Article

Fabrication of Fluorine-Free Superhydrophobic Surface on Aluminum Substrate for Corrosion Protection and Drag Reduction

1
Department of Marine Engineering, Dalian Maritime University, Dalian 116026, China
2
Yangtze Delta Region Institute, Tsinghua University Zhejiang, Jiaxing 314299, China
*
Author to whom correspondence should be addressed.
J. Mar. Sci. Eng. 2023, 11(3), 520; https://doi.org/10.3390/jmse11030520
Submission received: 7 February 2023 / Revised: 23 February 2023 / Accepted: 24 February 2023 / Published: 27 February 2023
(This article belongs to the Special Issue Advances in Sensor Technology in Smart Ships and Offshore Facilities)

Abstract

:
A fluorine-free cerium palmitate superhydrophobic surface on an aluminum plate was fabricated via a two-step electrodeposition method. The mechanical durability, anti-corrosion performance, water repellency and drag reduction properties were tested. The results indicate that a superhydrophobic surface with a densely packed convex island shape with micro-pores and nano-scale strips was formed on the aluminum plate. Furthermore, the as-prepared surface exhibits excellent water-repelling ability with a water contact angle of 162.3° and a sliding angle of 1.5°. Owing to the protective effect of the convex island structure on the surface, the surface also shows superb mechanical durability, which is a shortcoming of ordinary electrodeposited surfaces. Moreover, compared with bare aluminum, the corrosion inhibition efficiency of the superhydrophobic surface is 99.55% and the surface drag decreases by 65.3% at a lower flow rate. Therefore, it is believed that the environmentally friendly fluorine-free superhydrophobic surface has promising potential applications in marine engineering.

Graphical Abstract

1. Introduction

Superhydrophobic surfaces have attracted considerable attention in various fields due to their specific properties, such as anti-corrosion [1], self-cleaning [2], oil/water separation [3] and drag reduction [4]. Among them, anti-corrosion and drag reduction properties are regarded as some of the most promising for applications in marine engineering and military fields for improving the efficiency of energy utilization under global resource shortages, and also for increasing the speed of speedboats and small underwater vehicles under some emergency conditions [5,6].
Aluminum and its alloys are commonly used materials for some marine sensors, speedboats, marine structures and small pieces of underwater equipment due to their particular properties, such as low density, high strength and high ductility [7]. However, because of the corrosive working environment, these aluminum devices are easily damaged, leading to the loss of the material and huge maintenance costs. Therefore, superhydrophobic coatings have begun to be fabricated on aluminum surfaces to meet practical applications. For example, machine cutting [8], hard anodization process [9], hydrochloric and nitric acid etching [10], ammonia etching [11] and high-speed wire electrical discharge machining [12] are also adopted to fabricate the micro–nano structure on the surface of aluminum and its alloys. As for the low surface energy materials, 1H,1H,2H,2H-perfluorodecyl-triethoxysilane [11], hexadecyltrimethoxysilane [10], 1H,1H,2H,2H-perfluorooctyltrichlorosilane [13] and other long-chain perfluorosilanes are commonly employed. In addition, some studies show that the superhydrophobic property can also be achieved by mixing perfluorosilane-modified nanoparticles in a solution or resin and spraying them on the aluminum surface [14,15].
However, these methods all use long-chain perfluorosilanes with very low surface energy, which are recognized as pollutants of high global concern due to their toxicity, high persistence and bioaccumulation properties [16]. Moreover, these chemical compounds are ubiquitous in the environment, biota and humans [17]. Therefore, from the perspective of sustainable development, the preparation of fluorine-free superhydrophobic surfaces with low surface energy has greater development prospects.
Currently, there are some reports on the production of fluorine-free superhydrophobic surfaces via an electrodeposition approach. For instance, Liu et al. [18] and Zhang et al. [19] used one-step electrodeposition to fabricate fluorine-free superhydrophobic surfaces on magnesium and aluminum, respectively. All these superhydrophobic surfaces show excellent anti-corrosion properties.
However, although the one-step electrodeposition approach is facile and rapid, the electrodeposition coating is relatively soft, lacks robustness, and is easily damaged. Furthermore, most of the research on the electrodeposited superhydrophobic surface mainly focuses on anti-corrosion, anti-bacterial adhesion properties, and so on. There are seldom investigations on the drag reduction performance of an electrodeposited superhydrophobic surface on an aluminum substrate, which is also mainly related to the low robustness property.
Inspired by the concept of hard supporting points in coatings in the field of tribology, which adds hard particles into the soft coating to improve the hardness and wear resistance of the coating [20], hard SiC particles were incorporated into an electrodeposited coating in this study. This can be achieved by adding SiC particles directly to the electrolyte and allowing them to deposit on the aluminum surface along with the electrodeposited coating. Furthermore, in order to enhance the supporting effect of the hard particles, thereby increasing the robustness of the electrodeposited coating, a two-step electrodeposition method was adopted. In the first step of electrodeposition, an electrodeposited coating containing a high content of SiC particles was formed on the aluminum surface as a transition coating to increase the bonding strength between the outer layer and the substrate. In the second step of electrodeposition, a low surface energy substance with a micro–nano structure was mainly fabricated.
Consequently, different electrodeposition methods were employed to fabricate fluorine-free superhydrophobic surfaces in this work. The two-step electrodeposition method and the function of the SiC particles were investigated. The mechanical durability, anti-corrosion performance, water repellency and drag reduction performances were studied. All the results show that the fluorine-free superhydrophobic surface with SiC particles prepared by a two-step electrodeposition approach has high mechanical durability and drag reduction effect. We believe the environmentally friendly fluorine-free superhydrophobic surface has promising potential applications in marine engineering and military fields. However, due to the particularity of the electrodeposition method for metals, this method is difficult to apply on non-metallic surfaces and big-size objects at present. In addition, compared with the normal one-step electrodeposition method, although the mechanical durability of the electrodeposited superhydrophobic surface is greatly improved due to the two-step electrodeposition method and the incorporation of the hard particles, there is still a certain gap compared with the mechanical durability of a ceramic-based superhydrophobic coating.

2. Materials and Methods

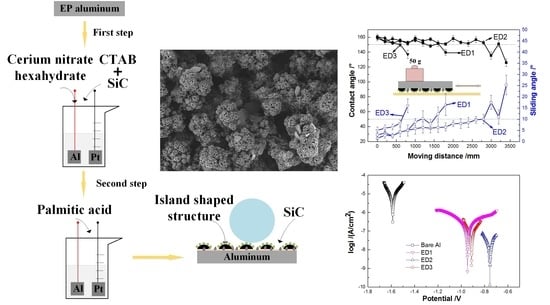
2.1. Preparation of Fluorine-Free Superhydrophobic Surfaces

Prior to the fabrication of the superhydrophobic surface, the original aluminum plate (99.99%, 40 mm × 20 mm × 2 mm) was ultrasonically cleaned with ethanol (99.9%, Aladdin) for 5 min and then dried in warm air. Furthermore, in order to increase the bonding strength of the electrodeposited coating, the aluminum plate was electropolished in dilute hydrochloric acid (0.5 mol/L, HCl, Aladdin) for 8 min to remove the oxide layer. After that, ultrasonic cleaning of the aluminum plate with ethanol was carried out again for 10 min.
As for the one-step electrodeposition process, the electrolyte was prepared by dissolving 10.2 g palmitic acid (>99%, CH3(CH2)14COOH, Aladdin), 4.3 g cerium nitrate hexahydrate (99.5%, Ce(NO3)3·6H2O, Aladdin), 2 g SiC particles (<50 μm, Aladdin) and 0.02 g hexadecyl trimethyl ammonium bromide (99%, CH3(CH2)15NBr(CH3)3, CTAB, Aladdin) in a mixed solution of 160 mL ethanol and 40 mL deionized water. CTAB was mainly used as a cationic surfactant to charge SiC particles [21]. Then, a uniform solution was obtained by magnetic stirring at 70 °C for five minutes. All reagents were received from Shanghai Aladdin Industrial Corporation and employed without further purification. The platinum plate (Pt) and the electropolished aluminum plate were placed oppositely in the electrolyte as anode and cathode, respectively. The distance between the two electrodes was 2 cm. According to the results of our pre-experiment, the electrodeposition experiment was performed at a constant voltage of 50 V and under a temperature of 70 °C with magnetic stirring for 4 min. After electrodeposition, the specimens were rinsed with ethanol, dried in warm air and marked as ED1.
In addition, a two-step electrodeposition process was also adopted to fabricate the electrodeposited surfaces. The electrodeposition process was carried out in two steps of 2 min each. In the first step, only cerium nitrate hexahydrate (Ce(NO3)3·6H2O), hexadecyl trimethyl ammonium bromide (CH3(CH2)15NBr(CH3)3) and SiC particles with the same concentration as above were added in the mixed solution. Then, palmitic acid was added to the mixed solution for the second step of electrodeposition. The prepared specimens were marked as ED2. Furthermore, according to the preparation process of the ED1 sample, the electrodeposited surfaces without SiC particles were also prepared for comparison and were marked as ED3. Figure 1 shows the schematic of the fluorine-free electrodeposition process on the aluminum plate.

2.2. Characterizations and Performance Tests

The water contact angles (CAs) and sliding angles (SAs) were characterized via a water contact angle measurement system (SL200KS, Boston, MA, USA) at room temperature, and the volume of the water droplets was 4 μL. All the angles were measured at least five times at different positions and the average value was adopted in this manuscript.
The surface morphologies were characterized using a scanning electron microscope (SEM, Hitachi, S8100, 5 kV, Tokyo, Japan), and the elemental compositions were characterized using an energy dispersive spectrometer (EDS, Bruker, Quantax 200, Germany). The chemical bonding information of the electrodeposited coatings was analyzed by Fourier transform infrared spectroscopy (FTIR, Thermofisher, Nicolet iS50, Waltham, MA, USA), Raman spectroscopy (Horiba, HR-800, Kyoto, Japan), X-ray photoelectron spectroscopy (XPS, PHI5000 Versa Probe, Kanagawa, Japan) and X-ray diffraction (XRD, PANayltical Empyrean, The Netherlands). The wavenumber range of FTIR measurements was 400–4000 cm−1 with a resolution of 4 cm−1. The X-ray source was a monochromatic Al Kα beam. The binding energies were calibrated with the saturated C1s peak at 284.8 eV. XPS Peak Fit software was selected for processing XPS data and fitting the curve of the peaks.
Sandpaper abrasion and rolling tests were carried out to examine the mechanical durability of the electrodeposited coatings. For the sandpaper abrasion test, one side of the prepared samples was located on the sandpaper (Grit No. 1000), and a 50 g standard weight (a pressure of about 2 kPa) was placed on the other side. The sample and the standard weight were fixed. The CAs and SAs were recorded after the sandpaper was pulled to move 200 mm. As for the rolling test, a 2 kg steel rod was rolled from one end of the surface to the other, and the CAs and SAs were recorded after each rolling movement.
The liquid impalement resistance was tested by droplet impact experiments. A droplet with a fixed volume (10 μL) was released from different heights to achieve different impacting speeds. The impact process of the droplet was recorded using a high-speed camera.
The chemical stability of the electrodeposited coatings was tested by electrochemical measurements and immersion tests. The electrochemical measurements were carried out in 3.5 wt% NaCl aqueous solutions using an electrochemical workstation (Gamry Reference 600, US) based on a three-electrode system with a frequency range of 10−2 to 105 Hz. The sample acted as the working electrode, a saturated calomel electrode was used as the reference electrode and a platinum sheet was adopted as the counter electrode. The prepared samples were stabilized at an open circuit potential for 60 min before measurements with an exposed area of 1 cm2. Polarization curves were plotted at a rate of 1 mV/s. The corrosion potential (Ecorr) could be obtained directly from the intersection of anode and cathode polarization curves. The logicorr could be derived from the Tafel region in the cathodic polarization curves by Tafel extrapolation, and then the corrosion current density (icorr) could be calculated. As for the immersion tests, the prepared surfaces were immersed into 3.5 wt.% NaCl aqueous solution and brought out every 24 h, and then the CAs and SAs of the electrodeposited coatings were measured after washing with pure water.
The drag reduction performance of the electrodeposited coatings was assessed using a self-designed experimental apparatus.

3. Results

3.1. Microstructure Morphology

The structures and morphologies of different electrodeposited coatings are shown in Figure 2. It can be seen from Figure 2a,b that the surface of the ED1 sample showed a cockscomb-like micro–nano structure with a size of about 10 μm. Numerous nano-scale protrusions also appeared on the pistil in the center of the flower. In addition, SiC particles were scattered on the surface, mostly deposited at the bottom and beside the cockscomb-like structure due to the electrophoretic force, as shown in the yellow area in Figure 2a. These can be confirmed from the EDS results shown in Figure 2c and Figure S1, where the main components were C, O, Ce and Si.
However, after two-step electrodeposition, the microstructure of the surface of the ED2 sample became densely packed convex islands with a size of about 30 μm. Moreover, there were many micro-pores and nano-scale strips on the islands, as shown in Figure 2d,e. The formation of these structures may be related to the electrodeposition process. The micro-scale pores may be formed by the shock of the gas generated during the experiment [19]. The EDS results of the ED2 sample showed that a small amount of SiC particles were distributed inside and between the islands, as exhibited in Figure 2f and Figure S2. However, the surface morphology after the first step of the two-step electrodeposition process was relatively flat, and many SiC particles and cracks appeared on the deposited layer, as shown in Figure S3a in Supplementary Materials. The EDS results (as shown in Figure S4) showed that the main constituent element was Ce, which was different from that of the ED1 sample. Furthermore, the content of SiC particles was also higher than that of the ED1 and the ED2 samples. Therefore, it can be deduced that most of the SiC particles were deposited inside the island rather than on the surface through the first step of two-step electrodeposition.
As for the surface of the ED3 sample, micro-scale fibrous-like structures were formed on the surface, and some of the fibrous-like structures formed a chrysanthemum-like structure, as shown in Figure 2g,h. In addition, the EDS results (as shown in Figure 2i and Figure S5) illustrated that the main components of the coating were C, O and Ce. The content of the Al element was very small, indicating that the electrodeposited coating covered the aluminum substrate uniformly.
In general, a micro–nano structure can be formed on the surface of the aluminum substrate by the electrodeposition method, and the SiC particles can also be adsorbed on the surface or in the coating during the electrodeposition process. The deposited coatings were mainly composed of C, Ce and O and did not contain the F element.

3.2. Water Contact Angles

The results of CAs and SAs of the electrodeposited coatings are revealed in Figure 3. It can be seen that the three electrodeposited coatings all reached a superhydrophobic state with static contact angles of 160.3°, 162.3° and 152.2°, respectively, and sliding angles of 2.5°, 1.5° and 2.3°, respectively. The ED2 sample exhibited better superhydrophobic properties. The superhydrophobicity of electrodeposited coatings may be attributed to the micro–nano structure of the surface and cerium palmitate which has low surface energy [19]. Moreover, the variations of contact angles and sliding angles also indicated that the coating prepared by the two-step electrodeposition process had an outstanding surface wettability. According to the Cassie–Baxter theory, the proportion of the actual contact area to the total contact area between a droplet and a solid surface can be reduced by adjusting the microstructure of the solid surface [22]. Due to the structure of the islands formed on the ED2 sample surface, as well as the micro-pores and nano-scale strips on the island making the fraction of solid/liquid interface less than that of the other two electrodeposited coatings, a large amount of air can be reserved in the gaps between the islands on the surface, which results in a larger contact angle and a smaller sliding angle.

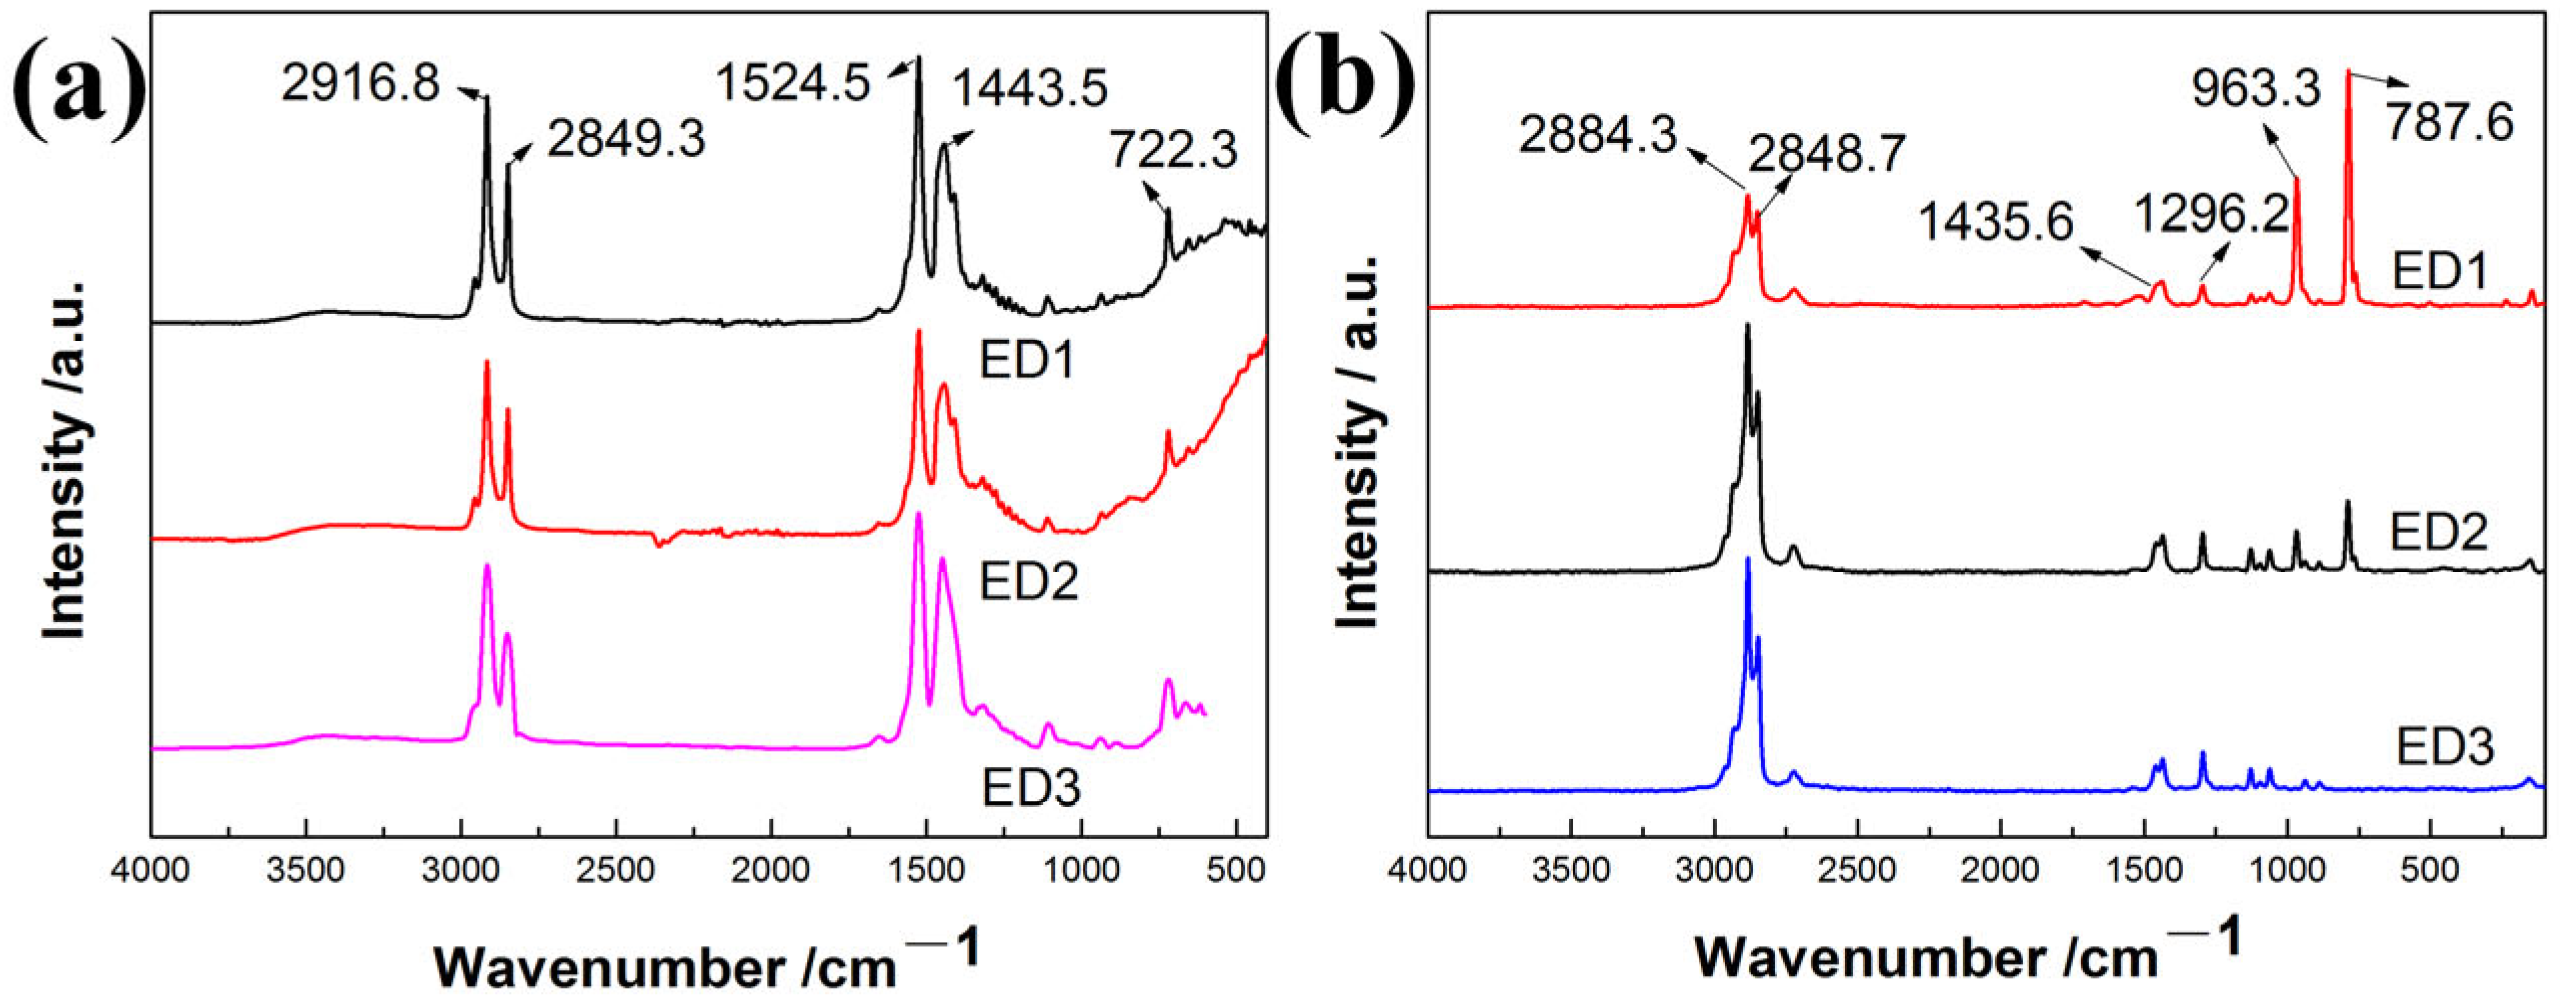
3.3. Chemical Composition

The XPS curves and the associated fine spectrum curves are exhibited in Figure 4. It can be observed from Figure 4a–c that all three electrodeposited superhydrophobic surfaces have strong peaks of Ce, C and O. Among them, C1s, O1s and Ce3d emerged as the typical peaks, and the peak intensities and locations of the three elements are very similar.
For the Ce element, the XPS spectrum is extremely intricate due to the existence of the 4f orbit [23]. Thus, the typical spectra of Ce 3d5/2 and Ce 3d3/2 appear on all three electrodeposited superhydrophobic surfaces. Moreover, two spectral line structures of Ce3+ ions and Ce4+ ions are simultaneously presented in the electron energy spectrum of Ce3d. For the ED1 sample, the peaks situated at 885.3 eV and 903.8 eV are attributed to the Ce 3d5/2 and Ce 3d3/2 peaks of Ce3+, respectively. The peaks located at 899.8 eV and 916.6 eV represent the Ce 3d5/2 and Ce 3d3/2 peaks of Ce4+, respectively [24]. Similarly, the Ce 3d5/2 and Ce 3d3/2 peaks of Ce3+ and Ce4+ of the ED2 sample are found at 885.1 eV, 902.8 eV, 898.6 eV and 916.2 eV, respectively [23]. The series of peaks at 885.7 eV, 904.5 eV, 900.6 eV and 916.9 eV belong to the Ce 3d5/2 and Ce 3d3/2 peaks of Ce3+ and Ce4+ of ED3 sample [25]. Furthermore, the satellite peak at 881.7 eV of Ce3+ also appears on the three electrodeposited superhydrophobic surfaces [24]. It can be seen from the above that the peaks of Ce appear at almost the same position. However, the peak intensity of Ce3+ ions is higher than that of Ce4+ ions, indicating that the main valence state of Ce in the as-deposited coating will be in the form of Ce3+ ions. Nevertheless, the peak intensity at 898.6 eV belonging to Ce4+ of the ED2 sample has increased compared with that of the other two samples, revealing that the content of Ce4+ ions in the coating of the ED2 sample has increased.
In addition, the results of the fine spectra of C1s and O1s on the three electrodeposited surfaces are basically the same. For C1s, the two peaks at 284.6 eV and 288.4 eV are related to the methylene (-CH2) and carboxyl (O=C-O-) groups in palmitic acid, respectively [19]. For O1s, the peak located at 528.9 eV can be assigned to the -C-O bond, and the peak at 531.3 eV is due to the C=O bond in palmitic acid [18]. The results of the fine spectra of C1s and O1s indicated that the palmitate group (CH3(CH2)12COO-) in palmitic acid did not change during the electrodeposition process. Therefore, the above results indicate that cerium palmitate with superhydrophobic properties is produced by the chemical reaction between palmitate and cerium ions in the electrolyte during the electrodeposition process.
To further analyze the chemical composition of the surfaces, FTIR and Raman spectroscopy results are displayed in Figure 5. It can be seen from Figure 5a that the absorption peaks at 722.3 cm−1, 1443.5 cm−1, 1524.5 cm−1, 2849.3 cm−1 and 2916.6 cm−1 are all observed on the three electrodeposited superhydrophobic surfaces.
The typical peaks at 722.3 cm−1, 1443.5 cm−1 and 1524.5 cm−1 in the low-frequency region are assigned to the bending vibrations of the methylene group (-CH2) and carboxyl group (COO-) existing in carboxylate (cerium palmitate), respectively [26]. In the high-frequency region, the strong absorption peaks at 2849.3 cm−1 and 2916.6 cm−1 are attributed to the symmetric and asymmetric stretching vibrations of the C-H bond, respectively [18]. These are all signs of the successful incorporation of cerium palmitate into the electrodeposited surface, which is consistent with XPS results.
Furthermore, the Raman spectrum results (as shown in Figure 5b) showed that the strong peaks at 2848.7 cm−1 and 2884.3 cm−1 belong to the stretching vibration of the C-H bond and the -CH2 bond in palmitate [27]. The peaks at 1296.2 cm−1 and 1435.6 cm−1 are attributed to the vibration of the Ce-O bond [28]. However, compared with the ED3 sample, there are two typical peaks at 787.6 cm-1 and 966.3 cm−1 that appeared on the electrodeposited surface of the ED1 and ED2 samples and are attributed to the C-Si bond of hexagonal SiC [29]. This also confirmed the existence of SiC in the electrodeposited coatings of the ED1 and ED2 samples. Moreover, the intensities of the peaks on the surface of the ED1 sample were stronger than those on the surface of the ED2 sample, indicating that there are more SiC particles exposed on the surface of the ED1 sample. The results are also consistent with the SEM and XPS data provided above.

3.4. Electrodeposition Process

To analyze the electrodeposition process in detail, XPS analysis was also performed on the first-step electrodeposited coating of the ED2 sample; the results are displayed in Figure S6. The differences in the Ce element from Figure 4d–f can be clearly seen. The peak intensities of Ce4+ 3d3/2, Ce4+ 3d5/2 and Ce 4d5/2 on the first-step electrodeposited coating were obviously stronger than those on the three electrodeposited superhydrophobic surfaces, indicating the higher content of the Ce4+ ionic compound in the coating.
According to the above analysis results, the electrodeposition process of the ED2 sample can be summarized. During the first step of electrodeposition (without palmitic acid in the electrolyte), the anions and cations moved towards the anode and cathode, respectively. Ce3+ ions in the solution were oxidized to Ce4+ ions near the platinum anode. Water in the electrolyte was first electrolyzed to form H+ and OH near the aluminum cathode. Then, H+ was reduced to H2 due to the electric equilibrium and overflowed from the system. At this point, the reactions in the solution were mainly the oxidation of Ce3+ ions and the reduction of H+, which can be verified by the experimental phenomenon. For example, the color of the electrolyte around the platinum electrode began to turn yellow (the color of the Ce4+ ion solution), and bubbles overflowed from the aluminum substrate. At this time, a large number of OH- ions remaining near the cathode combined with Ce3+ and Ce4+ ions in the solution to form compounds and deposited on the surface of the aluminum plate. For Ce3+ and Ce4+ ions, the charge densities are 0.68 e (μc pm−3) and 1.45 e (μc pm−3) and the radii are 102 pm and 87 pm, respectively [18]. Therefore, the Ce4+ ions will preferentially reach the cathode and react with OH- to form Ce(OH)4 deposited on the surface of the aluminum substrate due to a higher electric field force. However, Ce(OH)4 will present in the form of CeO2·nH2O due to its instability, which can be confirmed by the strong diffraction peak of CeO2·nH2O (111) at 28.44° in the XRD results [30] (as shown in Figure S7) and the peak at 530.4 eV related to Ce-O in the XPS results (as shown in Figure S6).
After palmitic acid (CH3(CH2)14COOH) was added into the electrolyte for the second step of electrodeposition, it began to ionize near the cathode to form a mass of H+ ions and CH3(CH2)14COO- ions. Hence, more free H+ was converted into H2 and released from the electrolyte, leaving a large amount of CH3(CH2)14COO- which reacted with the Ce3+ and Ce4+ in the electrolyte to synthesize cerium palmitate. Similarly, Ce(CH3(CH2)14COO)4 was first synthesized and deposited on the inner layer of the coating, and Ce(CH3(CH2)14COO)3 was synthesized and deposited on the outer layer of the coating. This also explains the high intensity of Ce4+ in Figure S6 and the high intensity of Ce3+ in Figure 4.
Therefore, the whole process is as follows:
H 2 O H + + O H
C e 4 + + 4 O H C e ( O H ) 4 C e O 2 2 H 2 O
C e 3 + + C H 3 ( C H 2 ) 14 C O O H C e ( C H 3 ( C H 2 ) 14 C O O H ) 3 + 3 H +
C e 4 + + C H 3 ( C H 2 ) 14 C O O H C e ( C H 3 ( C H 2 ) 14 C O O H ) 4 + 4 H +
2 H + + 2 e H 2
In the first step, the Ce(OH)4 layer was formed first, and then the cerium palmitate layer was formed in the second step. The Ce(OH)4 layer acted as a transition layer, increasing the bonding strength between the cerium palmitate layer and the aluminum substrate. Moreover, during the formation of the coating, the SiC particles which were positively charged by the modification of CTAB were deposited together into the coating under the action of the electric field force. The SiC particles in the coating acted as hard supporting points which could increase the structural strength of the coating. The release of H2 promoted the formation of micro–nano structures (micro-pores on the convex islands), resulting in excellent superhydrophobic properties.

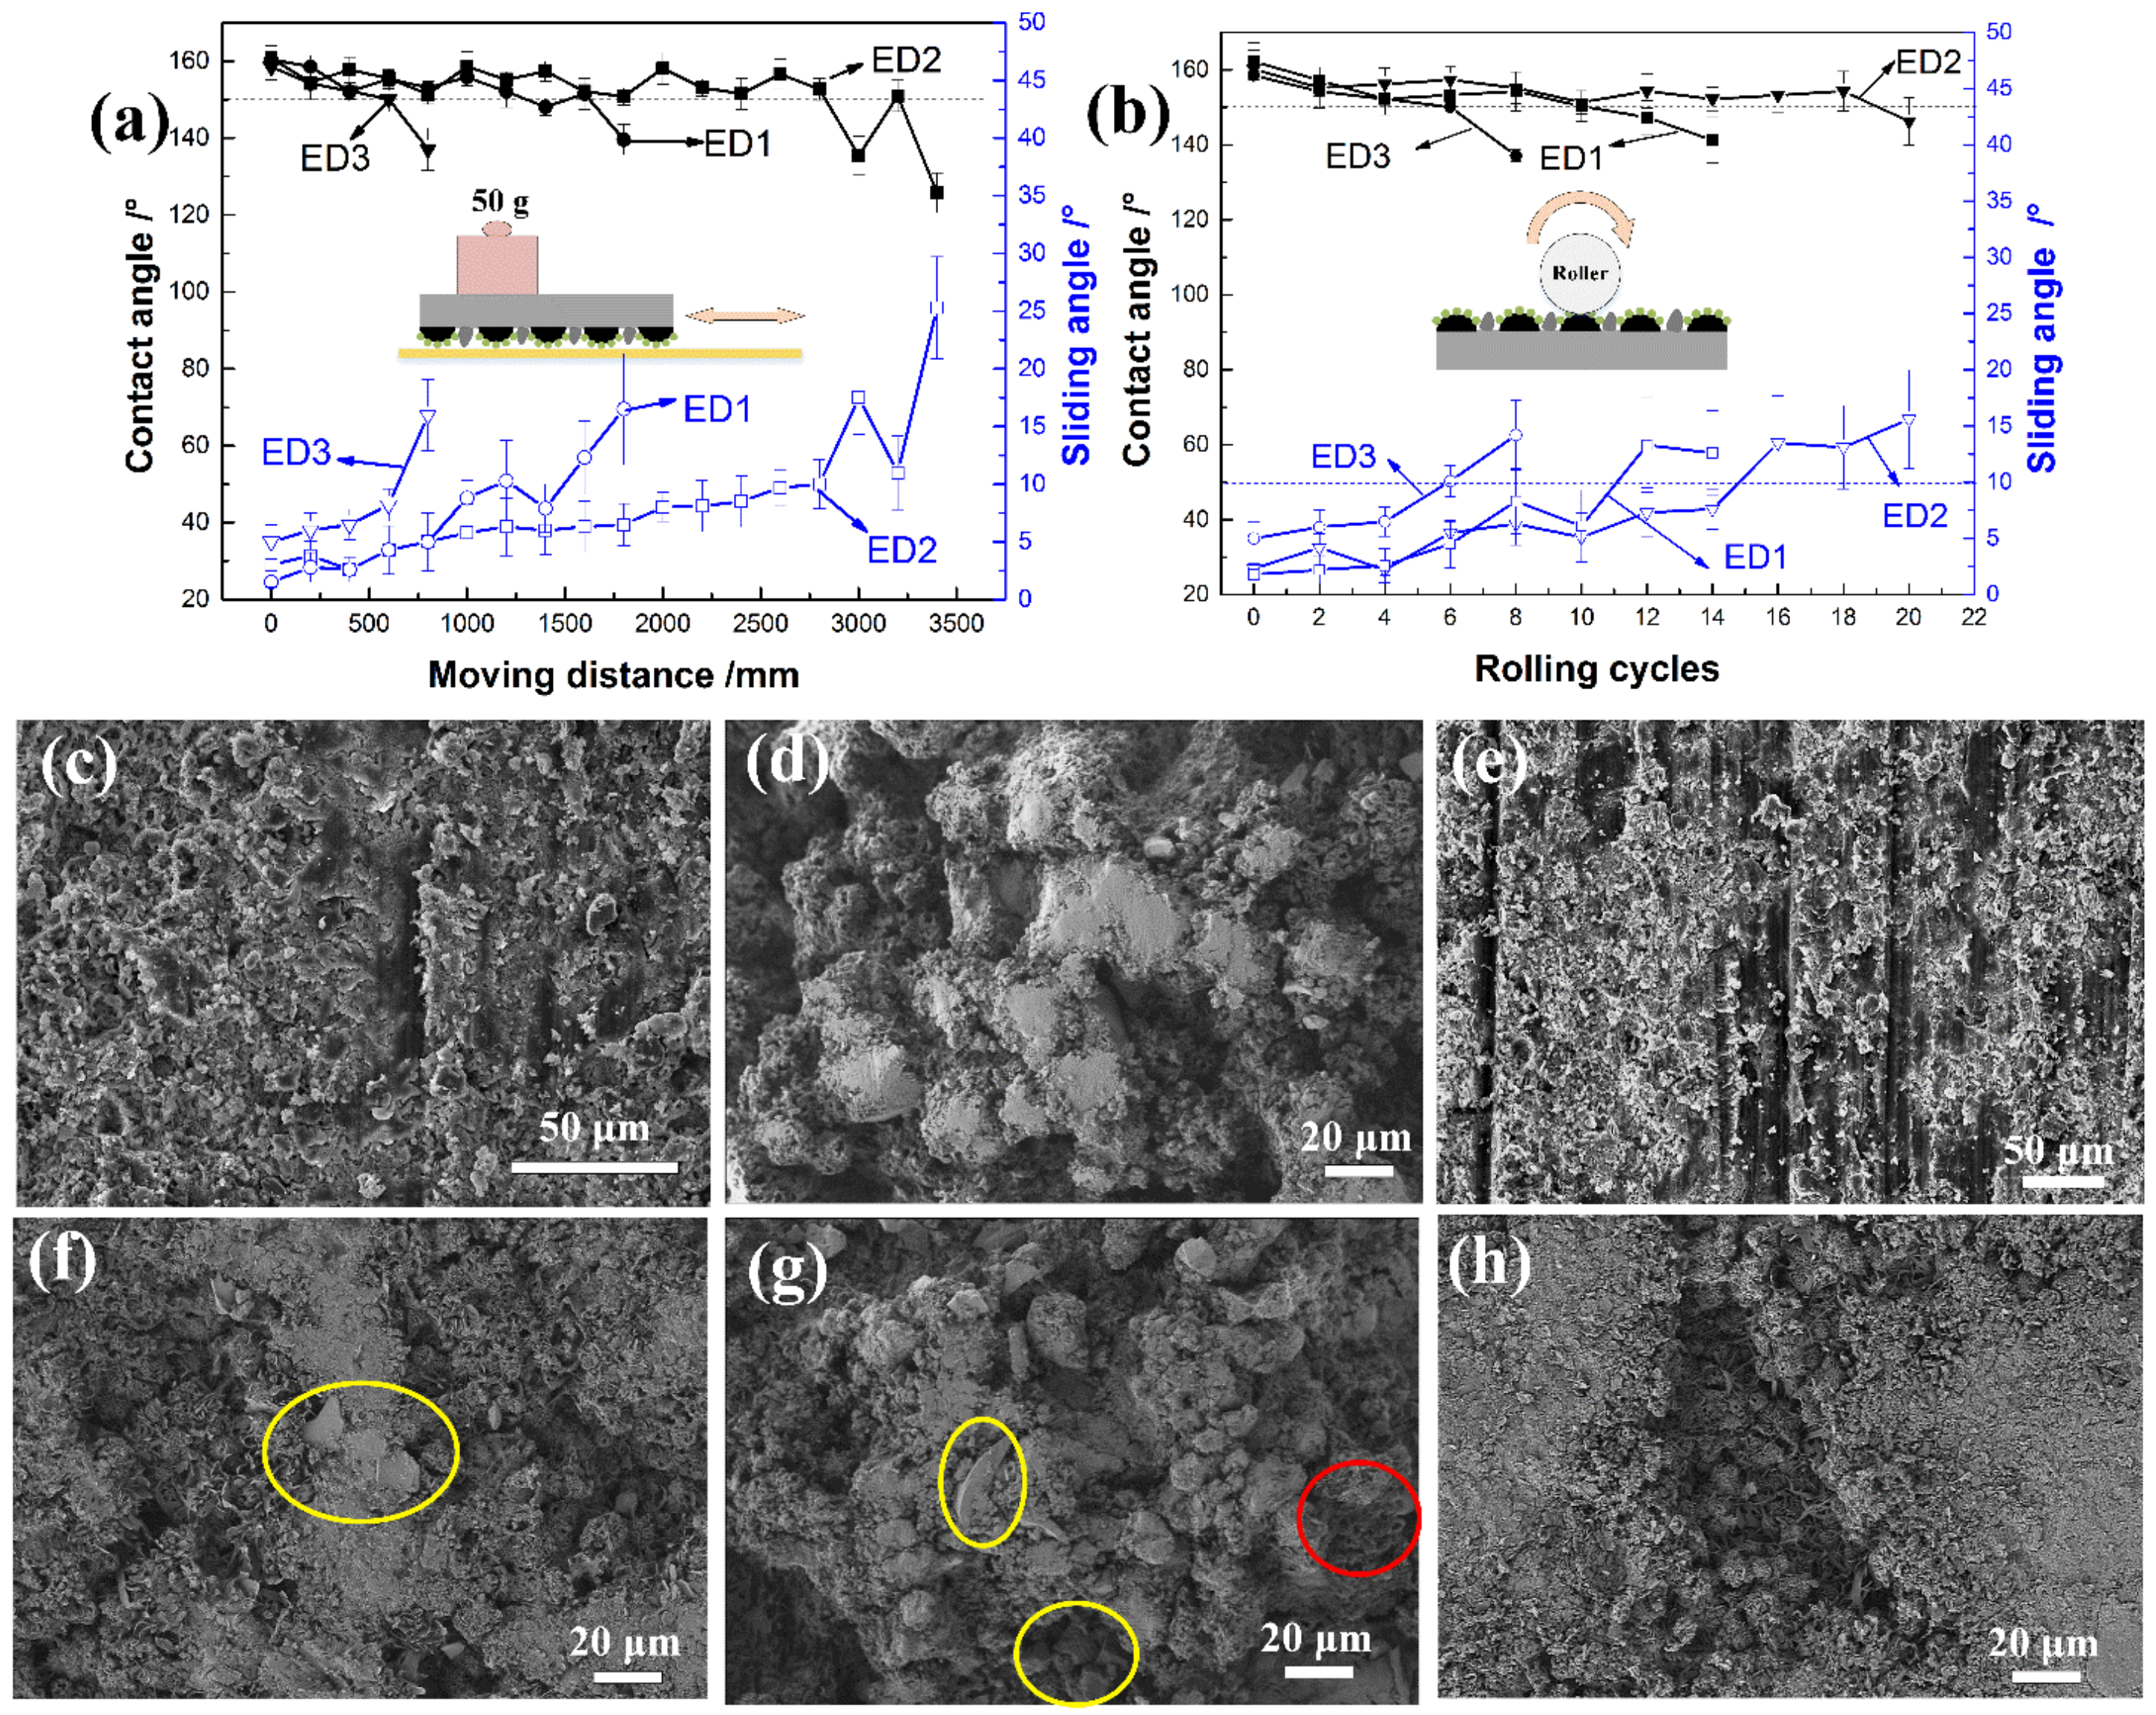
3.5. Mechanical Durability Performance

The results of the mechanical durability of the electrodeposited superhydrophobic surfaces are revealed in Figure 6. In the sandpaper abrasion test, the CAs of the ED1 sample decreased from 160.4 °to 139.6° and the SAs increased from 1.5° to 16.5° after an abrasion distance of 1600 mm. The CAs of the ED2 sample decreased from 163.2° to 135.4° after an abrasion distance of 3000 mm, and the SAs rose from 1.5° to 10.2° after an abrasion distance of 2600 mm. However, the abrasion distance was only 800 mm when the CAs of the ED3 sample decreased from 162.5 °to 137.1° and the SAs increased from 2.1° to 14.2°. In the rolling experiment, after 10 and 3 rolling cycles, respectively, the CAs of the ED1 and ED3 samples were lower than 150°. After 18 rolling cycles, the CA of the ED2 sample was less than 150°.
The results illustrated that the surface prepared by the two-step electrodeposition exhibited better mechanical durability than that of the one-step electrodeposition. The reasons may be related to the structure of the electrodeposited surface. For the ED2 sample, only the top structure of the densely packed islands was destroyed, as shown in Figure 6d,g. However, the cockscomb-like structure on the surface of the ED1 sample and the chrysanthemum-like structure on the surface of the ED3 sample were completely ruined, as shown in Figure 6c,e,f,h.
This also demonstrated that the densely packed islands with higher structural strength can protect the micro–nano structure between the islands (the red area in Figure 6g). In addition, SiC particles in the coating (the yellow area in Figure 6g) acted as hard supporting points, similar to the stones in concrete, which can further improve the structural strength of the coating to resist the abrasion of sandpaper and the rolling movement of the iron stick. Moreover, the transition layer of Ce(OH)4 formed in the first step of electrodeposition enhanced the bonding strength of the outer layer and the aluminum substrate, improving the damage resistance of the outer layer.

3.6. Anti-Corrosion Performance

The results of anti-corrosion properties are displayed in Figure 7a. The corrosion potential (Ecorr) and the corrosion current density (icorr) are listed in Table 1.
It can be seen that the Ecorr and icorr of Al substrate were −1.587 V and 1.159 × 10⁻⁶ Acm−2, respectively, while the values of the ED2 sample were −0.755 V and 5.224 × 10⁻⁹ Acm−2. The corrosion current density dropped by more than 3 orders of magnitude. As for the ED1 and ED3 samples, the values of Ecorr and icorr were almost the same. They were −0.946 V and −0.917 V, 2.924 × 10⁻⁸ Acm−2 and 1.799 × 10⁻⁸ Acm−2, respectively. This also means that the ED2 sample has the lowest corrosion rate. The corrosion inhibition efficiency of the ED2 sample was calculated to be 99.55% according to the following equation [31]:
η ( % ) = 1 i E D 2 i b a r e A l × 100
The saltwater immersion experiment results are displayed in Figure 7b. It can be seen that the CAs decreased from 162.5° to 147.5° after 9 days of immersion. The SAs increased from 1.7° to 10.5° after 8 days of immersion. These results also revealed better corrosion resistance of the ED2 sample.

3.7. Liquid Impalement Resistance Property

A series of pictures of the droplet contacting the surface, expanding to the maximum diameter, beginning to bounce, bouncing to the highest point and finally falling back to the surface were recorded during the droplet impact test of the two-step electrodeposition surface, and the results are illustrated in Figure 8. The Weber number ( W e = ( 2 ρ v 2 R ) / σ ), which is the ratio of inertial and surface tension forces, was adopted to quantify the degree of the impact [13].
The larger the We, the easier it is for droplets to penetrate into the surface microstructure and for the liquid puncture phenomenon to occur, leaving residual droplet on the surface [32]. It can be seen in Figure 8 that the droplets spread into a pancake structure after impacting the surface, and the shape of the pancake structure became irregular with the increase in the We. In addition, after the droplet bounced up, there was no residual droplet on the surface, even with a larger We (up to 72), indicating the Cassie–Baxter state of the ED2 surface was not affected by the impact speed of the droplet. This may be attributed to the low surface adhesion force caused by the cerium palmitate. During the shrinkage process, when the adhesion force of the electrodeposited superhydrophobic surface was less than the surface tension force of the droplets, the volume of the droplets above the island on the ED2 surface would take away the volume of the droplets that penetrate into the gaps between the islands. Then, the droplets could bounce off the surface completely with no liquid impalement occurring.
Furthermore, when the droplet fell from a height of 50 mm, a satellite droplet was detached from the main droplet after bouncing off the electrodeposited superhydrophobic surface. Satellite droplets will be produced only when the surface energy exceeds the surface tension of the droplet. It is well known that more surface energy is converted from the kinetic energy of the droplet due to a higher impact velocity. The degree of conversion of kinetic energy to surface energy is related to surface viscous dissipation during the spreading and shrinking of the droplet. It can also be seen from Figure 8 that as the impact velocity increases, the time consumed on the spread and shrinkage of the droplet decreases, leading to a decrease in the surface viscous dissipation. These phenomena indicated that the prepared electrodeposited surface had lower surface adhesion and better liquid impalement resistance property.

3.8. Drag Reduction Property

The drag reduction property of the electrodeposited superhydrophobic surfaces was investigated using a self-made experimental apparatus according to the previous work [4]. Figure 9a illustrates the schematic of the apparatus. The samples were bonded at the bottom of the force transmission mechanism with an angle of 3° to the horizontal direction. The force transmission mechanism was an equilateral “L” shape. A stainless steel nozzle with a caliber of 0.6 cm was adopted to spray water on the surface. A flow meter and a globe valve were employed to adjust the flow rate. A high-precision electronic balance was used to measure the total force between the water flow and the fixed electrodeposited surface. Thereby, the friction drag of the solid–liquid interface could be calculated by the decomposition of the total force, which could be read directly on the electronic balance. The decomposition of force is also shown in Figure 9a.
The results of surface drag under different flow rates are shown in Figure 9b; the drag reduction effect of all three superhydrophobic surfaces was significantly better than that of the aluminum substrate, and the ED2 sample possessed the lowest surface drag. Compared with the aluminum substrate, when the flow rate was 5 m/s, 5.6 m/s, 6.7 m/s, 7.8 m/s and 8.5 ms−1, the surface drag decreased by 65.3%, 61.2%, 55.9%, 56.7% and 55.7%, respectively. Furthermore, it can also be seen that the drag reduction effect was better at a lower flow rate.
The difference in drag reduction performance may be related to the different surface wettability caused by the special structure on the surface. The aluminum substrate was in direct contact with the spray water, and the contact state was a stable Cassie state. However, for the superhydrophobic surfaces, there would be a discontinuous air film between the spray water and the surface The air film maintained the surface contact state in a Cassie–Baxter state, leading to the water slipping on the surface for better drag reduction. In addition, the mechanical durability of the micro–nano structure on the ED2 sample surface was higher than that on the ED1 and ED3 sample surfaces, which means the micro–nano structure on the ED1 and ED3 sample surfaces may be more easily damaged under the impact of spray water, especially at a high flow rate. This also can be confirmed by the surface morphologies of the samples after the test, as shown in Figure 9c–e. The nano-strip structures on the surfaces of the ED1 and ED3 samples almost disappeared. However, the densely packed convex islands with micro-pores still existed on the surface of the ED2 sample. Therefore, the drag reduction effect of the ED2 sample was greater than that of the ED1 and ED3 samples.

4. Conclusions

In summary, a fluorine-free cerium palmitate superhydrophobic surface on an aluminum substrate was fabricated via a two-step electrodeposition method. During the electrodeposition process, modified SiC particles were added to the electrolyte. The following conclusions were made:
(1) Double layers with gradient structure were electrodeposited on the aluminum substrate to form a superhydrophobic surface which has densely packed convex islands with micro-pores and nano-scale strips. In addition, SiC particles were also electrodeposited on and inside the islands to increase the structural strength of the surface.
(2) The electrodeposited superhydrophobic surface exhibits excellent water-repelling ability with a water contact angle of 162.3° and a sliding angle of 1.5°. Furthermore, the surface also shows superb mechanical durability owing to the protective convex island structure on the surface and the hard SiC particles in the coating.
(3) Compared with the aluminum substrate, the corrosion inhibition efficiency of the electrodeposited superhydrophobic surface is 99.55%, and the surface drag decreases by 65.3% at a lower flow rate of 5 m/s.

Supplementary Materials

The following supporting information can be downloaded at: https://www.mdpi.com/article/10.3390/jmse11030520/s1, Figure S1: The EDS results of the surface of the ED1 sample; Figure S2: The EDS results of the ED2 surface; Figure S3: The surface morphologies of sample; Figure S4: The EDS results of the first-step electrodeposited surface of the ED2 sample; Figure S5: The EDS results of the surface of the ED3 sample; Figure S6: The XPS results of the first-step electrodeposited surface of the ED2 sample; Figure S7: The XRD results of the first-step electrodeposited surface of the ED2 sample.

Author Contributions

Conceptualization, J.F. and Y.S.; methodology, J.F. and Y.S.; validation, J.F., H.Z., J.Z. and Y.J.; formal analysis, J.F. and Y.S.; investigation, J.F., J.W. and Y.S.; resources, J.F. and Y.S.; data curation, J.F. and Y.S.; writing—original draft preparation, J.F., J.W. and Y.S.; writing—review and editing, J.F., H.Z., J.Z. and Y.J.; visualization, J.F.; supervision, H.Z., J.Z. and Y.J.; project administration, J.F. and Y.J.; funding acquisition, J.F. and Y.J. All authors have read and agreed to the published version of the manuscript.

Funding

This research was funded by the National Key Research and Development Program of China (2019YFE0116400), the Dalian Outstanding Scientific and Technological Talents Program (2020RJ03), the National Natural Science Foundation of China (52101344) and the National Natural Science Foundation of Liaoning Province (LJKZ0057).

Institutional Review Board Statement

Not applicable.

Informed Consent Statement

Not applicable.

Data Availability Statement

Data are contained within the article.

Conflicts of Interest

The authors declare that they have no known competing financial interests or personal relationships that could have appeared to influence the work reported in this paper.

References

  1. Lai, X.; Hu, J.; Ruan, T.; Zhou, J.; Qu, J. Chitosan derivative corrosion inhibitor for aluminum alloy in sodium chloride solution: A green organic/inorganic hybrid. Carbohydr. Polym. 2021, 265, 118074. [Google Scholar] [CrossRef] [PubMed]
  2. Dos Santos, F.C.; Pulcinelli, S.H.; Santilli, C.V.; Hammer, P. Protective PMMA-silica coatings for aluminum alloys: Nanostructural control of elevated thermal stability and anticorrosive performance. Prog. Org. Coat. 2021, 152, 106129. [Google Scholar] [CrossRef]
  3. Xie, A.; Cui, J.; Chen, T.; Lang, J.; Li, C.; Yan, T.; Dai, J. One-step facile fabrication of sustainable cellulose membrane with su-perhydrophobicity via a sol-gel strategy for efficient oil/water separation. Surf. Coat. Technol. 2019, 361, 19–26. [Google Scholar] [CrossRef]
  4. Zhang, H.; Yin, L.; Liu, X.; Weng, R.; Wang, Y.; Wu, Z. Wetting behavior and drag reduction of superhydrophobic layered double hydroxides films on aluminum. Appl. Surf. Sci. 2016, 380, 178–184. [Google Scholar] [CrossRef] [Green Version]
  5. Tuo, Y.; Chen, W.; Zhang, H.; Li, P.; Liu, X. One-step hydrothermal method to fabricate drag reduction superhydrophobic surface on aluminum foil. Appl. Surf. Sci. 2018, 446, 230–235. [Google Scholar] [CrossRef]
  6. Cheng, M.; Zhang, S.; Dong, H.; Han, S.; Wei, H.; Shi, F. Improving the Durability of a Drag-Reducing Nanocoating by Enhancing Its Mechanical Stability. ACS Appl. Mater. Interfaces 2015, 7, 4275–4282. [Google Scholar] [CrossRef]
  7. Chi, Y.; Gu, G.; Yu, H.; Chen, C. Laser surface alloying on aluminum and its alloys: A review. Opt. Lasers Eng. 2018, 100, 23–37. [Google Scholar] [CrossRef]
  8. Zhu, J. A novel fabrication of superhydrophobic surfaces on aluminum substrate. Appl. Surf. Sci. 2018, 447, 363–367. [Google Scholar] [CrossRef]
  9. Zhang, B.; Hu, X.; Zhu, Q.; Wang, X.; Zhao, X.; Sun, C.; Li, Y.; Hou, B. Controllable Dianthus caryophyllus-like superhydro-philic/superhydrophobic hierarchical structure based on self-congregated nanowires for corrosion inhibition and biofouling mitigation. Chem. Eng. J. 2017, 312, 317–327. [Google Scholar] [CrossRef]
  10. Kumar, A.; Gogoi, B. Development of durable self-cleaning superhydrophobic coatings for aluminium surfaces via chemical etching method. Tribol. Int. 2018, 122, 114–118. [Google Scholar] [CrossRef]
  11. Zhang, B.; Guan, F.; Zhao, X.; Zhang, Y.; Li, Y.; Duan, J.; Hou, B. Micro-nano textured superhydrophobic 5083 aluminum alloy as a barrier against marine corrosion and sulfate-reducing bacteria adhesion. J. Taiwan Inst. Chem. Eng. 2019, 97, 433–440. [Google Scholar] [CrossRef]
  12. Sun, R.; Zhao, J.; Li, Z.; Qin, N.; Mo, J.; Pan, Y.; Luo, D. Robust superhydrophobic aluminum alloy surfaces with anti-icing ability, thermostability, and mechanical durability. Prog. Org. Coatings 2020, 147, 105745. [Google Scholar] [CrossRef]
  13. Fu, J.; Sun, Y.; Ji, Y.; Zhang, J. Fabrication of robust ceramic based superhydrophobic coating on aluminum substrate via plasma electrolytic oxidation and chemical vapor deposition methods. J. Mater. Process. Technol. 2022, 306, 117641. [Google Scholar] [CrossRef]
  14. Wang, H.; Di, D.; Zhao, Y.; Yuan, R.; Zhu, Y. A multifunctional polymer composite coating assisted with pore-forming agent: Preparation, superhydrophobicity and corrosion resistance. Prog. Org. Coatings 2019, 132, 370–378. [Google Scholar] [CrossRef]
  15. Li, Z.; Cao, M.; Li, P.; Zhao, Y.; Bai, H.; Wu, Y.; Jiang, L. Surface-Embedding of Functional Micro-/Nanoparticles for Achieving Versatile Superhydrophobic Interfaces. Matter 2019, 1, 661–673. [Google Scholar] [CrossRef] [Green Version]
  16. Rasitha, T.; Vanithakumari, S.; Krishna, D.N.G.; George, R.; Srinivasan, R.; Philip, J. Facile fabrication of robust superhydrophobic aluminum surfaces with enhanced corrosion protection and antifouling properties. Prog. Org. Coatings 2021, 162, 106560. [Google Scholar] [CrossRef]
  17. ECHA, European Chemical Agency. Candidate List of Substances of Very High Concern for Authorisation. 2013. Available online: https://echa.europa.eu/web/guest/candidate-list-table (accessed on 14 August 2022).
  18. Liu, Y.; Xue, J.; Luo, D.; Wang, H.; Gong, X.; Han, Z.; Ren, L. One-step fabrication of biomimetic superhydrophobic surface by electrodeposition on magnesium alloy and its corrosion inhibition. J. Colloid Interface Sci. 2017, 491, 313–320. [Google Scholar] [CrossRef]
  19. Zhang, B.; Li, J.; Zhao, X.; Hu, X.; Yang, L.; Wang, N.; Li, Y.; Hou, B. Biomimetic one-step fabrication of manganese stearate su-perhydrophobic surface as an efficient barrier against marine corrosion and Chlorella vulgaris-induced biofouling. Chem. Eng. J. 2016, 306, 441–451. [Google Scholar] [CrossRef]
  20. Fu, J.; Li, M.; Liu, G.; Ma, S.; Zhu, X.; Ma, C.; Cheng, D.; Yan, Z. Robust ceramic based self-lubricating coating on Al–Si alloys prepared via PEO and spin-coating methods. Wear 2020, 458–459, 203405. [Google Scholar] [CrossRef]
  21. Zhao, G.; Li, J.; Huang, Y.; Yang, L.; Ye, Y.; Walsh, F.C.; Chen, J.; Wang, S. Robust Ni/WC superhydrophobic surfaces by electro-deposition. RSC Adv. 2017, 7, 44896–44903. [Google Scholar] [CrossRef] [Green Version]
  22. Cassie, A.B.D.; Baxter, S. Wettability of porous surfaces. Trans. Faraday Soc. 1944, 40, 546–551. [Google Scholar] [CrossRef]
  23. Bianconi, A.; Marcelli, A.; Tomellini, M.; Davoli, I. Determination of mixing of 4f-ligand orbitals in Ce(SO4)2 by Xanes is Ce(SO4)2 a mixed valent insulating system? J. Magn. Magn. Mater. 1985, 47–48, 209–211. [Google Scholar] [CrossRef]
  24. Sharma, S.; Hegde, M.S. Pt metal-CeO2 interaction: Direct observation of redox coupling between Pt0/Pt2+/Pt4+ and Ce4+/Ce3+ states in Ce0.98Pt0.02O2-δ catalyst by a combined electrochemical and x-ray photoelectron spectroscopy study. J. Chem. Phys. 2009, 130, 114706. [Google Scholar] [CrossRef] [PubMed]
  25. Sudarsanam, P.; Selvakannan, P.R.; Soni, S.K.; Bhargava, S.K.; Reddy, B.M. Structural evaluation and catalytic performance of nano-Au supported on nanocrystalline Ce0.9Fe0.1O2-δ solid solution for oxidation of carbon monoxide and benzylamine. RSC Adv. 2014, 4, 43460–43469. [Google Scholar] [CrossRef]
  26. Zhang, B.; Zhao, X.; Li, Y.; Hou, B. Fabrication of durable anticorrosion superhydrophobic surfaces on aluminum substrates via a facile one-step electrodeposition approach. RSC Adv. 2016, 6, 35455–35465. [Google Scholar] [CrossRef]
  27. Sawisai, R.; Wanchanthuek, R.; Radchatawedchakoon, W.; Sakee, U. Simple continuous flow synthesis of linoleic and palmitic acid-coated magnetite nanoparticles. Surf. Interfaces 2019, 17, 100344. [Google Scholar] [CrossRef]
  28. Lv, J.; Guo, S.; Li, G. In situ Raman Spectroscopic of cerium surface oxidation and reduction processes. J. Chin. Soc. Rare Earths 2013, 31, 488–494. [Google Scholar]
  29. Han, R.; Han, B.; Wang, D.H.; Li, C. Temperature dependence of Raman scattering from 4H-SiC with hexagonal defects. Appl. Phys. Lett. 2011, 99, 011912. [Google Scholar] [CrossRef]
  30. Yan, C.; Yi, W.; Ma, P.; Deng, X.; Song, S.; Zhu, Z. Synthesis and Characterization of Hydrous Ceria with its adsorption property for Boron. J. Chin. Soc. Rare Earths 2008, 26, 5. [Google Scholar]
  31. Nine, J.; Cole, M.A.; Johnson, L.; Tran, D.N.H.; Losic, D. Robust Superhydrophobic Graphene-Based Composite Coatings with Self-Cleaning and Corrosion Barrier Properties. ACS Appl. Mater. Interfaces 2015, 7, 28482–28493. [Google Scholar] [CrossRef]
  32. Lambley, H.; Schutzius, T.M.; Poulikakos, D. Superhydrophobic surfaces for extreme environmental conditions. Proc. Natl. Acad. Sci. USA 2020, 117, 27188–27194. [Google Scholar] [CrossRef]
Figure 1. The schematic of the fluorine-free electrodeposition process.
Jmse 11 00520 g001
Figure 2. Surface morphologies of different electrodeposited coatings: (a,b) the surfaces of one-step electrodeposited surface with SiC particles (ED1); (c) the EDS results of the ED1 surface; (d,e) the surfaces of two-step electrodeposited surface with SiC particles (ED2); (f) the EDS results of the ED2 surface; (g,h) the surface of one-step electrodeposited surface without SiC particles (ED3); (i) the EDS results of the ED3 surface.
Jmse 11 00520 g002
Figure 3. The contact angles and sliding angles of different electrodeposited coatings; ED1 means one-step electrodeposited surface with SiC particles, ED2 means two-step electrodeposited surface with SiC particles, ED3 means one-step electrodeposited surface without SiC particles.
Jmse 11 00520 g003
Figure 4. The XPS results of the electrodeposited coatings.
Jmse 11 00520 g004
Figure 5. The FTIR and Raman spectra of the surfaces: (a) the FTIR results of the samples; (b) the Raman spectrum results of the samples.
Jmse 11 00520 g005
Figure 6. The mechanical durability test of samples: (a) CAs and SAs with moving distance; (b) CAs and SAs with rolling cycles; (c) morphology of ED1 sample after abrasion test; (d) morphology of ED2 sample after abrasion test; (e) morphology of ED3 sample after abrasion test; (f) morphology of ED1 sample after rolling test; (g) morphology of ED2 sample after rolling test; (h) morphology of ED3 sample after rolling test.
Jmse 11 00520 g006
Figure 7. Anti-corrosion test: (a) the potentiodynamic polarization curves of the samples; (b) the immersion experiment of the ED2 sample.
Jmse 11 00520 g007
Figure 8. Droplet released from different heights to impact on the ED2 sample: (a) from the height of 20 mm (v = 0.625 m/s, We = 14.378), (b) from the height of 30 mm (v = 0.766 m/s, We = 21.568), (c) from the height of 40 mm (v = 0.885 m/s, We = 28.757), (d) from the height of 50 mm (v = 0.989 m/s, We = 35.946) and (e) from the height of 100 mm (v = 1.399 m/s, We = 71.892).
Jmse 11 00520 g008
Figure 9. The schematic of the drag reduction apparatus and the results: (a) schematic of the drag reduction apparatus; (b) drag reduction results of different samples; (c) morphology of ED1 sample after drag reduction test; (d) morphology of ED2 sample after drag reduction test; (e) morphology of ED3 sample after drag reduction test.
Jmse 11 00520 g009
Table 1. The corresponding polarization parameters of Al substrate and ED1, ED2 and ED3 samples.
SamplesEcorr (V)icorr (Acm−2)
ED1−0.9462.924 × 10−8
ED2−0.7555.224 × 10−9
ED3−0.9171.799 × 10−8
Al substrate−1.5871.159 × 10−6
Disclaimer/Publisher’s Note: The statements, opinions and data contained in all publications are solely those of the individual author(s) and contributor(s) and not of MDPI and/or the editor(s). MDPI and/or the editor(s) disclaim responsibility for any injury to people or property resulting from any ideas, methods, instructions or products referred to in the content.

