
Efficiency Evaluation of a Small Container Terminal with Perpendicular Yard Layout Using Shuttle Carriers

Abstract
:1. Introduction
2. Literature Review
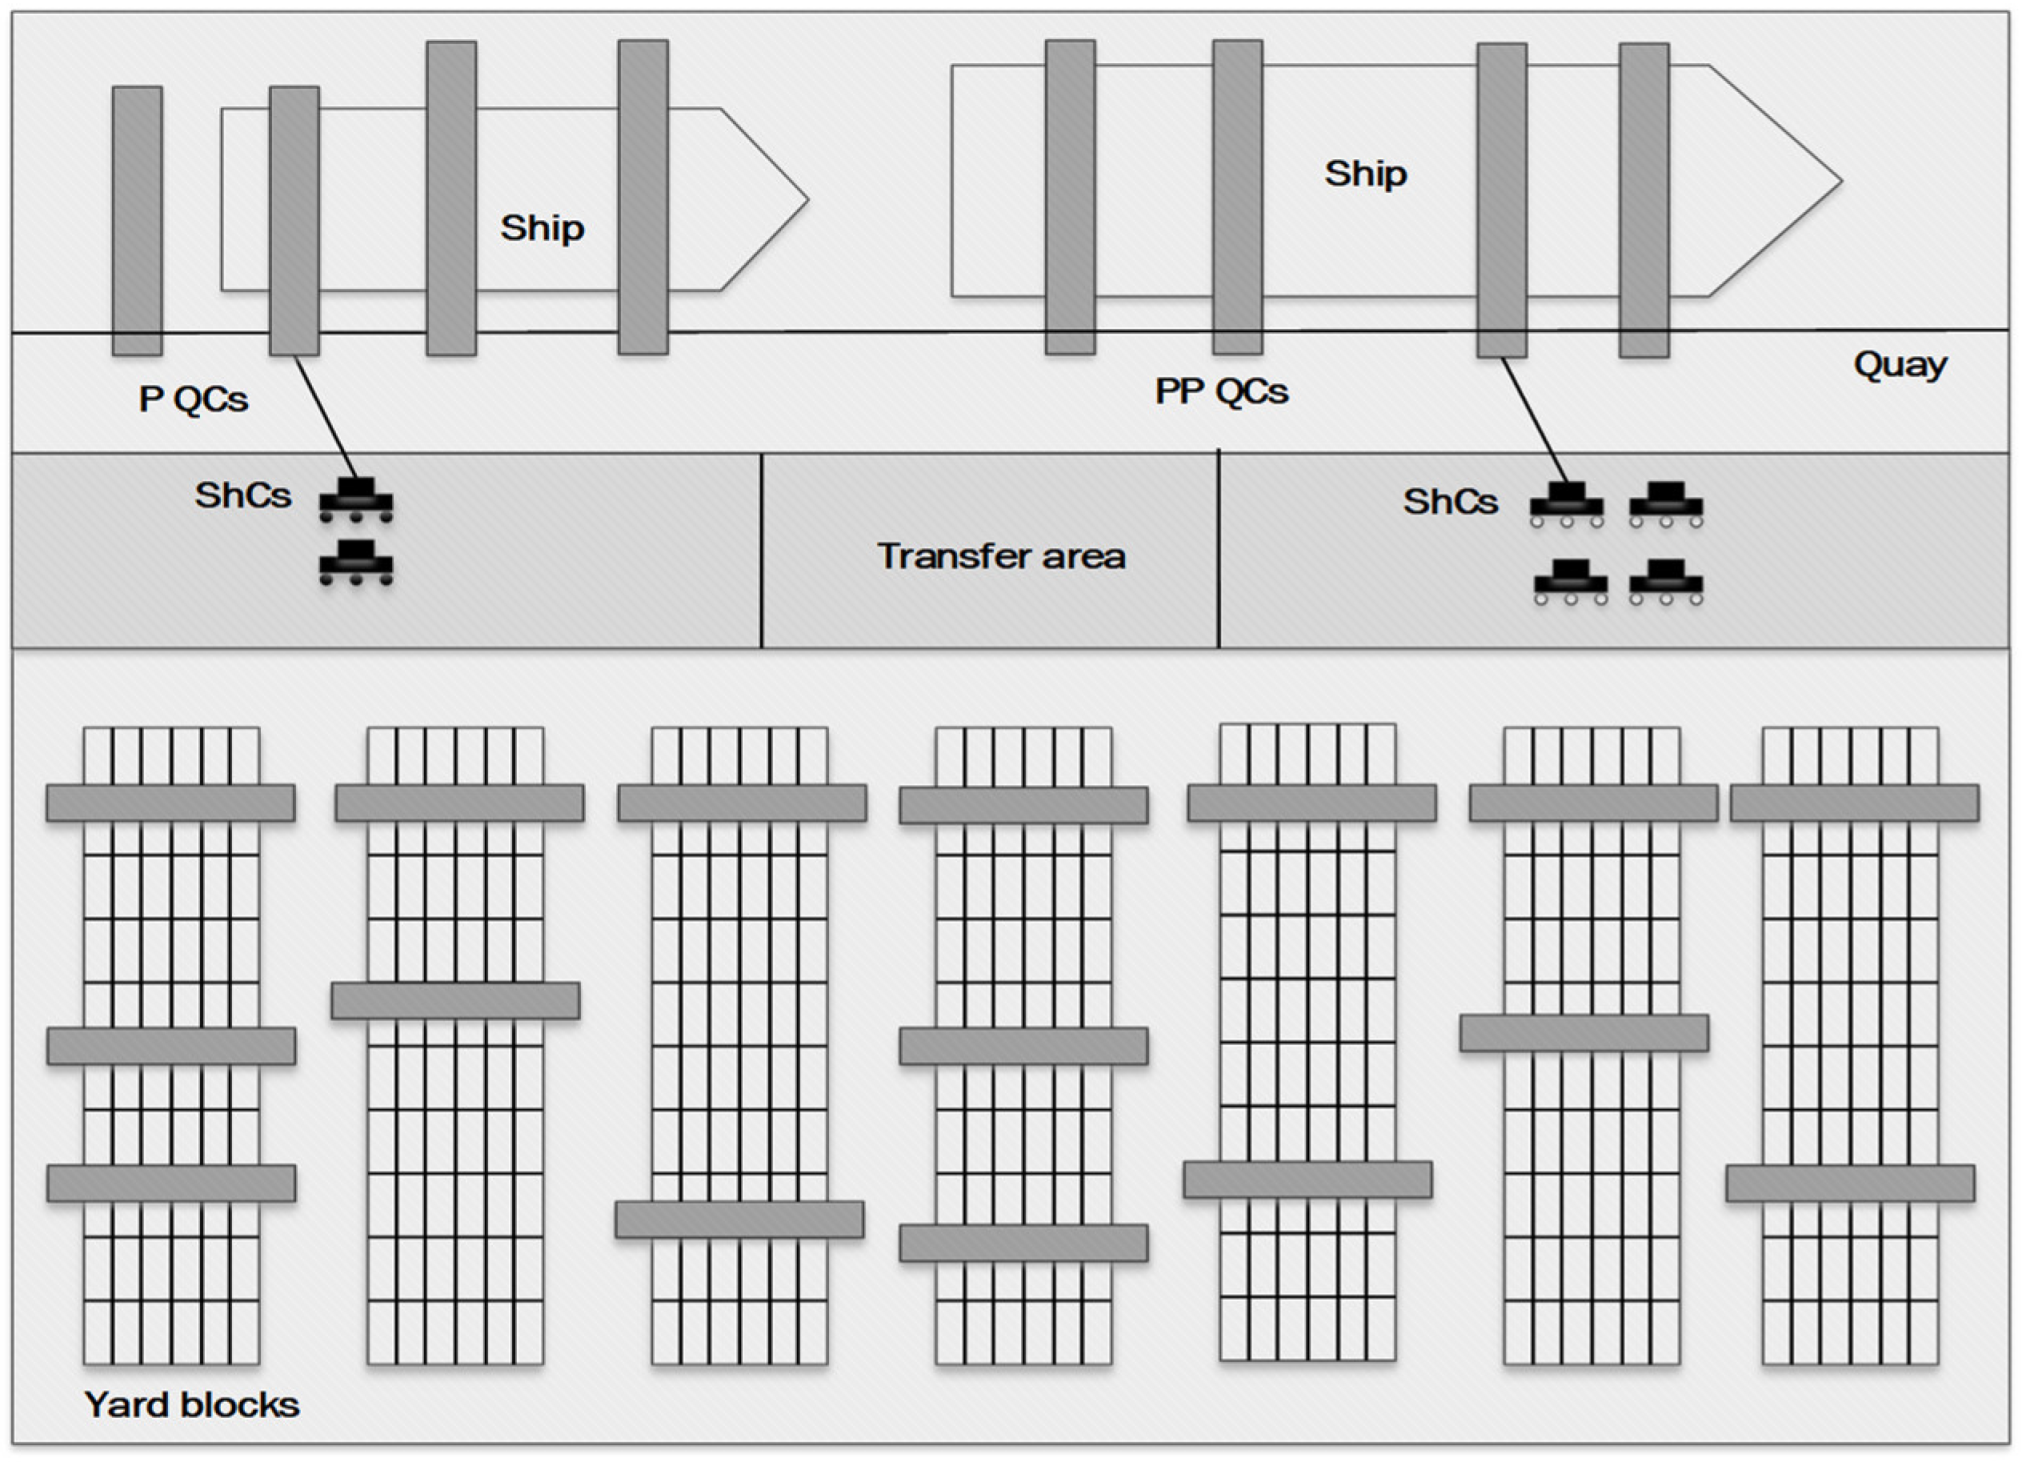
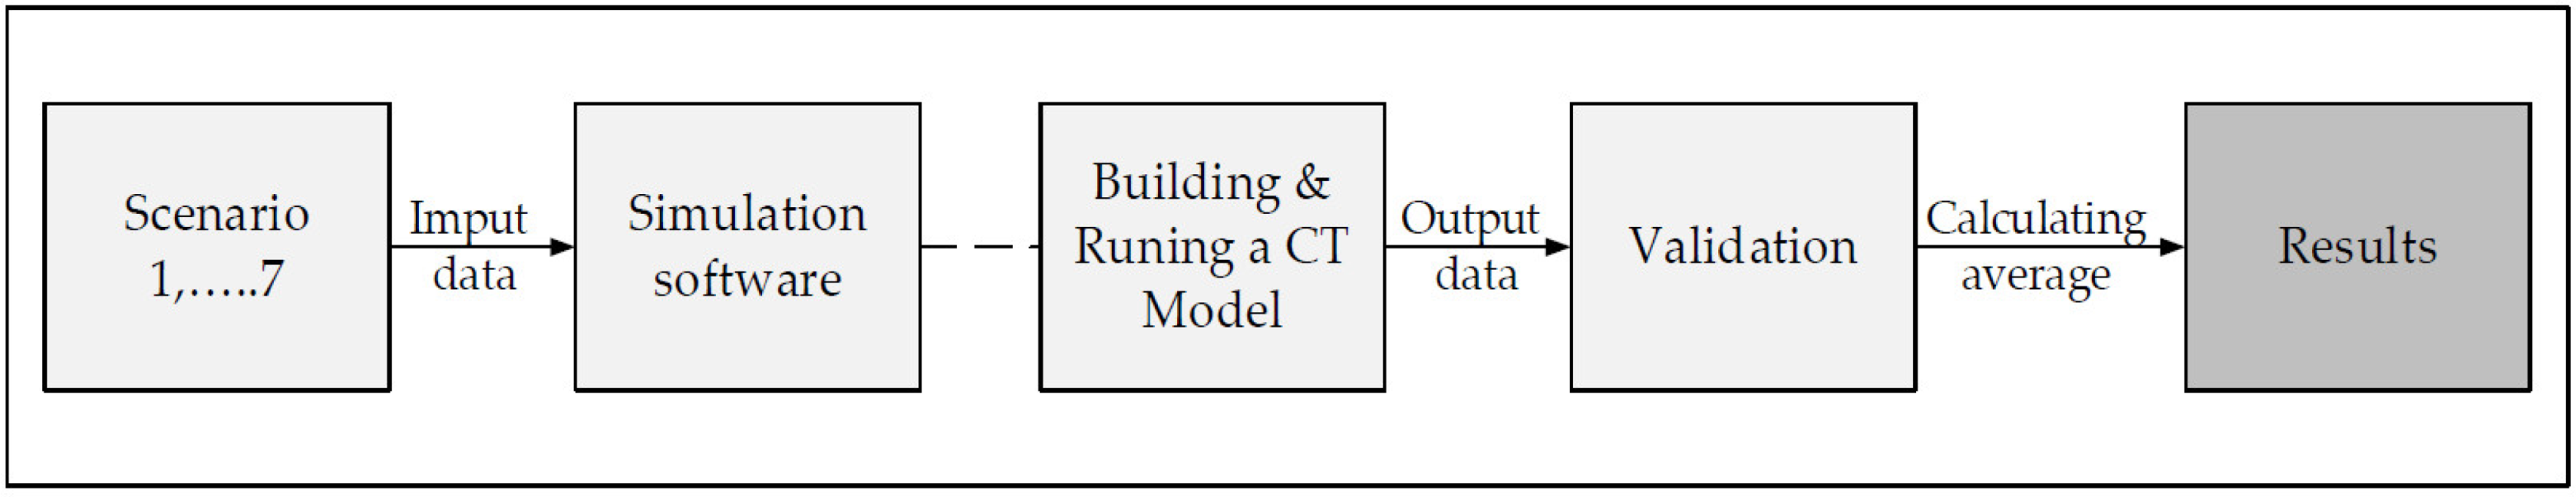
3. Model Formulation and Methodology
4. Results
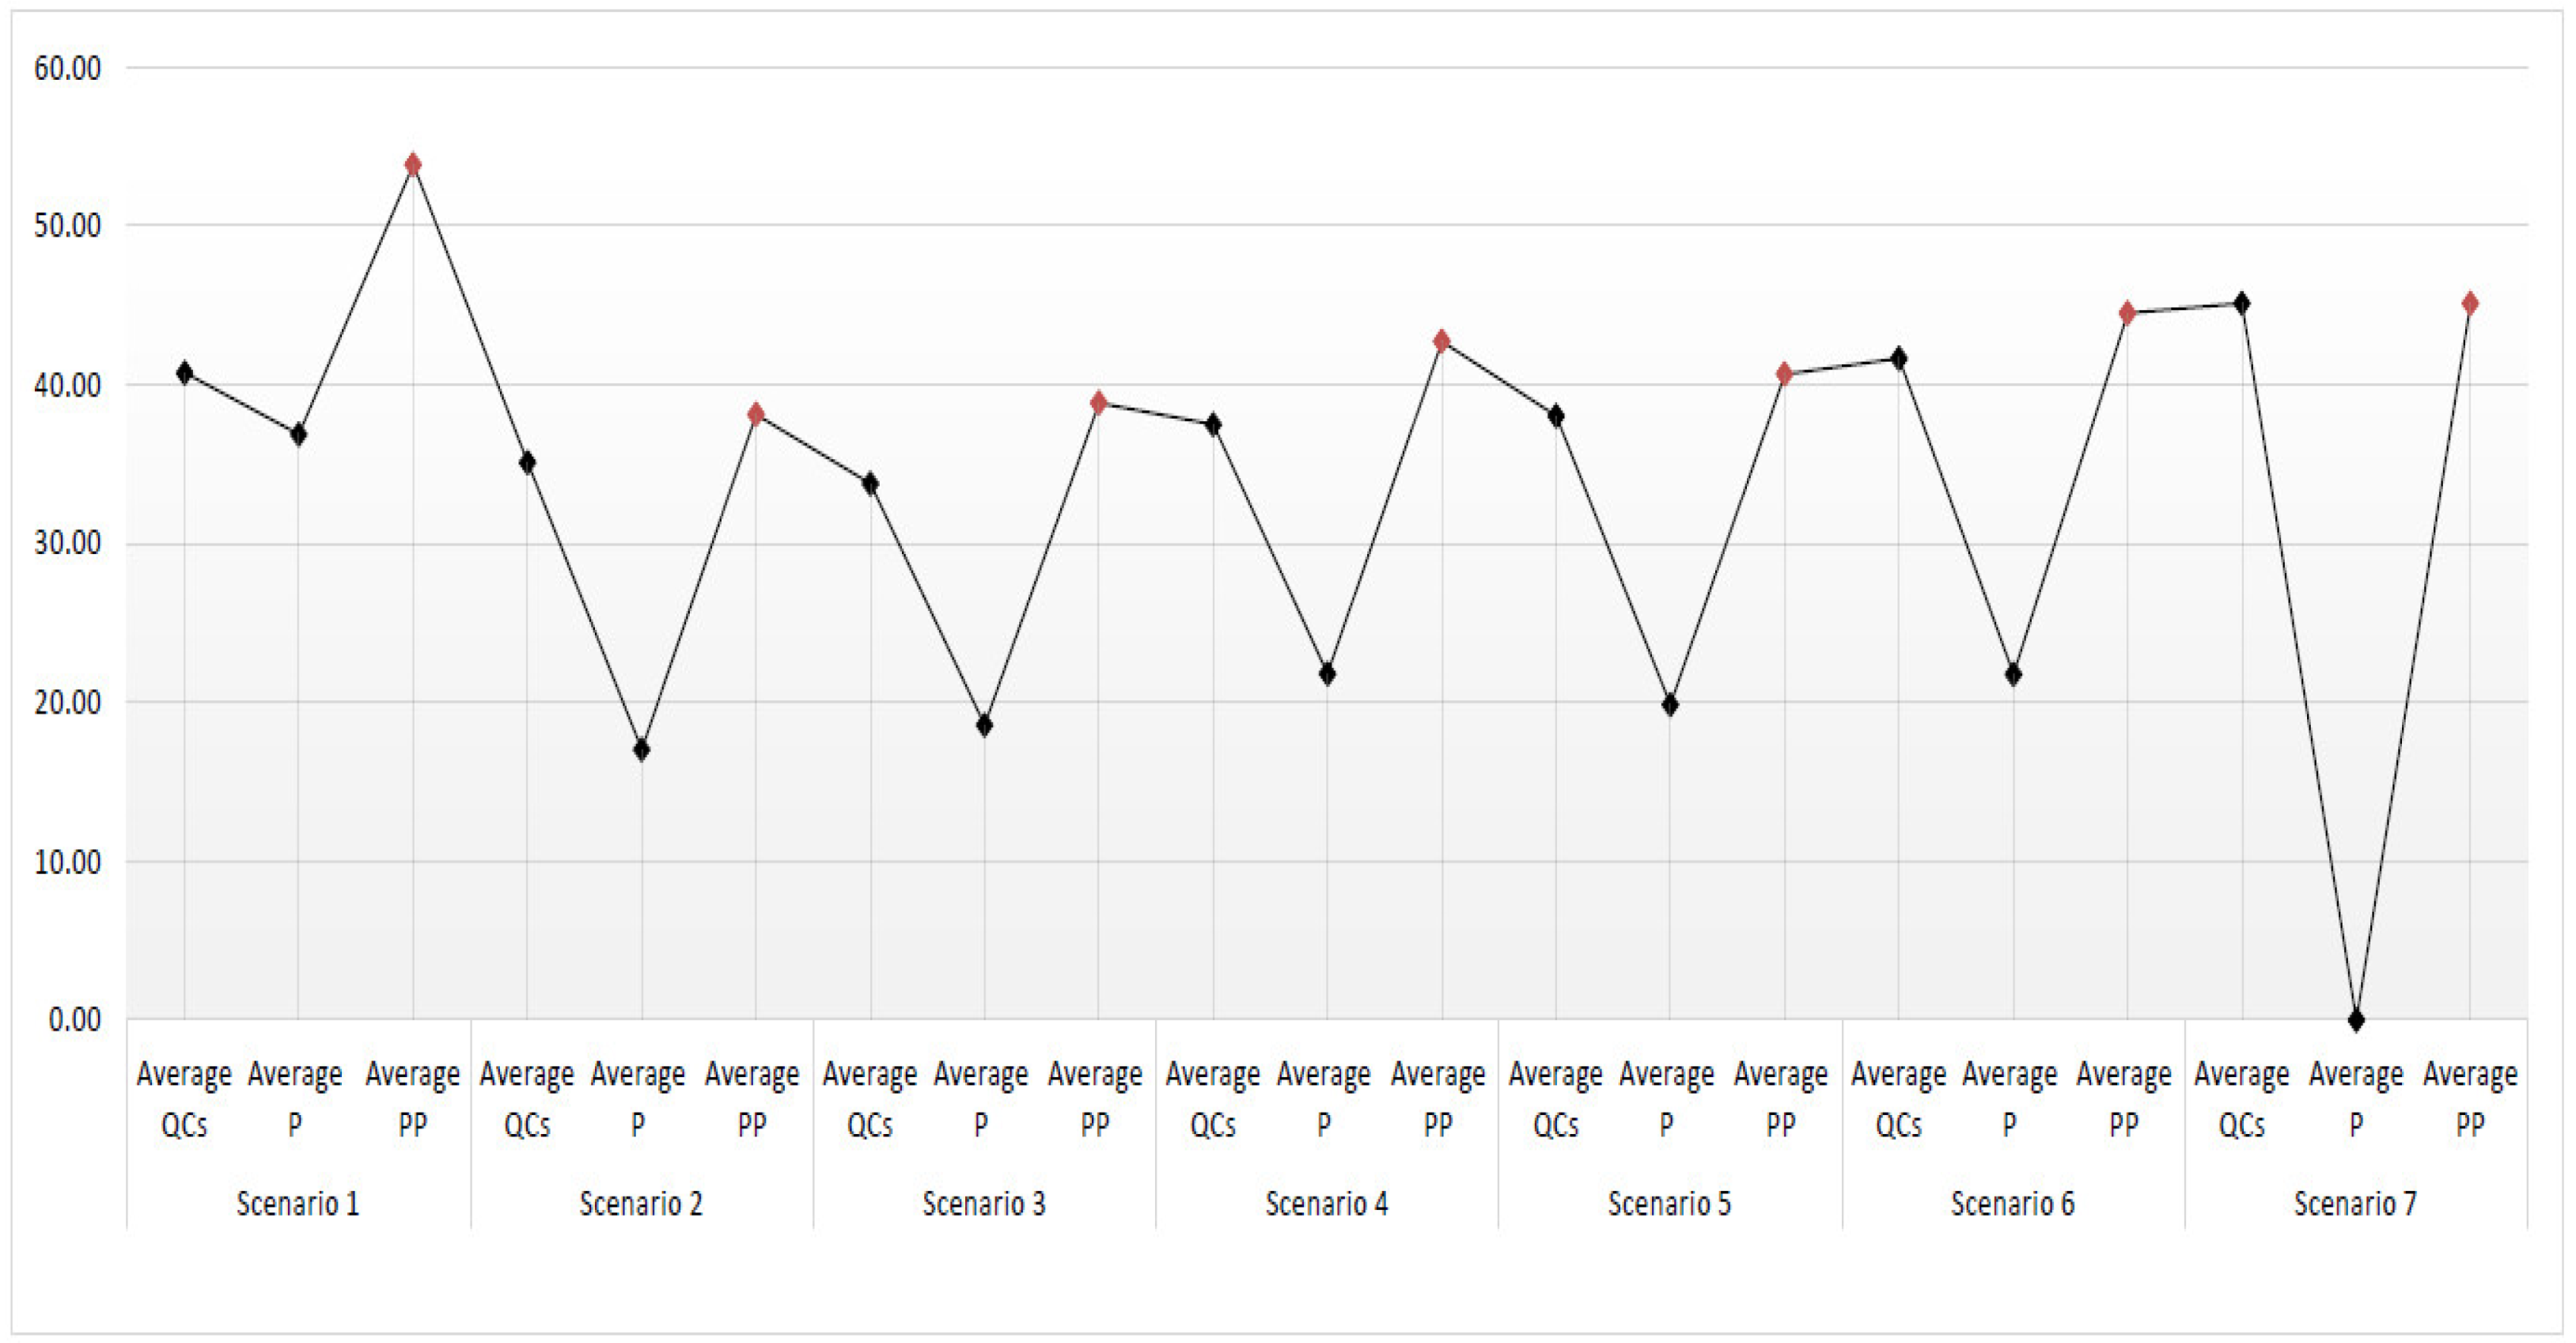
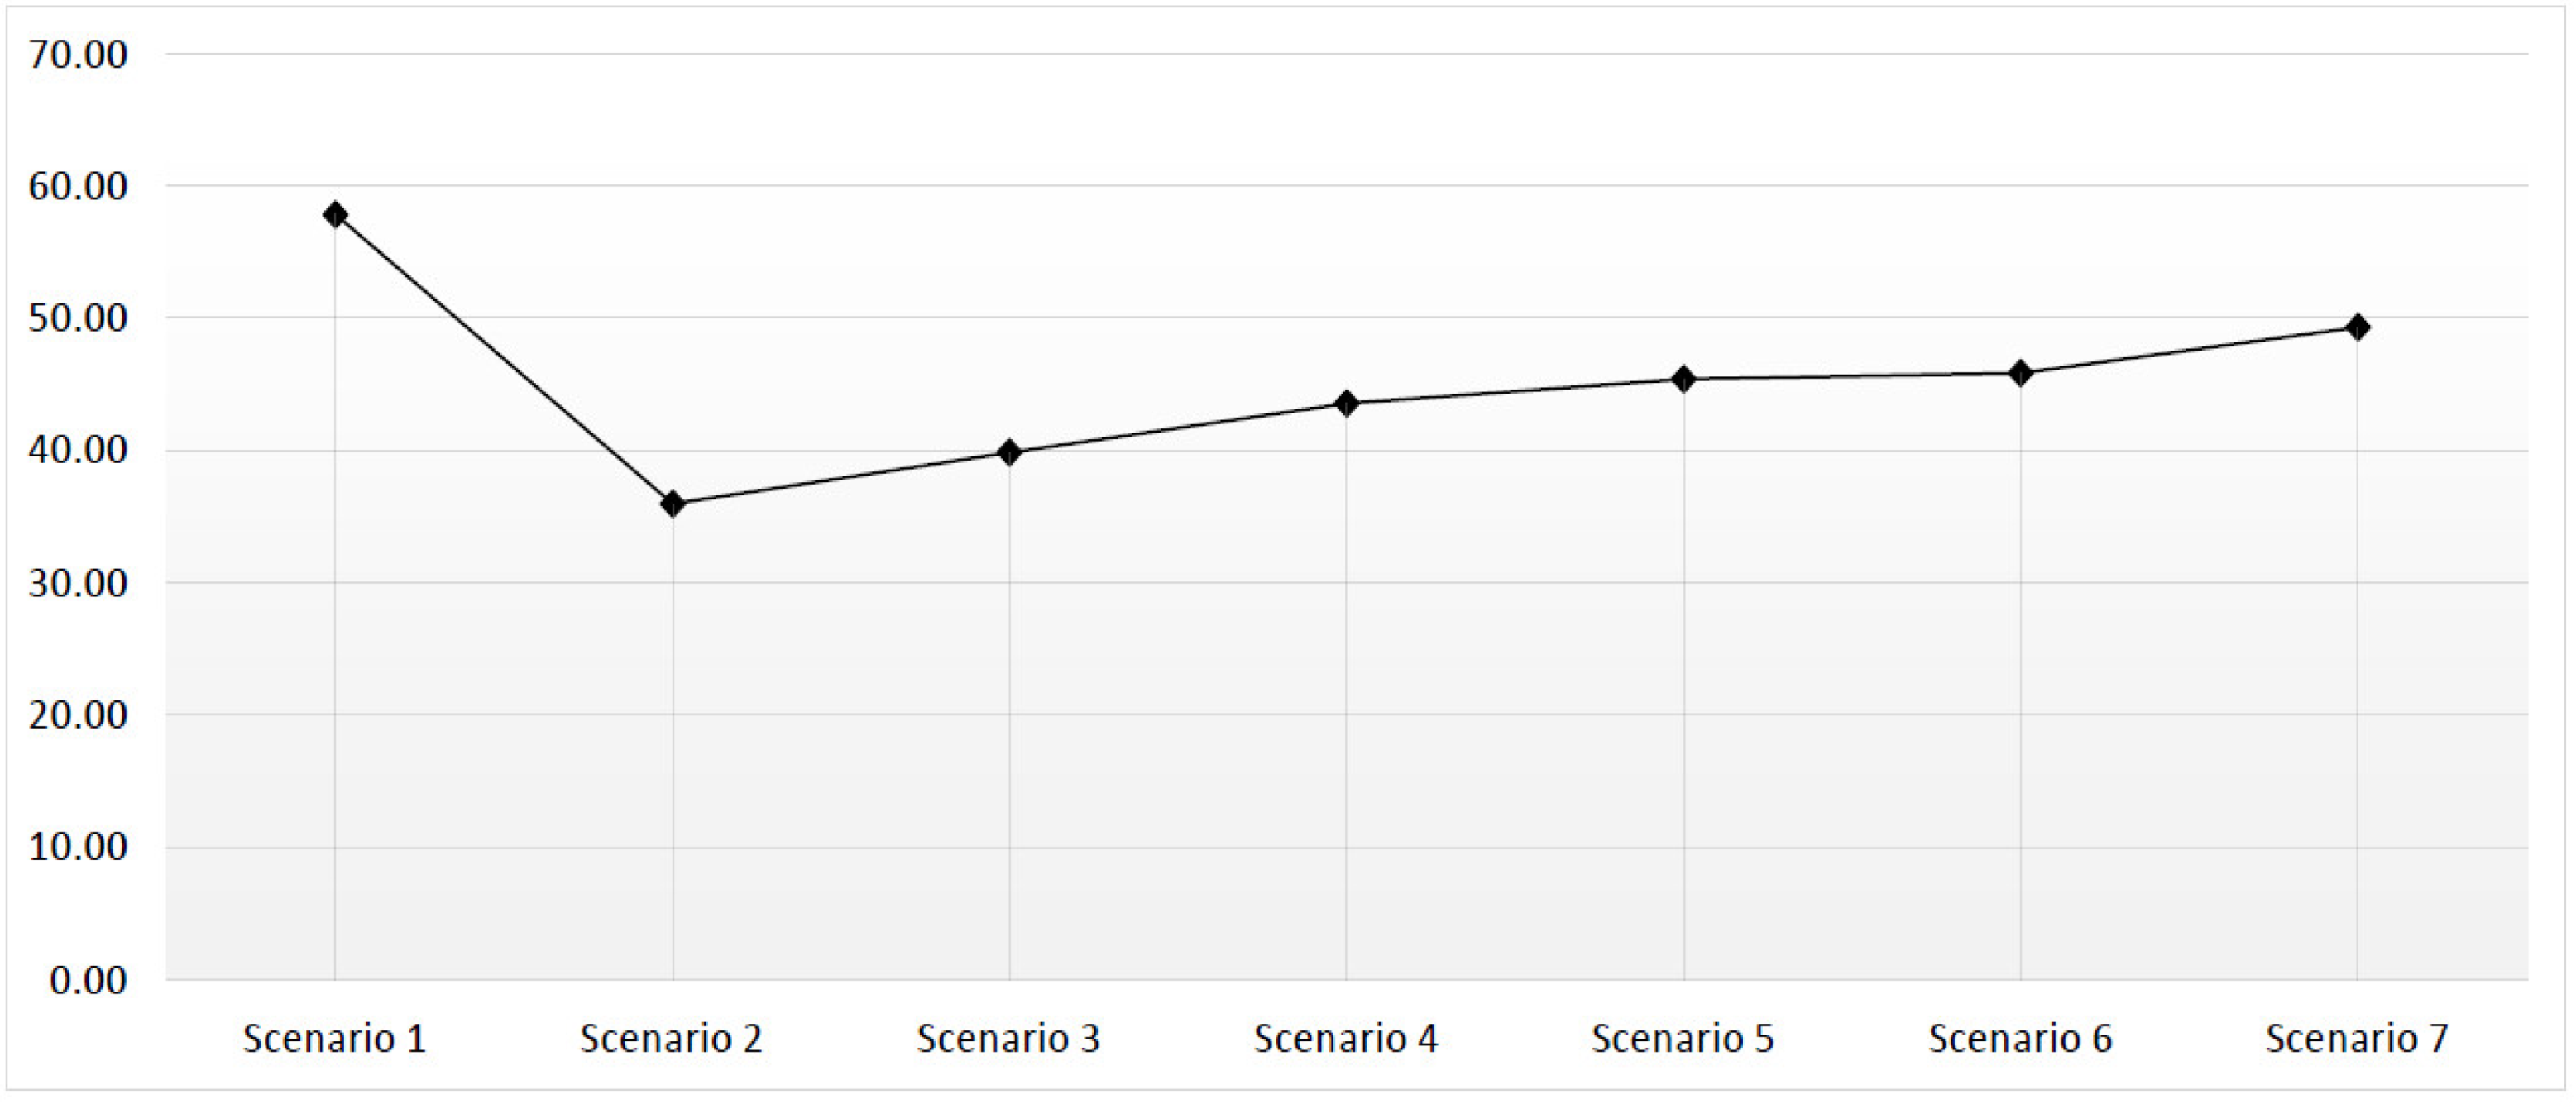
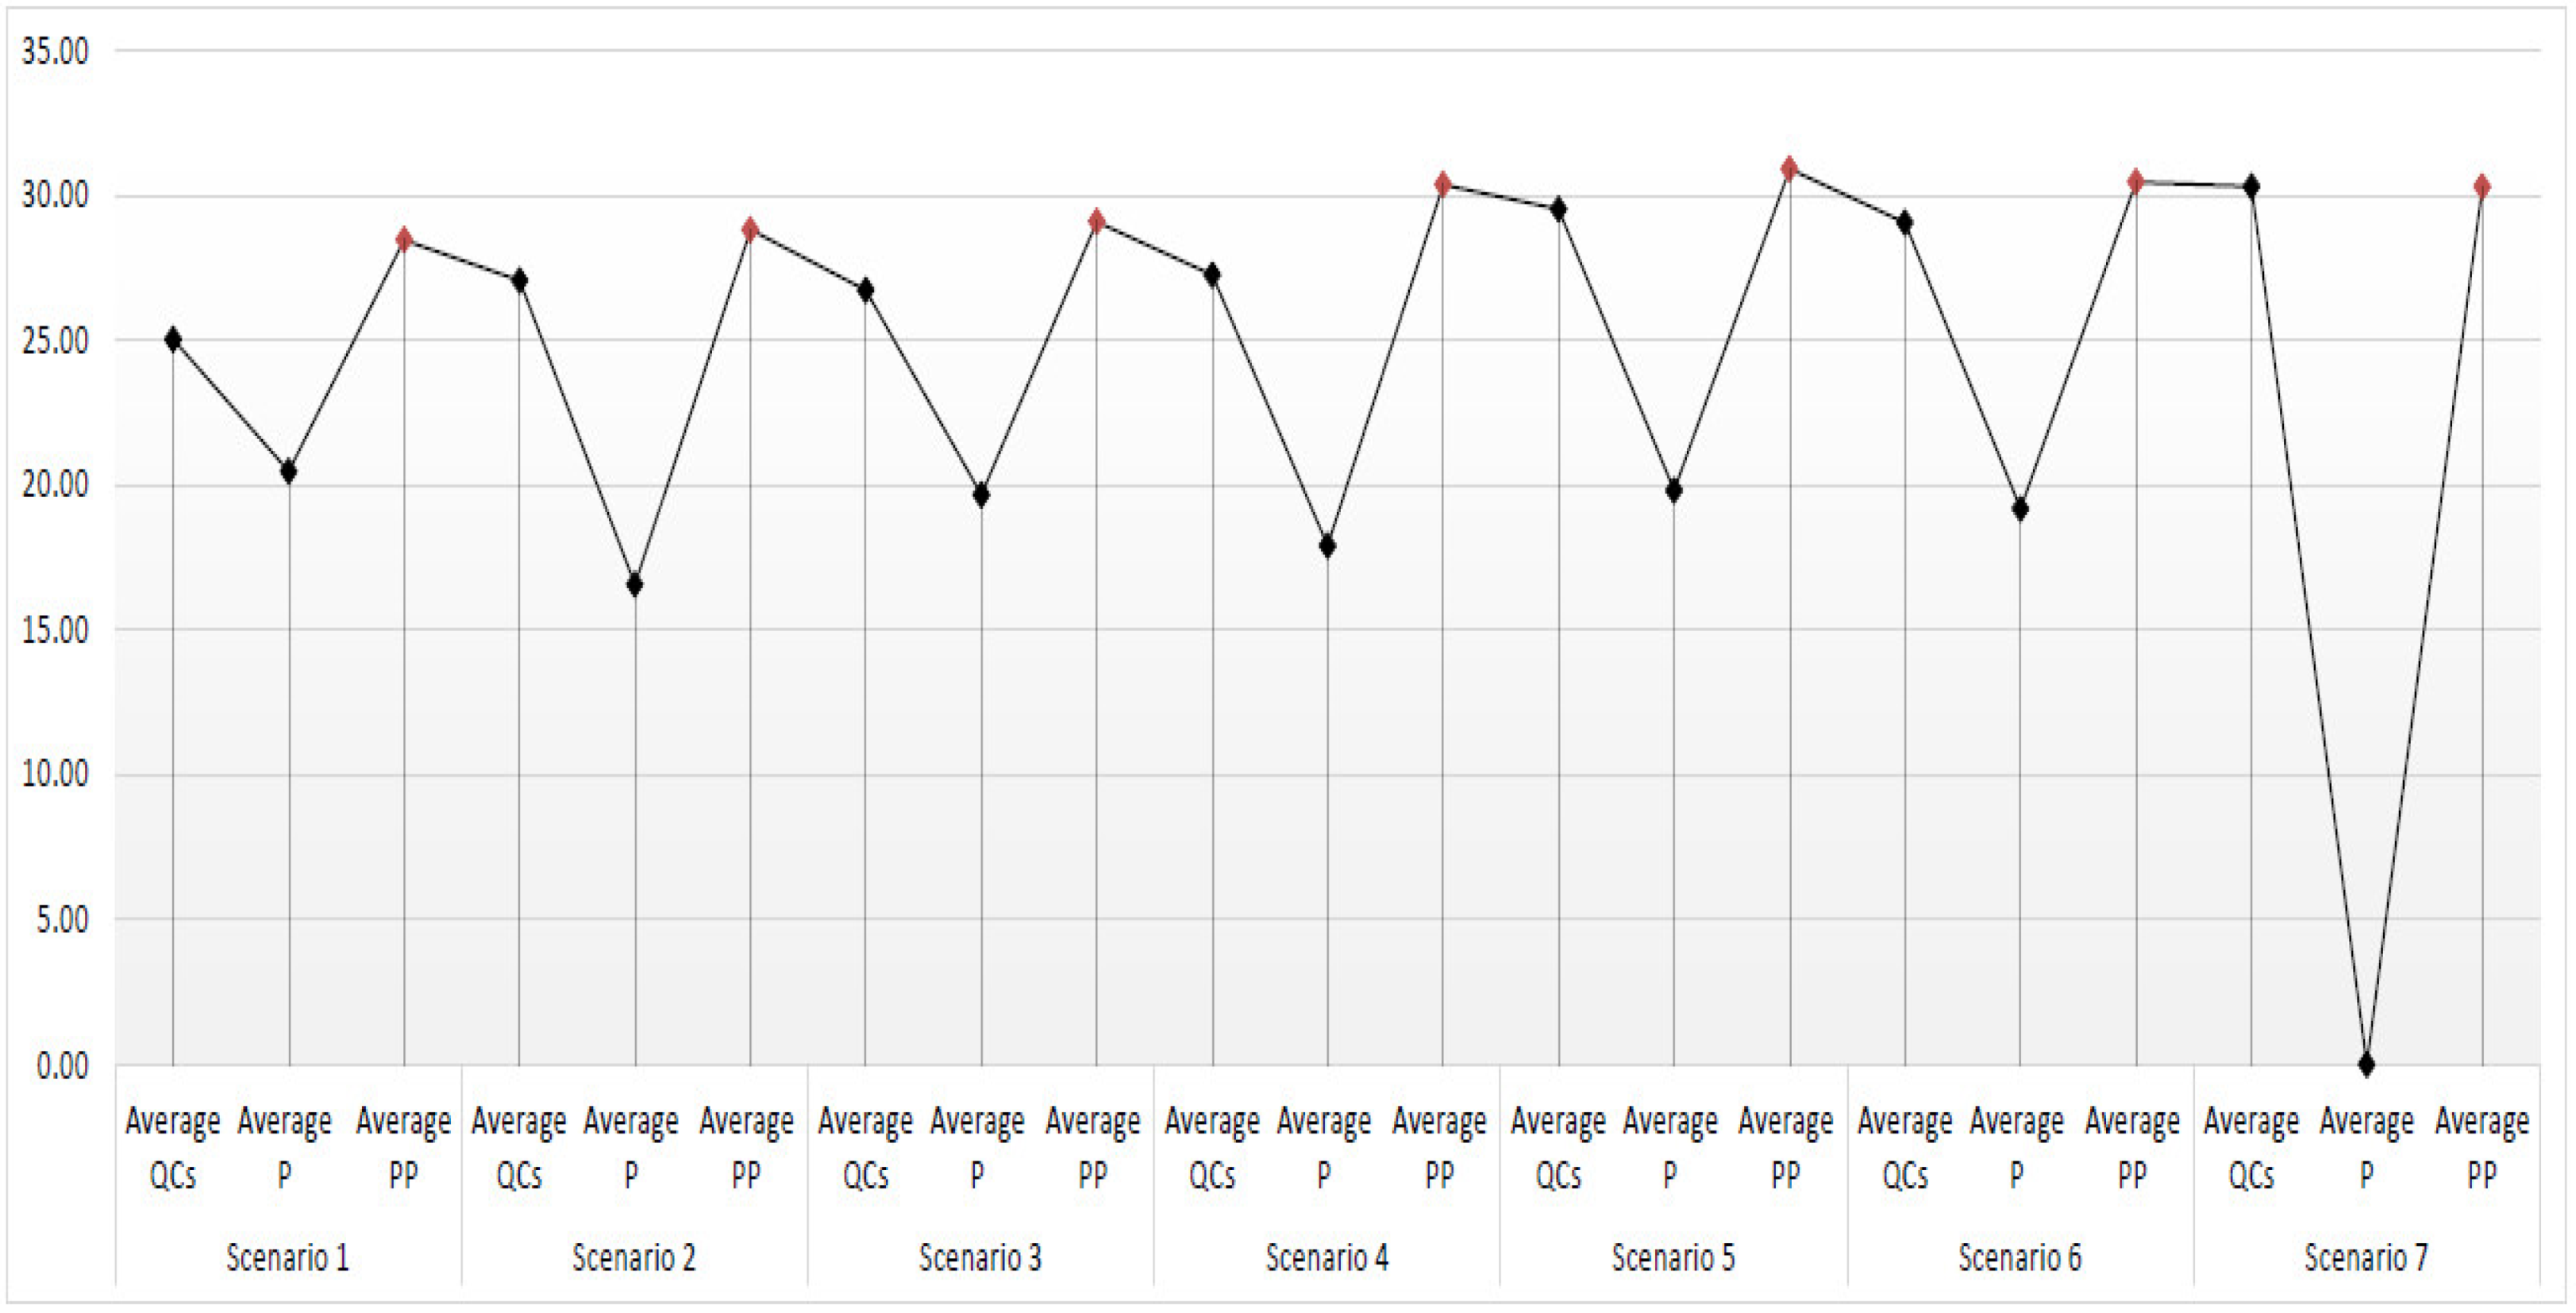
4.1. Berth
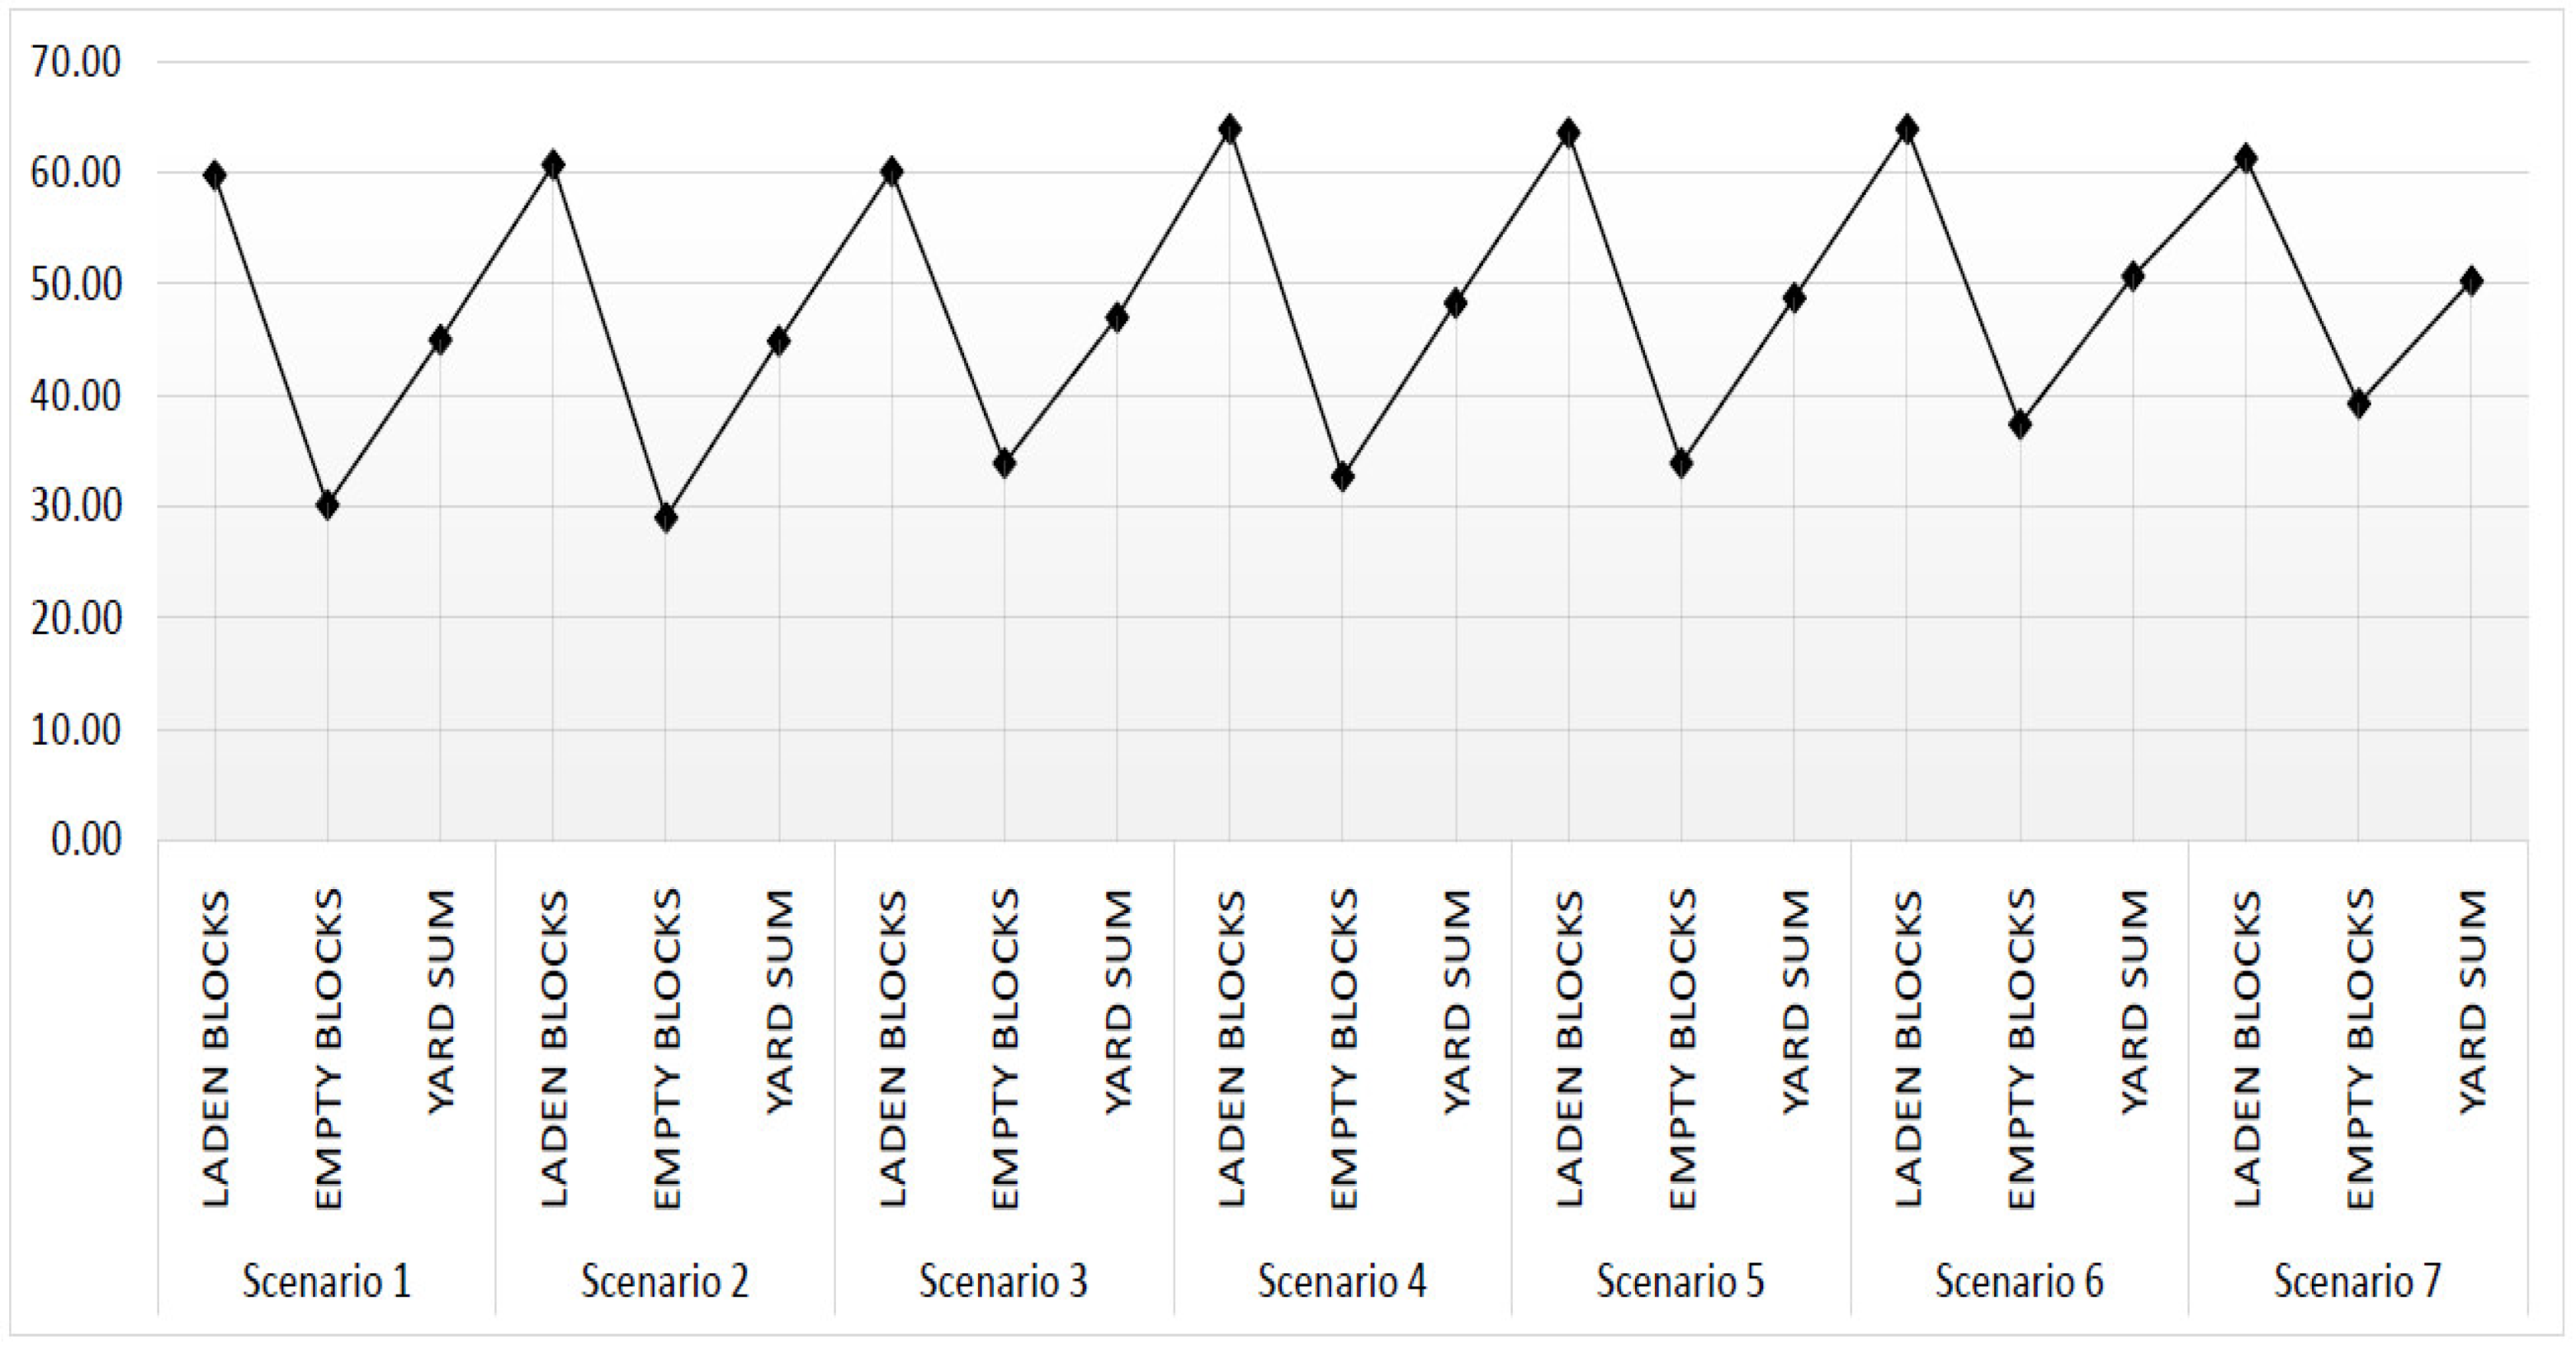
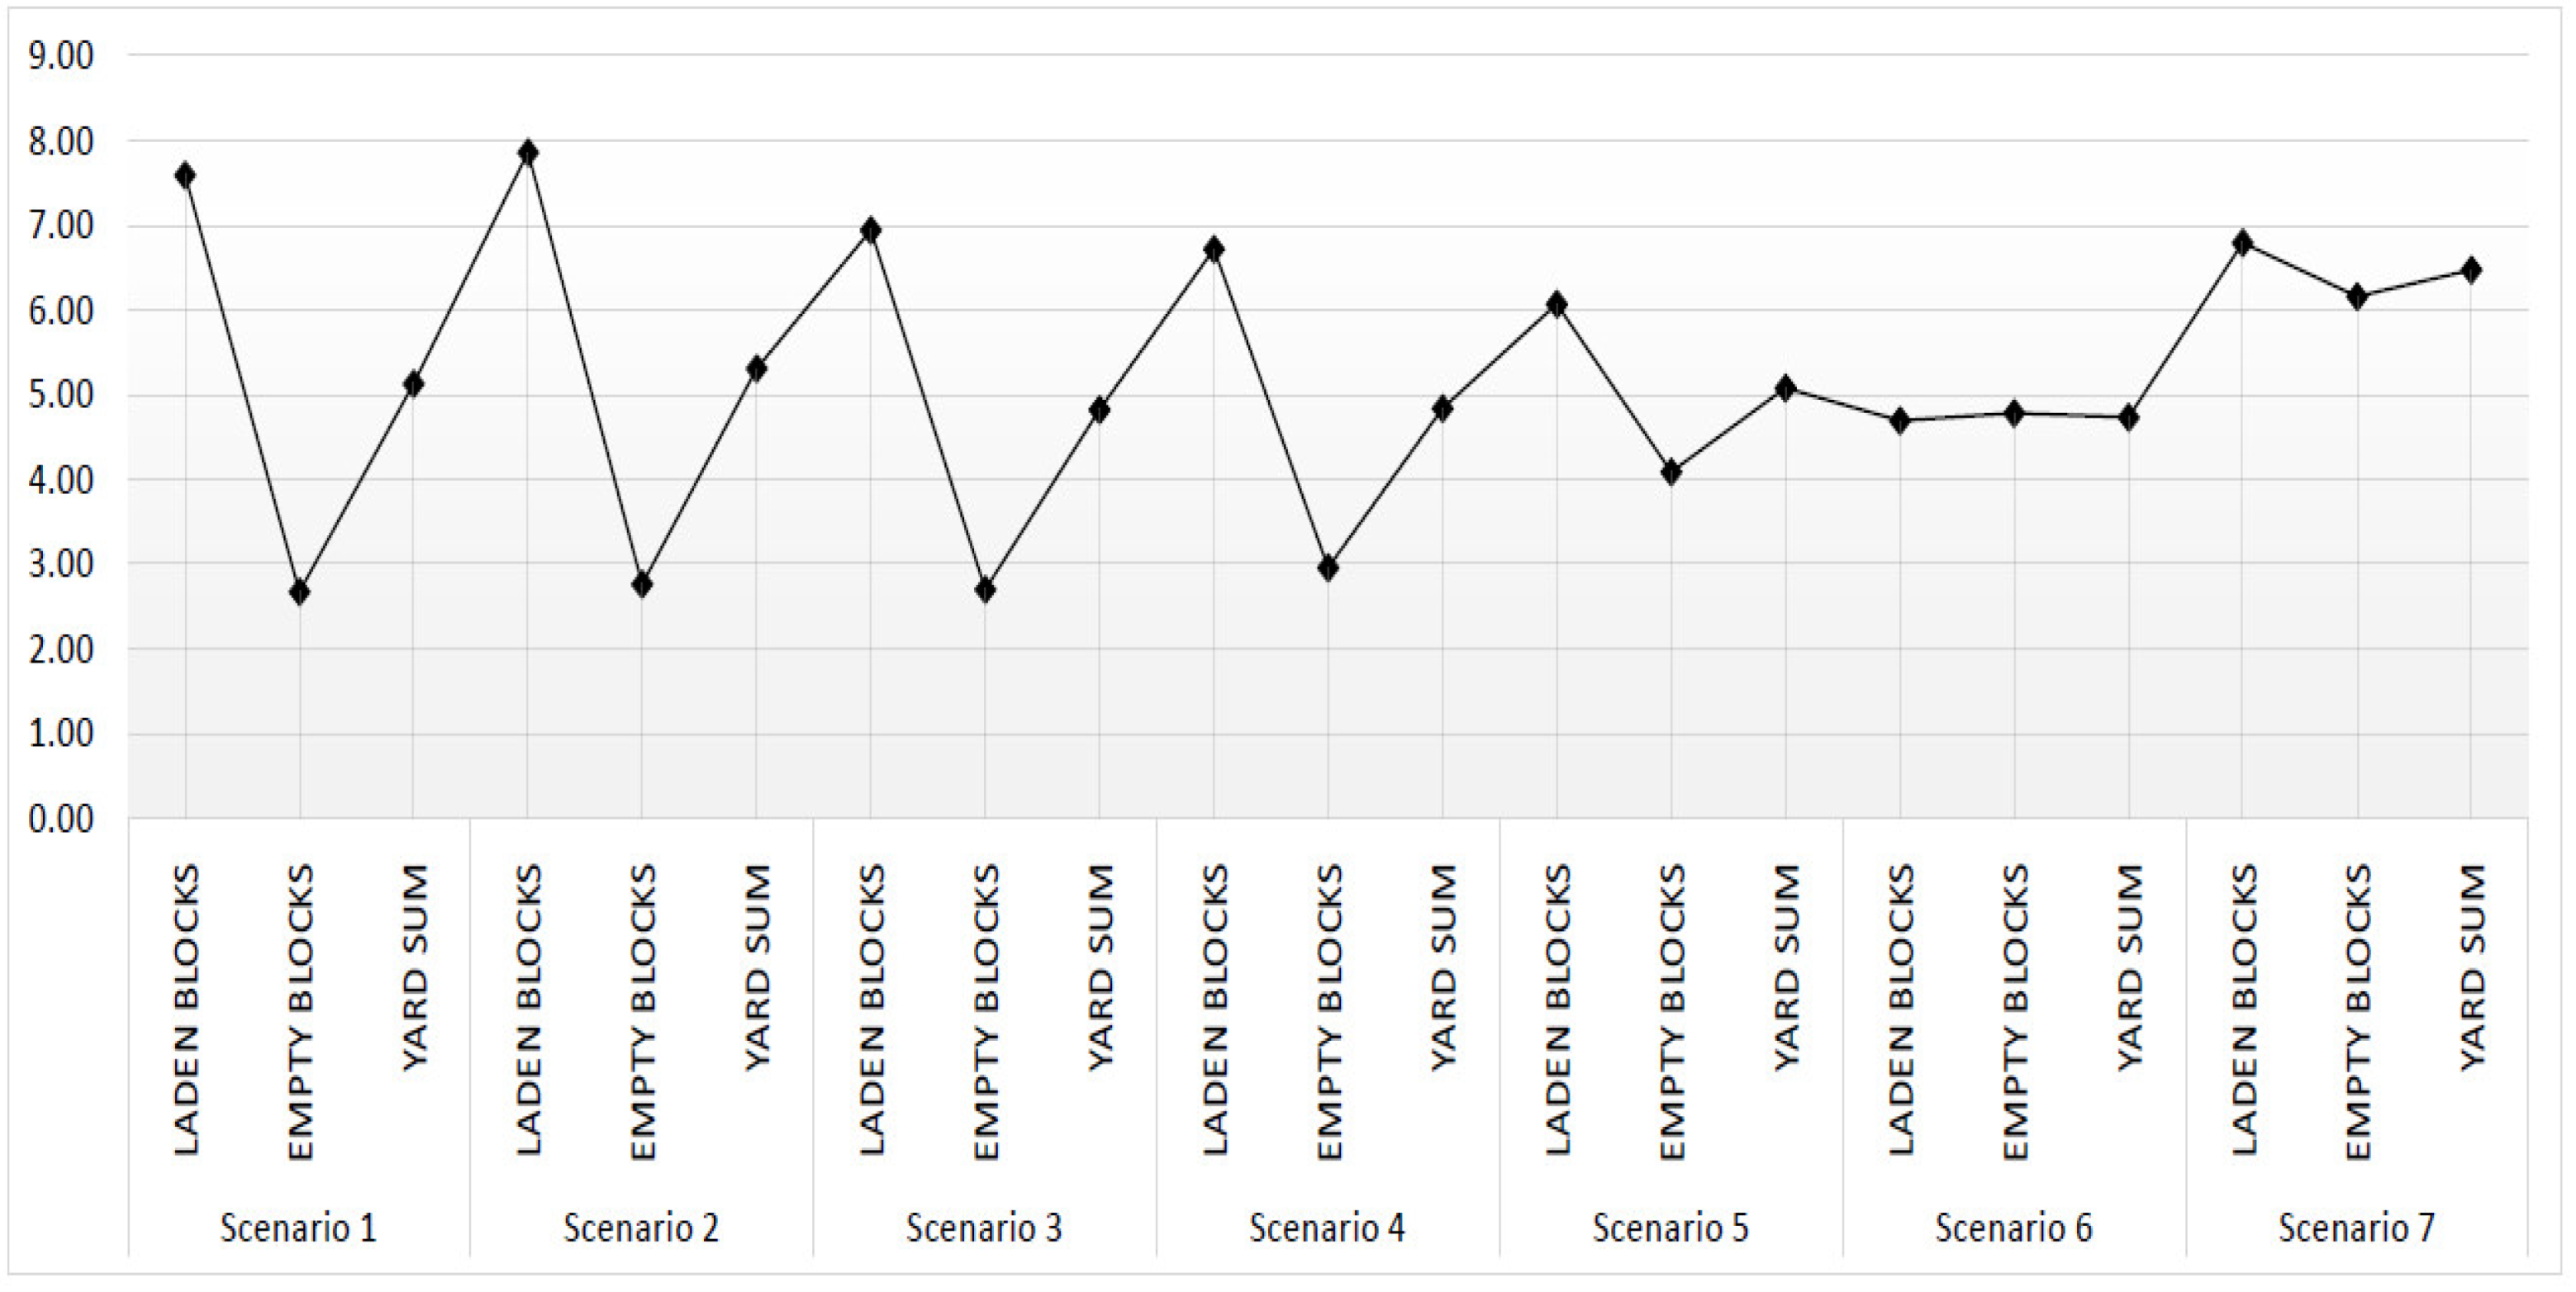
4.2. Yard
5. Discussion and Conclusions
Author Contributions
Funding
Institutional Review Board Statement
Informed Consent Statement
Data Availability Statement
Conflicts of Interest
References
- Beškovnik, B.; Twrdy, E.; Bauk, S. Developing Higher Berth Productivity: Comparison of Eastern Adriatic Container Terminals. Promet Traffic Transp. 2019, 31, 397–405. [Google Scholar] [CrossRef] [Green Version]
- Huynh, N.; Walton, C.M. Improving Efficiency of Drayage Operations at Seaport Container Terminals Through the use of an Appointment System. In Handbook of Terminal Planning; Bose, J.W., Ed.; Springer Science+Business Media, LLC: New York, NY, USA, 2011; pp. 323–343. [Google Scholar]
- Merk, O.; Busquet, B.; Aronietis, R. The Impact of Mega-Ships; OECD: Paris, France, 2015. [Google Scholar]
- Hu, H.; Chen, X.; Zhen, L.; Ma, C.; Zhang, X. The Joint quay crane scheduling and block allocation problem in container terminals. IMA J. Manag. Math. 2018, 30, 51–75. [Google Scholar] [CrossRef]
- Brinkmann, B. Operations System of Container Terminals: A Compendious Overview. In Handbook of Terminal Planning; Bose, J.W., Ed.; Springer Science+Business Media, LLC: New York, NY, USA, 2011; pp. 25–39. [Google Scholar]
- Stojaković, M.; Twrdy, E. A Simulation Approach to the Definition of the Subsystems Parameters in Small Container Terminals. J. Mar. Sci. Eng. 2021, 9, 1023. [Google Scholar] [CrossRef]
- Steenken, D.; Voß, S.; Stahlbock, R. Container terminal operation and operations research—A classification and literature review. OR Spectr. 2004, 26, 3–49. [Google Scholar]
- Stahlbock, R.; Voß, S. Operations research at container terminals: A literature update. OR Spectr. 2008, 30, 1–52. [Google Scholar] [CrossRef]
- Vis, I.F.A.; De Koster, R. Transshipment of containers at a container terminal: An overview. Eur. J. Oper. Res. 2003, 147, 1–16. [Google Scholar] [CrossRef]
- Kim, K.-H.; Günther, H.-O. Container terminals and terminal operations. OR Spectr. 2006, 28, 437–445. [Google Scholar]
- Böse, J.W. Handbook of Terminal Planning; Sharda, R., Voß, S., Eds.; Springer Science+Business Media: New York, NY, USA, 2011; 437p. [Google Scholar]
- Musso, E.; Sciomachen, A. Impact of megaships on the performance of port container terminals. Marit. Econ. Logist. 2020, 22, 432–445. [Google Scholar] [CrossRef]
- Park, N.K.; Suh, S.C. Tendency toward Mega Containerships and the Constraints of Container Terminals. J. Mar. Sci. Eng. 2019, 7, 131. [Google Scholar] [CrossRef] [Green Version]
- Martin, J.; Martin, S.; Pettit, S. Container ship size and the implications on port call workload. Int. J. Shipp. Transp. Logist. 2015, 7, 553. [Google Scholar] [CrossRef]
- Meng, Q.; Weng, J.; Li, S. Impact Analysis of Mega Vessels on Container Terminal Operations. Transp. Res. Procedia 2017, 25, 187–204. [Google Scholar] [CrossRef]
- Sys, C.; Blauwens, G.; Omey, E.; Van De Voorde, E.; Witlox, F. In Search of the Link between Ship Size and Operations. Transp. Plan. Technol. 2008, 31, 435–463. [Google Scholar] [CrossRef] [Green Version]
- Seyedalizadeh Ganji, S.R.; Babazadeh, A.; Arabshahi, N. Analysis of the continuous berth allocation problem in container ports using a genetic algorithm. J. Mar. Sci. Technol. 2010, 15, 408–416. [Google Scholar] [CrossRef]
- Bartošek, A.; Marek, O. Quay Cranes in Container Terminals. Trans. Transp. Sci. 2013, 6, 9–18. [Google Scholar] [CrossRef] [Green Version]
- Zhao, W.; Goodchild, A.V. Using the truck appointment system to improve yard efficiency in container terminals. Marit. Econ. Logist. 2013, 15, 101–119. [Google Scholar] [CrossRef]
- Bierwirth, C.; Meisel, F. A survey of berth allocation and quay crane scheduling problems in container terminals. Eur. J. Oper. Res. 2010, 202, 615–627. [Google Scholar] [CrossRef]
- Bierwirth, C.; Meisel, F. A follow-up survey of berth allocation and quay crane scheduling problems in container terminals. Eur. J. Oper. Res. 2015, 244, 675–689. [Google Scholar] [CrossRef]
- Liang, C.; Hwang, H.; Gen, M. A berth allocation planning problem with direct transshipment consideration. J. Intell. Manuf. 2011, 23, 2207–2214. [Google Scholar] [CrossRef]
- Giallombardo, G.; Moccia, L.; Salani, M.; Vacca, I. Modeling and solving the Tactical Berth Allocation Problem. Transp. Res. Part B Methodol. 2010, 44, 232–245. [Google Scholar] [CrossRef] [Green Version]
- Carlo, H.J.; Vis, I.F.A.; Roodbergen, K.J. Transport operations in container terminals: Literature overview, trends, research directions and classification scheme. Eur. J. Oper. Res. 2014, 236, 1–13. [Google Scholar] [CrossRef]
- Kress, D.; Meiswinkel, S.; Pesch, E. Straddle carrier routing at seaport container terminals in the presence of short term quay crane buffer areas. Eur. J. Oper. Res. 2019, 279, 732–750. [Google Scholar] [CrossRef]
- Chen, L.; Langevin, A.; Lu, Z. Integrated scheduling of crane handling and truck transportation in a maritime container terminal. Eur. J. Oper. Res. 2013, 225, 142–152. [Google Scholar] [CrossRef]
- Martin Alcalde, E.; Kim, K.H.; Marchán, S.S. Optimal space for storage yard considering yard inventory forecasts and terminal performance. Transp. Res. Part E Logist. Transp. Rev. 2015, 82, 101–128. [Google Scholar] [CrossRef]
- Zhen, L. Modeling of yard congestion and optimization of yard template in container ports. Transp. Res. Part B Methodol. 2016, 90, 83–104. [Google Scholar] [CrossRef]
- Zhen, L.; Xu, Z.; Wang, K.; Ding, Y. Multi-period yard template planning in container terminals. Transp. Res. Part B Methodol. 2016, 93, 700–719. [Google Scholar] [CrossRef]
- Wiese, J.; Suhl, L.; Kliewer, N. Planning Container Terminal Layouts Considering Equipment Types and Storage Block Design. In Handbook of Terminal Planning; Jurgen, B.W., Ed.; Springer Science+Business Media, LLC: New York, NY, USA, 2011; pp. 219–245. [Google Scholar]
- Gharehgozli, A.; Zaerpour, N.; de Koster, R. Container terminal layout design: Transition and future. Marit. Econ. Logist. 2019, 22, 610–639. [Google Scholar] [CrossRef]
- Lee, B.K.; Kim, K.H. Optimizing the yard layout in container terminals. OR Spectr. 2013, 35, 363–398. [Google Scholar] [CrossRef]
- Lee, B.K.; Lee, L.H.; Chew, E.P. Analysis on high throughput layout of container yards. Int. J. Prod. Res. 2018, 56, 5345–5364. [Google Scholar] [CrossRef]
- Taner, M.E.; Kulak, O.; Koyuncuoğlu, M.U. Layout analysis affecting strategic decisions in artificial container terminals. Comput. Ind. Eng. 2014, 75, 1–12. [Google Scholar] [CrossRef]
- Dragović, B.; Tzannatos, E.; Park, N.K. Simulation modelling in ports and container terminals: Literature overview and analysis by research field, application area and tool. Flex. Serv. Manuf. J. 2017, 29, 4–34. [Google Scholar] [CrossRef]
- Sislioglu, M.; Celik, M.; Ozkaynak, S. A simulation model proposal to improve the productivity of container terminal operations through investment alternatives. Marit. Policy Manag. 2018, 46, 156–177. [Google Scholar] [CrossRef]
- Kotachi, M.; Rabadi, G.; Obeid, M.F. Simulation Modeling and Analysis of Complex Port Operations with Multimodal Transportation. Procedia Comput. Sci. 2013, 20, 229–234. [Google Scholar] [CrossRef] [Green Version]
- Stojaković, M.; Twrdy, E. Determining the optimal number of yard trucks in smaller container terminals. Eur. Transp. Res. Rev. 2021, 13, 22. [Google Scholar] [CrossRef]


| Scenario | 1 | 2 | 3 | 4 | 5 | 6 | 7 |
|---|---|---|---|---|---|---|---|
| Annual Throughput (TEU) | 630,000 | 630,000 | 689,000 | 768,000 | 844,000 | 899,000 | 990,000 |
| Quay (m) | 600 | 700 | 700 | 700 | 700 | 700 | 700 |
| QCs | 4 P + 4 PP | 2 P + 6 PP | 2 P + 6 PP | 2 P + 6 PP | 1 P + 7 PP | 1 P + 7 PP | 0 P + 8 PP |
| No. of Feeder and Panamax services | 9 | 9 | 7 | 6 | 5 | 5 | 4 |
| No. of post-Panamax Services | 4 | 4 | 5 | 6 | 7 | 7 | 7 |
| Performance Metrics | Definition of Metrics | Measured Dimensions |
|---|---|---|
| QC | ||
| Working time | QCs working time on ships during simulation run | % |
| Productivity | Number of containers handled by QCs | Moves per hour |
| Berth | ||
| Occupancy | Berth utilisation by ships in a simulation run | % |
| Yard | ||
| Utilisation | Yard utilisation in a simulation run | % |
| YCs waiting time | Time spent by YCs waiting for ShCs | min |
| Scenarios | QC Working Time (%) | QC Moves per Hour | Berth Occupancy Ratio (%) | Average Yard Utilisation (%) | YC Average Waiting Time (min) | ||
|---|---|---|---|---|---|---|---|
| P | PP | P | PP | / | / | / | |
| Scenario 1 | 36.87 | 53.84 | 20.48 | 28.47 | 57.84 | 45.00 | 5.13 |
| Scenario 2 | 17.04 | 38.11 | 16.57 | 28.82 | 35.96 | 44.88 | 5.31 |
| Scenario 3 | 18.56 | 38.83 | 19.66 | 29.10 | 39.85 | 47.03 | 4.82 |
| Scenario 4 | 21.80 | 42.71 | 17.90 | 30.38 | 43.55 | 48.33 | 4.84 |
| Scenario 5 | 19.85 | 40.64 | 19.82 | 30.92 | 45.38 | 48.76 | 5.08 |
| Scenario 6 | 21.76 | 44.49 | 19.19 | 30.47 | 45.83 | 50.70 | 4.73 |
| Scenario 7 | 0.00 | 45.10 | 0.00 | 30.31 | 49.33 | 50.29 | 6.47 |
Disclaimer/Publisher’s Note: The statements, opinions and data contained in all publications are solely those of the individual author(s) and contributor(s) and not of MDPI and/or the editor(s). MDPI and/or the editor(s) disclaim responsibility for any injury to people or property resulting from any ideas, methods, instructions or products referred to in the content. |
© 2023 by the authors. Licensee MDPI, Basel, Switzerland. This article is an open access article distributed under the terms and conditions of the Creative Commons Attribution (CC BY) license (https://creativecommons.org/licenses/by/4.0/).
Share and Cite
Stojaković, M.; Twrdy, E. Efficiency Evaluation of a Small Container Terminal with Perpendicular Yard Layout Using Shuttle Carriers. J. Mar. Sci. Eng. 2023, 11, 449. https://doi.org/10.3390/jmse11020449
Stojaković M, Twrdy E. Efficiency Evaluation of a Small Container Terminal with Perpendicular Yard Layout Using Shuttle Carriers. Journal of Marine Science and Engineering. 2023; 11(2):449. https://doi.org/10.3390/jmse11020449
Chicago/Turabian StyleStojaković, Maja, and Elen Twrdy. 2023. "Efficiency Evaluation of a Small Container Terminal with Perpendicular Yard Layout Using Shuttle Carriers" Journal of Marine Science and Engineering 11, no. 2: 449. https://doi.org/10.3390/jmse11020449