Article

Classification of Hull Blocks of Ships Using CNN with Multi-View Image Set from 3D CAD Data

1
Department of Naval Architecture and Ocean Engineering, Kunsan National University, Gunsan 54150, Republic of Korea
2
Department of Naval Architecture and Ocean Engineering, Mokpo National Maritime University, Mokpo 58628, Republic of Korea
*
Author to whom correspondence should be addressed.
J. Mar. Sci. Eng. 2023, 11(2), 333; https://doi.org/10.3390/jmse11020333
Submission received: 31 December 2022 / Revised: 17 January 2023 / Accepted: 30 January 2023 / Published: 3 February 2023
(This article belongs to the Special Issue Sustainable Ship Design and Digital Twin Yard)

Abstract

:
In order to proceed with shipbuilding scheduling involving hundreds of hull blocks of ships, it is important to mark the locations of the hull blocks with the correct block identification number. Incorrect information about the locations and the identification numbers of hull blocks causes disruption in the shipbuilding scheduling process of the shipyard. Therefore, it is necessary to have a system for tracking the locations and identification numbers of hull blocks in order to avoid time loss due to incorrectly identified blocks. This paper proposes a method to mark the identification numbers, which are necessary for the tracking system of hull blocks. In order to do this, 3 CNN (convolutional neural network) models, VGG-19, Resnet-152V2, and Densenet-201, are used to classify the hull blocks. A set of multi-view images acquired from 3D CAD data are used as training data to obtain a trained CNN model, and images from 3D printer-printed hull block models are used for the test of the trained CNN model. The datasets used for training and prediction are Non-Thr and Thr datasets, that each included both binarized and non-binarized datasets. As a result of end-to-end classification experiments with Non-Thr datasets, the highest prediction accuracy was 0.68 with Densenet-201. A total of 4050 experimental conditions were constructed by combining the threadhold of the Thr training and testing dataset. As a result of experiments with Thr datasets, the highest prediction accuracy of 0.96 was acquired with Resnet-152V2, which was trained with a threshold of 72 and predicted with a threshold of 50. In conclusion, the classification of ship hull blocks using a CNN model with binarized datasets of 3D CAD data is more effective than that using a CNN model with non-binarized datasets.

1. Introduction

Large ships built in large shipyards are designed to be built by dividing the hull into hundreds of blocks because the hull is very large [1]. Hundreds of blocks that make up large ships are assembled through various workshops, and in this process, they are brought in and out of the stockyard at the workshop dozens or hundreds of times a day. In addition, blocks that have been completed or queued are temporarily stored in outdoor stockyards, and can be moved to an alternative workshop where the same work is possible as would be performed in the planned workshop [2]. As such, the block is moved and passes through a process that may be different from what was previously planned, for various reasons. In order to proceed with the block processing step, which requires a lot of time, it is necessary to systematically manage the block and secure information on the workshop where the block is located. Most shipyards identify block locations through dual tasks in which workers record block operation information in the field and enter it into the PC system [3]. As such, in the case of a system in which a worker manually inputs block location information, incorrect information may be entered due to problems with the input device or errors in judgment or incorrect input by the worker. Incorrectly entered block location information causes problems in the next stage of the process, and eventually schedule planning is disrupted [4]. Therefore, it is necessary to introduce a system that can automatically input block information without relying on the manual work of workers.
The block location information is composed of block coordinates and block numbers. In order to track the block location information, both block coordinates and block numbers must be entered accurately into the system. Even if the block coordinates are correct in the secured block location information, if there is an error in the block number, the location of the required block cannot be tracked. There has been considerable research on how best to track the location of blocks in the shipyard. However, most studies focus on tracking block coordinates, and research on block number identification is lacking. Accurately identifying the block number is as important as accurately acquiring the block coordinates. Therefore, it is necessary to develop a block identification system that does not require manual work by a worker to compensate for problems that may occur when inputting a block number into a block location information system due to a worker’s error in judgment or incorrect input.
This study proposes a method to identify a block number when developing a system that can obtain block location information from block images. The block number identification method using block images proposed in this study uses CNN of deep learning, which shows good performance in image recognition. In general, training data used to train a CNN model consist of images of objects in the real environment. However, since hull blocks are produced at the shipyard at the same time as they are designed, it is difficult to secure images of actual hull blocks and use them as training data. Therefore, since the shipyard uses a 3D CAD system for ship design, a method of identifying blocks by applying it to training CNN models is proposed.
A method of constructing a training dataset by converting 3D CAD data to voxels was considered, but there were problems. When converting hull blocks with complex internal structures into voxels, increasing the size of elements to reduce the amount of computation simplified the shape of hull blocks, but lost their features. Conversely, if the size of elements was reduced to a level that can express the features of hull block, the amount of computation increased exponentially.
Liu et al. compared the performance of each CNN model trained with voxel training data and multi-view image set training data. As a result of comparison, the multi-view image set training data performed better than or was similar to the training data consisting of voxels [5]. Therefore, this paper uses a set of multi-view images acquired with hull block 3D CAD data as CNN model training data. Constructing a training dataset with multi-view images obtained from hull block 3D CAD data preserves the features of the internal lattice structure of the hull block.
In this paper, a multi-view image set was constructed with the 3D CAD data of the hull block and used as training data. The testing dataset for calculating the prediction accuracy for classification performance of trained CNN model was obtained as a 3D printer-printed hull block model of hull block 3D CAD data. This paper proposes a method that shows good performance by calculating classification performance of trained CNN models by constructing a testing dataset with images of printed hull block models. This suggests a block identification method that can be applied to the development of a system that automatically inputs a block number after recognizing a hull block stocked on the stockyard.

2. Related Work

2.1. Tracking Location of Ship Blocks

There has been much recent research on tracking the location of blocks in the stockyard. Shin et al. proposed a system capable of real-time transmission by manually inputting block information at the current location using a PDA that can receive current location information from GPS [4]. Lee et al. applied this concept to a system that can track blocks in real time by updating location information and block information on an electronic map provided by the company using high-precision, low-cost GPS/INS suitable for the transporter’s operation characteristics [6]. Kim et al. developed an RFID tag that measures the location and size of a block [7]. Block measurement data may be input from the RFID tag and queried. In order to solve the problem of work being carried out through workers’ judgment, Park et al. determined the up and down state of the block when the block is transported to the transporter and tracked the location in real time [8]. Kang developed a system that allows workers to directly input block coordinates and production performance into mobile devices carried at work sites and transmit them via wireless communication [9]. Mun devised a location information collection device that is resistant to environments where wireless signals are distorted due to various large buildings and steel structures in shipyards [10]. Chon et al. conducted a study comparing the performance of CNN models that classify hull blocks using multi-view image sets [11]. If the dataset, consisting of acquired hull block images, is lacking, the prediction accuracy is compared and analyzed according to the training methods of VGGNet, GoogLeNet, ResNet, DenseNet, and NASNet models.
As such, it can be seen that most of the studies on block information input are studies to reduce errors in block coordinates. Each technology has advantages and disadvantages, which are summarized in Table 1. Therefore, more research is needed on block identification methods to reduce errors that may occur when a worker manually enters a block number. In addition, despite the conditions in which design and production are carried out simultaneously at the shipyard, no research has yet been conducted to analyze the actual block prediction performance using hull block 3D CAD data. Therefore, considering the conditions of the shipyard production environment, block identification research using 3D CAD data should be conducted.

2.2. Object Identification Using 3D CAD Data

Object identification studies using 3D CAD data are mostly transformed into voxels and composed of training data. When changing 3D CAD data to voxels, the size of the elements is inversely proportional to the quality of the training data and is proportional to the required learning time and computation amount. Therefore, research on object identification of CNN using voxels is drawing attention to methods that can have good prediction performance while reducing the amount of computation. Gernot et al. presented a 3D CNN model OctNet using high-resolution 3D voxel data [12]. The maximum resolution that OctNet can compute is 256 3 ( p x ) . Zhijian et al. proposed a method to reduce memory usage when CNN identifies 3D objects consisting of point clouds [13]. The proposed PVCNN model showed improved computation speed compared to the other model for a 8 × 2048-sized point cloud 3D object. However, hull block 3D CAD data are too big and complex to convert into voxel data. As the size of the element increases and the amount of computation decreases, the features of the block disappear. Therefore, it is not appropriate to convert 3D CAD data into voxels and use them. On the other hand, Chon et al. did not transform 3D CAD data into voxels to construct training data for a CNN model, but acquired multi-view 2D images and used them as training data [14].
As a result of the experiment training the CNN model with training data consisting of multi-view 2D images, it was confirmed that the prediction performance was similar to or better than the experimental results obtained by transforming data into voxels.
The hull block model, which is the object of identification in this study, has a very complex internal lattice structure. If the hull block 3D CAD data are transformed into voxels, they will lose their internal lattice structure features. In the study of Chon et al., it was confirmed that when 3D CAD data were used for CNN model training, good performance was obtained even when the training data were composed of multi-view images [5]. This study trained the CNN model by configuring multi-view images acquired with hull block 3D CAD data as training data.
This paper is structured as follows: Section 3 discusses the CNN model and transfer learning used in this study. Section 4 explains how to construct a training dataset with hull blocks from 3D CAD data and a testing dataset with 3D printer-printed hull blocks from 3D CAD data. Figure 1a is a diagram of Non-Thr experimental environment in Section 4.1. Figure 1b is the diagram of Thr experimental environment in Section 4.2. The diagram simply shows the experiment process according to the type of dataset. Section 4.3 predicts and analyzes the classification performance of each trained CNN model. Section 5 discusses the research conclusions.

3. Convolutional Neural Network

3.1. CNN Model

In order to conduct a study on block number identification using CNN, the CNN model that shows the best classification performance should be selected and applied. This study used the VGG-19 CNN model of VGGNet [15], the Resnet152V2 CNN model of ResNet [16], and the Densenet-201 CNN model of DenseNet [17], all of which showed good performance when identifying hull blocks by CNN in Chon’s study [13].
Table 2 summarizes the hyperparameters used to adjust the variables of CNN models. The batch size is set differently to avoid memory out errors, 64 for VGG19, 32 for Resnet152V2, and 16 for Densenet201.

3.2. Transfer Learning

The training dataset used in this study consists of a total of 1080 images, each with 360 images per hull block. The size of the training dataset is not large enough to show good performance. However, in the study of Chon [6], even when the CNN model for identifying hull blocks did not secure a training dataset of sufficient size, applying transfer learning showed good training performance with a small dataset. For the above reasons, ImageNet’s pre-training weights were used for the CNN model. This work applies fine-tuned transfer learning [18] to freeze the weights of the five input layers of the CNN model, and then uses the parameters of the CNN model pre-trained with ImageNet weights [19].

3.3. Customized CNN Model

The last FC (fully connected) layer of each CNN model was replaced by GAP (global average pooling) for use with Grad-CAM (gradient-weighted class activation mapping) [20,21]. When classifying a class, FC Layer serializes 3D feature maps, so class position information is lost, whereas GAP calculates the average for each channel, so class position information is not lost. In addition, using GAP can reduce the amount of computation and prevent overfitting problems [22,23].
In this paper, dropout was applied at a rate of 0.4 after the GAP of the CNN model. By applying dropout, the feature of the hull block image can be obtained more clearly, by avoiding the co-adaptation of the weights, and through the regularization effect, which can prevent overfitting [24].

4. Experimental Results

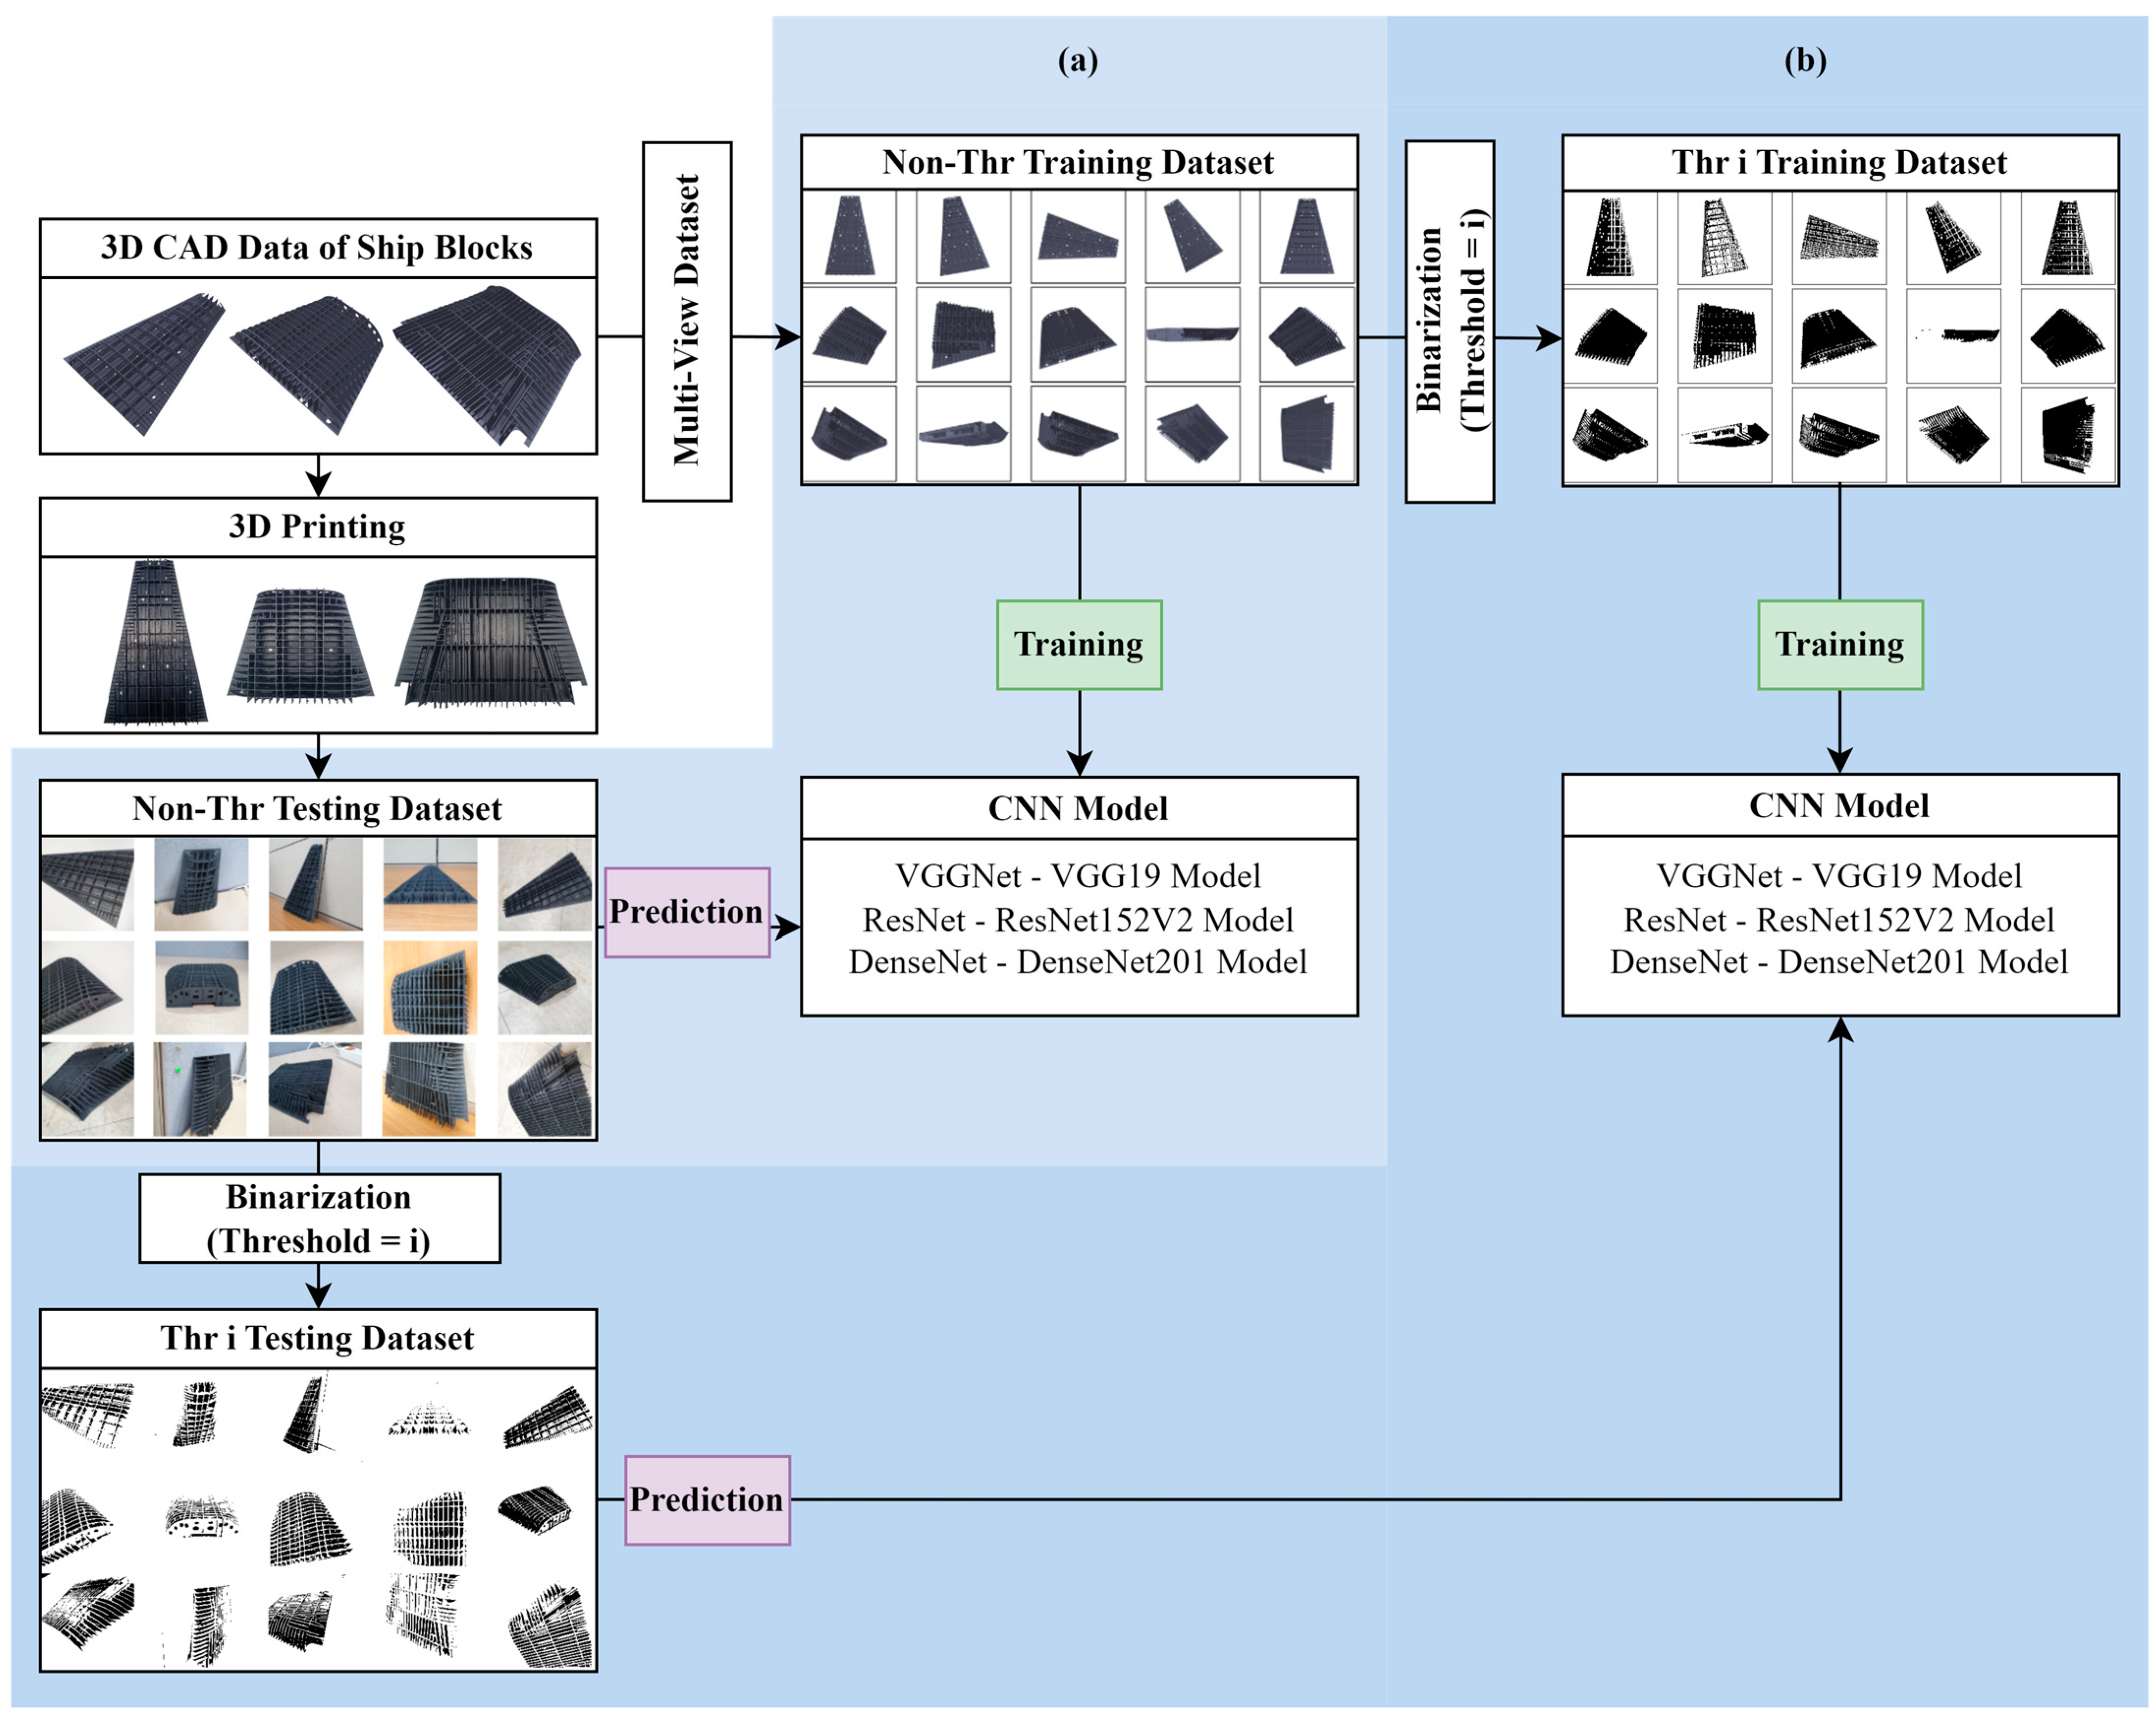
4.1. Configuring the Non-Thr Datasets

4.1.1. Non-Thr Training Datasets

We used 3D CAD data based on the actual hull block design, composed of the training dataset of the CNN model, to identify the hull blocks in the stockyard of the shipyard. Block classes to be classified included B1, B2, and B3, as shown in Figure 2a. The Non-Thr training dataset was composed of 3D CAD data. Each block has a similar shape but has a different length and width ratio and different characteristics of the internal lattice structure. The image of each block was rotated 10 degrees from 0 to 350 on the Z axis, and the X axis was rotated 10 degrees from 0 to 90 to obtain 360 images of a size of 500 × 300. The obtained image was resized to 224 × 224 to form a training dataset for the CNN model. One image was rotated by 30°, 60°, and 90° and increased to six images through vertical and horizontal reversal. In this way, a total of 6480 images consisting of 2160 images for each class were assigned to the Non-Thr training dataset. ‘Non-Thr’ means that there is no pre-processing except resizing.

4.1.2. Non-Thr Testing Datasets

The Non-Thr testing dataset to be used when evaluating the prediction accuracy after training the CNN model was constructed using a 3D printer-printed hull block model of hull block 3D CAD data (Figure 2b).

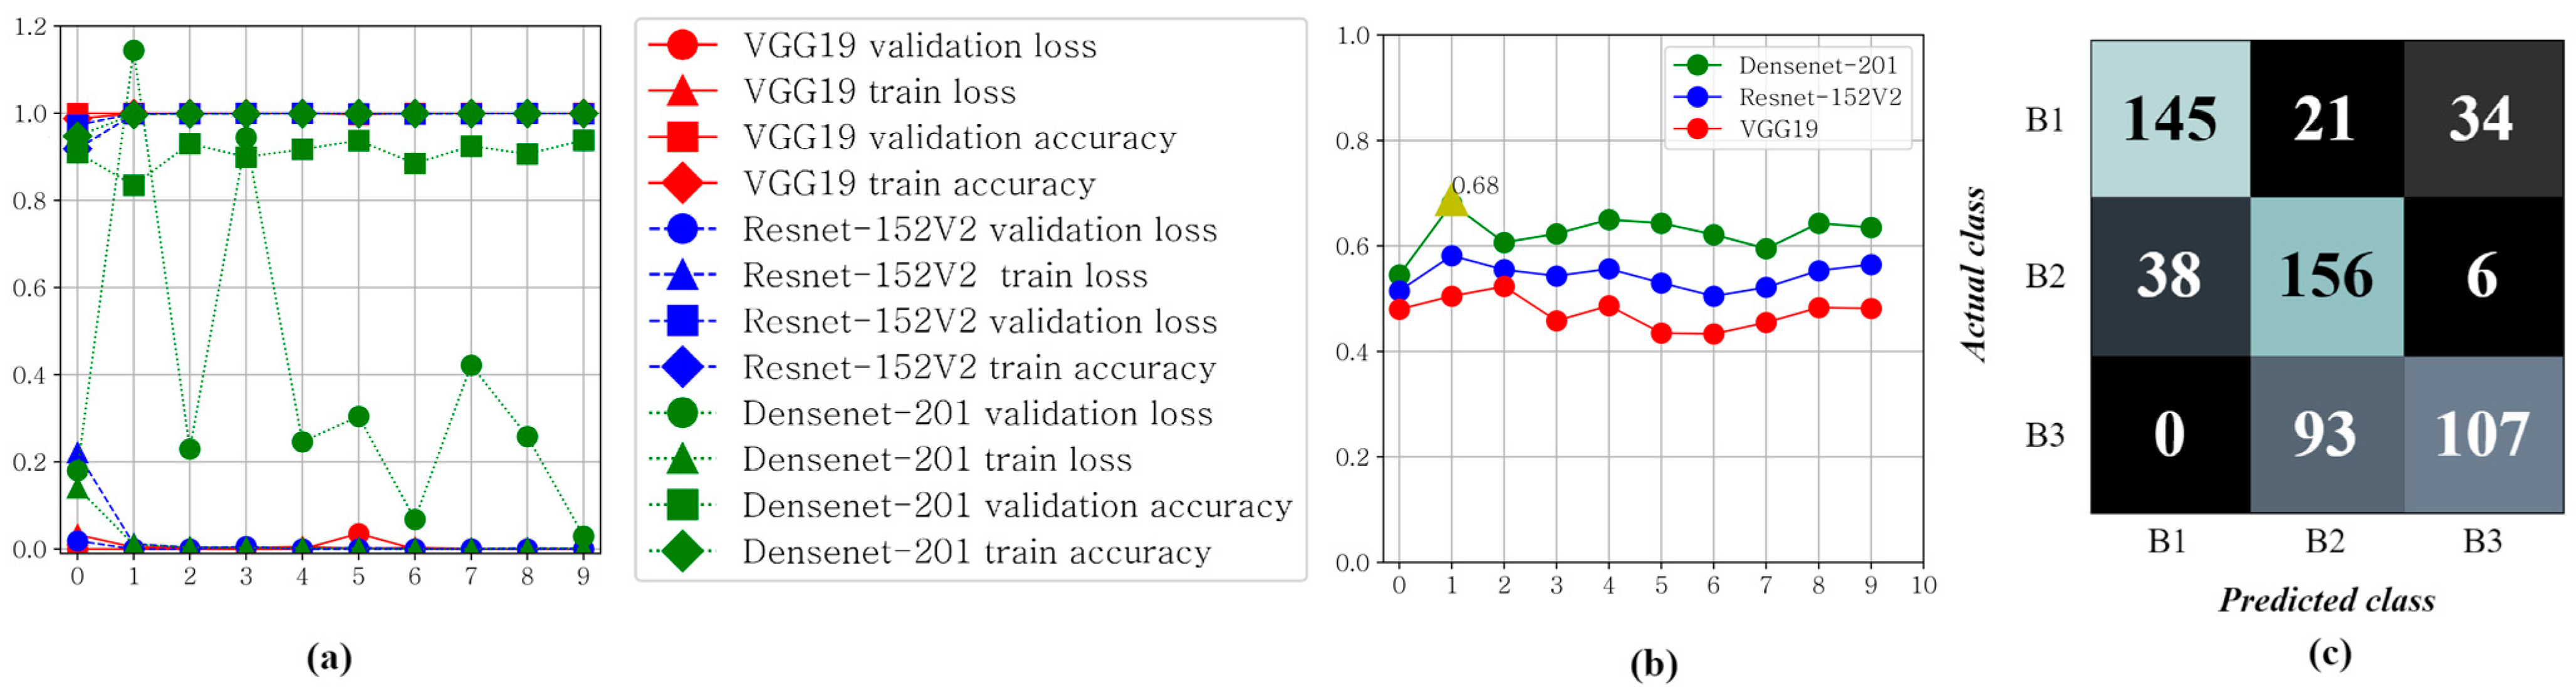
4.1.3. Experimantal Result of Non-Thr Datasets

After training the VGG-19 CNN model, the Resnet-152V2 CNN model, and the Densenet-201 CNN model as a Non-Thr training dataset, an experimental environment was configured to evaluate the prediction accuracy of the Non-Thr testing dataset. When the Non-Thr training dataset is used for training the CNN model, 80% is allocated to training and 20% to validation. The dataset used the Leave-ont-out method when training the CNN models.
This is because the dataset was not large enough to use K-Fold cross-validation. Thus, the dataset was divided into five sets, so that each set was assigned to the test once to be trained. It was confirmed that training was well conducted through the training history in Figure 3a. Figure 3a shows the training accuracy, validation accuracy, training loss, and validation loss when training is conducted using a Non-Thr training dataset in three CNN models. Figure 3b is a prediction accuracy graph using the Non-Thr testing dataset in three trained CNN models. Non-Thr Densenet-201 2 has the highest prediction accuracy at 0.68. In the VGG19 model, Non-Thr VGG19 3 has the highest prediction accuracy at 0.5233. In the Resnet152V2 model, Non-Thr Resnet152V2 2 has the highest prediction accuracy at 0.5817. Figure 3c is the Non-Thr Densenet-201 2′s confusion matrix. The number of epochs for the CNN model to continuously train the Non-Thr training dataset was set to 10.
The accuracy evaluated using the Non-Thr testing dataset for each of the 30 experimental environments is shown in the prediction accuracy graph in Figure 3b, and the highest prediction accuracy is marked with a yellow triangle. The name of the configured experimental environment is assigned as Non-Thr CNN model n (n is epoch). According to the experimental results, it was confirmed that the prediction accuracy was the highest at 0.68 in the second epoch of the Non-Thr Densenet-201. When evaluating each trained CNN model after training, it was found that the highest prediction accuracy appeared in the second and third epoch. The reason why the prediction accuracy does not improve as the number of epoch increases is because the parameters of the trained CNN models are set to initial weights that can show good performance by applying transfer learning. Therefore, as the number of epochs increases, the number of times that the initial weights of the trained CNN model parameters set by transfer learning are updated also increases, and the prediction accuracy decreases. Therefore, in the experimental results, the prediction accuracy decreases as the number of epochs of the trained CNN model exceeds three.
The highest prediction accuracy in the Non-Thr Densenet-201 CNN 2, which showed the best performance among experiments using Non-Thr datasets, was 0.68. Grad-CAM and Guided Grad-CAM were used to find the cause of low prediction accuracy and increase prediction accuracy. Grad-CAM and Guided Grad CAM are algorithms that can visually show what areas the trained CNN model focuses on when identifying images. The more focused the area, the redder it is, and the less focused the area, the bluer it is. Guided Grad-CAM shows the heat map of Grad-CAM more clearly with the outline. Figure 4 is the result of analyzing the image using Grad-CAM. In Figure 4a, as a result of identifying the images of the B1 andB3 classes as actual classes, in the heatmap of Grad-CAM, it was confirmed that red was concentrated in the block area. As a result of Guided Grad-CAM, it was confirmed that the trained CNN model focused on the overall shape of the block when identifying the image. The actual class and the predicted class were different, even though the focused area in Grad-CAM and Guided Grad-CAM in Figure 4a was the overall shape of the block. This was analyzed as a problem that occurs because the similarity between the image obtained as 3D CAD data of hull block and the image obtained as a 3D printer-printed hull block model of 3D CAD data is lower than the level at which the trained CNN model can have good classification performance. As a result of predicting the image with the actual class B1 of Figure 4b, it can be seen in the heatmap of the Grad-CAM that red is focused in the background, not the block area. Furthermore, the Guided Grad-CAM results show that the focusing area, when the trained CNN model identifies the image, represents the background contour. This shows that when identifying the image, the trained CNN model focused on the background and did not focus on the block area, thus confirming that the background of the image affects the prediction accuracy.
In the experimental environment consisting of the Non-Thr dataset, it was confirmed that the highest prediction accuracy of the Non-Thr Densenet-201 2 was 0.68. However, a prediction accuracy of 0.68 is not sufficient to determine that block identification is possible. As a result of analyzing the cause of low prediction accuracy with Grad-CAM and Guided Grad-CAM, it was confirmed that the similarity between each training image and the testing image was low, and the noise in the background area affected the prediction accuracy. Therefore, in this study, we concluded that it was necessary to pre-process the images, to solve the problem of low prediction accuracy. The image pre-processing method requires the construction of a new dataset by applying binarization to the Non-Thr dataset.

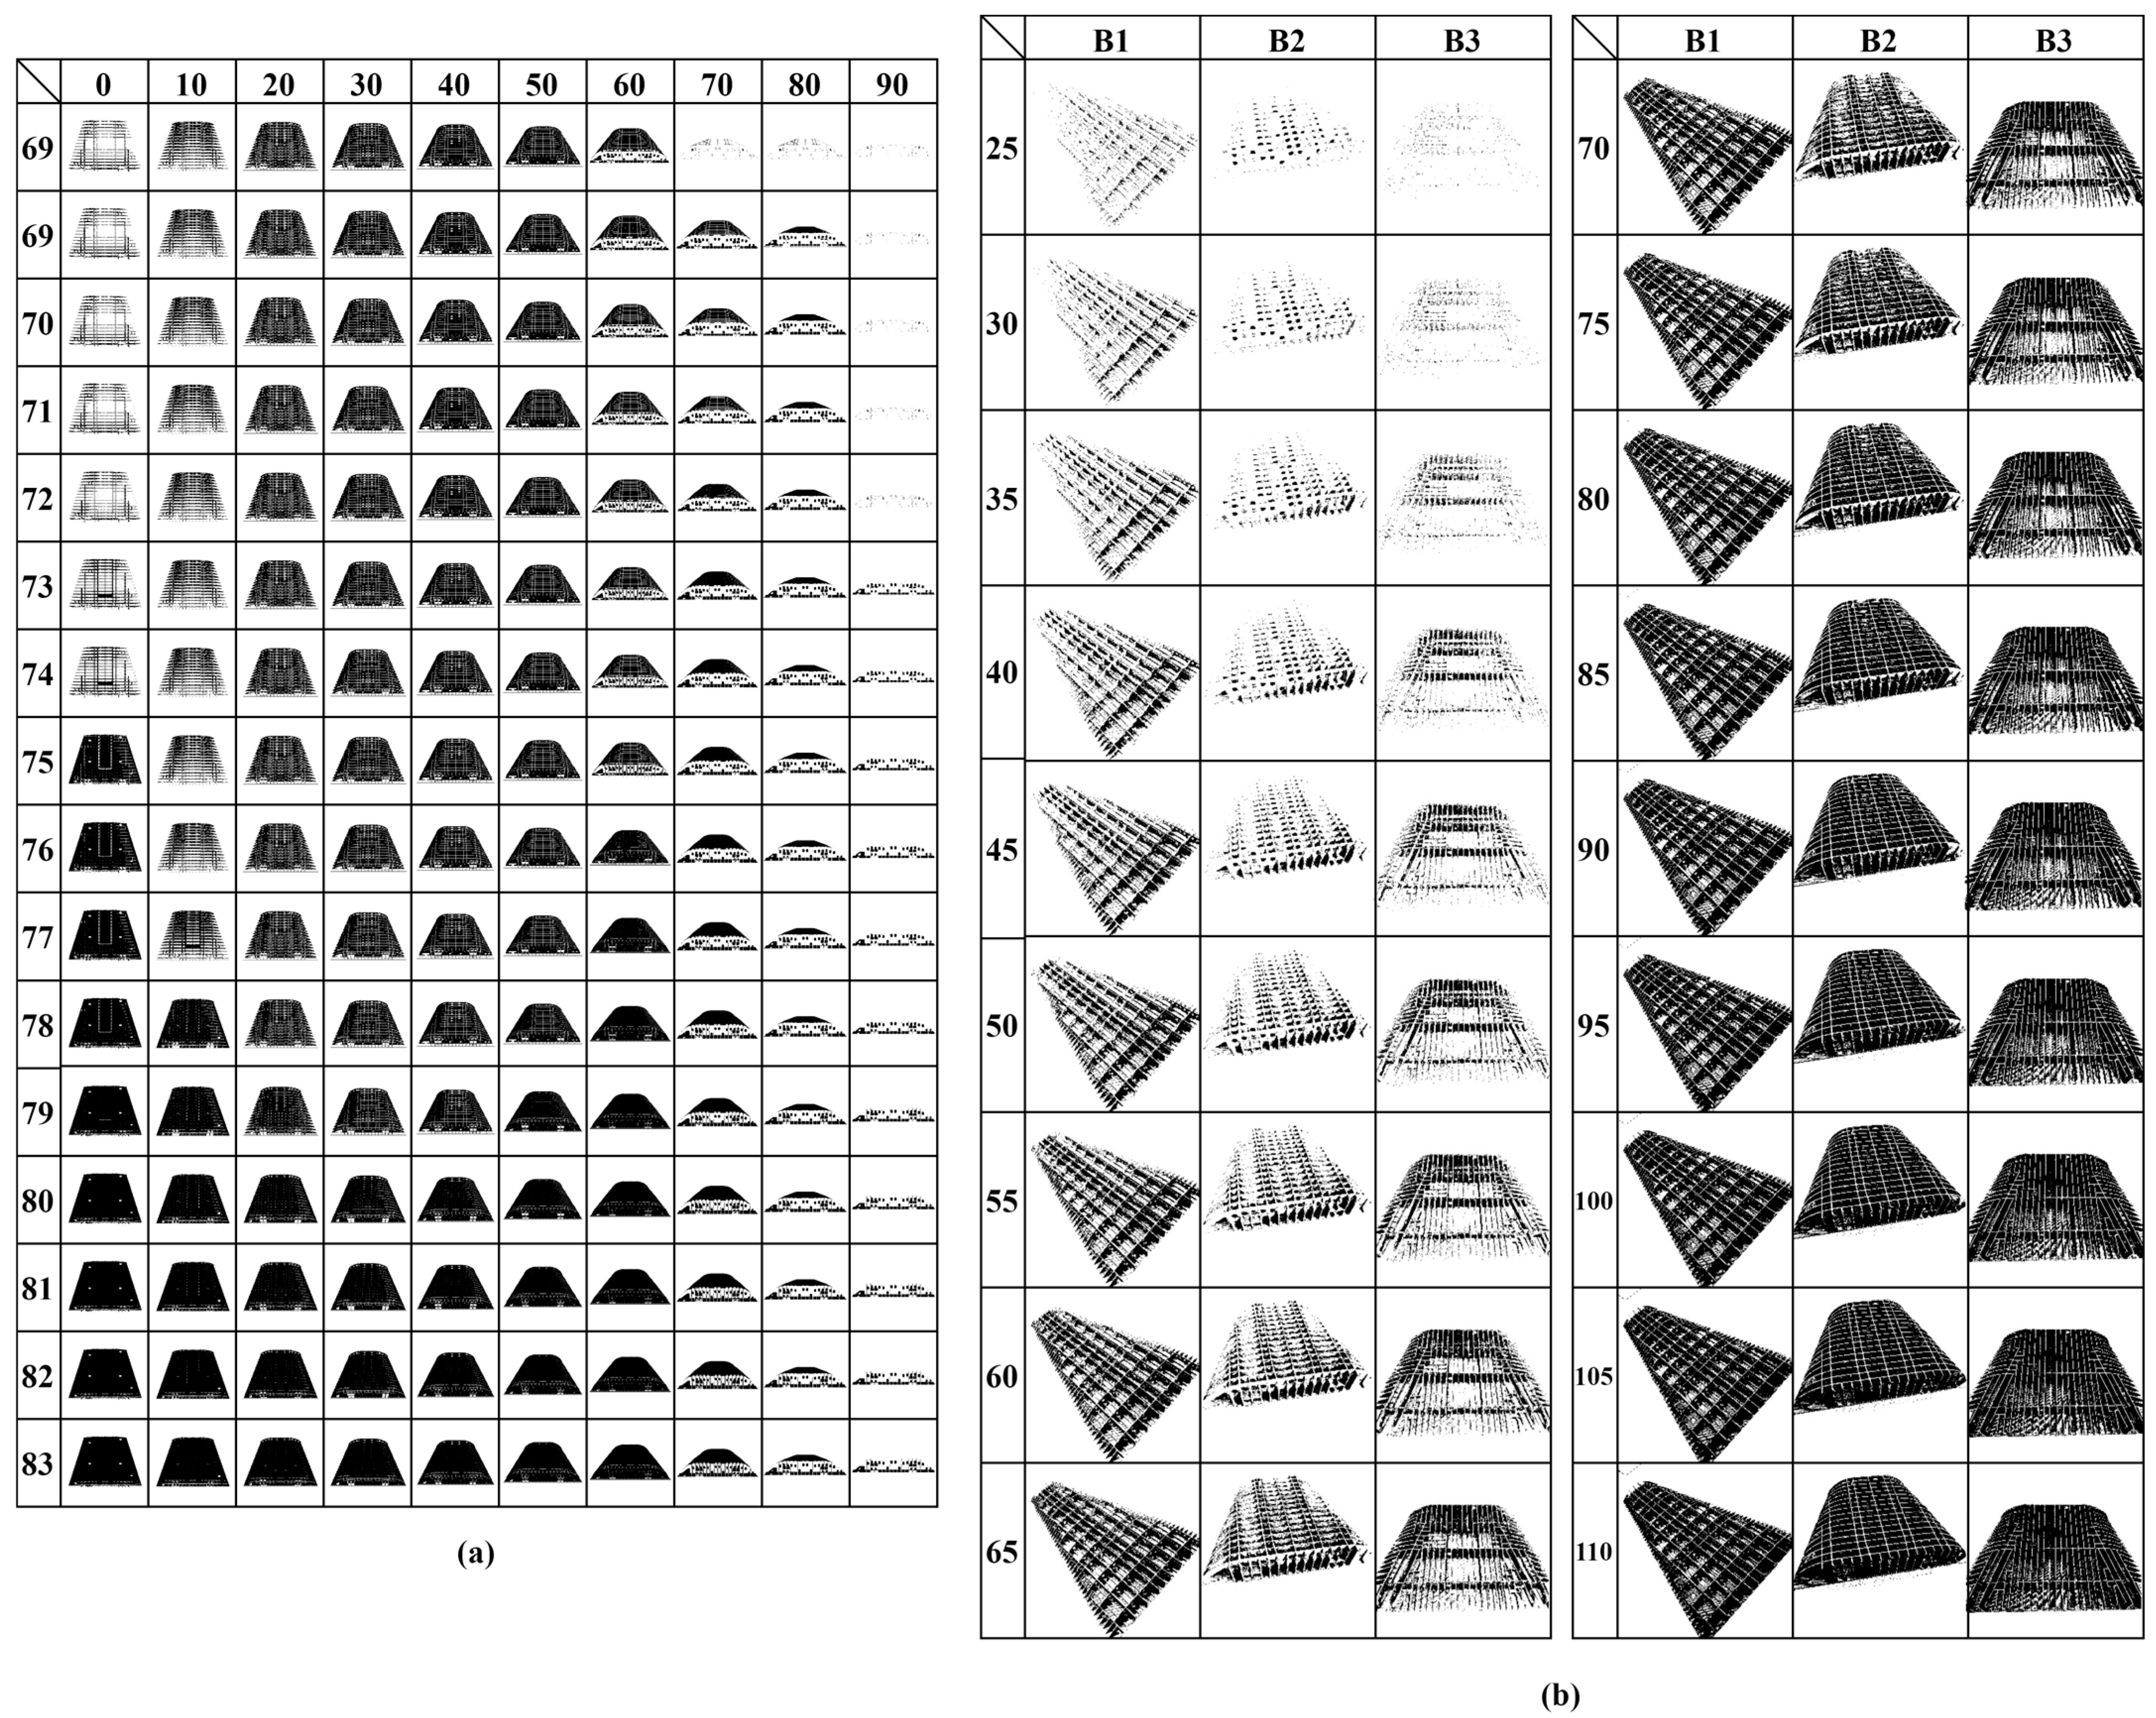
4.2. Configuring the Thr Datasets

4.2.1. Thr Training Datasets

In Section 4.1, the problem was that the highest accuracy among the experimental environments composed of Non-Thr datasets was only 0.68. One reason for this problem is that the features of each block class are not clearly predicted due to low similarity between the training image and testing image, another reason is that the background noise affects the prediction accuracy. To solve this problem, we decided to perform image pre-processing on the Non-Thr dataset, in consideration of the CNN model’s characteristics, which are highly influenced by the training data.
Image pre-processing should be able to remove the background area and increase the similarity between training images obtained as 3D CAD data and testing images obtained as block models. To this end, binarization was applied to the Non-Thr training dataset and the Non-Thr testing dataset.
Binarization was applied to the image according to the threshold value (= i), as shown in Figure 5, and the result was different. Therefore, the prediction accuracy of the binarized Non-Thr dataset to which different threshold values were applied was identified, and an appropriate threshold was selected.
In order to select the optimal threshold for binarization from the Non-Thr dataset, several sets of binarization training images and binarization testing images with different thresholds were generated. The threshold when applying binarization to the images of Non-Thr training dataset was assigned as ‘Thr i training datasets’ when the threshold was i.
Figure 5a is the B2 block training image according to the threshold and angle. In the set of binarization training images to which binarization is applied, there are differences in the aspect of the image that change according to the threshold. The lower the threshold, the more distinct the lattice structure features of the block, but the overall shape is blurred. The higher the threshold, the clearer the overall shape of the block, but the characteristics of the lattice structure are blurred. The training image set was composed of a total of 15 binarized training image sets, increasing the threshold of binarization by 1 from 69 to 83. As such, 15 sets of Thr training datasets with different features depending on the binary threshold were expected to act as a factor to change block classification performance when used for training CNN models. Training of the CNN model proceeded in the same way as the training with Non-Thr training datasets, described in Section 4.1.
The threshold when applying binarization to the images of the Non-Thr testing dataset was assigned as ‘Thr i testing datasets’ when the threshold was i. Figure 5b shows the testing image according to the threshold. When the threshold is lowered, background noise is removed, but the part of the lattice structure with high brightness is also erased. Conversely, as the threshold increases, the overall shape is clearly visible, but the background noise is also evident. The testing image set was composed of a total of 18 binarized testing image sets, increasing the threshold of binarization by 5 from 25 to 110.
Combinations of 15 sets of Thr training datasets and 18 sets of Thr testing datasets are composed of different elements in the experiment. In this paper, the name of the configured experimental environment is expressed as ‘Thr i j CNN model n (training threshold i, prediction threshold j, epoch n)’. (ex. ‘Thr 72 50 Resnet152V2 2’ means the experimental environment predicted with a set of the Thr 50 testing dataset for the parameter of the second epoch of training of Resnet-152V2 CNN model with Thr 72 training dataset)

4.2.2. Experimental Results with Thr Datasets

When training using 15 sets of the Thr training dataset of VGG-19, Resnet-152V2, and Densenet-201 CNN models, a total of 15 parameters were stored for each epoch. Since epoch was 5 and the number of CNN models was 3, a total of 225 parameters were stored. For 225 parameters, the accuracy was evaluated for a total of 4050 cases in combination with 18 sets of the Thr testing dataset, and the performance of the experimental environment.
When using the Thr dataset, high accuracy was confirmed at a specific threshold. Among the 4050 cases of the experimental environment composed of the Thr dataset, the top 10 based on the evaluated prediction accuracy are listed in Table 3. High prediction accuracy was obtained for each model, with Thr 75 60 VGG-19 2 at 0.9583, Thr 72 50 Resnet-152V2 2 at 0.9617, and Thr 72 75 Densenet-201 2 at 0.955. Among them, Thr 72 50 Resnet152V2 2 had the highest prediction accuracy.
Table 4 (left) shows the average of the prediction accuracies evaluated from each Thr training dataset in the trained Resnet152V2 model. It may be seen that the prediction accuracy changes according to the change in the threshold of the Thr testing dataset. When the threshold of the Thr training dataset is 69, the average prediction accuracy is the lowest, at 0.7169. On the other hand, when the threshold of the Thr training dataset is 79, the average prediction accuracy is the highest, at 0.8730. In addition, it can be seen that the average prediction accuracy decreases when the threshold of the Thr training dataset is 80 or more. Therefore, through the tendency of average prediction accuracy, it can be seen that setting the threshold value of the Thr training dataset between 70 and 79 results in good classification performance.
Table 4 (right) shows the average prediction accuracy according to the threshold of the Thr testing dataset in trained Resnet152V2 model. As may be seen, the prediction accuracy depends on the change in the threshold of the Thr testing dataset. When the threshold of the Thr testing dataset was 55, the average prediction accuracy was the highest at 0.8459. On the other hand, it was confirmed that the average prediction accuracy was lower when the threshold of the Thr testing dataset was 60 or higher. Therefore, it can be seen that setting the threshold of the Thr testing dataset to a value close to 55 results in good classification performance.

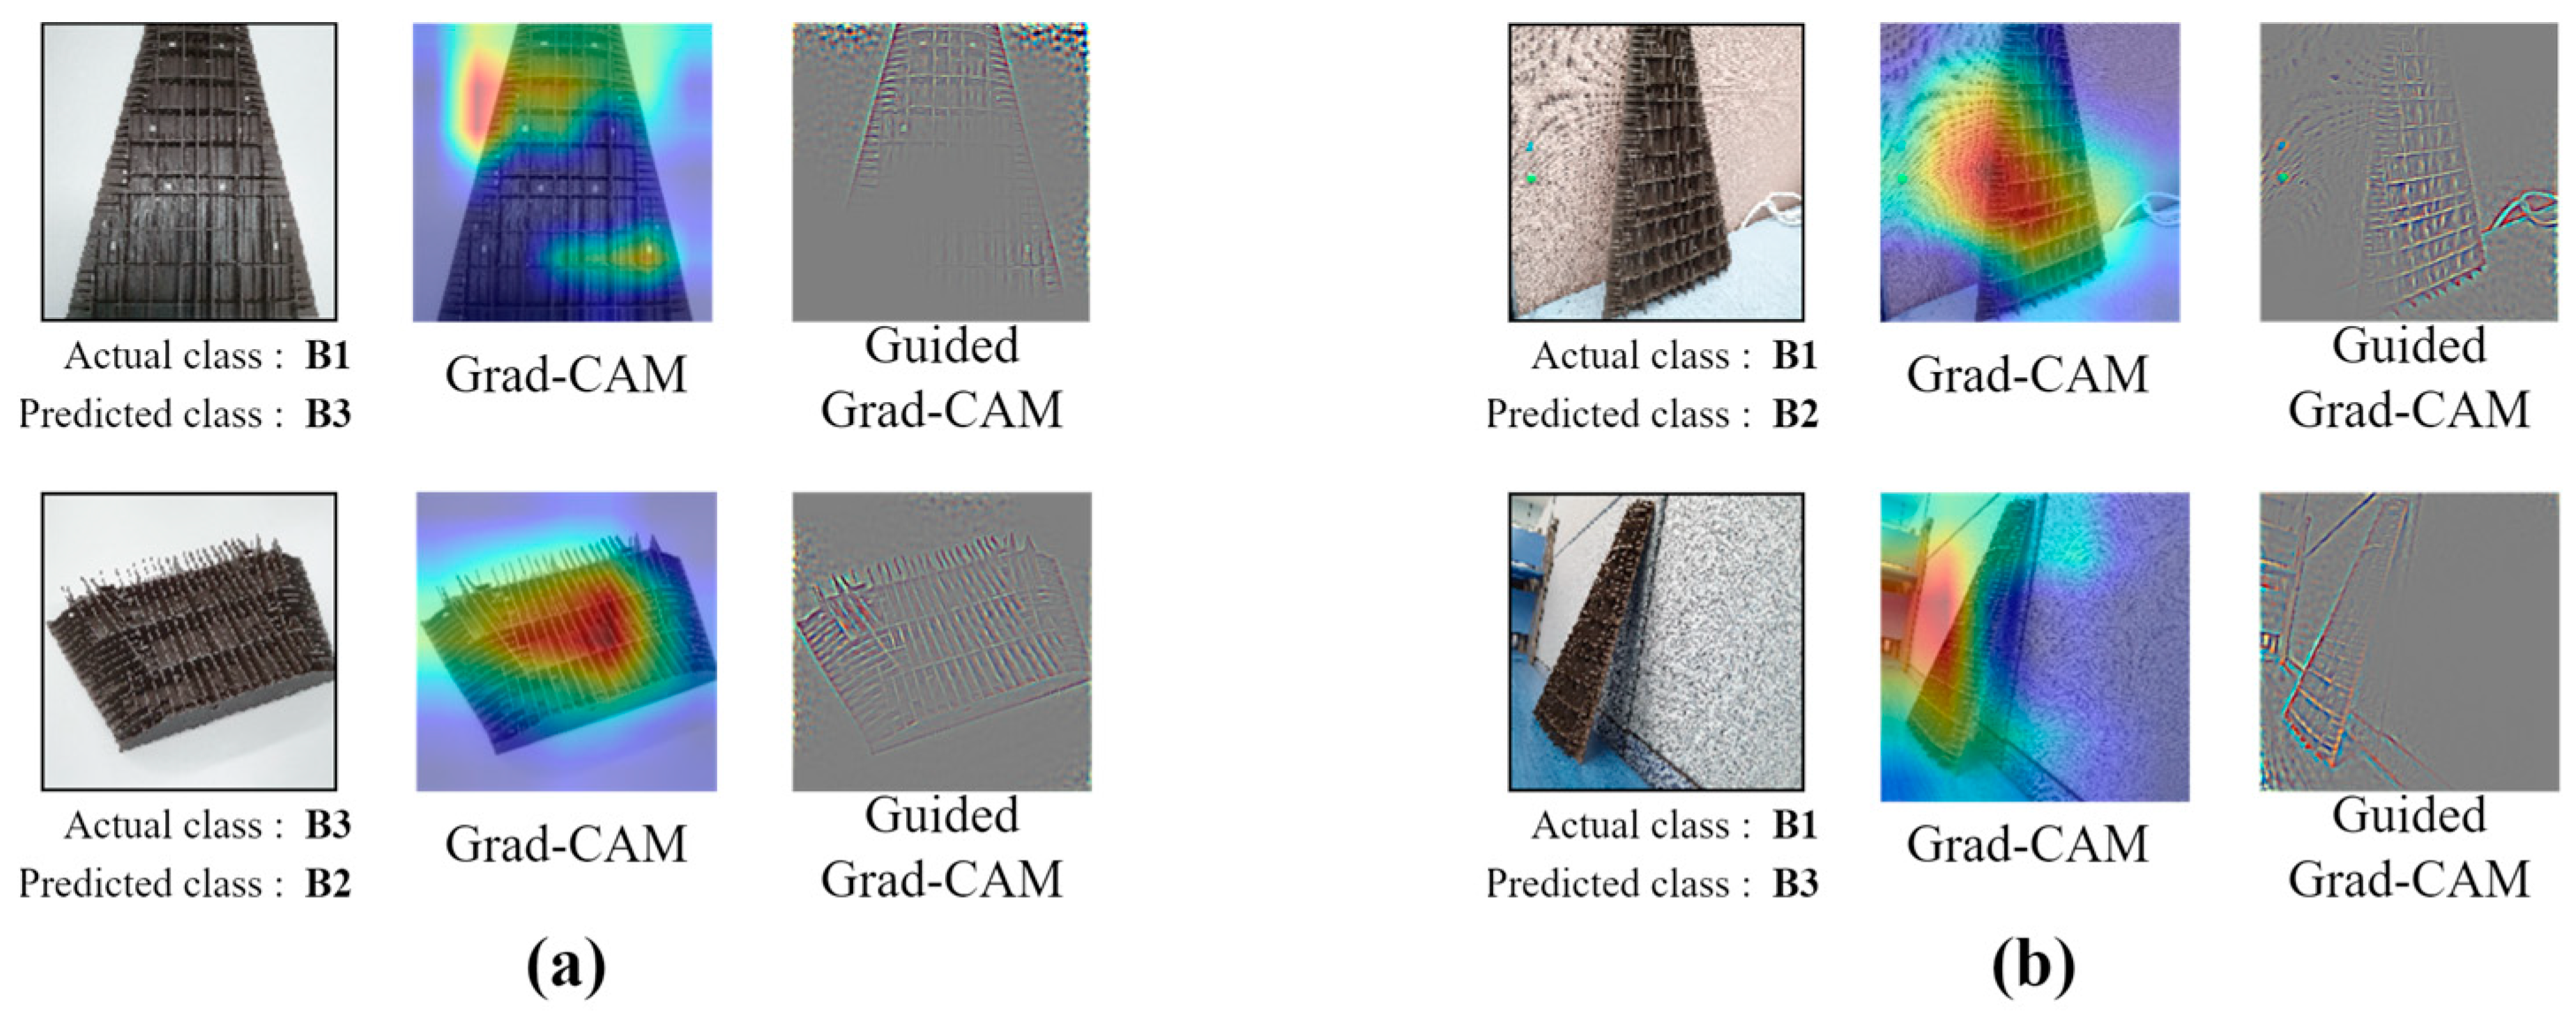
4.3. Analysis of Classification Performance between Non-Thr and Thr

The highest prediction accuracy was 0.68 in the experimental environment composed of the Non-Thr dataset in Section 4.1. However, this did not deliver a good classification performance on block recognition. The reason for the low prediction accuracy was that the trained CNN model focused on the background area when predicting images. In addition, the similarity between training images and testing images was low, so the trained CNN model could not focus on the discriminatory features of the block when predicting images. Thus, in Section 4.2, binarization was applied to the Non-Thr training dataset and the Non-Thr testing dataset to address the causes of the low prediction accuracy.
In Non-Thr Densenet-201 2 and Thr 72 50 Resnet152V2 2, the prediction performance was improved by the application of binarization, as analyzed with Grad-CAM. Before applying the binarization, the trained CNN model focused on non-block areas (Figure 6a) when predicting images, but after applying the binarization, it was able to focus on the block areas (Figure 6b). In addition, in Figure 6a, the area that the trained CNN model concentrated on when predicting an image was dispersed due to the noise existing in the background, but after applying binarization, the noise disappeared and the model was able to focus on the block area, as shown in Figure 6b. Therefore, the background noise was removed by applying binarization to the Non-Thr testing dataset, and the effect of the background on the prediction accuracy was minimized. In addition, the area on which the trained CNN model focuses when predicting an image could be selected as the internal lattice structure of the block. Therefore, this is a factor that improves the prediction accuracy of the trained CNN model.
Figure 6c is the confusion matrix of Thr 72 50 Resnet152V2 2. It was confirmed that the prediction accuracy improved by 0.2817 when applying binarization. Accuracy increased by 0.22 for each B1 class, 0.22 for the B2 class, and 0.405 for the B3 class better than the Non-Thr Densenet-201 2.

5. Conclusions

In this paper, a block identification method that can be applied to the development of a system that identifies hull blocks and automatically inputs block numbers was proposed. The shipyard uses a 3D CAD system for ship design; therefore, a method of identifying blocks by applying this system to training CNN models was proposed. The testing dataset consisted of images obtained from the 3D printer-printed hull block model of hull block 3D CAD data. As a result, it was confirmed that the prediction accuracy of the second epoch of the Densenet-201 CNN model was 0.68. The low prediction accuracy was due to the low similarity between training and testing dataset images and the effect of background noise. To address this, binarization was applied to the set of images to improve prediction accuracy. The classification results showed that the prediction accuracy was the highest at 0.9617 in the experimental environment, which was trained on the Resnet-152V2 CNN model with a Thr 72 training dataset and predicted with a Thr 50 testing dataset. These results showed good block classification performance in the domain identifying hull blocks. The results of this experiment cannot be generalized to all cases. However, good performance is expected when binarization is applied to train a CNN model by constructing a training dataset using 3D CAD data of hull blocks with many straight lines and grids.

Author Contributions

Conceptualization: H.C. and J.N.; methodology, analysis: H.C. and J.N.; software, investigation: H.C.; data curation, validation and visualization: H.C.; writing-original draft preparation: H.C.; writing—review and editing: J.N. and D.O.; project administration: J.N. All authors have read and agreed to the published version of the manuscript.

Funding

This work was partly supported by Korea Institute of Energy Technology Evaluation and Planning(KETEP) grant funded by the Korea govermment(MOTIE) (20213030020120, Development of product quality and O&M technology to improve all-steps reliability of offshore wind turbine blades) and partly supported by the Korea Institute of Energy Technology Evaluation and Planning (KETEP) grant funded by the Korea government(MOTIE) (20224000000220, Jeonbuk Regional Energy Cluster Training of human resources).

Institutional Review Board Statement

Not applicable.

Informed Consent Statement

Not applicable.

Data Availability Statement

Not applicable.

Conflicts of Interest

The authors declare no conflict of interest.

References

  1. Kim, M.S.; Cha, J.H.; Cho, D.Y. Determination of arrangement and take-out path in ship block stockyard considering available space and obstructive block. Soc. Comput. Des. Eng. 2013, 1, 433–438. [Google Scholar]
  2. Nam, B.W.; Lee, K.H.; Lee, J.J.; Mun, S.H. A Study on Selection of Block Stockyard Applying Decision Tree Learning Algorithm. J. Soc. Nav. Archit. Korea 2017, 54, 421–429. [Google Scholar] [CrossRef]
  3. Cho, D.Y.; Song, H.C.; Cha, J.H. Block and logistics simulation. Bull. Soc. Nav. Archit. Korea 2011, 48, 24–29. [Google Scholar]
  4. Shin, J.G.; Lee, J.H. Prototype of block tracing system for pre-erection area using PDA and GPS. J. Soc. Nav. Archit. Korea 2006, 43, 87–95. [Google Scholar]
  5. Su, H.; Maji, S.; Kalogerakis, E.; Learned-Miller, E. Multi-view convolutional neural networks for 3d shape recognition. In Proceedings of the IEEE International Conference on Computer Vision (ICCV), Santiago, Chile, 7–13 December 2015; pp. 945–953. [Google Scholar]
  6. Lee, Y.H.; Lee, K.C.; Lee, K.J.; Son, Y.D. Study on the Positioning System for Logistics of Ship-block. Spec. Issue Soc. Nav. Archit. Korea 2008, 9, 68–75. [Google Scholar]
  7. Kim, J.O.; Baek, T.H.; Ha, S.J.; Lee, S.H.; Jeong, M.Y.; Min, S.K.; Kim, D.S.; Hwang, S.Y. Development of real time location measuring and logistics system for assembled block in shipbuilding. In Proceedings of the Industrial Engineering and Management Systems Conference, Pusan, Republic of Korea, 22–23 May 2009; pp. 834–839. [Google Scholar]
  8. Park, J.H.; Lee, K.H.; Jin, G.J.; Oh, M.K. Loading/unloading decision system of ship block in the shipyard. J. Inst. Electron. Eng. Korea CI 2010, 47, 40–46. [Google Scholar]
  9. Kang, J.H. A Study on Mobile Block Logistics System for Shipyard. Master’s Thesis, Mokpo National University, Mokpo, Republic of Korea, 2014. [Google Scholar]
  10. Mun, S.H. Real Time Block Locating System for Shipbuilding through GNSS and IMU Fusion. Ph.D. Thesis, Pusan National University, Busan, Republic of Korea, 2019. [Google Scholar]
  11. Chon, H.; Noh, J. Comparison Study of the Performance of CNN Models with Multi-view Image Set on the Classification of Ship Hull Blocks. J. Soc. Nav. Archit. Korea 2020, 57, 140–151. [Google Scholar] [CrossRef]
  12. Riegler, G.; Osman Ulusoy, A.; Geiger, A. Octnet: Learning deep 3d representations at high resolutions. In Proceedings of the IEEE Conference on Computer Vision and Pattern Recognition, Honolulu, HI, USA, 21–26 July 2017; pp. 3577–3586. [Google Scholar]
  13. Liu, Z.; Tang, H.; Lin, Y.; Han, S. Point-voxel cnn for efficient 3d deep learning. arXiv 2019, arXiv:1907.03739. [Google Scholar]
  14. Chon, H. Identification of Ship Hull Blocks using Convolutional Neural Network with Multi-View Image Set of 3D CAD Data. Master’s Thesis, Kunsan National University, Gunsan, Republic of Korea, 2020. [Google Scholar]
  15. Simonyan, K.; Zisserman, A. Very deep convolutional networks for large-scale image recognition. In Proceedings of the 3rd International Conference on Learning Representations, ICLR 2015-Conference Track Proceedings, San Diego, CA, USA, 7–9 May 2015. [Google Scholar]
  16. He, K.; Zhang, X.; Ren, S.; Sun, J. Deep residual learning for image recognition. In Proceedings of the IEEE Conference on Computer Vision and Pattern Recognition, Las Vegas, NV, USA, 27–30 June 2016; pp. 770–778. [Google Scholar]
  17. Huang, G.; Liu, Z.; Van Der Maaten, L.; Weinberger, K.Q. Densely connected convolutional networks. In Proceedings of the IEEE Conference on Computer Vision and Pattern Recognition, Honolulu, HI, USA, 21–26 July 2017; pp. 4700–4708. [Google Scholar]
  18. Ribani, R.; Marengoni, M. A survey of transfer learning for convolutional neural networks. In Proceedings of the 2019 32nd SIBGRAPI Conference on Graphics, Patterns and Images Tutorials (SIBGRAPI-T), Rio de Janeiro, Brazil, 28–31 October 2019; pp. 47–57. [Google Scholar]
  19. Krizhevsky, A.; Sutskever, I.; Hinton, G.E. ImageNet classification with deep convolutional neural networks. Adv. Neural Inf. Process. Syst. 2012, 25, 1097–1105. [Google Scholar] [CrossRef]
  20. Selvaraju, R.R.; Cogswell, M.; Das, A.; Vedantam, R.; Parikh, D.; Batra, D. Grad-cam: Visual explanations from deep networks via gradient-based localization. In Proceedings of the IEEE International Conference on Computer Vision, Venice, Italy, 22–29 October 2017; pp. 618–626. [Google Scholar]
  21. Le, N.; Moon, J.; Lowe, C.; Kim, H.; Choi, S. An Automated Framework Based on Deep Learning for Shark Recognition. J. Mar. Sci. Eng. 2022, 10, 942. [Google Scholar] [CrossRef]
  22. Zhou, B.; Khosla, A.; Lapedriza, A.; Oliva, A.; Torralba, A. Learning deep features for discriminative localization. In Proceedings of the IEEE Conference on Computer Vision and Pattern Recognition, Las Vegas, NV, USA, 27–30 June 2016; pp. 2921–2929. [Google Scholar]
  23. Lin, M.; Chen, Q.; Yan, S.-C. Network in network. arXiv preprint 2013, arXiv:1312.4400. [Google Scholar]
  24. Labach, A.; Salehinejad, H.; Valaee, S. Survey of dropout methods for deep neural networks. arXiv 2019, arXiv:1904.13310. [Google Scholar]
Figure 1. Process diagram for ‘Identification of Ship Hull Blocks using Convolutional Neural Network with Multi-View Image set of 3D CAD Data’: (a) Experimental environment of Non-Thr dataset; (b) Experimental environment of Thr dataset.
Jmse 11 00333 g001
Figure 2. Block images from Non-Thr dataset: (a) Block images from Non-Thr training dataset consisting of multi-view images of hull block 3D CAD data; (b) Block images of Non-Thr testing dataset consisting of 3D printed model images of hull block 3D CAD data.
Jmse 11 00333 g002
Figure 3. Training history and prediction results in Non-Thr dataset experimental environments: (a) Training history of Non-Thr dataset experimental envorinment; (b) Prediction accuracy of CNN models at each epoch; (c) Confusion matrix of Non-Thr Densenet-201 2.
Jmse 11 00333 g003
Figure 4. Grad-CAM and Guided Grad-CAM images for analyzing the causes of low prediction accuracy in an experimental environment using Non-Thr datasets: (a) Visualizing predicted result affected by similarity in the Non-Thr densenet-201 2 experimental envorinment; (b) Visualizing predicted result affected by background noise in the Non-Thr densenet-201 2 experimental environment.
Jmse 11 00333 g004
Figure 5. Thr training and testing dataset images: (a) B2 block training images by threshold. Axis X is an angle and axis Y is a threshold; (b) Testing images by threshold.
Jmse 11 00333 g005
Figure 6. Grad-CAM and Guided Grad-CAM images for analyzing the causes of increased accuracy between Non-Thr densenet-201 2 and Thr 72 50 Resnet152V2 experimental environments: (a) Visualizing predicted result of Non-Thr densenet-201 2 experimental environment; (b) Visualizing predicted result of Thr 72 50 Resnet152V2 2 experimental environment. (c) Confusion matrix of Thr 72 50 Resnet152V2 2.
Jmse 11 00333 g006
Table 1. Advantages and disadvantages of the tracking locations of ship block technology.
ReferenceAdvantagesDisadvantages
Shin et al. [4]GPS-based PDA can be used to correct worker errors by entering block locationsWorker with PDA needs to move around and enter block location
Lee et al. [6]Use high-precision, low-cost GPS/INSNeed to install GPS base station to improve GPS precision
Kim et al. [7]Block transport schedule can be established in real timeNeed to install RFID tag in stockyard
Park et al. [8]Blocks and transporters can be tracked in real timeNeed to install RFID tag in block and stockyard
Kang [9]Reducing the situation of missing block operation information input by replacing dual tasksCan only manage a single block
Mun [10]Proposed a robust location tracking device and algorithm in a shipyard environment where the radio wave environment is very poorIt is impossible to track the route after unloading the block from the transporter
Chon et al. [11]Using CNN, hull blocks can be automatically identified only with imagesRequires actual hull block image
Table 2. CNN models hyperparameters tuning value.
VGG-19Resnet152V2Densenet-201
Batch size643216
Learning rate0.00020.00020.0002
Number of epochsNon-Thr dataset: 10
Thr dataset: 5
Non-Thr dataset: 10
Thr dataset: 5
Non-Thr dataset: 10
Thr dataset: 5
Loss functionCategorical-crossentropyCategorical-crossentropyCategorical-crossentropy
OptimizerRMSpropRMSpropRMSprop
RMSprop rho0.90.90.9
Table 3. Top-10 predicted accuracy in Thr dataset experimental environment.
CNN ModelTraining ThresholdTesting ThresholdEpochAccuracy
Resnet-152V2725020.9617
Resnet-152V2726020.9617
Resnet-152V2786020.9617
Resnet-152V2786520.9617
Resnet-152V2735050.9617
Resnet-152V2725520.9600
Resnet-152V2724520.9600
Resnet-152V2735540.9600
Resnet-152V2706030.9583
VGG-19756020.9583
Table 4. Average prediction accuracy per Thr training dataset and Thr testing dataset.
Thr i Training DatasetAverage Predicted AccuracyThr i Testing DatasetAverage Predicted Accuracy
Thr 69 training dataset0.7169Thr 25 testing dataset0.5320
Thr 70 training dataset0.8477Thr 30 testing dataset0.6233
Thr 71 training dataset0.8229Thr 35 testing dataset0.7168
Thr 72 training dataset0.8826Thr 40 testing dataset0.7817
Thr 73 training dataset0.8566Thr 45 testing dataset0.8192
Thr 74 training dataset0.8311Thr 50 testing dataset0.8383
Thr 75 training dataset0.8513Thr 55 testing dataset0.8459
Thr 76 training dataset0.8304Thr 60 testing dataset0.8452
Thr 77 training dataset0.8238Thr 65 testing dataset0.8401
Thr 78 training dataset0.8440Thr 70 testing dataset0.8377
Thr 79 training dataset0.8730Thr 75 testing dataset0.8350
Thr 80 training dataset0.6767Thr 80 testing dataset0.8336
Thr 81 training dataset0.7126Thr 85 testing dataset0.8300
Thr 82 training dataset0.6694Thr 90 testing dataset0.8243
Thr 83 training dataset0.6125Thr 95 testing dataset0.8183
Thr 100 testing dataset0.8131
Thr 105 testing dataset0.7989
Thr 110 testing dataset0.7814
Disclaimer/Publisher’s Note: The statements, opinions and data contained in all publications are solely those of the individual author(s) and contributor(s) and not of MDPI and/or the editor(s). MDPI and/or the editor(s) disclaim responsibility for any injury to people or property resulting from any ideas, methods, instructions or products referred to in the content.

