Article

Model Tests on Cyclic Responses of a Laterally Loaded Pile Considering Sand Anisotropy and Scouring

1
School of Civil Engineering and Architecture, Anhui University of Science and Technology, Huainan 232001, China
2
Department of Geotechnical Engineering, Tongji University, Shanghai 200092, China
3
Key Laboratory of Geotechnical and Underground Engineering of Ministry of Education, Tongji University, Shanghai 200092, China
*
Author to whom correspondence should be addressed.
J. Mar. Sci. Eng. 2023, 11(2), 255; https://doi.org/10.3390/jmse11020255
Submission received: 22 November 2022 / Revised: 14 January 2023 / Accepted: 18 January 2023 / Published: 20 January 2023
(This article belongs to the Special Issue Advances in Marine Structures)

Abstract

:
Monopile is a common foundation for offshore wind turbines. Long-term cyclic loading from winds and currents may affect the normal operation of offshore wind turbines. For offshore wind farms, natural soils are usually inherently anisotropic, and scouring often occurs as a removal of soil around a monopile. Their influence on pile behavior is seldom studied. To investigate the effects of anisotropy of sand and scouring on a cyclic laterally loaded pile, a series of 1 g model tests are conducted, in which three deposition angles of sand, two scour depths, and two cyclic amplitudes are considered. It was found that for a monopile in sandy soil, the accumulated displacements at the pile head increased with the increased deposition angles of sand and scour depth. The effects of sand anisotropy are more profound for piles with a smaller cyclic amplitude. However, the results for the pile with and without scouring did not give a consistent tendency as the factors of anisotropy of sand. Based on test results, an explicit expression is advised to assess the long-term accumulated residual displacement at the pile head, in which factors of deposition angle of sand, scour depth, and cyclic amplitudes are incorporated.

1. Introduction

The global energy challenge hastens the transition to a more sustainable energy system. The wind turbine, as a fast-growing technology to obtain renewable resources, has attracted attention in recent years. For wind turbines, monopile is currently the preferred foundation to support upper structures, which is dominant in water depths up to 35 m or even 40 m [1,2,3,4].
An important aspect of a wind turbine is its long-term behavior under cyclic loading from winds and waves. The accumulated displacement at the pile head over its design lift must be carefully estimated, as it typically limits the performance of the turbine due to serviceability constraints [5]. Besides extensive test studies about the functions of cyclic load characteristics on the responses of a cyclically loaded pile, such as cyclic load pattern and cyclic load amplitude [6,7,8], two factors, sand anisotropy and scouring, which may influence the displacement accumulation of piles under cyclic loading, have not received enough attention. Sand anisotropy is an inherent property of naturally occurring soil, with respect to different deformations and strengths of soil. A monopile buried in anisotropic soil may behave differently from one in homogeneous soil. For offshore wind farm sites, especially with tidal currents, scouring in the vicinity of the foundation is a common phenomenon, as is the removal of the upper soil around the pile due to the action of flowing water and the presence of the foundation. A monopile can be more or less susceptible to scouring because the removed soil diminishes the soil resistance around the pile and changes the properties of the remaining soil.
For the specification of anisotropic material characteristics of sand, many laboratory tests, including plain strain, direct shear, triaxial, and hollow cylinder tests, and the related constitutive models are presented [9,10,11,12]. For the issue of effects of soil anisotropy on the soil–structure interaction, there are works on the dynamic performance of piles [13,14], the static vertically loaded piles [15], which are restricted in the elastic analysis with a transversely isotropic media, and the stability of pile-stabilized slope [16], which only considers the strength anisotropy of soil for limit analysis. In addition, experimental tests were conducted to study the behavior of laterally loaded pile groups under a stratified soil system by Munaga and Gonavaram [17]. To study the effects of scouring on the response of a laterally loaded pile, p–y curves are modified to consider the scour hole dimensions [18,19], and the removed soil-induced stress change on the properties of soil [20,21]. Limited work attempts to study the cyclic responses of piles under scouring by Achmus et al. [22], in which a numerical analysis is presented to simulate the scour hole and a degradation stiffness to simulate the cyclic properties of sand.
In this study, 1 g model tests were performed on a monopile subjected to lateral monotonic and long-term cyclic loading, to investigate the influence of cyclic amplitude, anisotropy of sand, and scouring on the accumulated pile displacements. The work presented here is as follows. In Section 2, a set of test equipment is introduced to prepare the sand sample and apply long-term horizontal cyclic loading to the monopile, in which a container box is designed for the preparation of anisotropic sand with different deposition angles under air pluviation. The properties of the Toyoura soil and model pile and the test program are also introduced. In Section 3, the results of six static monotonic loading tests were analyzed to assess the lateral capacity of the monopile with three deposition angles of sand and two scouring depths. Then the results of twelve cyclic loading tests were analyzed to study the accumulated residual displacement of the pile subjected to three deposition angles, two scouring depths, and two cyclic loading amplitudes. In Section 4, a quantized work is proposed to predict the accumulated displacements of monopile foundations, and a united expression including the influence of scouring, cyclic load amplitudes, and soil deposition angles is expressed.

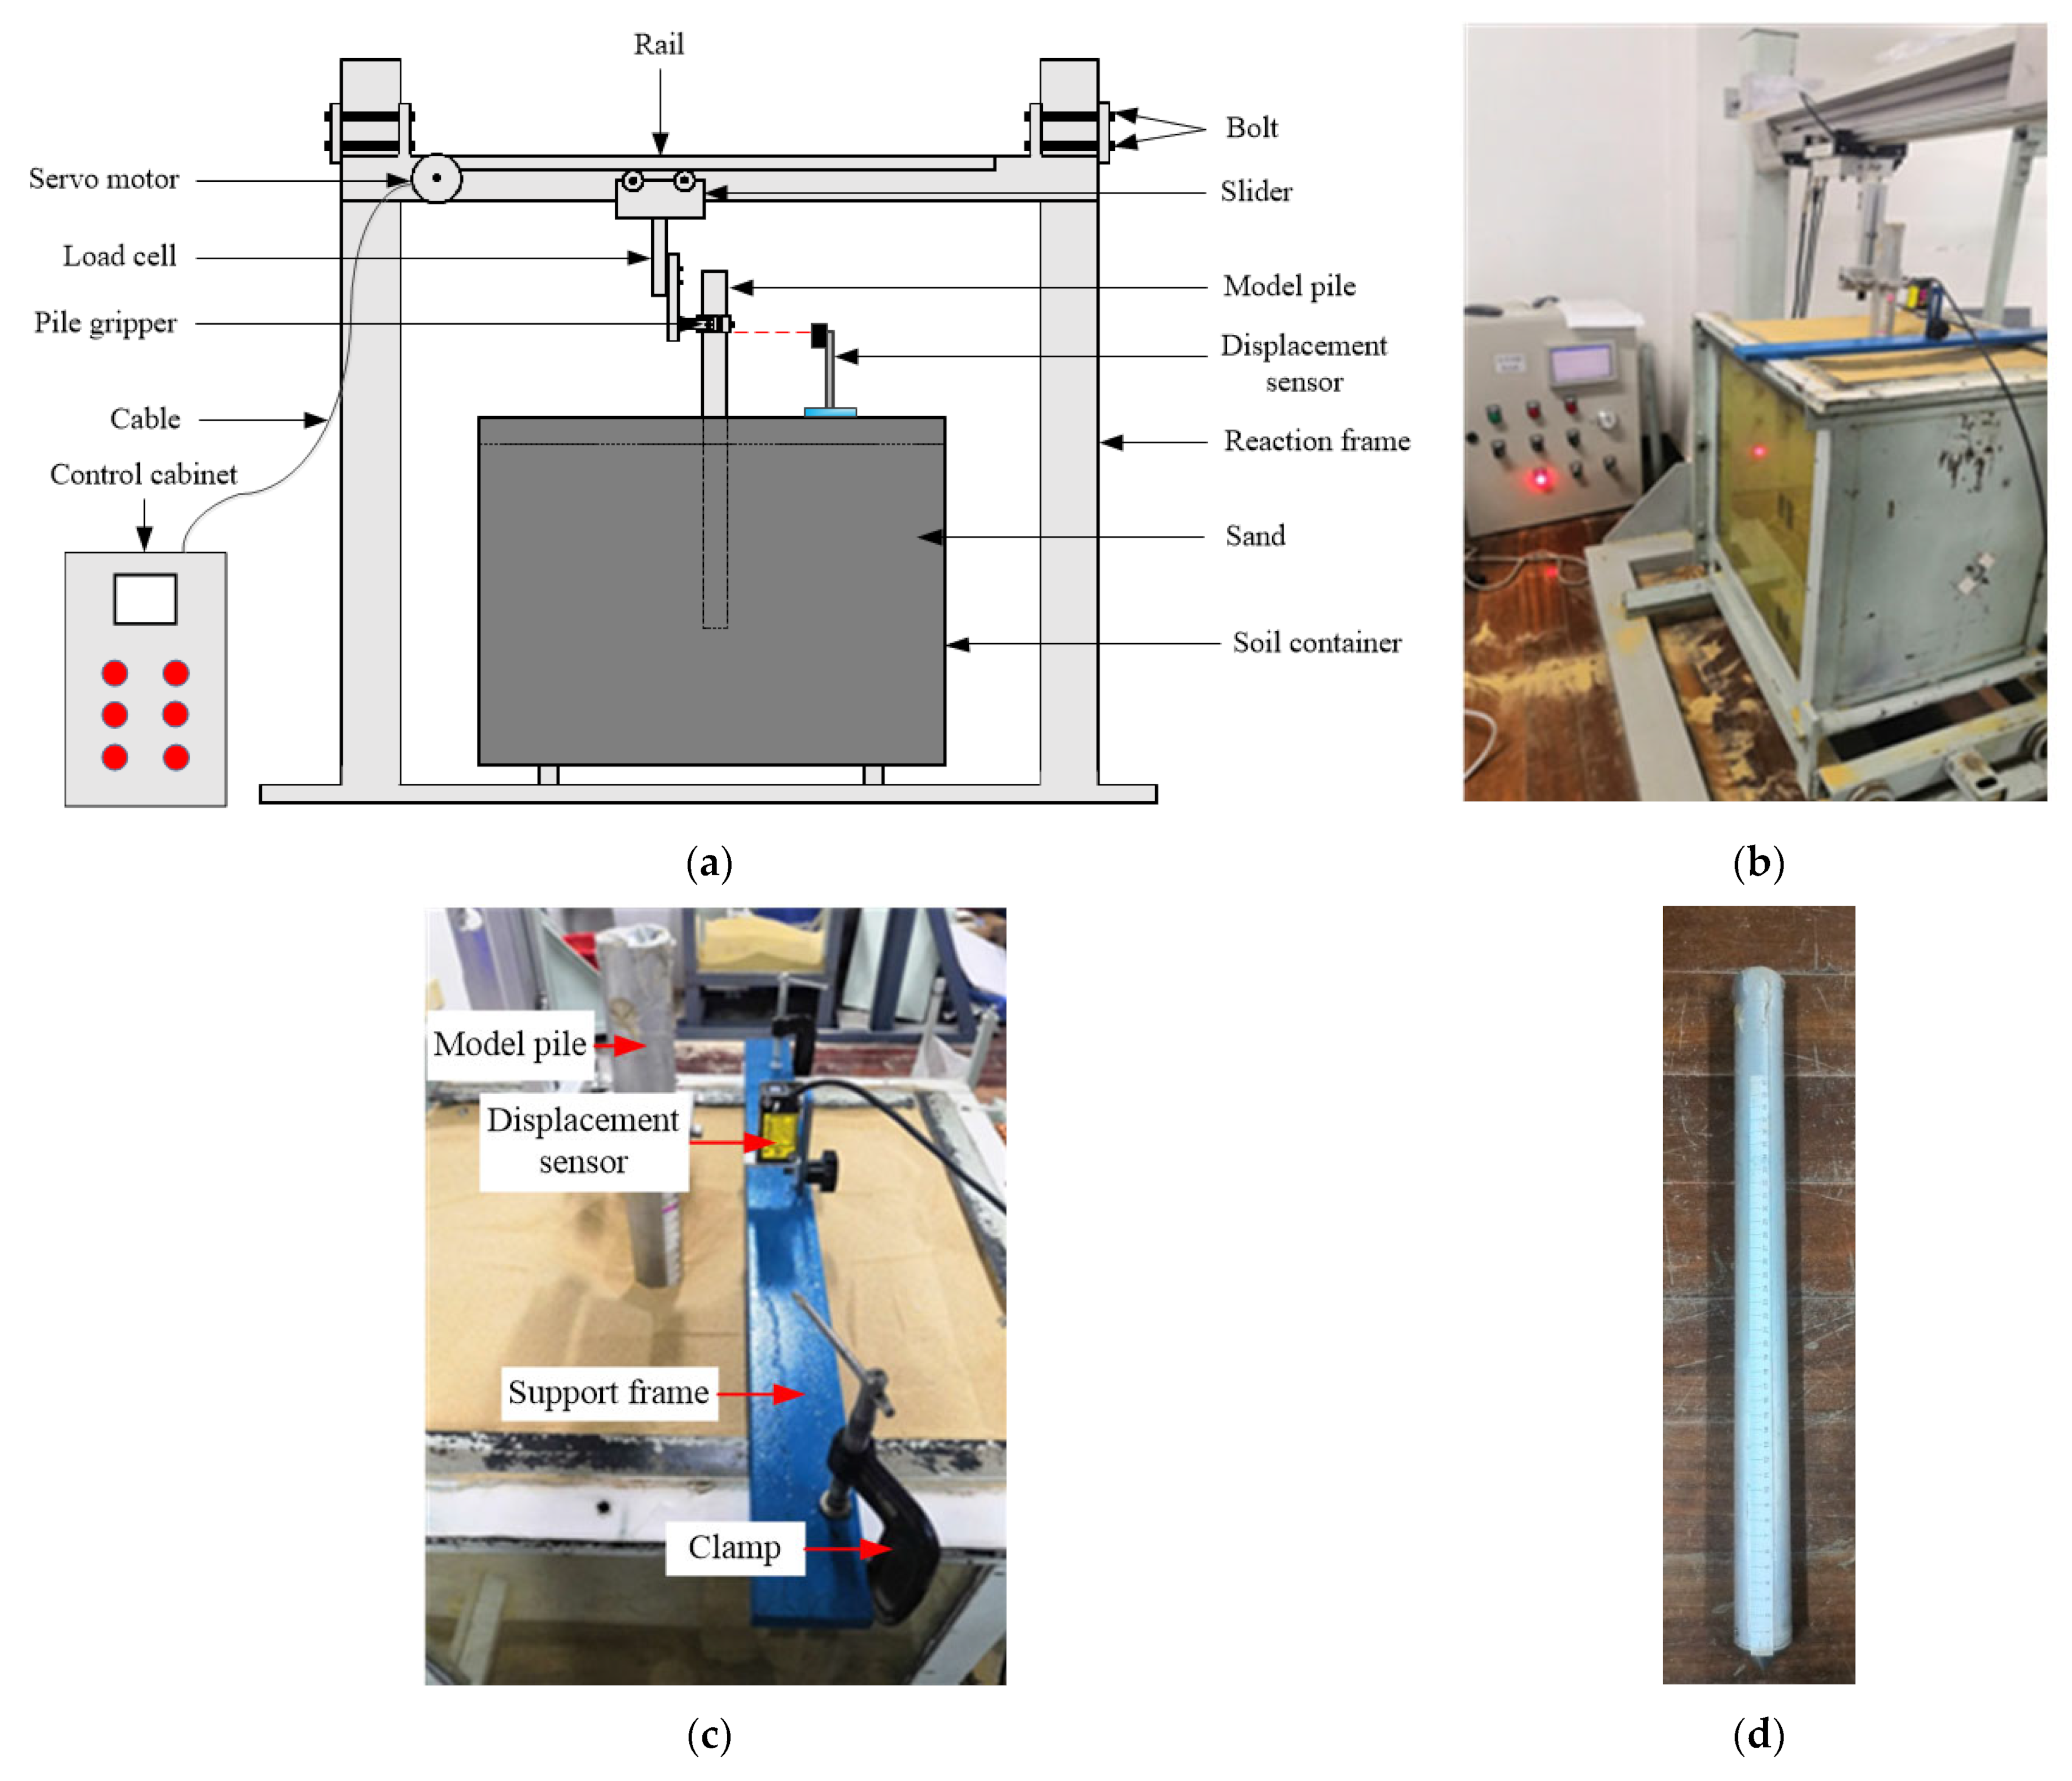
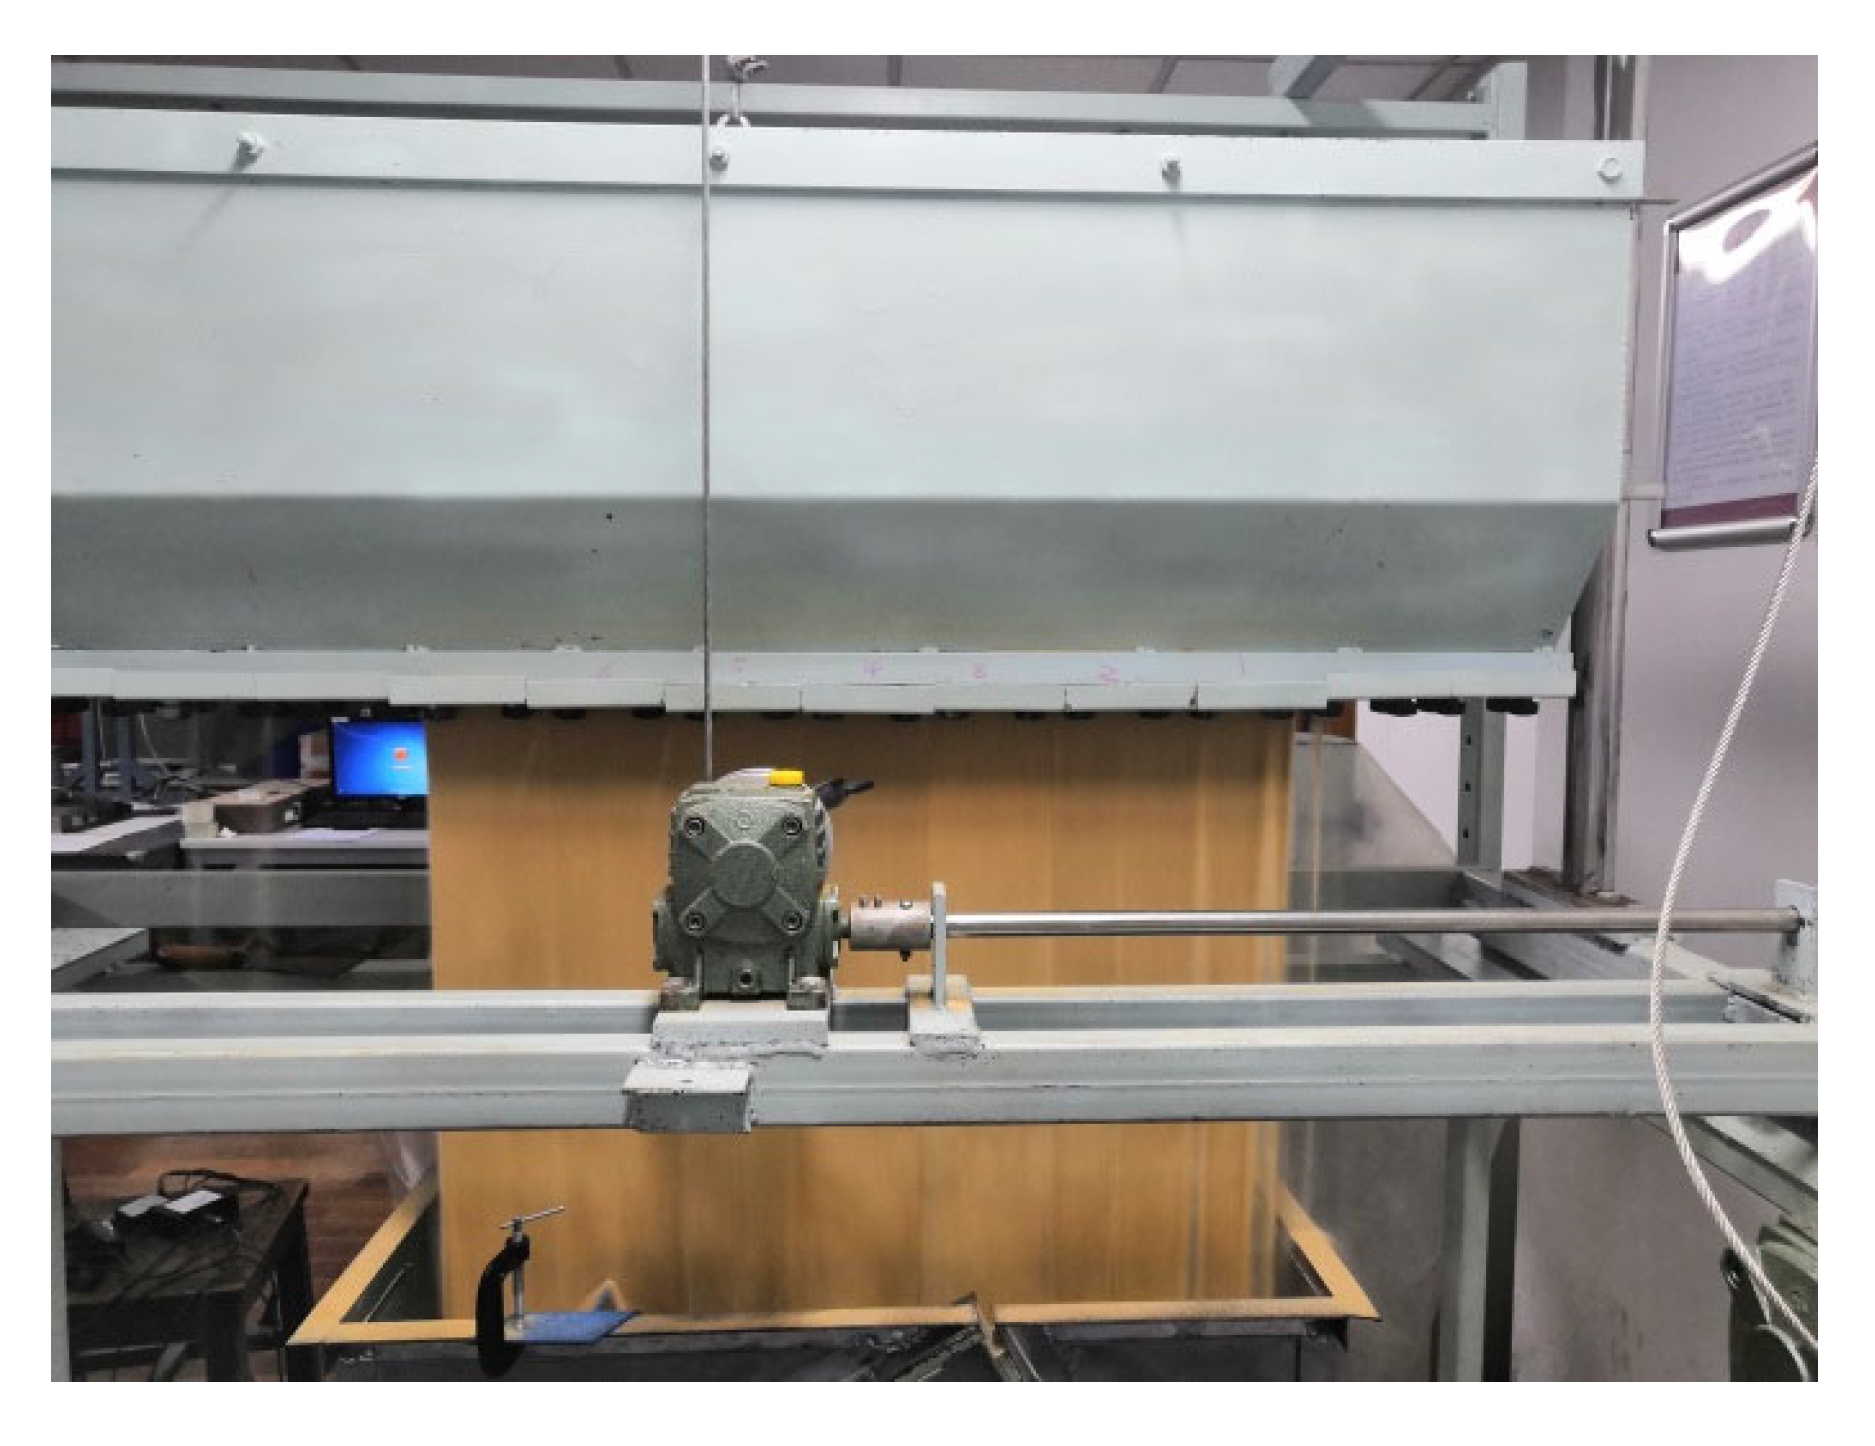
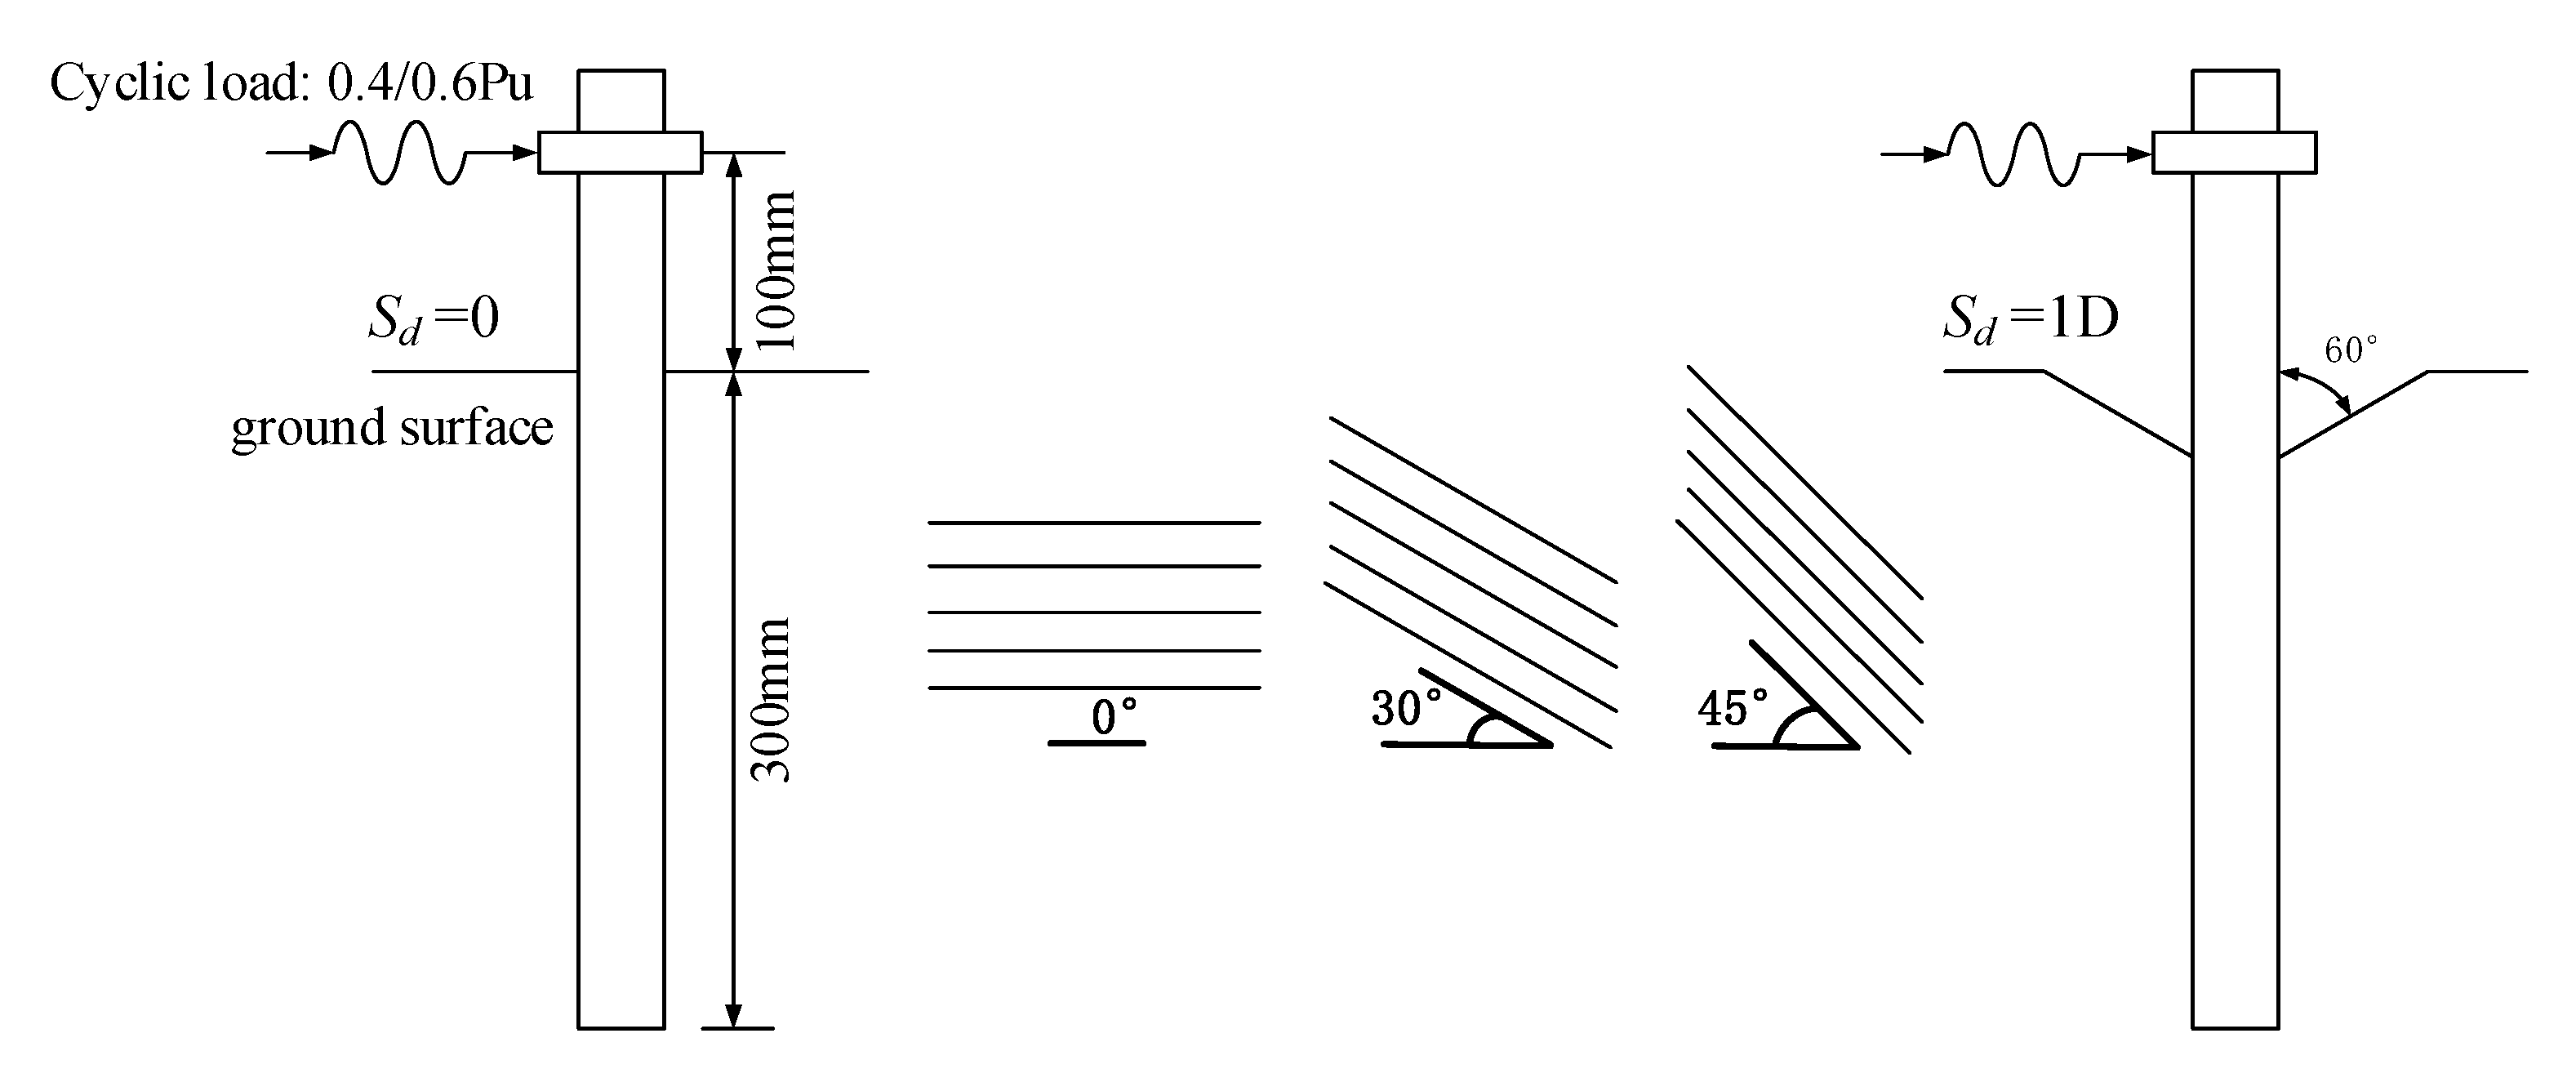
2. Experimental Set-Up and Procedure

The experiment here comprises the modeling of a cyclic laterally loaded pile buried in anisotropic sand and under scouring.

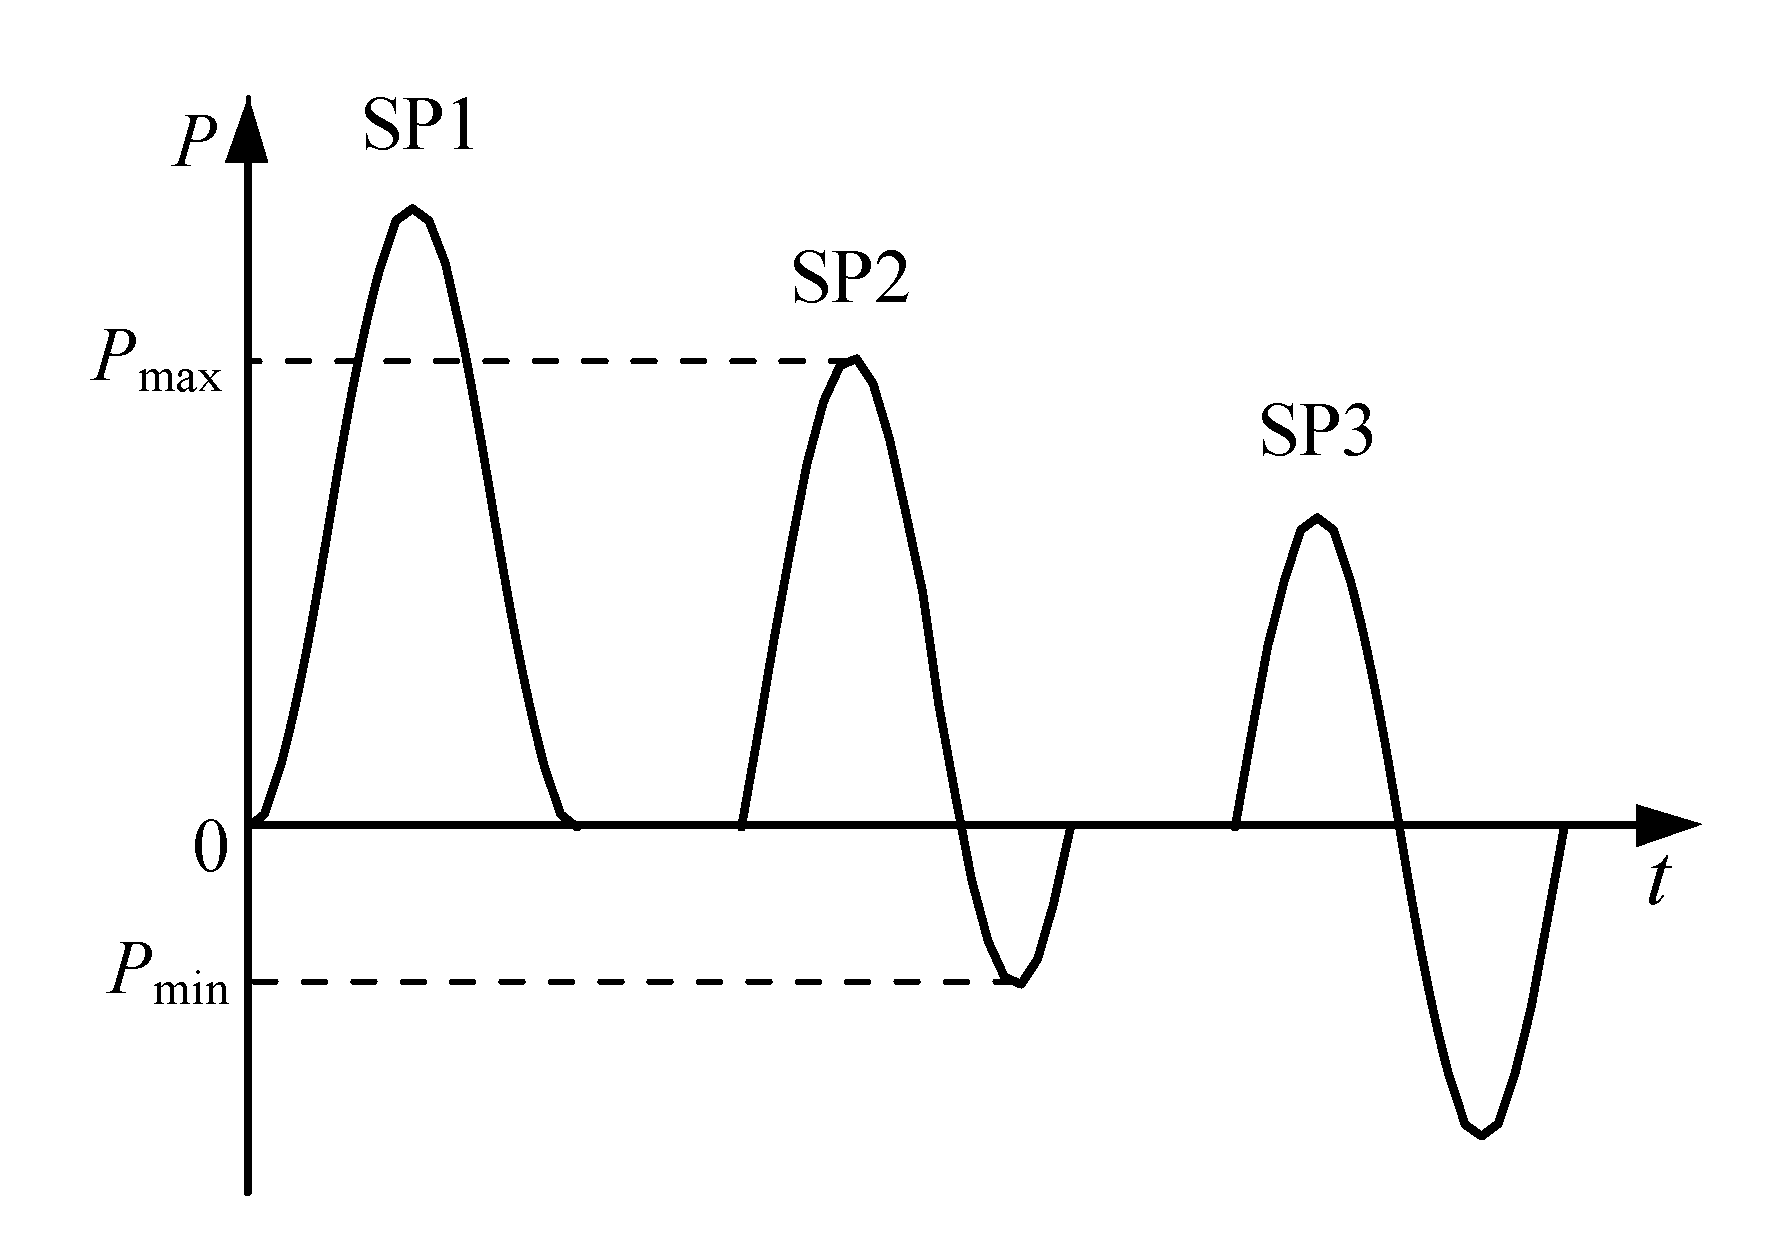
2.1. Test Loading and Measurement

All model tests are performed in a soil container, which has a length of 0.5 m, a width of 0.4 m, and a height of 0.5 m. In order to monitor soil preparation, two perspex sheets are attached to the sides of the container. A model pile was installed in the center of the container. Figure 1 shows the schematic sketch and photos of the test loading system.
The cyclic loading device is driven by a servo-controlled motor (see Figure 1a,b), having a frequency range of 0–0.2 Hz. By moving along the trail, a slider can supply cyclic horizontal loading at the pile head. The connection is made through a special gripper clamped at the pile head without any applied axial load or additional bending moment. A load cell is attached to the rigid extension from the slider to measure the lateral loading on the pile. The cyclic loading device is load controlled with a maximum output of 100 N. An example of the output cyclic loading pattern by the load cell is given in Figure 2, the accuracy of which is 1%, acceptable for the current study.
A non-contact miniature laser displacement sensor was mounted on a fixed support frame to measure the lateral displacements of the pile shaft at a height of 90 mm above the soil surface, as shown in Figure 1c. It has a range of 0–30 mm and an accuracy of 0.1%.

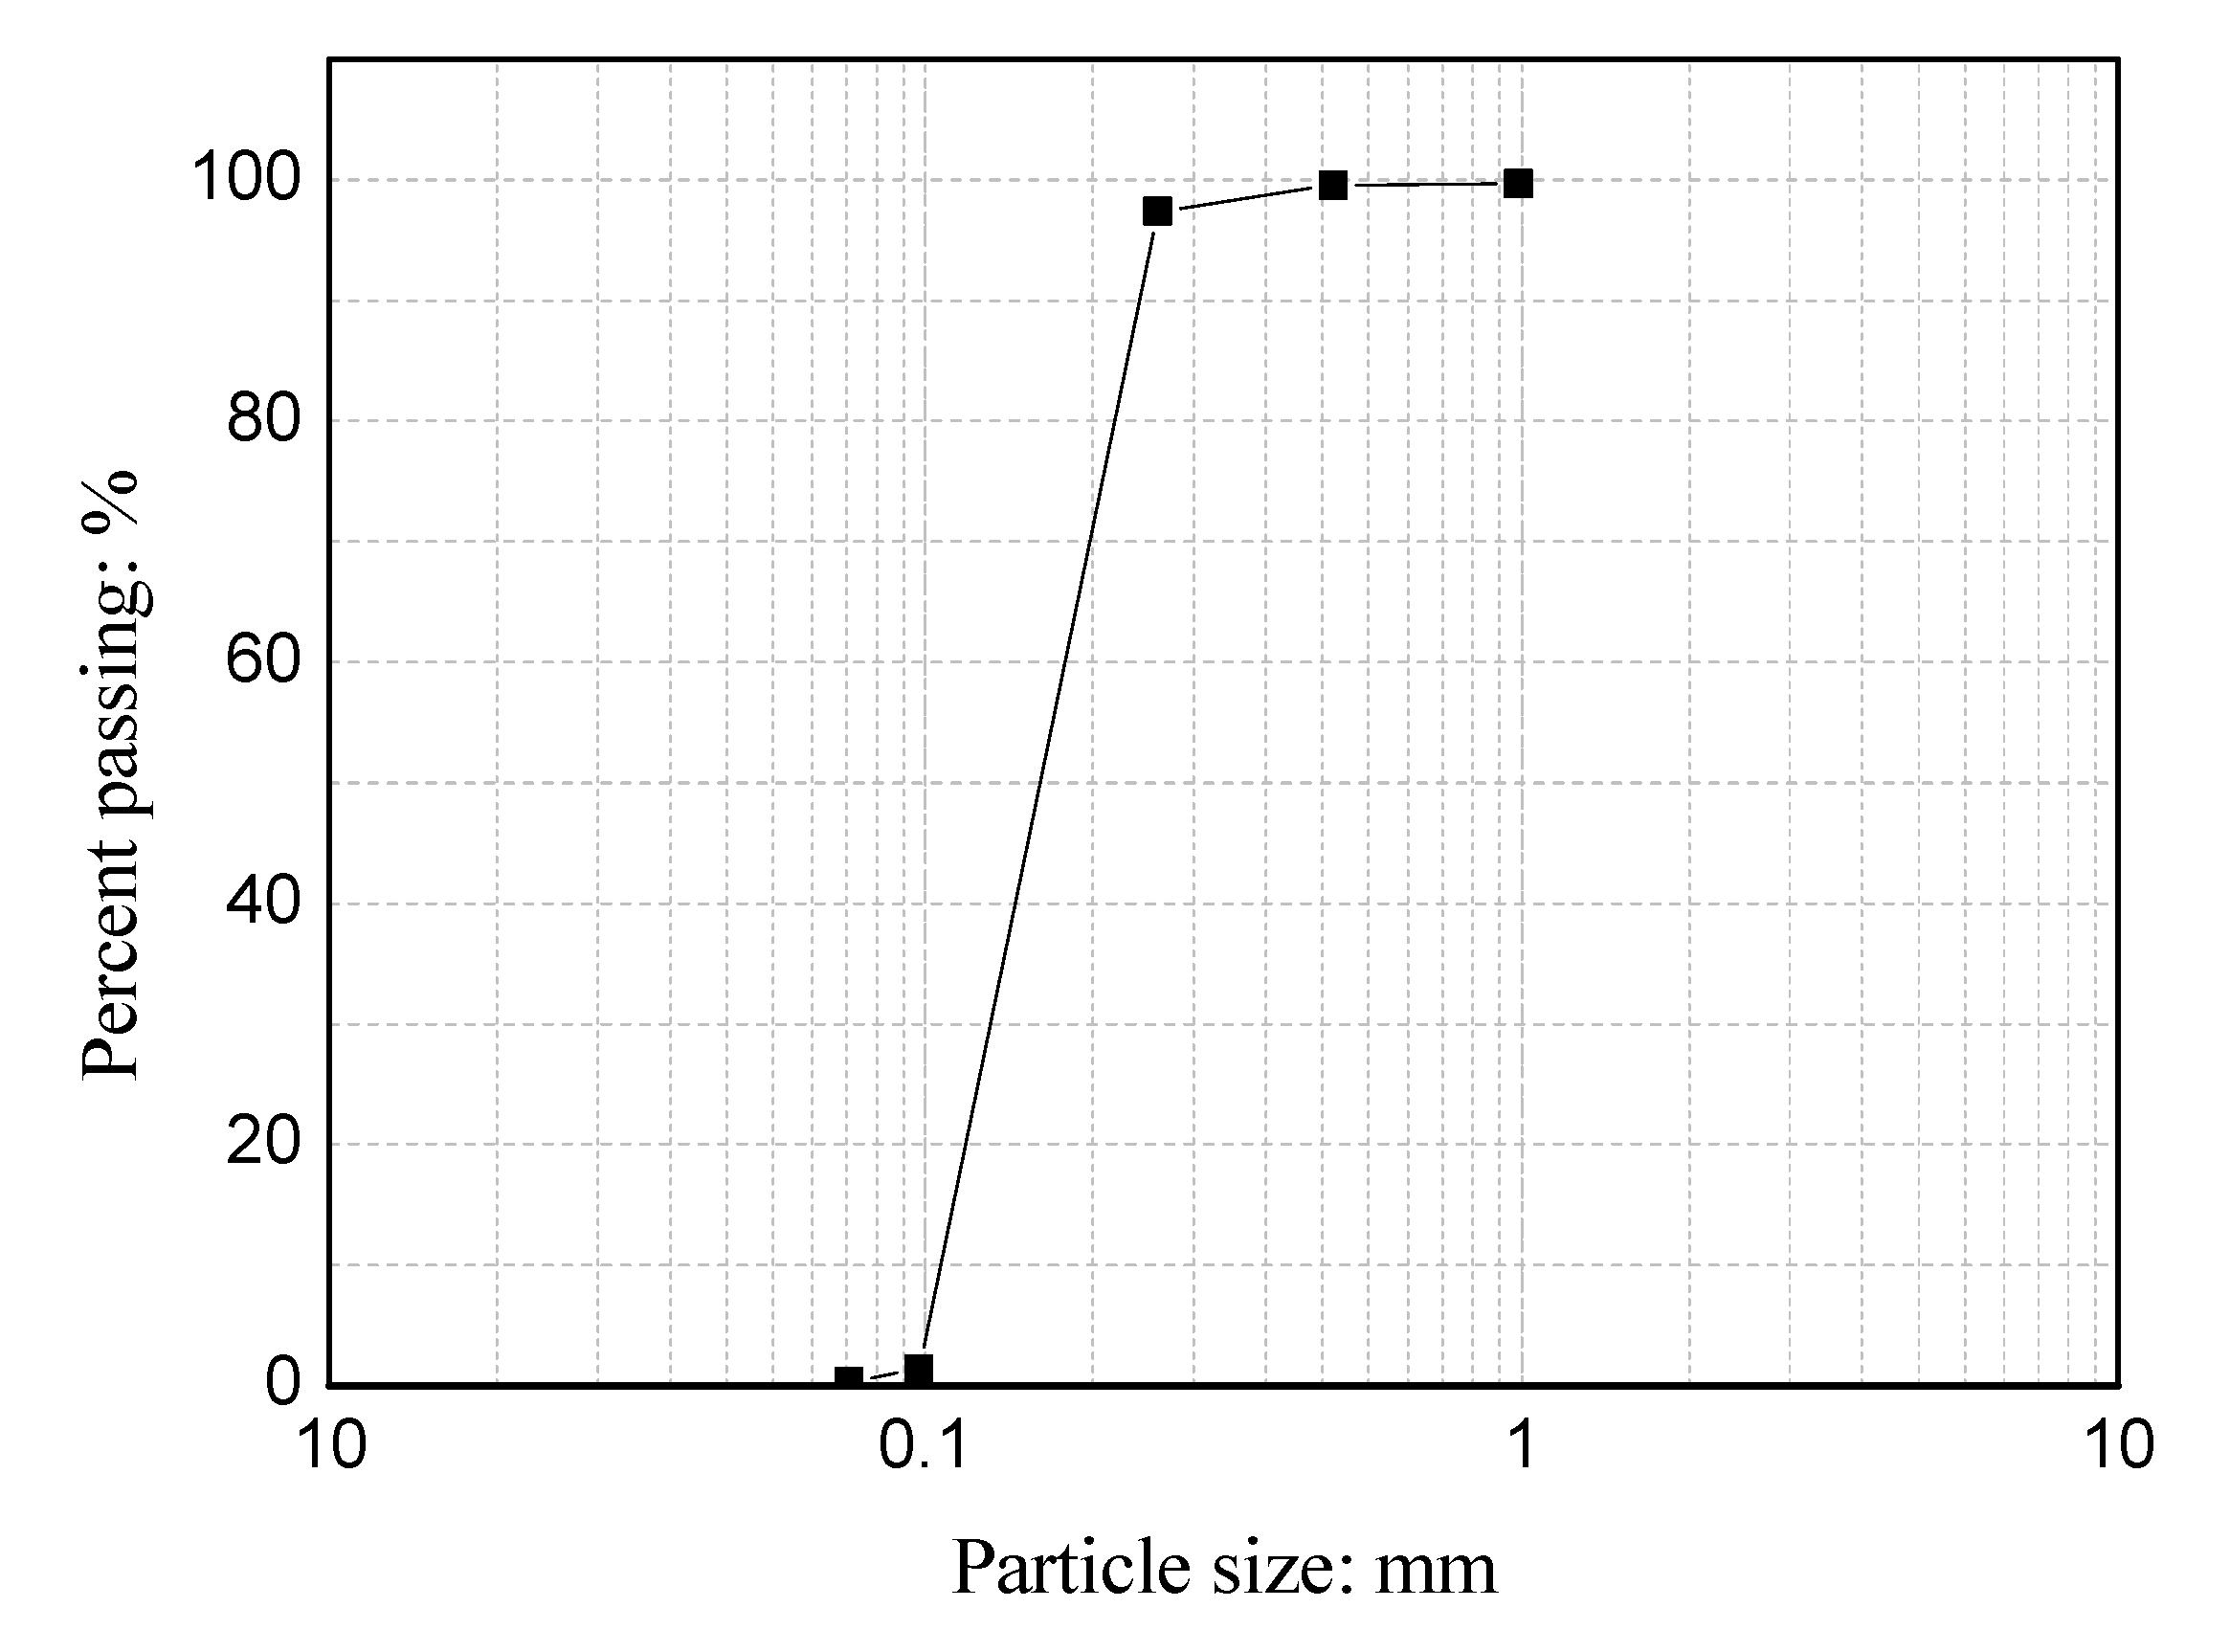
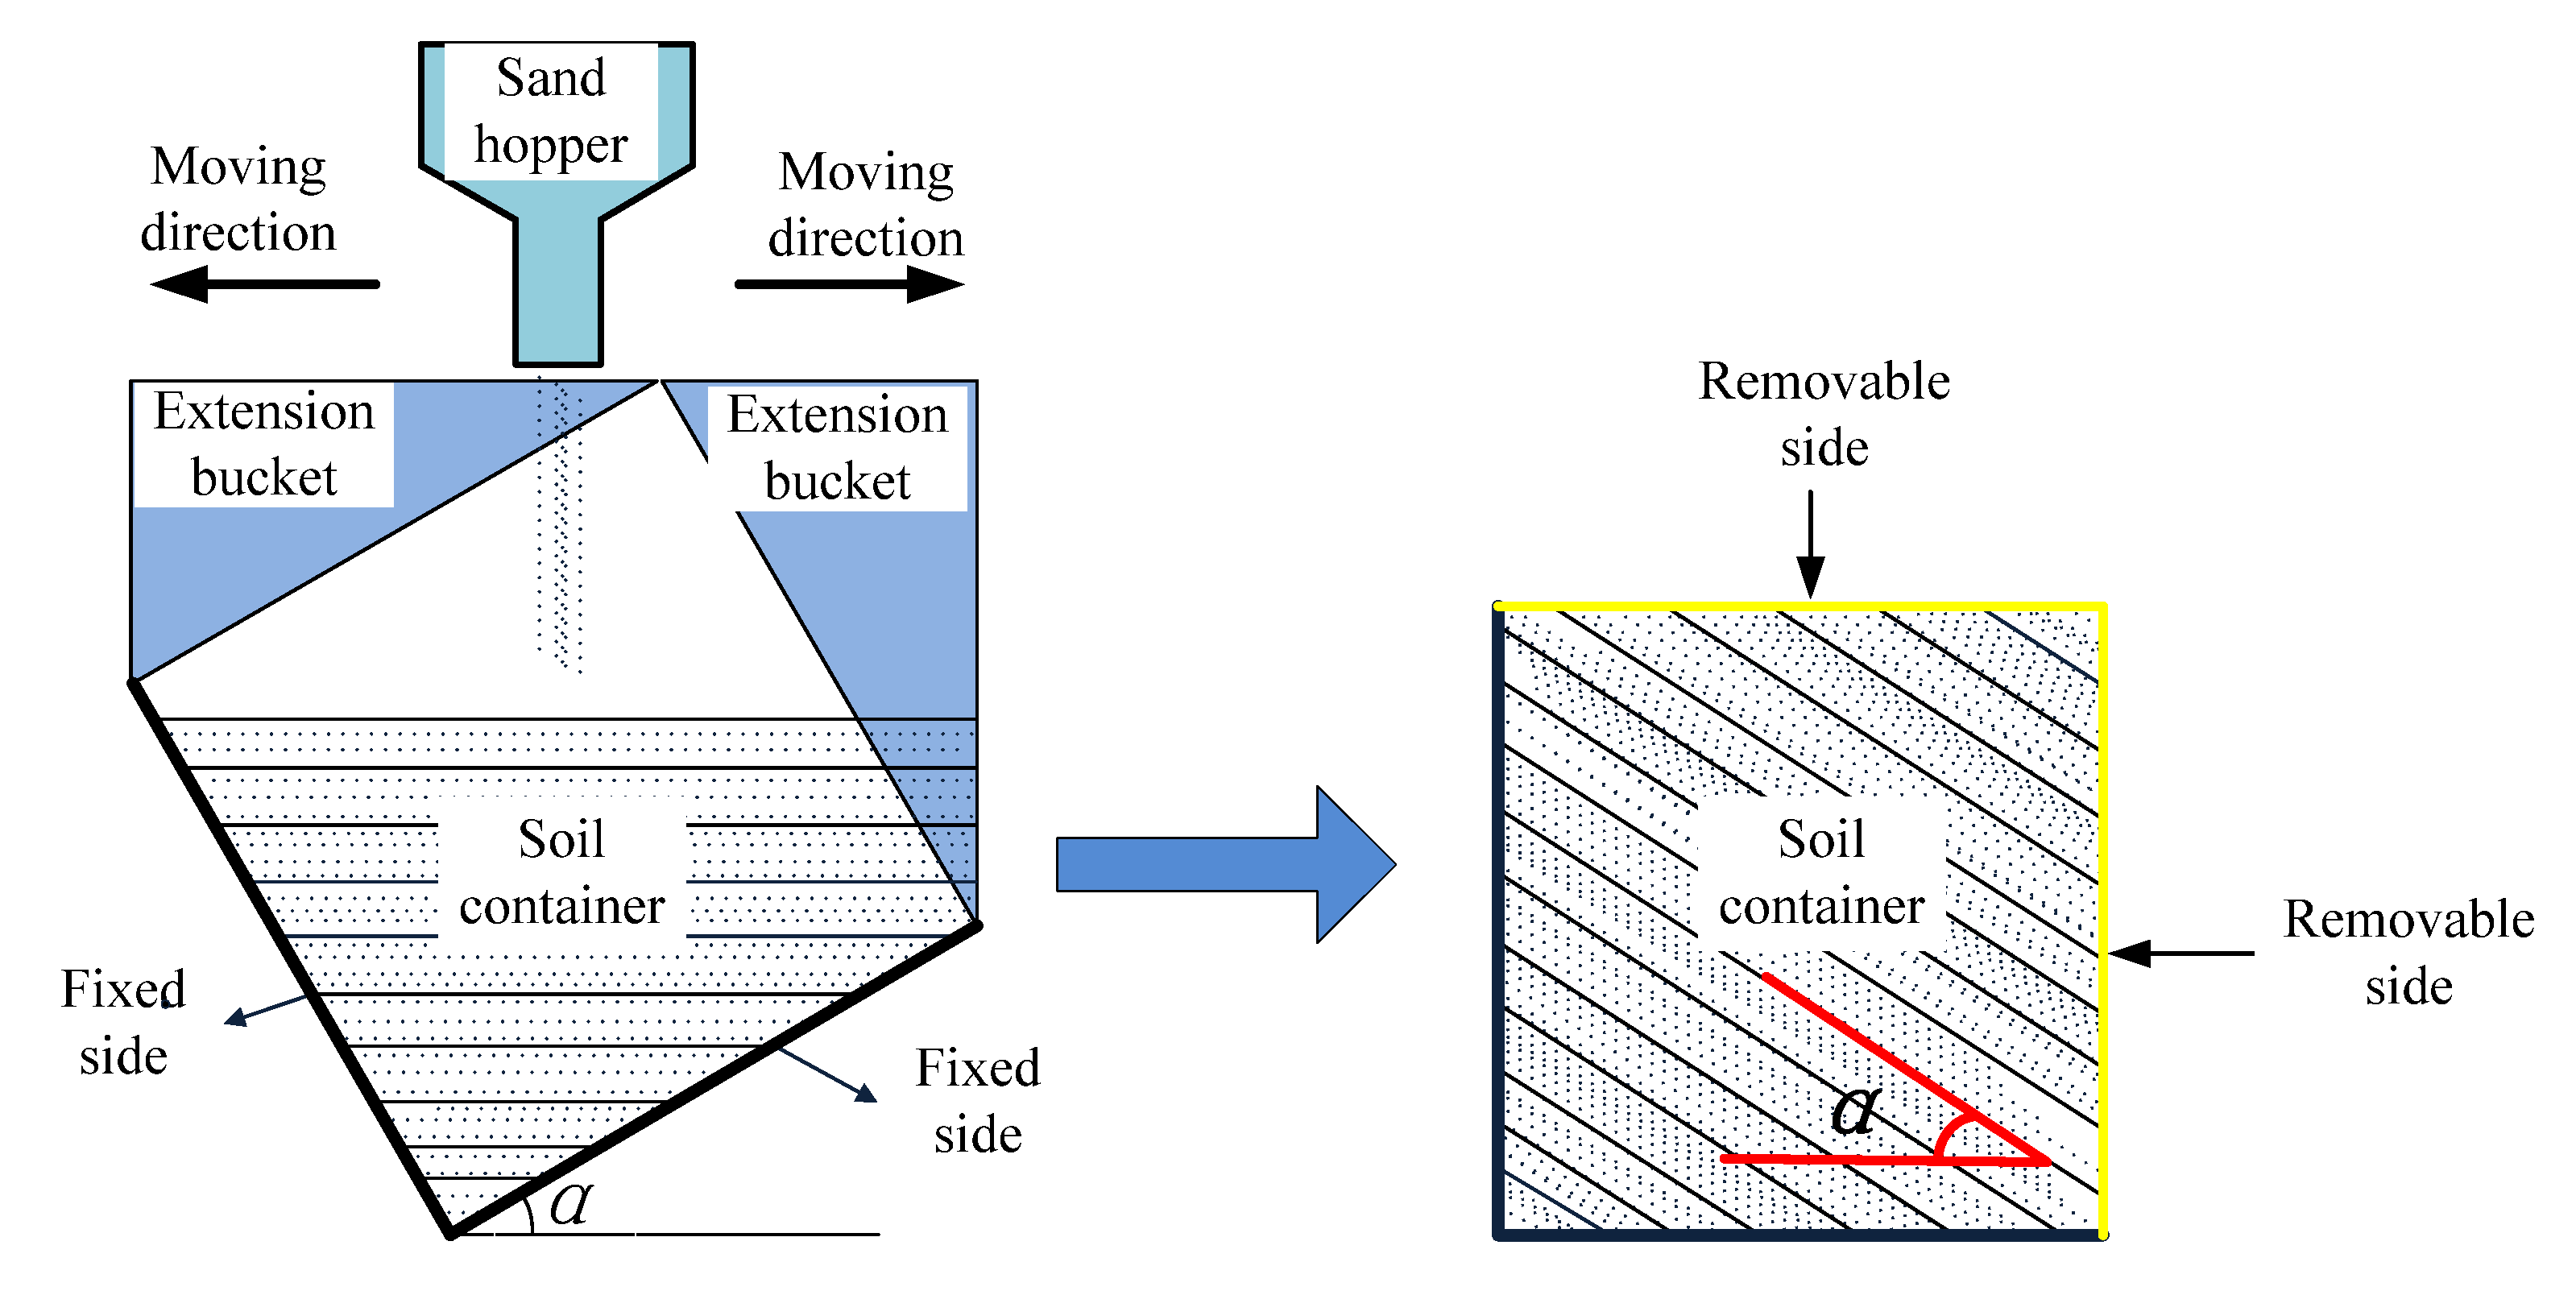
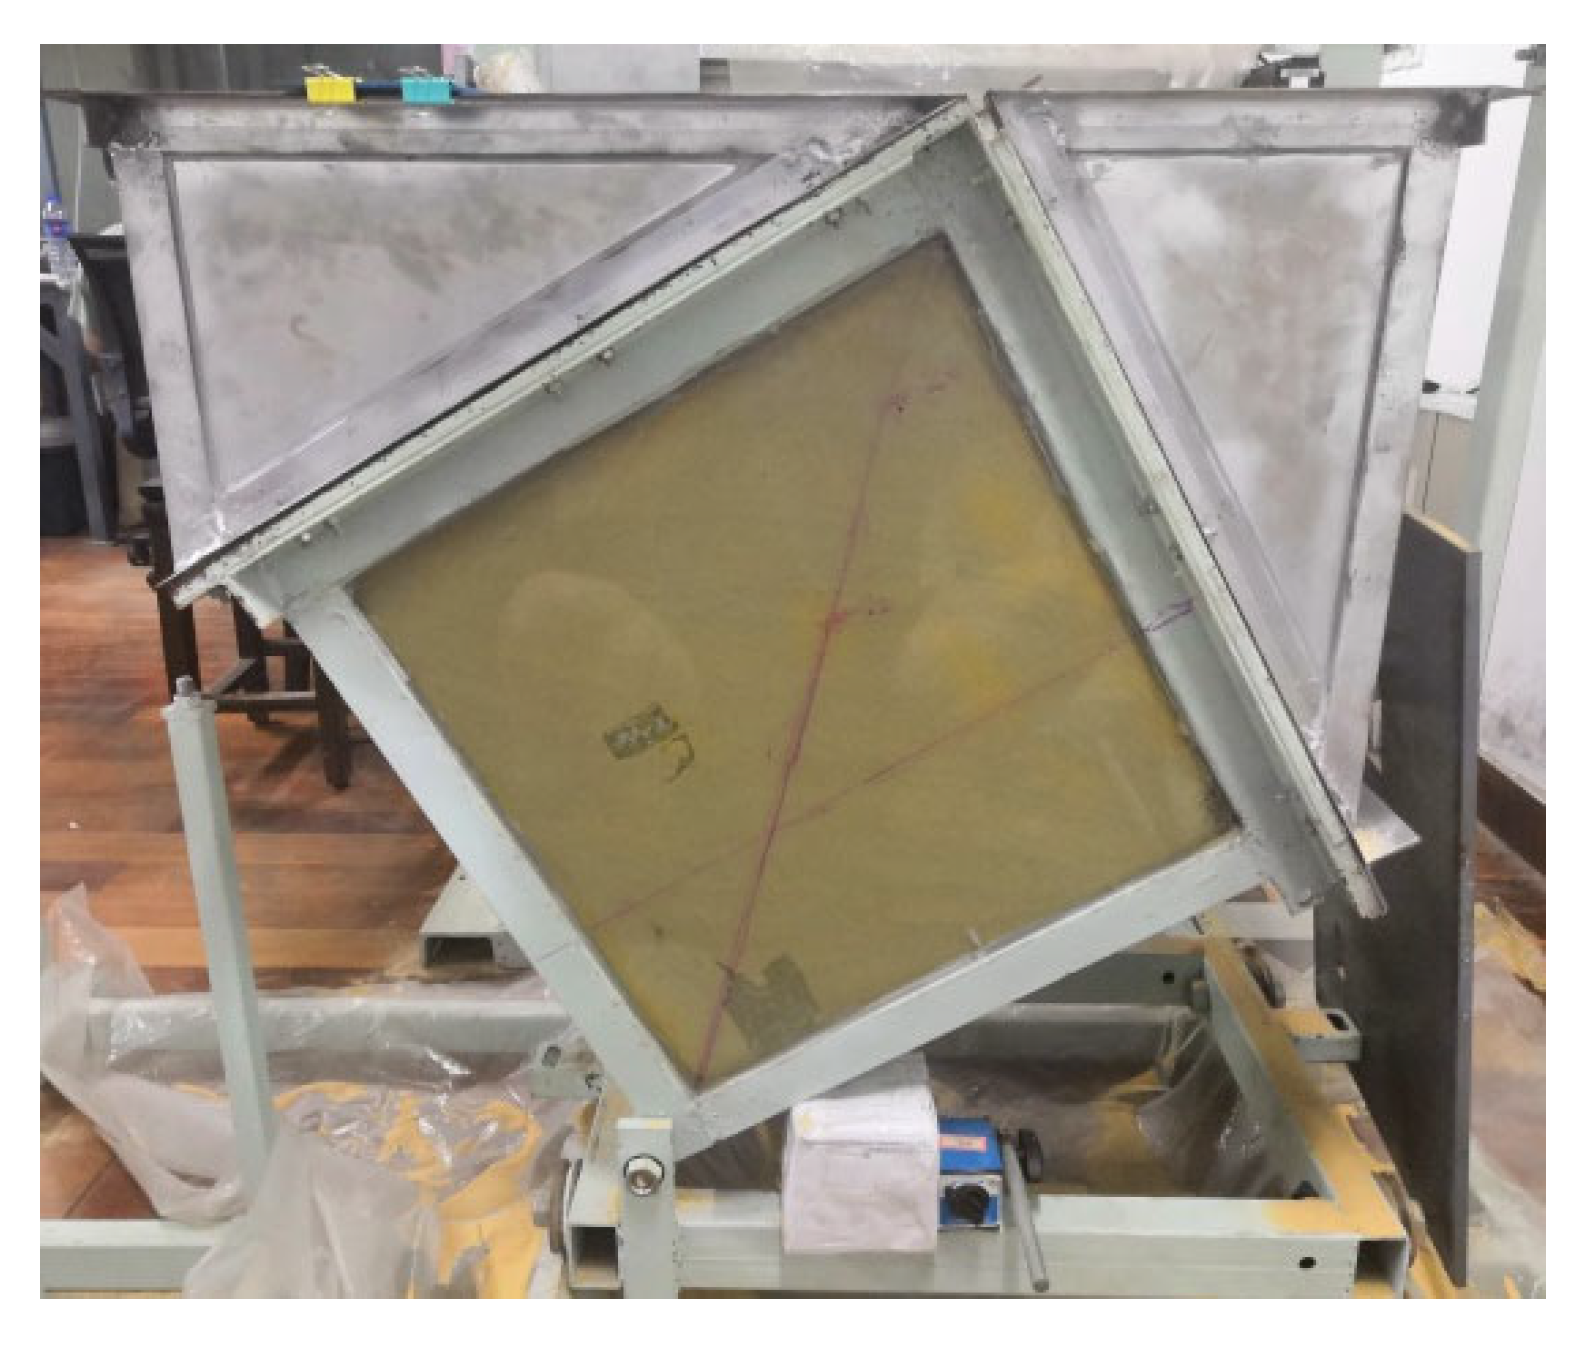
2.2. Soil Properties and Preparation

The soil prepared for the model tests was Toyoura sand. Figure 3 shows the grading curve, which indicates the sample is poorly graded fine sand. The characteristics of Toyoura sand are summarized in Table 1. The soil sample was prepared by air pluviation to pour sands from a height of 80 cm to the required depth layer by layer. In all tests, the relative density of sand is controlled at 54%. A photo of the moving hopper used to pour sand is shown in Figure 4.
Toyoura sand is an angular-shaped aggregate whose mechanical properties are anisotropic at the macroscale. In this experimental study, the effect of the anisotropy of sand on the pile–soil interaction is considered. The soil preparation produces samples at a designed deposition angle to simulate the inherently anisotropic nature of naturally occurring sand deposits [23,24]. To achieve this function, the container box is transformed as below. Figure 5 shows a schematic of the setup, and Figure 6 shows the photo. The box has two fixed sides and two removable sides. To maintain the sand rain for a tilted box, two extension buckets are attached to the box along the vacant, removable sides. After filling to the desired height, two plates are pushed into the box along the removable sides. Then the box was placed flat on the floor. The tilting angle of the box at raining presents the deposition angle of the sand.

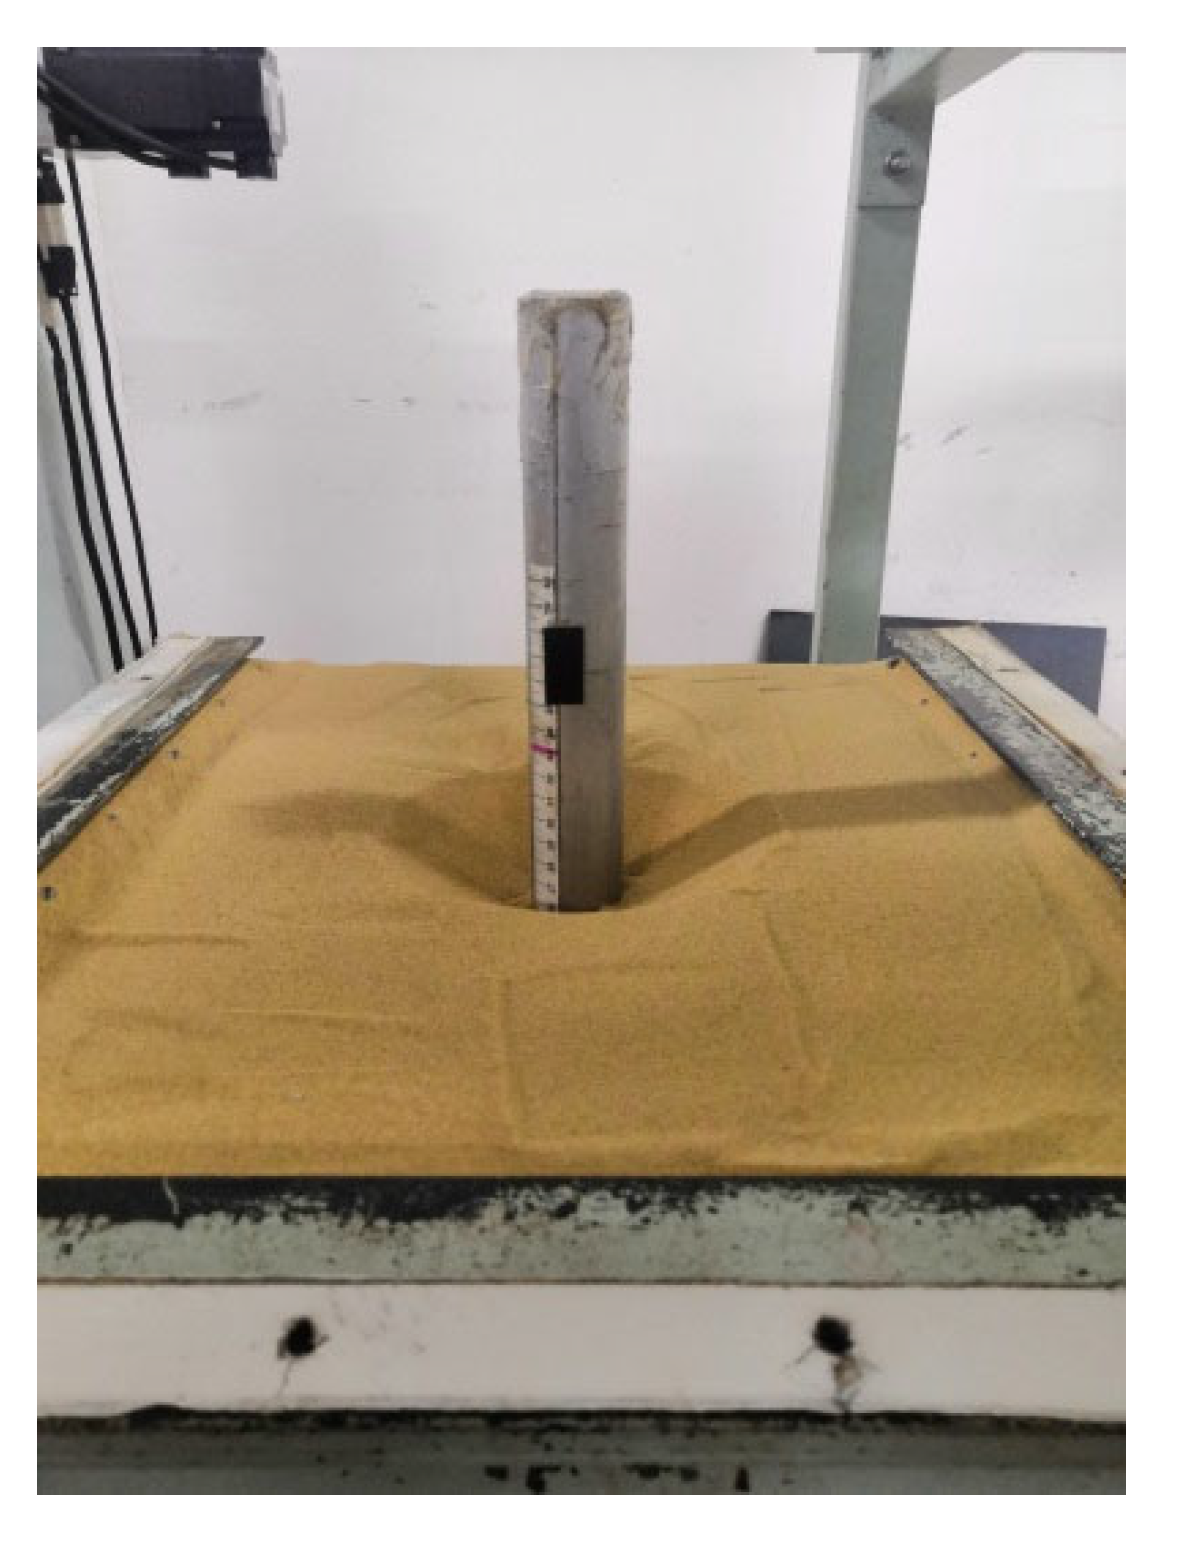
2.3. Model Pile Characteristics

The model pile (see Figure 1d) for tests is manufactured from a hollow, circular aluminum tube with an elasticity modulus of 71 GPa and a Poisson’s ratio of 0.33. The pile was embedded to a depth of 0.3 m, and its diameter is 40 mm, which represents an embedment ratio of 7.5. The total length of the pile is 0.4 m. It is considered a rigid pile. The width of the soil container is 10 times larger than the pile diameter, which is large enough to avoid boundary effects [4]. The pile was fixed temporarily in the soil container during soil preparation to eliminate soil disturbance around the pile with jacking. In all tests, the lateral loading point is 0.1 m above the soil surface.

2.4. Test Programme

The test program considered 18 tests to research the behavior of a pile subjected to cyclic lateral loads depending on the sand anisotropy, cyclic load amplitudes, and scour depths. The lateral capacity of the monopole from static tests can be used to normalize the cyclic load amplitude.
The soil stratum for tests was prepared with three deposition angles as 0 ° , 30 ° and 45 ° . Based on practical application, the scour can reach a depth of 1–1.5 times the pile diameter for larger piles [25]. In this study, a scouring depth of 1D was considered, and tests without scouring were used as comparative cases. Except for a global scour with the removal of a layer of soil, a local scour of a scour hole around a pile is more common, the shape of which is usually described as an inverted frustum, with parameters such as scour depth, scour width at the bottom, and slope angle. Existing studies indicated that, among the three parameters for scour hole dimensions, the post-scour responses of a laterally loaded pile are most sensitive to scour depth [18,26]. Hence, the test program considered the conditions of local scour with the dimension of a scour hole having a slope angle of 30 ° and scour width of 0. The angle of 30 ° is smaller than the critical state friction angle of Toyoura sand as of 31 ° [27]. The formation of the scour hole was realized by hand, with a photo shown in Figure 7.
Leblanc et al. [28] proposed two independent parameters η b and η c to quantify cyclic loads, for both one-way and two-way cyclic load patterns, which are expressed as
η b = P m a x P u
η c = P m a x P m i n
where P m a x and P m i n are the maximum and minimum loads applied in one cycle, P u is the ultimate lateral capacity. According to the definition, η b is the normalized cyclic amplitude. η c represents the cyclic load type, which is 1 η c < 0 , 0 η c < 1 , 1 for two-way (SP2, SP3), one-way cyclic load (SP1) and static load, respectively, as shown in Figure 8. For all cyclic tests, full one-way cyclic loading was applied with η c = 0 , and η b = 0.4 and 0.6, respectively. The capacity P u conforms to the reference case of a static load test on the pile in homogeneous sand and without scouring. Since the work focuses on factors such as soil anisotropy and scouring around the pile, the cyclic load pattern is simplified. In order to avoid dynamic effects, cyclic loading is applied at a frequency of 0.1 Hz. Based on the experimental facility capacity, the cyclic number is set at 4000.
Figure 9 shows the cyclic loading test program, illustrating the parameters of two scour depths, two cyclic load amplitudes, and three deposition angles. It is also listed in Table 2, which shows a total of six monotonic tests and 12 cyclic-loaded tests carried out.

3. Test Results

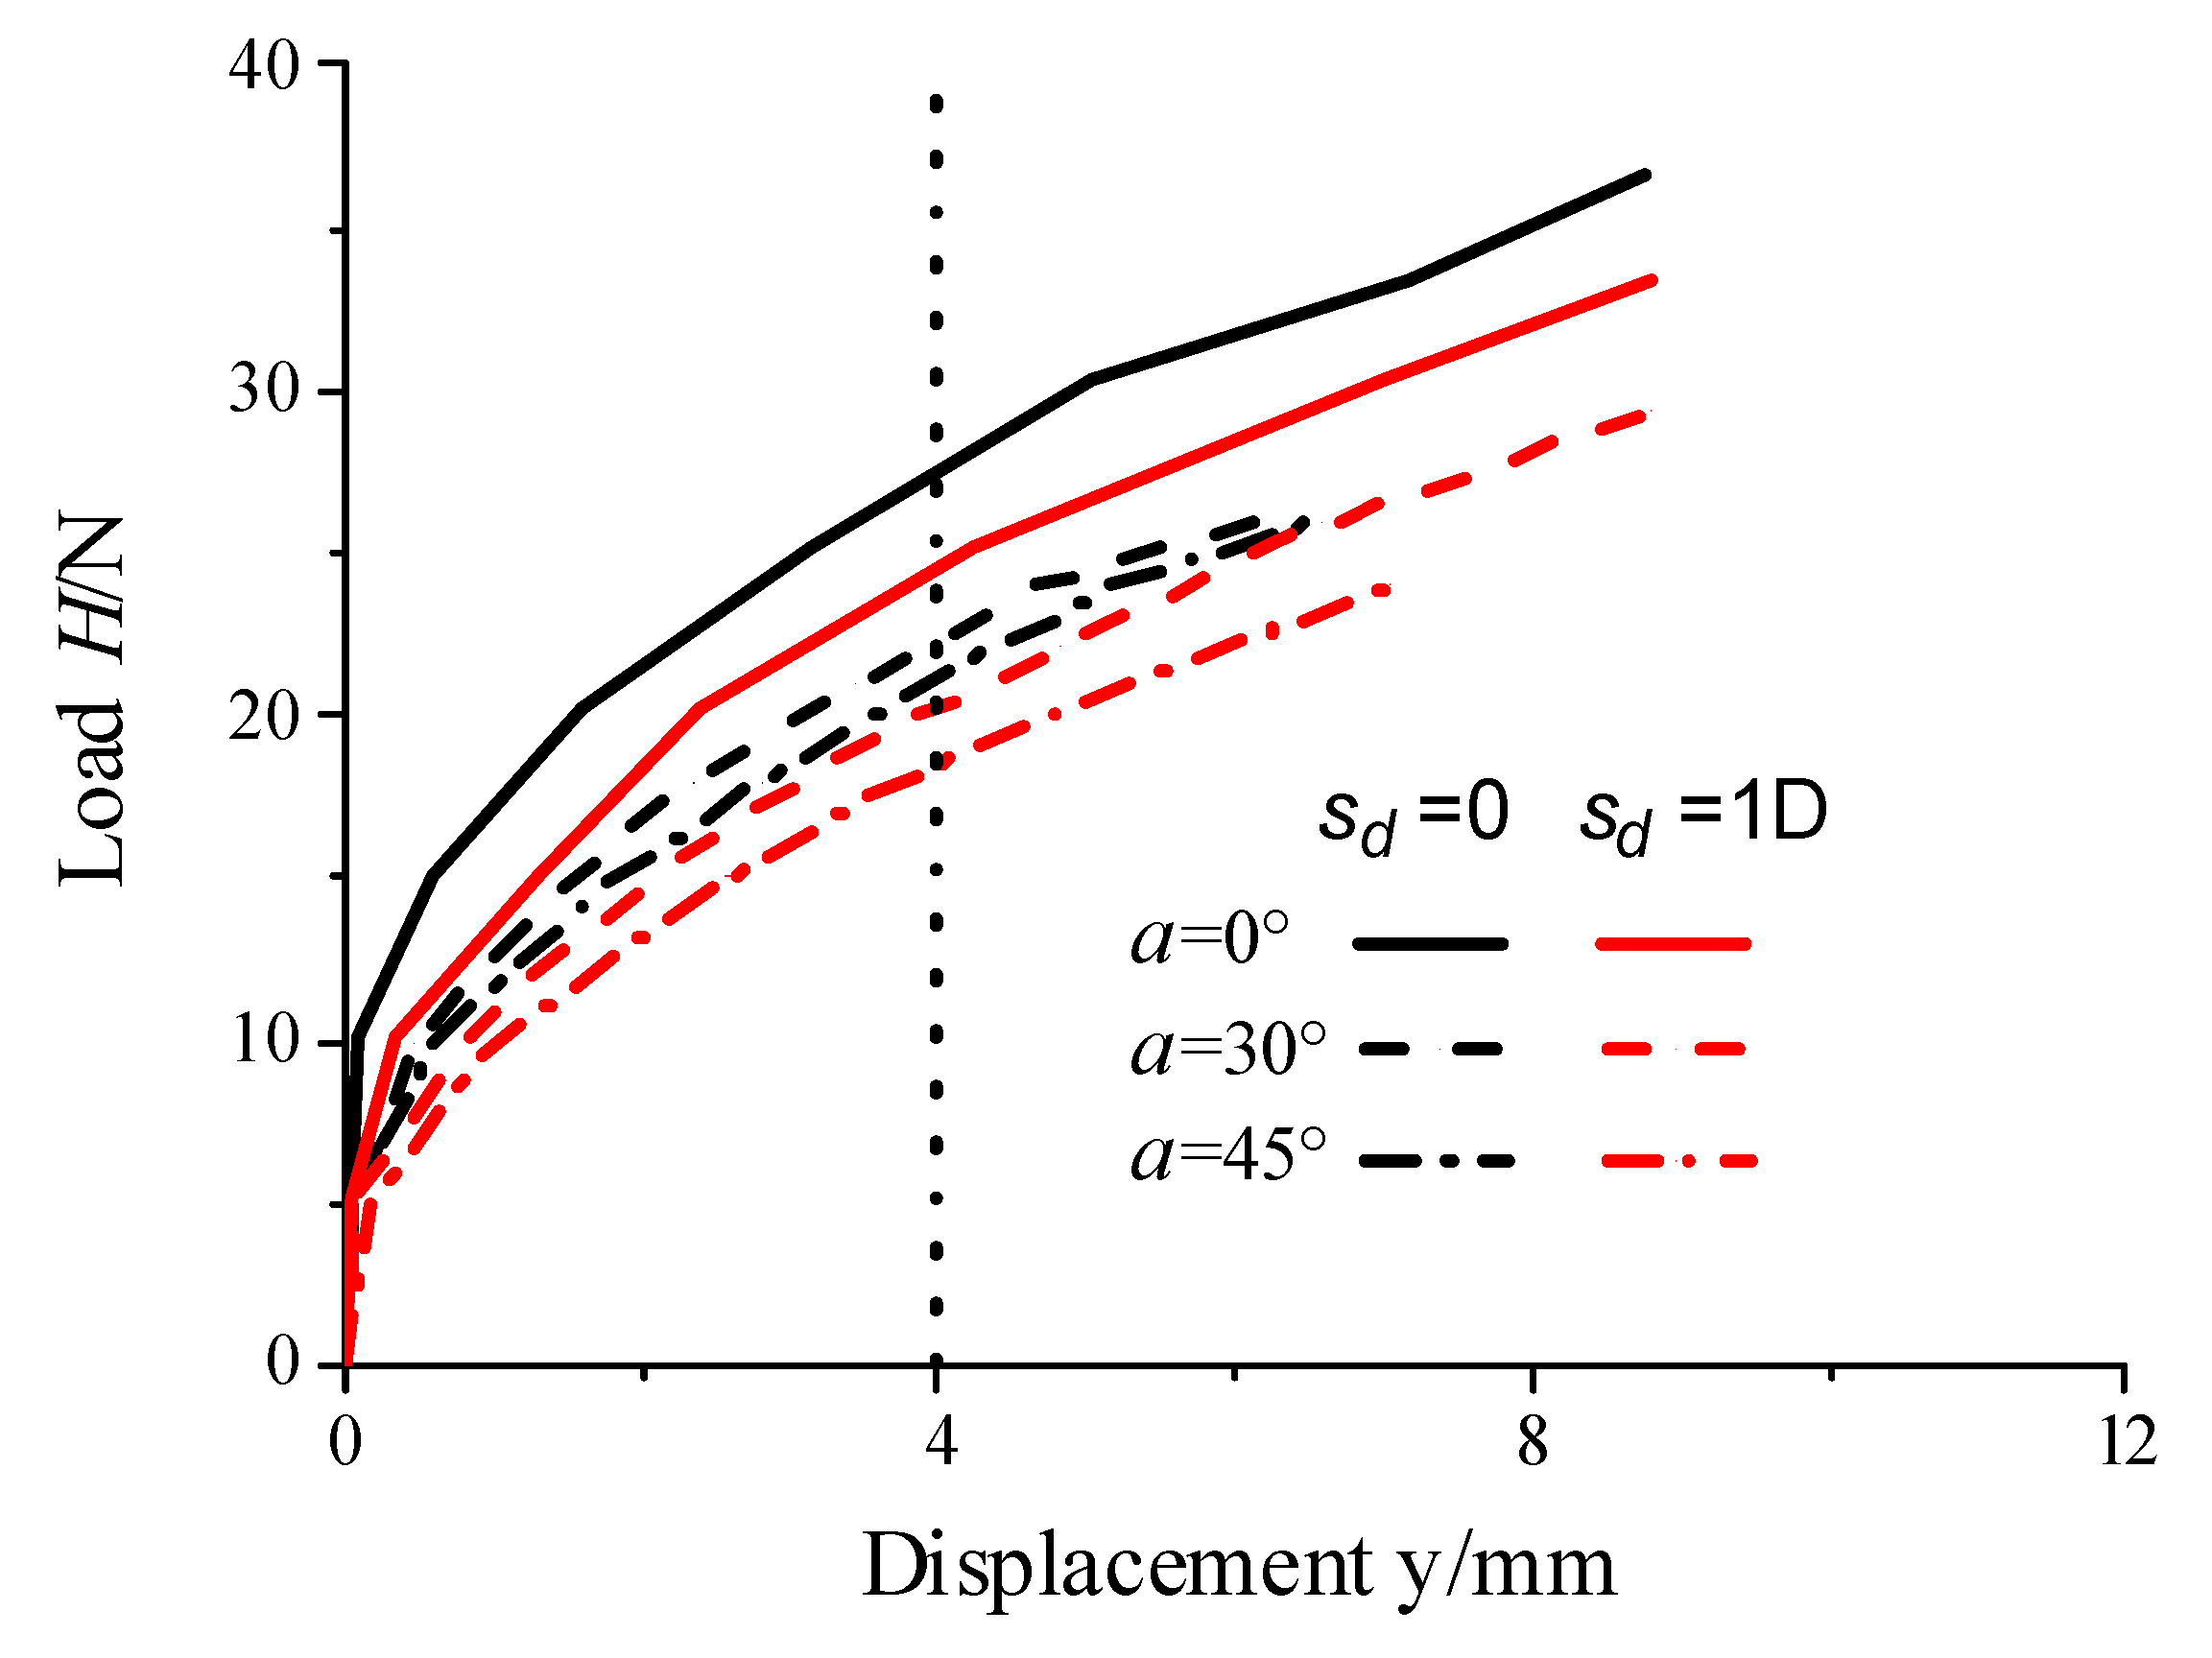
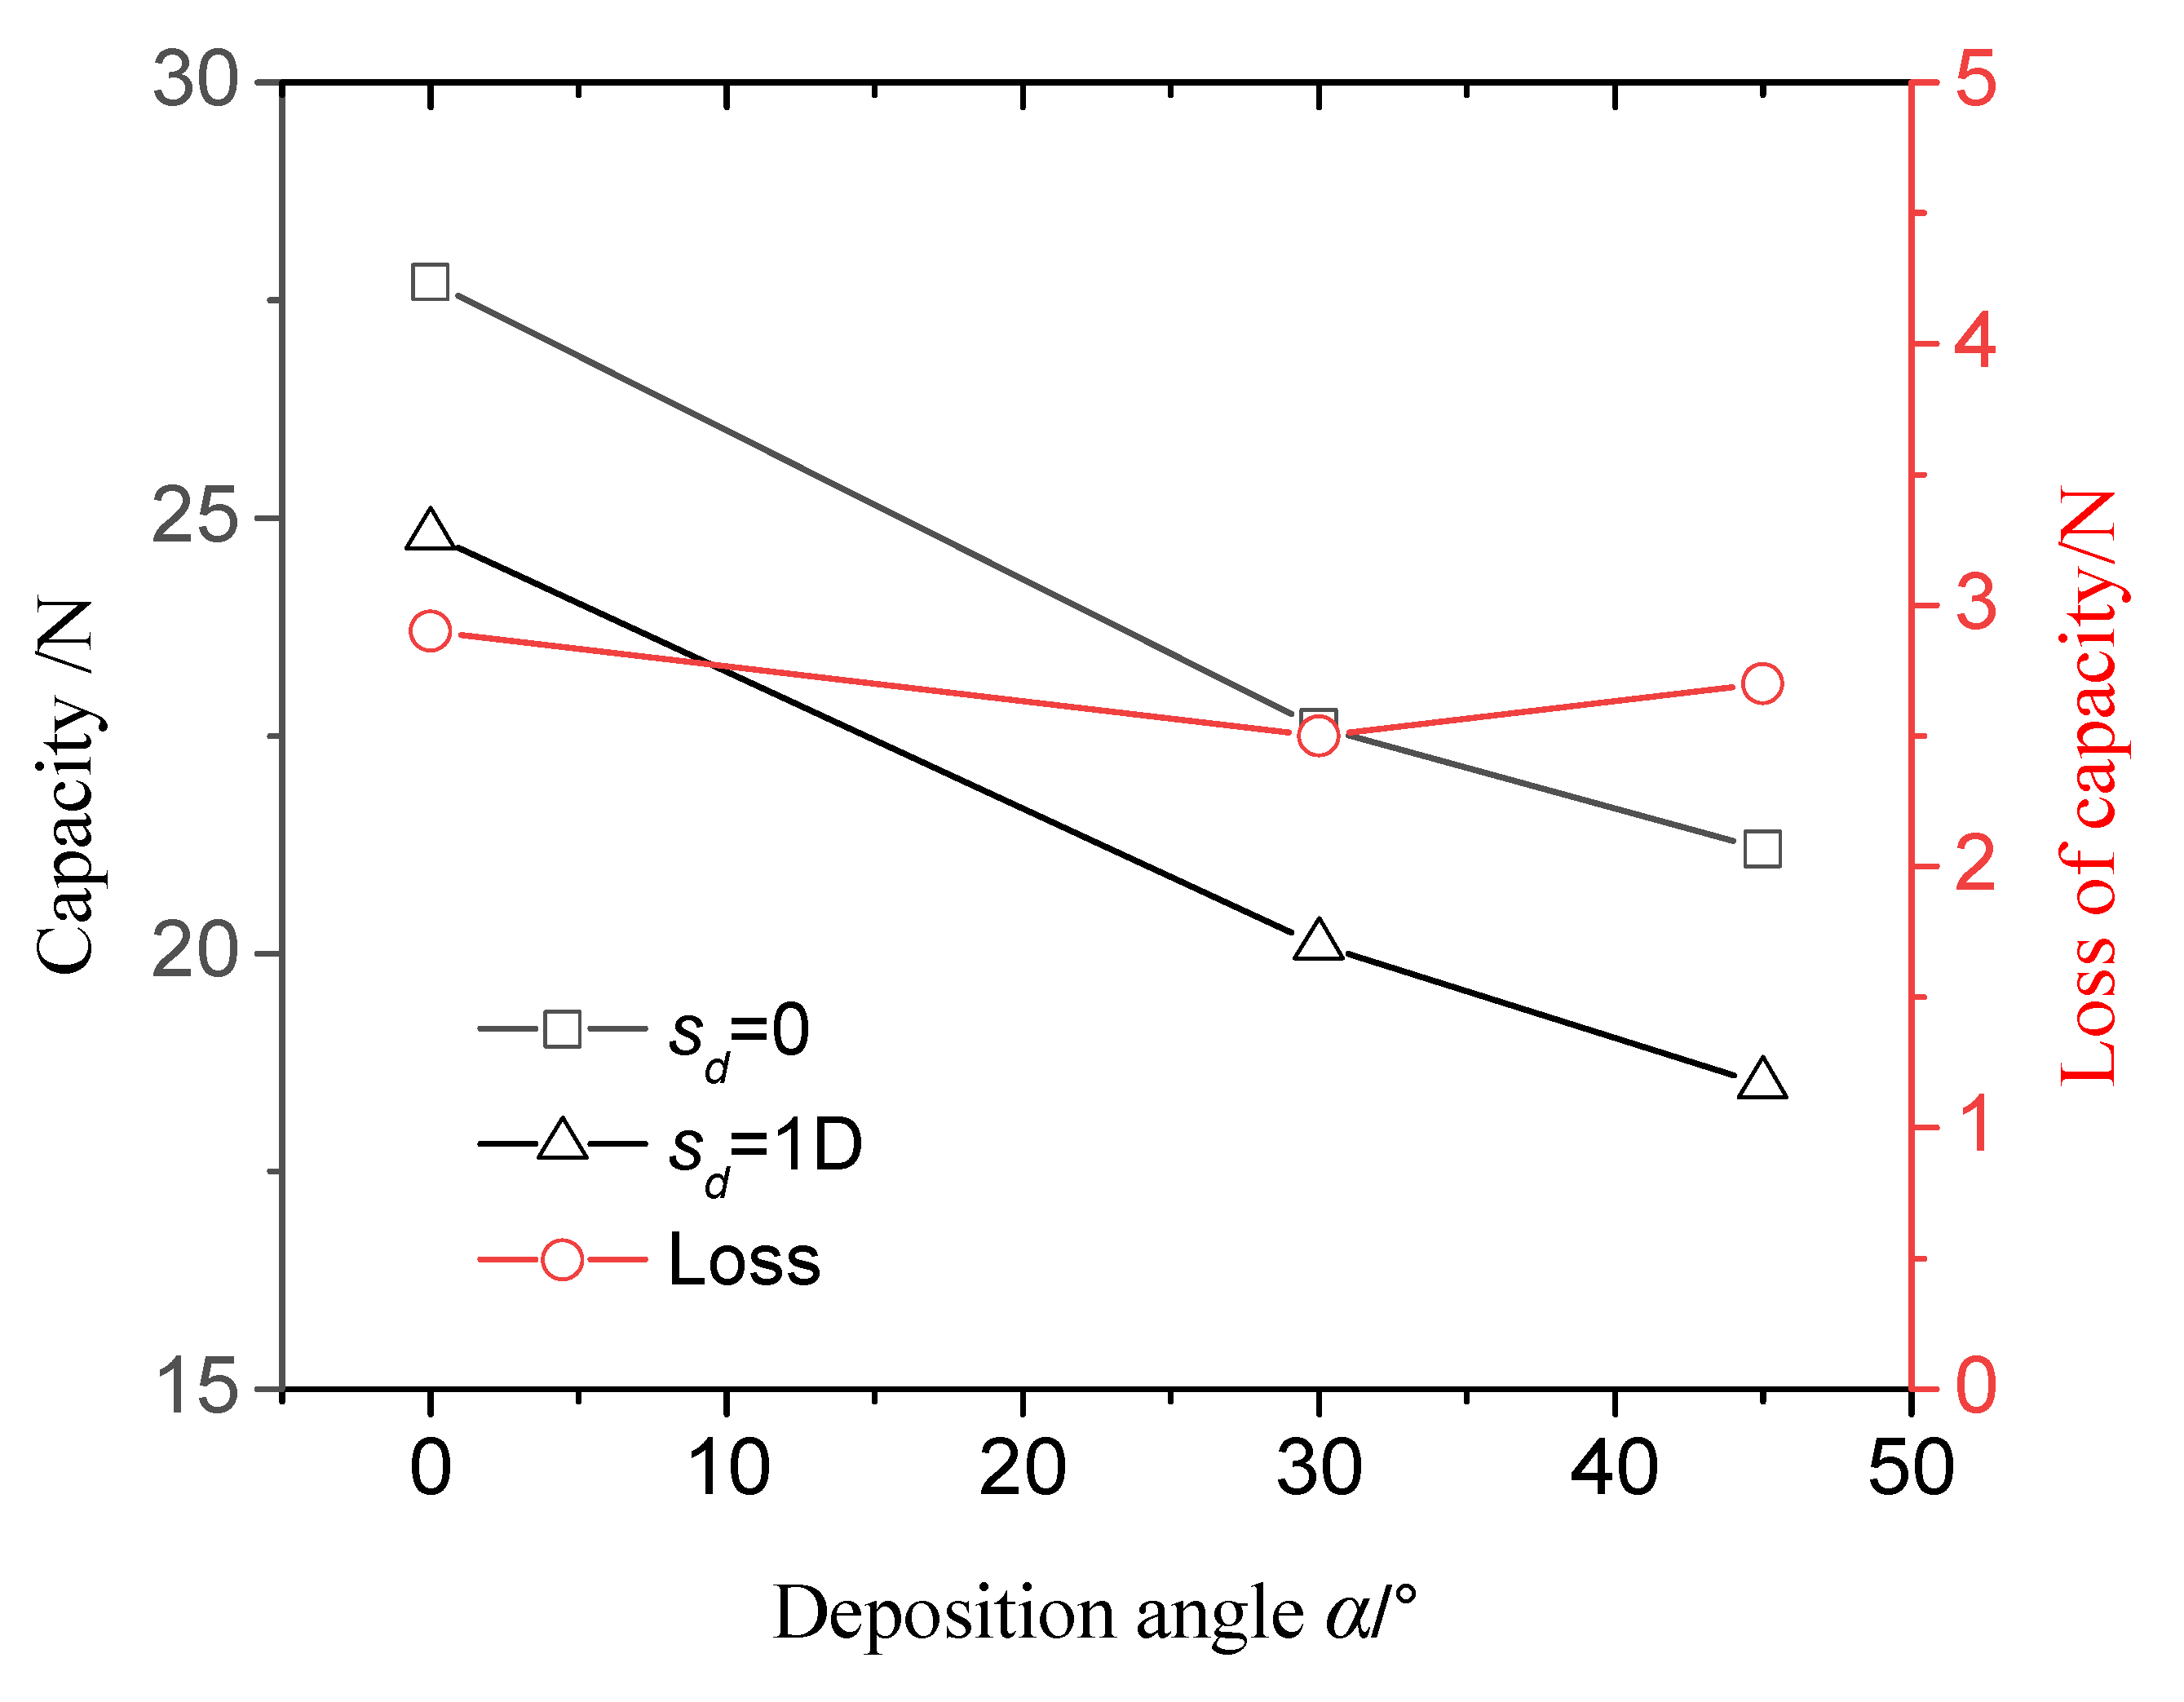
3.1. Monotonic Test Results

Figure 10 shows the load–displacement responses measured from all monotonic tests. The ultimate lateral capacity P u is taken as the load corresponding to a pile head displacement of 0.1 D [7,29]. The six ultimate capacities are shown in Figure 11. As seen, both the stiffness and the ultimate capacity are greatly influenced by the deposition angle of sand and scouring. An increase in the deposition angle for sand around the pile reduced the stiffness and lateral capacity of the loaded pile, for both scoured and un-scoured conditions. The effect of scour depth with s d = 1 D is also represented by a decrease in the stiffness and capacity of the pile compared to the performance of the pile without scouring. In Figure 11, it is interesting to find that the loss of capacity due to scouring, which is the difference in capacity for the two scouring depths, is not obviously altered by the three deposition angles. That is to say, the effects of sand anisotropy on the capacity of the laterally loaded pile can be decoupled from those of scour depth.
According to Azami et al. [30], the comparison of results between model tests and direct shear tests shows that the variation of capacity for a foundation with deposition angle does not follow exactly the tendency of strength variation for element sand. For example, the plain strain test results of Toyoura sand, show a dependency of shear strength on the deposition angles, with the minimum friction angle at the deposition angle in the range of 15°~25° [23] under different confining pressures. The model test by Azami et al. [30] shows a decreasing capacity of shallow foundations with increased deposition angles of 0°, 30°, 45°, and 60°, and then a slight increase for 90°, in which the obvious drop appears between 30° and 60°. Theoretical investigations, including microstructure tensor to simulate the anisotropic strength properties, localized response for the sand around the foundation, and re-arrangement of particles during shear deformation, are implemented to describe the above insistency between the foundation responses as a boundary problem and the element sand. For the experimental study here, it is believed that the chosen deposition angles of 0°, 30°, and 45° are able to exhibit the main mechanical characteristic of the problem. Besides, additional experiment research with a 90° deposition angle may be needed to facilitate the theoretical study of the static pile–sand interaction considering the anisotropy of sand.
It should also be noted that all subsequent studies on the cyclic accumulated displacements of the pile are related to the lateral capacity by normalized cyclic amplitudes. When a monopile embedded in sand is in a working state, a certain pile deflection is used to determine its lateral capacity. The deformation criterion is advised to be consistent with that in practical engineering.

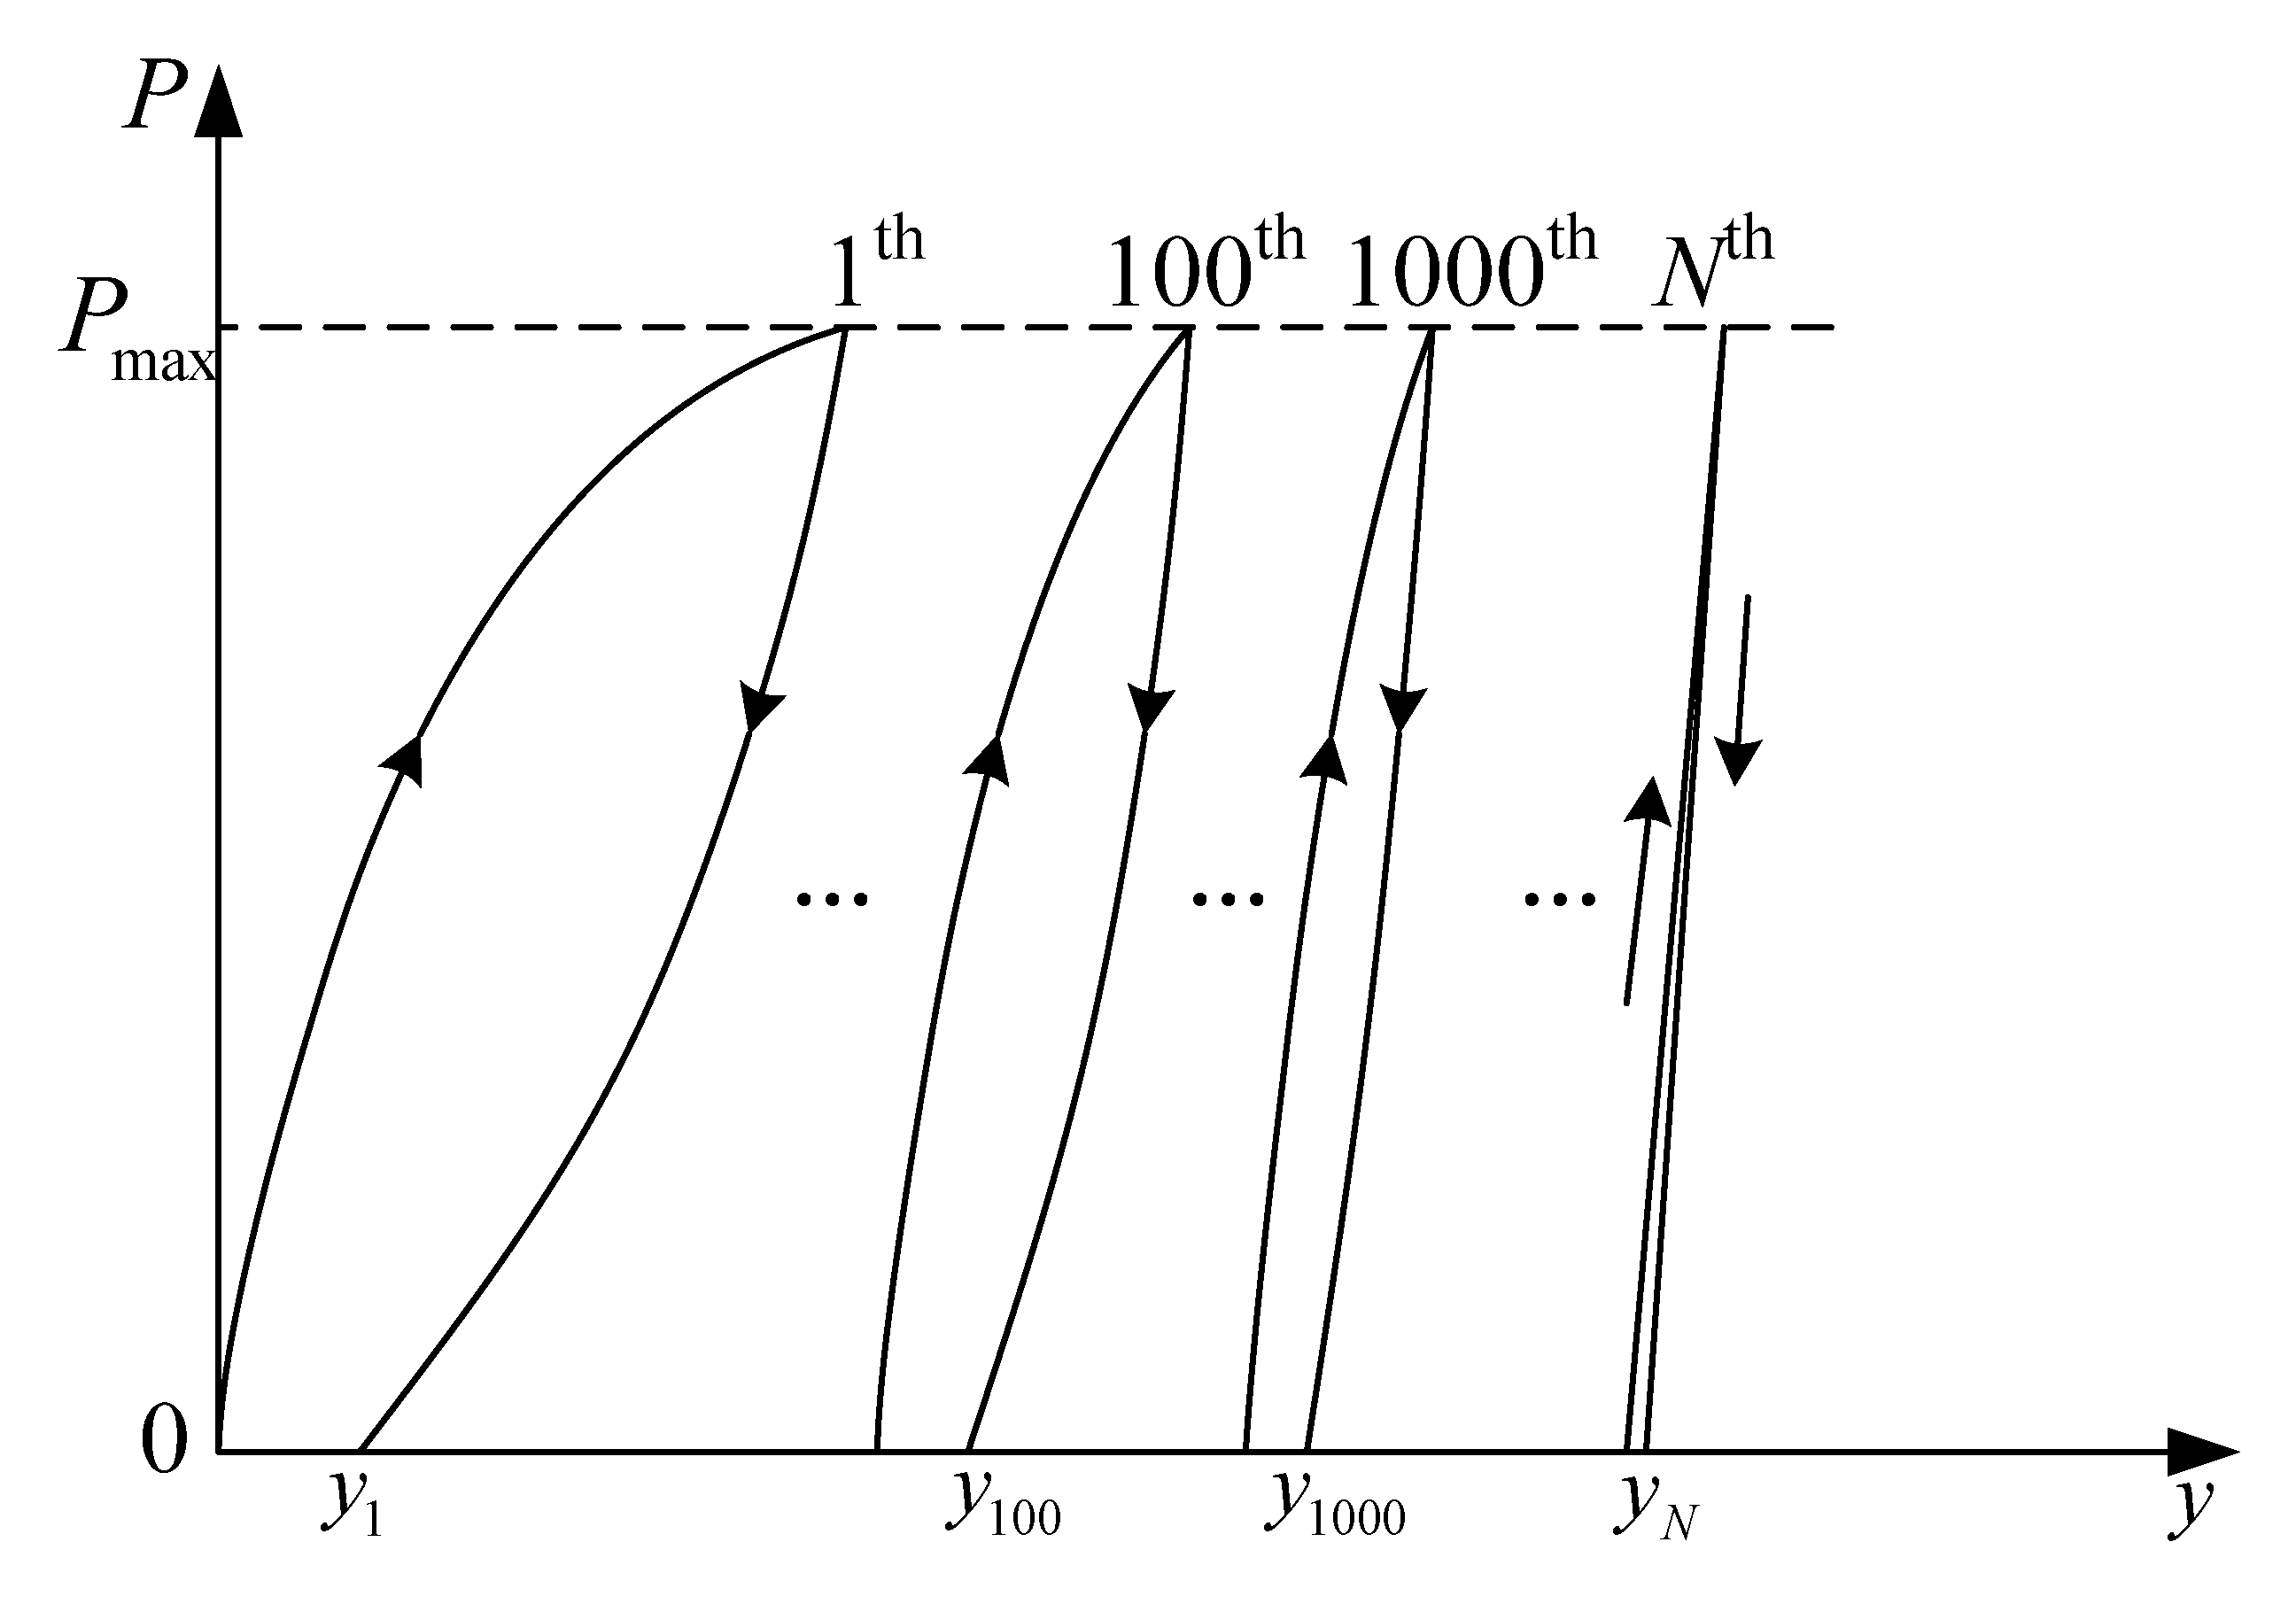
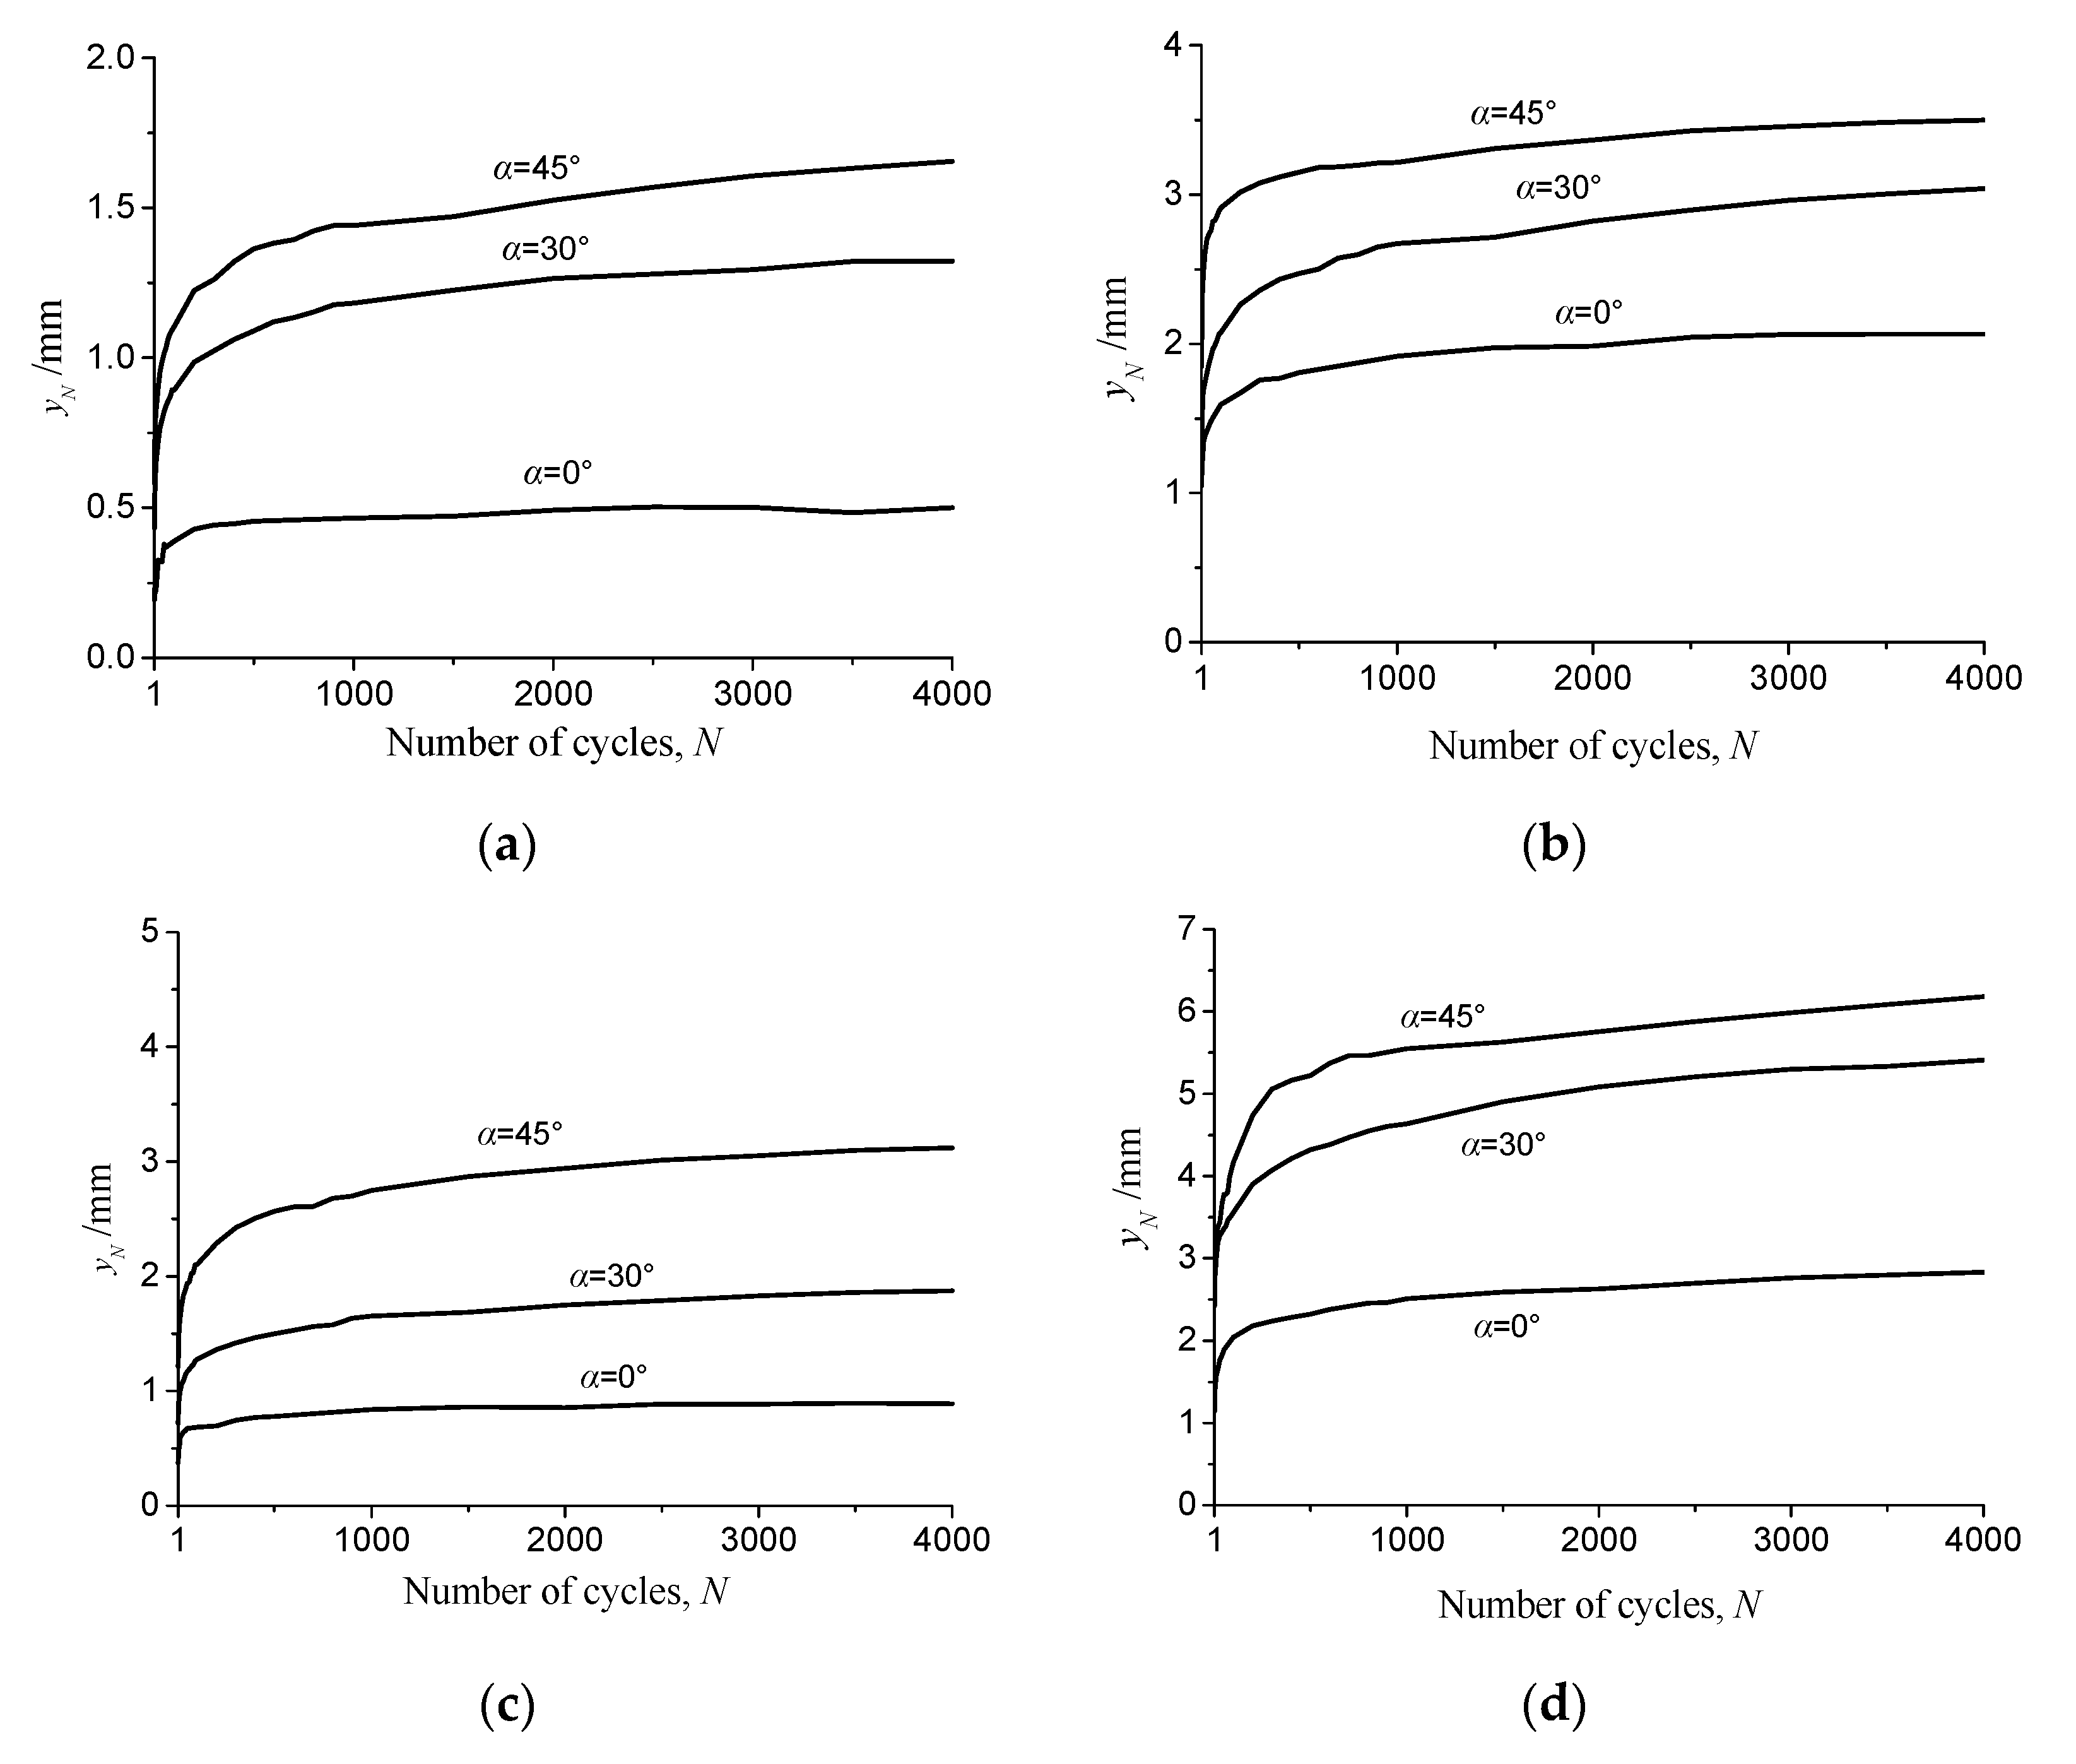
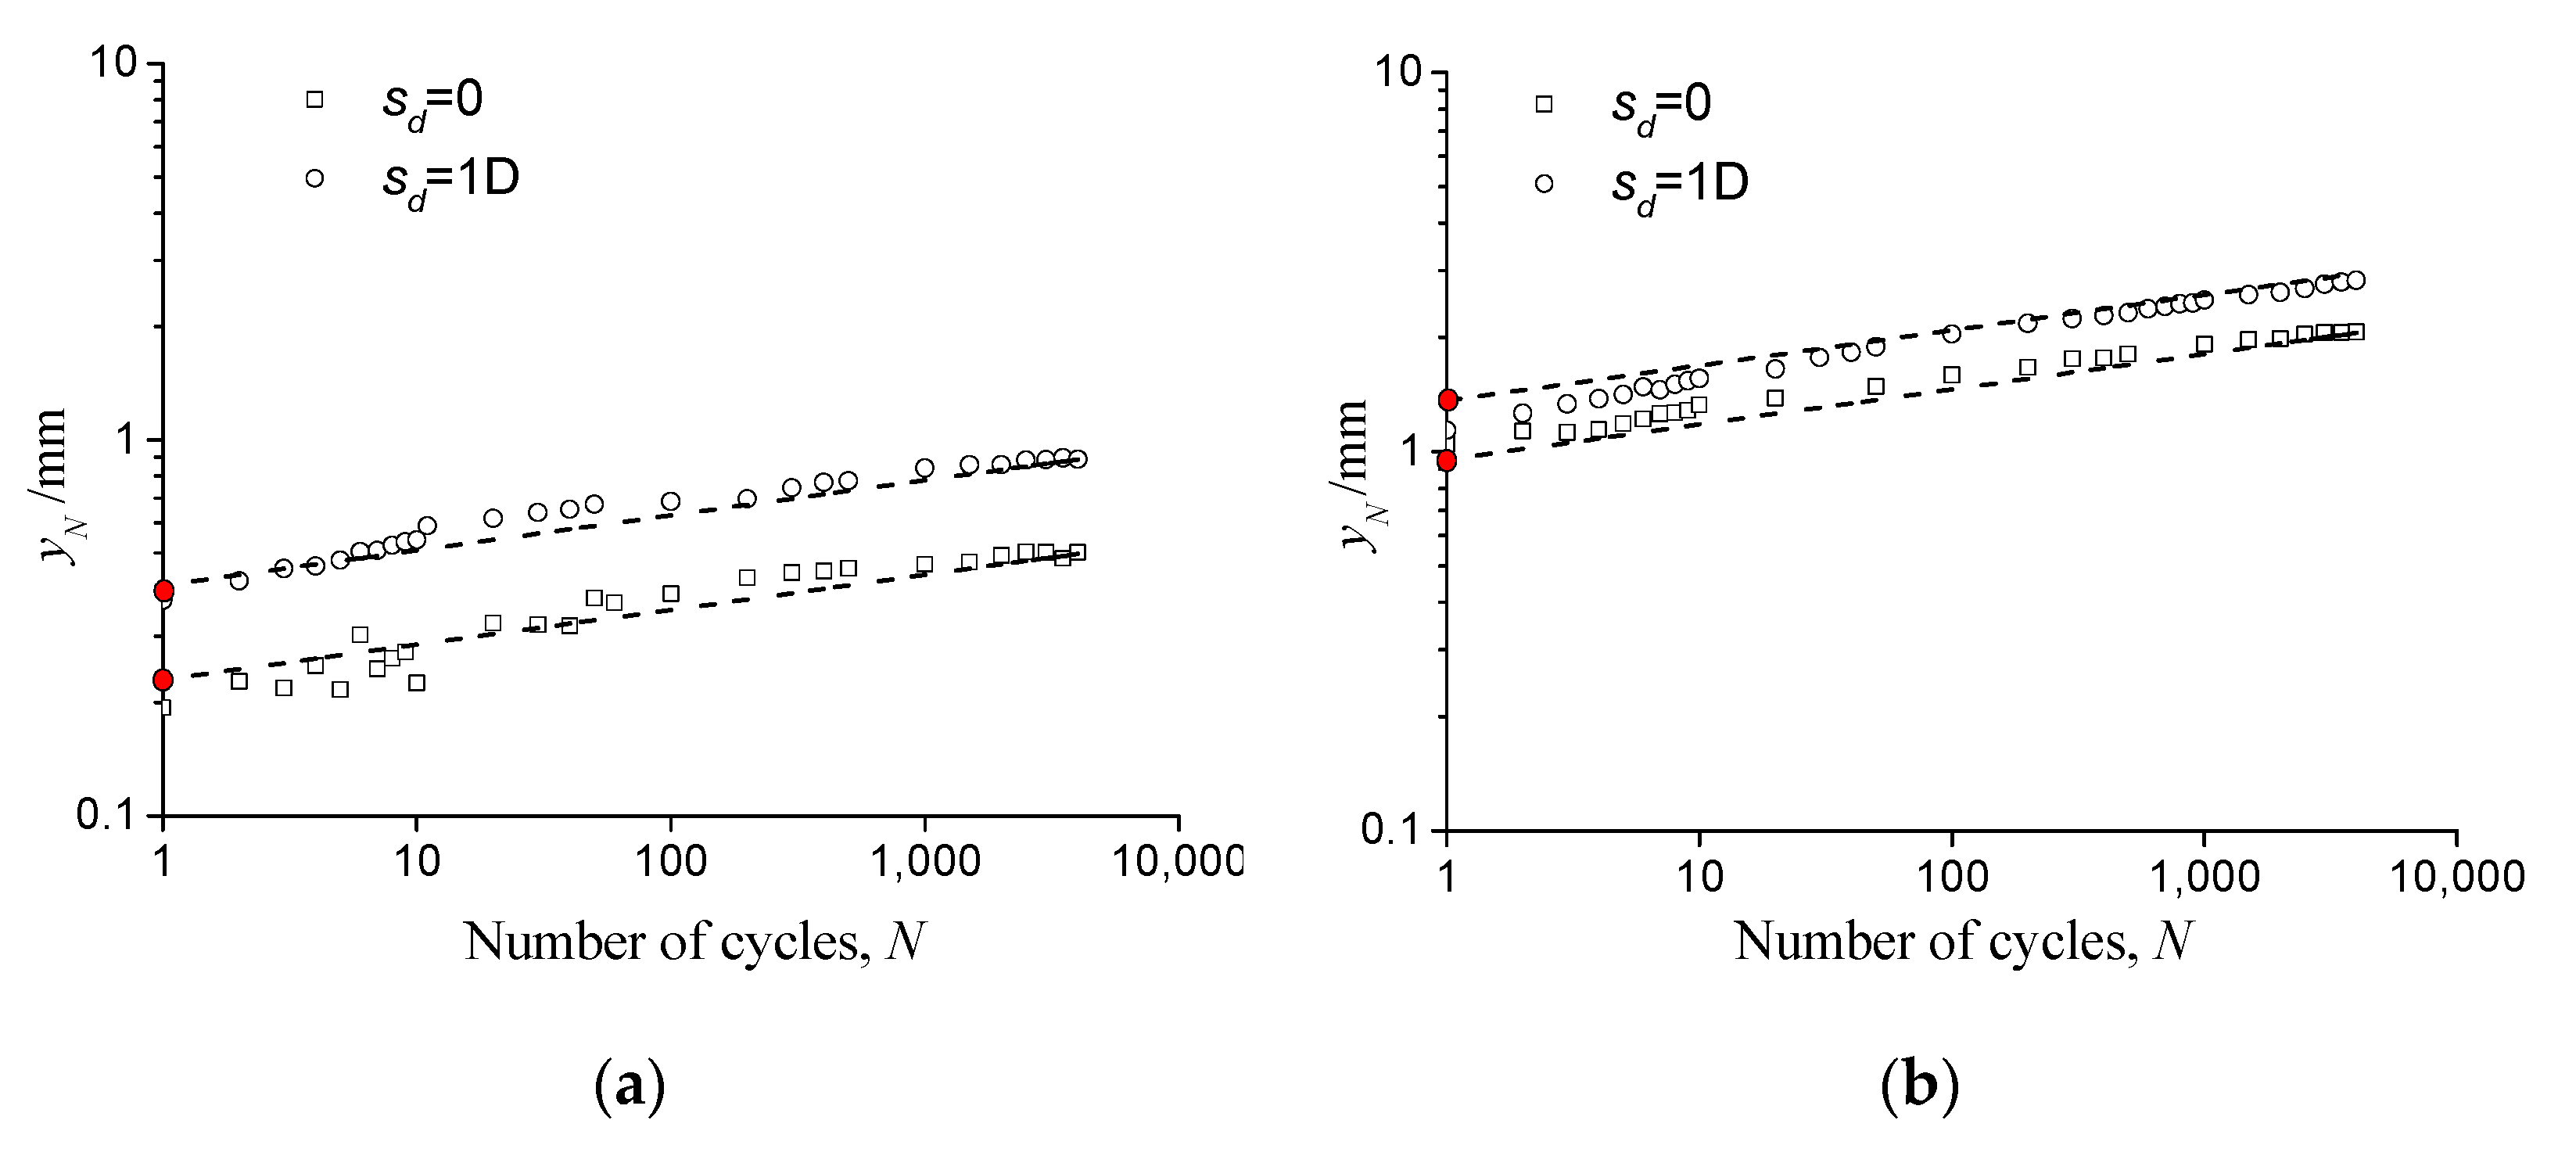
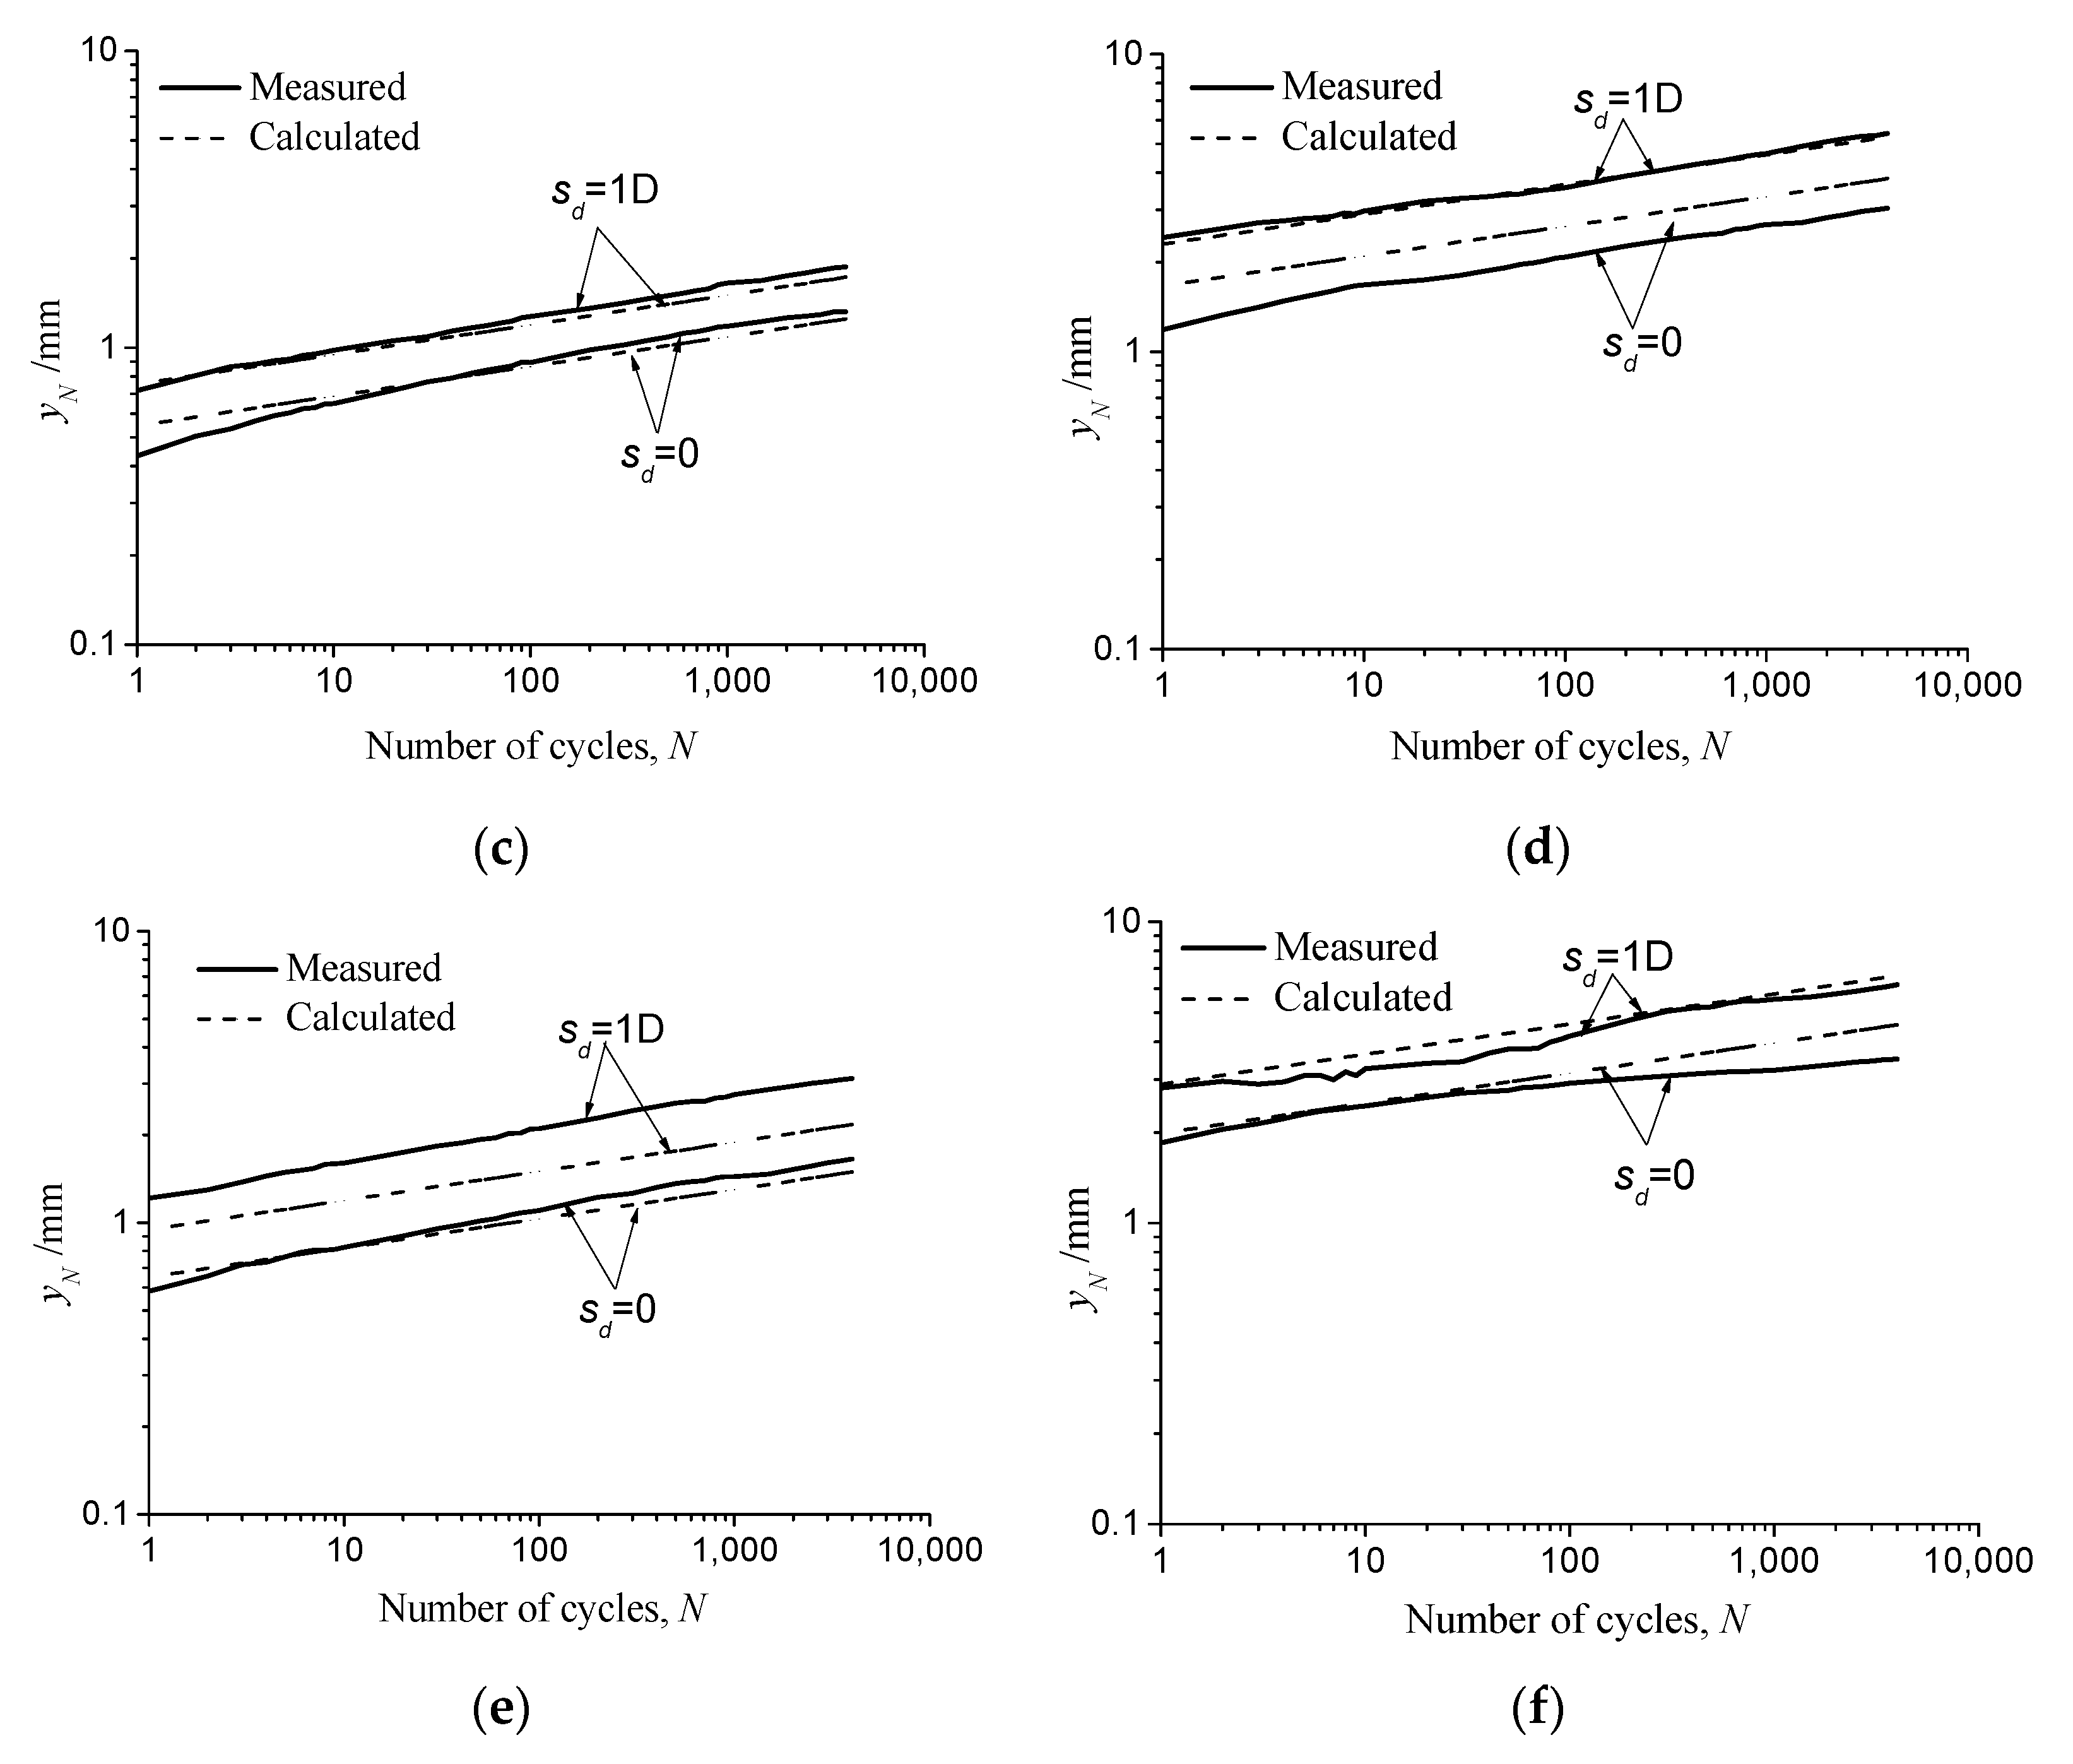
3.2. Cyclic Tests Results of Residual Displacement

The displacement accumulation of the pile under cyclic lateral loads is due to the changed soil properties around the pile. As shown in Figure 12, the accumulated residual displacement y N for cyclic number N is the displacement corresponding to the load value of P m i n after the Nth cycle.
Figure 13 shows the development of residual displacements with cyclic numbers for all cyclic tests. The results are divided into four plots under the two cyclic amplitudes and the two scour depths. It shows that accumulated displacements in the former 500 cycles exhibit rapid increases, which produce 80–91% of the total displacement at the 500th cycle, and then a slow increase for the following cycles. This tendency is consistent with other published model test results, except for the different critical cyclic numbers [29,31]. For each plot, the effects of sand anisotropy are shown as an increase in residual displacements, the difference of which is much larger for the deposition angles of 0°–30° than that of 30°–45°. This demonstrates that the cyclic behavior of a laterally loaded pile is sand anisotropy dependent.
Figure 14 represents the amplification of the accumulated displacements due to increased deposition angle for 4000 cycles, in which the amplification is defined as the ratio of the accumulated displacement for a certain deposition angle to that for α = 0 ° . It is evident that the amplification is deposition angle dependent. The anisotropic effects in terms of the accumulated displacements are more pronounced at smaller cyclic amplitudes for η b = 0.4 than for η b = 0.6 . The effects of scour depth are more complex, which did not give a consistent tendency. The two curves with squares show that for η b = 0.4 , the amplification is larger for s d = 0 , and for the two curves with triangles for η b = 0.6 , the amplification is larger for s d = 1 D .

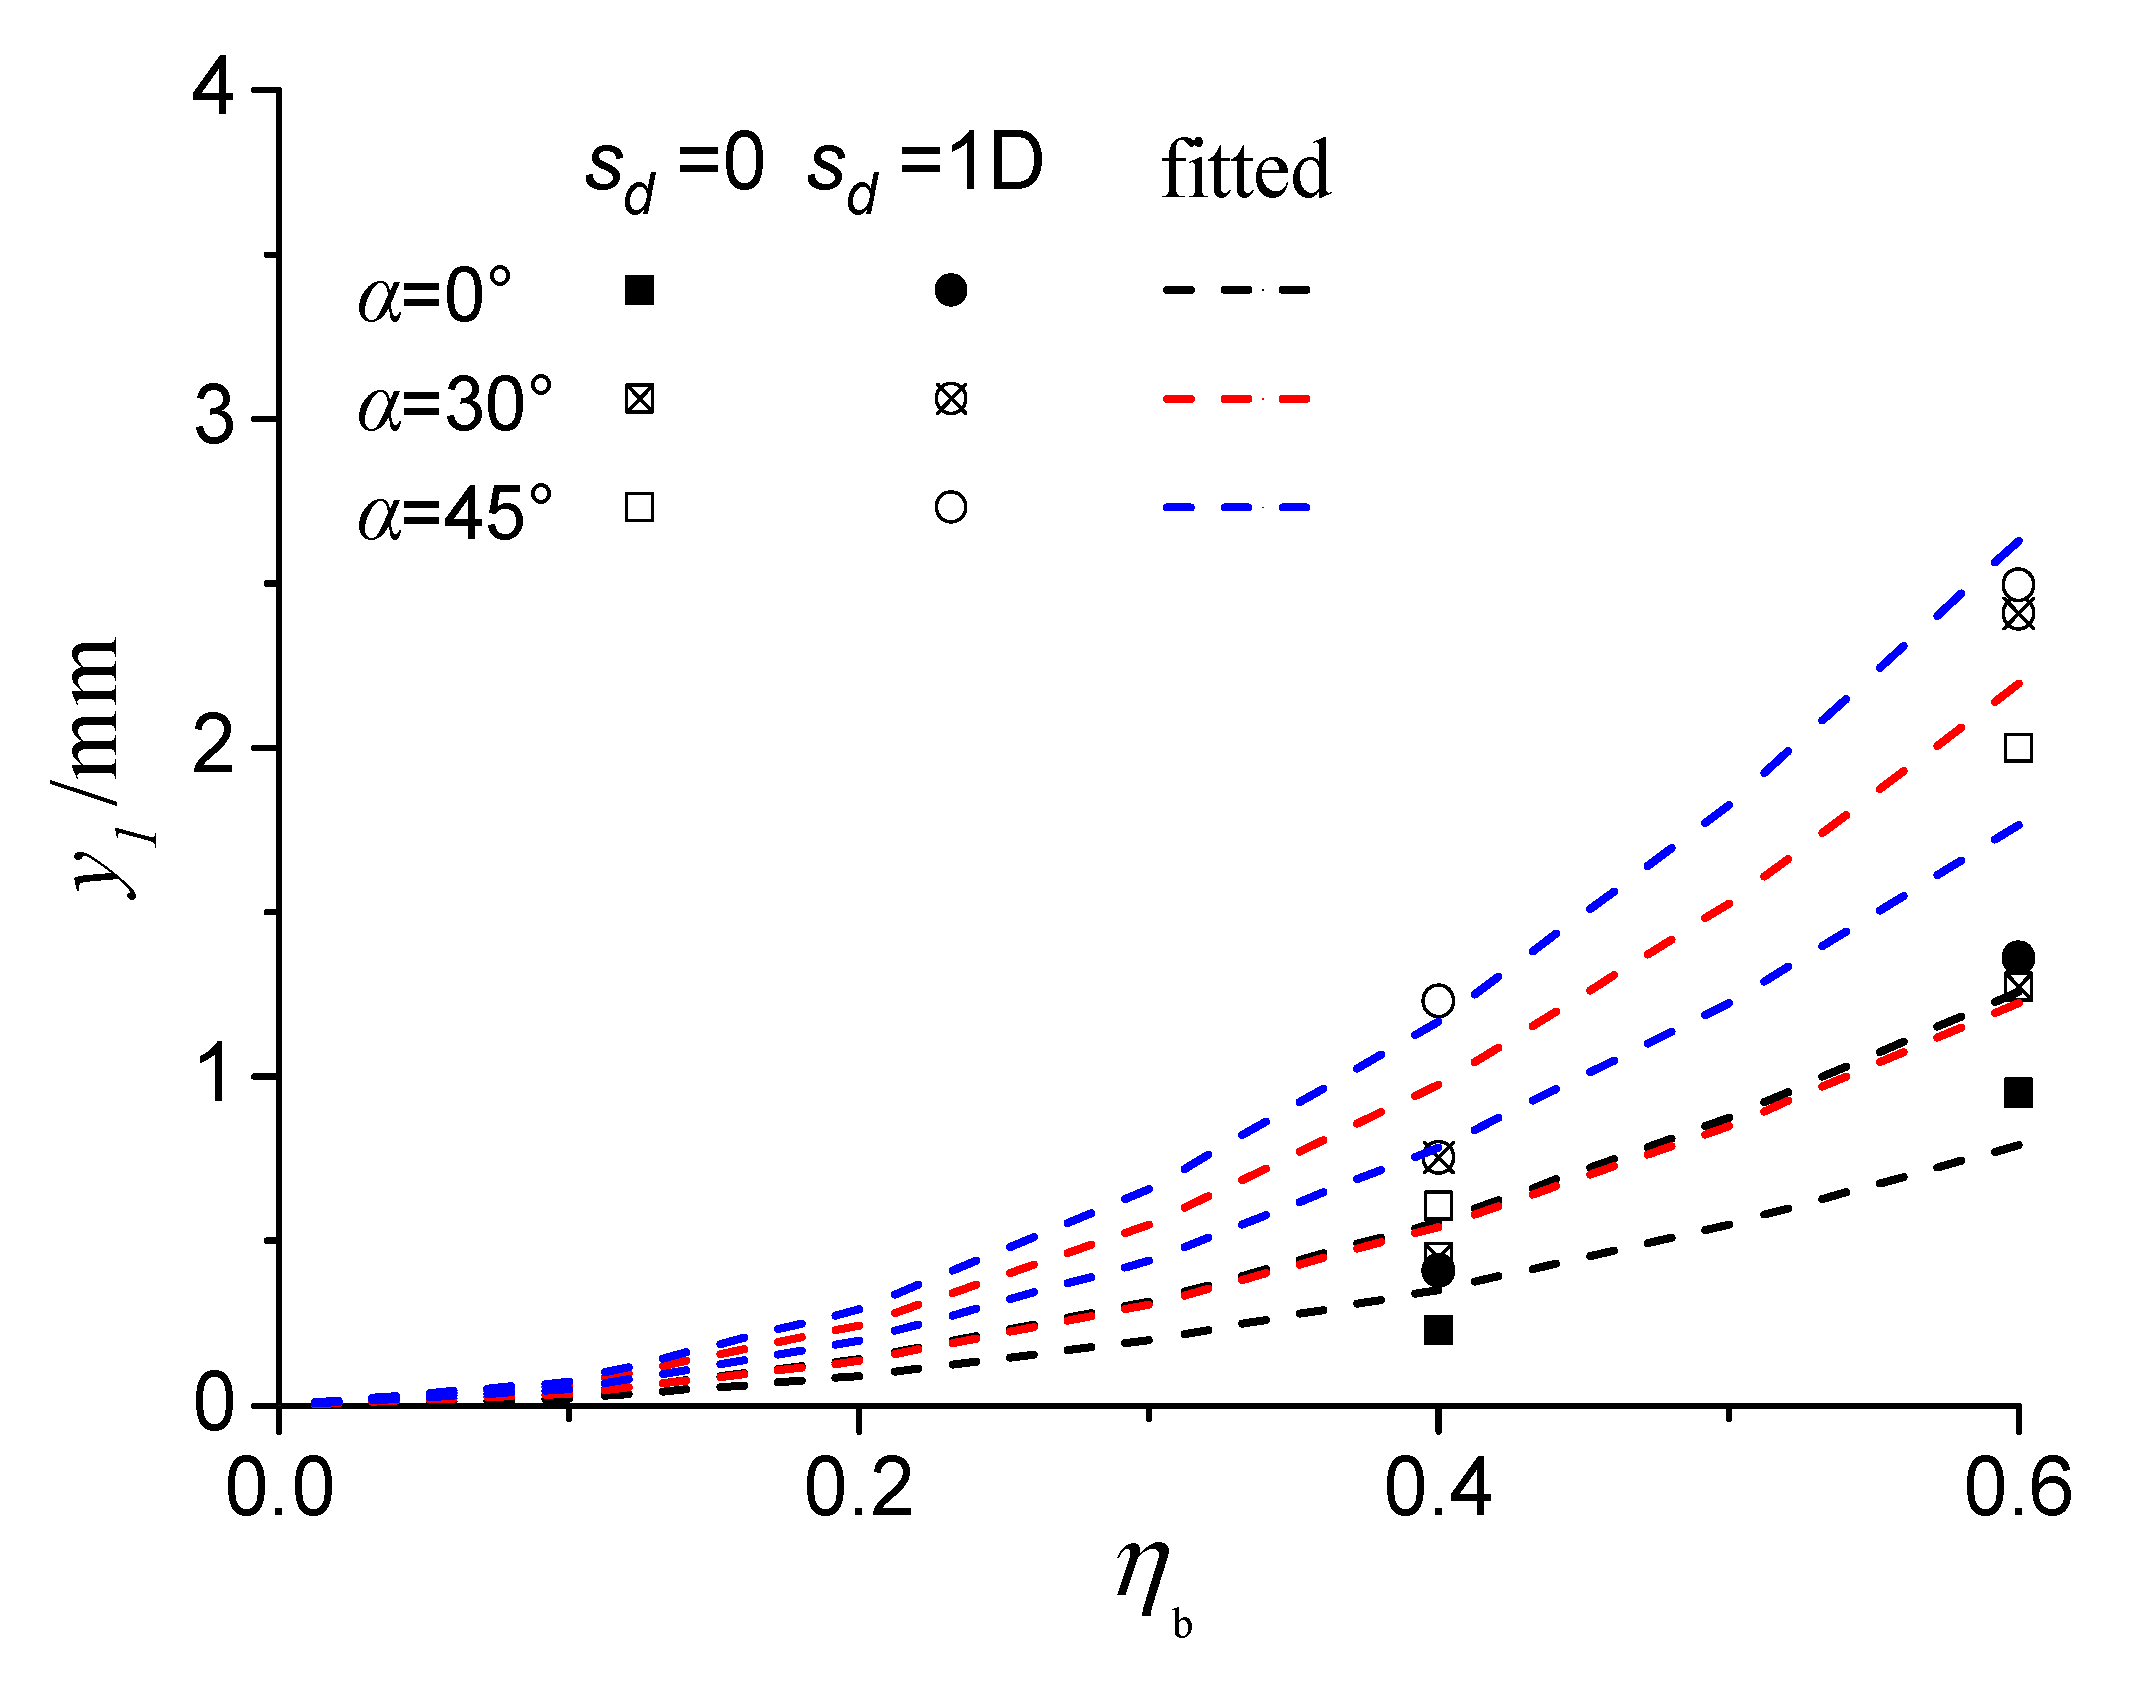
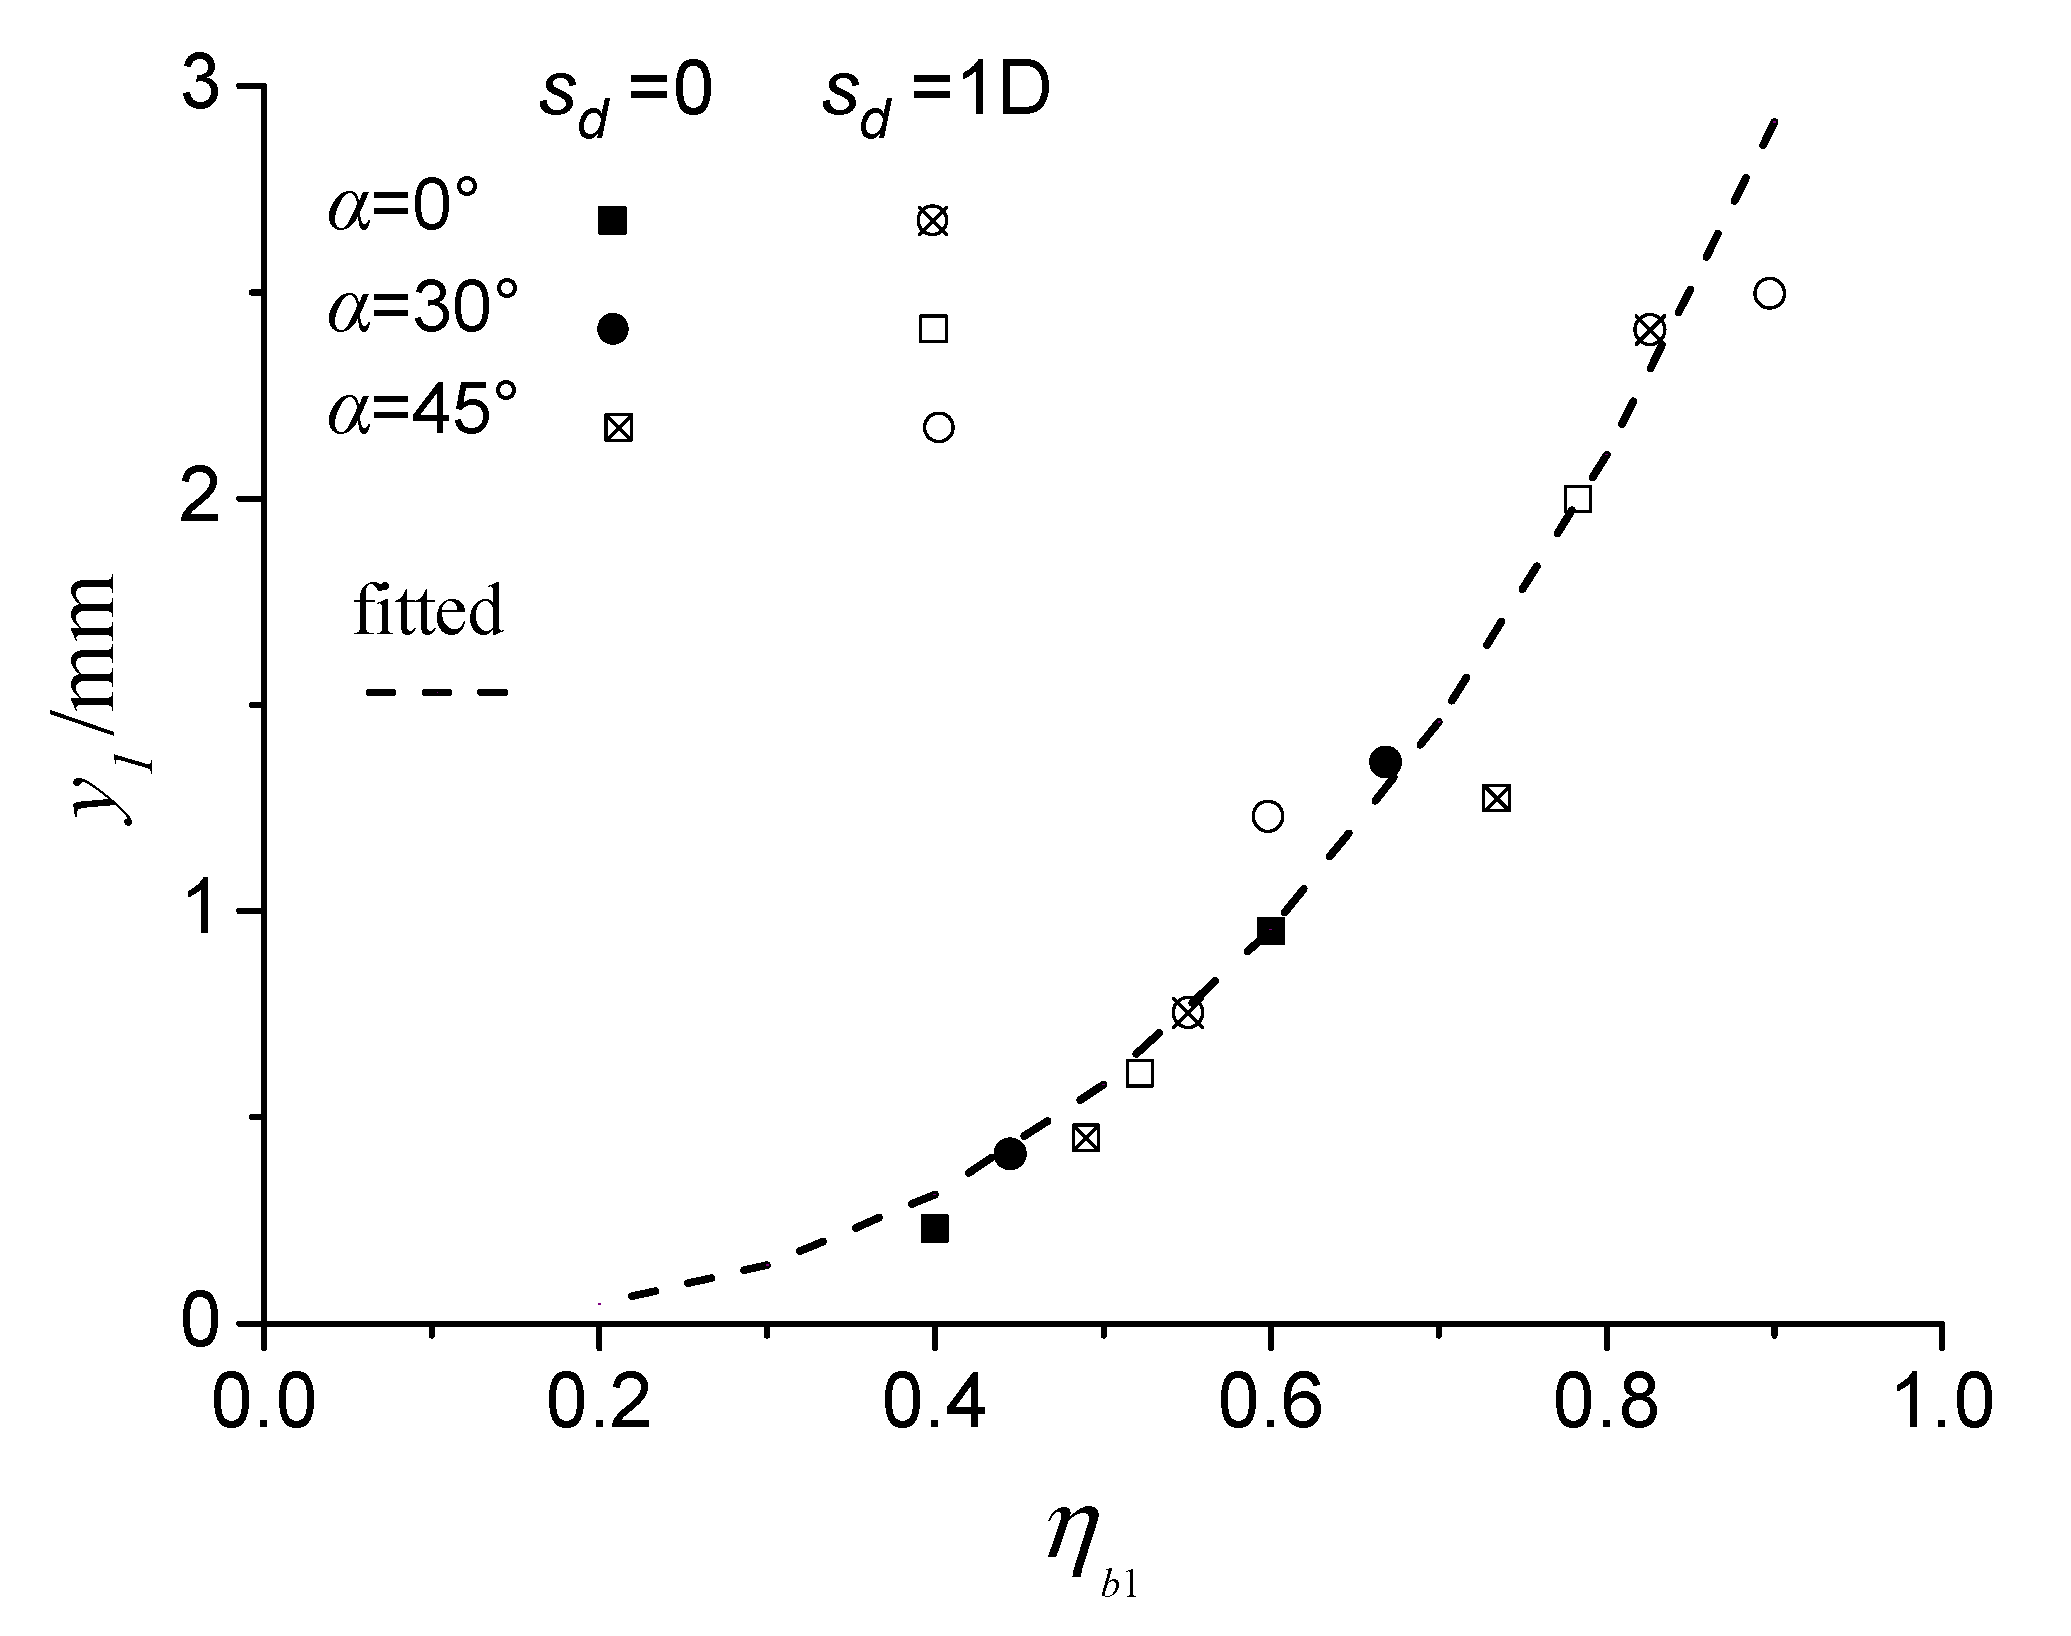
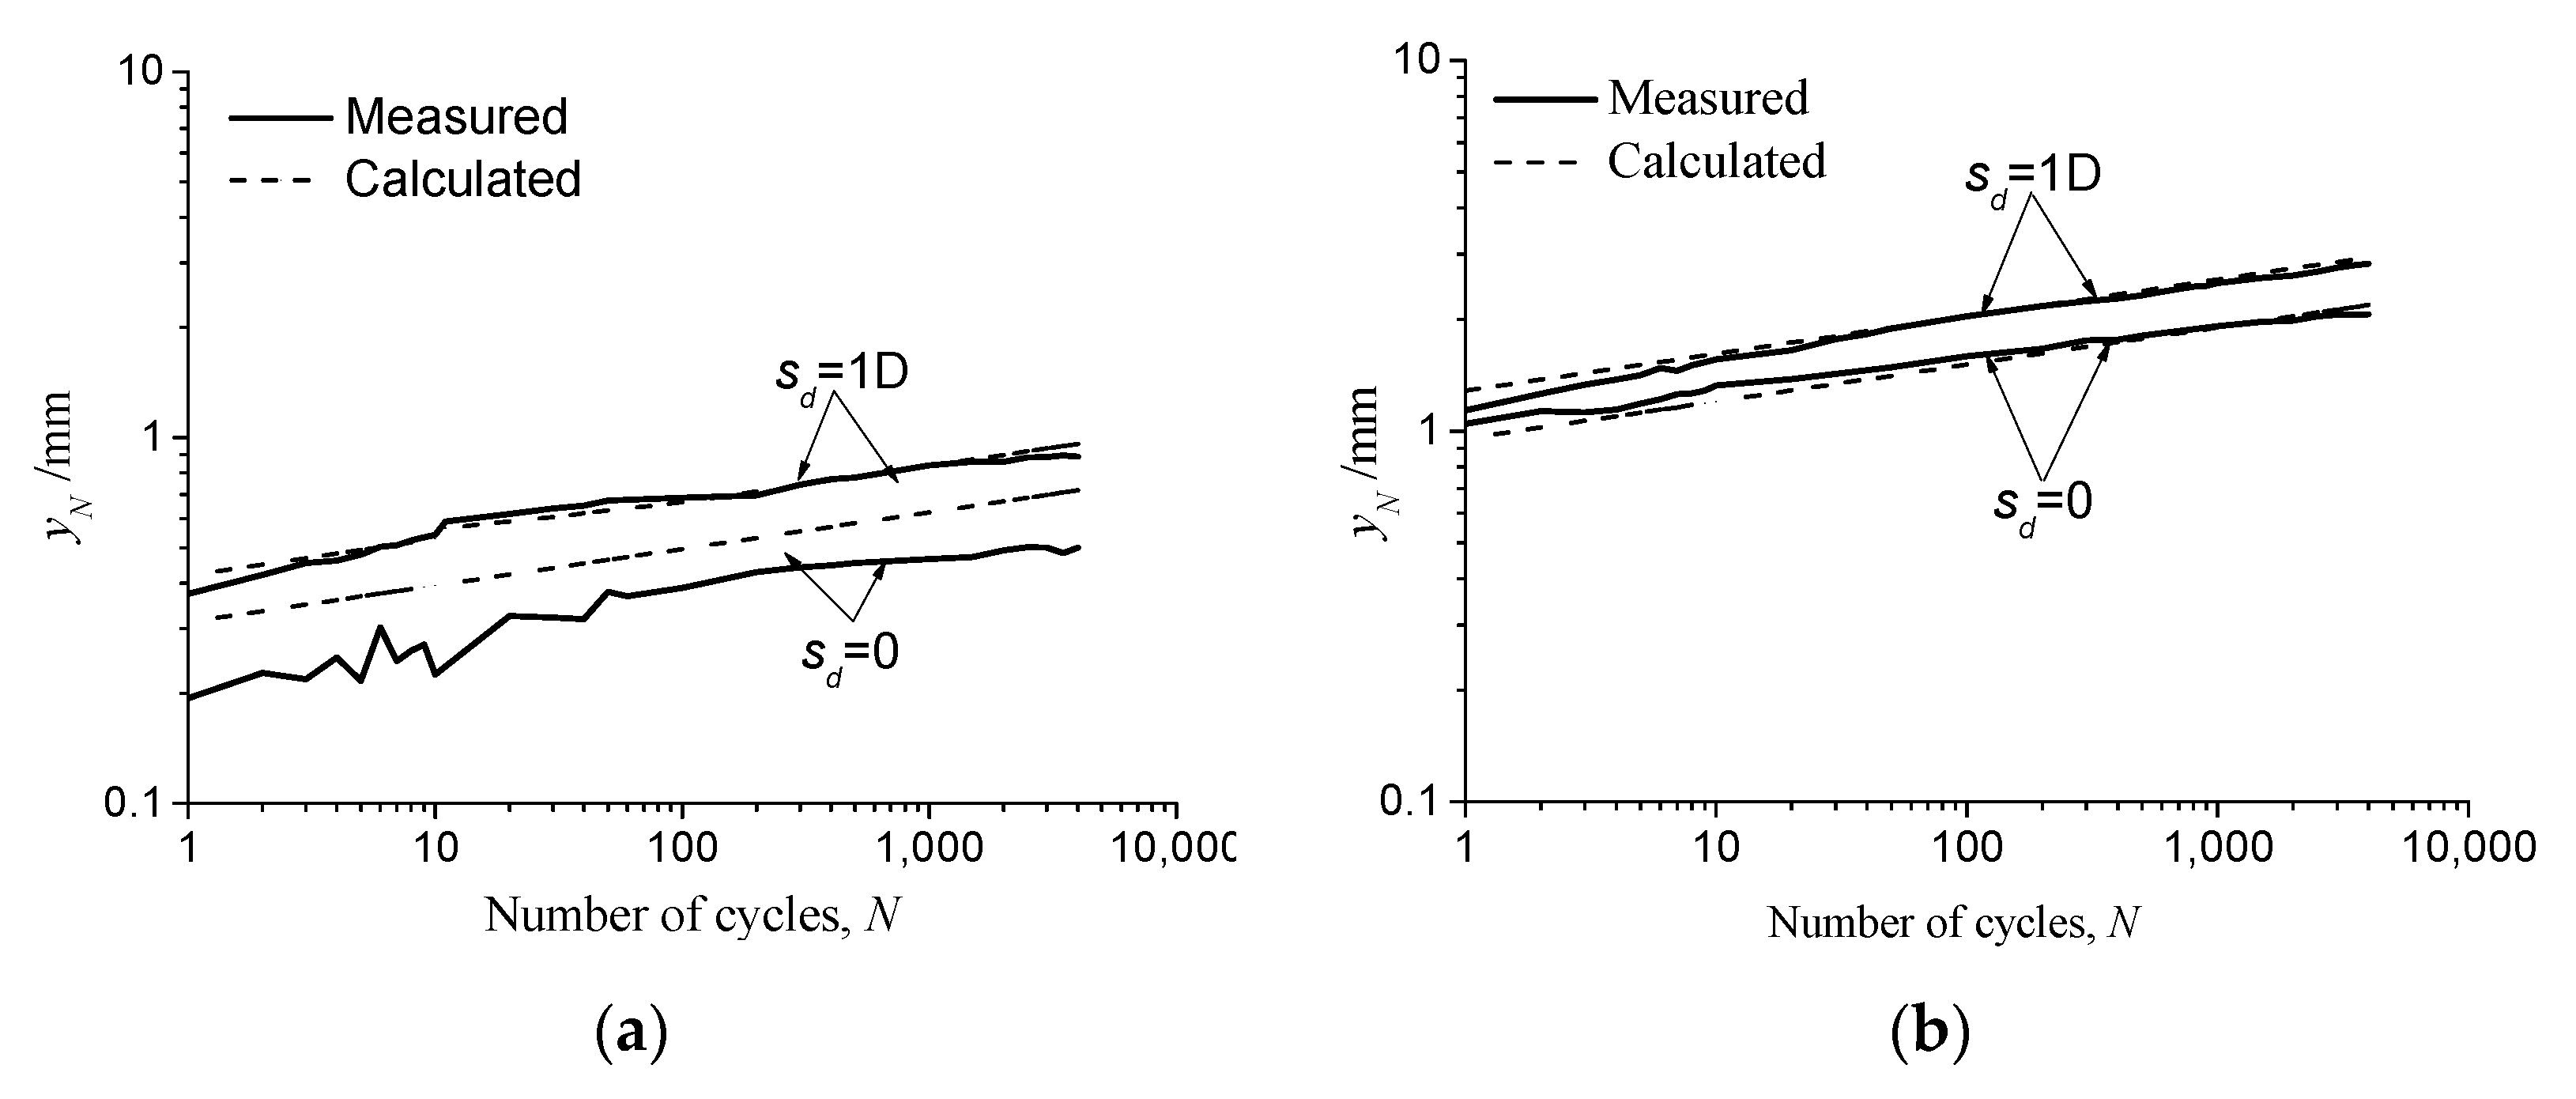
4. Analysis of Accumulated Residual Displacements

The following work presents a regression analysis of the model test results on the accumulated residual displacements, where factors of soil deposition angles, cyclic load amplitudes, and scouring are incorporated. The regression analysis on the long-term evolution of pile responses usually presents the following two expressions: one is the variable cyclic number N as a function of ln (N), and the other is N in an exponential function [7,8,28,29]. According to Leblanc et al. [28], for large cyclic numbers n > 500, the extrapolation in the regression analysis with ln (N) will underestimate the long-term accumulated displacements. In contrast, the exponential function can give a good fit, which is expressed as:
y N = y 1 N α s
in which the exponent   α s is a parameter. Figure 15 shows the accumulated residual displacement evolution for different deposition angles in a ratio of y N / y 1 versus cyclic numbers in double logarithmic axes. By definition, the slope in the plots relates to the value of   α s . As shown in Figure 15, the values of the three fitted exponent   α s for different deposition angles are close to each other. Therefore, it is advised as a constant of 0.1 for all cyclic tests here.
As a constant   α s is advised for Equation (3), the effects of different cyclic amplitudes, scour depths, and deposition angles on the residual displacements at the pile head can be ascribed to the value of y 1 , which is the residual displacement for the first cycle. It is explained that y 1 here is the intercept value obtained from the fitted lines, not the test results, to avoid random errors. The example y 1 (see the position of the red circle) in double logarithmic axes is shown in Figure 16.
Following the regular practice for the experimental analysis of the accumulated displacement of a pile under cyclic loading [8,31], the relationship between the value of y 1 and the normalized cyclic amplitude η b is given in Figure 17. It shows that the test results are divided into six groups, for the combination of two scour depths and three soil deposition angles. Test results for monotonic loading in Figure 11 present the capacity loss of the laterally loaded pile due to sand anisotropy and scouring, which means that the current definition of η b did not give a rational expression of the relative amplitude of the cyclic load, for the used capacity corresponding to a loaded pile in homogeneous sand and without scouring. Thereafter, a tentative attempt to modify the relative cyclic amplitude η b is performed, in which the cyclic amplitude is normalized by the pile capacity p u , s c _ a n , considering the effects of soil deposition angle and scouring. The expression of the modified normalized cyclic amplitude η b 1 is given as:
η b 1 = p m a x p u , s c _ a n = η b · p u p u , s c _ a n
The normalized cyclic amplitude with post-scour capacity is used by Achmus et al. [22] in a numerical study, and it is also validated by authors in model tests to consider the effects of scouring on the accumulated pile displacements [32]. However, the effects of soil deposition angles are not included.
The results of y 1 with the modified normalized cyclic amplitude η b 1 are given in Figure 18. It shows an obvious consistency of all data points in one curve, which manifests that the modification of the normalized cyclic amplitude is a rational measure to assess the effects of sand anisotropy and scouring on the accumulated pile displacement. The fitted exponential function, shown in Figure 18 as a dashed line, can be determined as:
y 1 = 3.892 η b 1 2.75
Based on Figure 18, together with Equations (3) and (5), the lateral residual displacements of a pile due to cyclic loads can be predicted, in which the factors of soil deposition angle, cyclic amplitude, and scour depth are considered.
Figure 19 shows the comparisons of the measured displacements with the calculated results, which present the application of the regression analysis in this section. As seen, the agreement between the measured and calculated data is acceptable.

Discussion

This study only conducts some preliminary work about the effects of soil anisotropy and scouring on the long-term lateral displacement responses of monopiles. The following limits demand the application with caution.
The maximum cyclic number is 4000 in the tests. However, in practical engineering, the cyclic numbers are usually up to 108 during the lifetime. Typical work with more cycles is worthwhile, but the time cost is very high.
This study pays attention to uniting the effects of soil deposition angle, cyclic loading characteristics, and scouring on the cyclic behavior of a monopile together. However, it cannot cover all points. The simplifications on the cyclic load pattern are expedient. The problem of two-way cyclic loading, the multi-amplitude cyclic load is advised to be discussed. Besides, the small cyclic load amplitudes should be considered, which demands a higher accuracy of the testing system.
The stress path of the sand around the pile experiences some changes due to scouring, which cannot be realized in 1 g tests. Likewise, in this model test, the mechanical properties of anisotropic sand are related to low gravitational stresses. The factors with detailed scour hole dimensions, such as scour hole slope angle and bottom scour width, are not included. An additional case for the soil deposition angle of 90° is also advised to cover the whole range for the deposition angle. Remember that the case for a shallow foundation shows a slight increase in capacity in the range of 60°~90° for the sand deposition angle [30].

5. Conclusions

To study the accumulated cyclic responses of a laterally loaded monopile in a harsh marine geological environment, a series of model tests on a monopile were performed with two cyclic load amplitudes, three soil deposition angles, and two scour depths. A loading test system has the functions of preparing the anisotropic sand sample and applying long-term horizontal cyclic loading to the monopile foundation. The following are the main conclusions:
(1)
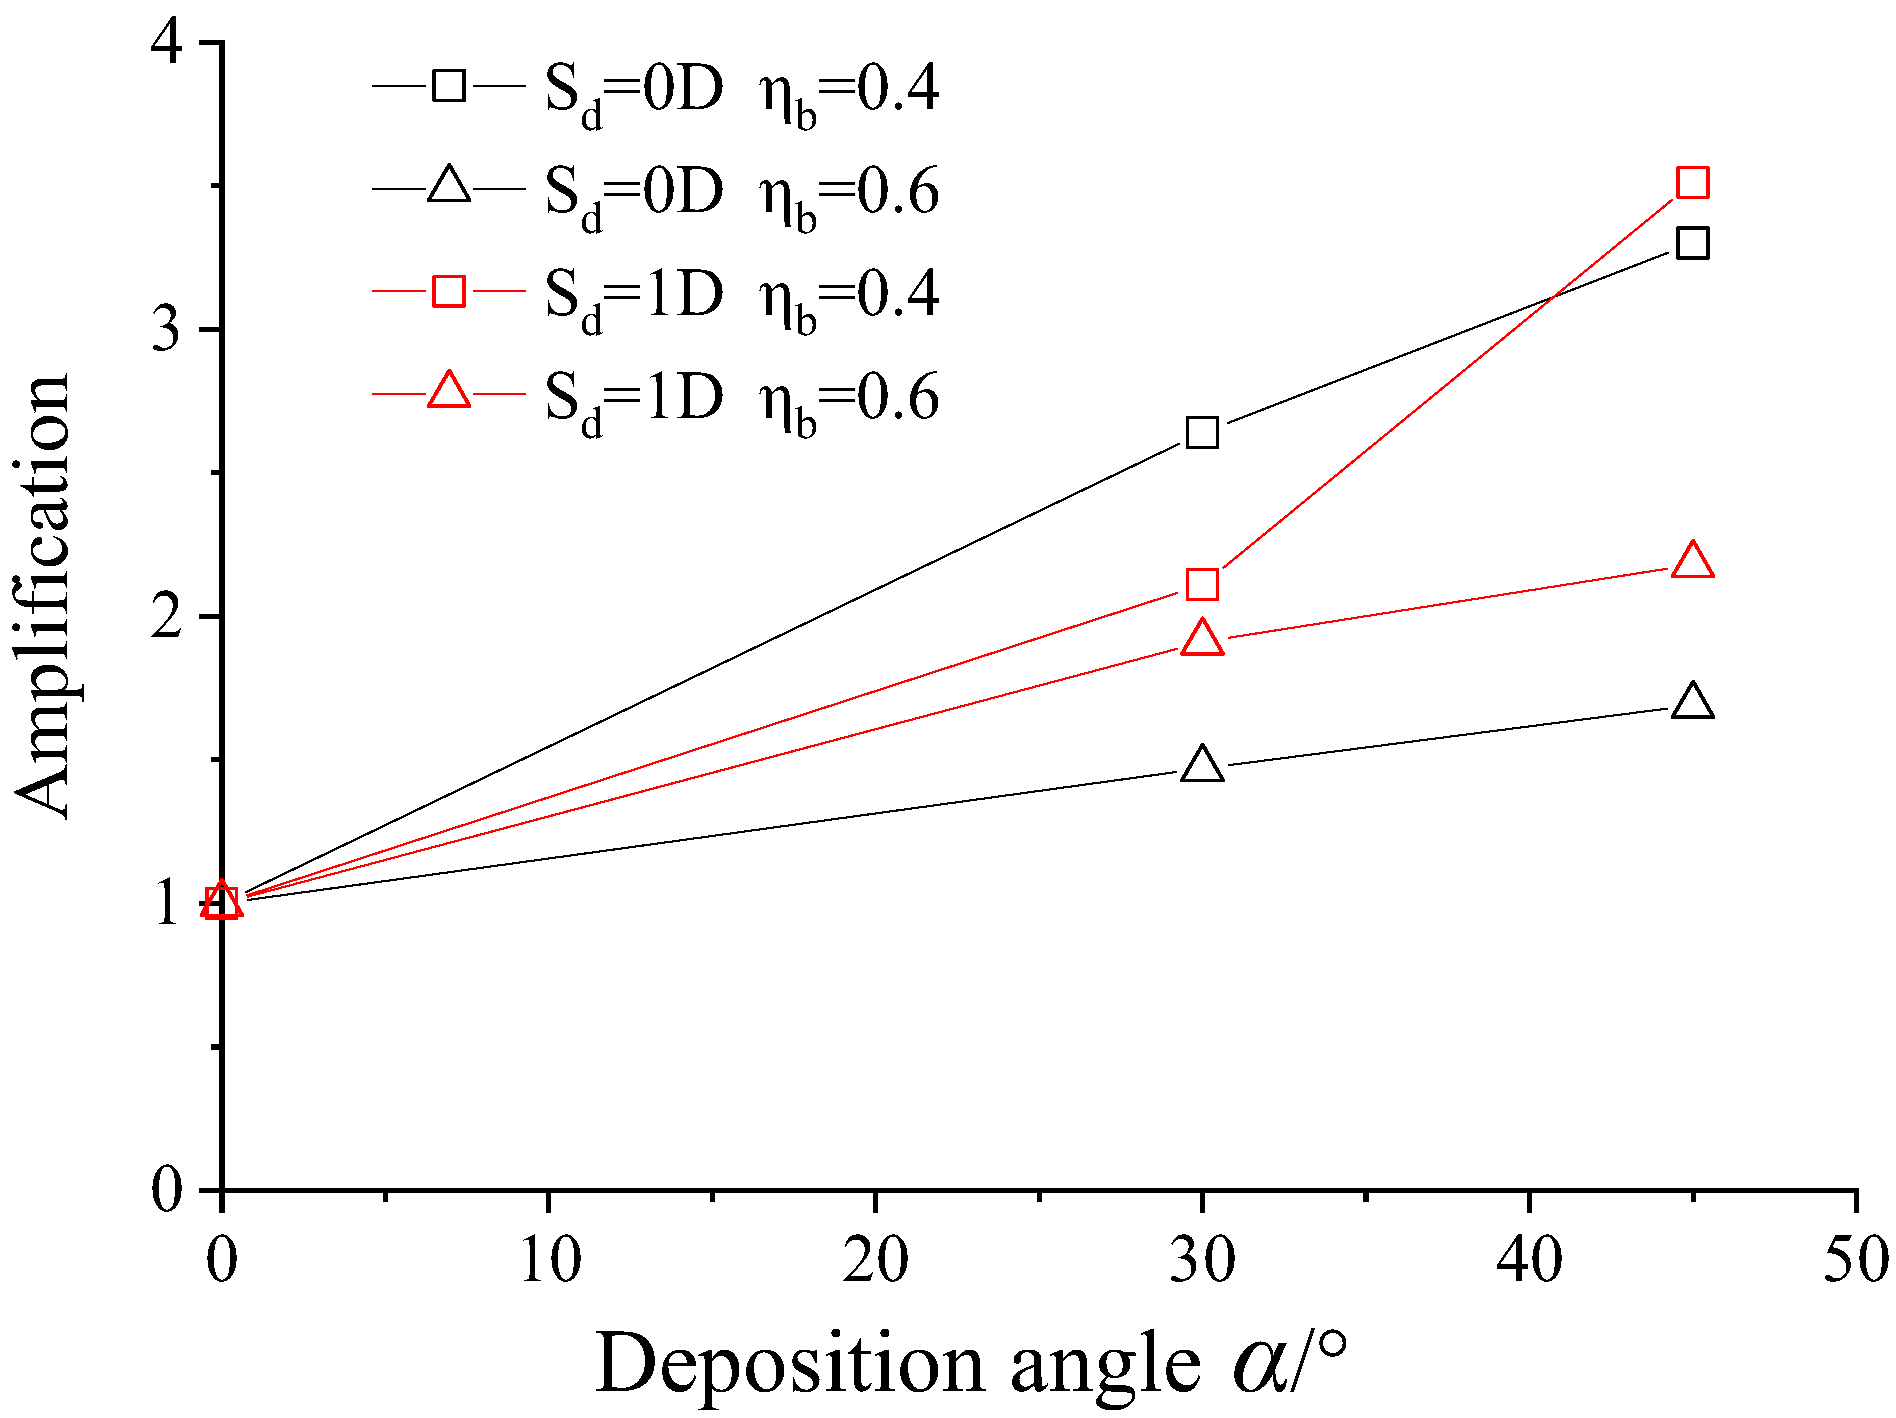
The load–displacement curves in monotonic tests show that the stiffness and the ultimate capacity decreased with increased deposition angle of sand and a scouring. The effects of sand anisotropy on the capacity of the laterally loaded pile can be decoupled from those of scour depth based on the plot for loss capacity.
(2)
There was a rapid increase in the residual displacement for the first 500 cycles, which produced 80–91% of the total displacement at the 500th cycle, then a much slower increase for the remaining cycles. The accumulated pile displacements at the pile head increased with increased deposition angle and scouring. The increase in displacement due to deposition angle is more obvious in the range of 0°~30° than in the range of 30°~45°. The effects of sand anisotropy on the accumulated displacement are more profound for a pile under a smaller cyclic amplitude, which is not found for the effects of scouring.
(3)
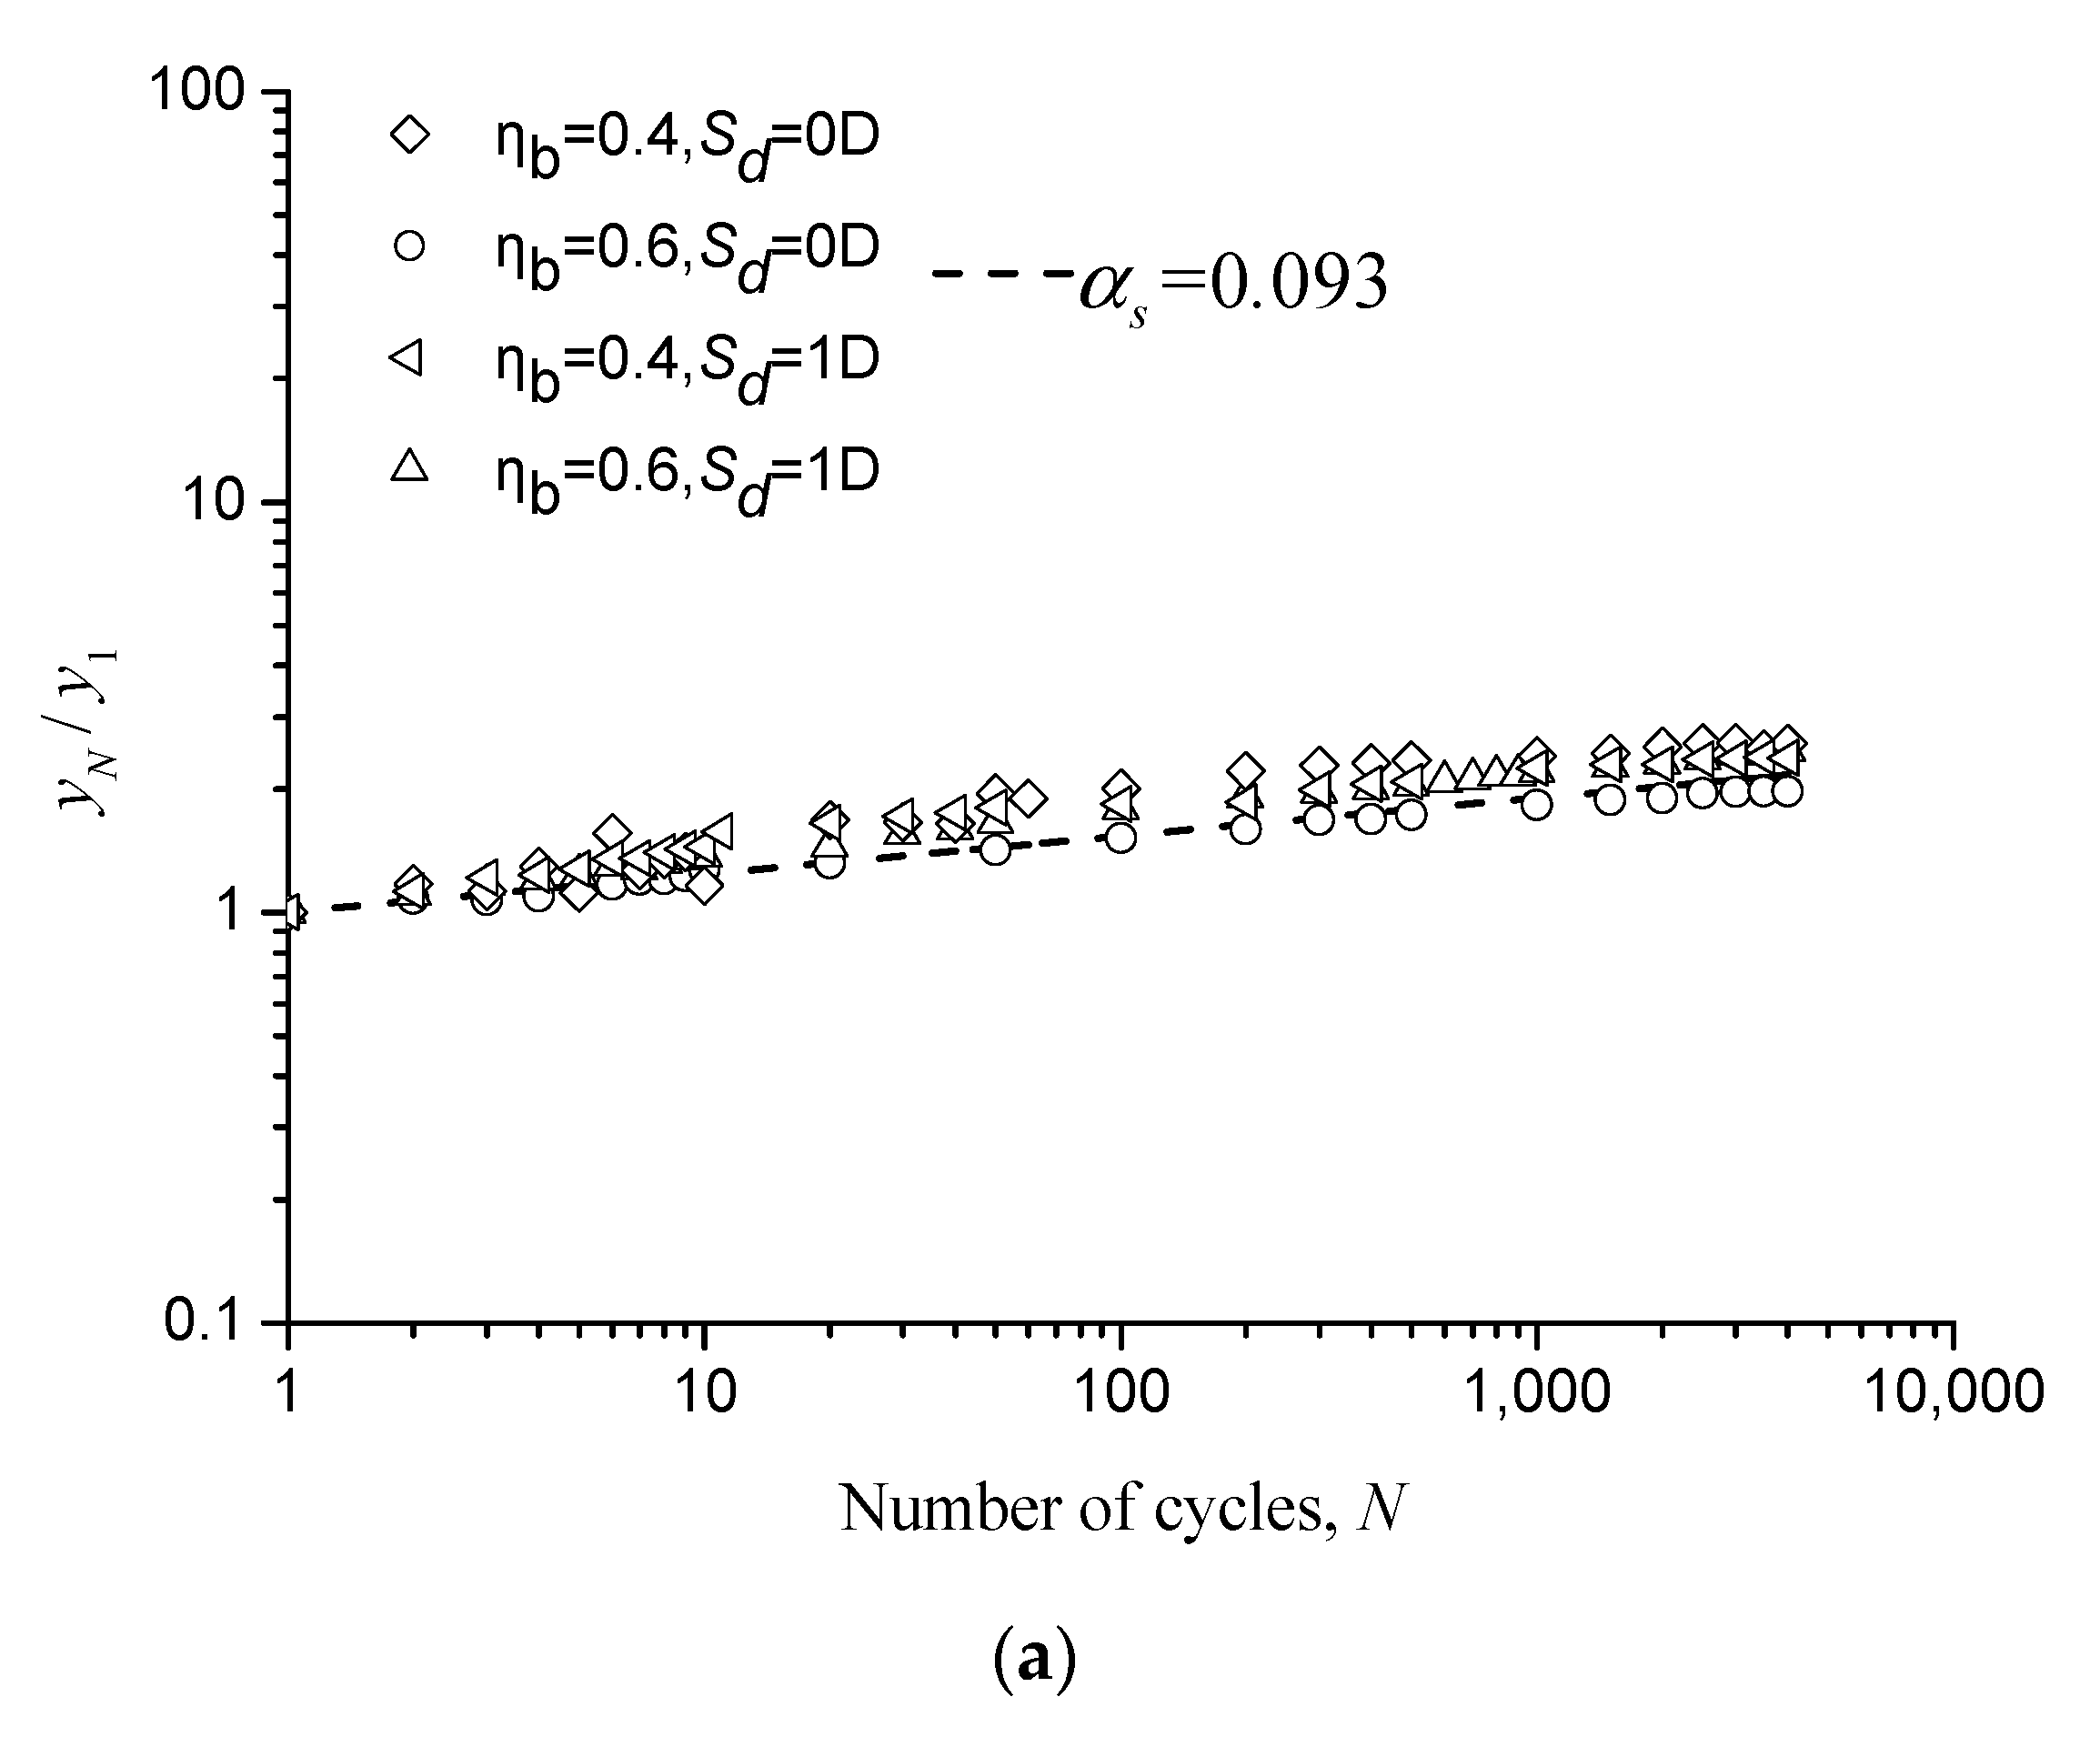
An exponential function of a cyclic number is proposed to predict the accumulated residual displacements of the pile based on the regression analysis of test results. The exponent α s is independent of the cyclic amplitudes, scour depths, and soil deposition angles, and all cyclic loading test results give a value of   α s close to each other. By modifying the normalized cyclic amplitude with the corresponding static capacity of the monopile under different soil deposition angles and scouring, good fits of the measured test results are shown.
(4)
Due to some drawbacks of model tests, it should be careful to apply the current regression analysis results.
(5)
Scouring removed soil and diminished the soil resistance around the pile. Natural soil is anisotropic due to the depositional process. The two factors may greatly influence the long-term performance of the monopile in a marine environment, including decreasing the lateral capacity of the laterally loaded pile and increasing the accumulated pile displacements. Special attention should be paid to the design of the monopile in offshore engineering because of scouring and sand anisotropy. The current model test study hopes to provide a preliminary reference for the design of laterally loaded piles.

Author Contributions

F.Y. writing—original draft preparation, methodology, and validation; C.Z. writing—review and editing, supervision, and conceptualization; M.H. writing—review, and supervision; X.Y. investigation; Z.Y. investigation. All authors have read and agreed to the published version of the manuscript.

Funding

This research was funded by the Scientific Research Foundation for High-level Talents of Anhui University of Science and Technology (Grant No. 2021yjrc65), National Natural Science Foundation of China (Grant No. 51779175), the Key Program of the Science and Technology Commission of Shanghai Municipality, China (Grant No. 18DZ1202104), and Anhui Provincial Natural Science Foundation (Grant No. 1908085QE214).

Institutional Review Board Statement

Not applicable.

Informed Consent Statement

Not applicable.

Data Availability Statement

Not applicable.

Acknowledgments

The authors would like to acknowledge Anhui University of Science and Technology and Tongji University.

Conflicts of Interest

The authors declare no conflict of interest.

References

  1. Doherty, P.; Gavin, K. Laterally loaded monopile design for offshore wind farms. Proc. Inst. Civ. Eng. Energy 2012, 165, 7–17. [Google Scholar] [CrossRef] [Green Version]
  2. Klinkvort, R.T.; Hededal, O. Lateral response of monopile supporting an offshore wind turbine. Proc. Inst. Civ. Eng. Geotech. Eng. 2013, 166, 147–158. [Google Scholar] [CrossRef]
  3. Sørensen, S.P.H.; Ibsen, L.B. Assessment of foundation design for offshore monopiles unprotected against scour. Ocean Eng. 2013, 63, 17–25. [Google Scholar] [CrossRef]
  4. Albiker, J.; Achmus, M.; Frick, D.; Flindt, F. 1 g model tests on the displacement accumulation of large-diameter piles under cyclic lateral loading. Geotech. Test. J. 2017, 40, 173–194. [Google Scholar] [CrossRef]
  5. Achmus, M.; Kuo, Y.S.; Abdel-Rahman, K. Behavior of monopile foundations under cyclic lateral load. Comput. Geotech. 2009, 36, 725–735. [Google Scholar] [CrossRef]
  6. Li, Z.; Haigh, S.; Bolton, M. Centrifuge Modelling of Mono-Pile Under Cyclic Lateral Loads. In Physical Modelling in Geotechnics, Two Volume Set, Proceedings of the 7th International Conference on Physical Modelling in Geotechnics, Zurich, Switzerland 28 June–1 July 2010; Springman, S., Laue, J., Seward, L., Eds.; CRC Press: London, UK, 2010; pp. 965–970. [Google Scholar]
  7. Zhu, B.; Li, T.; Xiong, G.; Liu, J.C. Centrifuge model tests on laterally loaded piles in sand. Int. J. Phys. Model. Geotech. 2016, 16, 160–172. [Google Scholar] [CrossRef]
  8. Zhang, C.R.; Zhang, X.; Huang, M.S.; Tang, H.W. Responses of Caisson-Piles Foundations to Long-Term Cyclic Lateral Load and Scouring. Soil Dyn. Earthq. Eng. 2019, 119, 62–74. [Google Scholar] [CrossRef]
  9. Mandolini, A.; Diambra, A.; Ibraim, E. Strength anisotropy of fibre-reinforced sands under multiaxial loading. Geotechnique 2019, 69, 203–216. [Google Scholar] [CrossRef] [Green Version]
  10. Xiong, H.; Guo, L.; Cai, Y.Q.; Yang, Z.X. Experimental study of drained anisotropy of granular soils involving rotation of principal stress direction. Eur. J. Environ. Civ. Eng. 2016, 20, 431–454. [Google Scholar] [CrossRef]
  11. Cheng, X.Y.; Diambra, A.; Ibraim, E.; Liu, H.; Pisanò, F. 3D FE-Informed Laboratory Soil Testing for the Design of Offshore Wind Turbine Monopiles. J. Mar. Sci. Eng. 2021, 9, 101. [Google Scholar] [CrossRef]
  12. Petalas, A.L.; Dafalias, Y.F.; Papadimitriou, A.G. SANISAND-F: Sand constitutive model with evolving fabric anisotropy. Int. J. Solids Struct. 2020, 188, 12–31. [Google Scholar] [CrossRef]
  13. Liu, W.M.; Novak, M. Dynamic response of single piles embedded in transversely isotropic layered media. Earthq. Eng. Struct. Dyn. 1994, 23, 1239–1257. [Google Scholar] [CrossRef]
  14. Zhi, Y.A.; Zhi, X.L. Dynamic analysis of a laterally loaded pile in a transversely isotropic multilayered half-space. Eng. Anal. Bound. Elem. 2015, 54, 68–75. [Google Scholar]
  15. Shahmohamadi, M.; Khojasteh, A.; Rahimian, M.; Pak, R.Y.S. Axial soil–pile interaction in a transversely isotropic half-space. Int. J. Eng. Sci. 2011, 49, 934–949. [Google Scholar] [CrossRef]
  16. Luan, M.T.; Ting-Kai, N.; Yang, Q. Stability analysis of pile-stabilized slopes considering both nonhomogeneity and anisotropy of soil strength using upper bound method of limit analysis. Yantu Lixue/Rock Soil Mech. 2006, 27, 530–536. [Google Scholar]
  17. Munaga, T.; Gonavaram, K.K. Influence of Stratified Soil System on Behavior of Laterally Loaded Pile Groups: An Experimental Study. Int. J. Geosynth. Ground Eng. 2021, 7, 18. [Google Scholar] [CrossRef]
  18. Lin, C.; Han, J.; Bennett, C.; Parsons, R.L. Analysis of laterally loaded piles in sand considering scour hole dimensions. J. Geotech. Geoenviron. Eng. 2014, 140, 04014024. [Google Scholar] [CrossRef]
  19. Yang, X.F.; Zhang, C.R.; Huang, M.S.; Yuan, J.Y. Lateral Loading of a Pile using Strain Wedge Model and Its Application under Scouring. Mar. Georesour. Geotech. 2018, 36, 340–350. [Google Scholar] [CrossRef]
  20. Lin, C.; Bennett, C.; Han, J.; Parsons, R.L. Scour effects on the response of laterally loaded piles considering stress history of sand. Comput. Geotech. 2010, 37, 1008–1014. [Google Scholar] [CrossRef]
  21. Liang, F.Y.; Zhang, H.; Chen, S.L. Effect of vertical load on the lateral response of offshore piles considering scour-hole geometry and stress history in marine clay. Ocean Eng. 2018, 158, 64–77. [Google Scholar] [CrossRef]
  22. Achmus, M.; Kuo, Y.S.; Abdel-Rahman, K. Numerical Investigation of Scour Effect on Lateral Resistance of Windfarm Monopiles. In Proceedings of the Twentieth (2010) International Offshore and Polar Engineering Conference (ISOPE), Beijing, China, 20–25 June 2010. [Google Scholar]
  23. Masanobu, O.; Isao, K.; Toshio, H. Experimental study of anisotropic shear strength of sand by plane strain test. Soils Found. 1978, 18, 25–38. [Google Scholar]
  24. Tatsuoka, F.; Sakamoto, M.; Kawamura, T.; Fukushima, S. Strength and deformation characteristics of sand in plane strain compression at extremely low pressures. Soils Found. 1986, 26, 65–84. [Google Scholar] [CrossRef] [Green Version]
  25. Kuo, Y.S.; Achmus, M. Practical Design Considerations of Monopile Foundations with Respect to Scour; Global Wind Power: Beijing, China, 2008. [Google Scholar]
  26. Zhang, H.; Chen, S.L.; Liang, F.Y. Effects of scour-hole dimensions and soil stress history on the behavior of laterally loaded piles in soft clay under scour conditions. Comput. Geotech. 2017, 84, 198–209. [Google Scholar] [CrossRef]
  27. Roy, K.; Hawlader, B.; Kenny, S.; Moore, I. Finite Element Modeling of Lateral Pipeline–Soil Interactions in Dense Sand. Can. Geotech. J. 2016, 53, 490–504. [Google Scholar] [CrossRef] [Green Version]
  28. Leblanc, C.; Houlsby, G.T.; Byrne, B.N. Response of stiff piles in sand to long-term cyclic lateral loading. Géotechnique 2010, 60, 79–90. [Google Scholar] [CrossRef]
  29. Chen, R.P.; Sun, Y.X.; Zhu, B.; Guo, W.D. Lateral cyclic pile-soil interaction studies on a rigid model monopile. Proc. Inst. Civ. Eng. Geotech. Eng. 2015, 168, 120–130. [Google Scholar] [CrossRef] [Green Version]
  30. Azami, A.; Pietruszczak, S.; Guo, P. Bearing capacity of shallow foundations in transveresely isotropic granular media. Int. J. Numer. Anal. Meth. Geomech. 2010, 34, 771–793. [Google Scholar] [CrossRef]
  31. Verdure, L.; Garnier, J.; Levacher, D. Lateral Cyclic Loading of Single Piles in Sand. Int. J. Phys. Model. Geotech. 2003, 3, 17–28. [Google Scholar] [CrossRef]
  32. Yu, F.; Zhang, C.R.; Huang, M.S.; Yang, X.F.; Yao, Z.M. Scouring effects on lateral cyclic responses of piles in sand. Eur. J. Environ. Civ. Eng. 2022. [Google Scholar] [CrossRef]
Figure 1. Test system: (a) schematic sketch; (b) photo; (c) displacement measurement; (d) model pile.
Jmse 11 00255 g001
Figure 2. Output load curves of the cyclic loading device: (a) whole range; (b) initial stage.
Jmse 11 00255 g002
Figure 3. Grading distribution curve of Toyoura sand.
Jmse 11 00255 g003
Figure 4. Raining method.
Jmse 11 00255 g004
Figure 5. Process of preparing soil sample with deposition angle.
Jmse 11 00255 g005
Figure 6. Photographs at soil deposition angle of 30°.
Jmse 11 00255 g006
Figure 7. Photographs of a scour hole s d = 1 D .
Jmse 11 00255 g007
Figure 8. Different cyclic loading types [28].
Jmse 11 00255 g008
Figure 9. Illustration of the test program.
Jmse 11 00255 g009
Figure 10. Load–displacement curves for monotonic tests.
Jmse 11 00255 g010
Figure 11. Variation of capacity to deposition angle α.
Jmse 11 00255 g011
Figure 12. Definition of accumulated residual displacement.
Jmse 11 00255 g012
Figure 13. Cyclic test results of residual accumulated displacements. (a) η b = 0.4 , s d = 0 (b) η b = 0.6 , s d = 0 (c) η b = 0.4 , s d = 1 D (d) η b = 0.6 , s d = 1 D .
Jmse 11 00255 g013
Figure 14. Amplification of the cumulative displacement with deposition angle.
Jmse 11 00255 g014
Figure 15. Nondimensional accumulated residual displacement to cycle number. (a) α = 0° (b) α = 30° (c) α = 45°.
Jmse 11 00255 g015aJmse 11 00255 g015b
Figure 16. Illustrative plot to obtain y 1 . (a) α = 0°, η b = 0.4 (b) α = 0°, η b = 0.6 .
Jmse 11 00255 g016
Figure 17. The value of y 1 to the cyclic amplitude η b .
Jmse 11 00255 g017
Figure 18. The value of y 1 to the cyclic amplitude η b 1 .
Jmse 11 00255 g018
Figure 19. Comparison between measured and calculated displacements. (a) α = 0°, η b = 0.4 (b) α = 0°, η b = 0.6 (c) α = 30°, η b = 0.4 (d) α = 30°, η b = 0.6 (e) α = 45°, η b = 0.4 (f) α = 45°, η b = 0.6 .
Jmse 11 00255 g019aJmse 11 00255 g019b
Table 1. Characteristics of Toyoura sand.
PropertyValue
Particle sizes, D 50 : mm0.16
Uniformity coefficient C u 1.6
Specific gravity G s 2.64
Minimum void ratio e m i n 0.609
Maximum void ratio e m a x 0.916
Table 2. Test program.
NumberLoad TypeScour DepthDeposition
Angle/°
Cyclic AmplitudeCycles
M-1Monotonic00--
M-2Monotonic030--
M-3Monotonic045--
M-4Monotonic1 D0--
M-5Monotonic1 D30--
M-6Monotonic1 D45--
C-1Cyclic000.4 Pu4000
C-2Cyclic0300.4 Pu4000
C-3Cyclic0450.4 Pu4000
C-4Cyclic1 D00.4 Pu4000
C-5Cyclic1 D300.4 Pu4000
C-6Cyclic1 D450.4 Pu4000
C-7Cyclic000.6 Pu4000
C-8Cyclic0300.6 Pu4000
C-9Cyclic0450.6 Pu4000
C-10Cyclic1 D00.6 Pu4000
C-11Cyclic1 D300.6 Pu4000
C-12Cyclic1 D450.6 Pu4000
Disclaimer/Publisher’s Note: The statements, opinions and data contained in all publications are solely those of the individual author(s) and contributor(s) and not of MDPI and/or the editor(s). MDPI and/or the editor(s) disclaim responsibility for any injury to people or property resulting from any ideas, methods, instructions or products referred to in the content.

