Article

Research on The Chloride Diffusion Modified Model for Marine Concretes with Nanoparticles under The Action of Multiple Environmental Factors

1
School of Civil Engineering, Northeast Forestry University, Harbin 150040, China
2
School of Civil Engineering and Architecture, East University of Heilongjiang, Harbin 150066, China
3
Institute of Engineering Mechanics, CEA, Harbin 150080, China
*
Author to whom correspondence should be addressed.
J. Mar. Sci. Eng. 2022, 10(12), 1852; https://doi.org/10.3390/jmse10121852
Submission received: 1 November 2022 / Revised: 20 November 2022 / Accepted: 22 November 2022 / Published: 1 December 2022
(This article belongs to the Special Issue Advances in Marine Structures)

Abstract

:
Marine concrete structures are subject to the action of multiple environments during their service time. This leads to increased deterioration in the durability of marine concretes under the combined action of bending load and dry–wet cycles, salt freeze–thaw cycles, and salt spray erosion. The main reason for the damage of concrete under the action of the above three environments is Cl- attack. The free Cl- content (Cl-f) and the free Cl- diffusion coefficient (Df) of concrete can explain the diffusion of Cl- in concrete. This paper considers the actual environment of marine concrete structures and develops the Cl- diffusion modified model for nano-marine concretes under the action of dry–wet cycles, salt freeze–thaw cycles, and bending load and salt spray erosion. The nano-SiO2, nano-Fe2O3, and nano-Fe3O4 were firstly incorporated into ordinary marine concrete, then the Cl- content of each group of marine concrete was measured at different depths, and the Cl- diffusion coefficients were calculated; finally, the Cl- diffusion modified model was established under different environmental factors. The test results show that the total and free Cl- diffusion coefficients of nano-marine concretes were lower than those of ordinary marine concrete, and the nano-SiO2, nano-Fe2O3, and nano-Fe3O4 of the optimum dosage were 2%, 1%, and 2%, respectively. The fitting results of Cl- content have a good correlation, and the correlation coefficient (R) is basically above 0.98.

1. Introduction

Cl- diffusion can cause reinforcement corrosion for marine concrete structures in long-term marine environments such as cross-sea bridges and harbors, which is the main reason for the shortened service life of marine concrete structures [1,2,3]. Marine concretes in different positions are exposed in the atmosphere zone (salt spray zone), tidal zone, splash zone, and submerge zone, respectively. In addition to the Cl- erosion, the structures are also influenced by the damage of salt freeze–thaw cycles in cold regions [4,5,6,7]. The studies reported that the structural damage in the submerge zone is more serious under the combined effects of environments and Cl- erosion [8].
When Cl- diffuses into concrete, part of the Cl- produces a series of chemical reactions with cement hydration products called binding Cl-. The unreacted Cl- will exist with a freedom that is called free Cl-. Several studies have reported [9,10] that free Cl- is one of the main reasons for reinforcement erosion. Therefore, investigating the distribution of free Cl- in concrete can effectively evaluate the durability performance of marine concrete structures. The Cl- diffusion coefficient is an important parameter for predicting the service life of concrete structures [11].
The Cl- diffusion coefficient will change by time, temperature, water–cement ratio, and other factors. The basic Fick’s second law is too idealistic to consider Cl- diffusion. In recent years, many scholars have reworked the basic model of Fick’s second law and considered the Cl- diffusion under the action of various environmental factors [12,13,14,15] to study the Cl- distribution in different environments.
The dry–wet cycles are usually considered to have an unfavorable impact on marine concrete structures under the action of multiple environments [16,17,18]. The structural positions in the atmosphere zone, splash zone, and tidal zones are subject to the influence of dry–wet cycles. The atmosphere zone is mainly through salt spray erosion [19,20,21,22,23]; the tidal and splash zones are mainly through seawater at high tide, low tide, and splash, which causes structural positions to be under the action of dry–wet cycles for a long time. Ou et al. and Zanden et al. [24,25] considered the effect of water molecules on the distribution of Cl- concentration under the action of dry–wet cycles and established a correlation model. Among them, Ou [24] considered the effect of water pressure, investigated the distribution characteristics of Cl- concentration in concrete over time under the effect of a reverse hydraulic gradient, and introduced impermeability coefficients to describe the influence of reverse transfusion. Cracks are usually covered on the surface of marine concrete structures; the presence of cracks accelerates the diffusion of Cl- under the action of dry–wet cycles [16,26,27]. The Cl- diffusion performance of marine concrete structures is also different under the different forms of loading and dry–wet cycles [28,29,30,31,32].
Marine concrete structures are also subjected to salt freeze–thaw cycles except for Cl- erosion. Wang et al., Kesseler et al., Sun et al., and Zhang et al. [4,33,34,35] investigated Cl- diffusion in concrete under the action of salt freeze–thaw cycles and proposed a numerical model. Wang et al. [36] reviewed the coupled effects of salt freeze–thaw cycles and other environmental factors, which mainly included salt solution and loading, on the influence of concrete durability performance, and summarized the development method of concrete durability performance, such as adding fiber polymers, including steel fibers (SF) or synthetic fibers, and so on. Niu et al. [37] conducted freeze–thaw cycle tests on steel fiber reinforced concrete (SFRC) with different dosages. They believed that, compared with PC, all types of SFRCs have better resistance to salt freeze–thaw cycles. This is because that with the SF added, the pore structure of concrete has significantly decreased. This is consistent with the conclusions reached by Yang et al. [38]. Meng et al. [39] prepared high performance synthetic fibers reinforced concrete (HPSFRC) and PC, respectively, and studied their flexural strength, anti-crack performance, and salt freeze–thaw cycles resistance. They found that compared with PC, the above-mentioned performance of HPSFRC can be improved to varying degrees. So, choosing the reasonable fiber dosage and its type can effectively improve the salt freeze–thaw cycles resistance of marine concrete structures. Li et al. and Chen et al. [40,41] also developed a model for Cl- diffusion in concrete at the microscopic level under the action of salt freeze–thaw cycles, based on the previous work.
Due to the small size of nanoparticles, they have many properties that conventional materials do not possess, such as surface effect and filling effect. Adding nanoparticles to PC has positive effects on the hydration of cement and the microstructure of concrete, such as promoting cement hydration and enhancing C-S-H gels properties [42,43,44,45,46]. Considering the actual service environment of marine concrete structures, the nano-SiO2, nano-Fe2O3, and nano-Fe3O4 of appropriate amounts were substituted to replace cement in equal amounts, and three groups of marine concrete underwent the durability test under the action of dry–wet cycles, freeze–thaw cycles, and bending load and salt spray erosion in this paper. Cl- sampling was determined after arriving at the corresponding test age. Based on Fick’s second law and considering the effects of age attenuation coefficient m, load influence coefficient f(σ), environmental influence coefficient fh, convection zone depth (Xc), Cl- binding coefficient K, nanoparticles (A), freeze–thaw damage degree (F), and spalling layer (ΔB), the Cl- diffusion model for nano-marine concretes under the action of different environmental factors are modified, and the modified model can provide a reference for the durability design of marine concrete structures.

2. Materials and Methods

2.1. Test Materials

(1)
Cement: P.O42.5 ordinary Portland cement produced by Harbin Cement Factory.
(2)
Fine aggregate: medium sand with a fineness modulus of 2.42.
(3)
Coarse aggregate: selected continuous gravel gradation with particle size 5–31.5 mm.
(4)
Defoamer agent: Tributyl phosphate was selected as the defoamer agent.
(5)
Water reducing agent: FDN-type naphthalene high-efficiency water reducing agent was used, its dosage according to the method specified in the Concrete Admixture (GB8076-2008).
(6)
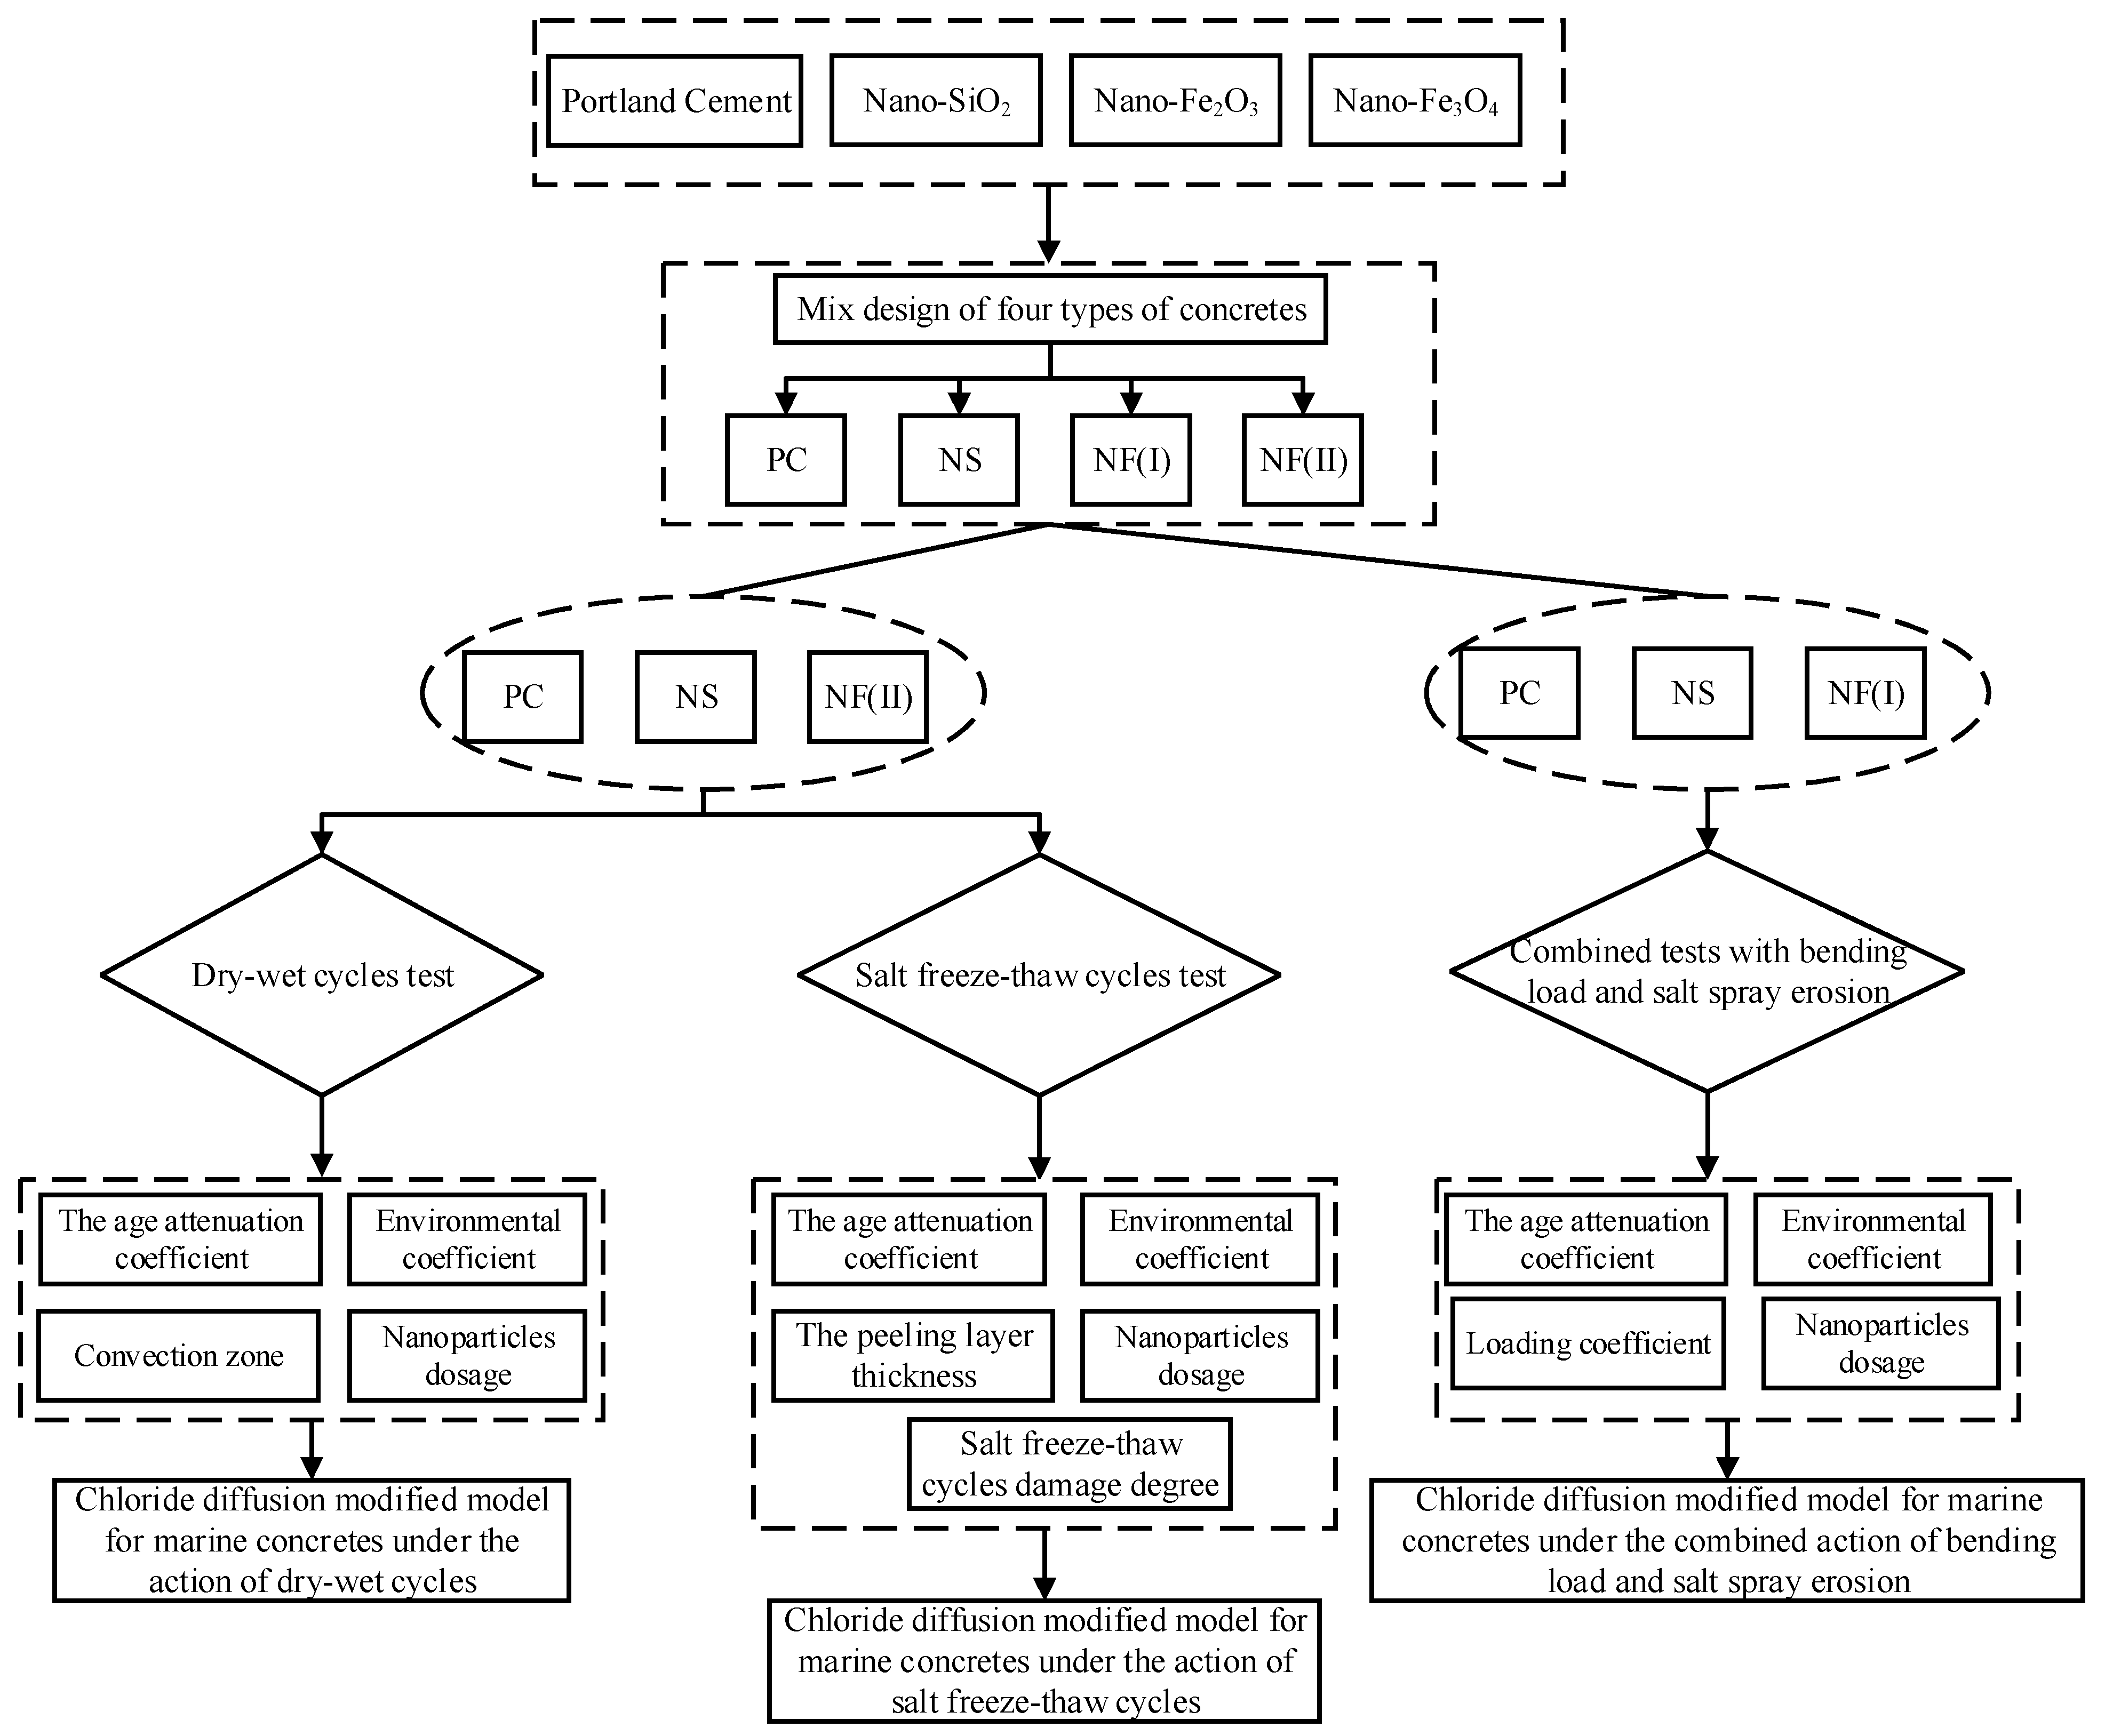
Nanoparticles: Nano-SiO2 has a strong pozzolanic effect, which can react with cement secondary hydration, and can effectively improve the microstructure of concrete. Although nano-Fe2O3 and nano-Fe3O4 do not have a pozzolanic effect, their surface has high activity and strong adsorption, respectively, and can also react with cement hydration products. So, nano-SiO2 and nano-Fe3O4 were used for the dry–wet cycles and salt freeze–thaw cycles tests under no load condition, and nano-SiO2 and nano-Fe2O3 were used for the bending load and salt spray erosion test. This selection method can effectively reflect the difference between nano-Fe2O3 and nano-Fe3O4 in the improvement of concrete durability. According to their different properties, the chloride content of concrete in three different environments is studied. And the results of the modified model are also different. The nano-SiO2, nano-Fe2O3, and nano-Fe3O4 was produced by Anhui Kerun Nanotechnology Co. The properties of nanoparticles are shown in Table 1.

2.2. Marine Concrete Mix Proportioning

According to the Code for Durability Design of Concrete Structures (GB/T50476-2019) [47] and the Code for Mix Proportions Design Procedure of Ordinary Concrete (JGJ55-2011) [48], the environmental action grade is III-C under the marine chloride environment. With the slump requirements taken into consideration, the concrete design strength level in this test is C45, the water-binder ratio is 0.44, the sand rate is 33%, the water reducing agent level is 0.25% of the cement amount, and the dosage of defoamer is 4% of the water reducing agent amount. Nano-marine concretes are based on the concrete ratio for ordinary marine concrete structures, the water-cement ratio and unit water consumption were maintained, and the cement was substituted by the equal quality of nanoparticles. The dosage of nanoparticles was used 0.5%, 1.0%, 2.0%, and 3.0% in this paper. The marine concretes ratios are shown in Table 2.

2.3. Test Methods

2.3.1. The Combined Action of Dry–Wet Cycles and Cl- Erosion Test

The dry–wet cycle is a period every 24 h. The specific operation is as follows: After curing for 28 days, the specimen is immersed in NaCl solution (concentration 5%) for 11 h. After taking it out for natural air drying for 1 h, it is put into the oven for 11 h (oven temperature is set at 80 °C), and then taken out for cooling to room temperature (1 h). The NaCl solution was changed every 30 days to keep the concentration constant. The specimens were immersed in NaCl solution and replaced every 50 days under the action of full immersion. A total of 108 specimens were used for the determination of Cl- content under the two test conditions, and the size of the specimen was 100 × 100 × 100 mm.

2.3.2. The Combined Action of Freeze–Thaw Cycles and Cl- Erosion Test

The salt freeze–thaw cycles test was conducted for the fast-freezing method according to the Concrete long-term Performance and Durability Test Method Standard (GB/T 50082-2019) [49]; The circulating medium of salt freeze–thaw cycles was 5% NaCl solution. The specimens were immersed in NaCl solution, and each freeze–thaw cycle was completed within 2~4 h, and the melting time should not be less than 1/4 of the freeze–thaw cycles. The minimum and maximum temperature at the center of the specimen were set at −18 °C and 5 °C, respectively, and they were automatically controlled by the freeze–thaw testing machine. A total of 72 specimens were used for the determination of the Cl- content, and the size of the specimen was 100 × 100 × 100 mm.

2.3.3. The Combined Action of Bending Load and Salt Spray Erosion Test

(1)
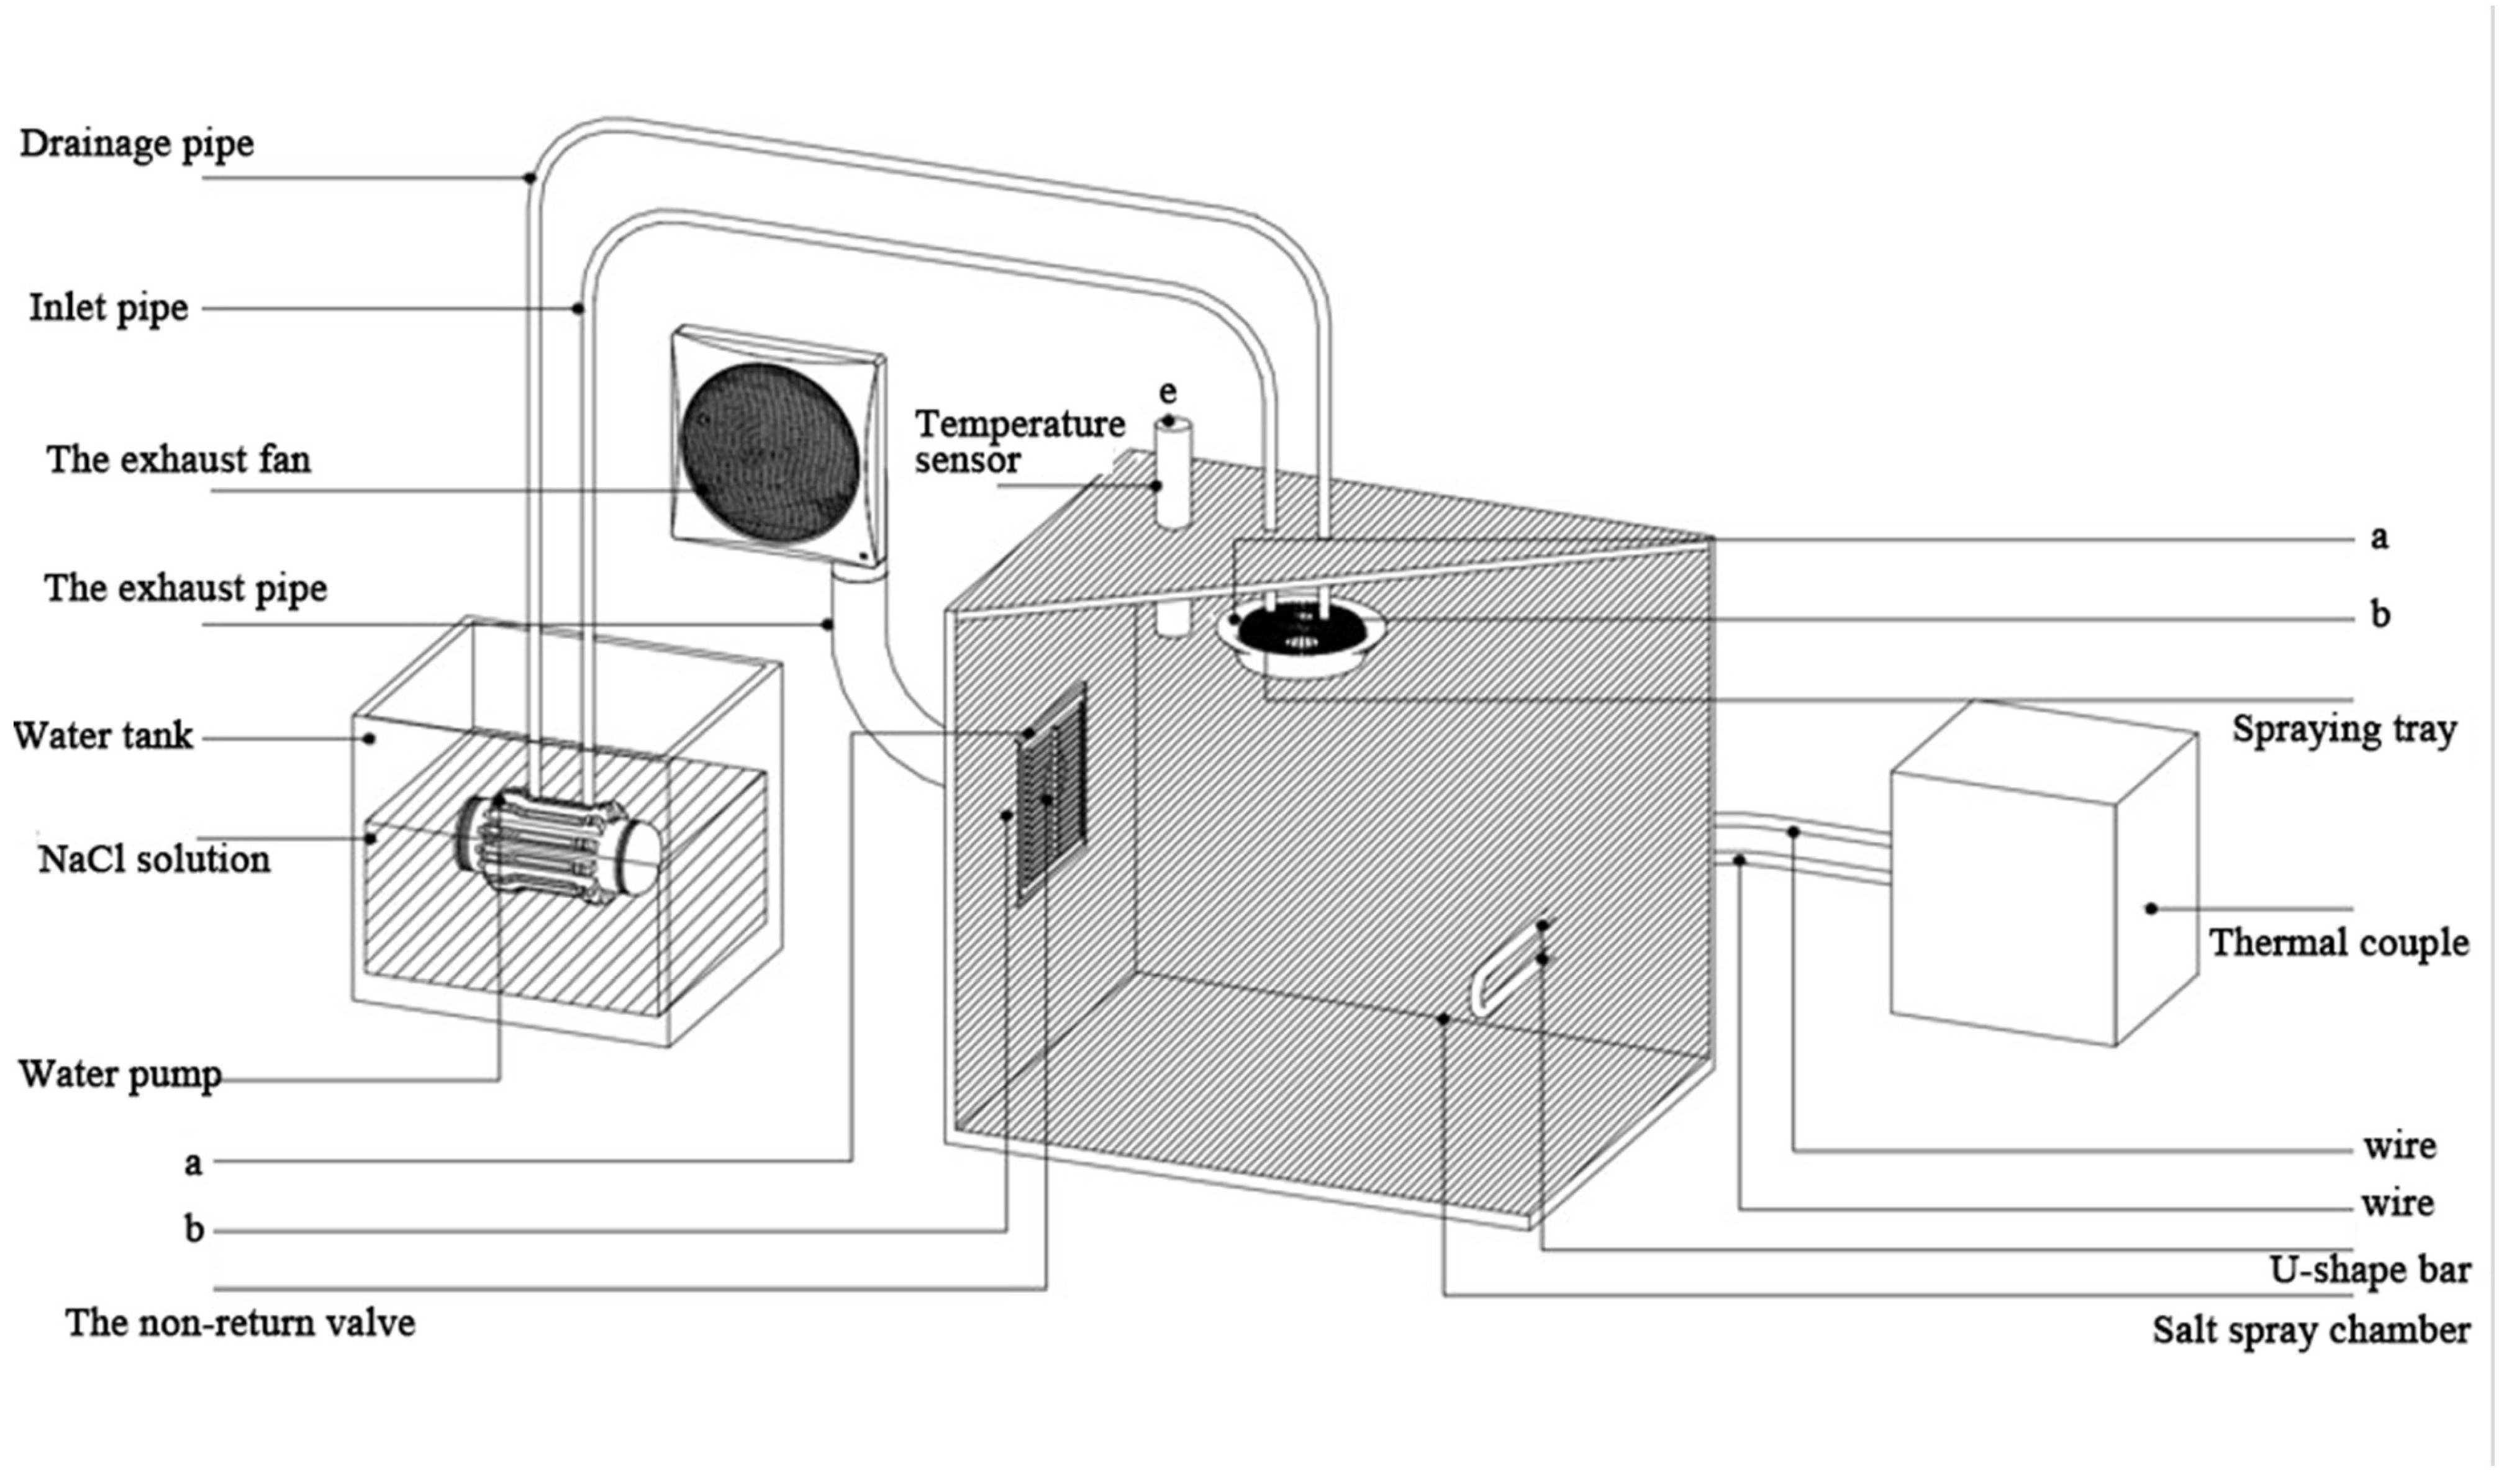
Test conditions: Referring to the neutral salt spray test (NSS test), a concrete durability test chamber [50] under the action of salt spray erosion was independently developed (application number ZL 202120853835.7). The test blocks of preloaded concrete, together with the loading device, were put into the concrete durability test chamber (see Figure 1) for the salt spray erosion test. In Figure 1, a, b, c, d, and e are the drilling positions of installation objects, respectively. The test was carried out by continuous spray, that is, continuous spray for 12 h and rest for 12 h every day. According to the recommended test ages of the NSS test, the test ages were set as follows: 4 d, 7 d, 14 d, 21 d, and 30 d.
(2)
Number and size of specimens: There are 9 groups of 100 × 100 × 400 mm prismatic blocks, and each group has 63 blocks, among which 60 blocks are used for combining tests for bending load and salt spray erosion, and the remaining 3 blocks are only used for the salt spray erosion test.
(3)
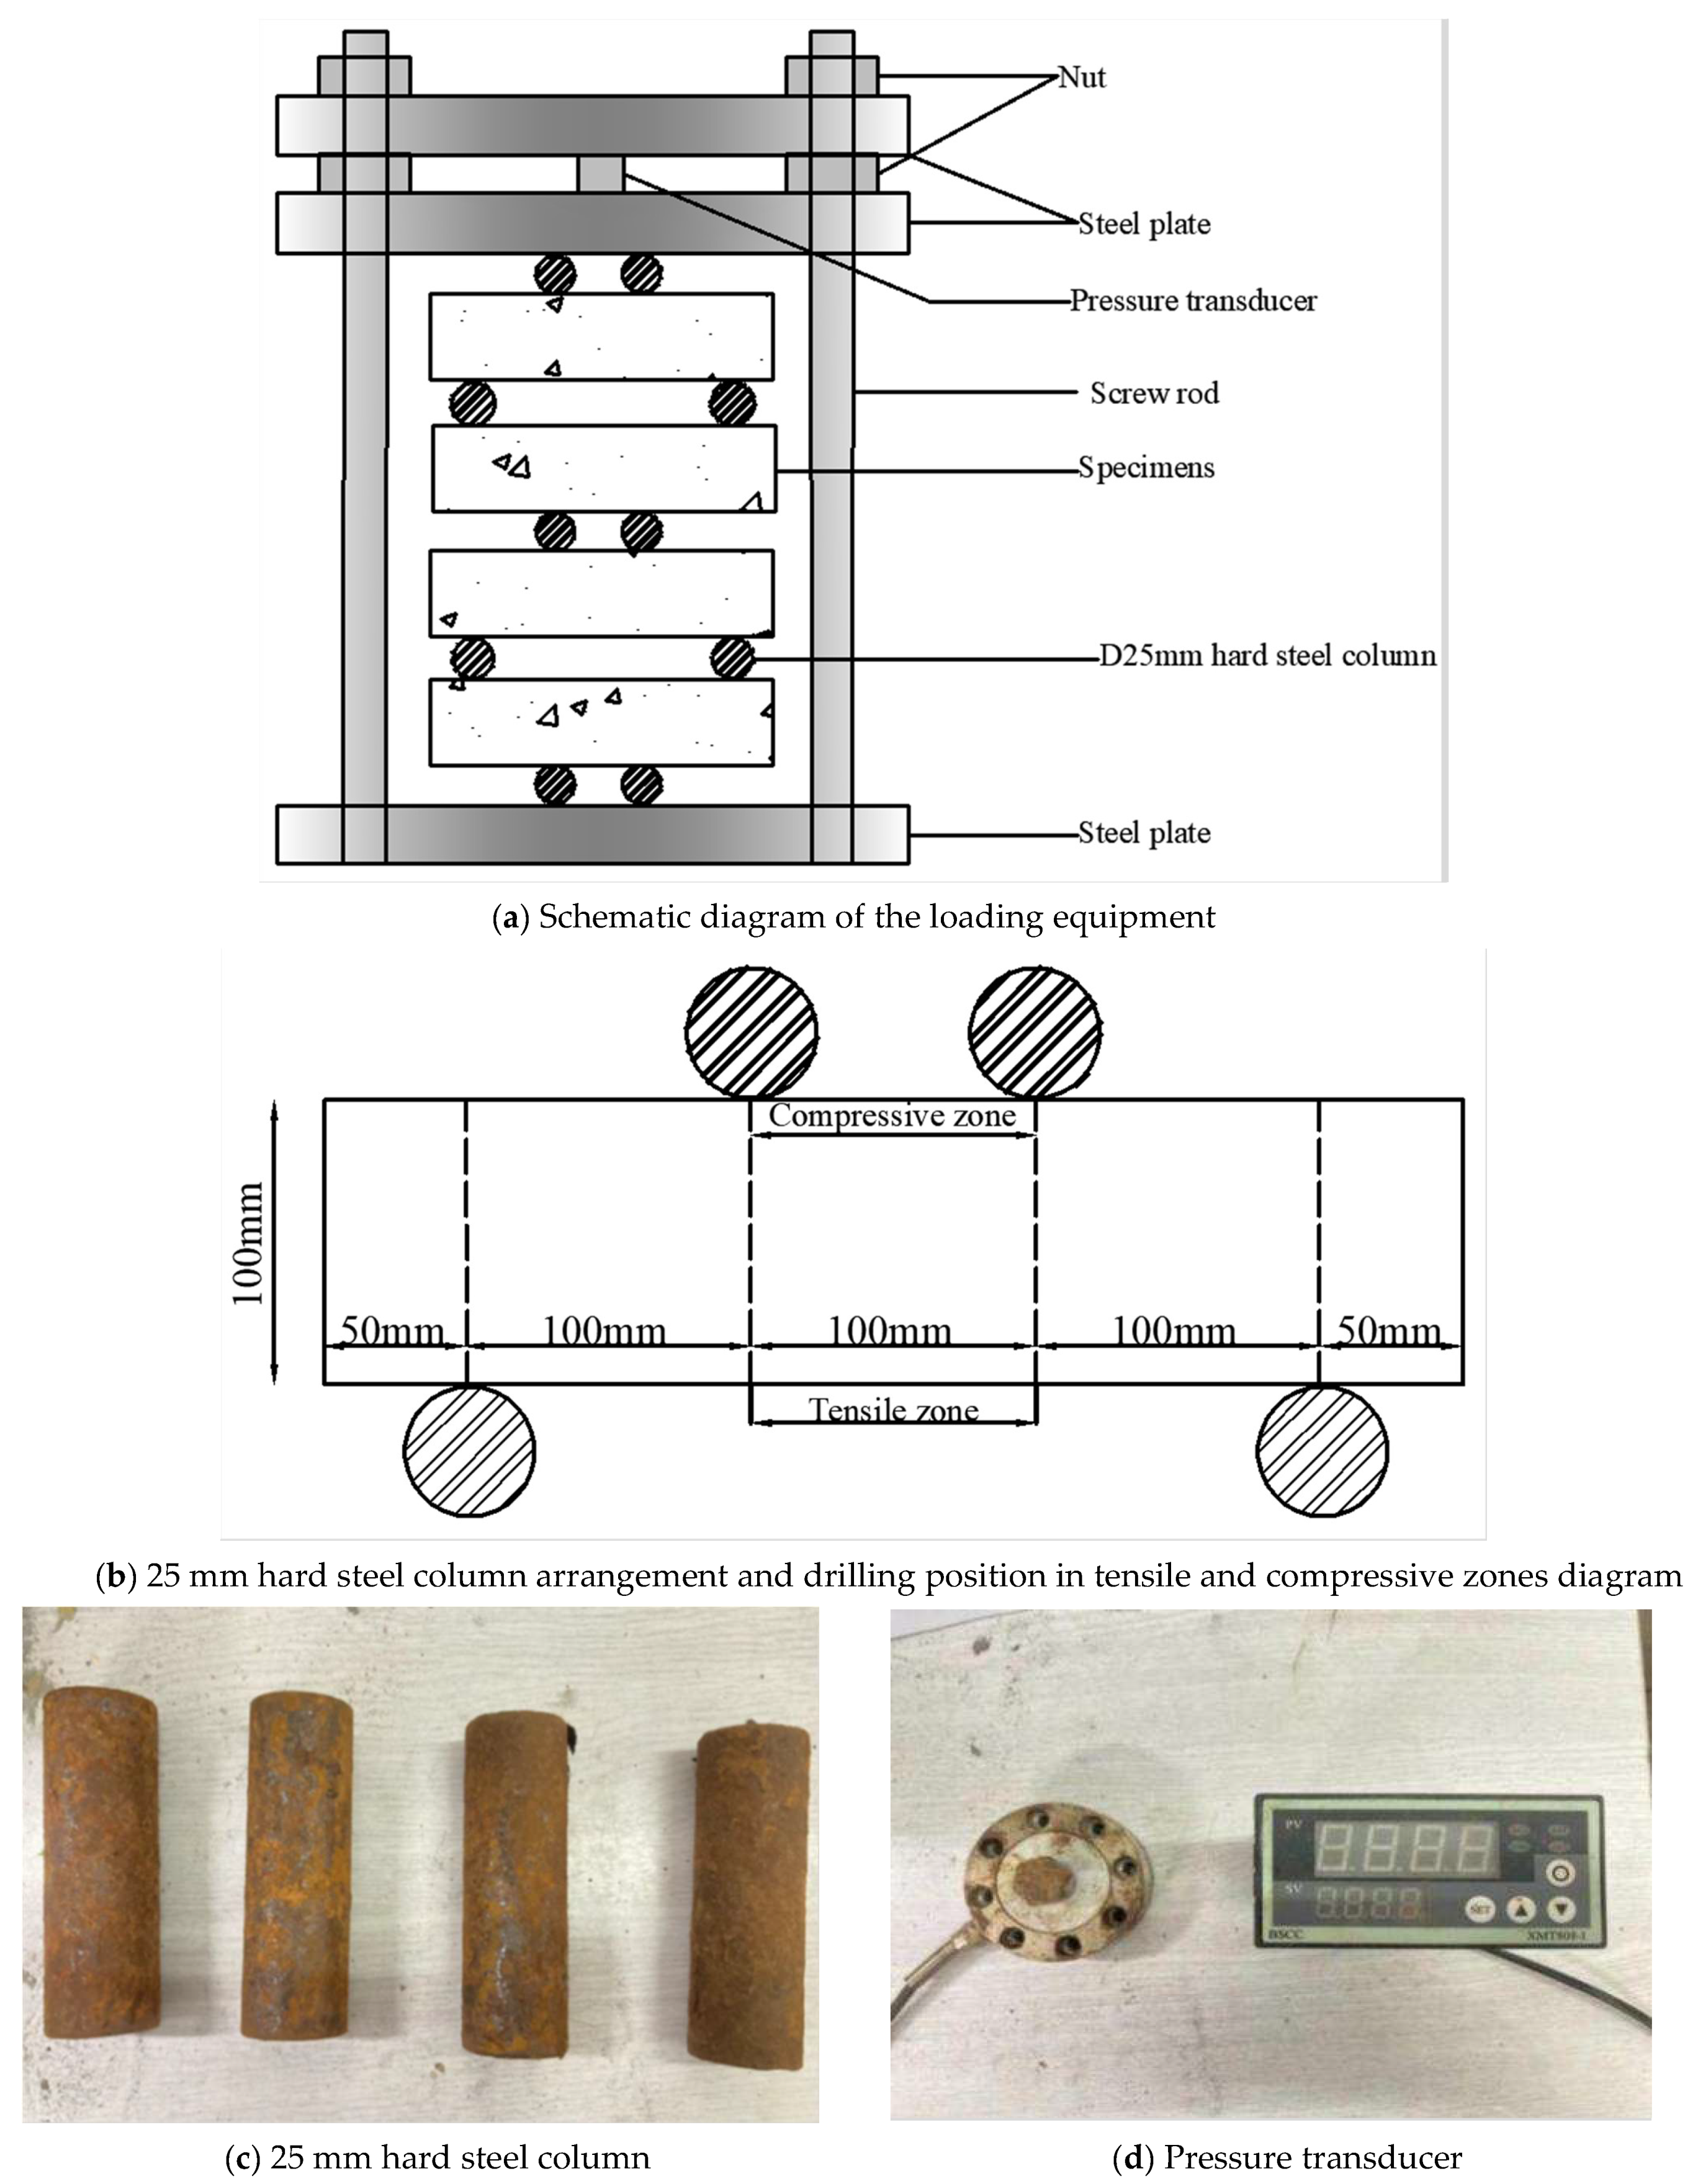
Test loading device: The loading device was designed by the reference [51], the test in this paper self-assembled a set of bending loading devices [50] (see Figure 2). Its advantages include small size and being easy to operate during the process of loading and unloading, intuitive control of stress ratios, and can be directly placed in the salt spray test chamber.

2.3.4. Cl- Sampling and Determination

Cl- Sampling

(1)
The combined action of dry–wet cycles and Cl- erosion: After 25 dry–wet cycles and sampling, Cl- determination was carried out. After the test blocks were dried, two parts of powder (10 g each) were taken as a group at different depths, and the drilling depths were 2, 5, 10, 15, 20, 25, and 30 mm, respectively.
(2)
The combined action of salt freeze–thaw cycles and Cl- erosion: After 25 salt freeze–thaw cycles, the test blocks were taken. They were used to drill the powder on the four parts. The salt freeze–thaw cycles caused the surface layer of concrete to peel off, so the drilling depths were 5, 10, 15, 20, 25, and 30 mm, respectively.
(3)
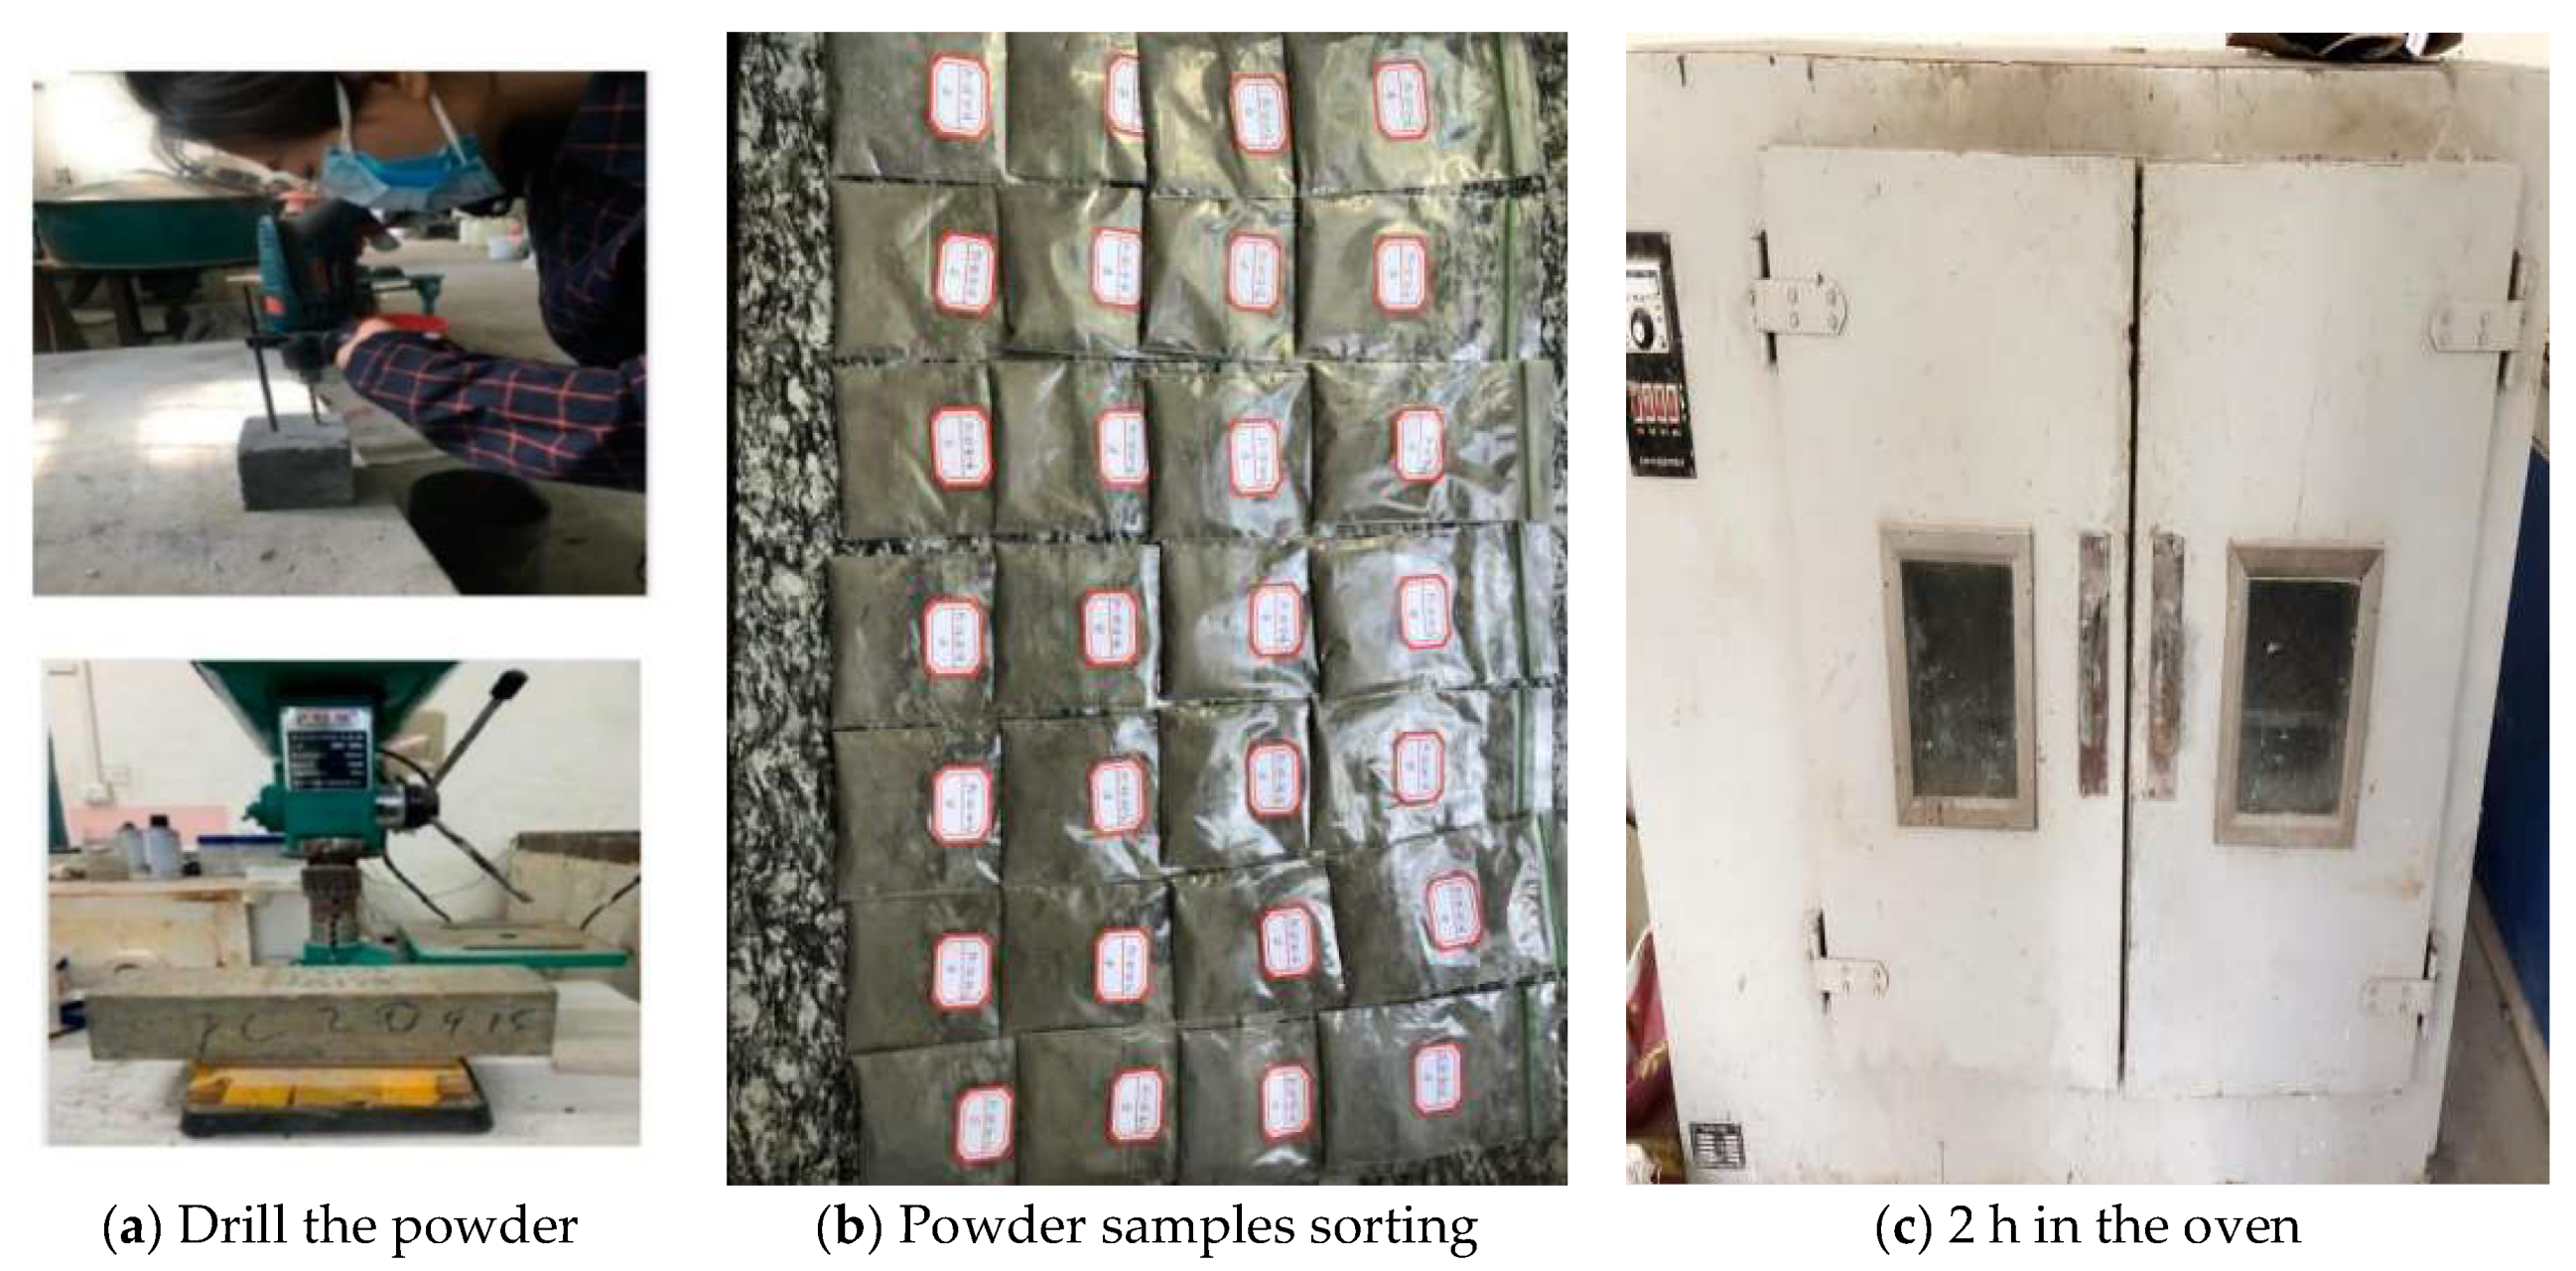
The combined action of bending load and salt spray erosion: After the test blocks arrived at the corresponding test age, each group of them was used to drill the powder from the tensile zone and the compressive zone (100 mm), respectively (see Figure 2b). After screening, they were put into the oven for 2 h (temperature 105 ± 5 °C) and then cooled to nature temperature for the Cl- content test. The drilling depths were 3, 5, 10, 15, 20, 25, and 30 mm, respectively.
The process of Cl- sampling, sorting, and drying is shown in Figure 3.

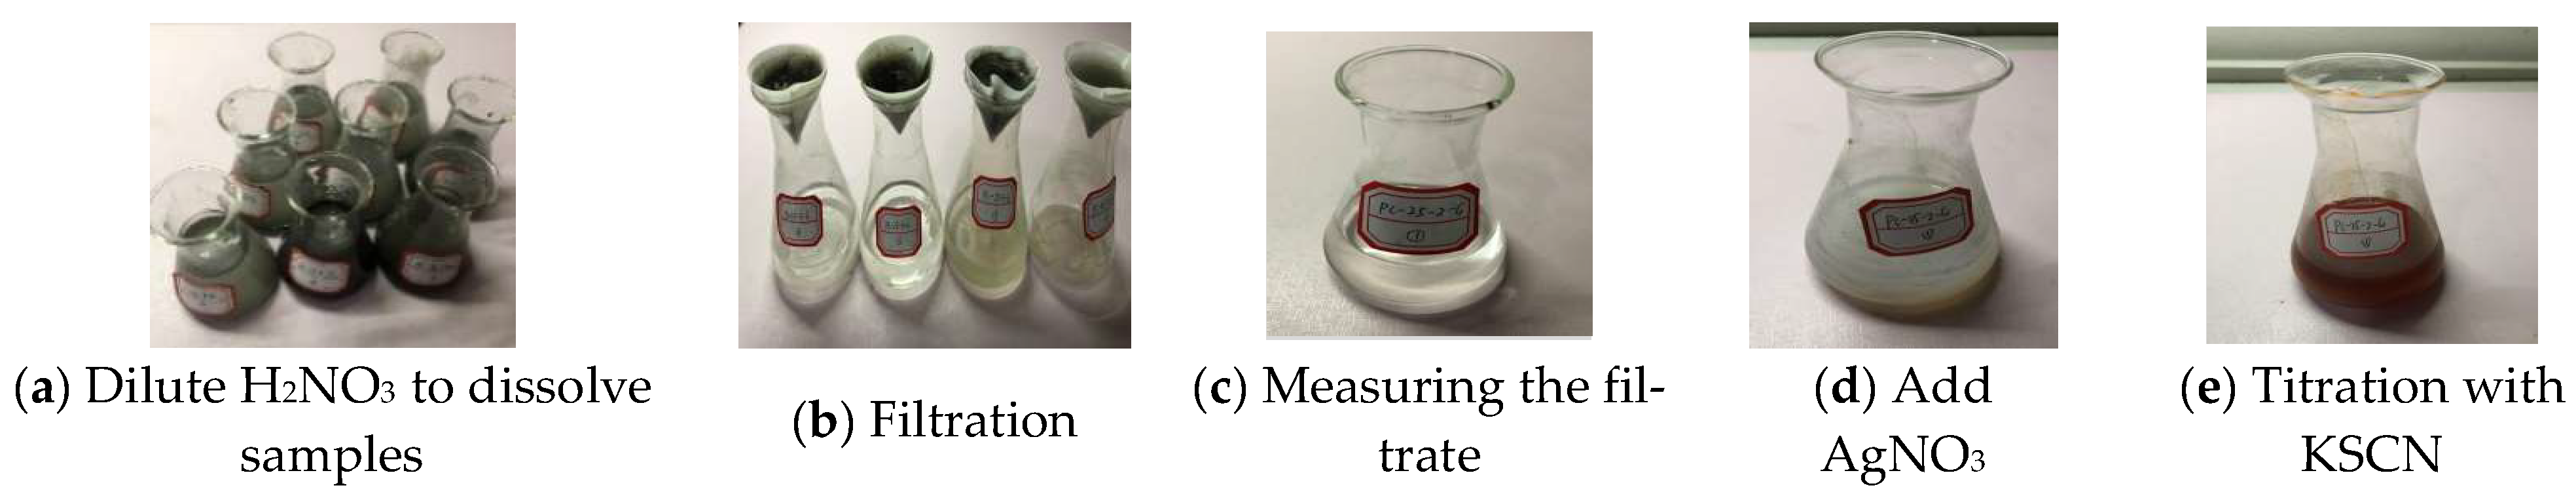
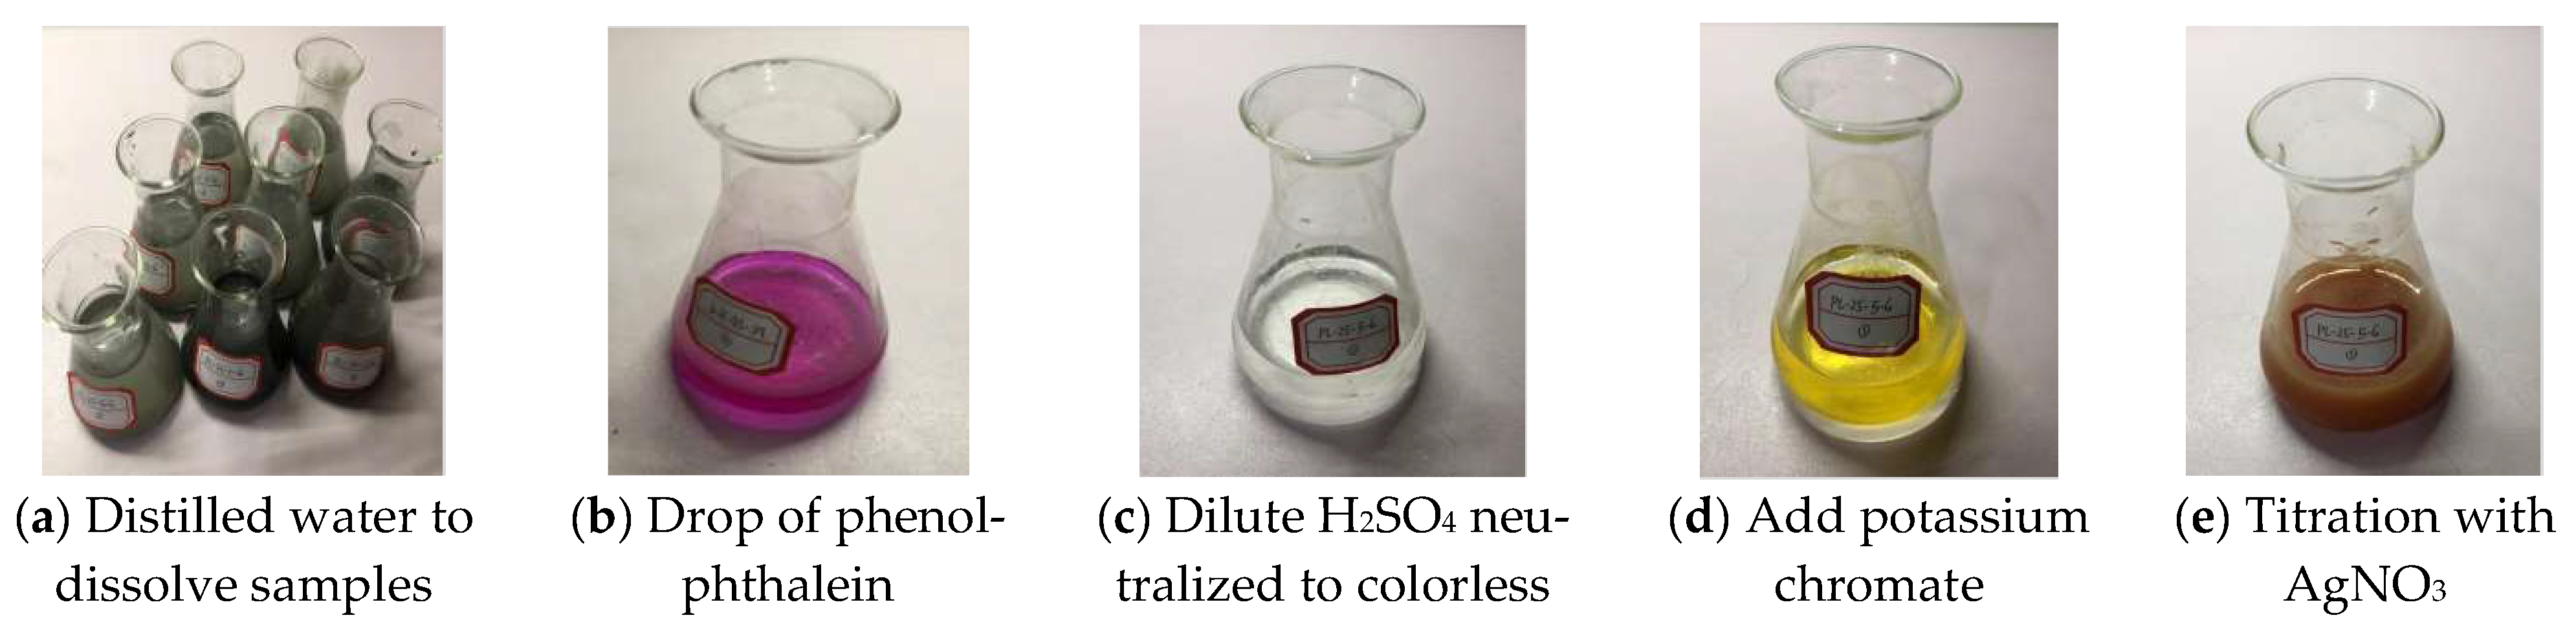
The Determination of Cl-

The free Cl- content of each group of samples was determined according to the Cl- content test method in the Test Procedure for Hydraulic Concrete (SL 352-2020) [52]. Binding Cl- content (Cl-b) = total Cl- content (Cl-t) -free Cl- content (Cl-f).
The determination process of total Cl- content is shown in Figure 4. The free Cl- content determination process is shown in Figure 5. After the test is finished, the total Cl- content and free Cl- content formula are shown in Equations (1) and (2).
C l - t = 0.03545 ( C A g N O 3 V C K S C N V 3 ) M V 2 / V 1 × 100 %
C l - f = C A g N O 3 V 5 × 0.03545 G V 4 / V 1 × 100 %
The flow chart of the methodology in this paper is shown in Figure 6.

3. Test Results and Discussion

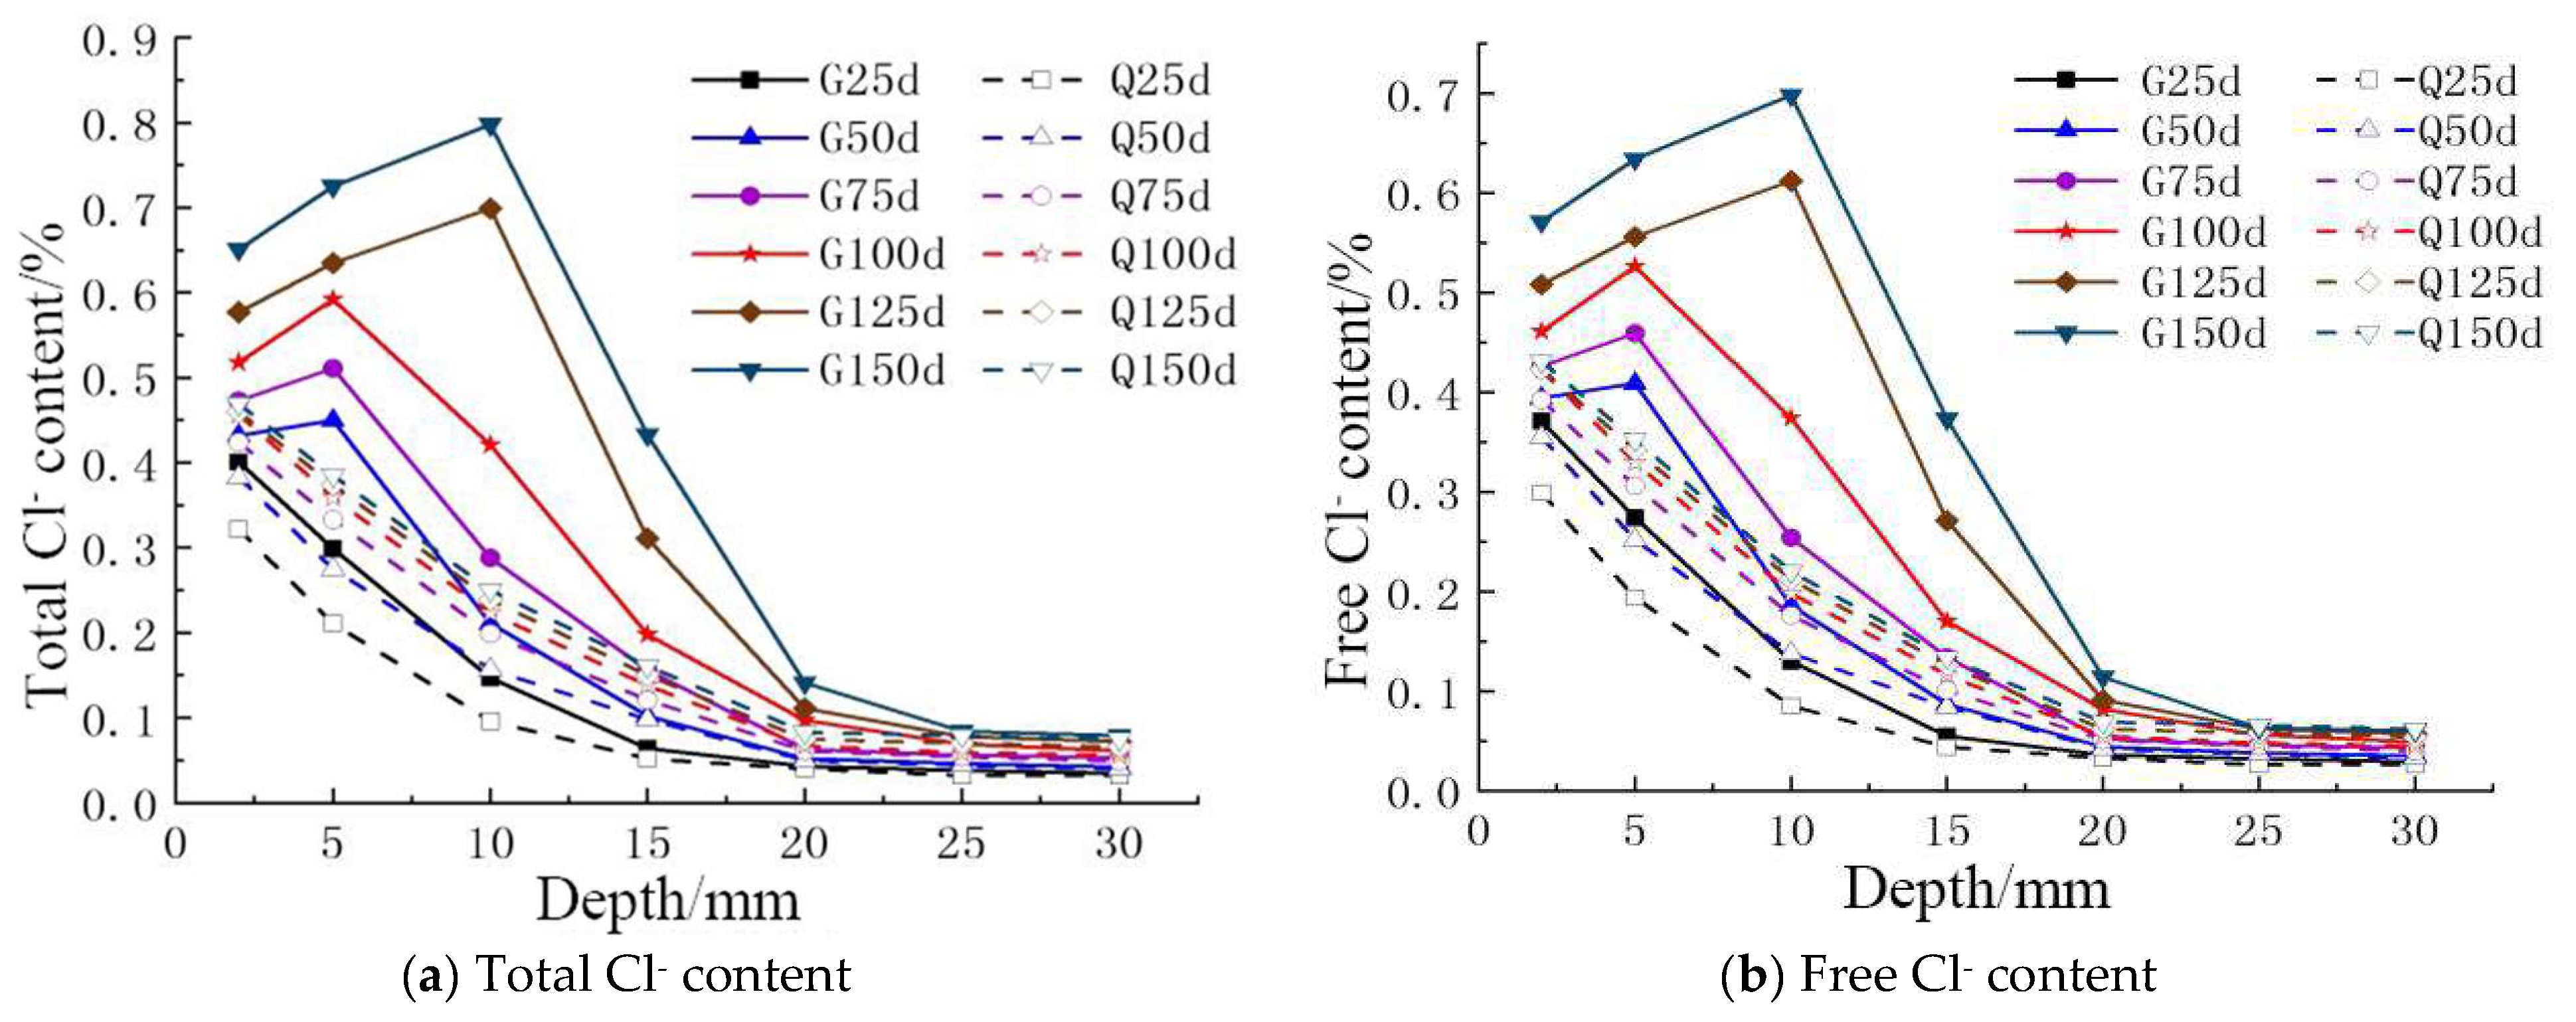
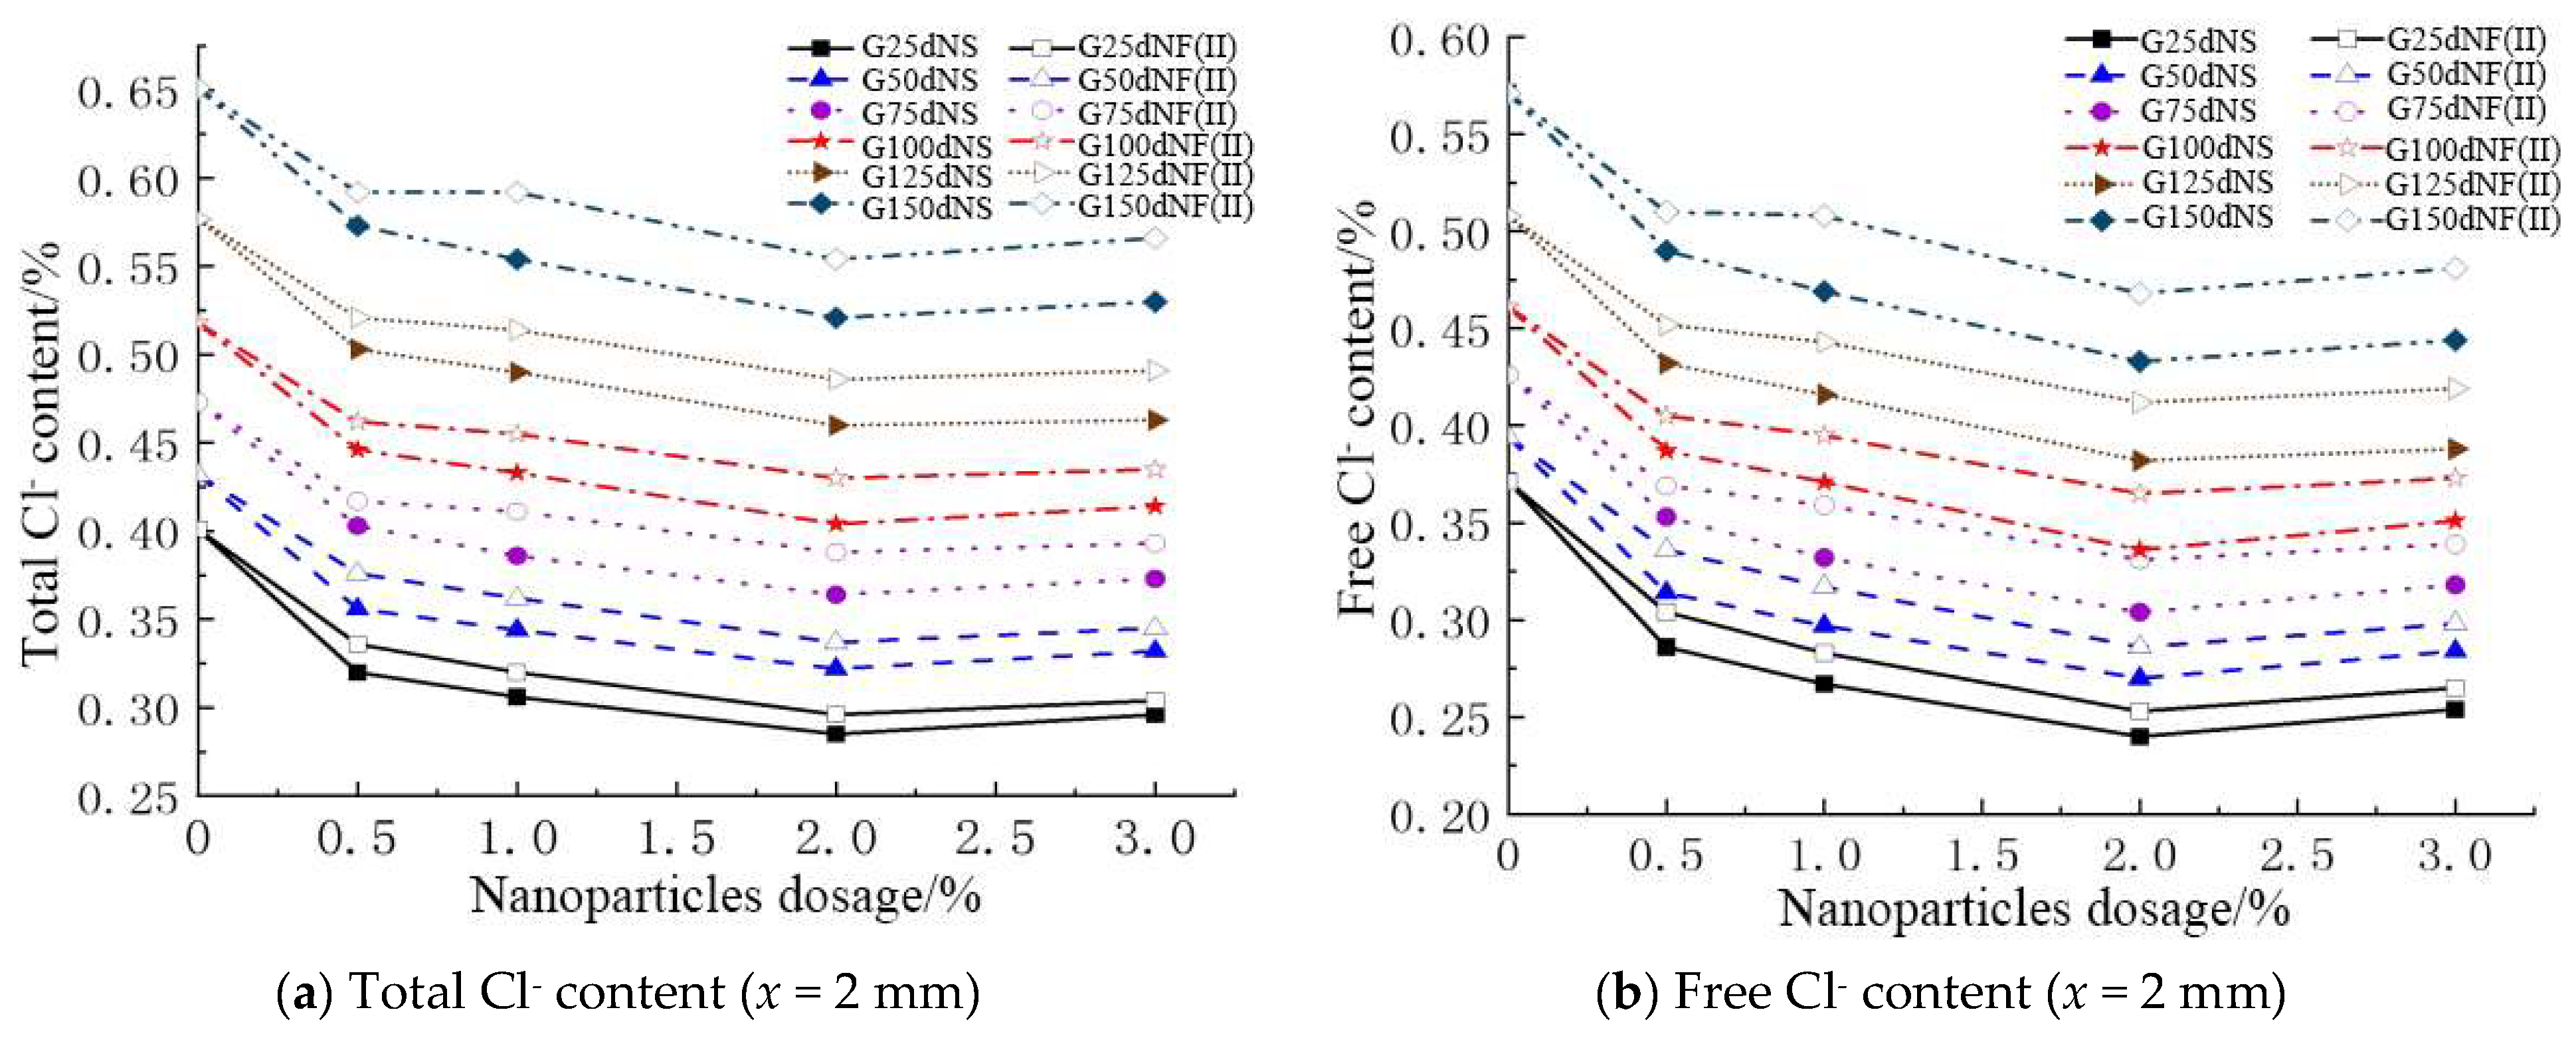
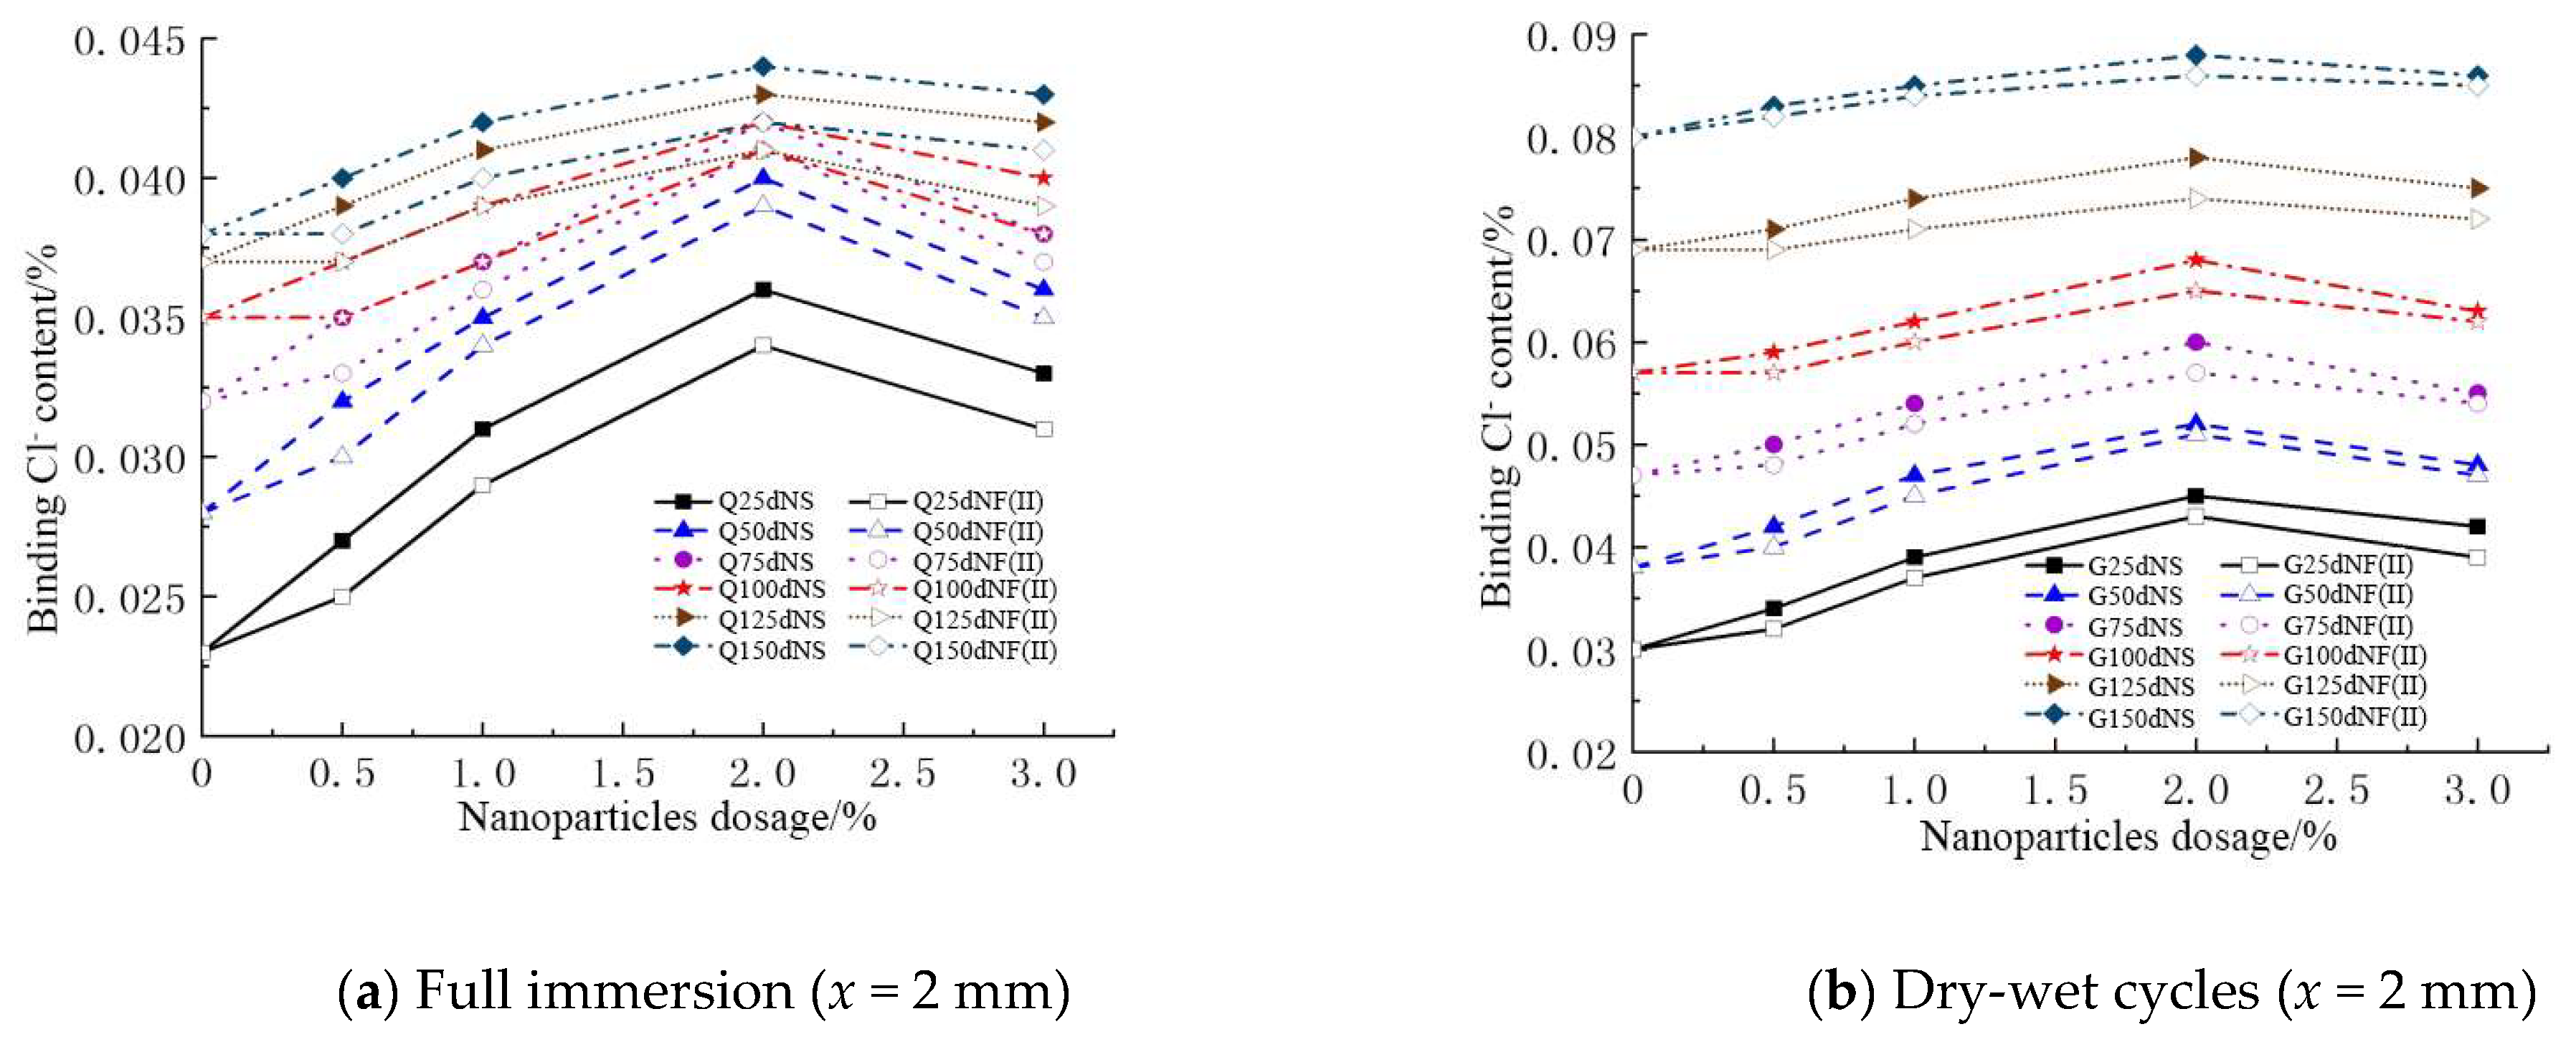
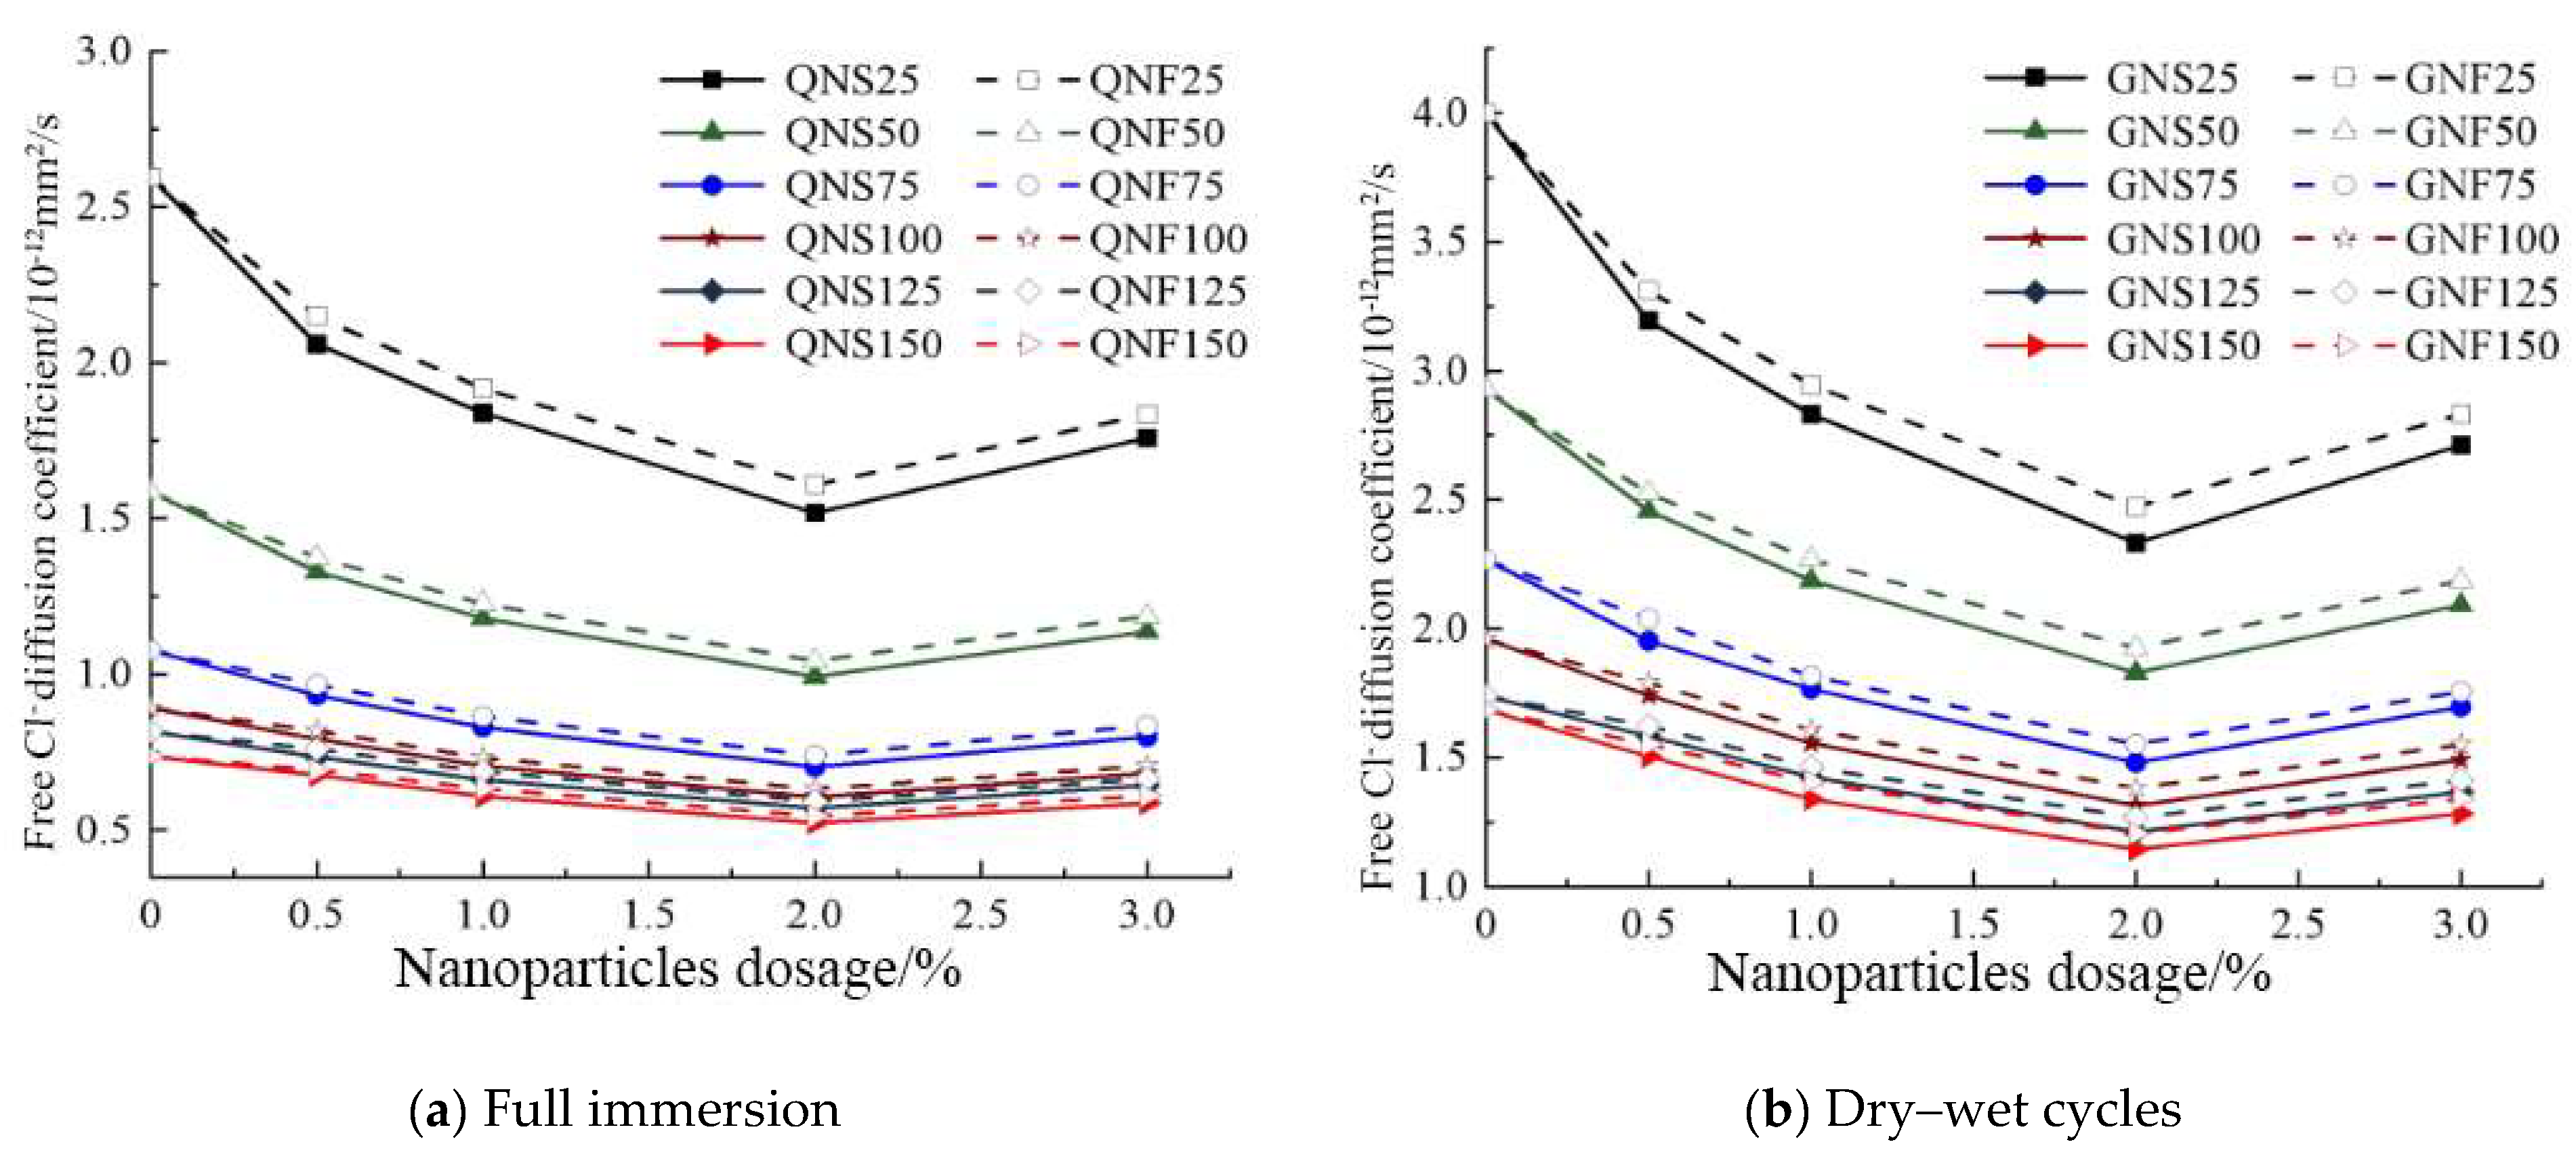
3.1. The Difference of Cl- Diffusion Process under the Action of Dry–Wet Cycles and Full Immersion

Figure 7 shows the variation curves of the total and free Cl- content of PC under the action of dry–wet cycles and full immersion with depth (x) and age (G and Q), where G and Q represent the number of dry–wet cycles and the time of full immersion, respectively (one period of dry–wet cycle is equal to full immersion for 1 day). The variation trend of total and free Cl- content in concrete with age and depth is basically the same under the action of dry–wet cycles and full immersion, but the total Cl- content is higher than the free Cl- content under the same condition. The content of Cl- at each age decreases gradually with the increase of depth until it becomes stable under the action of full immersion. When depth and age are constant, compared with the two test conditions, the Cl- content is higher under the action of dry–wet cycles, and the difference of Cl- content becomes sharper with the increase of G and Q.

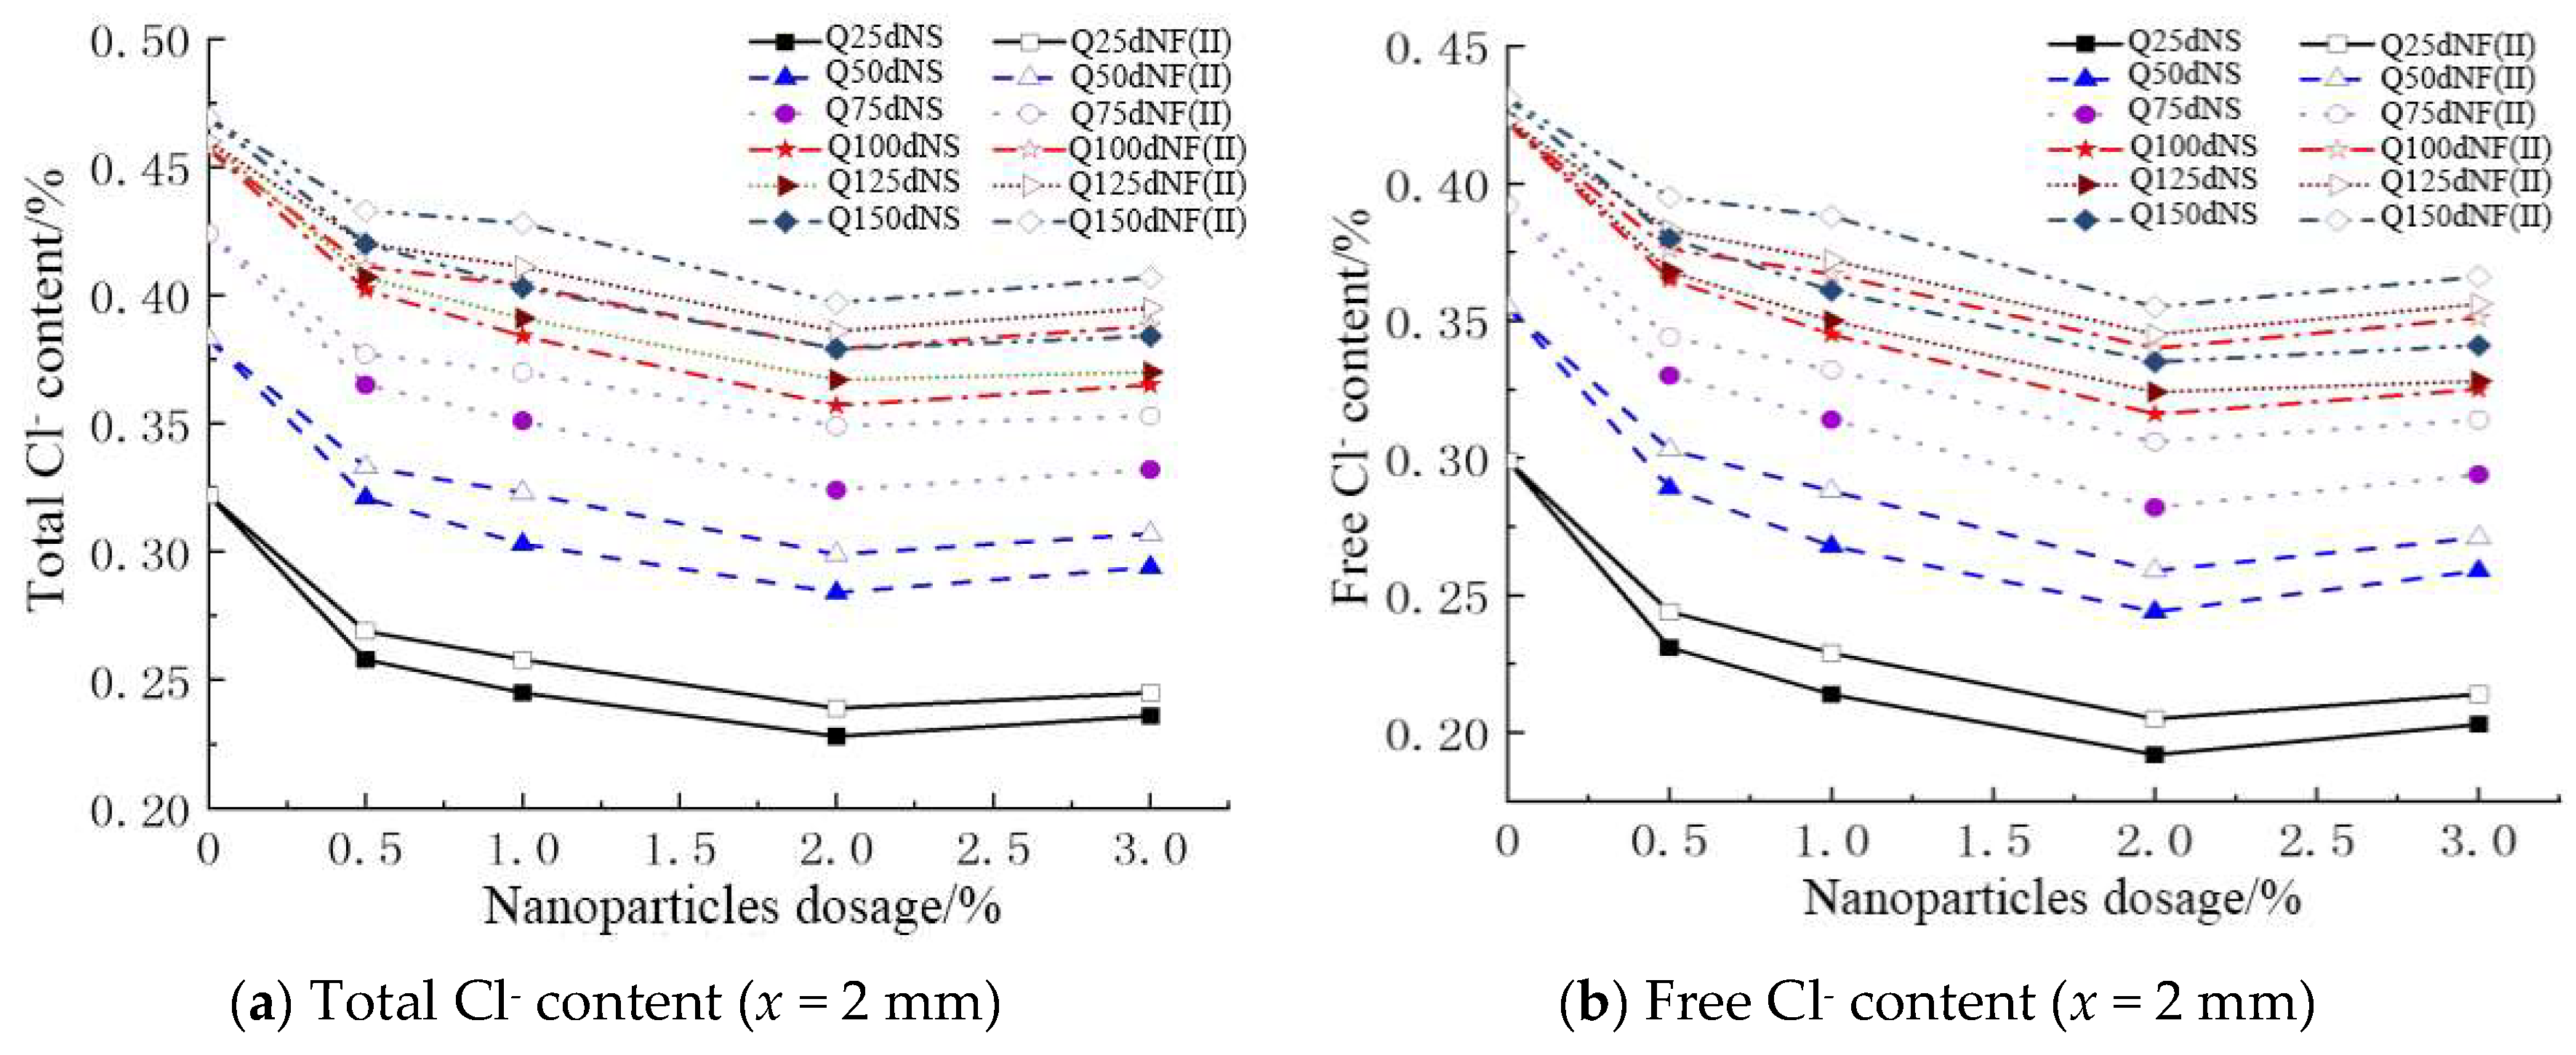
3.2. The Cl- Diffusion Performance of Marine Concretes under the Action of Dry–wet Cycles

Figure 8, Figure 9 and Figure 10 show the variation of Cl- content of marine concretes under the action of dry–wet cycles and full immersion, respectively (Take x = 2 mm as an example, the other depth has the same pattern). It can be seen that the content of total and free Cl- in NS, NF (II), and PC increased gradually with the increase of Q. When Q ≤ 100, the increase of Cl- content was higher than that of when Q > 100. The total and free Cl- content of NS and NF(II) with different dosages are is lower than that of PC. This indicated that nano-SiO2 and nano-Fe3O4 particles can improve the Cl- erosion resistance of concrete. When the dosage and ag-e are constant, the binding Cl- content and binding Cl- capacity of NS are higher than that of NF(II) under the action of wet-dry cycles and full immersion, which proves that nano-SiO2 has a better effect on improving Cl- erosion performance. When the number of dry–wet cycles and the age of full immersion are the same, the total and free Cl- content of NS is lower than that of NF(II). This indicated that nano-SiO2 has a better effect on improving the Cl- erosion resistance of concrete than that of nano-Fe3O4. The total and free Cl- contents of both NS and NF(II) initially decreased, then increased with additional admixture, and the optimal dosage of nano-SiO2 and nano-Fe3O4 is about 2%. When the dosage and age are constant, the binding Cl- content and binding Cl- capacity of NS are higher than those of NF(II) under the action of dry–wet cycles and full immersion. The binding Cl- content bottomed out at the optimal dosage.

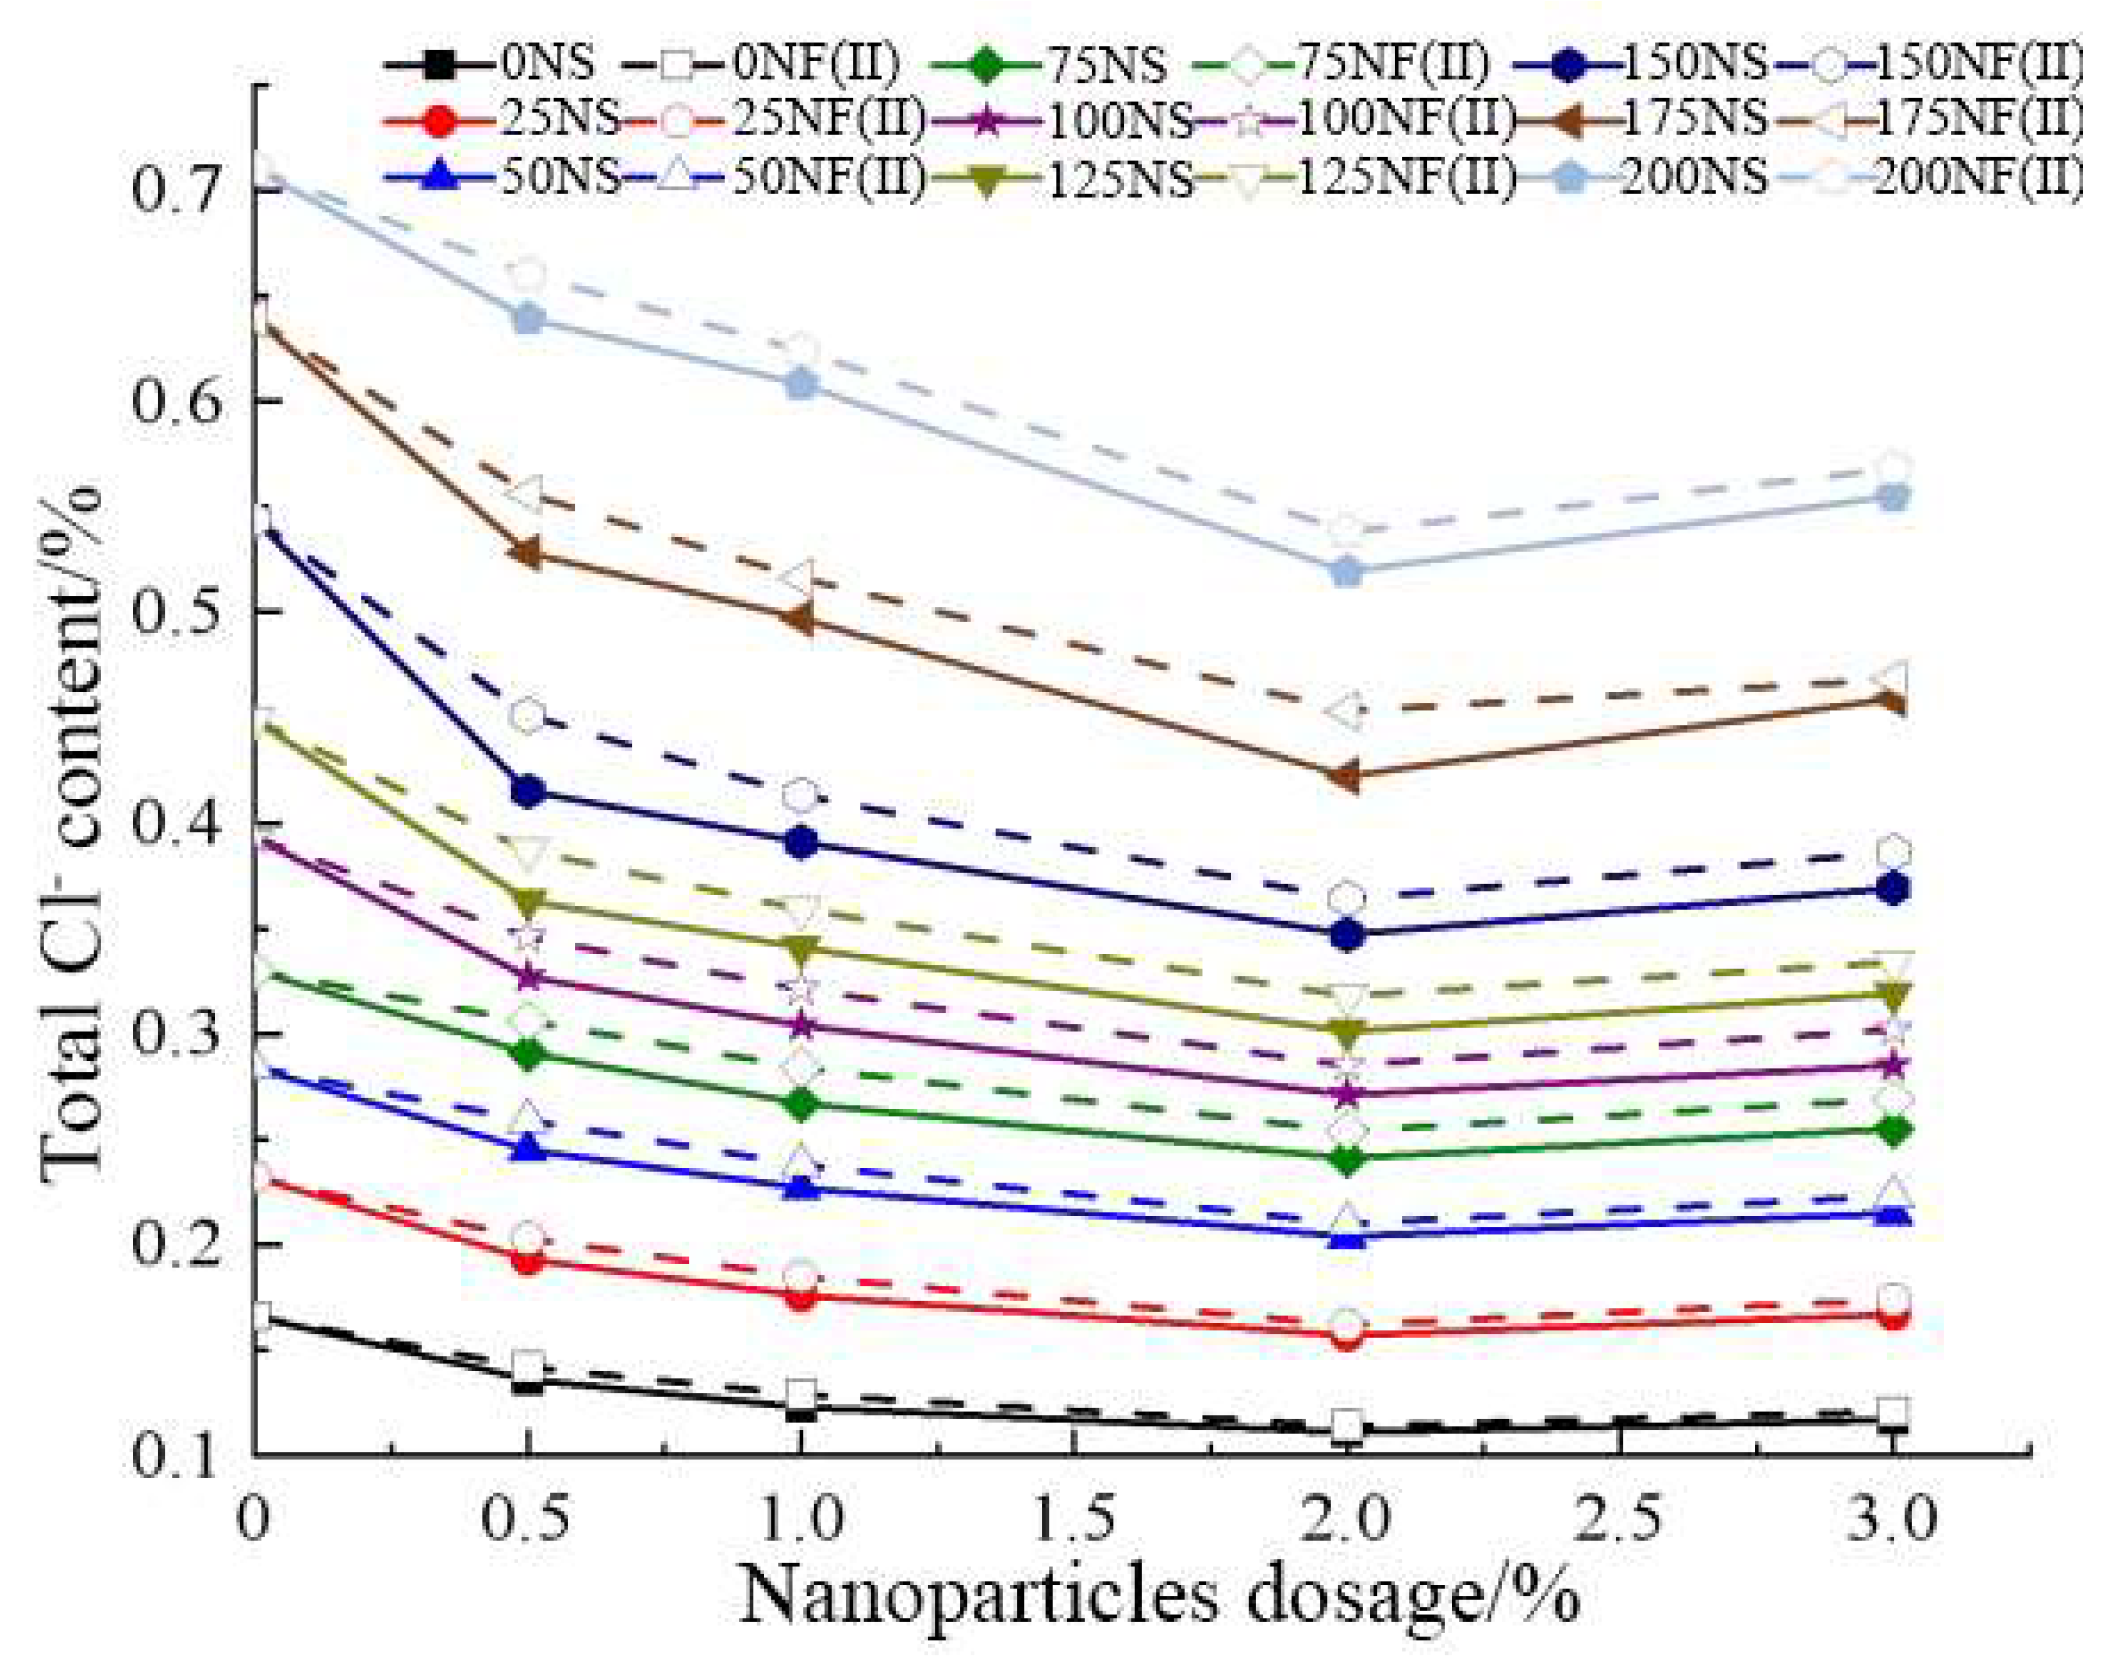
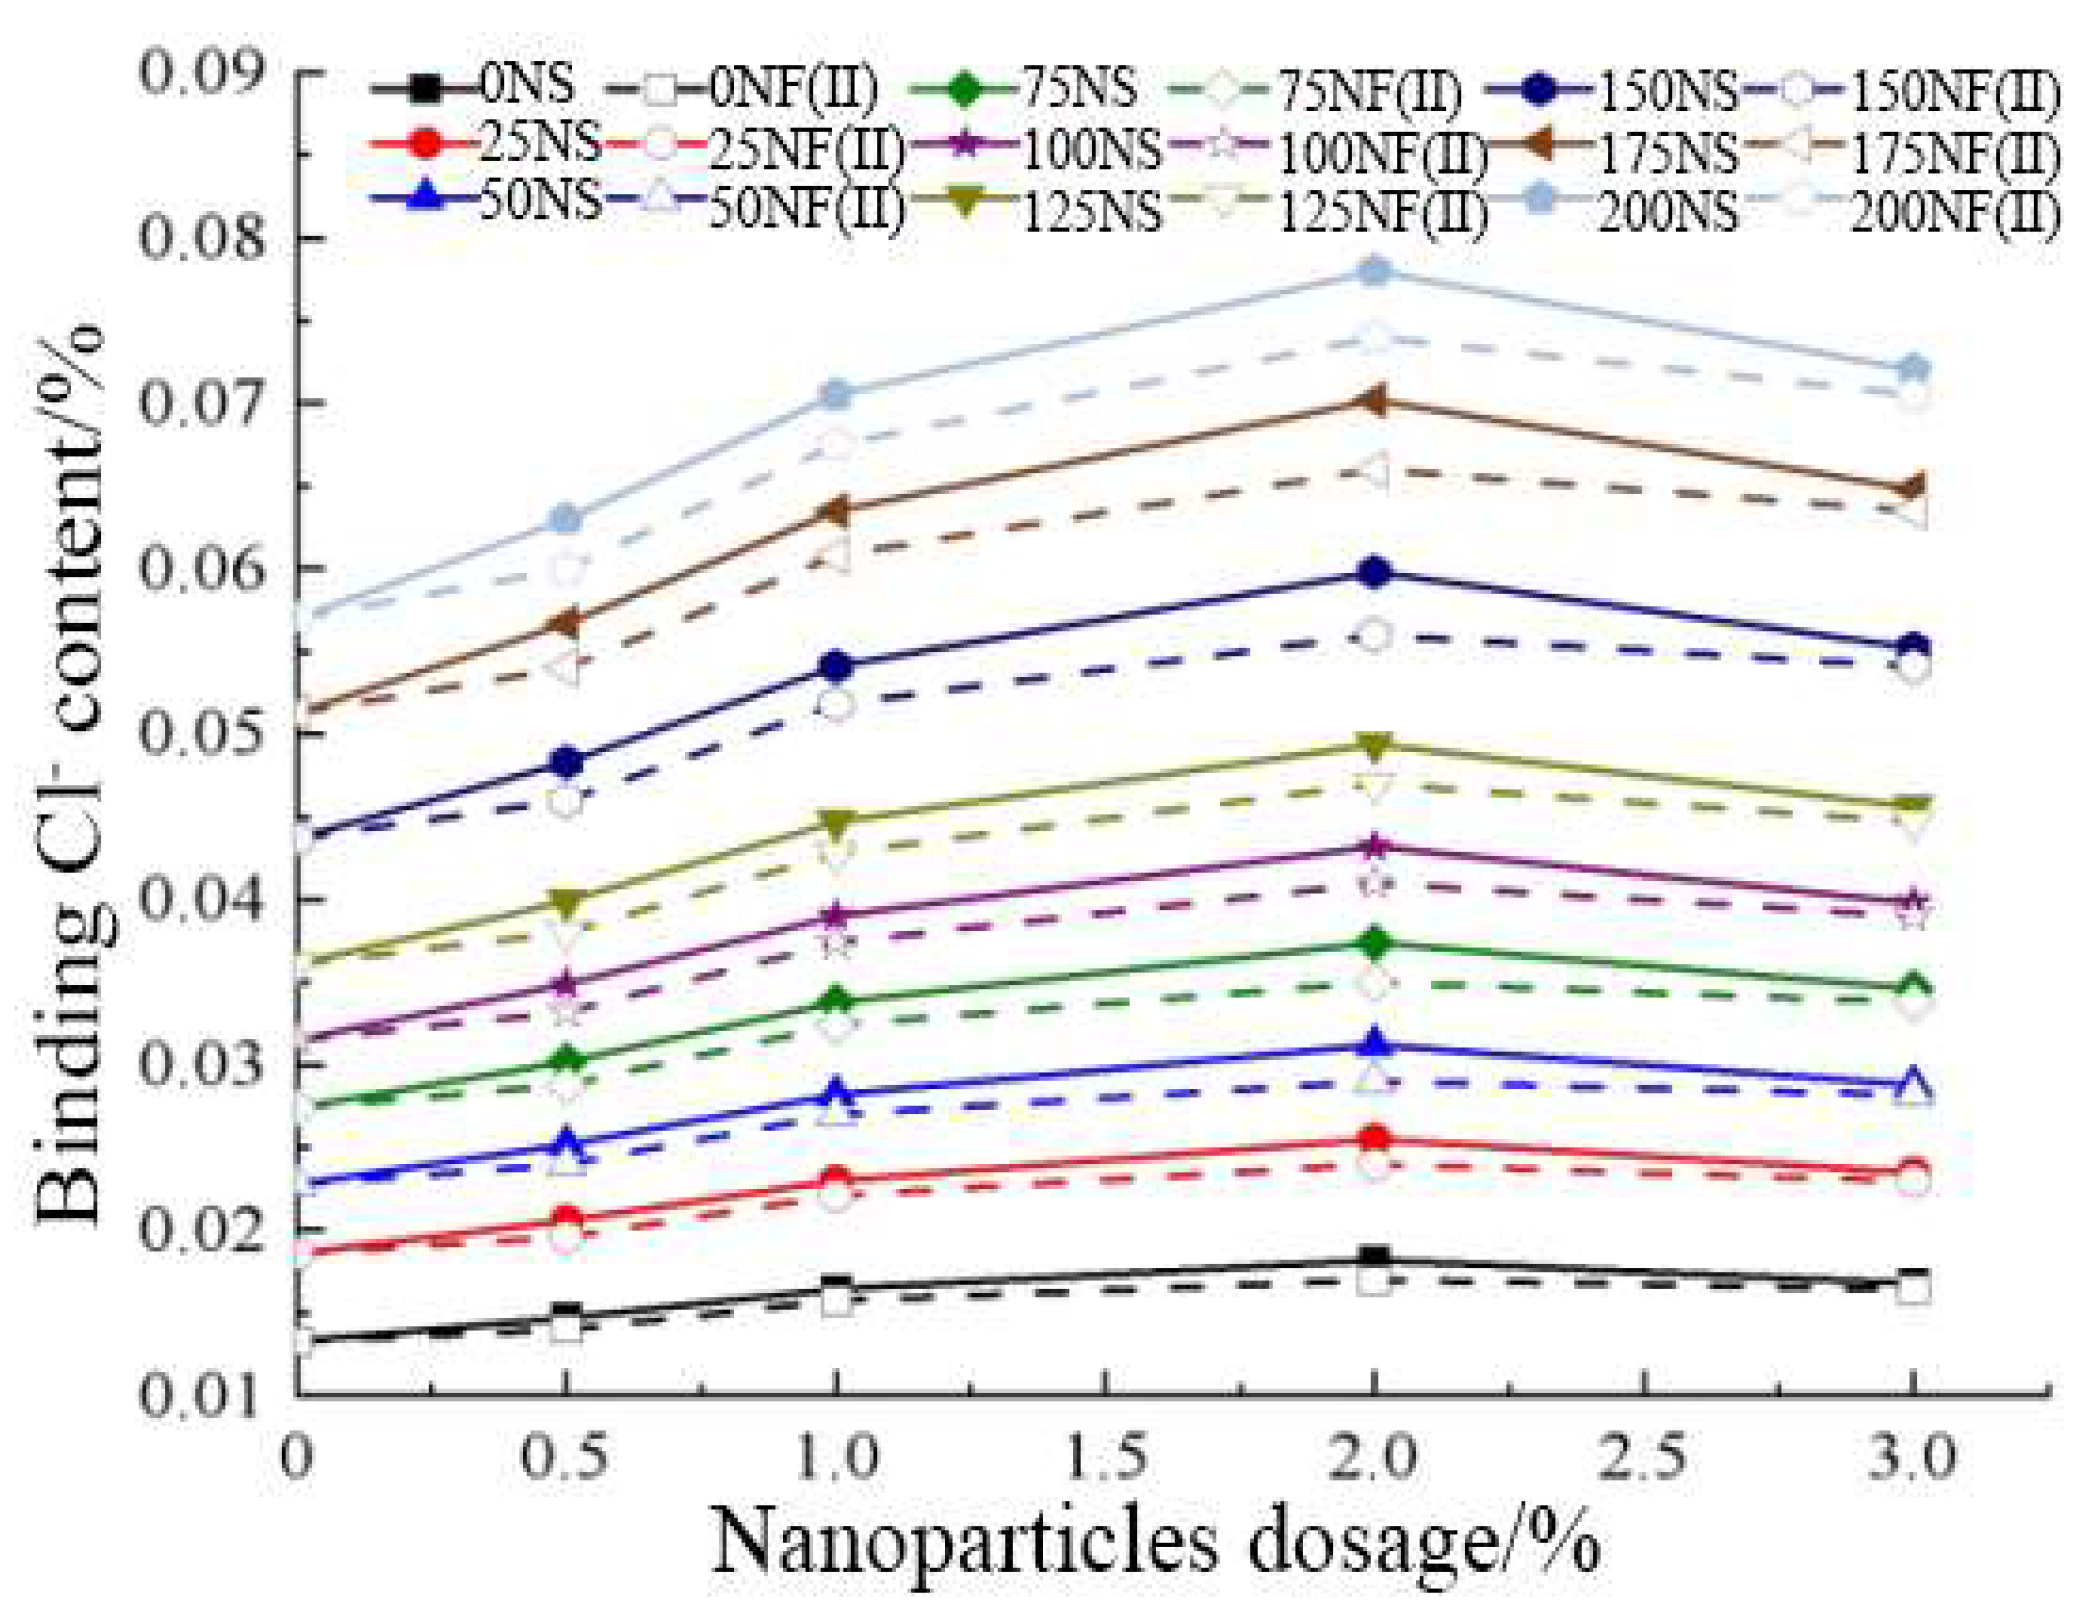
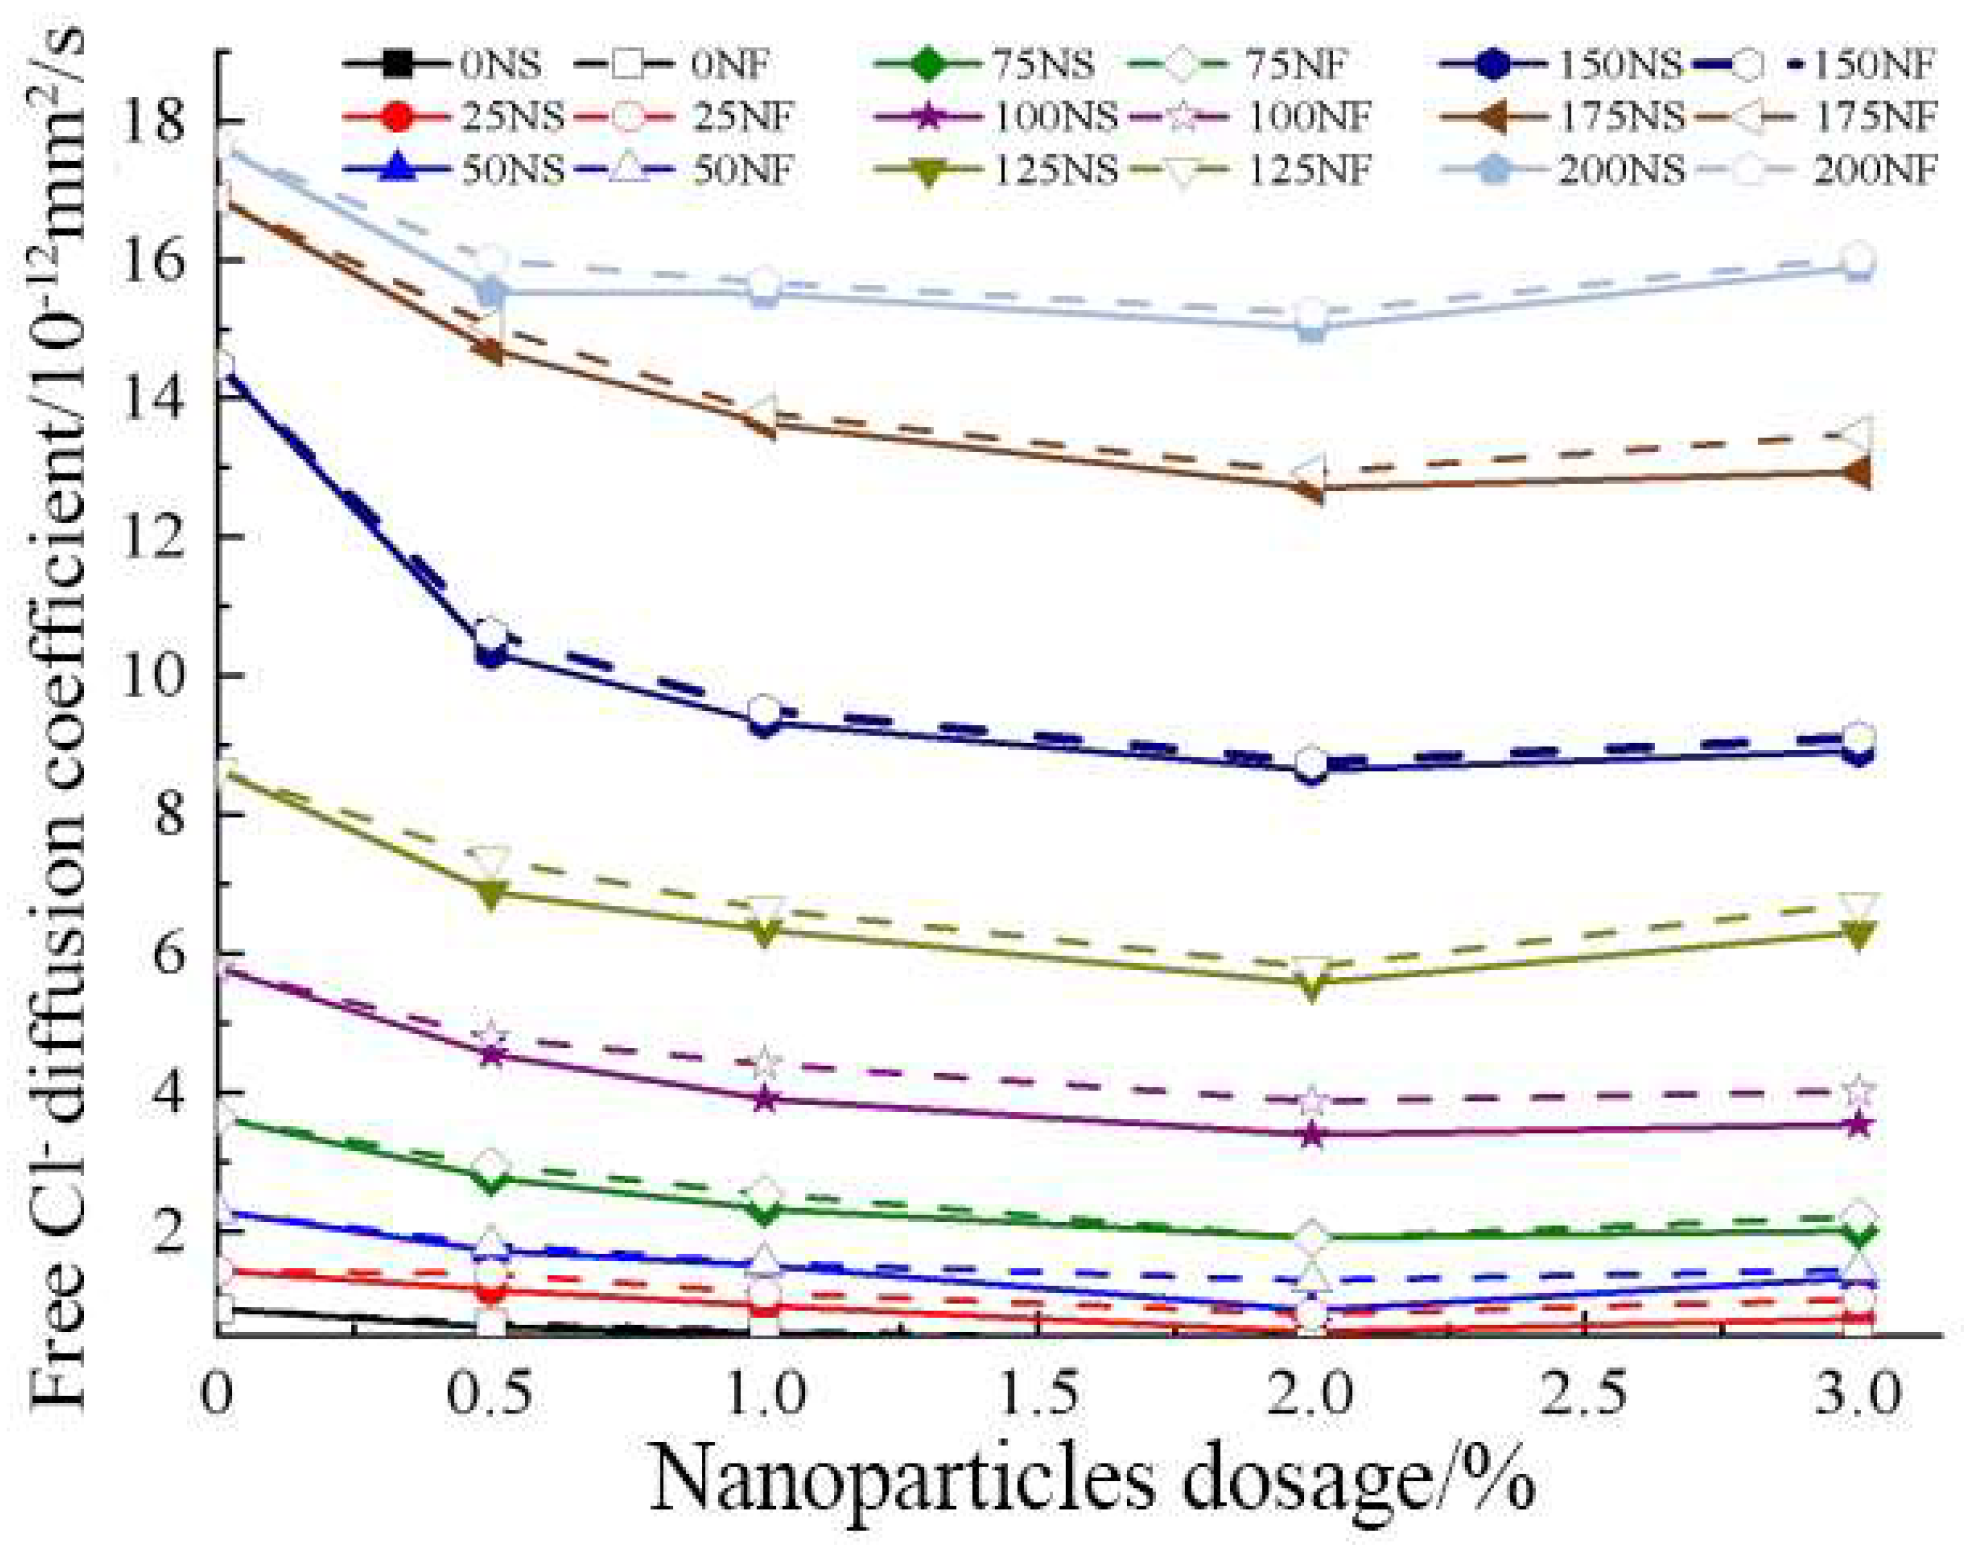
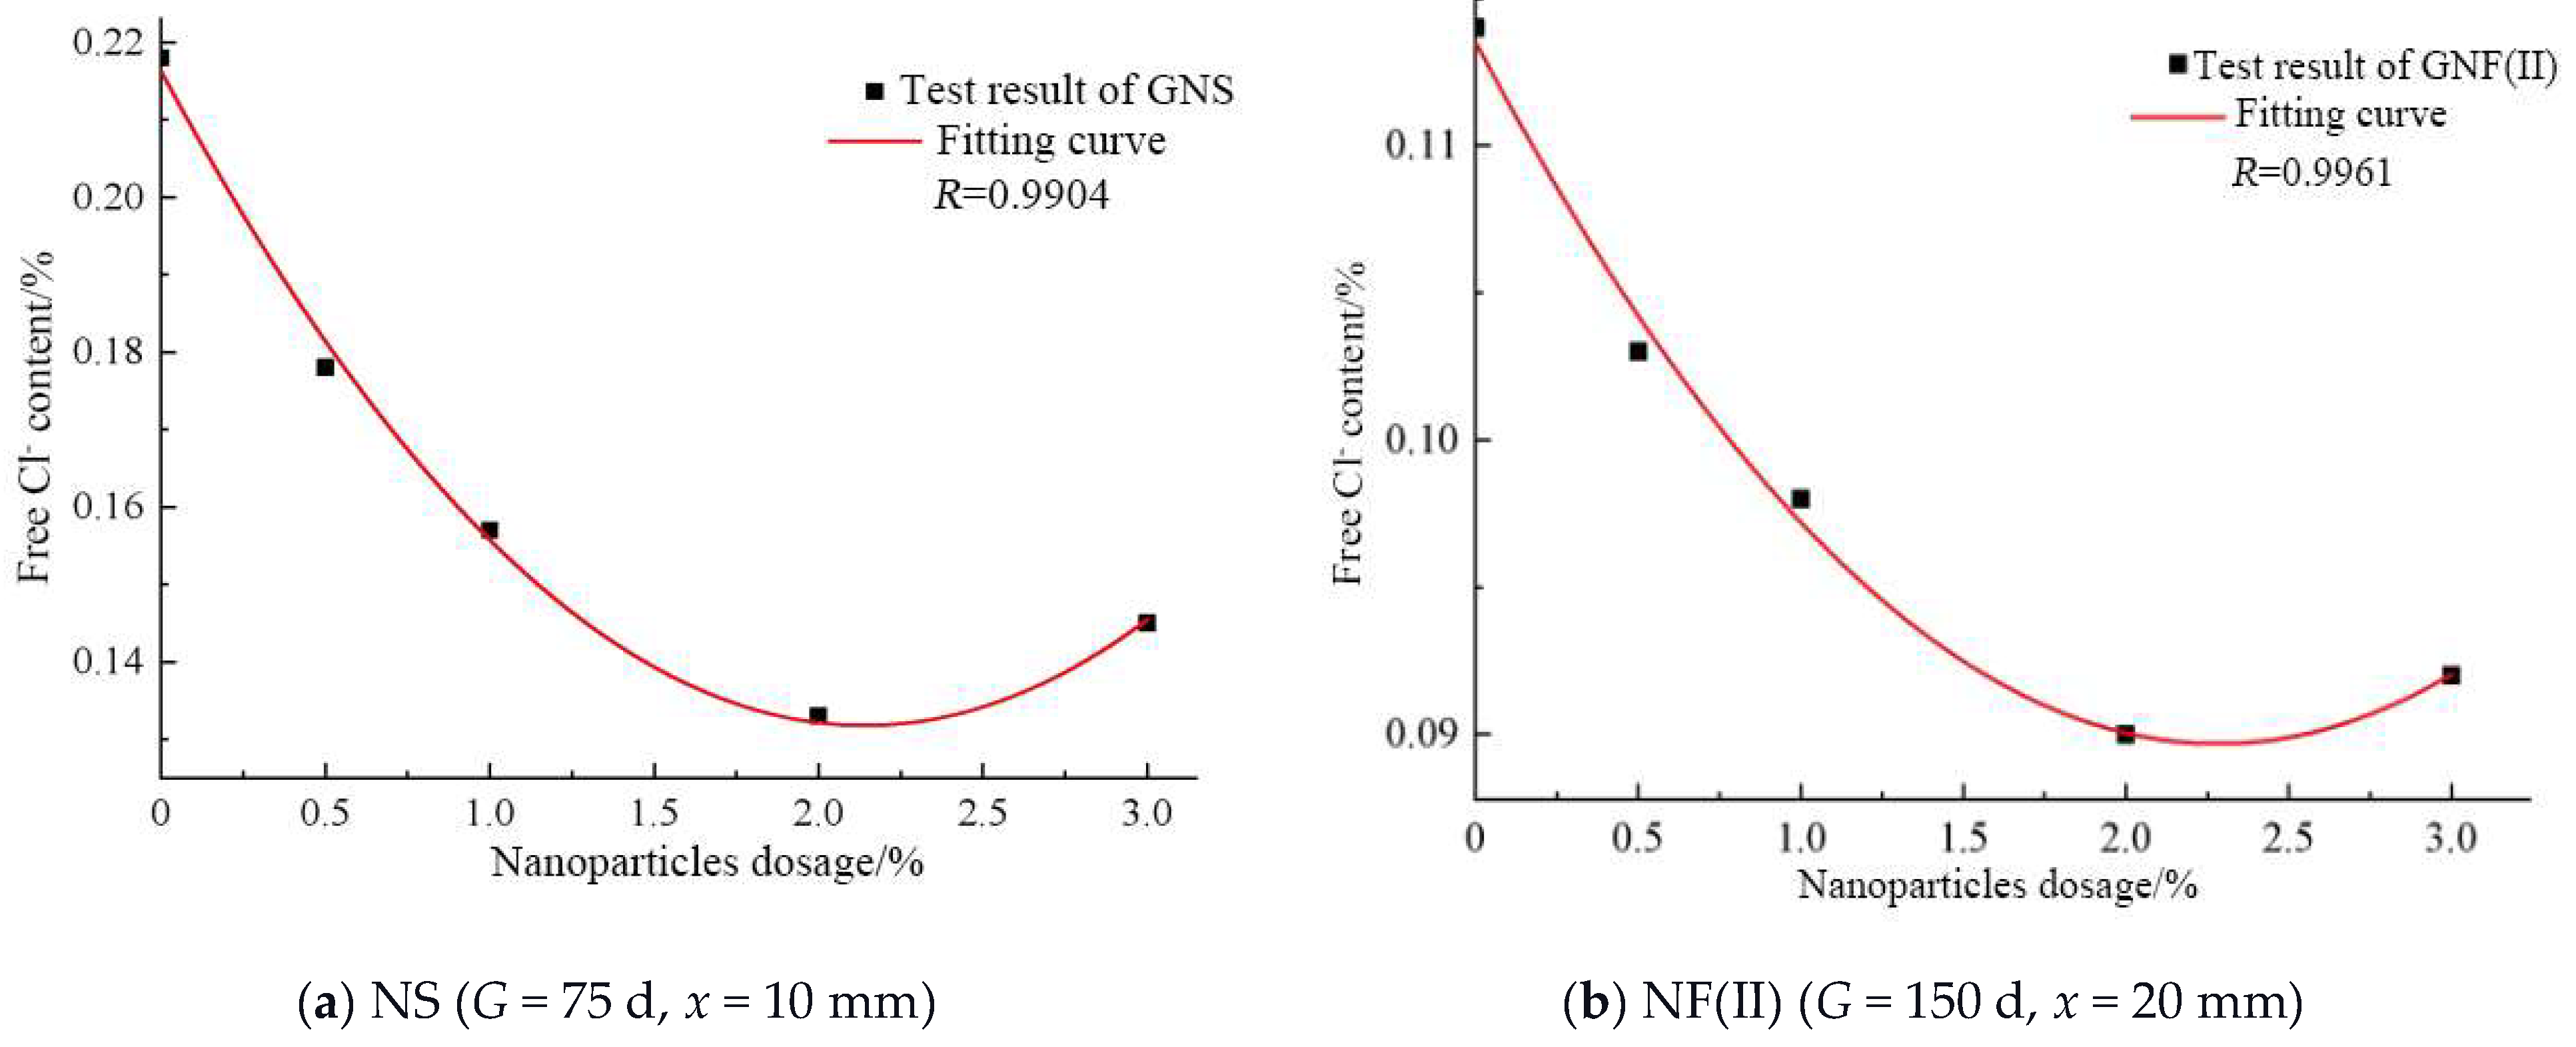
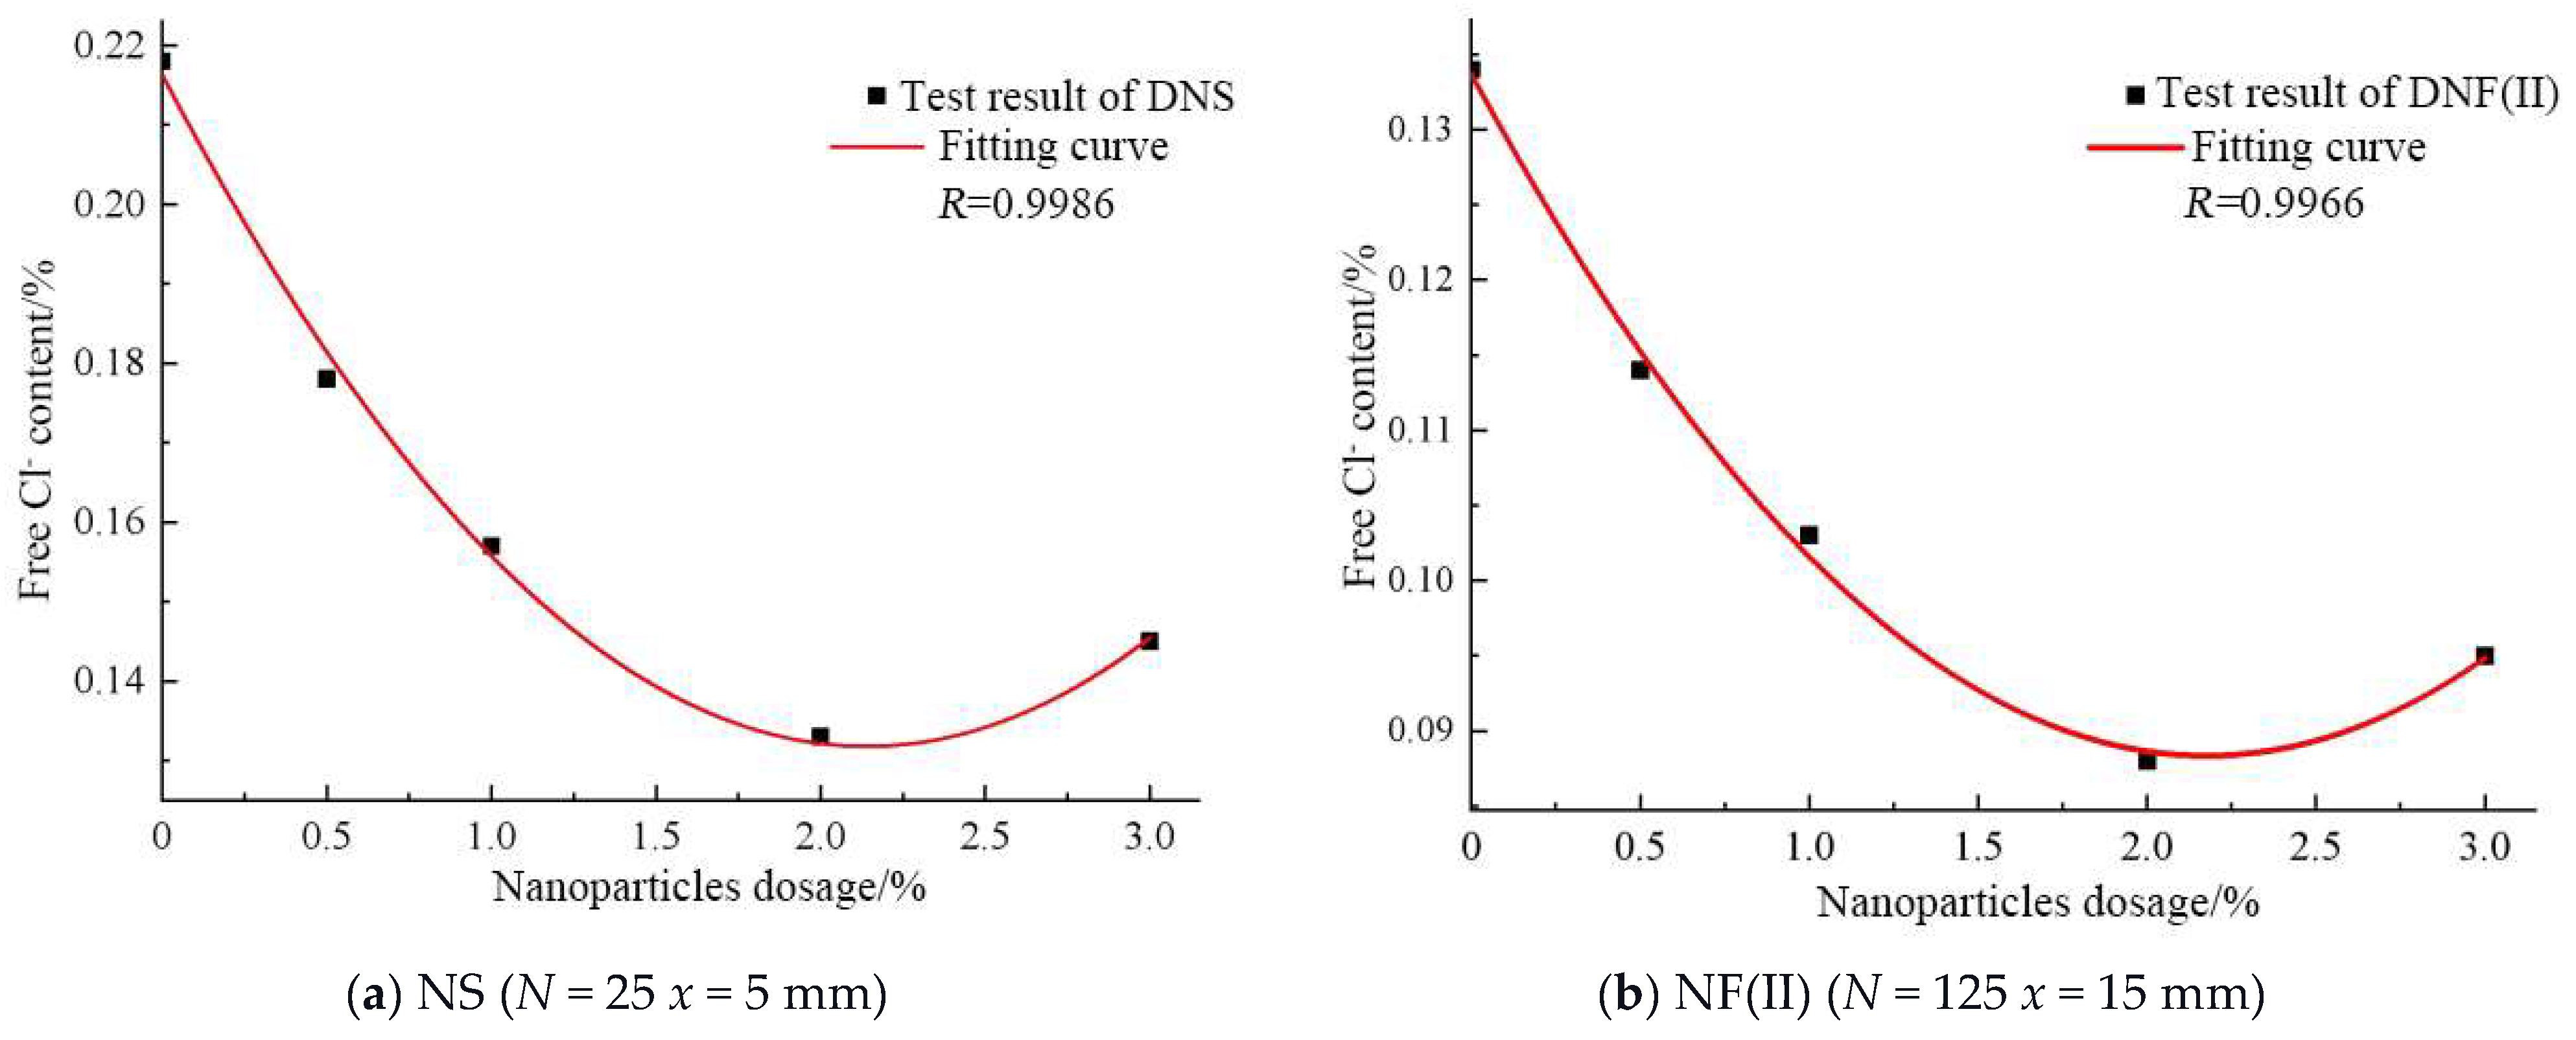
3.3. The Cl- Diffusion Performance of Marine Concretes under the Action of Salt Freeze–thaw Cycles

Figure 11 and Figure 12 show the variation regulation of the total and binding Cl- contents of NS and NF(II) with a dosage under the action of salt freeze–thaw cycles, respectively. (Taking 5 mm depth as an example, the other depth has the same pattern). The variation regulation of free Cl- content is similar to that of total Cl- content. It can be seen that the total Cl- content of NS and NF(II) is lower than that of PC, while the binding Cl- content is higher than that of PC. This indicated that nanoparticles can solidify the Cl- of pores in concrete, reduce free Cl- content, and improve Cl- erosion resistance of concrete under the action of freeze–thaw cycles. The total Cl- content of NS and NF(II) initially decreased, then increased with the additional admixture, and the binding Cl- content initially increased and then decreased with the additional admixture. When A = 2%, the total Cl- content of NS and NF(II) was the lowest, and the binding Cl- content was the highest. This indicated that the effect of improving the salt freeze–thaw resistance of concrete was the best at A = 2%. When the dosage and age are constant, the total Cl- content of NS is lower than NF(II), and the binding Cl- content of NS is higher than NF(II). This indicated that the effect of improving the salt freeze–thaw resistance of nano-SiO2 is better than that of nano-Fe3O4.

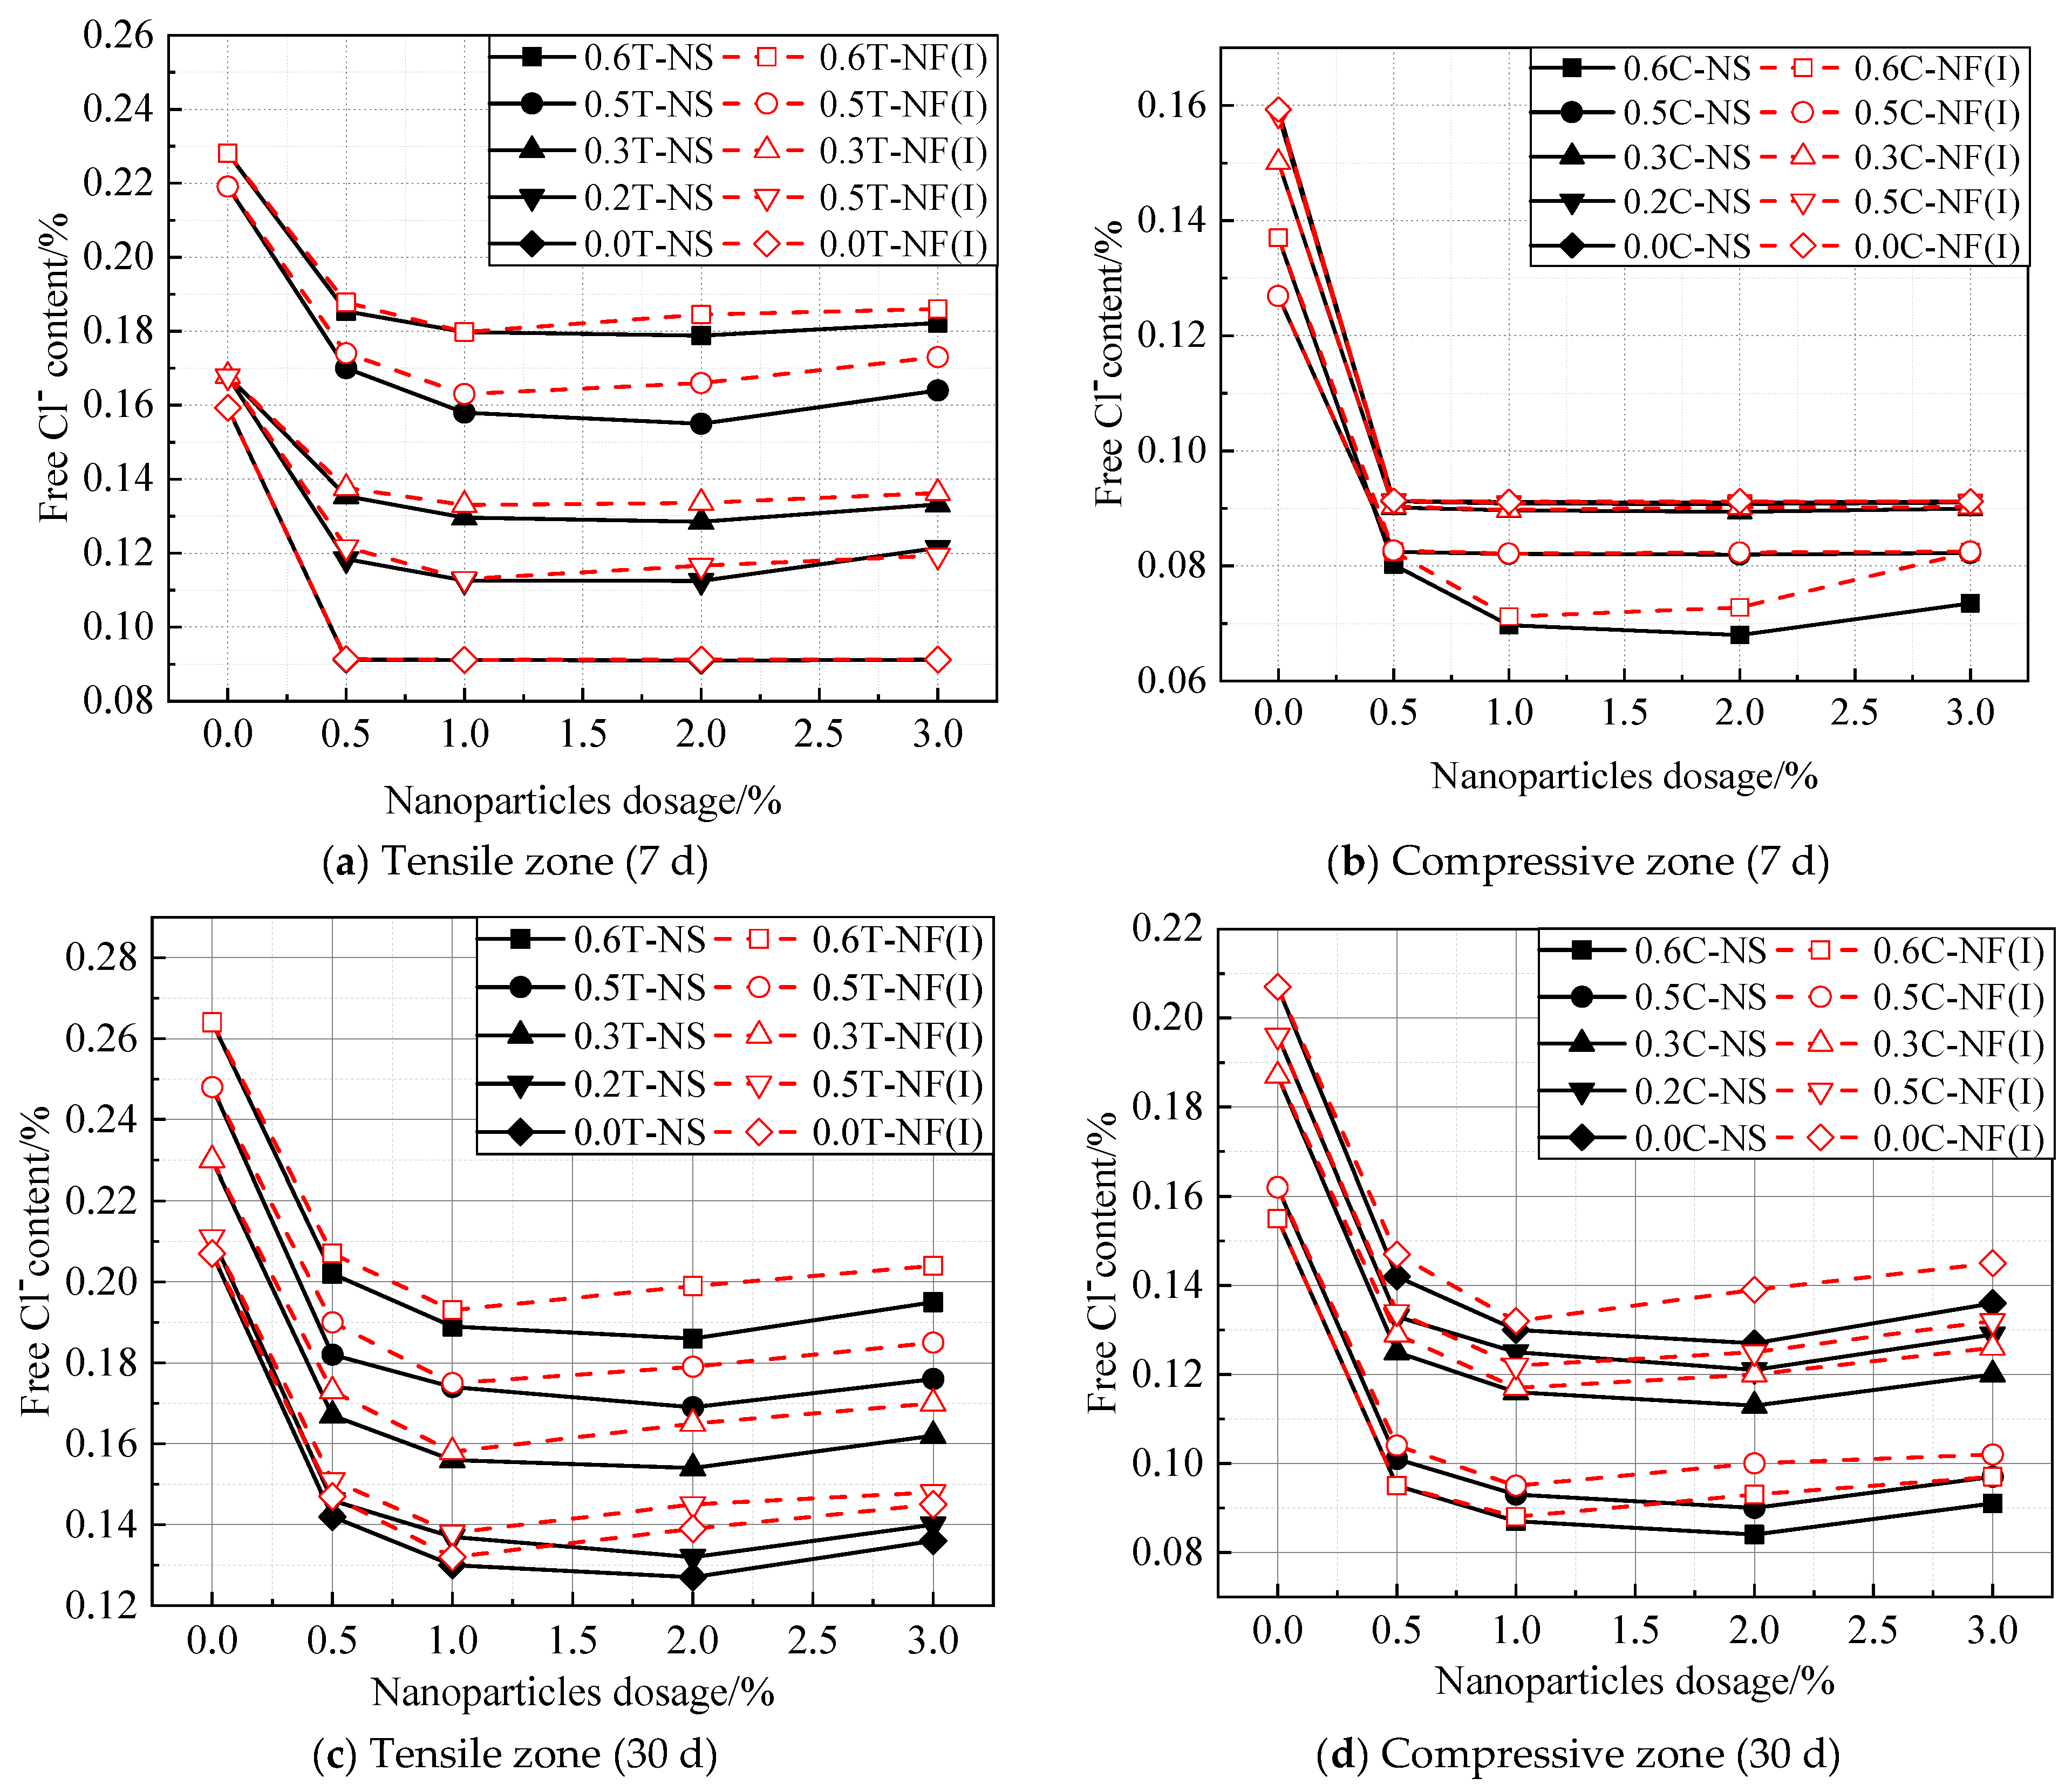
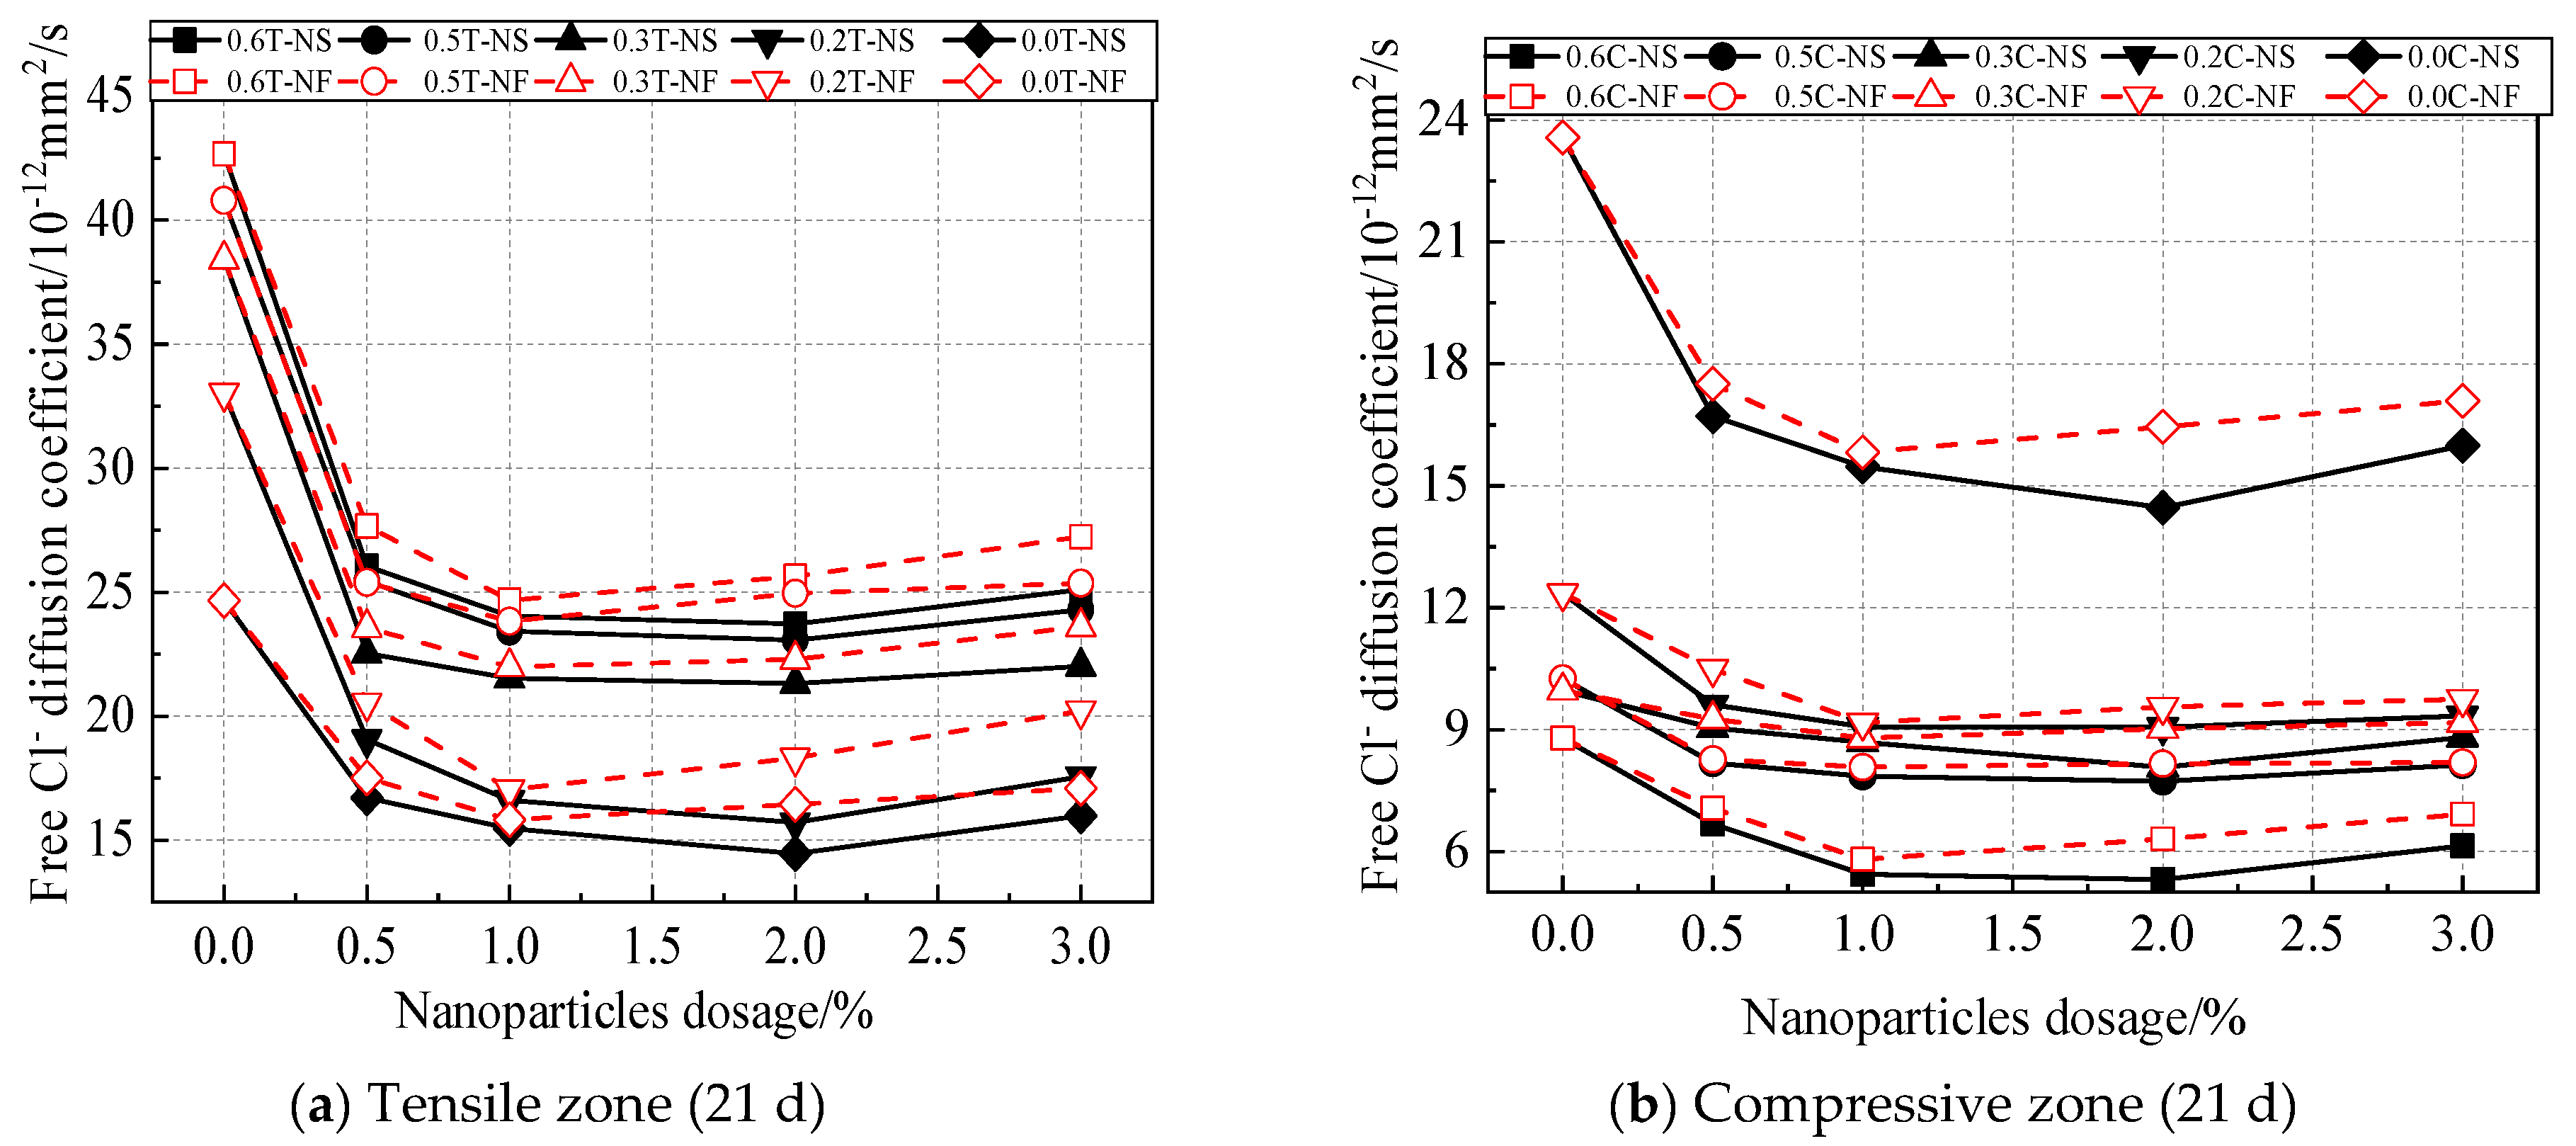
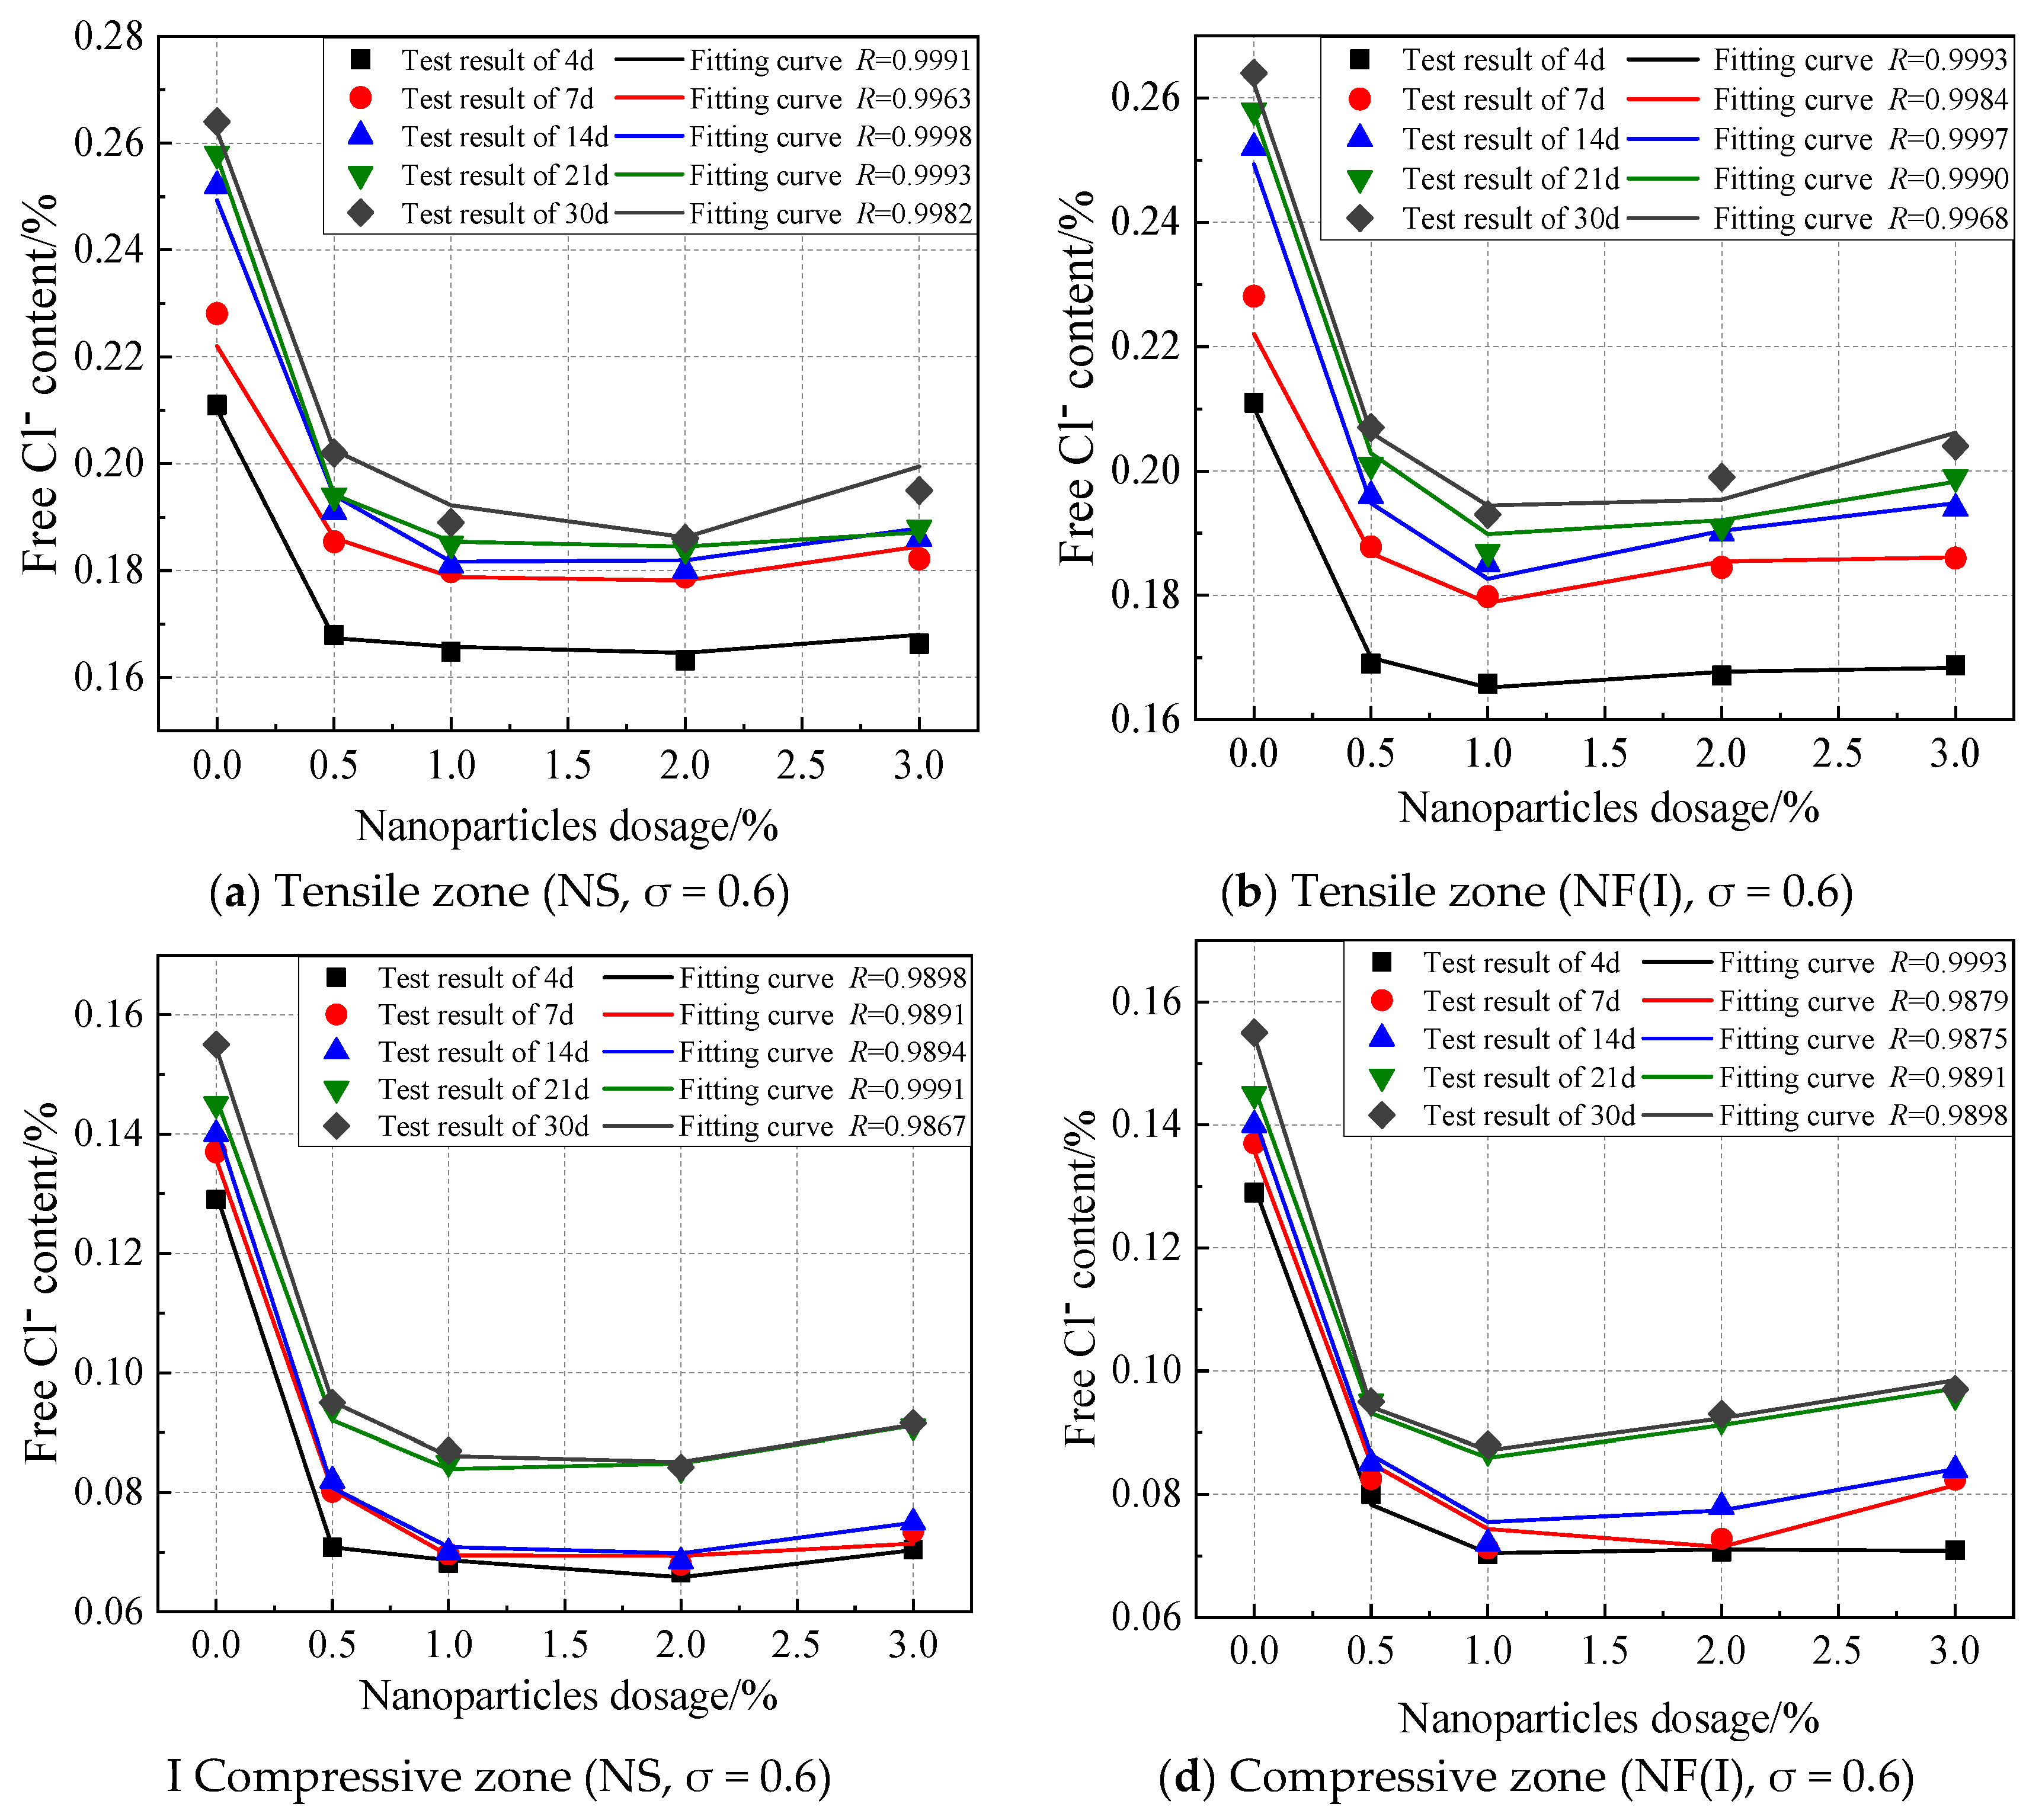
3.4. Free Cl- Diffusion Performance of Marine Concretes under the Combined Action of Bending Load and Salt Spray Erosion

Figure 13 shows the relationship between free Cl-, the content of NS and NF(I), and the nanoparticle admixture (x = 5 mm, 7 d and 30 d was used as an example, and the rest of the depth range has the same trend with age). T and C in the Figure represent the tensile and compressive zones, respectively; 0, 0.2, 0.3, 0.5 and 0.6 in the Figure represent the stress ratio, respectively. It can be seen that the free Cl- content in the tensile and compressive zones of nano-SiO2 and nano-Fe2O3 concrete with different dosages under different stress conditions are lower than those of PC. This indicated that the amount of nano-SiO2 and nano-Fe2O3 improved the durability performance of marine concretes. The free Cl- content of both NS and NF(I) initially decreased, then increased with the increase of dosages, and the free Cl- contents of nano-SiO2 and nano-Fe2O3 are the lowest at A = 2% and A = 1% under different stress conditions. With increasing stress, the free Cl- content in the tensile zone of concretes (PC, NS, NF(I)) gradually increased at the same dosage, and the free Cl- in the compressive zone gradually decreased. Compared with the unloaded condition, when the test age was at 30 d, the free Cl- levels in the marine concretes increased less when the stress ratio was 0.2. When σ ≥ 0.3, free Cl- contents significantly increased, while free Cl- in the compressive zone clearly decreased when the stress ratio was small.

4. Cl- Diffusion Modified Model

4.1. Basic Model

The studies reported that [53] Fick’s second law can explain the diffusion path of Cl- in concrete, and its expression is as follows:
C T = D 2 C x 2
where C is the chloride content (%); T is the time of concrete exposed to Cl- environment (s); x is depth (mm); D is Cl- diffusion coefficient of concrete(m2/s).
When the boundary conditions are: C(0,T) = Cs; When C(x,0) = 0, Equation (4) can be written:
C ( x , T ) = C 0 + ( C s C 0 ) [ 1 e r f ( x 2 D T ) ]
where C0 is the initial chloride content (%) in concrete; Cs is the apparent chloride content (%) in concrete; T is the test age of concrete(s); erf is the error function, e r f u = 2 π 0 u e t 2 d t .
However, the actual diffusion path of Cl- is complicated. Concrete is a kind of porous and heterogeneous material, and the chloride diffusion coefficient is not constant. Moreover, the diffusion path of Cl- in concrete is influenced by multiple environmental factors, such as temperature, loads, and other factors on the action of diffusion and binding of Cl-. Therefore, Fick’s second law needs to be modified based on the above problems in this paper.

4.2. Cl- Diffusion Coefficient

Cl- diffusion coefficient is an important parameter that describes the diffusion speed of Cl- in concrete. The free Cl- content of each group of marine concretes at different depths was substituted into the Equation (4), the total and free Cl- diffusion coefficient of them can be deduced inversely. Figure 14, Figure 15 and Figure 16 show the variation of the free Cl- diffusion coefficient with A for NS, NF(I), and NF(II) under three environmental conditions, respectively. The total Cl- diffusion coefficient has the same trend.

4.3. Determination of Cl- Diffusion Correction Model Coefficient

4.3.1. Environmental Coefficient

The diffusion path of Cl- under different environmental conditions (submerge zone, tidal zone, splash zone, and salt spray zone) is different. Referring to the research results [54], the environmental coefficient (fh) selected in this paper is shown in Table 3.

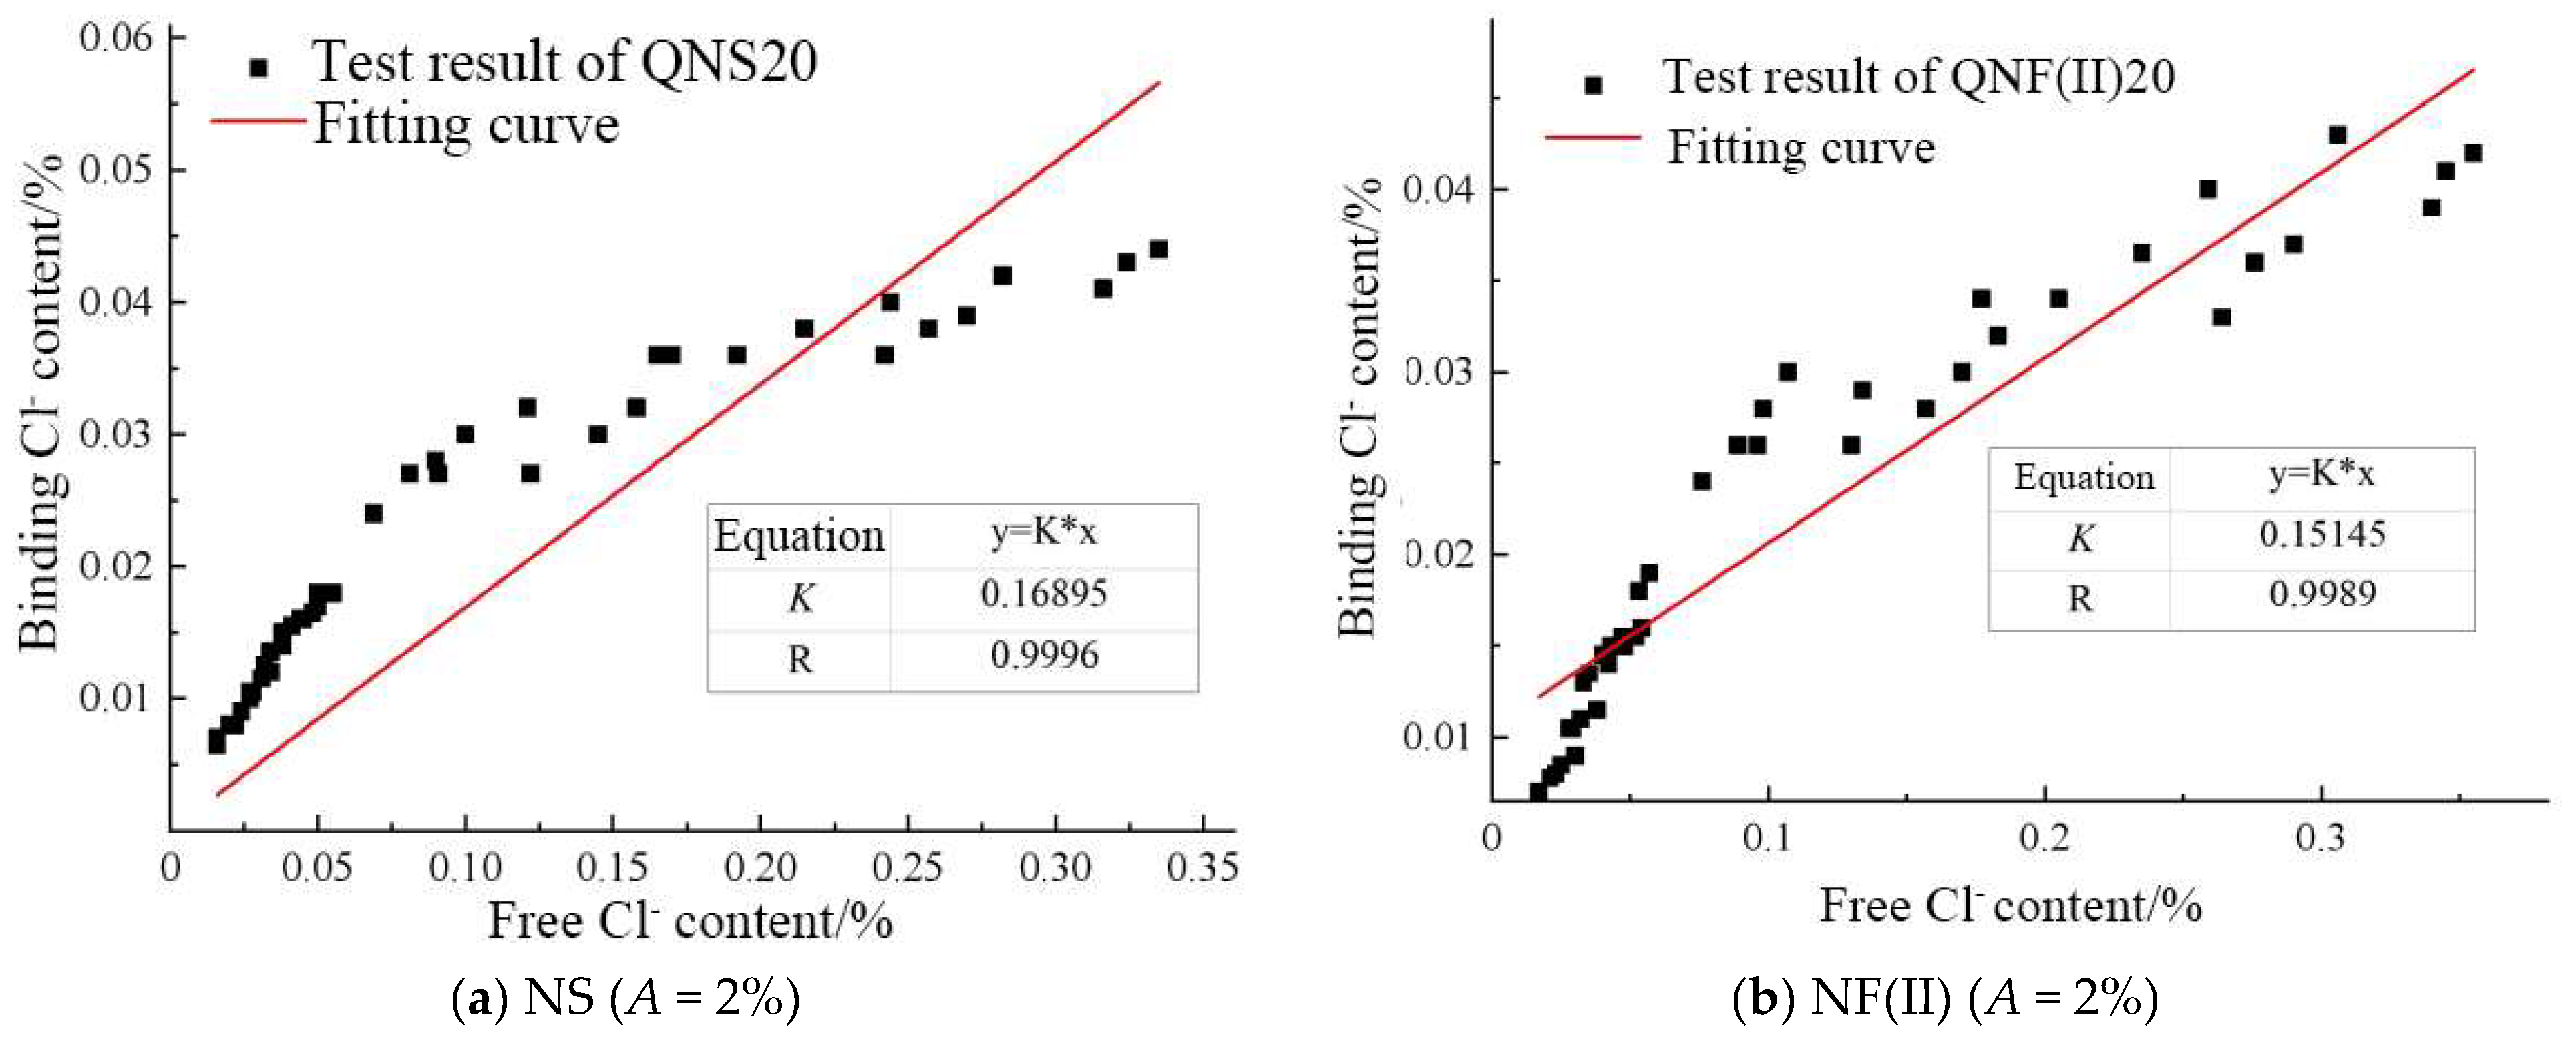
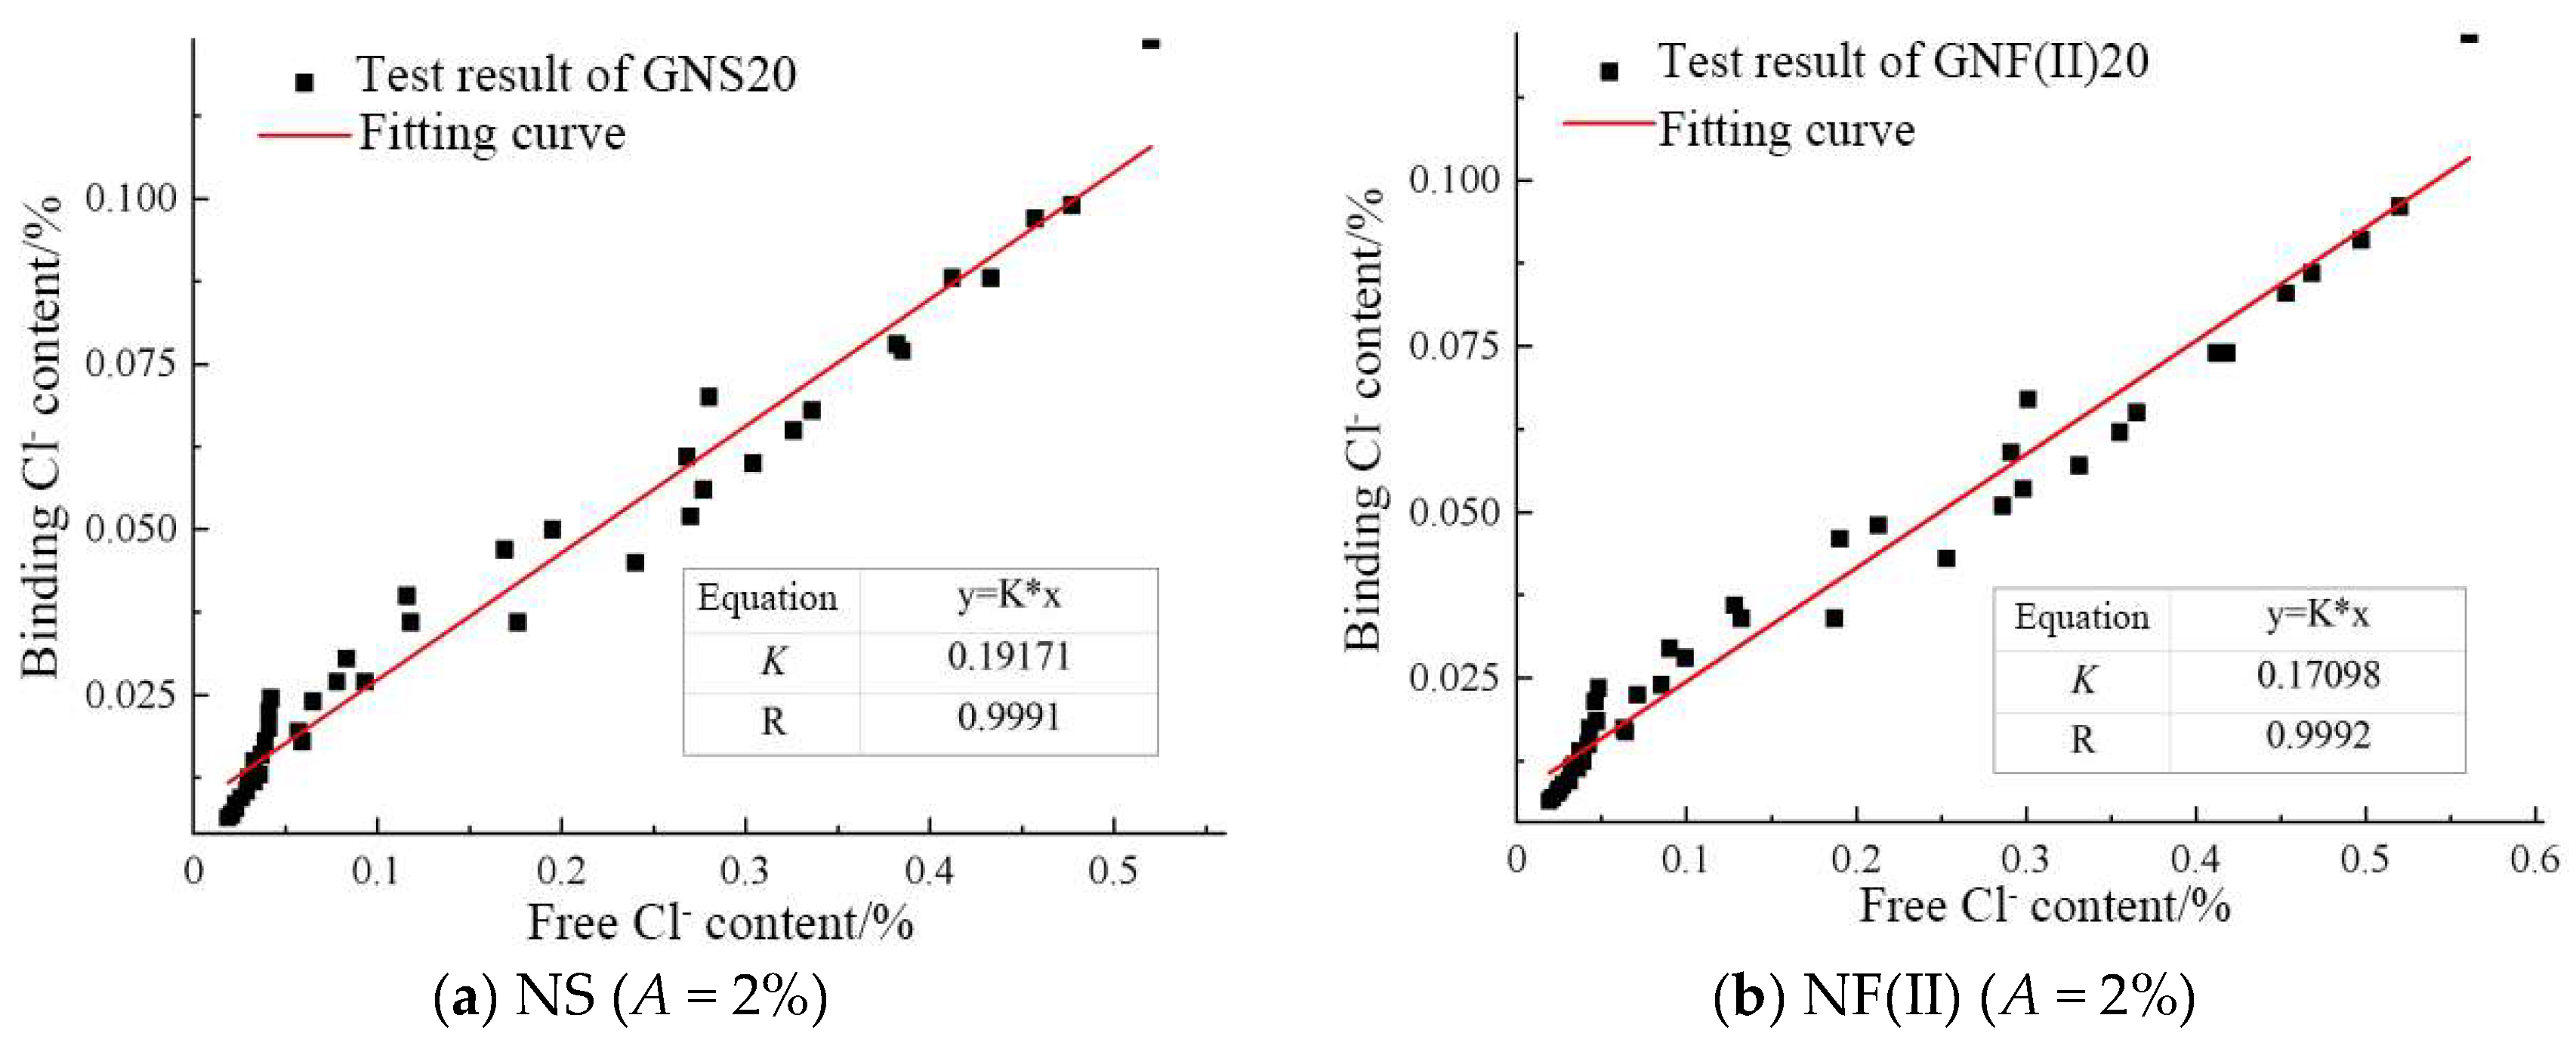
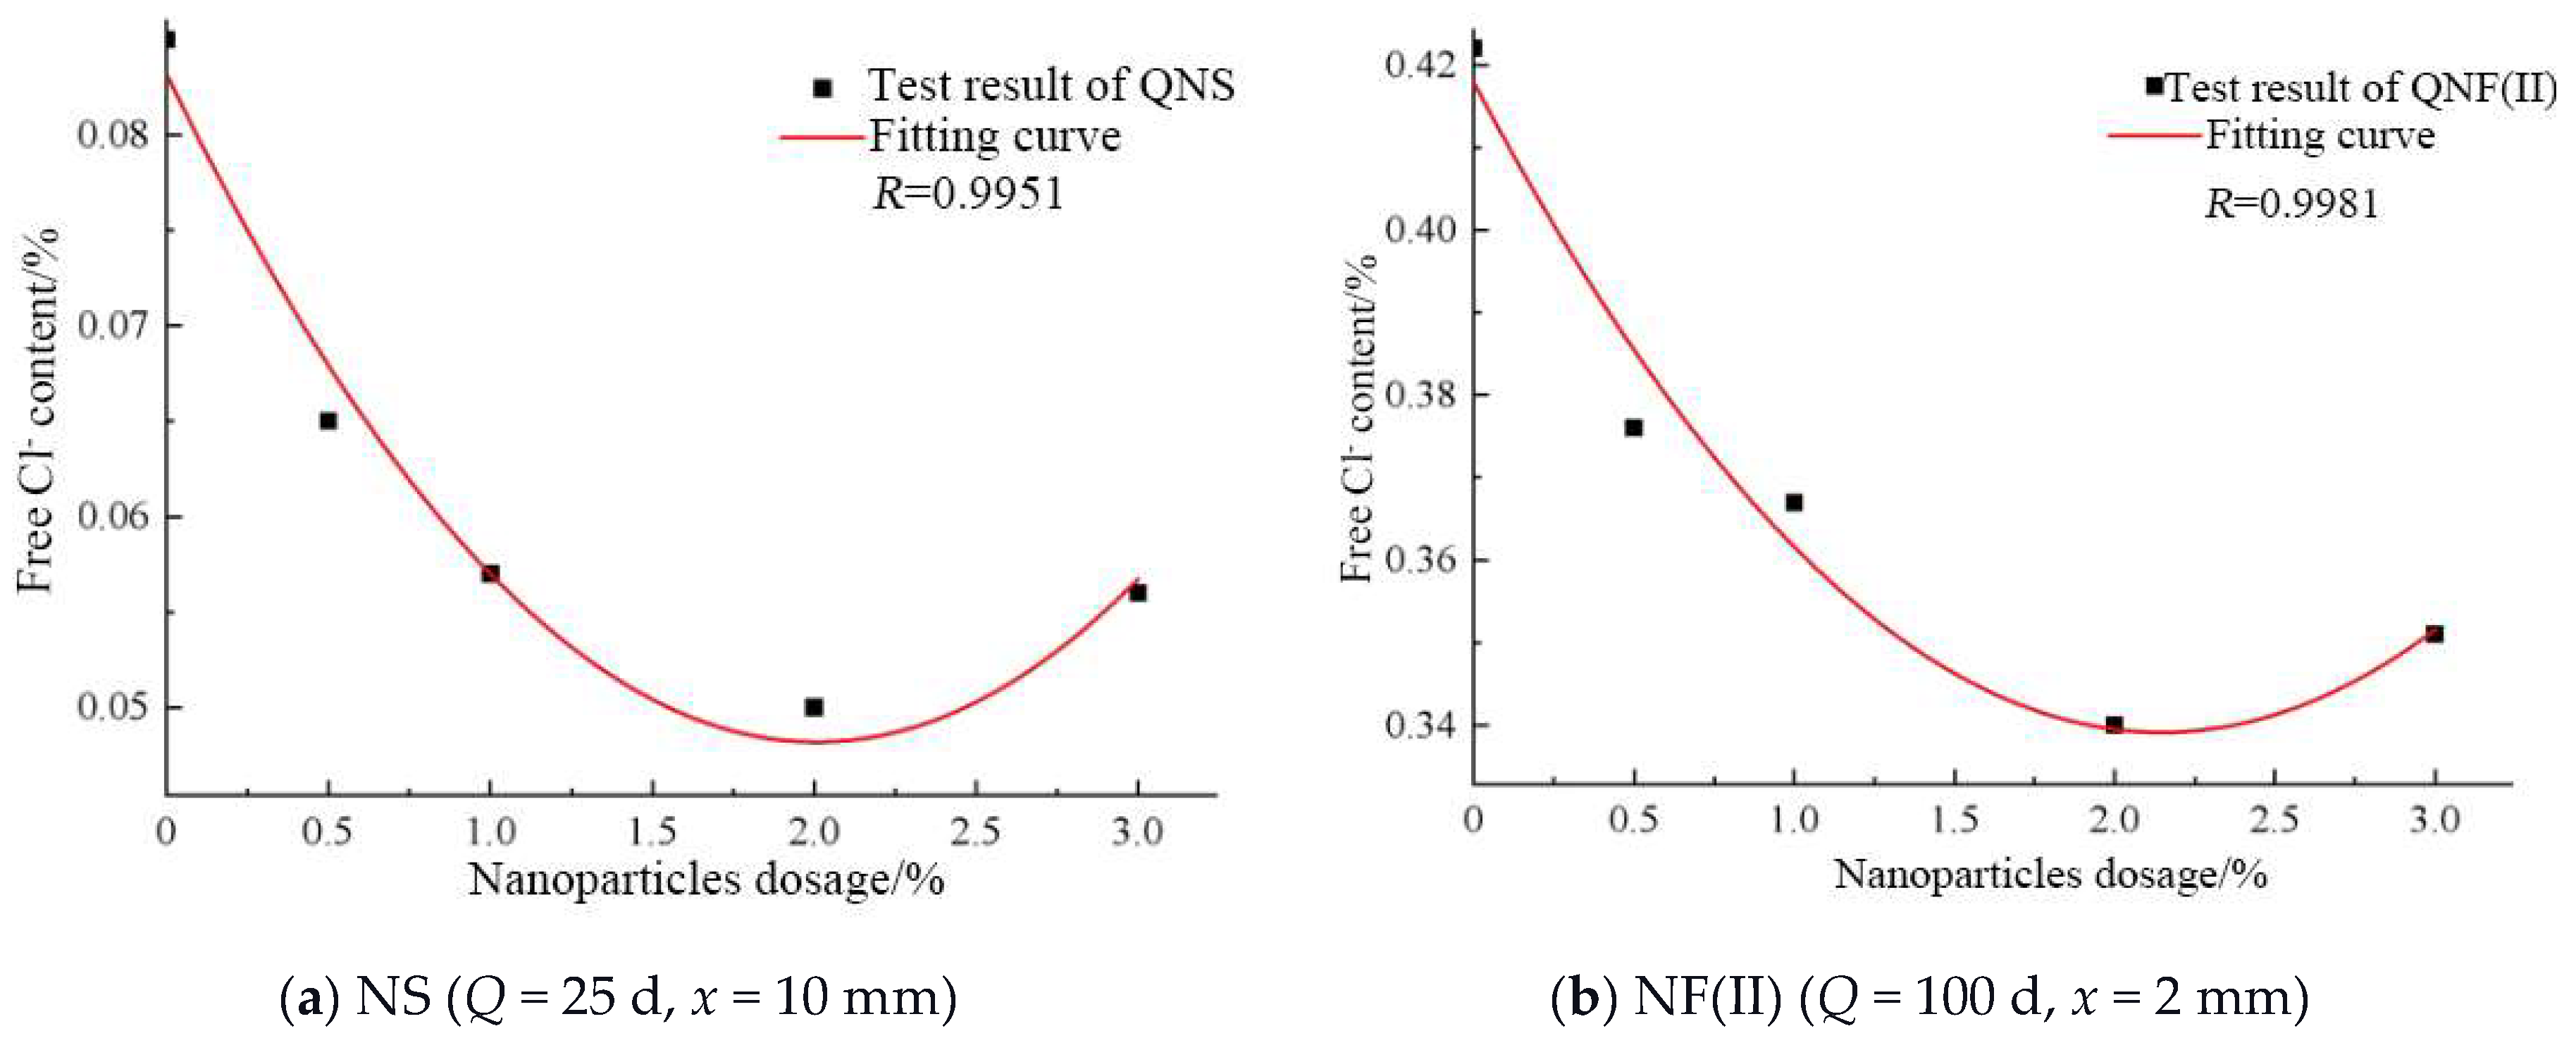
4.3.2. Cl- Binding Coefficient

In the actual environment, the damage mechanism of salt spray erosion to marine concrete structures is similar to that of dry–wet cycles. There are not only considerations of salt spray erosion, but also the influence of bending load in this paper, and the diffusion of free Cl- in concrete under the coupling effect of bending load and salt spray erosion is discussed. Therefore, in this paper, the Cl- binding coefficient (K) is only introduced when marine concretes are subjected to dry–wet cycles and salt freeze–thaw cycles.

The Fitting of Cl- Binding Coefficient

K can directly reflect the Cl- binding capacity of concrete, and the expression is as follows:
K = Cl-b/Cl-f
where K is the binding coefficient; Cl-b is the binding Cl- content (%); Cl-f is the free Cl- content (%).
The Cl- binding mechanism mainly includes three types: a linear binding mechanism, a Fangmuir binding mechanism, and a Langmuir binding mechanism. The linear binding mechanism is not only more concise and direct but also has a high correlation with the test results. Hence, this paper employed the linear binding mechanism to fit K. The free Cl- content and binding Cl- content at different ages and depths were substituted into Equation (5) and obtained the K value of NS and NF(II) under the action of dry–wet cycles and full immersion, as shown in Figure 17 and Figure 18. (Taking A = 2% as an example, the fitting results of each dosage are similar). It can be seen that the fitting results can all reach above 0.99.

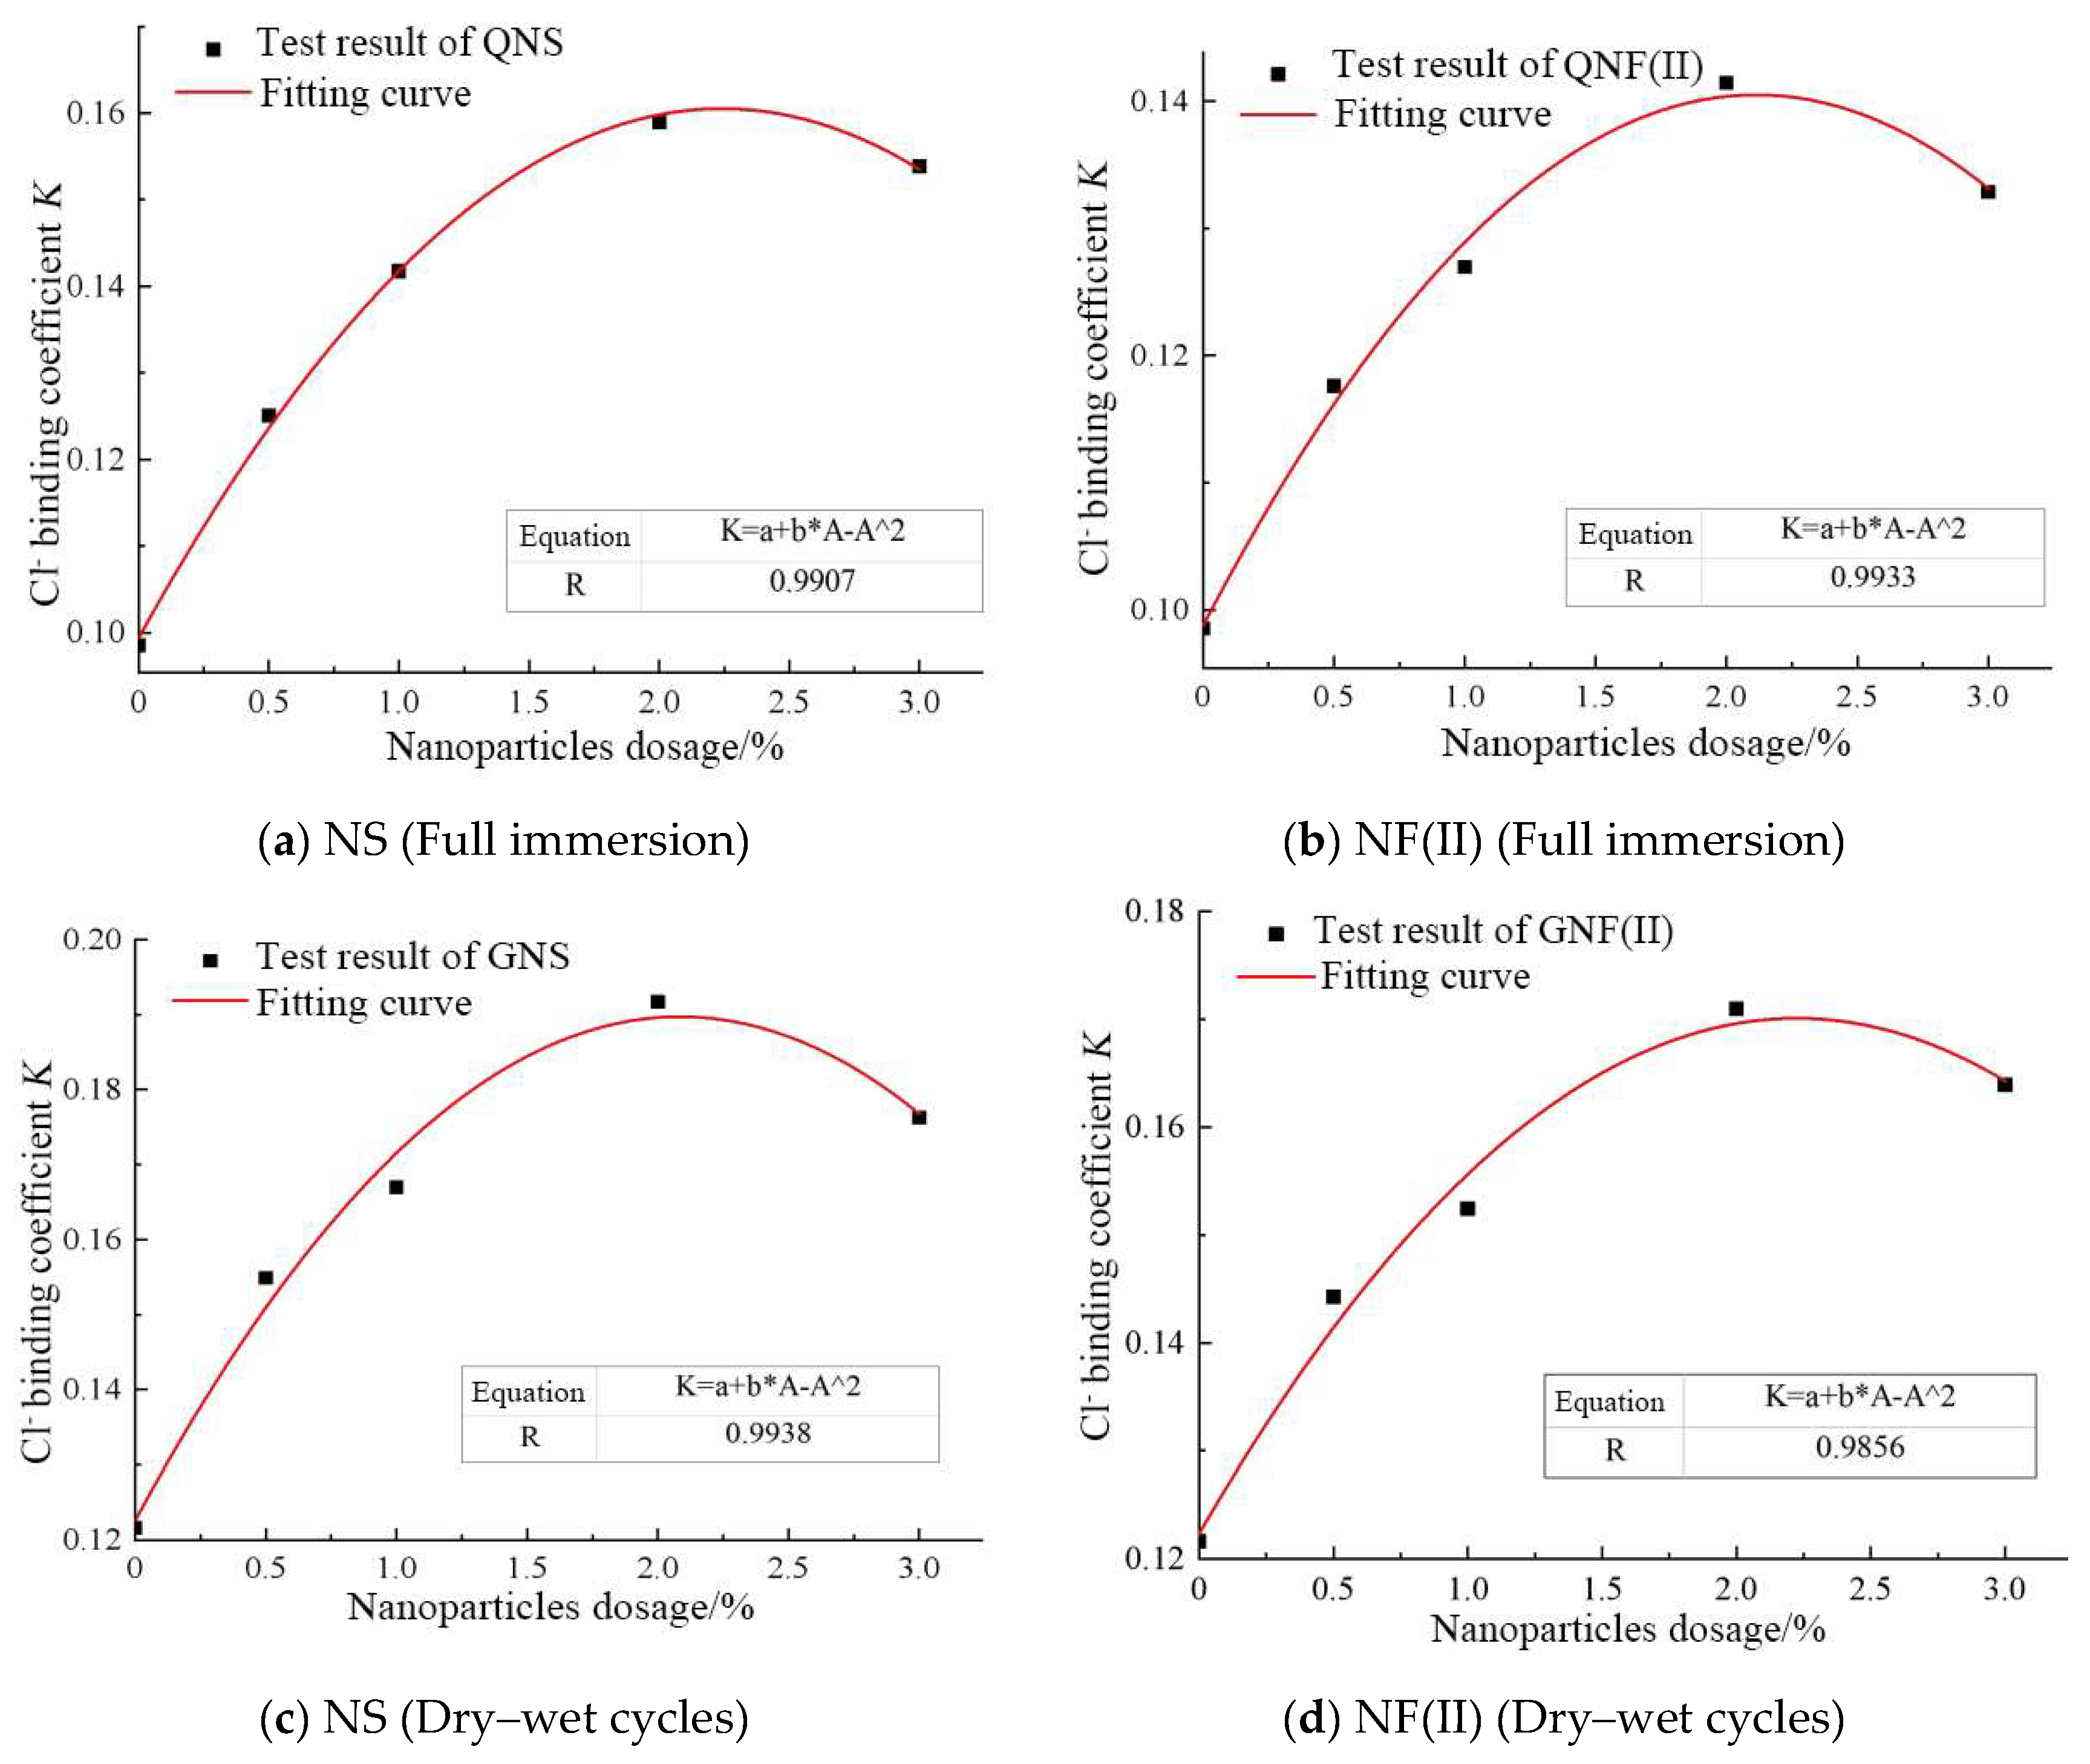
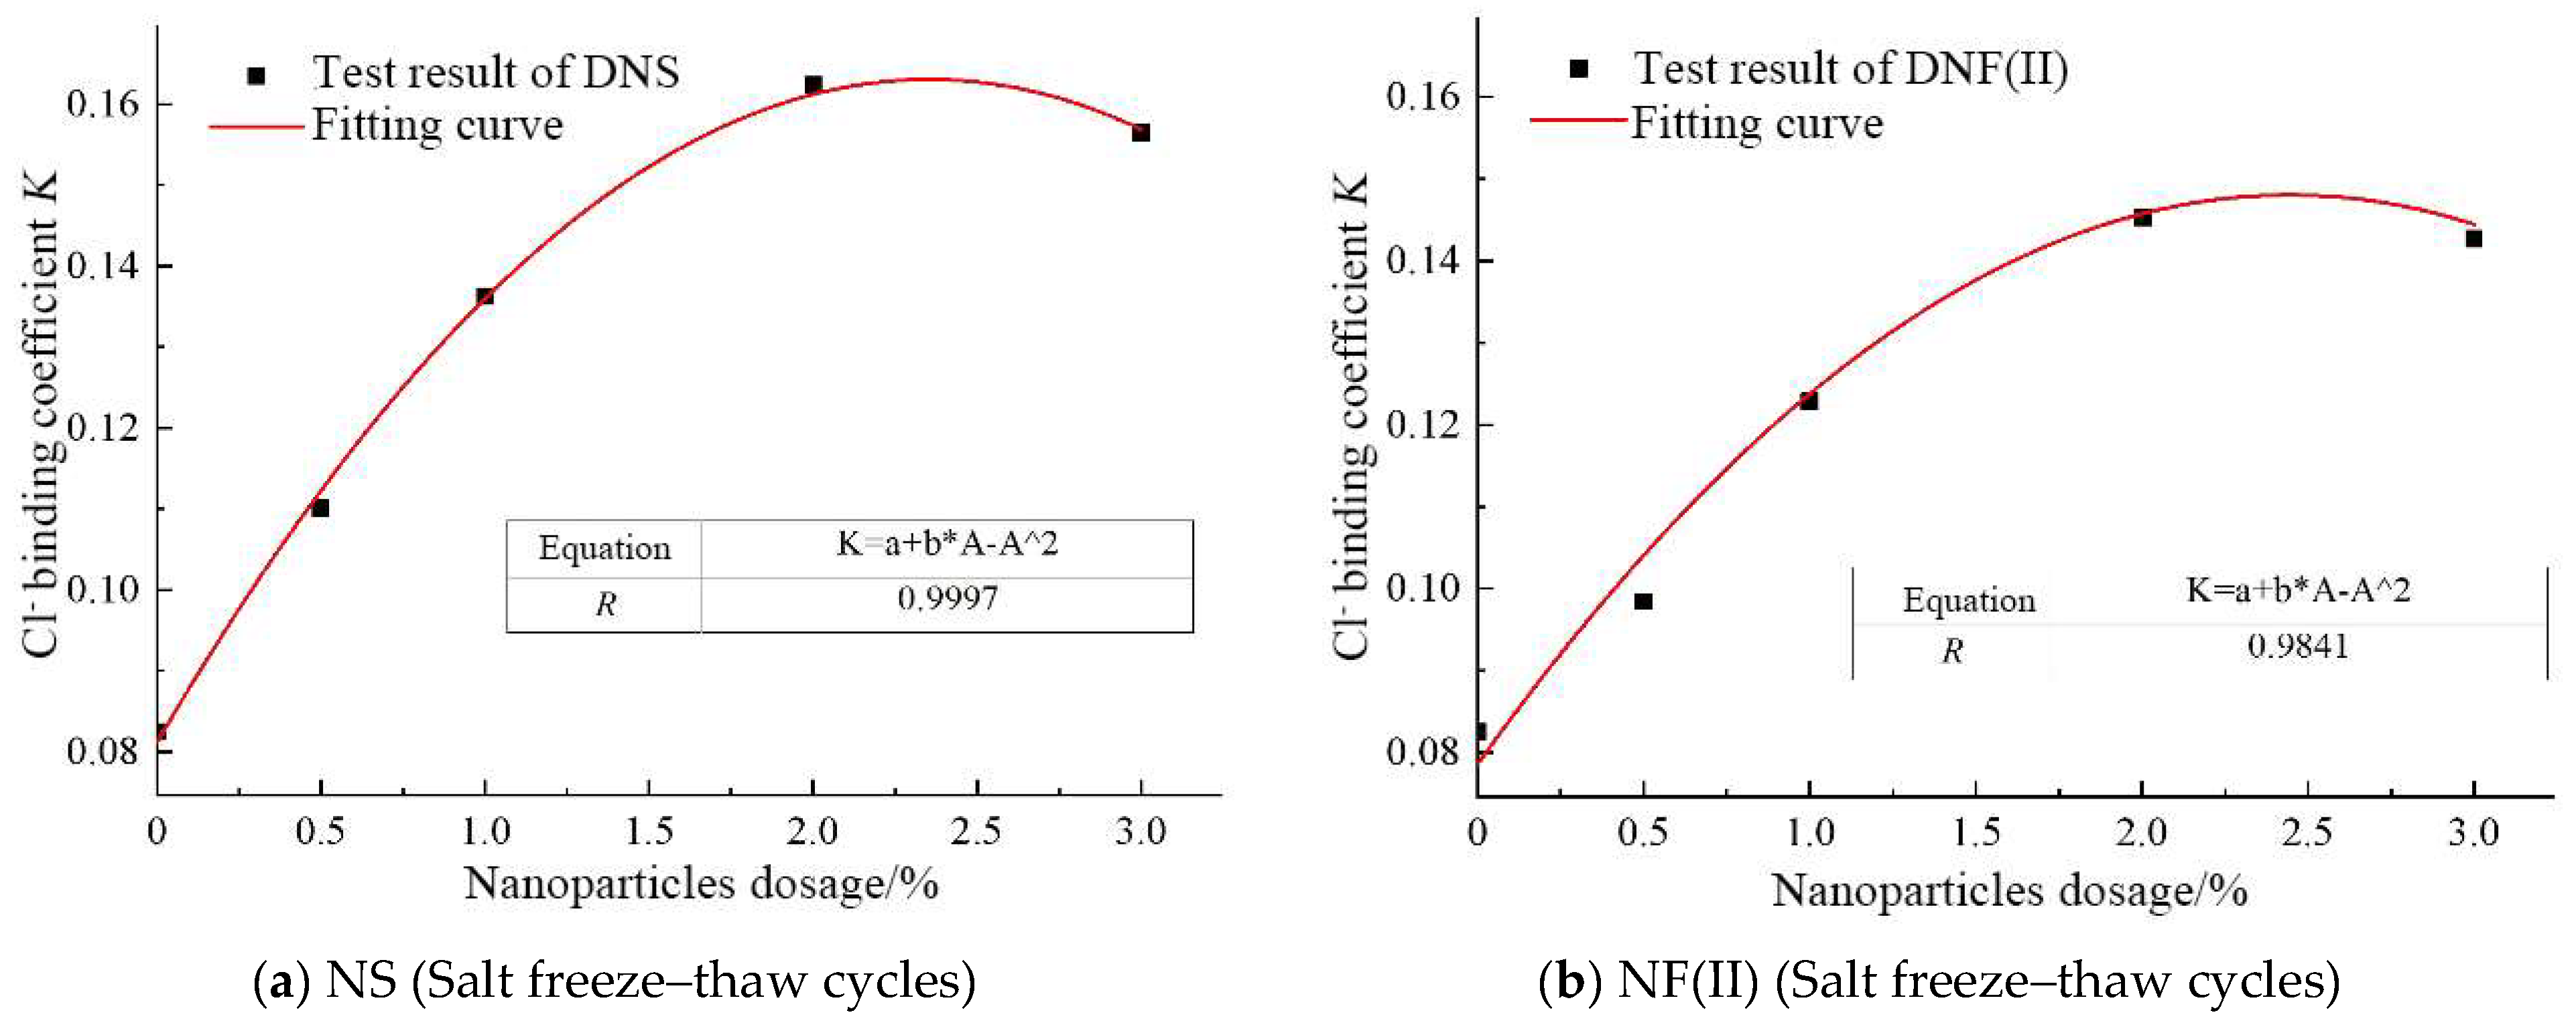
The Fitting of Relationship of K Value and A Value

Figure 19 and Figure 20 show that the fitting results of the relationship between the K value and A value for NS and NF(II) under the action of the dry wet cycle (full immersion) and salt freeze–thaw cycles, respectively, The fitting equation of K value and A value can be seen in Equation (6).
K = e + fAgA2
where e, f and g are the fitting coefficients, and the fitting results are shown in Table 4 and Table 5.

4.3.3. Depth of Convection

According to the test results in Figure 7, the diffusion of Cl- in concrete under the action of dry–wet cycles and full immersion exists in the convection zone. Therefore, the convective depth (xc) should be considered in the Cl- diffusion correction model under the action of dry–wet cycles and full immersion.

4.3.4. Load Coefficient

According to the free Cl- content in three groups of marine concretes in Figure 12, the diffusion speed of Cl- accelerated in the tensile zone, and the diffusion coefficient will also increase. The Cl- diffusion increases are more evident when the tensile stress increases. However, the diffusion speed of Cl- in the compressive zone will be lower with increasing stress. In order to reflect the relationship between bending load and Cl- diffusion, the load coefficient f(σ) is introduced. According to the test results, each group of marine concretes under different tensile and compressive stresses (set D/D0 = f(σ)) were fitted that can obtain the relation curve in the tensile zone and compressive zone between the bending load and Cl- diffusion coefficient, as shown in Equations (7) and (8).
f ( σ ) = h + i σ + g σ 2 + k σ 3
f ( σ ) = h + i σ + g σ 2
where h, i, g and k are all fitting coefficients, and the fitting results are shown in Table 6 and Table 7.

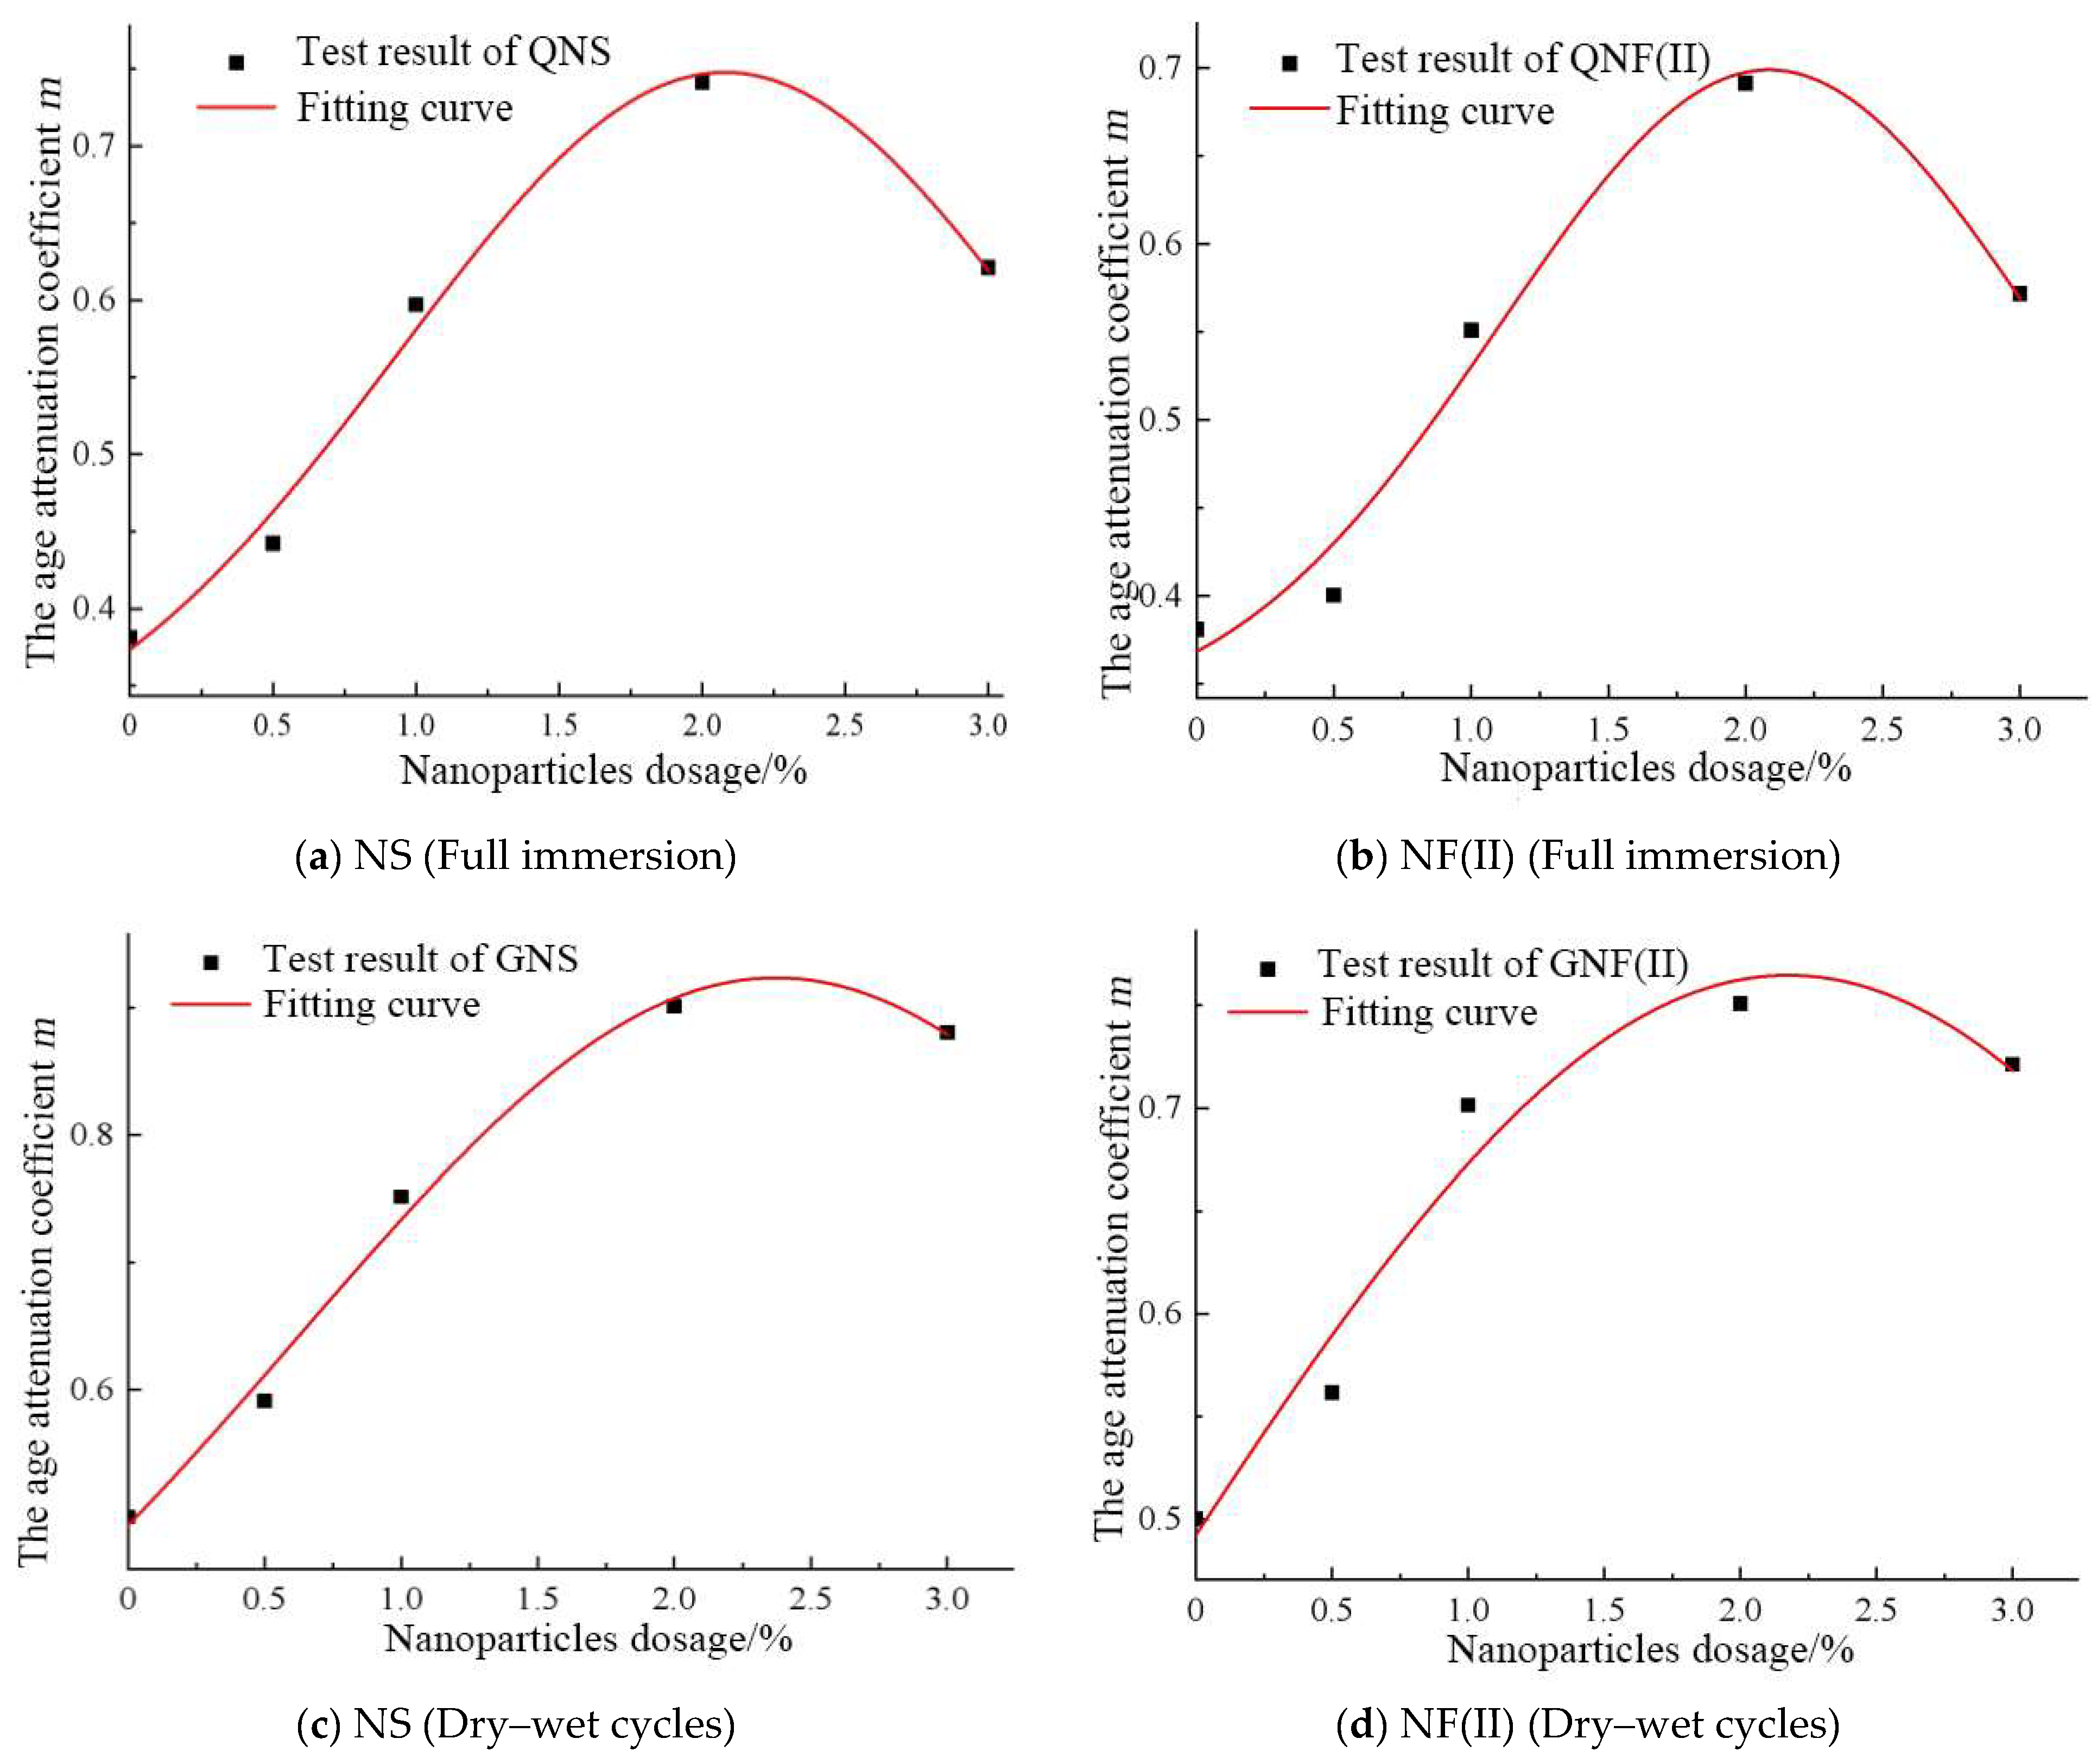
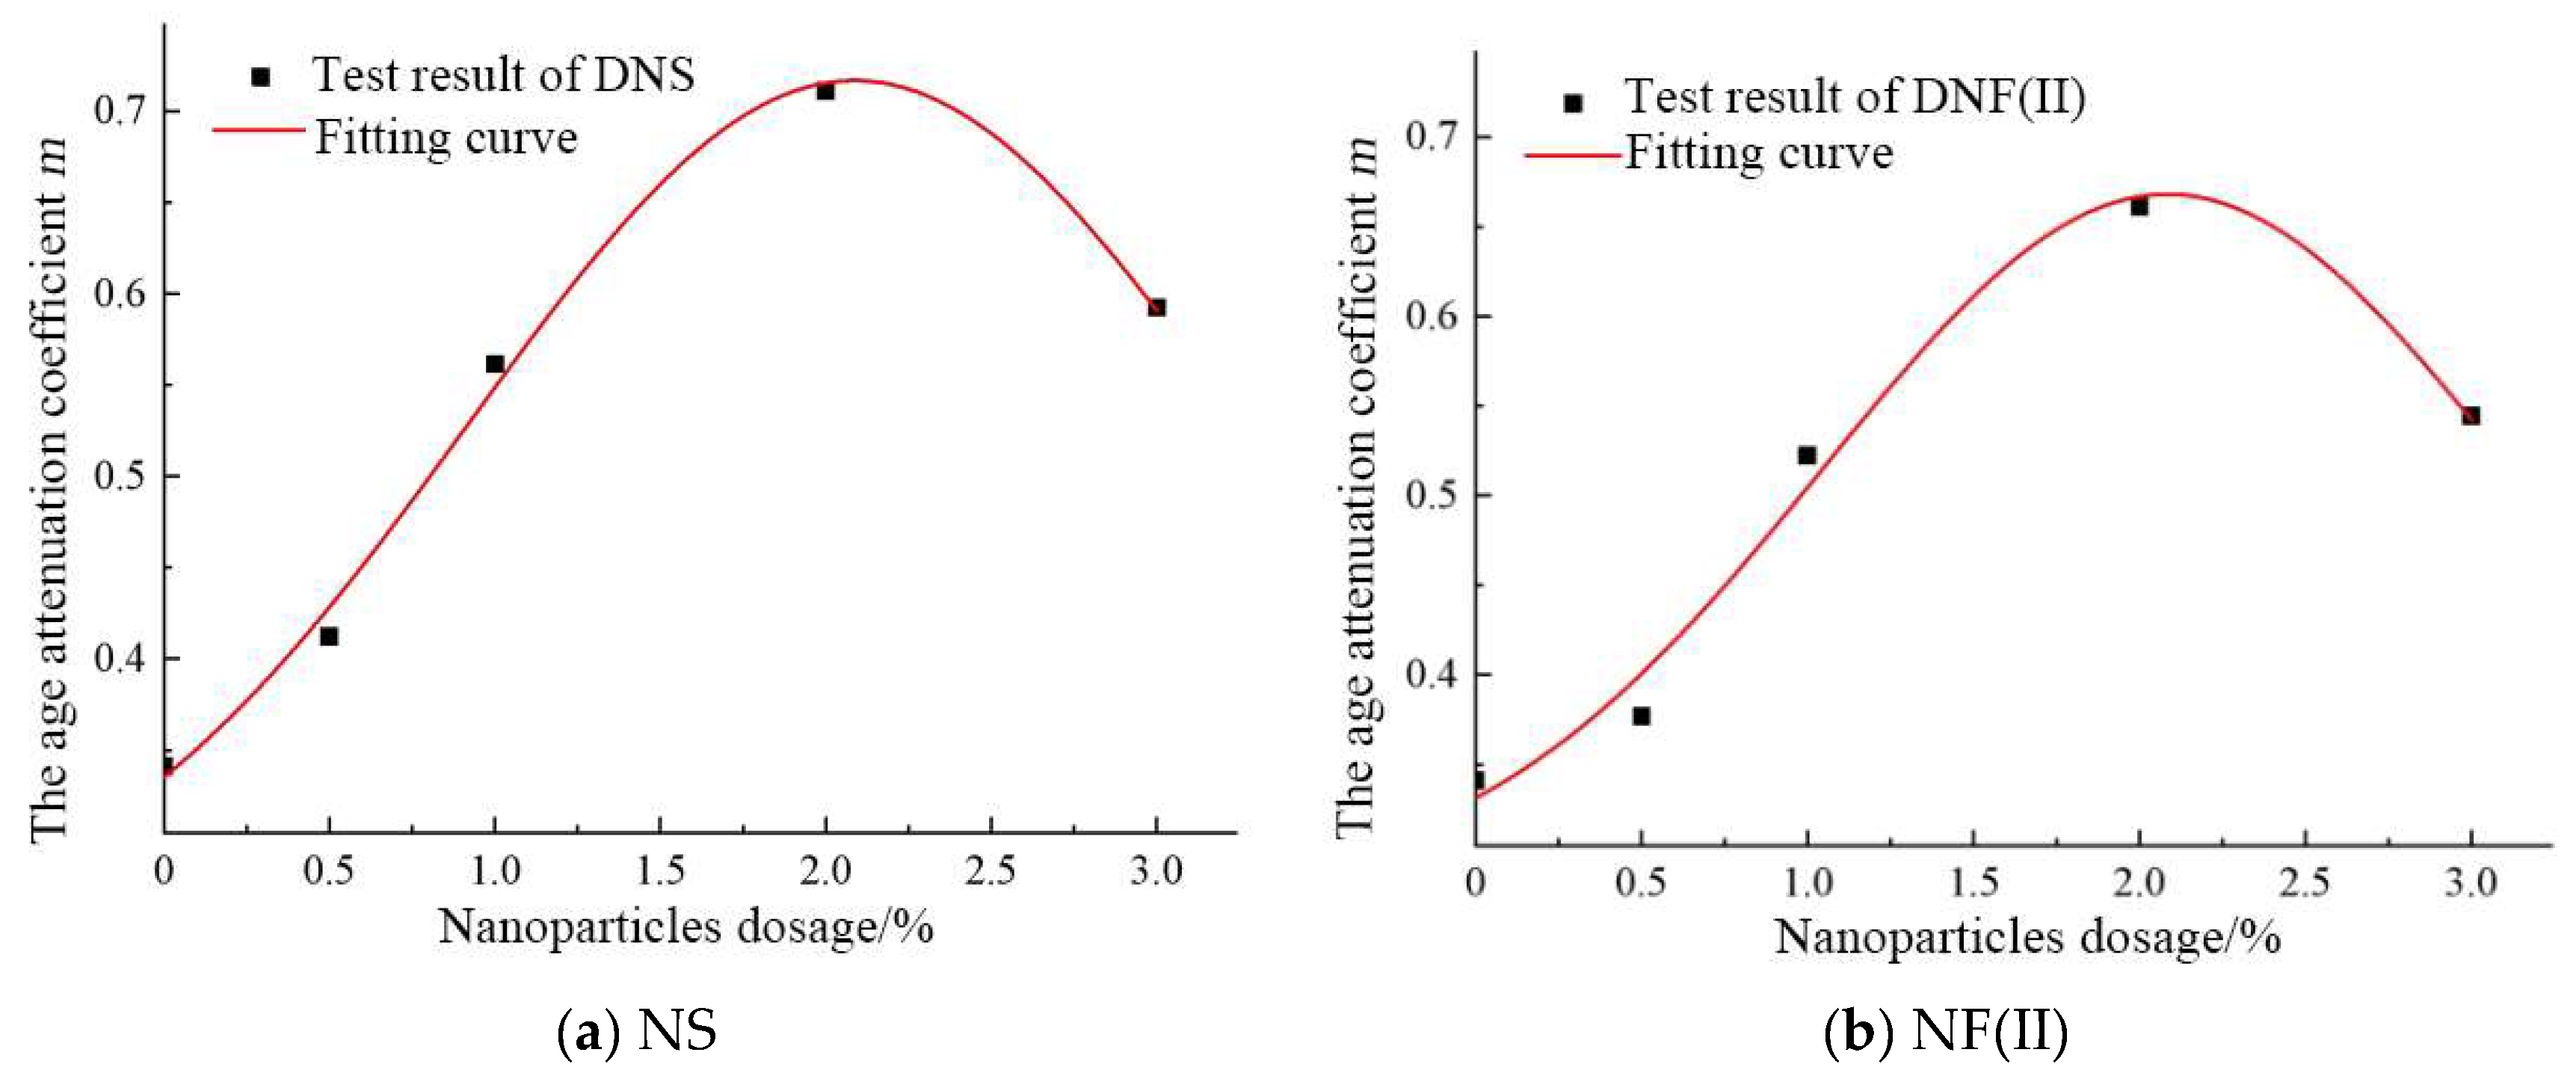
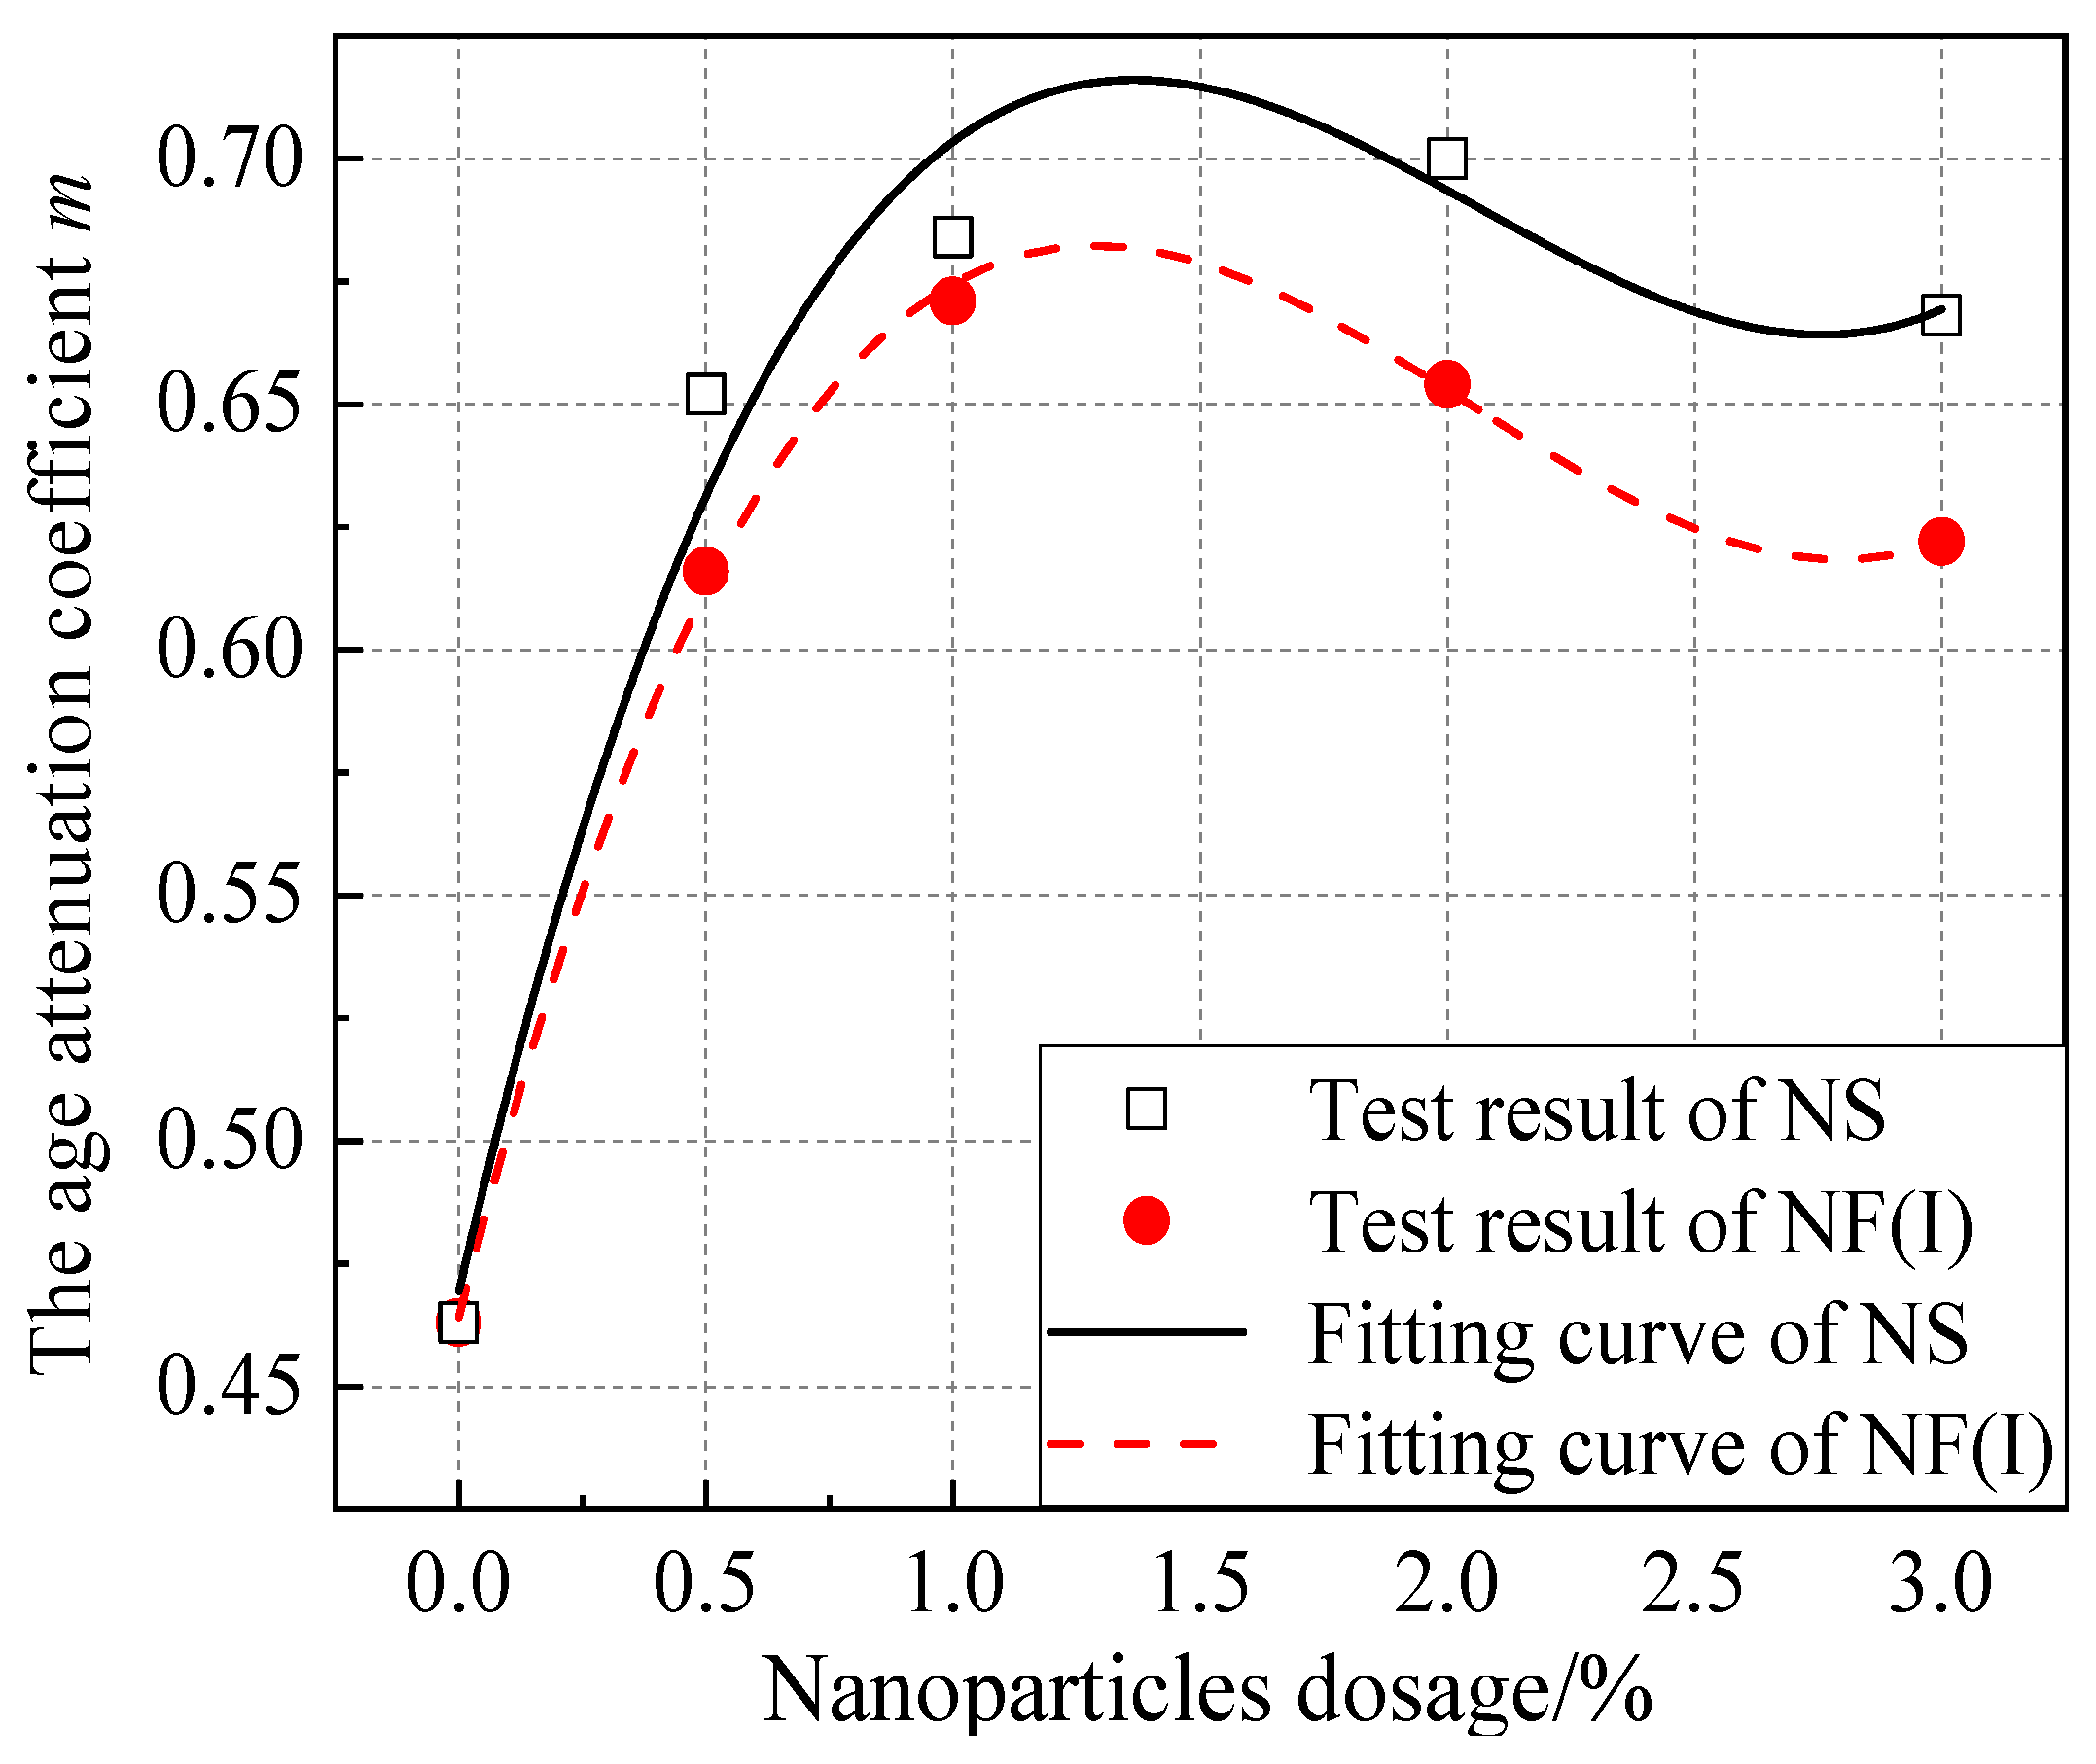
4.3.5. The Age Attenuation Coefficient

Mangat et al. [55] reported that the Cl- diffusion coefficient was dependent on time to a certain extent. They proposed to use m to represent the age attenuation coefficient, and established a modified model of the relationship between the Cl- diffusion coefficient and time:
D ( T ) = D 0 [ T 0 T ] m
Costa et al. [56,57,58] provided m values in different types of concrete under different marine environments, as shown in Table 8. Due to the nano-particles used in this paper, the m value in Table 8 is not consistent with materials in this test. So, it is necessary to re-fit the m value of three groups of marine concrete under the action of three environmental factors. The m value is fitted under three conditions according to Equation (9).

The Combined Action of Dry–Wet Cycles and Cl-

Figure 21 shows that the fitting results of relationship between m and A of NS and NF(II) under the action of dry–wet cycles and full immersion. The fitting formula of m and A is shown in Equation (10).
m = a + b exp [ ( A c ) 2 d ]
where a, b, c and d are fitting coefficients, and the fitting results are shown in Table 9.

The Combined Action of Salt Freeze–Thaw Cycles and Cl-

Figure 22 shows the fitting results of the relationship between m and A of NS and NF(II) under the action of salt freeze–thaw cycles. The fitting formula of m and A is shown in Equation (10). The fitting results are shown in Table 10.

The Combined Action of Bending Load and Salt Spray Erosion

Figure 23 shows the fitting results of the relationship between m and A of NS and NF(I) under combined the action of bending load and salt spray erosion. The fitting formula of m and A is shown in Equation (11). The fitting results are shown in Table 11.
m = l + r A + j A 2 + z A 3

4.4. Determination of Cl- Diffusion Correction Model

4.4.1. The Action of Dry–Wet Cycles and Full Immersion

Considering fh, m and xc to modify Fick’s second law, Equations (6), (8) and (9) are substituted into Equation (4), respectively, to obtain the Cl- diffusion correction model of nano-marine concretes under the action of dry–wet cycles and full immersion:
C ( x , T ) = C 0 + ( C s C 0 ) [ 1 e r f ( x x c 2 f h D 0 t 0 a + b exp [ ( A c ) 2 d ] ( e + f A g A 2 ) { 1 a b exp [ ( A c ) 2 d ] } T { 1 a b exp [ ( A c ) 2 d ] } ) ]
where C is Cl- content (%); C0 is the initial Cl- content (%); Cs is the apparent Cl- content (%); erf is error function; D0 is the Cl- diffusion coefficient (m2/s) at the initial time; t0 is the initial time (s); fh is the environmental coefficient; Xc is the depth of convective zone (mm); X is the depth from the concrete surface (mm); T is the age (s); A is nanoparticles dosage (%); a, b, c, d, e, f, and g are the fitting coefficients.
According to the actual service environment of marine concretes, the fh value is chosen as 1.32 and 0.92 in the modified model under the action of full immersion and dry–wet cycles, respectively. Taking different ages and depths as an example, the test results of NS at Q = 25 d, x = 10 m, G = 75, x = 10 mm, and NF(II) at Q = 100 d, x = 2 mm, G = 150, x = 20 mm were fitted to the modified model. Figure 24 and Figure 25 show the fitting results of the relationship between the Cl- diffusion correction formula and the content (A) (the rest of the ages and depths have the same law). The fitting curve of the modified model under the action of dry–wet cycles has a high correlation with the test results, and R can reach above 0.99.

4.4.2. The Action of Salt Freeze–Thaw Cycles Modified Model

The influence of salt freeze–thaw cycles on the durability of marine concretes are shown as follows: firstly, cracks on the surface of increase until they become cracking, and then the surface of concrete begins to peel off. Therefore, not only considering the effects of fh, K, and m, but also the effects of salt freeze–thaw cycle damage and the thickness of the exfoliation layer should be considered in the Cl- diffusion correction model under the action of salt freeze–thaw cycles.

Influence of Salt Freeze–Thaw Cycles

(1) Salt freeze–thaw cycles damage degree of concrete: According to the concept of damage mechanics [57], the damage degree of concrete structures subjected to salt freeze–thaw cycles is usually shown as salt freeze–thaw damage degree (F). The deterioration of concrete structure durability is more serious with the gradual increase of the F value. The expression of the F value is as follows:
F ( N ) = ( 1 E D N E D 0 ) × 100 %
where F(N) denotes the damage degree of concrete after a number of N (%); ED0 denotes the dynamic modulus of elasticity of concrete before salt freeze–thaw cycles (MPa); EDN denotes the dynamic modulus of elasticity of concrete after the number of N (%) (MPa). The salt freeze–thaw cycles damage degree of marine concretes can be calculated as shown in Table 12.
Fitting the relationship between the F value and N value: the fitting formula for the relationship between the F value and N value for NS and NF(II) under the action of salt freeze–thaw cycles is as follows:
F = u + v N + w N 2
where u, v, w are the fitting coefficients, and the fitting results are shown in Table 13.
The relationship between F and Cl- diffusion coefficient: Salt freeze–thaw cycles will cause concrete structures to deteriorate and generate cracks, thus accelerating the migration rate of Cl- in the concrete. Studies have reported [55] that the F and Cl- diffusion coefficient approximately obey the exponential function relationship, the equation is as follows:
D F / D 0 = e ω F
where D0 is the Cl- diffusion coefficient (m2/s) of sound concrete; DF is the Cl-diffusion coefficient (m2/s) after the action of salt freeze–thaw cycles; F is the damage degree of salt freeze–thaw cycles (%); ω is the effect coefficient of salt freeze–thaw cycles. The fitting results are shown in Table 14.

Influence of Peeling Layer Thickness

Studies have shown [59] that the peeling layer thickness of concrete is proportional to the mass loss rate, the expression is as follows:
Δ B = λ R m
where ∆B is the peeling layer thickness of concrete after the action of salt freeze–thaw cycles (mm); λ is the coefficient of test conditions (e.g., specimen shape, peeling uniformity, material properties, and the effect of salt freeze–thaw cycles, etc.; Rm is the mass loss rate of concrete after the action of salt freeze–thaw cycles (%).
In the literature [60], the relationship between Rm and N of concrete under the action of salt freeze–thaw cycles was investigated and the following relationship was obtained.
R m = p · lg ( q · N + 1 )
where Rm is the mass loss rate of specimens under the action of salt freeze–thaw cycles; N is the number of salt freeze–thaw cycles; p and q are material characteristic parameters.
After summarizing and analyzing the above factors, Fick’s second law is modified. Considering the influence of fh, m, K, F, and ΔB, the Cl- diffusion correction model of nano-marine concretes is obtained as follows:
C ( x , T ) = C 0 + ( C s C 0 ) [ 1 e r f ( x Δ B 2 f h D T exp ( ω F ) ( 1 + K ) ) ]
where C is the Cl- content (%) in concrete; C0 is the initial Cl- content (%) in concrete; Cs is the surface Cl- content of concrete (%); erf is error function; T is the time of concrete structure exposed to Cl- environment (s); x is the depth from the concrete surface (mm); D is Cl- diffusion coefficient (m2/s); fh is the environmental coefficient; K is the Cl- binding coefficient; ΔB is the thickness of the exfoliated layer (mm); ω is the influence coefficient of salt freeze–thaw cycles damage; F is the damage degree of salt freeze–thaw cycles (%).
Considering the influence of the actual environment and referring to the existing research results, fh is 1.32; λ, p and q are 0.03, 2.5 and 0.2, respectively; C0 are 0.03% and 0.5%; D0 is 0.5 × 10⁻¹² m2/s; T is 3.456 × 10⁵ s (4 d). Taking different ages and depths as examples, the test results of NS at N = 25 and x = 5 mm, NF (II) at N = 125 and x = 15 mm were fitted, respectively. Figure 26 shows the fitting results of relationship between the Cl- diffusion correction formula and A of nano-marine concretes under the action of salt freeze–thaw cycles (other ages and depths have the same trend). The fitting curve of the modified model under the action of salt freeze–thaw cycles has a high correlation with the test results, and R can reach above 0.99.

4.4.3. Combined Action of Bending Load and Salt Spray Erosion

The load coefficient f(σ), environmental influence coefficient fh, and age attenuation coefficient m were taken into account to modify Fick’s second law. Equations (7), (8), and (10) were substituted into Equation (4), and the Cl- diffusion correction model of nano-marine concretes was obtained as follows:
C ( x , T ) = C 0 + ( C s C 0 ) [ 1 e r f ( x 2 ( h + i σ + g σ 2 + k σ 3 ) D 0 T 0 l + r A + j A 2 + z A 3 f h 1 ( l + r A + j A 2 + z A 3 ) T 1 ( l + r A + j A 2 + z A 3 ) ) ]
where C is Cl- content (%) in concrete; C0 is the initial Cl- content (%) in concrete; Cs is the surface Cl- content of concrete (%); erf is error function; T is the time of concrete structure exposed to Cl- environment (s); x is the depth from the concrete surface (mm); D is Cl- diffusion coefficient (m2/s); fh is the environmental coefficient which is 0.68; σ is the stress ratio; A is the content of nano-particles (%); h, I, g, k, l, r, j, and z are the fitting coefficients.
According to the salt spray environment of marine concretes and Equation (18), the depth x is 5 mm, the stress ratio σ is 0.6, and fh value is 0.68. Taking stress ratio, nano-particle dosages, and ages as examples, the Cl- content test results and correction model of PC, NS, and NF(I) in the tensile zone and compressive zone were fitted. Figure 27 shows the fitting results (the rest of the stress ratio and ages of the fitting results have the same trend) of between the Cl- diffusion correction formula and the nano-particles dosage. It can be seen that the fitting curves of the tensile zone and compressive zone of marine concretes under the same stress ratio have a good correlation with the test results, and R is basically above 0.98.

5. Conclusions

Four types of marine concretes were prepared in this paper, including OPC, NS, NF(I), and NF(II). According to their service characteristics under the action of the above three environmental factors, the Cl- content was tested. And based on Fick’s second law, the Cl- diffusion modified model for nano-marine concretes was also proposed. The main conclusions are as follows:
(1)
Under the action of dry–wet cycles, the convection zone appears due to the action of capillary adsorption, which is different from the erosion mechanism of the other two environmental actions. So, the erosion speed of Cl- was significantly accelerated under the action of dry–wet cycles.
(2)
With the increase in the number of salt freeze–thaw cycles, the icing expansion pressure, osmotic pressure and salt crystallization pressure in concrete were increased, which lead to the deterioration of concrete durability.
(3)
Under the action of three different environments, the nano-SiO2, nano-Fe2O3, and nano-Fe3O4 of the optimum dosage were 2%, 1%, and 2%, respectively. Compared with the other two nanoparticles, nano-SiO2 had the best effect on improving concrete.
(4)
Considering the characteristics of Cl- diffusion under the action of three environmental factors and its relative parameters, Fick’s second law is modified, and the Cl- diffusion modified model of nano-marine concretes is obtained. It can be used to calculate the Cl- content in different dosages and depths of nanoparticles. The correlation coefficient R value of the fitting curve and the test results is basically above 0.99, which can provide a reference for the life prediction of actual marine concretes.
(5)
Under the coupling effect of bending load and salt spray erosion, the fitting results correlation coefficient R of the load influence coefficient f(σ) for marine concretes is basically above 0.95, which has a high correlation. Compared with the unloaded condition, the load influence coefficient values in the tensile zone of marine concretes are increased to different degrees, while their values in the compressive zone are decreased. It is proved that the Cl- content is closely related to bending load.

6. Patents

The patent number used in this article (ZL202120853835.7), and the patent name is “A concrete durability test chamber under salt spray erosion”.

Author Contributions

Conceptualization, M.Z.; methodology, Z.L.; validation, Z.L. and Y.S.; formal analysis, Z.L. and Y.S.; investigation, Z.L.; resources, M.Z.; writing—original draft preparation, Z.L.; writing—review and editing, M.Z.; supervision, M.Z.; project administration, M.Z.; funding acquisition, M.Z. All authors have read and agreed to the published version of the manuscript.

Funding

This work was supported by the National Natural Science Foundation of China (52078109).

Institutional Review Board Statement

Not applicable.

Informed Consent Statement

Not applicable.

Data Availability Statement

Data are available on reasonable request from the corresponding author.

Acknowledgments

We are grateful for the financial support from the National Natural Science Foundation of China (52078109).

Conflicts of Interest

The authors declare no conflict of interest.

References

  1. Guo, Y.; Zhang, T.; Du, J.; Wang, C.; Wei, J.; Yu, Q. Evaluating the chloride diffusion coefficient of cement mortars based on the tortuosity of pore structurally-designed cement pastes. Microporous Mesoporous Mater. 2021, 317, 111018. [Google Scholar] [CrossRef]
  2. Zhang, Y.; Luzio, G.D.; Alnaggar, M. Coupled multi-physics simulation of chloride diffusion in saturated and unsaturated concrete. Constr. Build. Mater. 2021, 292, 123394. [Google Scholar] [CrossRef]
  3. Wang, Y.; Gong, X.; Wu, L. Prediction model of chloride diffusion in concrete considering the coupling effects of coarse aggregate and steel reinforcement exposed to marine tidal environment. Constr. Build. Mater. 2019, 216, 40–57. [Google Scholar] [CrossRef] [Green Version]
  4. Wang, Y.; Liu, Z.; Zhang, B.; Fu, K. A time-dependent diffusive model for the simulation of chloride penetration in concrete considering the effect of natural salt freeze-thaw cycles. Cold Reg. Sci. Technol. 2022, 201, 103622. [Google Scholar] [CrossRef]
  5. Jiang, W.-Q.; Shen, X.-H.; Xia, J.; Mao, L.-X.; Yang, J.; Liu, Q.-F. A numerical study on chloride diffusion in freeze-thaw affected concrete. Constr. Build. Mater. 2018, 179, 553–565. [Google Scholar] [CrossRef]
  6. Sun, D.; Cao, Z.; Huang, C.; Wu, K.; De Schutter, G.; Zhang, L. Degradation of concrete in marine environment under coupled chloride and sulfate attack: A numerical and experimental study. Case Stud. Constr. Mater. 2022, 17, e01218. [Google Scholar] [CrossRef]
  7. Jee, A.A.; Pradhan, B. Long term effect of chloride and sulfates concentration, and cation allied with sulfates on corrosion performance of steel-reinforced in concrete. J. Build. Eng. 2022, 56, 104813. [Google Scholar] [CrossRef]
  8. Zuquan, J.; Xia, Z.; Tiejun, Z.; Jianqing, L. Chloride ions transportation behavior and binding capacity of concrete exposed to different marine corrosion zones. Constr. Build. Mater. 2018, 177, 170–183. [Google Scholar] [CrossRef]
  9. Mohammed, T.U.; Hamada, H. Relationship between free chloride and total chloride contents in concrete. Cem. Concr. Res. 2003, 33, 1487–1490. [Google Scholar] [CrossRef]
  10. Mangat, P.S.; Ojedokun, O.O. Free and bound chloride relationships affecting reinforcement cover in alkali activated concrete. Cem. Concr. Compos. 2020, 112, 103692. [Google Scholar] [CrossRef]
  11. Al-Sodani, K.A.A.; Al-Zahrani, M.M.; Maslehuddin, M.; Al-Amoudi, O.S.B.; Al-Dulaijan, S.U. Chloride diffusion models for plain and blended cement concretes exposed to laboratory and atmospheric marine conditions. J. Mater. Res. Technol. 2022, 17, 125–138. [Google Scholar] [CrossRef]
  12. Liberati, E.A.P.; Nogueira, C.G.; Leonel, E.D.; Chateauneuf, A. Nonlinear formulation based on FEM, Mazars damage criterion and Fick’s law applied to failure assessment of reinforced concrete structures subjected to chloride ingress and reinforcements corrosion. Eng. Fail. Anal. 2014, 46, 247–268. [Google Scholar] [CrossRef]
  13. Wang, J.; Niu, D.; Wang, Y.; He, H.; Liang, X. Chloride diffusion of shotcrete lining structure subjected to nitric acid, salt–frost degradation, and bending stress in marine environment. Cem. Concr. Compos. 2019, 104, 103396. [Google Scholar] [CrossRef]
  14. Yu, L.; Zhou, C.; Liu, Z.; Xu, F.; Liu, W.; Zeng, H.; Liu, C. Scouring abrasion properties of nanomodified concrete under the action of chloride diffusion. Constr. Build. Mater. 2019, 208, 296–303. [Google Scholar] [CrossRef]
  15. Ju, X.; Wu, L.; Lin, C.; Yang, X.; Yang, C. Prediction of chloride concentration with elevation in concrete exposed to cyclic drying-wetting conditions in marine environments. Constr. Build. Mater. 2021, 278, 122370. [Google Scholar] [CrossRef]
  16. Ye, H.; Jin, N.; Jin, X.; Fu, C. Model of chloride penetration into cracked concrete subject to drying–wetting cycles. Constr. Build. Mater. 2012, 36, 259–269. [Google Scholar] [CrossRef]
  17. Dehestani, A.; Hosseini, M.; Taleb Beydokhti, A. Effect of wetting–drying cycles on mode I and mode II fracture toughness of cement mortar and concrete. Theor. Appl. Fract. Mech. 2020, 106, 102448. [Google Scholar] [CrossRef]
  18. Ting, M.Z.Y.; Wong, K.S.; Rahman, M.E.; Meheron, S.J. Deterioration of marine concrete exposed to wetting-drying action. J. Clean. Prod. 2021, 278, 123383. [Google Scholar] [CrossRef]
  19. Kim, Y.Y.; Kim, J.M.; Bang, J.-W.; Kwon, S.-J. Effect of cover depth, w/c ratio, and crack width on half cell potential in cracked concrete exposed to salt sprayed condition. Constr. Build. Mater. 2014, 54, 636–645. [Google Scholar] [CrossRef]
  20. Zhang, H.; Zhang, W.; Meng, Y.; Li, H. Deterioration of sea sand roller compacted concrete used in island reef airport runway under salt spray. Constr. Build. Mater. 2022, 322, 126523. [Google Scholar] [CrossRef]
  21. Papadopoulos, M.P.; Apostolopoulos, C.A.; Alexopoulos, N.D.; Pantelakis, S.G. Effect of salt spray corrosion exposure on the mechanical performance of different technical class reinforcing steel bars. Mater. Des. 2007, 28, 2318–2328. [Google Scholar] [CrossRef]
  22. Su, L.; Niu, D.; Huang, D.; Luo, Y.; Qiao, H.; Zhang, Y. Chloride diffusion behavior and microstructure of basalt-polypropylene hybrid fiber reinforced concrete in salt spray environment. Constr. Build. Mater. 2022, 324, 126716. [Google Scholar] [CrossRef]
  23. Xia, M.; Wang, Y.; Xu, S. Study on surface characteristics and stochastic model of corroded steel in neutral salt spray environment. Constr. Build. Mater. 2021, 272, 121915. [Google Scholar] [CrossRef]
  24. Ou, Y.; Xu, M.; Chen, D.; Jiang, M.; Xiao, L.; Mei, G. Effect of reverse water pressure on chloride penetration within finite concrete during drying-wetting cycles. Ocean. Eng. 2022, 257, 111606. [Google Scholar] [CrossRef]
  25. van der Zanden, A.J.J.; Taher, A.; Arends, T. Modelling of water and chloride transport in concrete during yearly wetting/drying cycles. Constr. Build. Mater. 2015, 81, 120–129. [Google Scholar] [CrossRef]
  26. Hoseinzade, M.; Esfahani, M.; Arbab, F.; Shakiba, M.; Yekrangnia, M. Residual flexural capacity of pre-cracked RC beams exposed to chloride penetration at the sea surface temperature. Constr. Build. Mater. 2022, 343, 128126. [Google Scholar] [CrossRef]
  27. Marcos-Meson, V.; Geiker, M.; Fischer, G.; Solgaard, A.; Jakobsen, U.H.; Danner, T.; Edvardsen, C.; Skovhus, T.L.; Michel, A. Durability of cracked SFRC exposed to wet-dry cycles of chlorides and carbon dioxide—Multiscale deterioration phenomena. Cem. Concr. Res. 2020, 135, 106120. [Google Scholar] [CrossRef]
  28. Tongning, C.; Lijuan, Z.; Guowen, S.; Caihui, W.; Ying, Z.; Pengshuo, W.; Aoxue, X. Simulation of chloride ion transport in concrete under the coupled effects of a bending load and drying–wetting cycles. Constr. Build. Mater. 2020, 241, 118045. [Google Scholar] [CrossRef]
  29. Wang, X.-H.; Bastidas-Arteaga, E.; Gao, Y. Probabilistic analysis of chloride penetration in reinforced concrete subjected to pre-exposure static and fatigue loading and wetting-drying cycles. Eng. Fail. Anal. 2018, 84, 205–219. [Google Scholar] [CrossRef] [Green Version]
  30. Qi, B.; Gao, J.; Chen, F.; Shen, D. Chloride penetration into recycled aggregate concrete subjected to wetting–drying cycles and flexural loading. Constr. Build. Mater. 2018, 174, 130–137. [Google Scholar] [CrossRef]
  31. Ying, J.; Huang, J.; Xiao, J. Test and theoretical prediction of chloride ion diffusion in recycled fine aggregate mortar under uniaxial compression. Constr. Build. Mater. 2022, 321, 126384. [Google Scholar] [CrossRef]
  32. Wu, J.; Li, H.; Wang, Z.; Liu, J. Transport model of chloride ions in concrete under loads and drying-wetting cycles. Constr. Build. Mater. 2016, 112, 733–738. [Google Scholar] [CrossRef]
  33. Kessler, S.; Thiel, C.; Grosse, C.U.; Gehlen, C. Effect of freeze–thaw damage on chloride ingress into concrete. Mater. Struct. 2016, 50, 121. [Google Scholar] [CrossRef]
  34. Sun, L.F.; Jiang, K.; Zhu, X.; Xu, L. An alternating experimental study on the combined effect of freeze-thaw and chloride penetration in concrete. Constr. Build. Mater. 2020, 252, 119025. [Google Scholar] [CrossRef]
  35. Zhang, P.; Cong, Y.; Vogel, M.; Liu, Z.; Müller, H.S.; Zhu, Y.; Zhao, T. Steel reinforcement corrosion in concrete under combined actions: The role of freeze-thaw cycles, chloride ingress, and surface impregnation. Constr. Build. Mater. 2017, 148, 113–121. [Google Scholar] [CrossRef]
  36. Wang, R.; Zhang, Q.; Li, Y. Deterioration of concrete under the coupling effects of freeze–thaw cycles and other actions: A review. Constr. Build. Mater. 2022, 319, 126045. [Google Scholar] [CrossRef]
  37. Niu, D.; Jiang, L.; Bai, M.; Miao, Y. Study of the performance of steel fiber reinforced concrete to water and salt freezing condition. Mater. Des. 2013, 44, 267–273. [Google Scholar] [CrossRef]
  38. Quanbing, Y.; Beirong, Z. Effect of steel fiber on the deicer-scaling resistance of concrete. Cem. Concr. Res. 2005, 35, 2360–2363. [Google Scholar] [CrossRef]
  39. Meng, C.; Li, W.; Cai, L.; Shi, X.; Jiang, C. Experimental research on durability of high-performance synthetic fibers reinforced concrete: Resistance to sulfate attack and freezing-thawing. Constr. Build. Mater. 2020, 262, 120055. [Google Scholar] [CrossRef]
  40. Li, B.; Mao, J.; Nawa, T.; Liu, Z. Mesoscopic chloride ion diffusion model of marine concrete subjected to freeze-thaw cycles. Constr. Build. Mater. 2016, 125, 337–351. [Google Scholar] [CrossRef]
  41. Chen, X.; Yu, A.; Liu, G.; Chen, P.; Liang, Q. A multi-phase mesoscopic simulation model for the diffusion of chloride in concrete under freeze–thaw cycles. Constr. Build. Mater. 2020, 265, 120223. [Google Scholar] [CrossRef]
  42. Chekravarty, D.S.V.S.M.R.K.; Mallika, A.; Sravana, P.; Rao, S. Effect of using nano silica on mechanical properties of normal strength concrete. Mater. Today Proc. 2022, 51, 2573–2578. [Google Scholar] [CrossRef]
  43. Liu, Q.; Liu, Z.; Qian, B.; Xiong, Y. Effect of nano-modified permeable silicone emulsion on the durability of concrete curbstone. Constr. Build. Mater. 2022, 324, 126620. [Google Scholar] [CrossRef]
  44. Faried, A.S.; Mostafa, S.A.; Tayeh, B.A.; Tawfik, T.A. Mechanical and durability properties of ultra-high performance concrete incorporated with various nano waste materials under different curing conditions. J. Build. Eng. 2021, 43, 102569. [Google Scholar] [CrossRef]
  45. Norhasri, M.S.M.; Hamidah, M.S.; Fadzil, A.M. Applications of using nano material in concrete: A review. Constr. Build. Mater. 2017, 133, 91–97. [Google Scholar] [CrossRef]
  46. Amin, M.; Abu El-Hassan, K. Effect of using different types of nano materials on mechanical properties of high strength concrete. Constr. Build. Mater. 2015, 80, 116–124. [Google Scholar] [CrossRef]
  47. GB/T 50082-2019; Code for Durability Design of Concrete Structures. China Architecture & Building Press: Beijing, China, 2019.
  48. JGJ 55-2011; Code for Mix Proportions Design Procedure of Ordinary Concrete. China Architecture & Building Press: Beijing, China, 2011.
  49. GB/T 50476-2019; Concrete Long-Term Performance and Durability Test Method Standard. China Architecture & Building Press: Beijing, China, 2019.
  50. Maohua, Z.; Zhengyi, L.; Jiyin, C.; Zenong, T.; Zhiyi, L. Durability of Marine Concretes with Nanoparticles under Combined Action of Bending Load and Salt Spray Erosion. Adv. Mater. Sci. Eng. 2022, 2022, 1968770. [Google Scholar] [CrossRef]
  51. Mu, R.; Yan, A. Damage and damage suppression of HPC under freeze-thaw and stress composite effects. J. Build. Mater. 1999, 04, 359–364. (In Chinese) [Google Scholar] [CrossRef]
  52. SL 352-2020; Test Procedure for Hydraulic Concrete. China Architecture & Building Press: Beijing, China, 2020.
  53. Collepardi, M.; Marcialis, A.; Turriziani, R. Penetration of Chloride Ions into Cement Pastes and Concretes. J. Am. Ceram. Soc. 1972, 55, 534–535. [Google Scholar] [CrossRef]
  54. Hongfa, Y. Prediction method of durability, mechanism and service life of high performance concrete in salt lake area. J. Southeast Univ. 2004, 32, 638–642. (In Chinese) [Google Scholar]
  55. Mangat, P.S.; Molloy, B.T. Prediction of long term chloride concentration in concrete. Mater. Struct. 1994, 27, 338–346. [Google Scholar] [CrossRef]
  56. Costa, A.; Appleton, J. Chloride penetration into concrete in marine environment-Part II: Prediction of long term chloride penetration. Mater. Struct. 1999, 32, 354–359. [Google Scholar] [CrossRef]
  57. Yuanzhan, W.; Shuangzhu, T.; Wang, J. Chloride diffusion model considering the influence of load under different environmental conditions. Channel Port 2010, 31, 125–131. (In Chinese) [Google Scholar]
  58. Thomas, M.D.A.; Bamforth, P.B. Modelling chloride diffusion in concrete: Effect of fly ash and slag. Cem. Concr. Res. 1999, 29, 487–495. [Google Scholar] [CrossRef]
  59. Taylor, H.F.W. Cement Chemistry, 2nd ed.; Lightening Source Inc.: London, UK, 1997. [Google Scholar]
  60. Mu, R. Durability and service time prediction of concrete under combined action of freeze-thaw cycles, external bending stress and salt solution. Ph.D. Thesis, Southeast University, Dhaka, Bangladesh, 2000. (In Chinese). [Google Scholar]
Figure 1. The concrete durability test chamber for the salt spray erosion test [50]. Reprinted from Ref. [50]. 2022, Maohua Zhang.
Jmse 10 01852 g001
Figure 2. The schematic diagram of bending load device [51].
Jmse 10 01852 g002
Figure 3. Cl- sampling, sorting and drying.
Jmse 10 01852 g003
Figure 4. The determination of total Cl- content.
Jmse 10 01852 g004
Figure 5. The determination of free Cl- content.
Jmse 10 01852 g005
Figure 6. The flow chart of methodology.
Jmse 10 01852 g006
Figure 7. The relationship between depth and age under the action of dry–wet cycles and full immersion.
Jmse 10 01852 g007
Figure 8. Total and free Cl- content under the action of full immersion.
Jmse 10 01852 g008
Figure 9. Total and free Cl- content under the action of dry–wet cycles.
Jmse 10 01852 g009
Figure 10. Binding Cl- content under the action of dry-wet cycles and full immersion.
Jmse 10 01852 g010
Figure 11. Total Cl- content (x = 5 mm).
Jmse 10 01852 g011
Figure 12. Binding Cl- content (x = 5 mm).
Jmse 10 01852 g012
Figure 13. The relationship between free Cl- content and nanoparticles dosage of NS and NF(II).
Jmse 10 01852 g013
Figure 14. Cl- diffusion coefficient under both the action of dry–wet cycles and full immersion.
Jmse 10 01852 g014
Figure 15. Cl- diffusion coefficient under the action of salt freeze–thaw cycles.
Jmse 10 01852 g015
Figure 16. Cl- diffusion coefficient under the combined action of bending load and salt spray erosion.
Jmse 10 01852 g016
Figure 17. The fitting result of K value under the action of full immersion.
Jmse 10 01852 g017
Figure 18. The fitting result of K value under the action of dry–wet cycles.
Jmse 10 01852 g018
Figure 19. The fitting result of K and A under the action of dry–wet cycles and full immersion.
Jmse 10 01852 g019
Figure 20. The fitting result of K value and A value under the action of salt freeze–thaw cycles.
Jmse 10 01852 g020
Figure 21. The fitting results of relationship between m and A of NS and NF(II) under the combined action of dry–wet cycles and Cl-.
Jmse 10 01852 g021
Figure 22. The fitting results of the relationship between m and A of NS and NF(II) under the combined action of salt freeze–thaw cycles and Cl-.
Jmse 10 01852 g022
Figure 23. The fitting results of the relationship between m and A of NS and NF(I) under the combined action of bending load and salt spray erosion.
Jmse 10 01852 g023
Figure 24. The fitting results of the Cl- diffusion modified model for nano-marine concretes under the action of full immersion.
Jmse 10 01852 g024
Figure 25. The fitting results of Cl- diffusion modified model for nano-marine concretes under the action of dry–wet cycles.
Jmse 10 01852 g025
Figure 26. The fitting results of the modified Cl- diffusion model for nano-marine Concretes under the action of salt freeze–thaw cycles.
Jmse 10 01852 g026
Figure 27. The fitting results of modified Cl- iffusion model for nano-marine concretes under the combined action of bending load and salt spray erosion.
Jmse 10 01852 g027
Table 1. The properties of Nanoparticles.
TypesDiameter
(nm)
AppearancePurity
(%)
Specific Surface Area
(m2/g)
PhasePH
SiO230White powder99.5190–2505–7
Fe2O350–100Red powder99.760m
Fe3O450–100Black powder99.5130β
Table 2. Mix proportions of concrete (kg·m−3).
Types of CementNumberWaterCementSandCoarse AggregateFDNDefoa-MerNanopartic-Les
Ordinary concretePC205486.063811851.90
Nano-SiO2
concrete
NS05205483.663811851.900.082.4
NS10205481.163811851.900.084.9
NS20205476.363811851.900.089.7
NS30205471.463811851.900.0814.6
Nano-Fe2O3
concrete
NF(I)05205483.663811851.900.082.4
NF(I)10205481.163811851.900.084.9
NF(I)20205476.363811851.900.089.7
NF(I)30205471.463811851.900.0814.6
Nano-Fe3O4
concrete
NF(II)05205483.663811851.900.082.4
NF(II)10205481.163811851.900.084.9
NF(II)20205476.363811851.900.089.7
NF(II)30205471.463811851.900.0814.6
Table 3. Values of environmental coefficient [54]. Reprinted with permission from Ref. [54]. 2004, Hongfa Yu”.
Submerge ZoneTidal ZoneSplash ZoneAtmospheric Zone
fh1.320.920.270.68
Table 4. The fitting result of coefficient under the action of dry–wet cycles and full immersion.
Types of ConcreteefgR
QNS0.090.050.010.9907
QNF(II)0.090.030.010.9933
GNS0.120.060.020.9938
GNF(II)0.120.040.010.9956
Table 5. The fitting result of coefficient under the action of freeze–thaw cycles.
Types of ConcreteefgR
NS0.080.060.010.9997
NF(II)0.070.050.010.9841
Table 6. The fitting results of Equation (7).
Types of ConcretehIgkR
PC1.000.370.3100.9224
NF(I)050.992.08−9.4311.940.9423
NF(I)101.003.64−17.4521.230.9975
NF(I)200.992.55−12.4215.650.9896
NF(I)300.992.72−12.6415.540.9844
NS050.992.38−11.3814.330.9861
NS100.993.42−15.7219.070.9980
NS201.003.42−15.7519.140.9969
NS301.003.54−16.6420.140.9991
Table 7. The fitting results of Equation (8).
Types of ConcretehigR
PC0.98−1.892.370.8788
NF(I)050.99−2.583.550.9755
NF(I)100.99−2.443.120.9386
NF(I)200.99−2.583.430.9752
NF(I)300.99−2.613.590.9763
NS050.99−2.583.480.9792
NS100.99−2.383.050.9294
NS200.98−2.322.950.9228
NS300.99−2.453.210.9491
Table 8. Values of the age attenuation coefficient [56,57,58]. Reprinted with permission from Refs. [56,57,58]. 1999, 2010 and 1999. A. Costa, Yuanzhan Wang and M.D.A. Thomas.
Marine EnvironmentTypes of Concrete
Portland CementFly AshSlagSilica
Submerge zone0.300.690.710.62
Tidal and splash zone0.370.930.600.39
Atmosphere zone0.650.660.850.79
Table 9. The fitting results under the combined action of dry–wet cycles and Cl-.
abcdR
QNS0.280.462.082.600.9814
QNF(II)0.330.372.091.930.9537
GNS0.210.712.376.080.9877
GNF(II)−0.030.802.1811.290.9444
Table 10. The fitting results under the combined action of salt freeze–thaw cycles and Cl-.
Types of ConcreteabcdR
NS0.240.482.092.730.9889
NF(II)0.280.392.082.150.9766
Table 11. The fitting results under the combined action of bending load and salt spray erosion.
Types of ConcretelrjzR
NS0.460.41−0.230.040.9957
NF(I)0.470.43−0.240.040.9762
Table 12. The damage degree of salt freeze–thaw cycles for marine concretes (%).
The Number of Salt Freeze–Thaw Cycles0255075100125150175200
PC03.097.6115.9128.6640.4553.16--
NS0502.055.4911.9721.4030.9542.1452.17-
NS1001.495.1110.8819.2828.1839.1648.62-
NS2001.003.128.4815.6523.4730.9639.6149.74
NS3001.164.349.0116.4325.9536.4446.87-
NF0502.246.3813.4722.7233.7842.8653.05-
NF(II)1002.124.8811.4721.4531.3039.5851.13-
NF(II)2001.293.999.8517.7326.8533.5742.4348.95
NF(II)3002.125.5311.6919.2428.9837.7148.56-
Table 13. The fitting results of relationship between values of F and N.
Types of ConcreteuvwR
NS−1.920.148.19 × 10−40.9912
NF(II)−2.140.177.00 × 10−40.9803
Table 14. The fitting results of the salt freeze–thaw damage influence coefficient.
PCNS05NS10NS20NS30NF(II)05NF(II)10NF(II)20NF(II)30
w0.09250.08990.09330.09120.09880.09120.09010.09210.0899
R0.99090.99170.99320.99030.99190.98990.99430.99190.9878
Publisher’s Note: MDPI stays neutral with regard to jurisdictional claims in published maps and institutional affiliations.

