Article

Coastal Flood Risk Assessment: An Approach to Accurately Map Flooding through National Registry-Reported Events

1
Mediterranean Institute for Environmental Studies, Science and Research Centre Koper, 6000 Koper, Slovenia
2
Department of Geography, University of Maribor, 2000 Maribor, Slovenia
*
Author to whom correspondence should be addressed.
J. Mar. Sci. Eng. 2023, 11(12), 2290; https://doi.org/10.3390/jmse11122290
Submission received: 24 October 2023 / Revised: 20 November 2023 / Accepted: 30 November 2023 / Published: 2 December 2023
(This article belongs to the Special Issue Natural Hazards: Coastal Erosion, Inundation and Sea-Level Rise)

Abstract

:
The escalating frequency and severity of climate-related hazards in the Mediterranean, particularly in the historic town of Piran, Slovenia, underscore the critical need for enhanced coastal flood prediction and efficient early warning systems. This study delves into the impediments of available coastal flood hazard maps and the existing early warning system, which rely on distant sensors, neglecting the town’s unique microclimate. The current study leverages the public registry maintained by the Administration of the Republic of Slovenia for Civil Protection and Disaster Relief (URSZR), an underutilized resource for generating comprehensive and accurate flooding maps for Piran. Here, we show that in the historic town of Piran, floodings reported through the national registry can be used to map coastal flooding by means of verification and validation of the georeferenced reports therein, with subsequent correlation analysis (hotspot, cluster, and elevation polygons) that show temporal and spatial patterns. The innovative approach adopted in this study aims to bolster the accuracy and reliability of flooding data, offering a more nuanced understanding of flood patterns (in Piran, but generally applicable where national or regional registries are available). The findings of this research illuminate the pressing need for localized field-report and sensor systems to enhance the precision of flood predictions. The study underscores the pivotal role of accurate, localized data in fortifying coastal towns against the escalating impacts of climate change, safeguarding both the inhabitants and the invaluable architectural heritage of historic areas.

1. Introduction

In recent years, Europe has experienced a notable increase in the frequency and intensity of climate-related hazards, particularly extreme weather events, which are now lasting longer than before [1]. Amidst the global rise in sea levels, coastal areas are increasingly vulnerable to extreme weather events, including storm surges. Such conditions heighten the risk of coastal flooding, posing significant threats to villages, towns, and cities. The built environment, infrastructure, and daily life face potential disruption, especially in the absence of adequate measures to mitigate the swift rise of sea water [1,2].
The Mediterranean basin, especially, is facing such events as well [3], with the North Adriatic, including Slovenia, characterized by storm surges under the influence of low atmospheric pressure events and particular wind directions [4,5,6], observed from long-time data series on wind force [4,7] and sea surface [8]. Nevertheless, milder storms with less significant wave heights are expected within the second half of this century [9] with a negative trend of cyclones [10]. Further, for Slovenia, the combined results of sea level rise extrapolated from observed and IPCC-directed predictions [11,12,13] with LIDAR assessments [14] do show alarming trends for both the frequency and severity of future events of coastal salt-water flooding.
Such events are also occurring in the North Adriatic of the Mediterranean basin, with typical examples within the Gulf of Venice [15,16] and the Gulf of Trieste, including the 47 km of Slovenian coastline [17,18,19]. Of all the Slovenian inhabited coastal area, the historic town of Piran is most at risk of being flooded by the sea; e.g., just like the city of Venice, it is located at a very low elevation, vulnerable to a combination of high tides, southeast wind, and low atmospheric pressure [12,17,20]. Generally, for the Slovenian coast, it has been mentioned that during 1963–2003, the low-lying parts experience, on average, 7.3 floods per year [17]. Amidst the escalating impacts of climate change, this historical Venetian town, Piran, stands at a heightened risk, potentially threatening not only the safety and well-being of its inhabitants but also its invaluable architectural heritage, which bears significant historical and cultural importance [21,22,23].
However, while the need for prediction of when, where, and to what extent coastal flooding appears, due to the combined effects of sea-level rise, storm surges, atmospheric pressure, wind direction [4,5,6,12], and geographic location, for Slovenia, in particular, sea flooding maps have been based on older flooding events data [17] or extreme events with low probability combined with sea-level rise predictions [14]. A significant issue for Piran lies in the fact that its flood hazard map and early warning system, intended to alert citizens of impending floods, directly rely on sea (buoy) and land sensors in the port of Koper and the airport of Portorož, locations that are 4, 15, and 10 km away from Piran, respectively. With no existing sensors within Piran itself, this setup overlooks the unique geography and microclimate of Piran, which influences flood patterns differently than in Koper, thereby potentially compromising the accuracy of flood predictions and the effectiveness of early warnings in the town.
SCORE is a European Commission (EC)-funded project, in which the Slovenian town of Piran is included, that investigates the climate adaptation of European coastal cities [24] to build resilience through smart solutions and implementation of ecosystem-based approaches [25,26]. While the solutions are being collaboratively developed with local stakeholders, both the retrieval of data and equipping communities with precise information on past and anticipated flooding events and their severity present significant challenges [25,26,27,28]. In this context, we employ an innovative approach to enhance the accuracy and reliability of the coastal flooding data provided. The public registry for natural disasters (SPIN database) maintained by the Administration of the Republic of Slovenia for Civil Protection and Disaster Relief (URSZR) proves to be a valuable resource and is the only database that holds structural information on the historic flood events on the Slovenian coast, albeit it was not intended as such. It serves as a registry of reported natural or other risks to civil safety, the reports on interventions to those events, and, in many cases, the direct consequences of such events. It is utilized to decide on appropriate intervention regarding civil safety during natural hazards, based on on-site (informed meteorological, e.g., local storm surge and sea level) situation assessment. Despite not mentioning the severity of the natural disaster and despite its existence since 2005, it has not been utilized for generating flooding maps for the historic town of Piran. The present initiative marks a pioneering effort in leveraging this registry for such a purpose, ensuring a more comprehensive and accurate understanding of flood patterns in Piran.
Hence, using the SPIN database’s recorded events, this paper intends to: show the usability of a natural disaster registry to map coastal flooding; show the seasonality (seasonal occurrence) of coastal flooding events in relation to flood zones; show trends in frequency of reported flooding events; determine the flood zones within the historic town of Piran from previously recorded flooding events.

2. Materials and Methods

2.1. SPIN Database

The Administration for Civil Protection and Disaster Relief of the Republic of Slovenia (abbreviation: URSZR) keeps a record of the reported occurrence of natural hazards through the Information System for Reporting Accidents and Interventions (in Slovene: Informacijski Sistem za Poročanje o nesrečah in INtervencijah, hence the abbreviation SPIN). The regional office in Koper is responsible for recording and entering the reported natural hazard events in the Slovenian coastal area that comprises the coastal cities and smaller communities, including Ankaran, Izola, Koper, Piran, and Portorož. SPIN was established in 2005 and has been in use since then, compiling, amongst others, data on coastal flooding.
Each event entry in the SPIN database includes information on natural hazards (categories include intense cold, intense heat, strong winds, landslides, floods, earthquakes, frost, interruption of traffic due to natural phenomena, drought, hailstorm, lightning strike, heavy snow, sea flooding, glaze ice; it also covers disease outbreaks as a non-natural hazard feature) entered by date and hour of reporting and, additionally, written descriptions on the event, the intervention, and the consequences. The database also includes World Geodetic System (WGS) coordinates, while, in the written descriptions, street names, buildings, or other reference points of the town are often mentioned, providing a more accurate location (than WGS) of the event.
A brief protocol of how data are entered in the SPIN database is illustrated by Figure 1 and provided here. SPIN entries are created through an established process consisting of four phases (hexagons of Figure 1): (1) The Regional Notification Center (Regijski center za obveščanje, ReCO) is informed about a potential emergency, either called in by citizens who witnessed a natural disaster or other event or initiated by ReCO through early warning systems and monitoring of relevant data (both camera visuals and meteorological data from National Meteorological Service of Slovenia, ARSO). If received information is deemed worthy of intervention, ReCO creates the initial SPIN entry that contains only the most basic information (coordinates of the location, short description of the event, and potential additional data that can aid the first responders). (2) The first responders, who in the case of natural disasters are usually local firefighters, carry out an on-site assessment of additional intervention steps and decide whether an actual intervention is needed. If further actions are necessary, the intervention is carried out by the firefighter brigade, civil protection service, or, in cases when helicopter support is needed, police and army as well. This step is led by the intervention manager who updates the SPIN database entry during the intervention. (3) After the intervention is finished, the intervention manager completes the entry by describing the aftermath of the intervention with damages, costs of the intervention, etc. (4) In the final step, ReCO finalizes the entry and forwards it to the National Notification Center (Center za obveščanje, CORS) to inform the public.

2.2. Confirmation of the SPIN-Recorded Flooding Events

Flooding events used for the current analysis were SPIN entries that corresponded to flooding events located within the historic town center of Piran. Hence, exclusion criteria were: multiple coverage of the same event; unknown location; no description of the event and the event’s consequences; description stating there was no need to intervene; description and or coordinates tagging the event to places outside of the historic town center, for example, occurring in other parts of the municipality of Piran (e.g., Sečovlje, Portorož, Strunjan); event locations being falsely tagged offshore.
Subsequently, based on the event description, the interventions, and consequences reported in SPIN, the relevant locations were spatially interpreted and provided a final dataset of entries with verifiable geolocation (consisting of either a textual description, coordinates, or both).

2.3. Geolocation of the Confirmed Flooding Events

The given SPIN location of an event was assumed to be correctly entered if its written description generally confirmed the matched WGS coordinates of the event. Event entries were considered valid if their descriptions mentioned low-lying areas (as opposed to, e.g., higher-lying areas that were entered in the SPIN database by mistake), and if, at the same time, the entered WGS coordinates were confirmed to be low-lying areas. On the other hand, event entries were considered invalid if their description mentioned low-lying areas, but their recorded coordinates were positioned outside of low-lying areas. In cases where the described locations were different from the recorded coordinates, the data point was deemed valid only if the marked location was in a low-lying area or at roughly the same elevation as the described locations. For instance, data points that had a WGS coordinate in Punta and whose description mentioned flooded low-lying areas along the coast, especially Punta and Prešeren embankment (which refers to a wider area and not a specific coordinate), were deemed valid, and, thus, subsequently, the said data point was duplicated and positioned on the Prešeren embankment. No further positions were added for the location of a mere description of “low-lying parts”.
No additional data points were created for land locations that were not described but reasonably could have been been described individually in relation to the other locations mentioned, e.g., if the description of the data point mentions Prešeren embankment and Cankar embankment, but does not mention Kidrič embankment, which is one of the lowest-lying points in the study area. Still, no data point for such a land position (in this case, Kidrič embankment) was added.
Data points that referred only to “the lowest parts of the coast” or similar, and were marked in the sea, a few meters away from the shore, were positioned at the nearest point on the coastline. As some individual entries mentioned unspecified “other locations”, these ended up in the cluster “Other”, indicated in this manuscript as the zone labelled “inland areas with most residential and historic buildings”.
The above-described confirmation of the original geolocated entry of the natural hazards in the SPIN database (Section 2.2 and Section 2.3) eventually yielded validated data points of flooding events corresponding to location-specific flood events, recognized as simultaneous floodings occurring in separate zones (that currently are not possible to tune to accurate consecutive time-dependent information regarding executed actions by the intervention managers, i.e., steps 3 and 4 of the SPIN entry protocol). The extraction from the SPIN database, according to the current applied approach, prevents appointing multiple data points to a specific time unit.

2.4. Analysis of the Validated Flooding Geolocations

The flood zones were defined based on validation of SPIN flooding data mapped within a certain area, named by a town-specific landmark. All the locations described were within a narrow coastline that was generally delimited to the areas between the sea and the first lines of buildings. Exceptionally, in the case of the Tartini square area, the first adjacent row of surrounding buildings was also included (in the central part of the town), as a significant number of data entries in this area were specifically locked to buildings and also mentioned said buildings. Next to Tartini Square, other typical landmarks of the town were included in the flood zones, such as the lighthouse and the church in the “Punta” area, as these are two historic buildings prominently stand out from the more compact built environment. Another exception was included for the Prešeren embankment, where the first half row of buildings facing the sea was included in the zone.
To perform further analysis of the validated spatial geolocations, maps were overlayed with hexagons (86.5 m2). This cell shape was selected to increase the number of neighboring cells as compared to standard square-shaped cells, which optimized the results of further analysis.
QGIS plugins were used to implement local indicators of spatial association statistics [29] with the Getis-Ord Gi * statistics used to perform hotspot analysis for maps [30,31], and Moran’s I was used for cluster analysis [32].
The Getis-Ord Gi * hotspot analysis tool calculates statistics for each feature in a dataset with resultant z-scores and p-values that inform whether features like flooding events associated to geographic locations (in this case, hexagons to which flooding events are attributed) are clustered spatially (as compared to the map’s whole) with certain confidence intervals (99, 95 or 90%), either as high values (hotspots, red/orange/yellow hexagons) or low values (coldspots, blue-range hexagons), or are non-significant, meaning subjected to random spatial patterns [30,31].
The Moran’s I cluster analysis [32,33] tool identifies whether geographic features (locations) and associated attributes (in this particular case, flood events) can be expressed in a pattern that is either clustered, dispersed, or random. It identifies concentrations of high values, concentrations of low values, and spatial outliers [32], but, most importantly, this spatial autocorrelation is characterized by a correlation in a signal among nearby locations in space. Hence, it takes surrounding features of locations into consideration. The land surface of Piran was divided in hexagons, and each of these hexagons was classified according to whether the incidence of flooding events in said hexagon was above (high) or below (low) the global (map’s) mean and whether the weighted mean across its neighboring hexagons was above or below the global (map’s) mean. Based on this, hexagons received a value of non-significant; high-high (HH, red with a black rim); high-low (HL, white with a red rim); low-high (LH, white with a blue rim); and low-low (LL, blue with a black rim), indicating the value of incidence for a flooding event itself and the incidence value of the weighted mean across its neighboring hexagons (both as compared to the map’s mean).
The incidence of flooding (frequency of flooding events) was correlated to elevation polygons. This yielded a map with elevation polygons where each zone corresponds to an area with an elevation range (10 cm of elevation increments) for which the sum of recorded flooding events is visualized. Thus, elevation polygon in this manuscript refers to a circumscribed surface area with a specific elevation range.

2.5. Geographic Information Sources and Systems

Maps, specific layers, and statistical analysis were prepared and performed using the open source QGIS software (version 3.22). WGS coordinates from the SPIN database were transferred to GIS georeferenced data and entered in elevation and cluster analysis maps.
The elevation map was created from LIDAR data from the Surveying and Mapping Authority of the Republic of Slovenia (Geodetska uprava Republike Slovenije, GURS). The land-use map was created from the data of the Ministry of Agriculture, Forestry and Food (Ministrstvo za kmetijstvo, gozdarstvo in prehrano, MKGP) and GURS. Geolocated flooding events maps were made from data provided by URSZR.
Google satellite images and GURS orthophoto of Slovenia were used as cartographic layers and basemaps.

3. Results

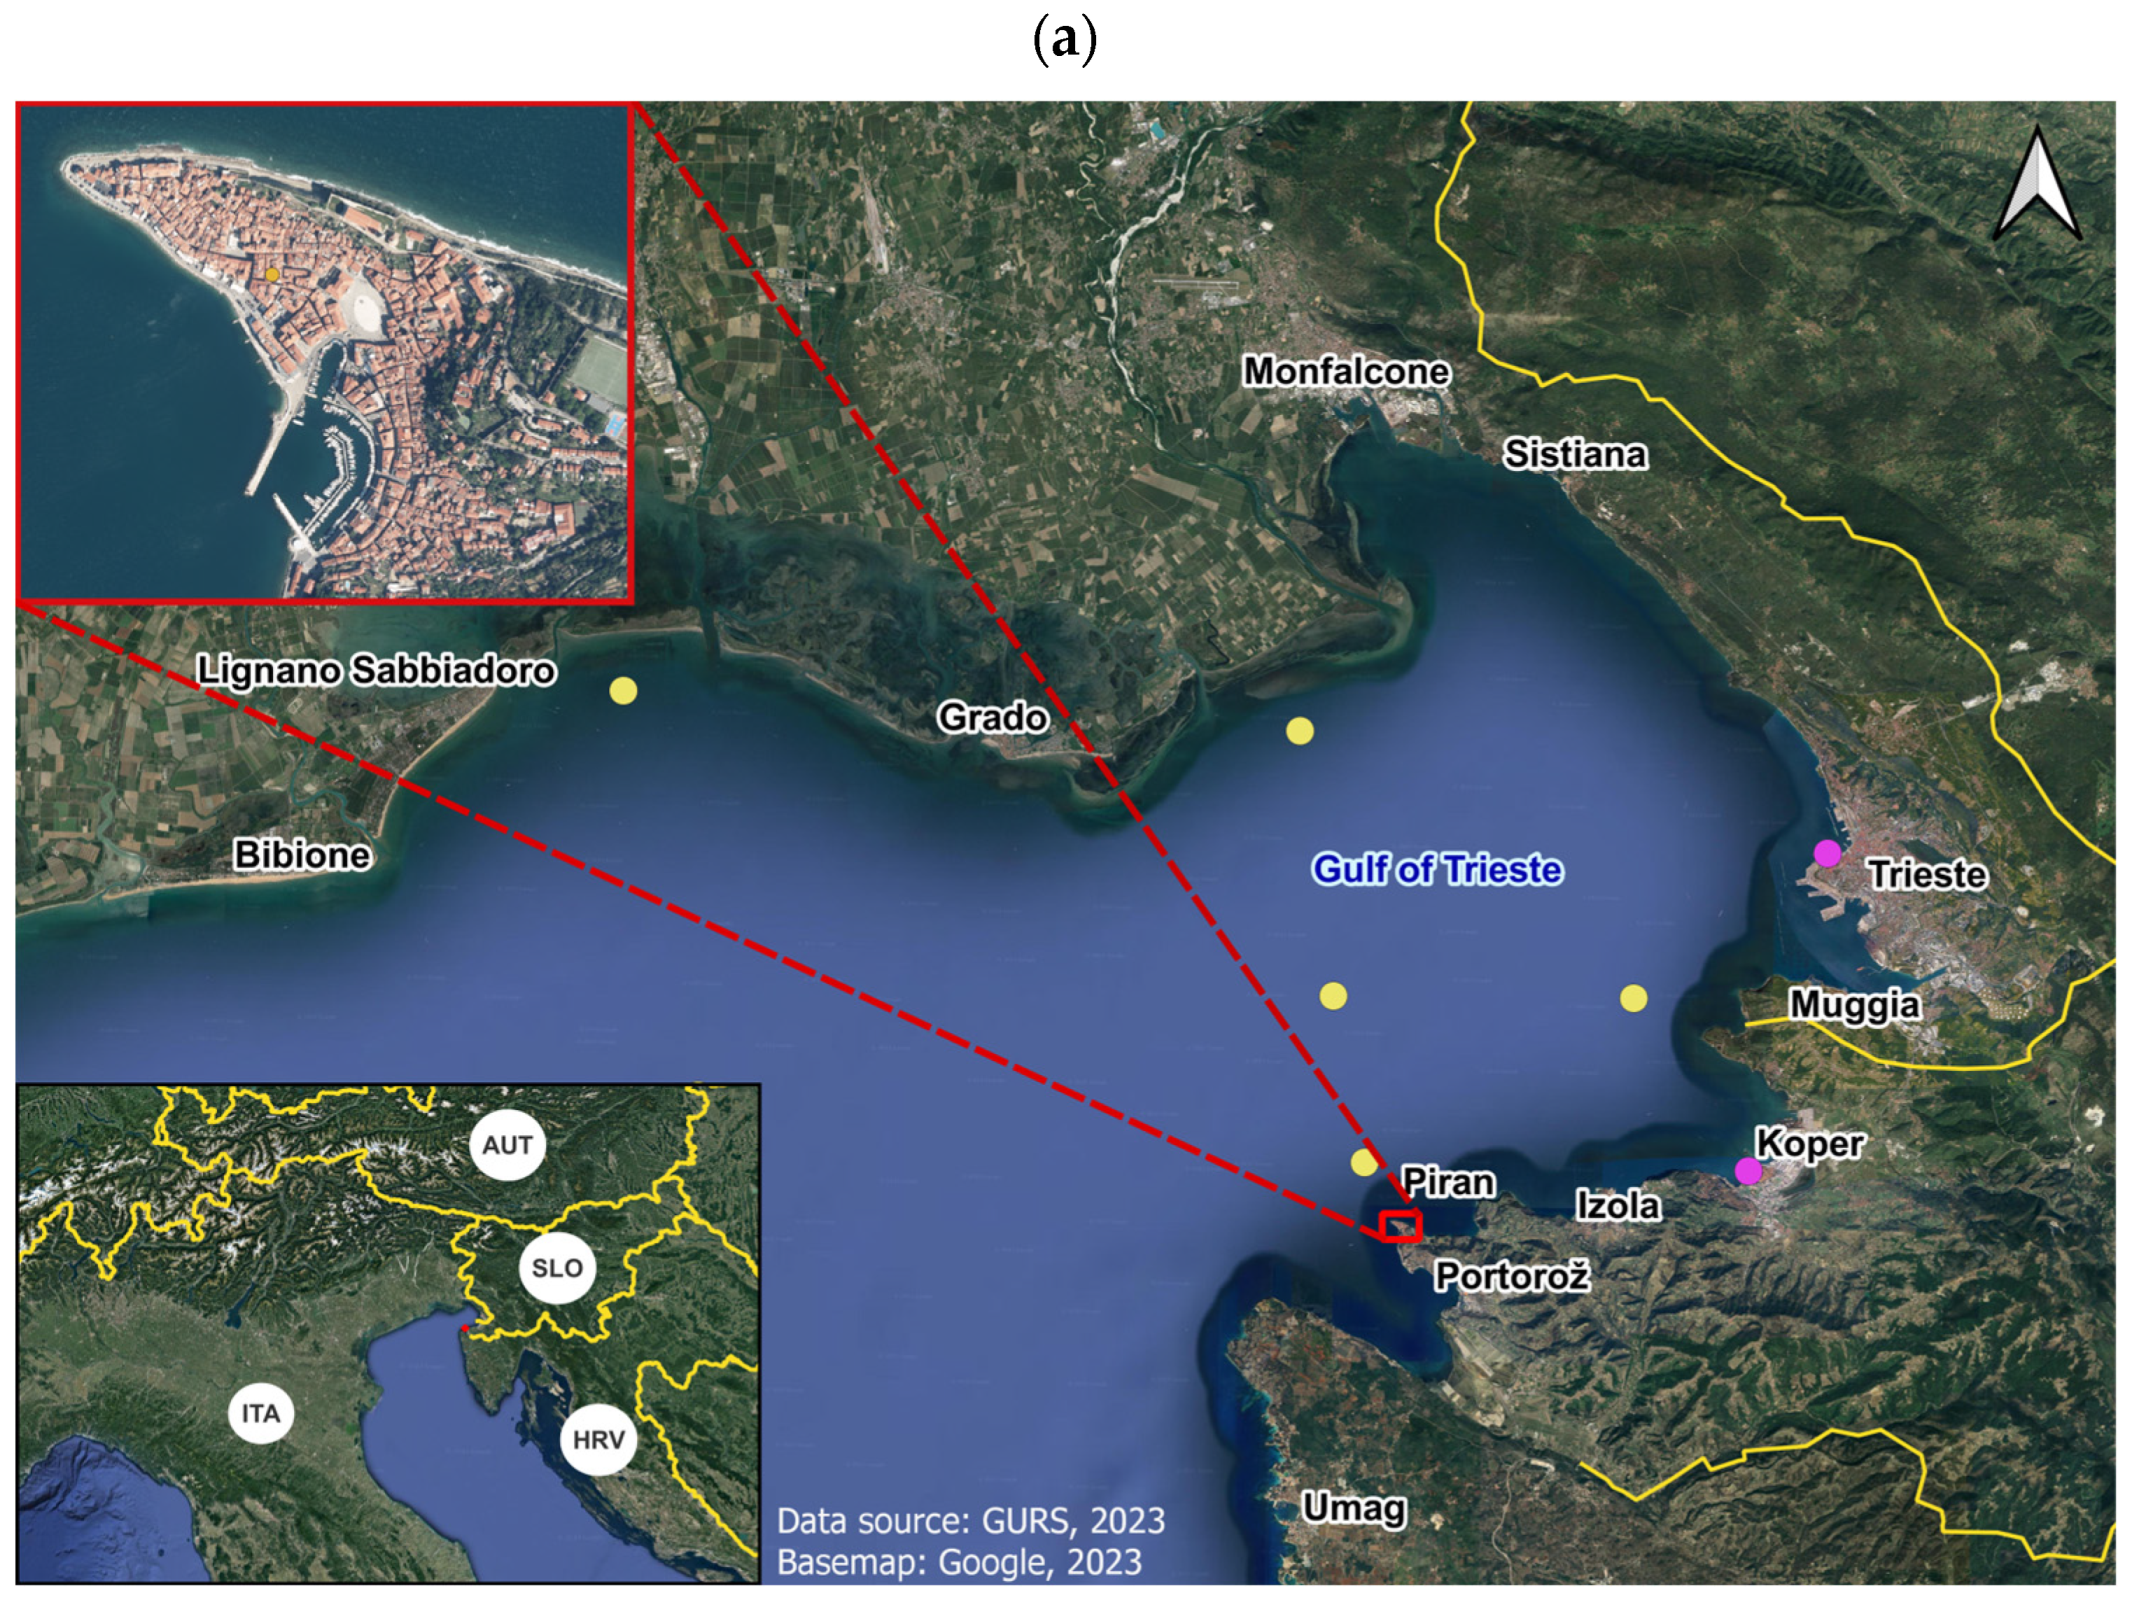
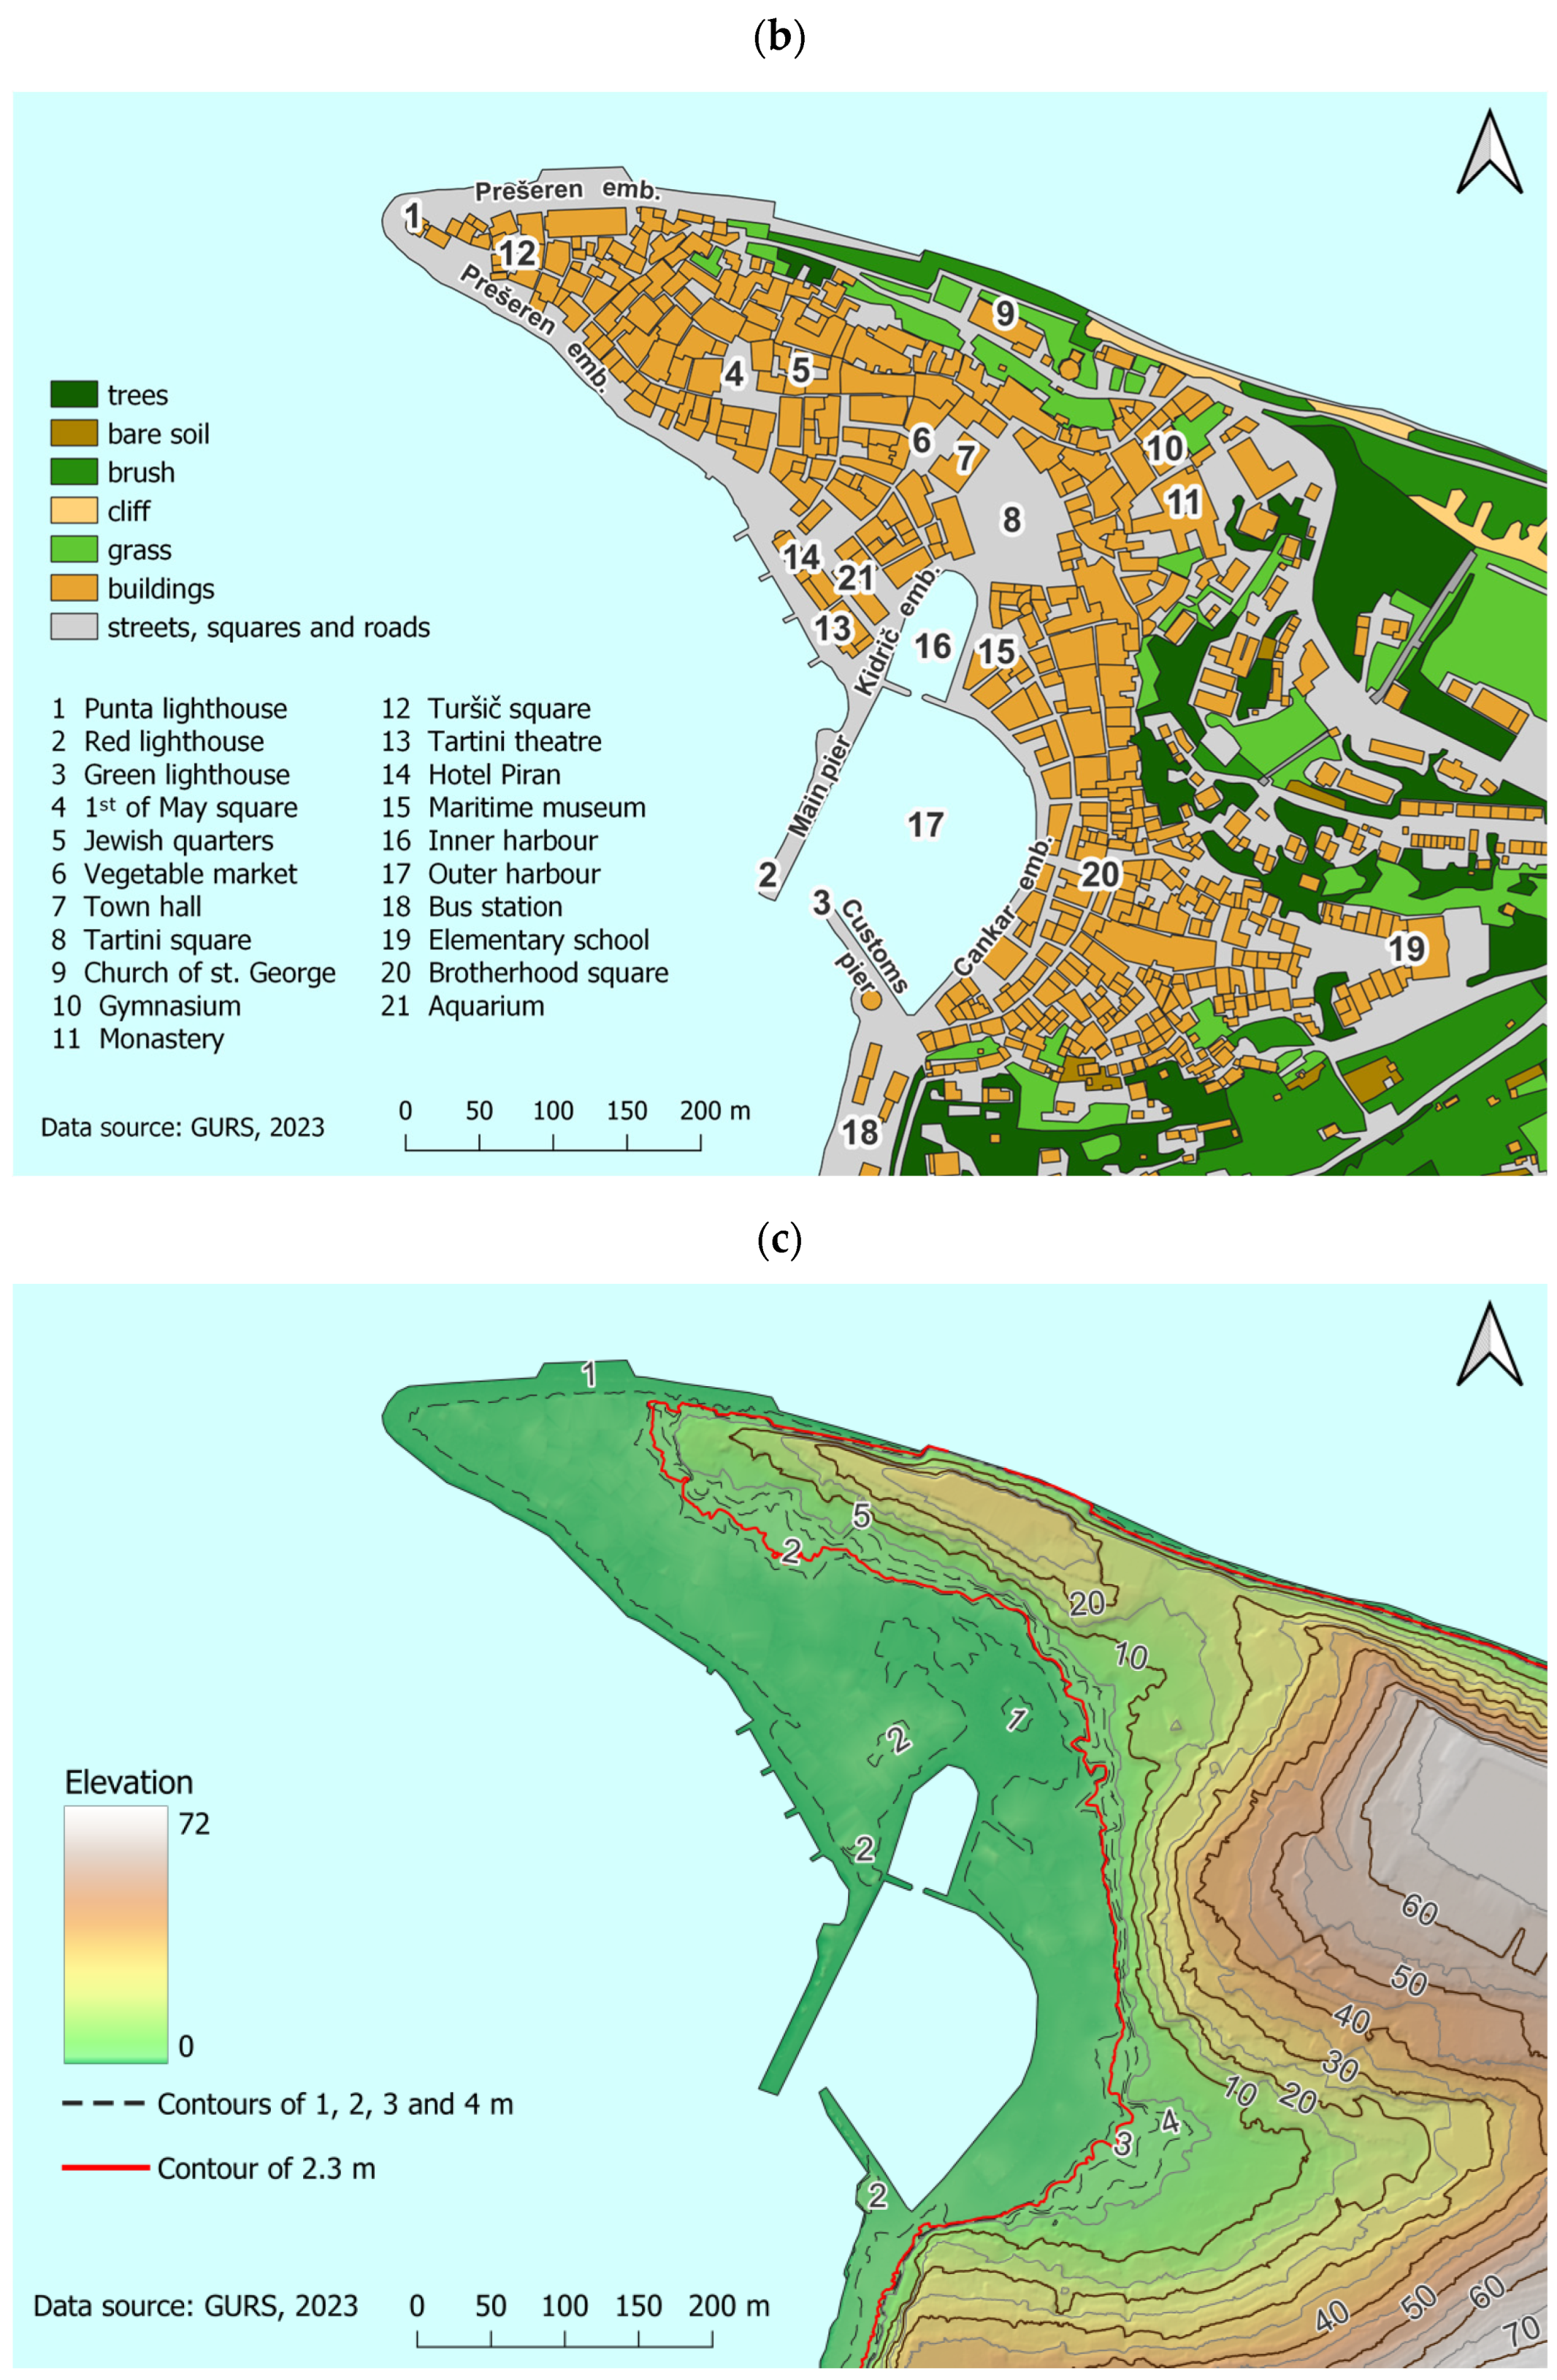
3.1. Basic Geographical Data of the Study Area

Figure 2 shows the geographical reference of the coastal town of Piran within the North Adriatic and within the wider Mediterranean basin. The town’s historic center is located on the peninsula, with most of the area below 2 m above sea level, while the highest points, the slope towards the northeastern hills, are at 70+ meters.

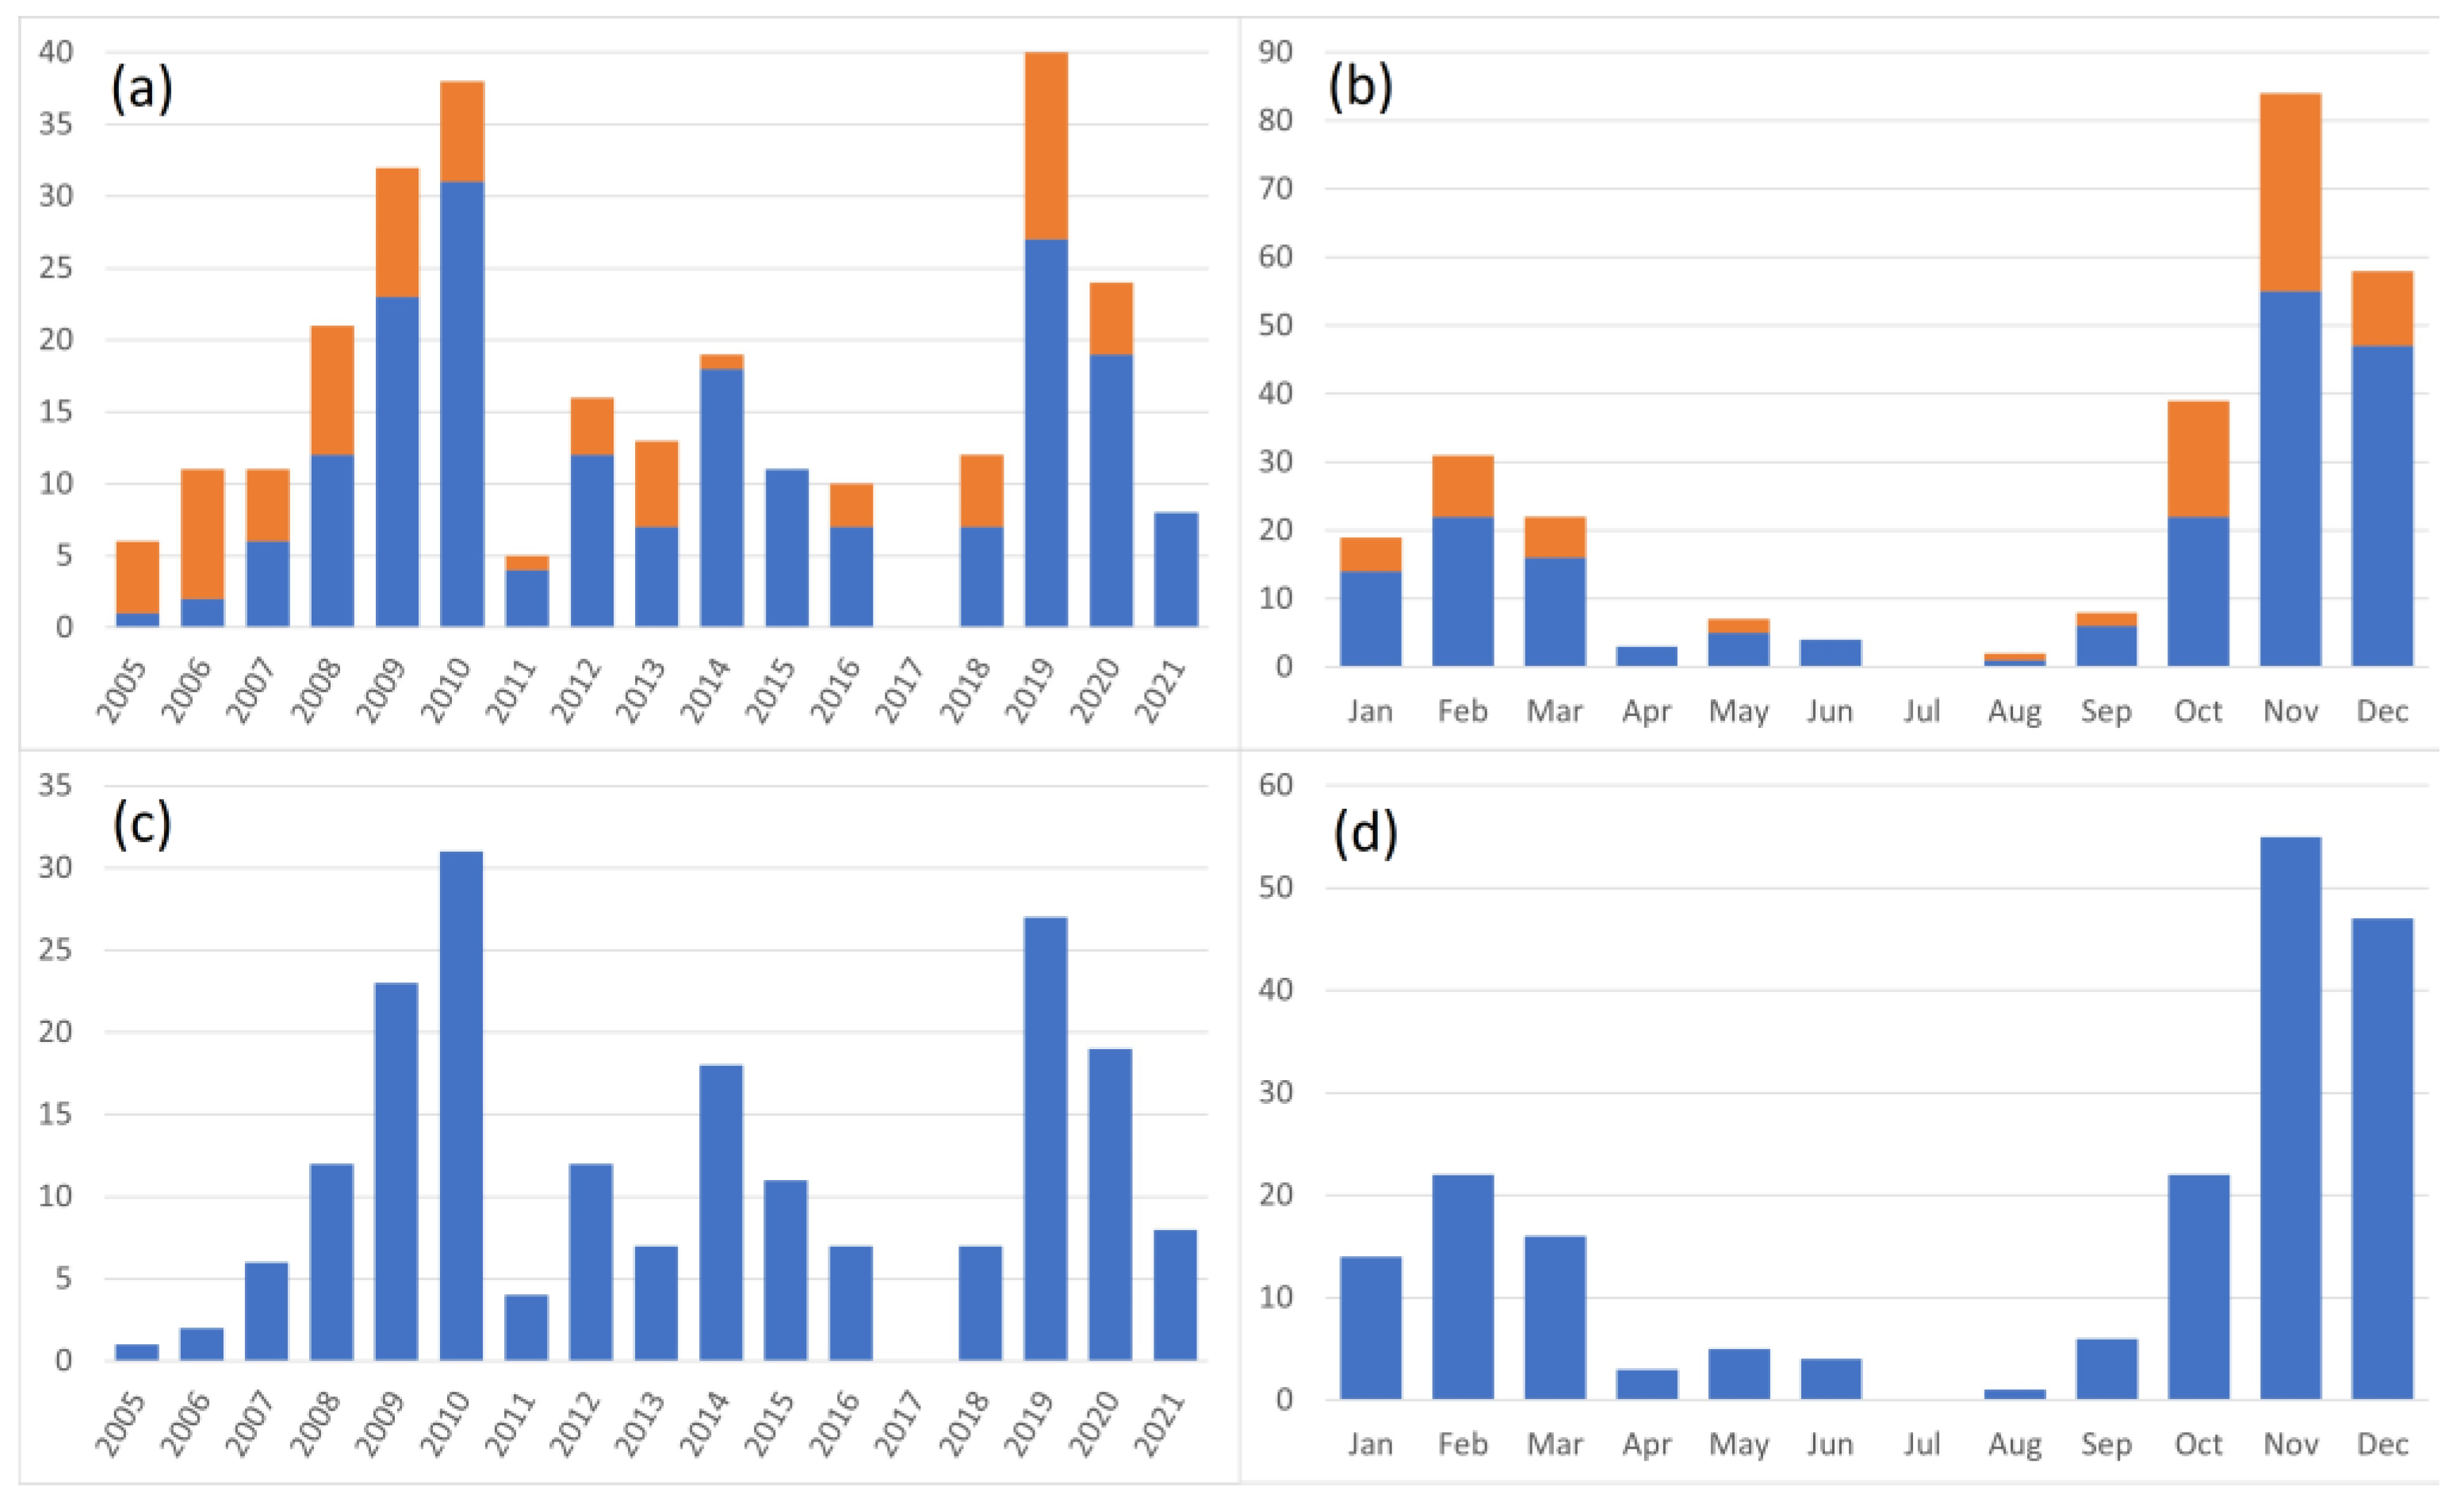
3.2. Flooding Events from SPIN Database

The initial SPIN dataset contained 598 entries of reported flooding events at the Slovenian coast, of which 277 were categorized as occurring in the municipality of Piran. After all the invalid entries were removed, the dataset contained 196 entries corresponding to flooding events located within the historic town center of Piran. The distribution within the historic town of Piran is shown in Figure 3a. Subsequently, based on the descriptions of the event, interventions, and consequences reported in the SPIN database, the relevant locations were spatially (re-)interpreted, producing a separate dataset that contained 419 entries with verifiable geolocation (consisting of either a textual description, coordinates, or both). Mapping of the events after the current validation by spatial interpretation/verification is shown in Figure 3b.
The final number of validated georeferenced sea flood events (419) is larger than the intermediate number of the validated original database entries (196) due to discrimination of the event reports into several distinct geolocations, depending on the described and recorded locations within the SPIN database. Note that multiple distinct areas can be flooded during an event on the same day, and, thus, on average, each flooding event in Piran during 2005–2021 took place simultaneously in 2.14 flood-prone areas.
Most of the reported flooding events are located at the coastal interface and, subsequently, the validated flooding events were distributed into flood-prone zones that correspond to ten coherent areas based on the built infrastructure of the town’s historic center. This is shown in Figure 3b, where the following flood zones are specified: (1) Punta, (2) Prešeren embankment (Prešernovo nabrežje), (3) Hotel Piran parking area (Hotel Piran parkirišče), (4) Hotel Piran beach (Hotel Piran plaža), (5) main pier (glavni pomol), (6) customs pier (carinski pomol), (7) Tartini Square (Tartinijev trg), (8) Kidrič embankment (Kidričevo nabrežje), (9) Cankar embankment (Cankarjevo nabrežje), (10) inland areas with most residential and historic buildings.

3.3. Incidence of Coastal Flooding in Piran

Over the period 2005–2021, the accumulated flooding events extracted from the SPIN database can be displayed as the incidence of yearly and monthly total flooding events, as shown in Figure 4. The yearly flooding events over the period 2005–2021 range from 0 in 2017 to the highest number (N = 40) of floodings recorded in 2019, of which 27 are validated through the current methodology. In general, on a yearly basis, the current methodology validates about 70% of the original floodings entered into SPIN, which means that from the original geolocated references in the SPIN database, more than two thirds could be validated.
No clear trend in yearly flooding events can be observed, except for perhaps a 10-year cycle in the form of repeated peaking numbers of coastal flooding events in both 2009/2010 and 2019/2020. Nevertheless, it is obvious that most flooding events are recorded during the autumn/winter season from October through March, with the highest incidences during late autumn and early winter (respectively, November and December). Substantially less events are recorded during spring and summer.
Validated floodings were unequally distributed among the 10 interface zones (note the number of events in the legenda of Figure 3b as well the zone-specific charts of Appendix A). Apart from the main pier (N = 78), both the Prešeren and Kidrič embankments are most susceptible to recurring coastal floodings (N = 76 and 83, respectively).
Additionally, the resulting time series of flooding events that were validated through the current methodology was analyzed according to geolocated occurrence, and these zone-specific time series are available in Figure A1 of Appendix A. More specifically, some striking features emerge; e.g., Punta seems to differ from the cumulative yearly pattern, with higher incidences between 2009/2010 and 2019/2020, with particularly low incidences in December. Further, the pattern of late winter to early spring shows higher incidences for Punta, the main pier, and especially for Kidrič embankment.

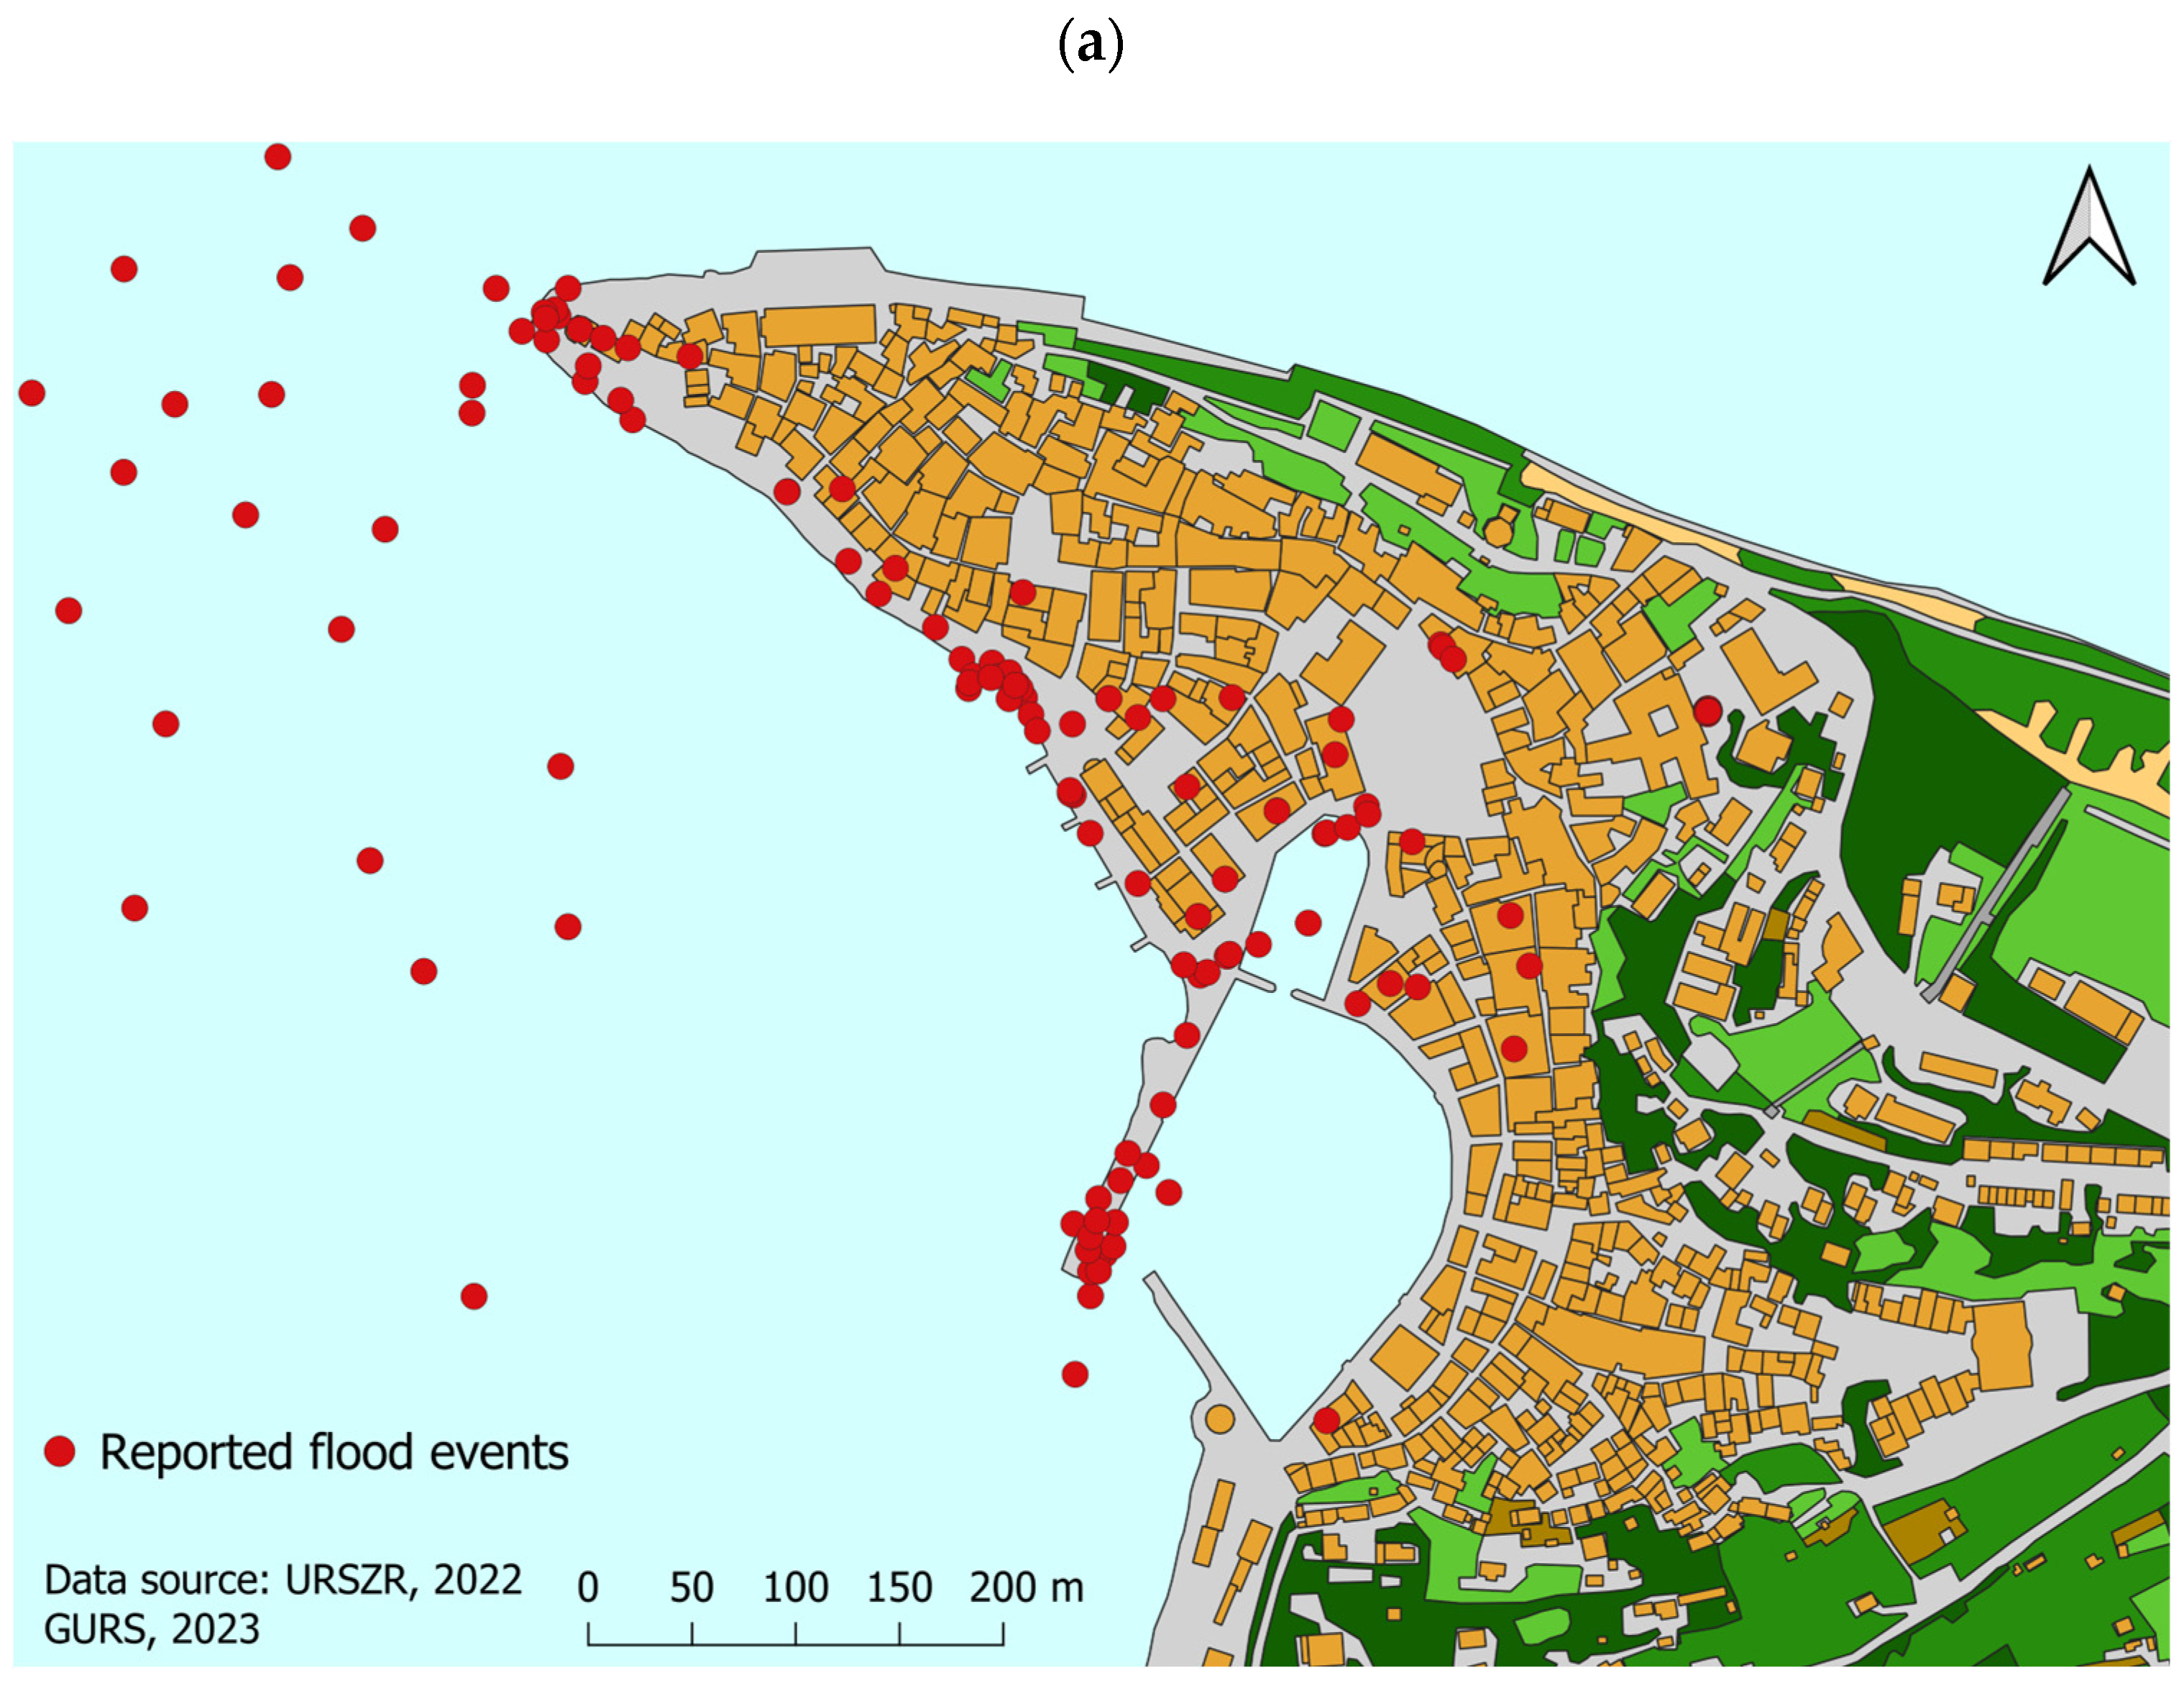
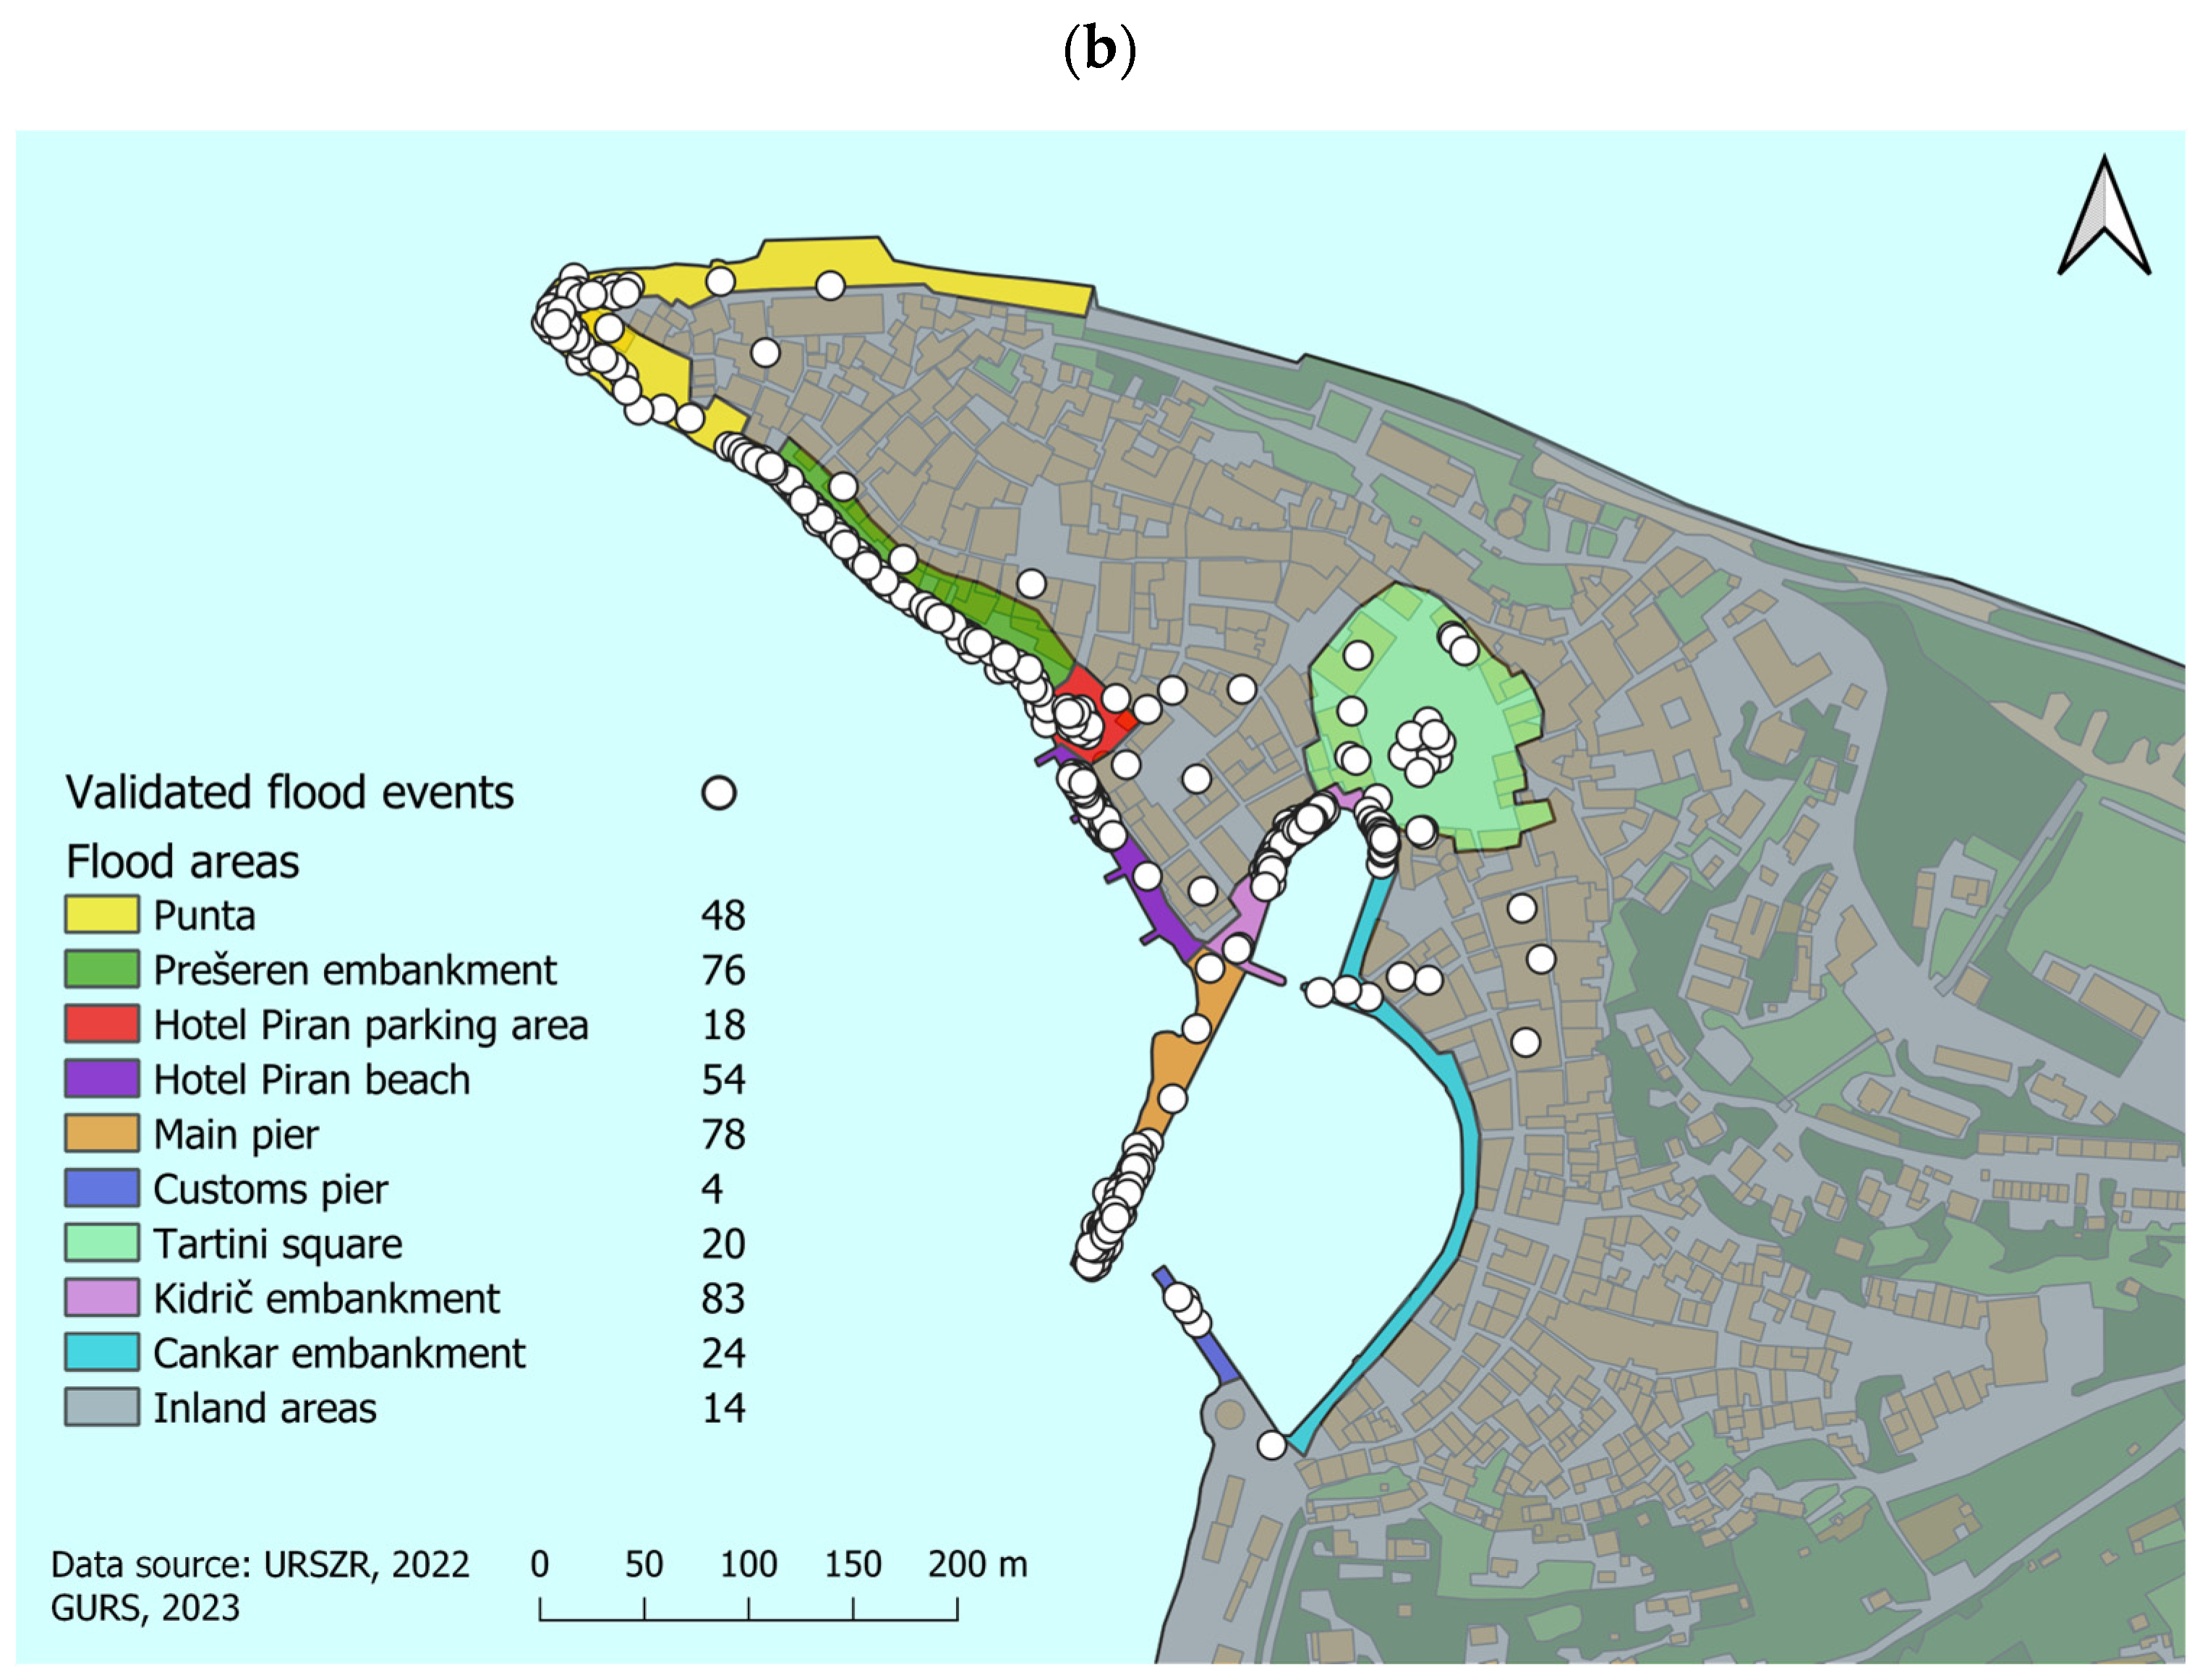
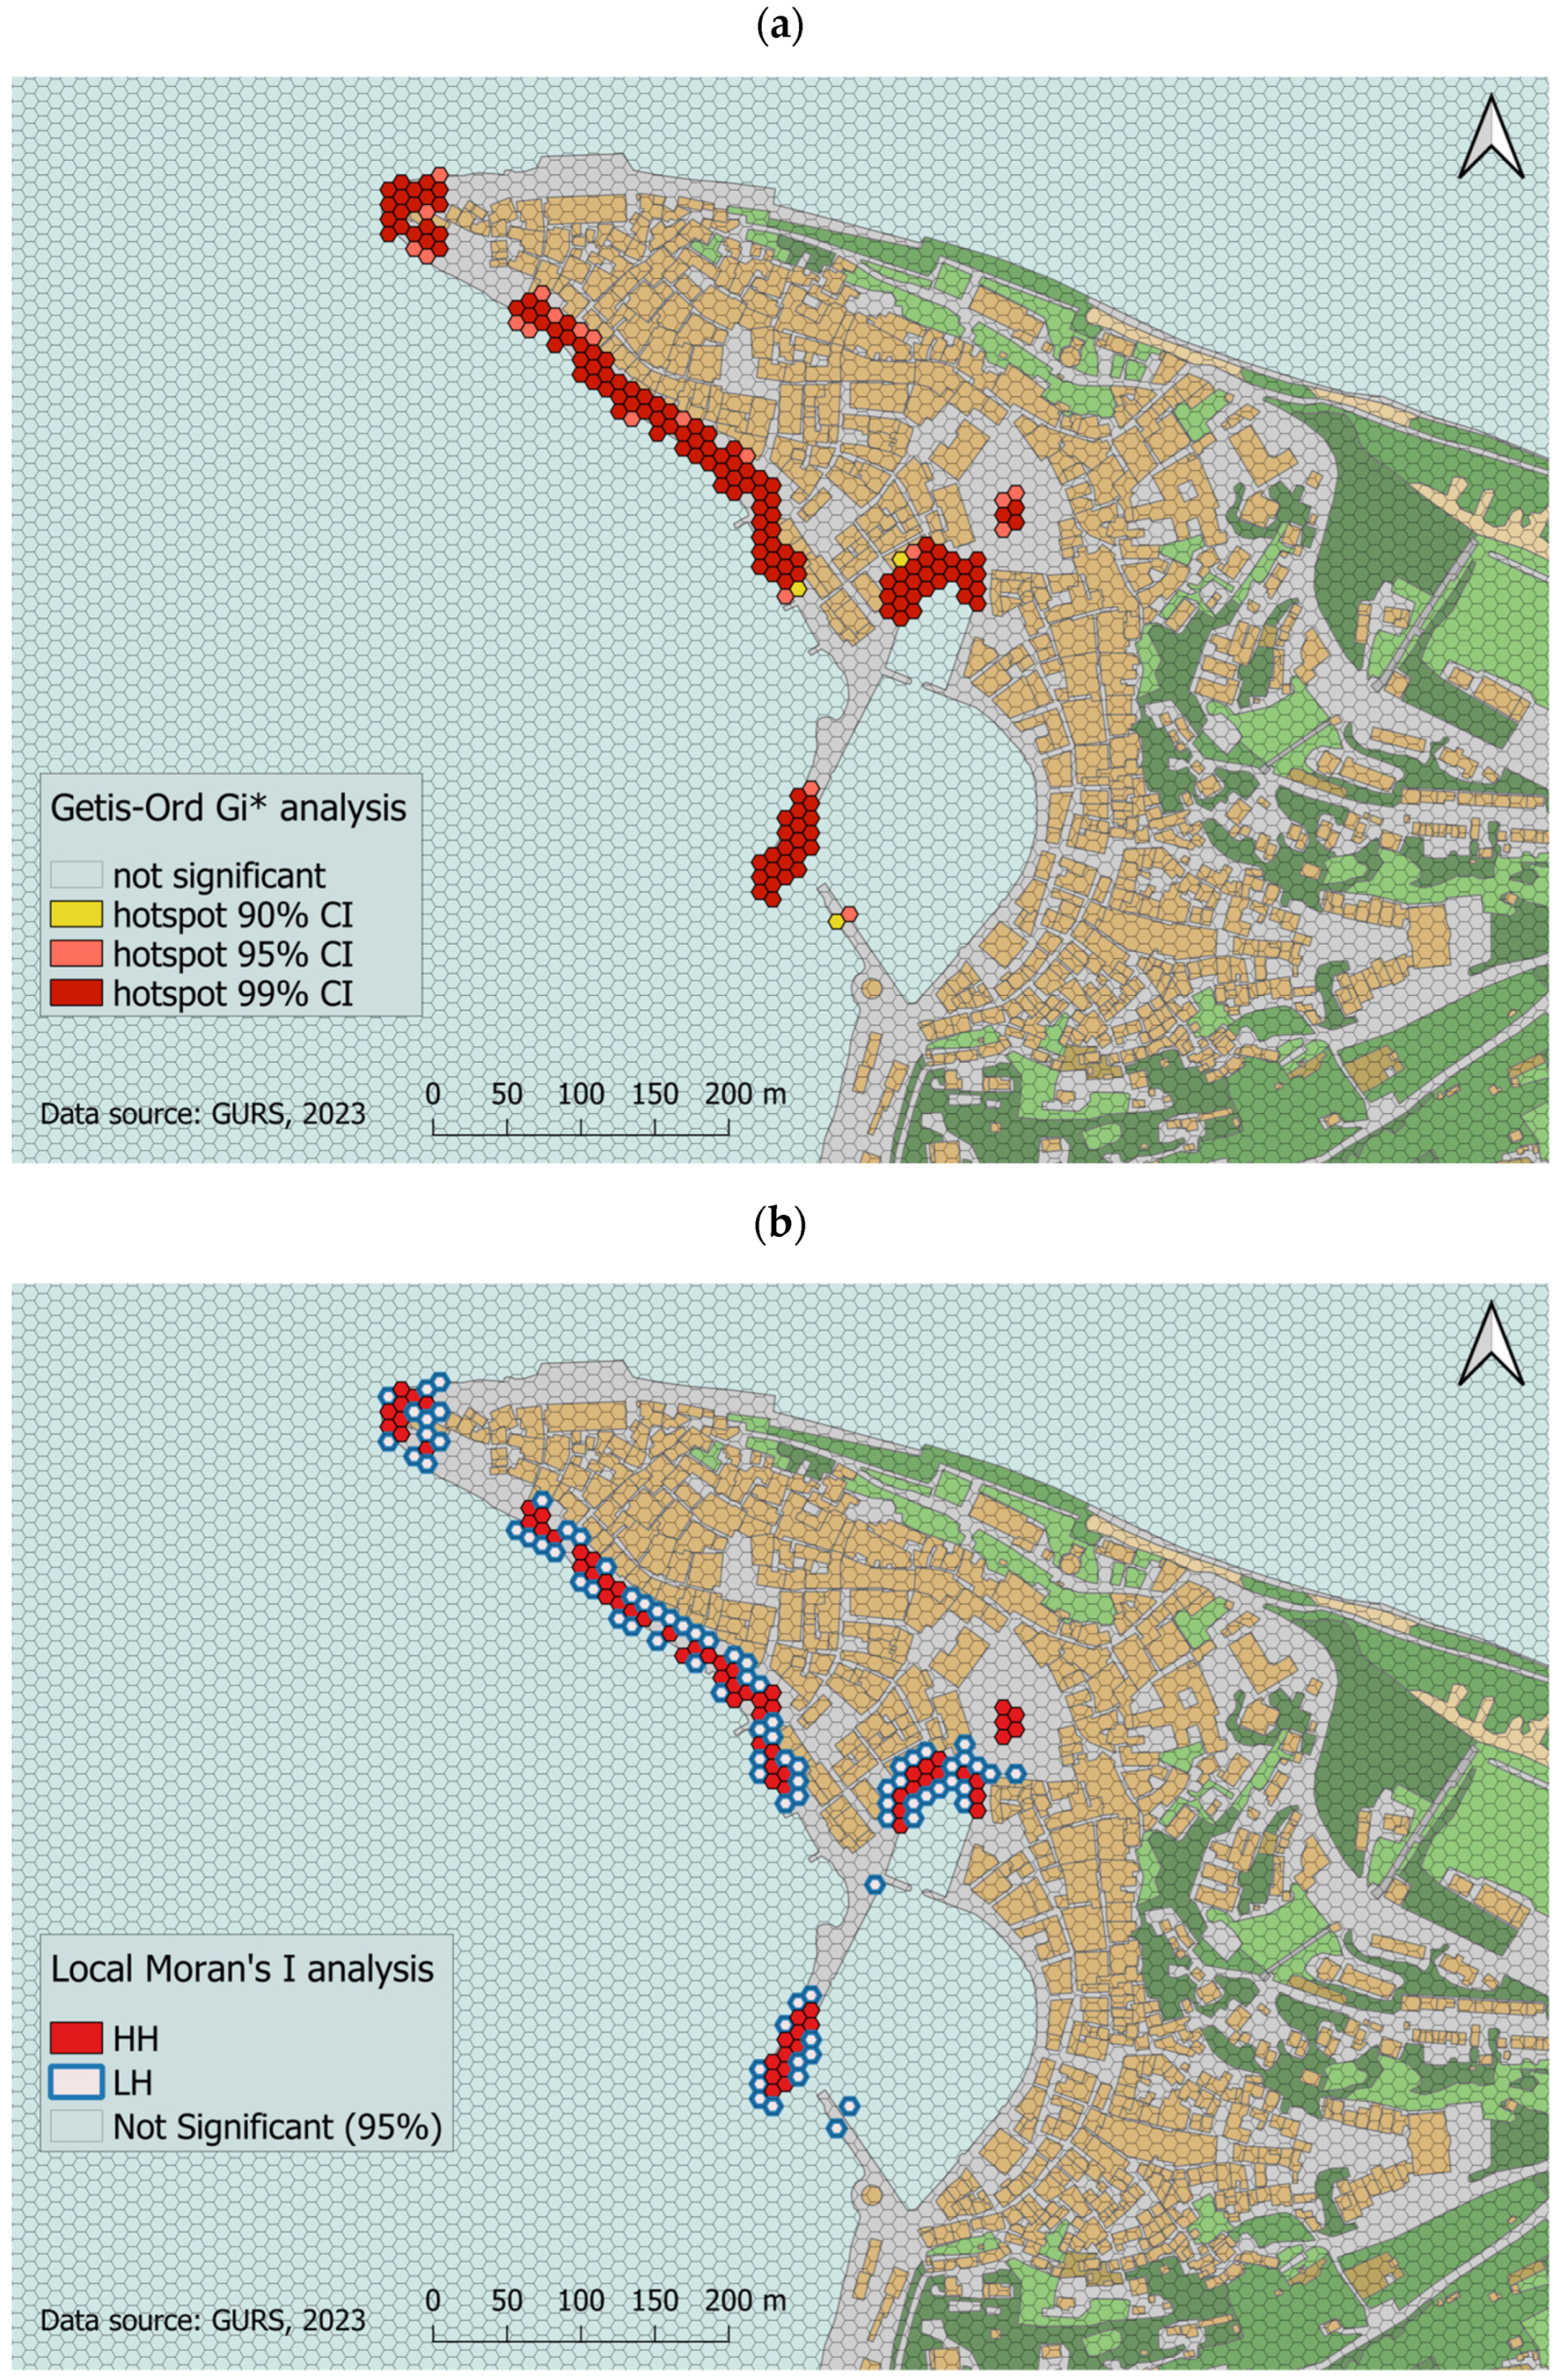
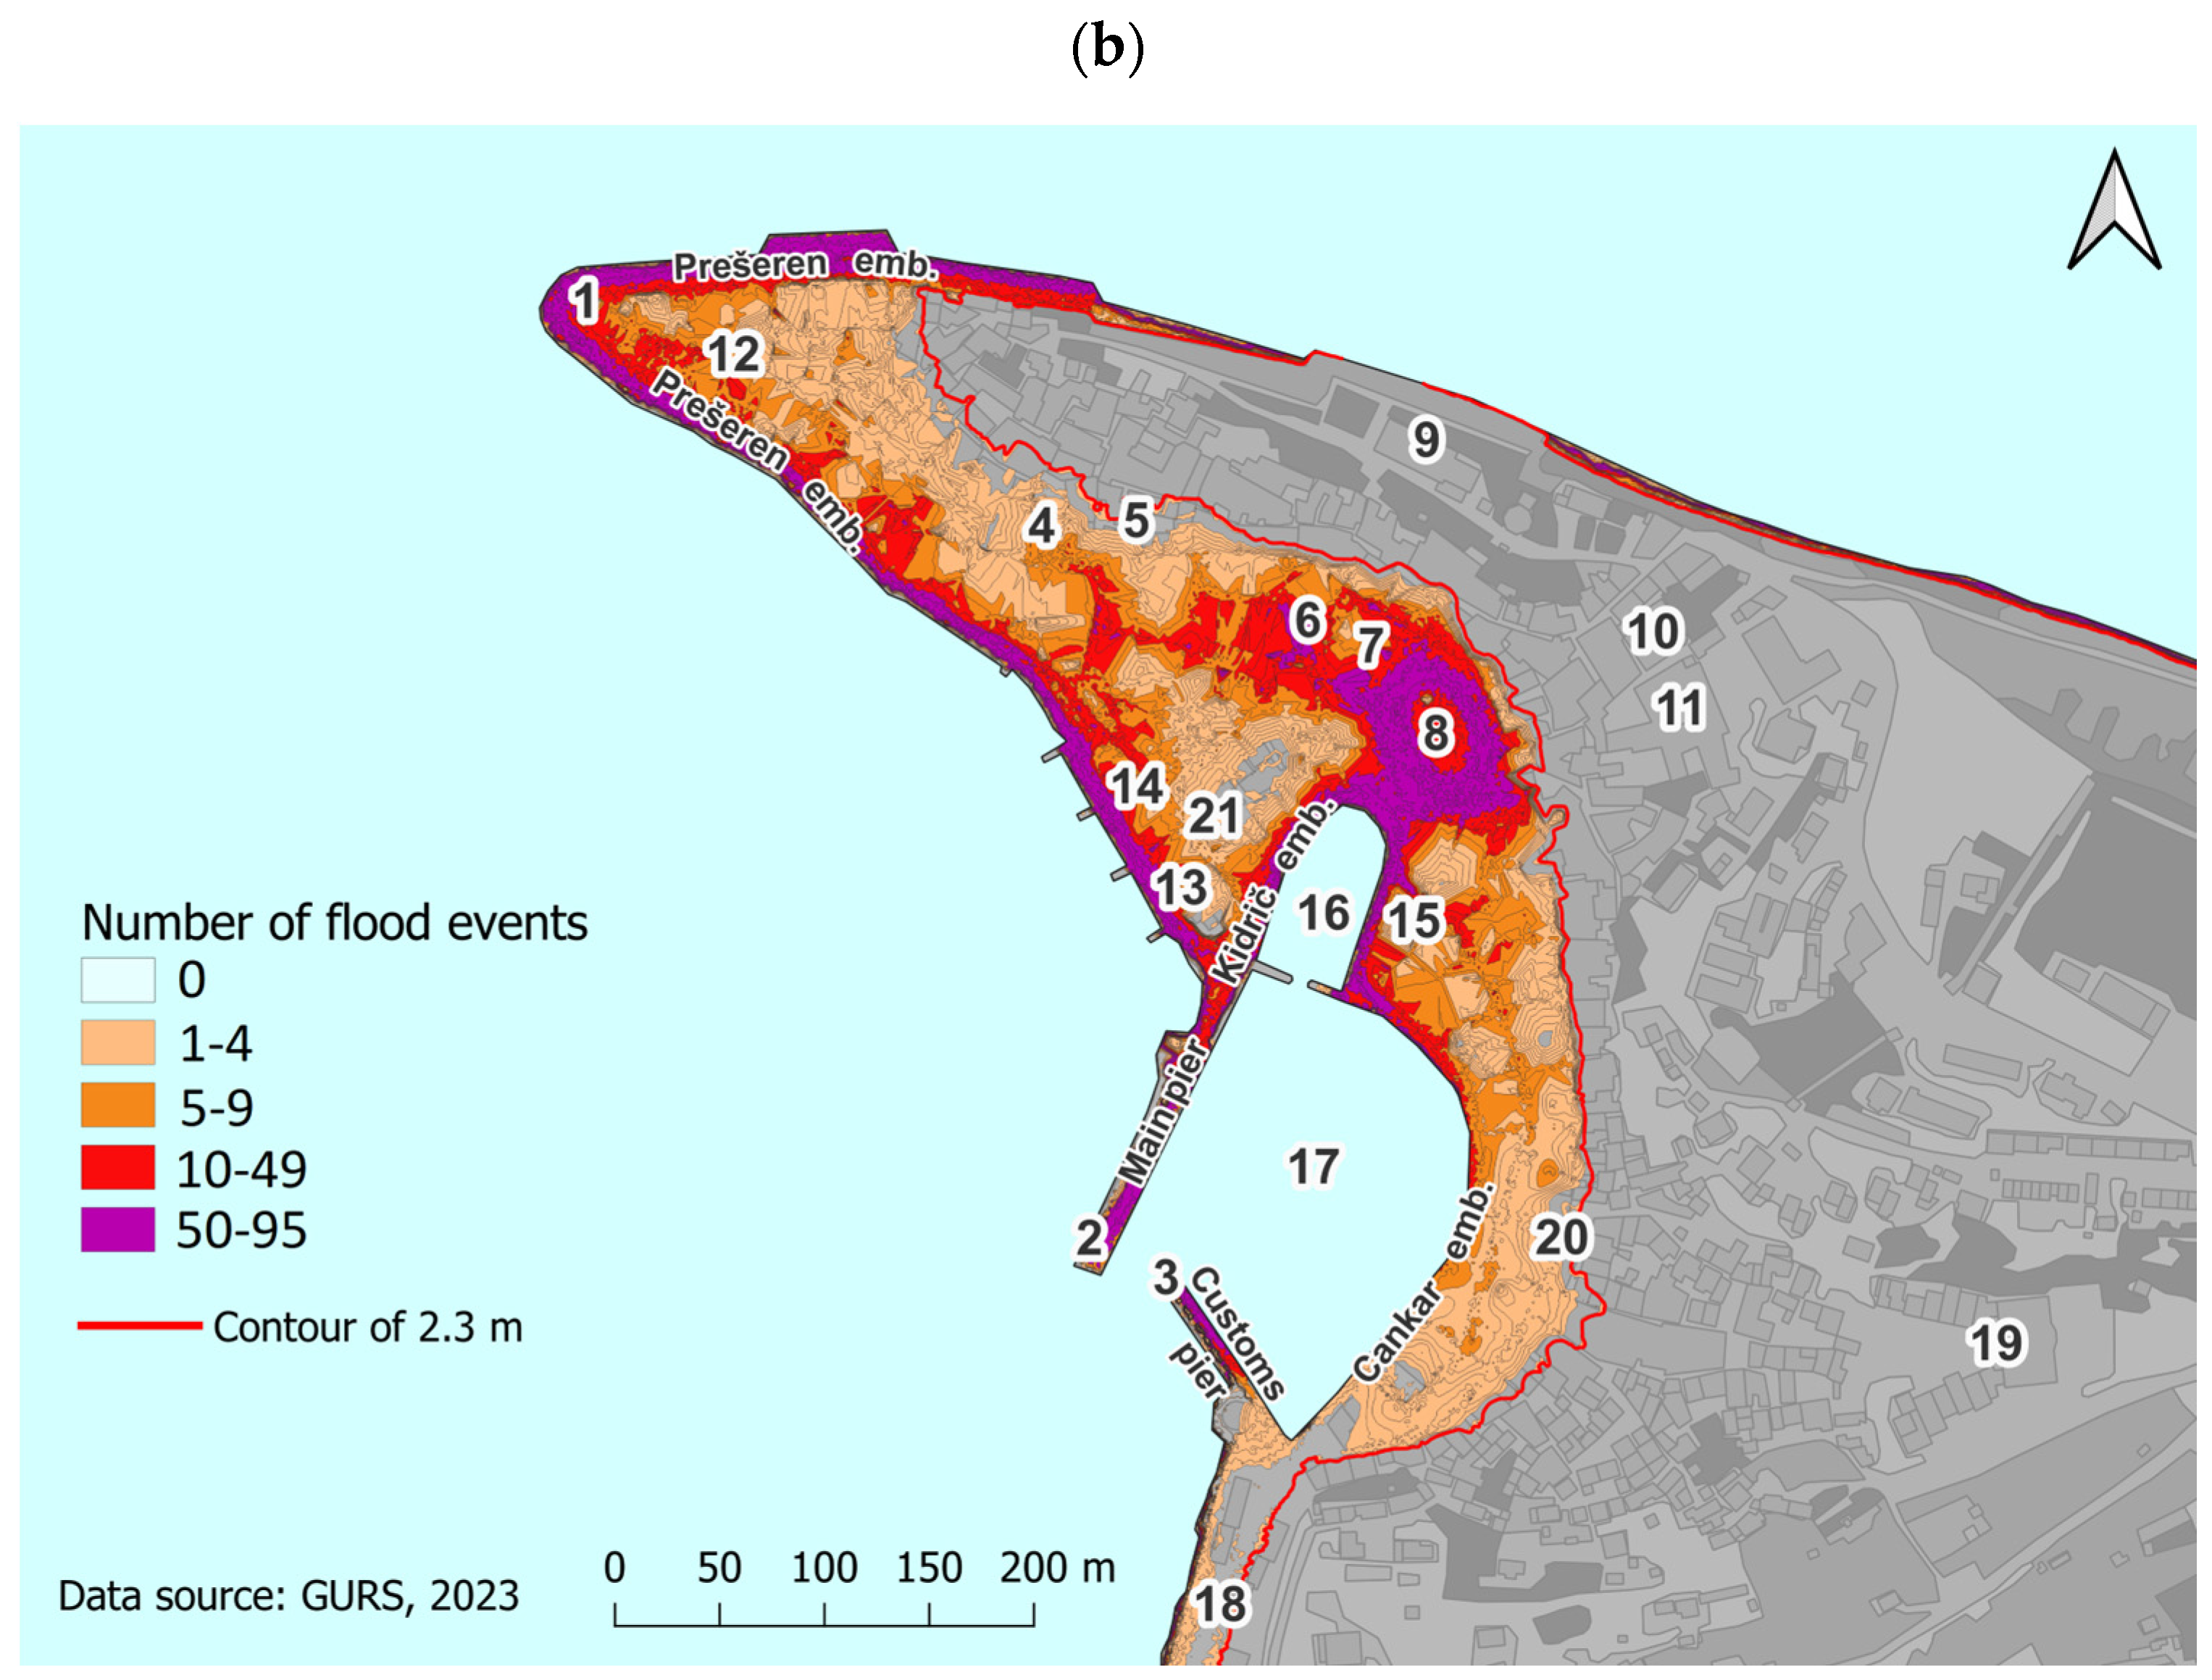
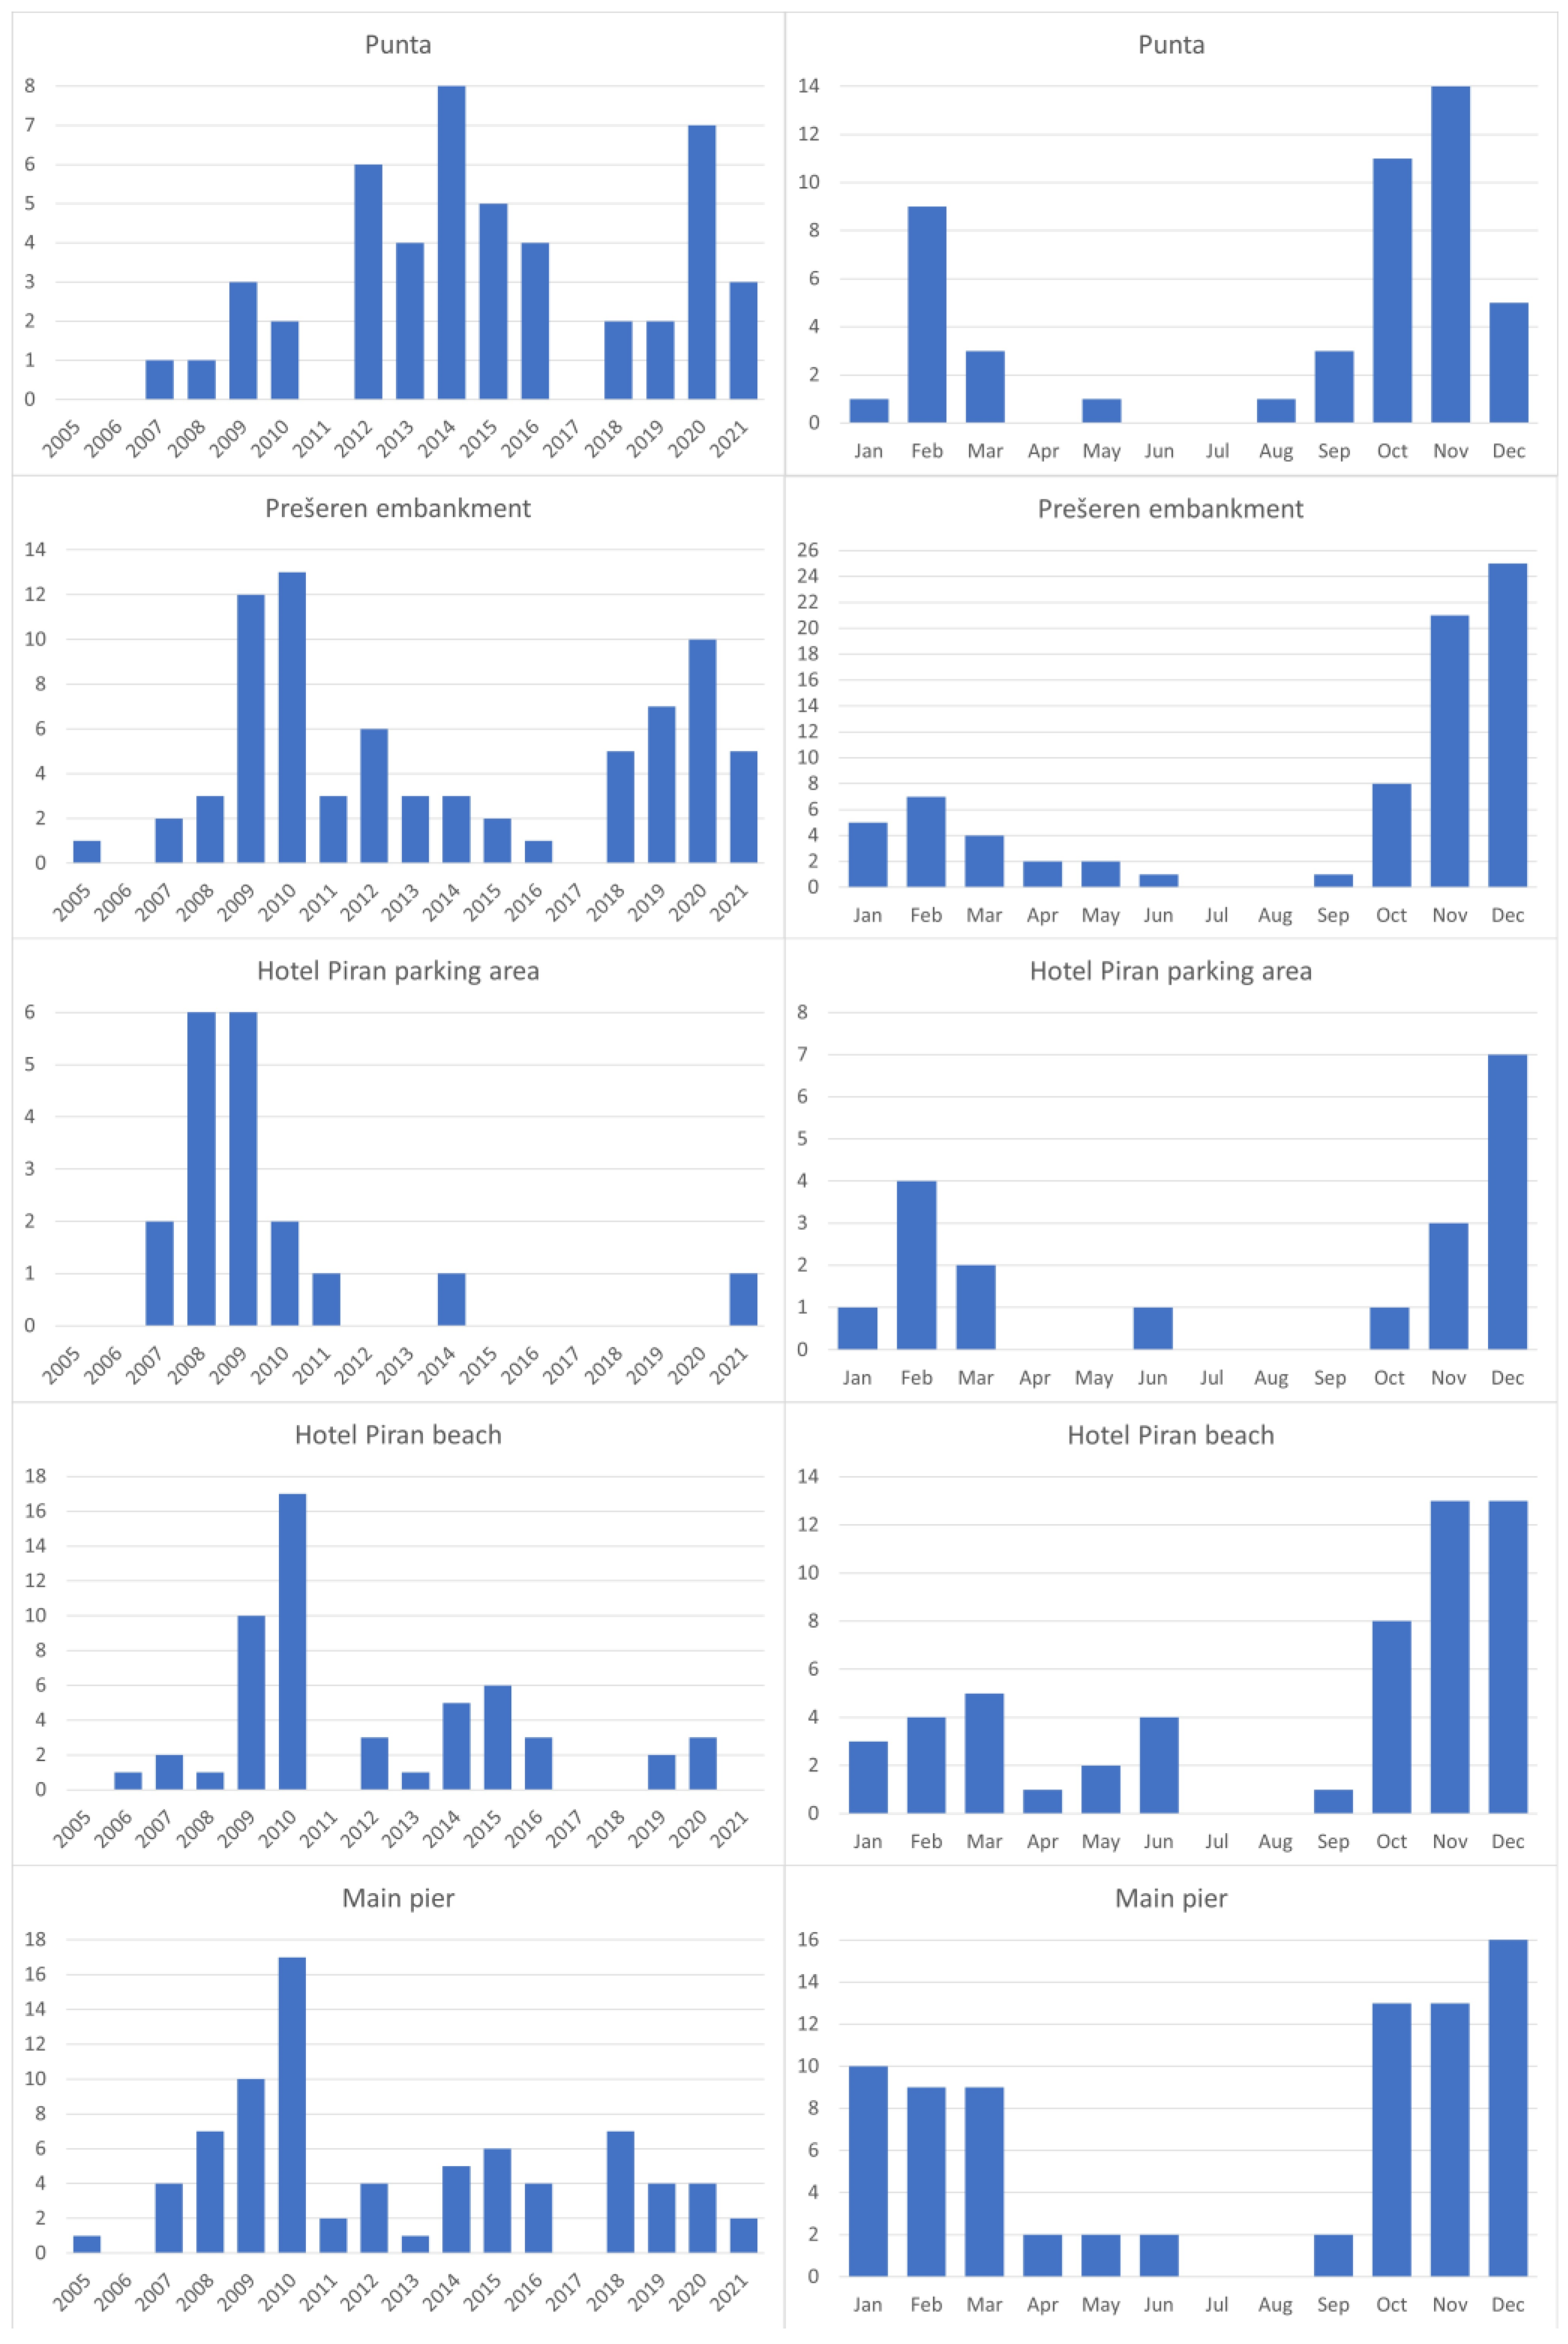
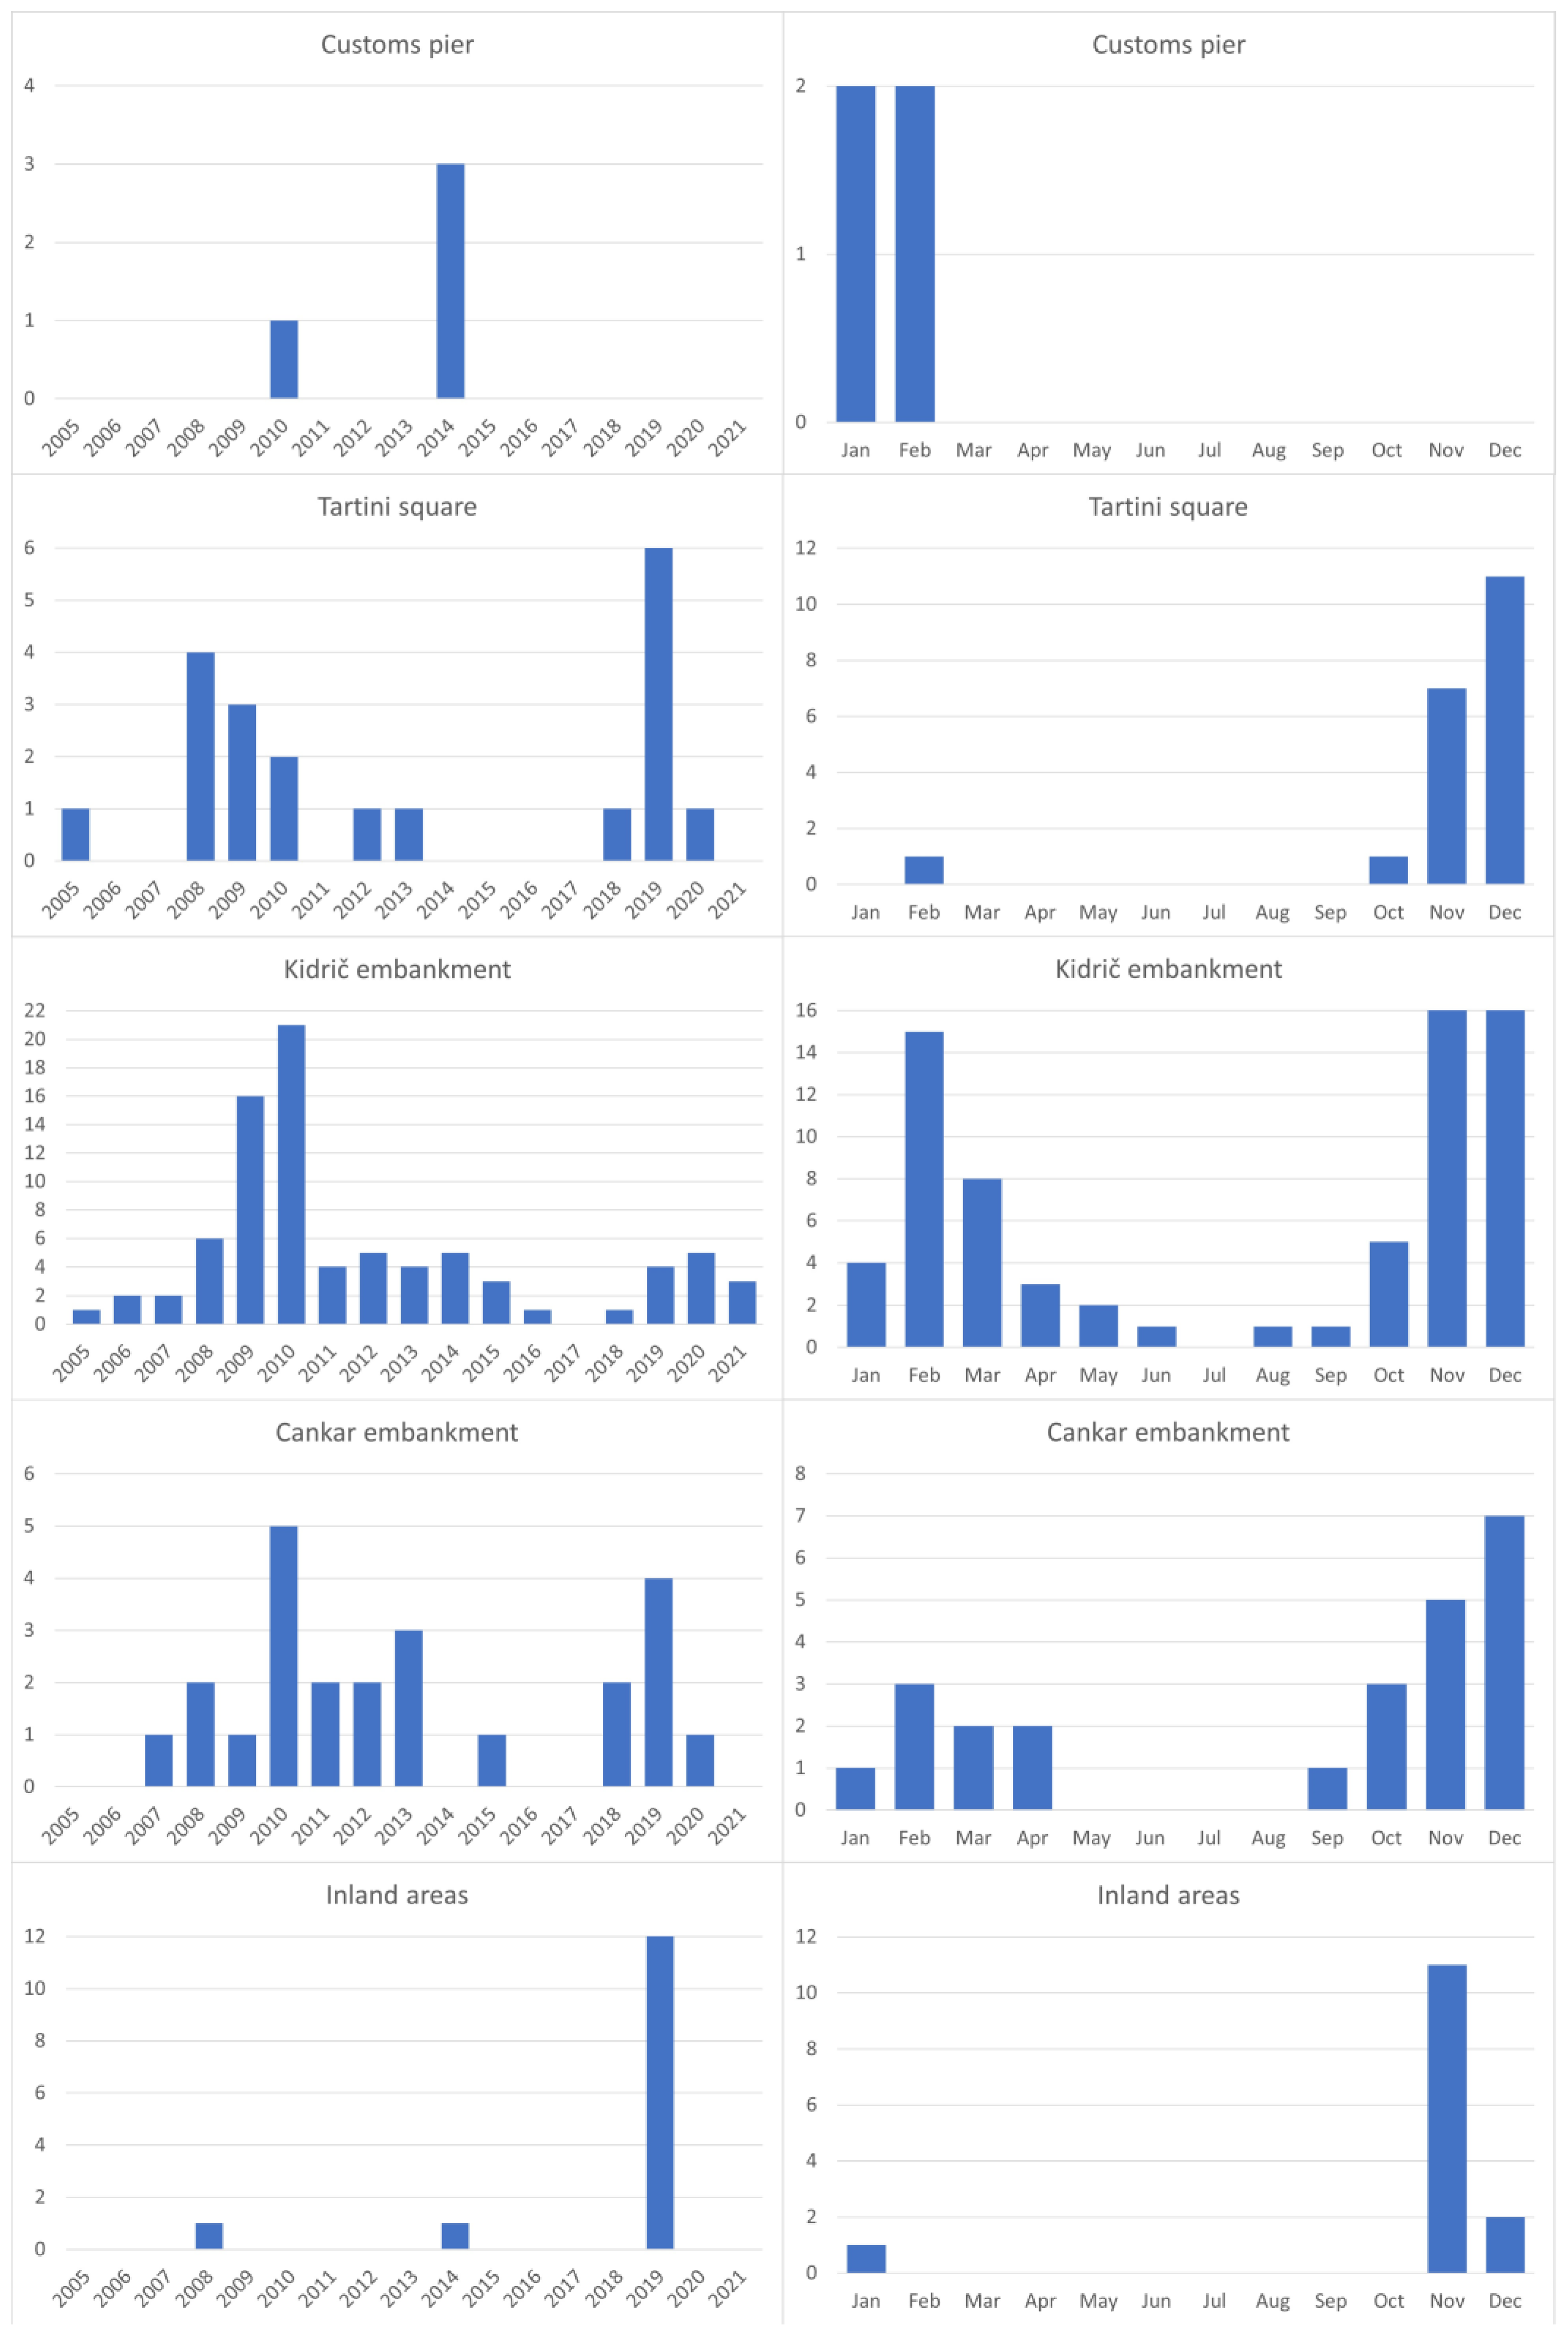
3.4. Geographical Distribution of Coastal Flooding Events in Piran

To determine the areas of the town most susceptible to flooding, and thus most vulnerable to damaging effects by coastal flooding or best suited to suggest potential intervention sites, further mapping and geospatial cluster analysis was performed on the flooding data and, more specifically, on the validated spatial geolocations.
Figure 5a shows the results of the Getis-Ord Gi * hotspot analysis of the validated SPIN data. While most of the town’s area was labelled as non-significant and subjected to random spatial patterns (empty grey hexagons in Figure 5a), certain areas with validated flooding events clustered with high 99% confidence (red-colored hexagons). The significant hotspots occurred at the following landmarks: Punta Lighthouse; along Prešeren embankment; Hotel Piran parking area; Kidrič embankment of the inner harbour; at the main pier; and Tartini Square. Coldspots were not observed.
Additional autospatial correlation using local Moran’s I analysis (Figure 5b) further confirmed the flood zones identified through the Getis-Ord Gi * hotspots (note the vastly similar positions of the red hexagons in Figure 5a,b). Furthermore, from this additional analysis, a border zone around the hotspots emerged in the form of low-value hexagons (indicated as white, blue-rimmed hexagons, LH, in Figure 5b) that are positioned both at the side facing the sea and the central town area. These are hexagons with a low number of flooding events but with a high incidence value of the weighted mean across their neighboring hexagons.
Tartini Square turned out to be an exceptional zone, as it covers a relatively large circular area free of buildings—the square itself—surrounded by cultural heritage buildings with only a small open passageway to the embankment and sea, located centrally in the built environment of the town (olive green zone of Figure 3b). This is as opposed to the other flood zones, identified by a combination of red hotspots and white, blue-rimmed border zone hotspots, which are all relatively narrow and stretched, located at the coastal interface, and always directly bordered by the sea on—at least—one side. Thus, the validated SPIN data analyzed through both Getis-Ord Gi * and local Moran’s methods can be identified and mapped as hotspots that subsequently presume a high likelihood of being flooded.
Finally, the validated flooding events were correlated to elevation by associating the validated SPIN data to corresponding elevation polygons. The resulting correlation between the validated flood occurrence and the elevation yielded flood zones with a likeliness for a particular frequency of flooding connected through an elevation range (Figure 6a). This ignores underground waterways like connecting sewage and drainage systems but does take into consideration ground-level connected areas. The results simulate a flooding map with flood-prone areas (depicted in Figure 6a) that shows the historic town center of Piran distributed according to validated flood probability elevation zones. Purple indicates low-lying zones with high probability of flooding, while the salmon-colored zones indicate low probability of flooding, and the grey-colored zones, generally >2 m elevation, indicate no probability of flooding based on the current sea level and the interpretation of the cumulative flooding events during 2005–2021. Figure 6b shows the flooding elevation probability on top of Piran’s land-use layer. Note that the validated reported flooding events over the period 2005–2021 all occurred below 2.3 m elevation in the historic town, making them flood-prone areas.

4. Discussion

The results presented in this paper show that events reported through a national registry for natural disasters can be used to map coastal flooding in the historic town of Piran, showing temporal and spatial patterns, especially after the collected data were verified and validated for georeference. In addition, through correlation analysis, zones with high probability of flooding could be identified and associated with elevation levels.
Most scholars use sea level rise projections [17,18,34], sea behavior models, or a combination of both, e.g., HYDRA [35,36], to predict and project flooding areas and levels, in contrast to our methodology, which uses past spatial and temporal flooding patterns to map flooding probability zones in Piran. Nevertheless, the current flood-prone mapping results align with spatial patterns of these models’ predictions.
According to emission scenarios (low RCP2.6 and high RCP8.5), the estimates for global sea level rise by the year 2100 can range from 28 to 61 cm (RCP2.6) to 52 to 98 cm (RCP8.5). Within the Gulf of Trieste, by 2050, the mean sea level will rise by 30–50 cm, and by the end of the century, by 40–100 cm [34]. Consequently, with such a predicted sea level rise, Piran will face more frequent (up to two hundred times more frequent) and more severe sea floods [34], and “with the unchanged configuration of the coast, this means daily flooding—even in calm and sunny weather” [34]. As this process will be gradual, any future protective measures and changes of the coastal morphology will have to take into consideration the areas that this paper has identified as the most flood prone because, strikingly, the RCP-driven predicted sea level rise aligns with the flood-prone zones of our results.
In this respect, the combination of past flooding events’ interpretation (in this study), sea level rise predictions [35,36], and changing atmospheric conditions (with a corresponding increase in the frequency, duration, and intensity of extreme weather events [1,15,16,34]) should provide better insight into coastal vulnerability and damaging infrastructural effects. However, for Piran, desalination and mixed waterways currently are not appropriately considered within this cumulative climate hazard altogether, and, thus, the future effects for Piran as a coastal city under threat of flooding might be more devastating than currently expected: recent estimates of damage on infrastructure and humans might represent an underestimation [11,14,23].
In light of establishing climate resilient coastal communities, Slovenia, within the wider Adriatic region, has already been considering plans for climate adaptation [37] and early warning sea flooding projects [38,39]; nevertheless, the current study notes several ambiguities and is subject to several limitations.
One notable limitation within this study pertains to the validation of the extrapolated flooding map of Piran. The SPIN database entries were contributed by professional civil servants such as police officers, fire brigade staff, and local civil protection services. Nonetheless, they might be semi-volunteers regarding calamity, and, consequently, some experts did not prioritize entering the correct spatial distribution, focusing more on ensuring the event was registered. Another constraint is the exclusive relation of these entries to actual field interventions, such as the arrival of the fire brigade, suggesting that only areas where material assets were at risk are reported. This scenario suggests the possibility of unreported flooding, like mild coastal floodings (deemed not intervention-worthy) and other areas being affected by floods, as they did not pose an adequately substantial threat to possessions. And, even though the current approach displays location-specific flood events, recognized as simultaneous floodings occurring at separate zones, these are distinct from having them completely linked to accurate consecutive time-dependent information of executed actions by the intervention managers (i.e., steps 3 and 4 of the SPIN entry protocol) during acute flooding. Thus, the current report on the SPIN events and the validated geolocations as a calamity leaves discrepancies between calamity as a natural disaster, its severity, and actual flooding.
Another point is that even though the current flooding map is based on validated geolocations, adjustments were made based on available supplementary information to pinpoint the precise location. However, the precision is contingent on the clarity and accuracy of these text entries (steps 3 and 4 of the SPIN entry protocol), which have been found to be sometimes ambiguous. Additionally, the variability in data entry by different experts further compounds this issue, leading to potential inconsistencies and inaccuracies in the location data for flooding events. Hence, it is essential for experts to ascertain the accuracy and reliability of the current map. These aspects warrant further exploration to ensure the consistency and precision of the flooding data and the subsequent maps generated.
A further limitation revolves around the influence of weather, particularly, wind direction (bora versus jugo or foehn) and its impact on flooding severity and area. Our observations indicate distinct flooding patterns connected to several landmark points of the local context and indicate the need for a more detailed exploration into the correlation between meteorological factors and flooding patterns. It is proposed to augment the current flooding map by integrating it with data from ARSO, the National Meteorological Service of Slovenia. This data includes information on atmospheric pressure, tidal levels, and other relevant meteorological factors which are crucial for a better and accurate understanding and would enable a more comprehensive temporal and severity insight into the incidence, frequency, and patterns of flooding events in Piran.
In Piran, Tartini Square, at its heart, has experienced frequent flooding in the past. As recently as 2020, an inflatable barrier was implemented to prevent sea water from entering through the narrow entrance at the last moment during events. While the effectiveness of this particular measure remains to be assessed, other damage-diminishing measures like door barriers and sandbags have proven their use over centuries. However, long-term flood prevention measures are being proposed and assessed, of which infrastructural changes, like the repairment of the customs pier in 2014, are the most recent implemented examples. Nevertheless, most of these are not preventative but merely adjust the infrastructure and change the elevation of smaller parts of the town’s landscape which, in turn, only changes their susceptibility to sea floods. Considering the lack of nature-based solutions or hard preventative measures, it seems very relevant to ensure timely and accurate alerts for the community. To achieve that, the following improvements based on observations from this study could be made:
  • The improvement of the registration process for entries to the SPIN, ensuring more timely and accurate alerts for the community. A crucial suggestion is the exclusive reporting by trained experts to ensure consistency and comparability in entries. The consistent use of geographical names or the introduction of town-specific polygon selection is emphasized for precise location reporting.
  • A consistent approach among first respondents should also include mandatory inspections of low-lying areas to avoid misinterpretation of retreating water levels, ensuring comprehensive and accurate flood reporting and management.
  • First respondents should also gather basic field data by mapping the flooded areas, utilizing basic GIS tools for accuracy.
  • The integration of field observations with local-level smart sensor data is advocated for a more robust early warning system.
  • The establishment of a simple automatic instrument system, primarily in highly populated and frequently flooded areas at the Slovenian coast, is proposed for efficient data gathering. For example, more precise classification of sea flooding events in which the more common and less damaging floods would be distinguished from the more severe ones. Alternatively, to avoid complications and ambiguities, each entry could carry the information regarding initial tidal level of the warning and actual peak water level during the flood event. This enhancement, even in the absence of other upgrades, would bolster sea level monitoring, aiding timely response and accurate on-site assessments by first responders.
These additional guideline considerations would already address some of the limitations of the current approach; such improvements would allow for effective integration of SPIN data into any future sea flooding models and would make flood event research easier and more concise, as data would be less subjective and easier to verify. Thus, the SPIN database would further contribute to enhancing the climate resilience of the coastal community and supporting the development of coastal climate services [27,40,41].
While more global registries on natural disasters do exist (e.g., [42]), our paper intends to provide useful information to support local climate services, for which not many local registries on natural disasters have been used. A recent paper describes the creation of a registry on coastal flooding in Portugal through the collection and analysis of social media, newspaper, and technical reports over a period from 1980 to 2018 [43]. The authors show temporal and spatial patterns of coastal flooding and, in addition, describe an adopted methodology that allows the identification of different coastal typologies. The authors identified the gap constituted by the lack of a flooding registry; hence, they created one and presented results. Their approach and our SPIN database analysis show the usefulness of regional registries on natural disasters, as they turn out to be objective and reliable both for recording flooding events and maintaining a comprehensive database for future modelling. We believe that such databases, with the adoption of the improvements mentioned above, are low-cost and therefore applicable to practically any setting and could contribute extensively to climate adaptation.

5. Conclusions

The current approach lays down a new foundation stone in understanding coastal flood patterns (both incidence and spatial occurrence trends) and—provided that registries for natural disasters exist for other coastal regions—is generally applicable. Both the approach and the derived database insights are pivotal for enhancing flood prediction and management and are especially relevant for developing user-driven coastal climate services [27,40,41] that integrate more detailed local environmental and atmospheric data. A registry database for natural disasters (like SPIN), as a collaboration between active citizens and trained professionals is, in part, a user-driven (citizen science) platform that, with improvements as suggested above, would enable community empowerment and aid protection services. Having detailed and accurate flooding maps available that are based on recent and previously reported flooding events certainly could prepare local communities and authorities to be more efficient in planning infrastructure and protective measures while being directly responsive to extreme weather events occurring at the coastal interface of densely populated areas.

Author Contributions

Data acquisition, P.K.; data preparation, validation, and analysis, E.K.; visualization, E.K. and C.J.W.M.; writing—original draft preparation, review, and editing, E.K., P.K. and C.J.W.M.; conceptualization and supervision, P.K. and C.J.W.M.; project administration, C.J.W.M. All authors have read and agreed to the published version of the manuscript.

Funding

This research was funded by the European Commission through the SCORE project, Smart Control of the Climate Resilience in European Coastal Cities, H2020-LC-CLA-13-2020, Project ID: 101003534.

Data Availability Statement

The data presented in this study are available on request from the authors.

Acknowledgments

The authors would like to thank the Koper office of the Administration of the Republic of Slovenia for Civil Protection and Disaster Relief (URSZR) for its support in providing the off-line data of the SPIN registry.

Conflicts of Interest

The authors declare no conflict of interest. The funders had no role in the design of the study; in the collection, analyses, or interpretation of data; in the writing of the manuscript; or in the decision to publish the results.

Appendix A

Temporal occurrence of coastal flooding arranged according to flood-prone zones in Piran as extracted from validated flooding events over the period 2005–2021.
To provide a more detailed insight into where and how frequently the coastal floodings appear in the town of Piran, the validated accumulated flooding events over the period 2005–2021, presented in Section 3.3. Incidence of Coastal Flooding in Piran, can be displayed according to the identified flood zones. Both yearly and monthly validated flooding events are depicted in Figure A1 for the 10 flood zones.
Figure A1. Incidence of sea flooding in Piran over the period 2005–2021. The depicted number of events indicates the yearly (left column) and monthly (right column) events with stochastic distribution of validated coastal flooding for each of the identified flood zones (see title in each row).
Jmse 11 02290 g0a1aJmse 11 02290 g0a1b
While for the cumulative data, no clear trend in yearly flooding events can be observed—except for perhaps a 10-year cycle with peaks in both 2009/2010 and 2019/2020—generally, in the autumn, the highest number of floods are recorded. Strikingly, Punta seems to differ from the cumulative yearly pattern, with higher incidences between 2009/2010 and 2019/2020, especially low incidences in December, and, next to the October/November peak, regular floods also experienced in February. This pattern of a secondary peak of floodings during January–March can be observed for the main pier and especially for Kidrič embankment as well.
As an explanation of the incidence of floods within a flood-zone area, we would like to expose the data on the Kidrič embankment. Figure 3b mentions 83 flood events that were validated from the SPIN database for the Kidrič embankment, while the eighth row of Figure A1, which also deals with the Kidrič embankment zone (a central flood-prone zone at the inner harbour), shows 21 events in 2010, but during the period 2005–2021, the most observed events/year is 4–5, sometimes 6 per year. This is in line with Kolega (2006), who reports an average of 7.3 yearly flood events on the coast of Slovenia for the period 1963–2003 [17].

References

  1. IPCC. Sections. In Climate Change 2023: Synthesis Report; Contribution of Working Groups I, II and III to the Sixth Assessment Report of the Intergovernmental Panel on Climate Change; Core Writing Team, Lee, H., Romero, J., Eds.; IPCC: Geneva, Switzerland, 2023; pp. 35–115. [Google Scholar] [CrossRef]
  2. IPCC. IPCC Special Report on the Ocean and Cryosphere in a Changing Climate; Pörtner, H.-O., Roberts, D.C., Masson-Delmotte, V., Zhai, P., Tignor, M., Poloczanska, E., Mintenbeck, K., Alegría, A., Nicolai, M., Okem, A., et al., Eds.; Cambridge University Press: Cambridge, UK; New York, NY, USA, 2019; p. 755. [Google Scholar] [CrossRef]
  3. Makris, C.V.; Tolika, K.; Balitkas, V.N.; Velikou, K.; Krestenitis, Y.M. The impact of climate change on the storm surges of the Mediterranean Sea: Coastal sea level responses to deep depression atmospheric systems. Ocean. Model. 2023, 181, 102149. [Google Scholar] [CrossRef]
  4. Pomaro, A.; Cavaleri, L.; Lionello, P. Climatology and trends of the Adriatic Sea wind waves: Analysis of a 37-year long instrumental data set. Int. J. Climatol. 2017, 37, 4237–4250. [Google Scholar] [CrossRef]
  5. Porcù, F.; Aragão, L.; Aguzzi, M.; Valentini, A.; Debele, S.; Humar, P.; Loupis, M.; Montesarchio, M.; Mercogliano, P.; Di Sabatino, S. Extreme wave events attribution using ERA5 datasets for storm-surge studies in the northern Adriatic sea. In Proceedings of the EGU General Assembly 2020, Online, 4–8 May 2020; p. EGU2020-19443. [Google Scholar] [CrossRef]
  6. Postacchini, M.; Melito, L.; Ludeno, G. Nearshore observations and modeling: Synergy for coastal flooding prediction. J. Mar. Sci. Eng. 2023, 11, 1504. [Google Scholar] [CrossRef]
  7. Rizzi, J.; Torresan, S.; Gallina, V.; Critto, A.; Marcomini, A. Regional risk assessment for the analysis of the risks related to storm surge extreme events in the coastal area of the North Adriatic Sea. In Proceedings of the EGU General Assembly, Geographical Research Abstracts, Vienna, Austria, 7–12 April 2013; Volume 15, p. EGU2013-7026. [Google Scholar]
  8. Riminucci, F.; Capotondi, L.; Ravaioli, M.; Bergami, C. In-situ high resolution turbidity time series to describe storm resuspension events along the North-Western Adriatic shelf. In Proceedings of the XXVI Congresso dell’Assozione Italiana di Oceanologia e Limnologia, S. Michele all’Adige, Italy, 28 June–1 July 2022. [Google Scholar]
  9. Lionello, P.; Cavaleri, L.; Nissen, K.M.; Pino, C.; Raicich, F.; Ulbrich, U. Severe marine storms in the Northern Adriatic: Characteristics and trends. Phys. Chem. Earth Parts A/B/C 2012, 40–41, 93–105. [Google Scholar] [CrossRef]
  10. Lionello, P.; Triggo, I.F.; Gil, V.; Liberato, M.L.R.; Nissen, K.M.; Pinto, J.G.; Raible, C.C.; Reale, M.; Tanzarella, A.; Trigo, R.M.; et al. Objective climatology of cyclones in the Mediterranean region: A consensus view among methods with different system identification and tracking criteria. Tellus 2016, 68, 29391. [Google Scholar] [CrossRef]
  11. Kryžanowski, A.; Alivio, M.B.; Rusjan, S.; Vidmar, A. Ocena poplavne škode na območju mesta Piran zaradi naraščajoče gladina morje. In Proceedings of the Zbornik 32 Mišičev Vodarski Dan, Maribor, Slovenia, 2 December 2021; pp. 131–138. Available online: https://www.mvd20.com/LETO2021/R16.pdf (accessed on 23 October 2023).
  12. Ličer, M. Podnebne Spremembe in Naraščanje Gladine Morja v Severnem Jadranu (Climate Change and Sea Level Rise in the North Adriatic); National Institute of Biology—Marine Biological Station Piran: Piran, Slovenia, 2020; Available online: https://www.nib.si/mbp/sl/home/news/902-podnebne-spremembe-in-narascanje-gladine-morja-v-severnem-jadranu (accessed on 23 October 2023).
  13. Zanchettin, D.; Bruni, S.; Raicich, F.; Liomello, P.; Adloff, F.; Androsov, A.; Antonioli, F.; Artale, V.; Carminati, E.; Ferrarin, C.; et al. Sea-level rise in Venice: Historic and future trends. Nat. Hazards Earth Syst. Sci. 2021, 21, 2643–2678. [Google Scholar] [CrossRef]
  14. Alivio, M.B. Evaluation of Flood Damage Caused by Rising Sea Levels. Ocena Poplavne Škode na Območju Mesta Piran Zaradi Naraščajoče Gladina Morje. Master’s Thesis, University of Ljubljana, Faculty for Civil and Geodetic Engineering, Ljubljana, Slovinia, 2021. Available online: https://repozitorij.uni-lj.si/Dokument.php?id=146697&lang=slv (accessed on 23 October 2023).
  15. Lionello, P.; Barriopedro, D.; Ferrarin, C.; Nicholls, R.J.; Orlić, M.; Raicich, F.; Reale, M.; Umgiesser, G.; Vousdoukas, M.; Zanchettin, D. Extreme floods of Venice: Characteristics, dynamics, past and future evolution. Nat. Hazards Earth Syst. 2021, 21, 2705–2731. [Google Scholar] [CrossRef]
  16. Ferrarin, C.; Orlić, M.; Bajo, M.; Davolio, S.; Umgiesser, G.; Lionello, P. The contribution of a mesoscale cyclone and associated meteotsunami to the exceptional flood in Venice on November 12, 2019. Q. J. R. Meteorol. Soc. 2023, 149, 2929–2942. [Google Scholar] [CrossRef]
  17. Kolega, N. Slovenian coast sea floods risk. Acta Geogr. Slov. 2006, 46, 143–169. [Google Scholar] [CrossRef]
  18. Brečko Grubar, V.; Kovačič, G.; Kolega, N. Podnebne spremembe vplivajo na pogostejše poplave morja Climate change increasing frequency of sea flooding. Geogr. Šoli 2019, 27, 30–34. [Google Scholar] [CrossRef]
  19. Poklar, M.; Brečko Grubar, V. Assessing coastal vulnerability to sea level rise: The case study of Slovenia. Egypt. J. Environ. Chang. 2023, 15, 7–24. [Google Scholar] [CrossRef]
  20. Kovačič, G.; Kolega, N.; Brečko Grubar, V. Vpliv podnebnih sprememb na količine vode in poplave morja v slovenski Istri Climate change impacts on water quantities and sea flooding in Slovene Istria. Geogr. Vestn. 2016, 88, 21–36. [Google Scholar] [CrossRef]
  21. Zorn, M.; Komac, B. Sustainable mountain regions: Make them work: Natural disasters versus cultural and natural heritage. In Proceedings of the International Scientific Conference Proceedings, Borovets, Bulgaria, 14–16 May 2015; pp. 123–128. [Google Scholar]
  22. Fondazione Scuola dei Beni e Delle Attività Culturali. Three key questions on culture, cultural heritage and climate change. In Proceedings of the Round Table; Fondazione Scuola dei Beni e Delle Attività Culturali: Rome, Italy, 2022. [Google Scholar] [CrossRef]
  23. Machado de Almedia, L.B. Flood Risk and Damage Investigation in Areas of High Cultural Heritage Value. Master’s Thesis, University of Ljubljana, Faculty for Civil and Geodetic Engineering, Ljubljana, Slovenia, 2023. Available online: https://repozitorij.uni-lj.si/IzpisGradiva.php?id=148920 (accessed on 23 October 2023).
  24. SCORE—Smart Control of the Climate Resilience of European Coastal Cities. Available online: https://score-eu-project.eu/ (accessed on 23 October 2023).
  25. Kumer, P.; Meulenberg, C.J.W.; Mackenzie Hawke, S. Piran coastal city living lab (CCLL): Challenges and opportunities. In First SCORE Consortium Meeting; Atlantic Technological University: Sligo, Ireland, 2022; poster 11. [Google Scholar]
  26. Kumer, P.; Meulenberg, C.J.W.; Kralj, E. Challenges for planning climate change resilience through the co-creation living lab approach in the Mediterranean coastal town of Piran. J. Geogr. 2022, 17, 89–106. [Google Scholar] [CrossRef]
  27. Anton, I.; Paranunzio, R.; Gharbia, S.; Baldin, L.; Ahmed, T.; Giannetti, F.; Brandini, C.; Ortolani, A.; Meulenberg, C.; Adirosi, E.; et al. Challenges in retrieving and using climate services’ data for local-scale impact studies: Insights from the SCORE project. In Proceedings of the EGU General Assembly 2022, Vienna, Austria, 23–27 May 2022; p. EGU22-5469. [Google Scholar] [CrossRef]
  28. Laino, E.; Iglesias, G. Extreme climate change hazards and impacts on European coastal cities: A review. Renew. Sustain. Energy Rev. 2023, 184, 113587. [Google Scholar] [CrossRef]
  29. Anselin, L. Local indicators of spatial association—LISA. Geogr. Anal. 1995, 27, 93–115. [Google Scholar] [CrossRef]
  30. Getis, A.; Ord, J.K. The analysis of spatial association by use of distance statistics. Geogr. Anal. 1992, 24, 189–206. [Google Scholar] [CrossRef]
  31. Ord, J.K.; Getis, A. Local spatial autocorrelation statistics: Distributional issues and an application. Geogr. Anal. 1995, 27, 286–306. [Google Scholar] [CrossRef]
  32. Li, H.; Calder, A.A.; Noel, C. Beyond Moran’s I: Testing for Spatial Dependence Based on the spatial autoregressive model. Geogr. Anal. 2007, 39, 357–375. [Google Scholar] [CrossRef]
  33. Cliff, A.D.; Ord, J.K. Spatial Processes: Models & Applications; Taylor & Francis: Oxfordshire, UK, 1981. [Google Scholar]
  34. Ličer, M.; Žust, L.; Kristan, M. Prepletanje umetne inteligence in fizike pri napovedovanju obalnih poplav. Alternator 2021, 35. [Google Scholar] [CrossRef]
  35. Žust, J.; Fettich, A.; Kristan, M.; Ličer, M. HIDRA 1.0: Deep-learning-based ensemble sea level forecasting in the Northern Adriatic. Geosci. Model Dev. 2021, 14, 2057–2074. [Google Scholar] [CrossRef]
  36. Rus, M.; Fettich, A.; Kristan, M.; Ličer, M. HIDRA 2.0: Deep-learning-based ensemble sea level and storm tide forecasting in in the presence of seiches—The case of the Northern Adriatic. Geosci. Model Dev. 2023, 16, 271–288. [Google Scholar] [CrossRef]
  37. Supporting Energy and Climate Adaptation Project—SECAP. Available online: https://climate-adapt.eea.europa.eu/en/metadata/projects/supporting-energy-and-climate-adaptation-policies (accessed on 23 October 2023).
  38. Integrated Sea sTORm Management Strategies—I-STORMS. Available online: https://istorms.adrioninterreg.eu/ (accessed on 23 October 2023).
  39. An Information Platform for Strengthening Climate Change Resilience for the Adriatic Coastal Local Communities—AdriAdapt. Available online: https://adriadapt.eu/ (accessed on 23 October 2023).
  40. Paranunzio, R.; Anton, I.; Adirosi, E.; Ahmed, T.; Baldini, L.; Brandini, C.; Giannetti, F.; Meulenberg, C.J.W.; Ortolani, A.; Pilla, F.; et al. A new approach towards a user-driven coastal climate service to enhance climate resilience in European cities. Sustainability, 2023; Submitted, upcoming. [Google Scholar]
  41. Sánchez-García, E.; Rodríguez-Gamino, E.; Bacciu, V.; Chiarle, M.; Costa-Saura, J.; Garrido, M.V.; Lledó, L.; Navascués, B.; Paranunzio, R.; Terzago, S.; et al. Co-design of sectoral climate services based on seasonal prediction information in the Mediterranean. Clim. Serv. 2022, 28, 100337. [Google Scholar] [CrossRef]
  42. The International Disaster Database EM-DAT. Centre for Research on the Epidemiology of Disasters. Institute of Health and Society, University of Louvain, Belgium. Available online: https://www.emdat.be/ (accessed on 23 October 2023).
  43. Oliveira Tavares, A.; Leandro Barros, J.; Freire, P.; Pinto Santos, P.; Perdiz, L.; Bustorff Fortunato, A. A coastal flooding database from 1980 to 2018 for the continental Portuguese coast zone. Appl. Geogr. 2021, 135, 102534. [Google Scholar] [CrossRef]
Figure 1. Protocol for entering natural disaster alert data leading to public announcements in URSZR-managed SPIN database.
Jmse 11 02290 g001
Figure 2. Map of the study site. (a) North Adriatic Sea surrounded by Italy (ITA), Slovenia (SLO), and Croatia (HRV) with their respective coastal towns (e.g., Trieste, Koper, Umag). The Slovenian coastal town of Piran, situated on a peninsula, is depicted as an insert. Yellow dots represent buoys, and purple dots represent tide gauges; (b) historic town center of Piran with land-use and main landmarks as indicated by respective numbers; (c) elevation map. While most of the historic town center is positioned within the range up to 2.3 m above sea level (red contour line) and below 4 m (note the green colored area with dashed contour lines), towards the northeast and south there is terraced elevation up to about 70 m containing both built environment and urban green.
Jmse 11 02290 g002aJmse 11 02290 g002b
Figure 3. Reported and validated flooding events over the period 2005–2021 in the coastal town of Piran. (a) Distribution of original SPIN database-reported flooding events, indicated as red dots positioned according to initial reported geolocation; (b) distribution of coastal flooding events after spatial interpretation/verification, indicated as white dots. The color-coded zones are coastal interface zones referenced through street or Piran-specific landmarks. Indicated are the amount of zone-specific validated flooding events.
Jmse 11 02290 g003aJmse 11 02290 g003b
Figure 4. Incidence of sea flooding in Piran over the period 2005–2021. The depicted number of events indicate the yearly (a,c) and monthly (b,d) stochastic distribution of coastal flooding events; SPIN recorded (orange) and validated through current methodology (blue).
Jmse 11 02290 g004
Figure 5. Flooding hotspot analysis of the validated SPIN entries. Confirmation of validated georeferenced flooding hotspots within their corresponding coastal flood zones through: (a) Getis-Ord Gi * hotspot analysis indicating yellow, orange, and red hotspots (respectively, 90%, 95%, and 99% confidence intervals, CI) (no coldspots (significant low values) were detected); (b) local Moran’s I analysis with red hexagons (HH) that indicate high values of spatial clustering (highly significant), while empty grey hexagons (basically transparent) indicate the values of spatial distribution resulting from random spatial processes (not significant). White, blue-rimmed hexagons (LH) indicate lower flooding probability but with high incidence value of the weighted mean across its neighboring hexagons.
Jmse 11 02290 g005
Figure 6. Correlation of flooding and elevation of the validated SPIN entries. (a) Flooding map for Piran based on counts of floodings correlated to elevation polygons (note that contour lines <10 m are dashed); (b) flooding-elevation polygons laid over gray-scale land-use layer of Figure 2b (numbers refer to same landmarks therein).
Jmse 11 02290 g006aJmse 11 02290 g006b
Disclaimer/Publisher’s Note: The statements, opinions and data contained in all publications are solely those of the individual author(s) and contributor(s) and not of MDPI and/or the editor(s). MDPI and/or the editor(s) disclaim responsibility for any injury to people or property resulting from any ideas, methods, instructions or products referred to in the content.

