Article

Investigation of Effect of Wind-Induced Vibration on Typical Frame Structures on the Open Decks of Large Cruise Ships Based on the Subdomain Method

1
School of Naval Architecture, Ocean and Energy Power Engineering, Wuhan University of Technology, Wuhan 430063, China
2
Green & Smart River-Sea-Going Ship, Cruise Ship and Yacht Research Center, Wuhan University of Technology, Wuhan 430063, China
3
Hexagon Manufacturing Intelligence (Qingdao) Co., Ltd., Qingdao 266000, China
4
School of Science, Wuhan University of Technology, Wuhan 430070, China
*
Author to whom correspondence should be addressed.
J. Mar. Sci. Eng. 2023, 11(12), 2210; https://doi.org/10.3390/jmse11122210
Submission received: 20 October 2023 / Revised: 9 November 2023 / Accepted: 13 November 2023 / Published: 21 November 2023

Abstract

:
Due to the tall and large superstructures of cruise ships, the wind-induced vibration of frame structure on open decks cannot be neglected. This study investigated the wind-induced vibration of a typical frame structure on a cruise ship by using wind tunnel tests and numerical simulations. Wind tunnel tests were conducted to explore the simulation methods of the fluid–structure interaction (FSI). CFD simulations were performed to obtain the wind field data of the entire ship, which was utilized as an input for the open deck through the subdomain method. Subsequently, wind-induced vibration simulations of the guide rail frame structure on the open deck was carried out under various wind conditions. The results revealed that employing the turbulence model SST k-ω had a good agreement with the experimental data. The entire ship’s CFD results have a significant impact on the subdomain’s wind-induced vibration results. The vibration frequency of the guide rail frame structure was mainly concentrated between 0.8–10.1 Hz. The most unfavorable conditions appear at the wind attack angles of 0° and 120°. This study can provide some instructive insights for the prediction of wind-induced vibration and control of typical structures on the open decks of large cruise ships.

1. Introduction

Cruise ships, regarded as high-value-added vessels, impose rigorous standards for passenger comfort, particularly in terms of vibration control [1,2]. Nevertheless, luxury cruise ships boast intricate and elevated superstructures, rendering them vulnerable to wind-induced effects. Moreover, the open decks are densely packed with lightweight entertainment facilities [3]. The presence of the bow and forward structures significantly impacts the wind distribution on the aft open deck, leading to complex and pronounced wind loads. Consequently, the structures on the open deck would experience significant wind-induced vibrations, thus affecting passengers’ safety and comfort. Hence, the assessment of wind-induced vibrations on the open deck of a cruise ship during the design phase is crucial to ensure the construction of a safe and comfortable cruise ship [4].
The investigation of wind-induced vibration can be generally divided into three categories: wind tunnel test, numerical simulation, and field measurement [5]. The wind tunnel test is widely employed due to its capacity to obtain the most accurate and reliable results [6,7]. In the field of architectural wind engineering, the wind-induced vibrations of high-rise buildings can be estimated through wind tunnel tests by measuring the wind load or response on a scaled-down model [5]. Aeroelastic model tests, utilized to directly measure wind-induced responses, are commonly applied in wind vibration testing for large-span structures, high-rise buildings, and other constructions [8,9,10,11]. For instance, Li et al. [12] investigated the effect of corner modification on the wind response of square-section super-high-rise buildings by conducting aeroelastic model tests. Notably, a cruise ship is a structure with a multi blunt body, with densely arranged facilities on the open deck. Therefore, the wind-induced vibration of the open area structure is easily affected by the wake of the upstream structure. In response to this issue, experimental investigations were conducted on the impact of structural layout on wind-induced vibration across various vibration modes. Chen et al. [13] investigated the effect of building spacing and height ratio on the disturbance of modal generalized force and wind response of low-rise building roofs. Hu et al. [14] investigated the cross-flow vibration of two cylinders arranged in series. Tang et al. [15] conducted a comprehensive study on the interference mechanism of translational and torsional responses using a three-dimensional aeroelastic high-rise building model. The results indicate that the wake of the upstream structure may amplify the vibration of the downstream structure, and the interference effect depends on the position of the downstream structure.
For the wind-induced vibration test technology, several researchers have adopted contactless vibration measurement techniques. Numerous studies [15,16,17] have demonstrated the utility of laser vibrometers and their application in vibration assessment. Laser displacement sensors [18,19] are employed to measure the vibration displacements of towering structures, including models of very tall buildings. Furthermore, several other studies [20,21,22,23,24] have applied the Digital Image Correlation (DIC) method to data acquisition for vibration testing. DIC has been demonstrated as a valid alternative means of measuring structural vibration without direct contact.
However, wind tunnel test costs are quite high, and the research could be constrained by wind tunnel devices. With the development of computing technology, many scholars have investigated wind-induced vibration by using fluid–structure interaction simulations [3,25,26]. Fluid–structure interaction wind vibration simulations typically encompass one-way fluid–structure interaction [27,28,29] and two-way fluid–structure interaction [30,31,32]. In one-way FSI studies on wind-induced vibration in high-rise buildings, wind load data are typically acquired through numerical calculations or experiments, and subsequently applied to the structural finite element model [29]. Two-way FSI involves information exchange between the fluid and solid domains through interpolation and iteration at each time step, typically achieved via co-simulation between the structural finite element and fluid CFD domains [32]. Several researchers [33,34] separately evaluated the one-way FSI and the two-way FSI method, concluding that the two-way FSI approach exhibits superior stability. Eetu Kivelä [3] investigated the differences between one-way and two-way FSI simulations in analyzing the wind-induced vibration of amusement structures on cruise ships’ decks. The results of the study revealed that two-way FSI computations yielded considerably greater lift forces and structural displacements compared to one-way FSI. However, this study did not perform an experimental validation of the FSI method, and did not account for the wind field shielding effect by the cruise ship.
The above-mentioned studies show that numerous scholars employed elastic model tests to study wind-induced vibrations, utilized non-contact laser vibrometers for data acquisition, and applied the fluid–structure interaction method for numerical simulations.
Nevertheless, the overall wind environment of large cruise ships is complex, which in turn affects the distribution of open deck wind field and wind-induced vibration of the structure. Thus, it is imperative to calculate the wind field of the entire ship, so as to acquire the wind field input for the open deck. In the exploration of the entire ship’s wind field, numerous scholars have adopted a Computational Fluid Dynamics (CFD) numerical analysis to delineate the inherent characteristics of the ship’s wind fields. Several researchers have investigated the aerodynamic impact of wind field on whole ships, concentrating on factors such as the configuration of container ships [35], container simplification levels [36], assembly conditions under various wind speeds [37], and the effect of superstructure wind field [38,39]. Furthermore, several researchers [40,41] have examined the influence of the port’s wind environment on entire vessels. Regarding the study of the cruise ship wind field, Ricci et al. [42] conducted a numerical investigation into wind loads on a cruise ship while it was docked at the quay using 3D steady RANS simulations. The numerical method was validated through field measurements and wind tunnel tests. Wang et al. [43] conducted an assessment of the three-part force coefficient and wind pressure on a large cruise ship, covering a wind field ranging from 0° to 180°. They all conducted numerical validation based on wind tunnel tests. These researchers used Computational Fluid Dynamics (CFD) to compute the ship’s wind field, focusing on the comprehensive and localized wind load distributions, streamline patterns, and three-component coefficients under various wind conditions.
Once the whole ship’s wind field is computed, obtaining wind field inputs for specific local open decks becomes essential. The subdomain method utilizes the results of the whole domain analysis as the initial or boundary conditions for a secondary subdomain assessment [44]. This method is well-suited for the meticulous calculation of airflow within a specific local building affected by group shielding effects. Huang et al. [44] introduced the parameters of the subdomain method and applied it to compute the aerodynamic noise generated by rear-view mirrors. They subsequently verified the accuracy of the subdomain method based on the wind tunnel test. This comprehensive analysis further served to affirm the reasonableness and applicability of the subdomain assignment method.
However, to the best of our knowledge, studies on the wind-induced vibration of large cruise ships have rarely been reported. Therefore, this study endeavors to explore the wind vibration calculation method for typical structures on the open deck and verify the accuracy through wind tunnel tests. The wind field input of the open deck was captured via CFD calculations of the cruise ship based on the subdomain method. The calculation process of wind-induced vibration of the frame structure on the open deck of a large cruise ship was proposed, and the wind-induced vibration characteristics of the typical guide rail frame structure on the open deck were analyzed. The study could provide some instructive insights for the wind vibration control of the open deck structures of cruise ships.

2. Material and Method

2.1. Wind Tunnel Test and Simulation Method of Typical Structures on Open Deck

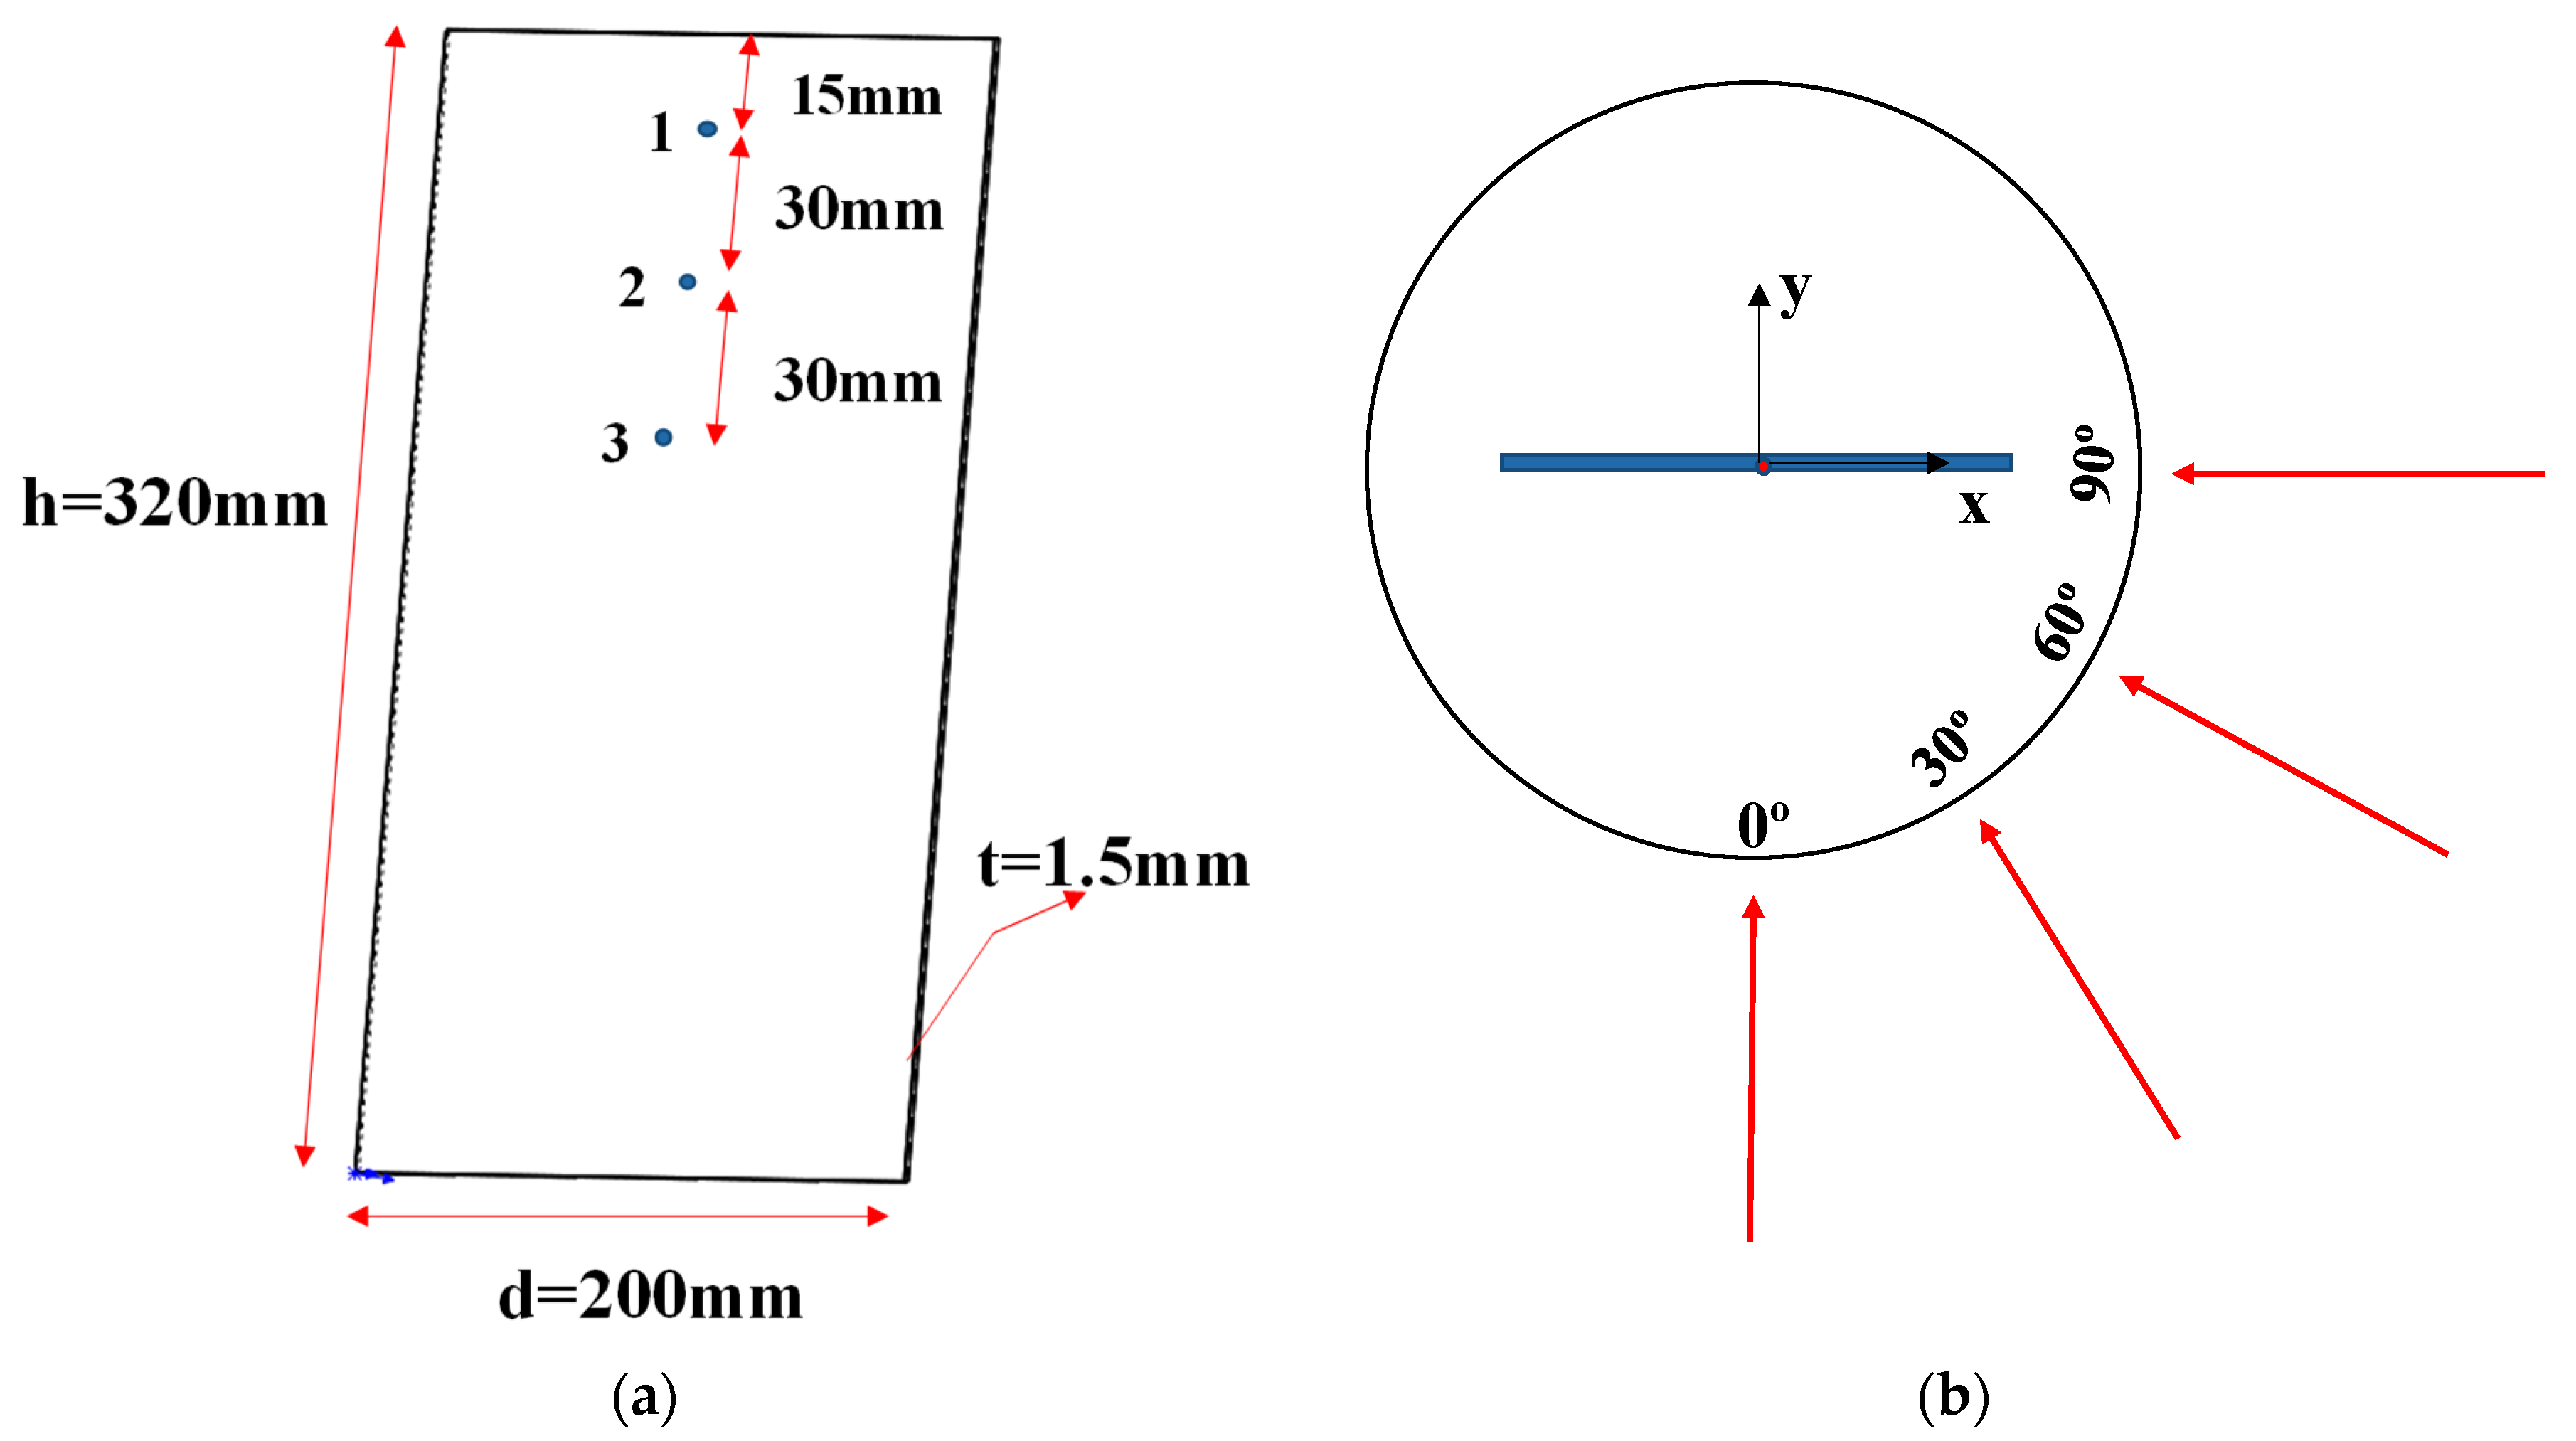
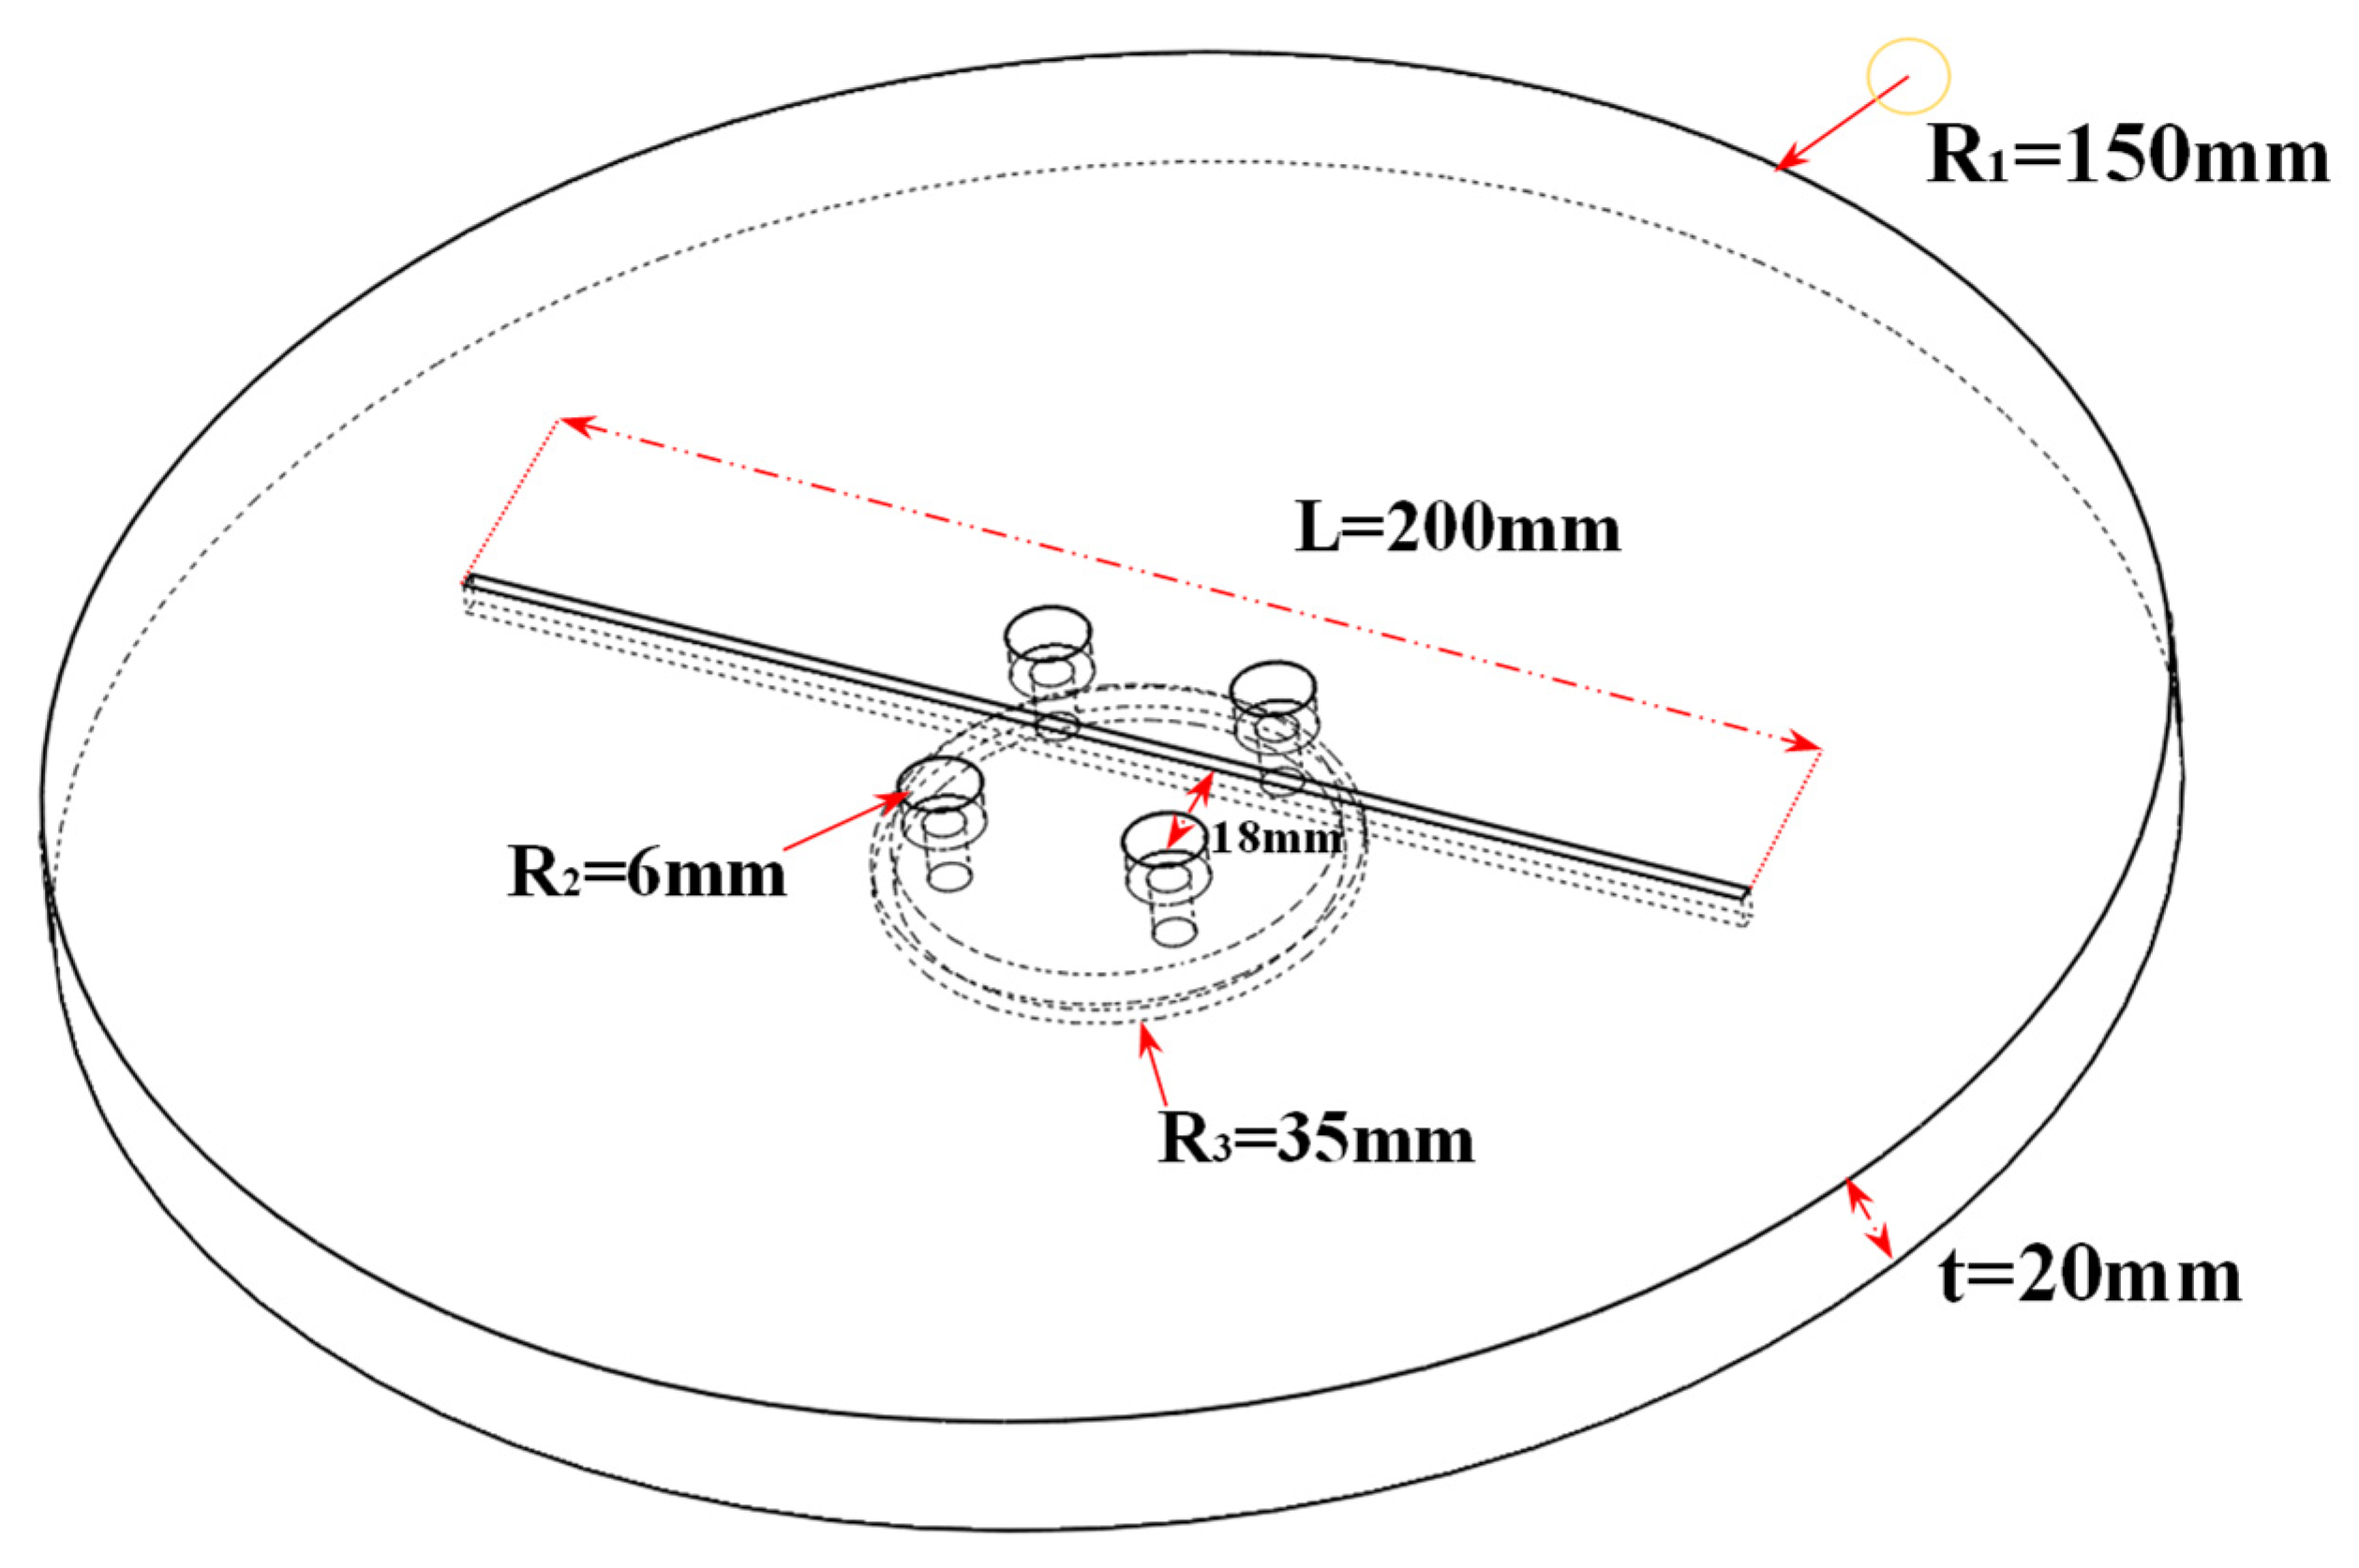
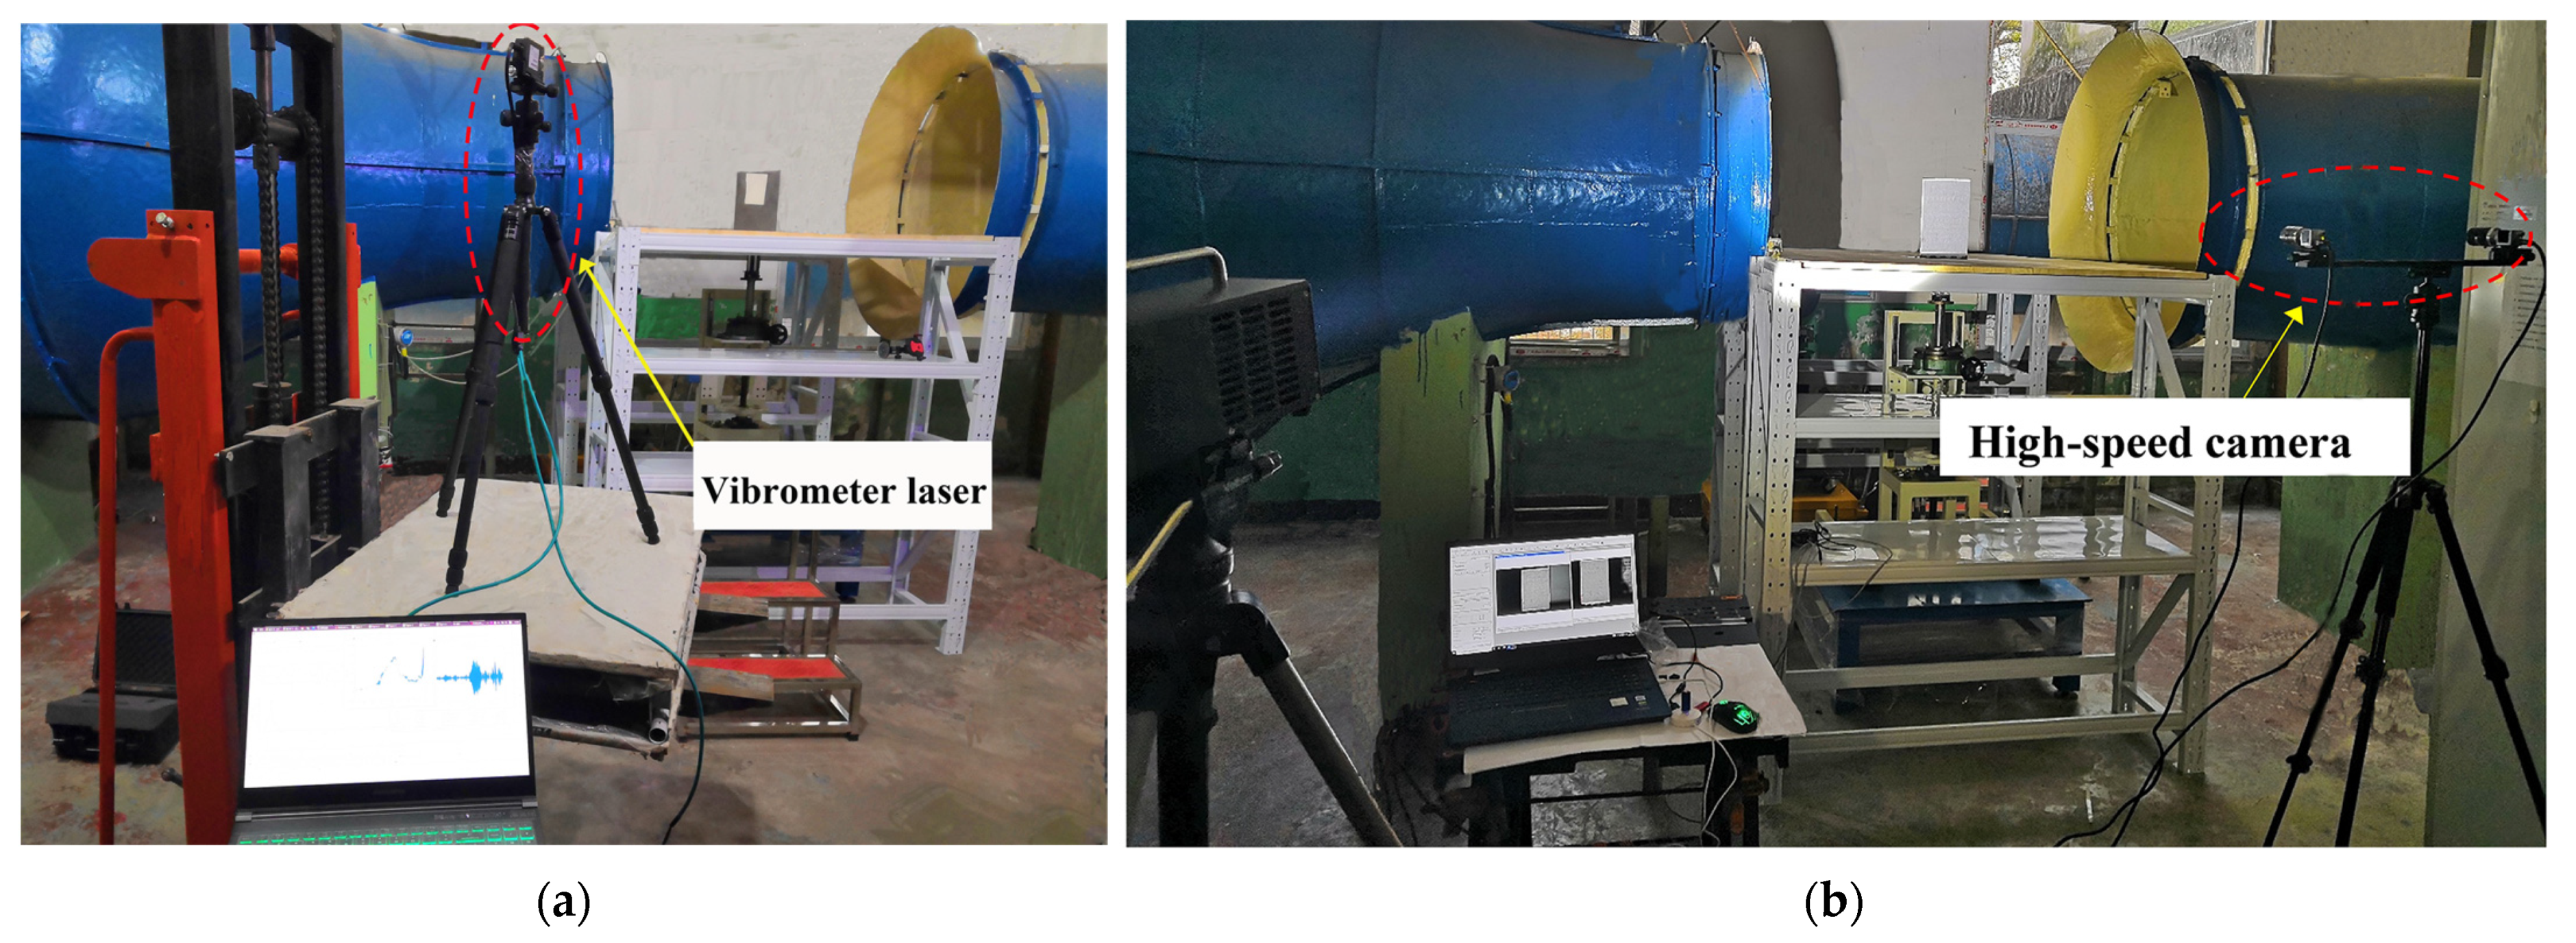
2.1.1. Wind Tunnel Test of Typical Structure on the Open Deck

To investigate and validate the numerical method for fluid–structure interaction, wind tunnel tests were initially performed in an open wind tunnel at Wuhan University of Technology. The experiments encompassed both the rigid force test and wind-induced vibration test. According to the design requirements of typical structural qualities, boundary conditions, and material properties of the open deck, a plate structure was selected as the subject [3], with the lower section affixed as a fixed boundary condition. The material was steel. The characteristic dimensions of the model, as well as the wind velocity in the wind tunnel, are designed according to the Reynolds number in the open area of the cruise ship at sea.
The dimensions of the structural components and the layout of the measuring points are depicted in Figure 1a. Furthermore, Figure 2 illustrates the design of the turntable, devised to stabilize the lower aspect of the plate structure. Additionally, by adjusting the rotation angle of the turntable, different wind angles could be achieved and measured during the tests, as seen in in Figure 1b.
Wind tunnel tests encompassed an array of distinct wind velocities: specifically, 15 m/s, 20 m/s, 25 m/s, and 30 m/s. Additionally, four wind angles (0°, 30°, 60°, and 90°) were configured for comprehensive assessment. To ensure the precision of the input wind speed within the designated test section, the utilization of a pitot tube and an impeller anemometer was employed to measure the incoming wind velocity. The wind load tests employed a six-component balance utilizing a measurement range of 400 N/40 N m.
In order to obtain the variation trends in vibration displacement under different wind conditions, including various wind velocities, wind angles, and spatial positions, the measurement of vibration displacement was conducted utilizing a KathMatic Kv laser vibrometer, as shown in Figure 3a. As shown in Figure 3b, the dynamic response of the plate structure under various wind conditions was examined using a high-speed DIC system.

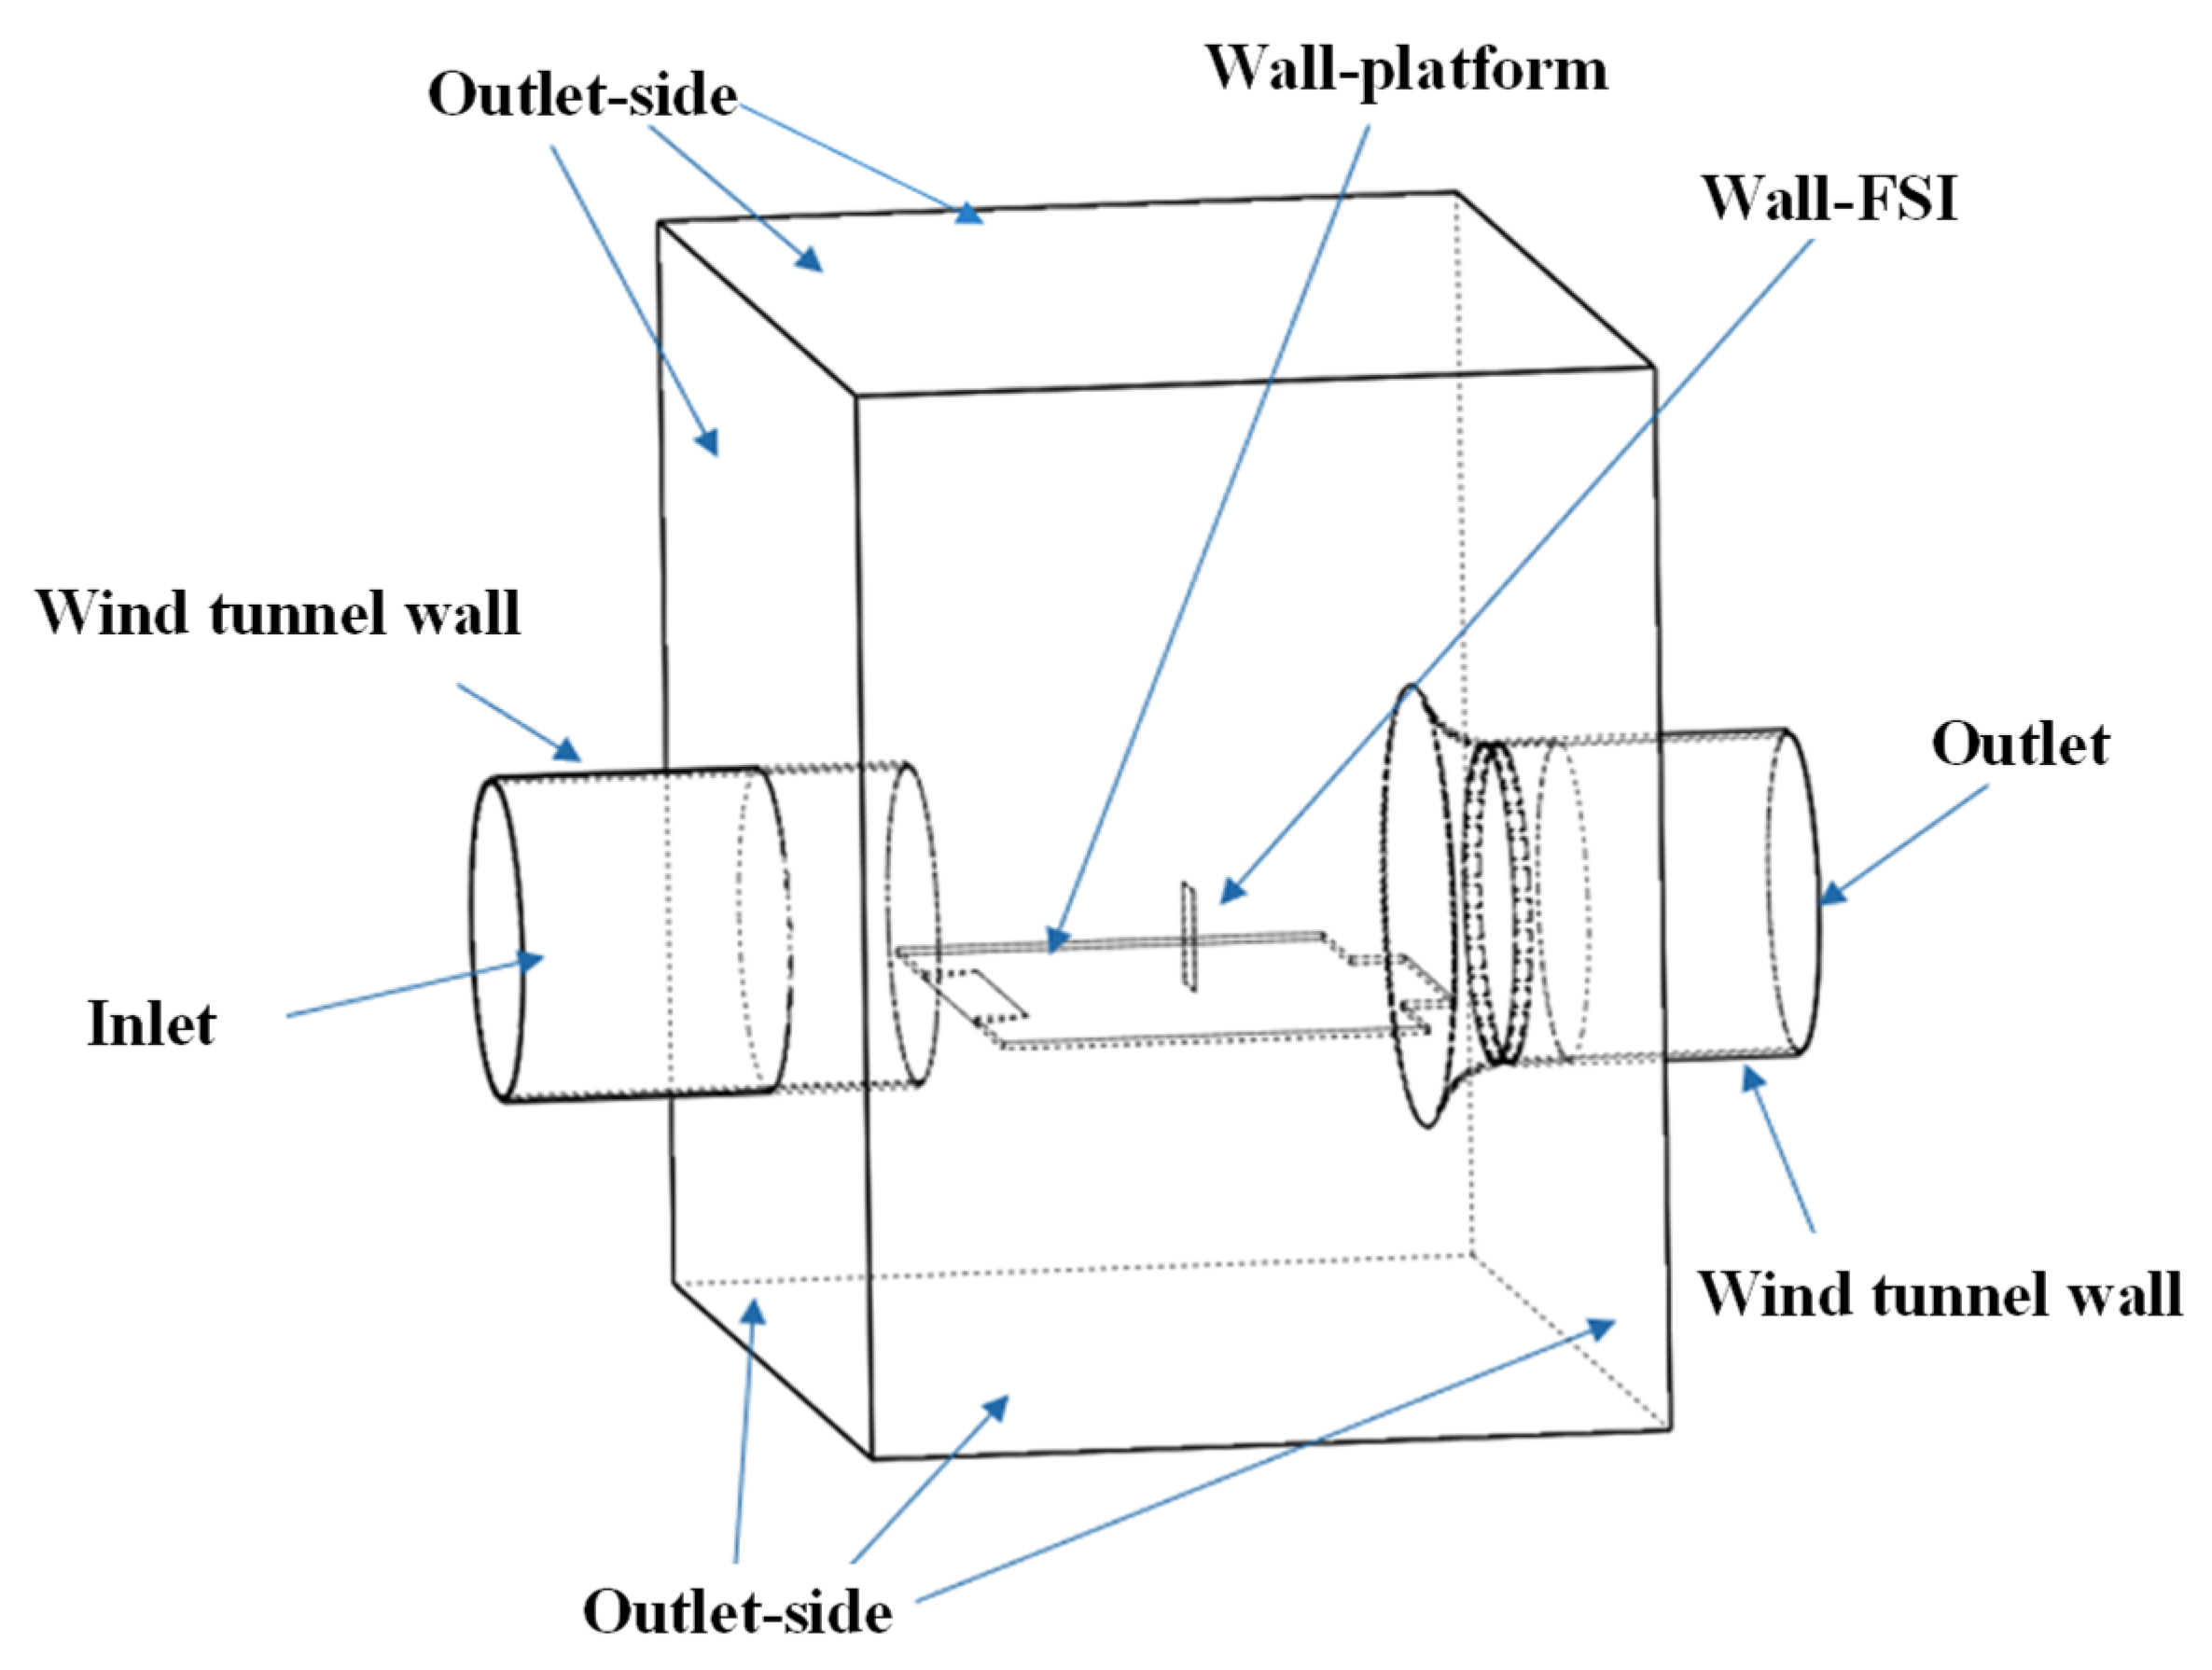
2.1.2. Study of Wind-Induced Vibration Simulation Method for Typical Structure on Open Deck

The computational domain, corresponding in size to the WHUT wind tunnel, was established as depicted in Figure 4. The inlet of the computational domain was designated as a velocity inlet, and the velocity was consistent with the wind velocity of the test. The wind tunnel outlet was designated as the static pressure outlet. Since the wind tunnel was open, the six sides of the square domain within the test section were set as static pressure outlets. The wall surfaces of the wind tunnel and test platform were non-slip wall surfaces. Notably, the surface of the plate structure was designated as the interface for fluid–structure interaction, serving as a non-slip wall boundary. The Cartesian cut volume and the polyhedral mixed mesh was applied for the mesh generation. Three levels of local mesh refinements around the plate structure and the wind tunnel wall were generated. Moreover, ten layers of prism meshes with a growth rate of 1.1 were distributed on the surface of the plate, and the non-dimensional wall distance y + < 1. Four sets of mesh refinement schemes were subsequently adopted for exploration.
As shown in the Table 1, the mesh size is taken to be dimensionless, where x is the basic size of the mesh, y is the near-wall refinement size of the structure, z is the near-wall size of the wind tunnel, and L is the characteristic size of the computational domain, which is taken as the maximum value of the length, width, and height of the computational domain.
The physical flow time was set to 8 s, and different time steps were utilized: 0.01 s, 0.005 s, 0.001 s, and 0.0005 s. Three turbulence models were employed for analysis [45,46]: SST k-ω, Realizable k-ε, and Des-SST k-ω models. The calculation of the fluid section was performed using the software ScFlow V2020.
The interface was set to exchange fluid pressure and structural displacement information. The dynamic meshes were inserted around the structural surface to form uniform deformation. The structural simulation was set in the structural finite element software MSC Marc 2020, and the setting parameters were consistent with the wind tunnel test. The contact surfaces between the structural and fluid functioned as the pivotal interface for conducting fluid–structure co-simulation. The time step and iterations were set to be consistent with the fluid setting. The computational pathway was set for the fluid and structure calculations within the co-simulation interface MSC CoSim. The interface was employed to exchange information between the fluid and the structure to achieve the interpolation calculation.
As shown in Figure 5, different coloured curves represent the trend of different parameters. With the mesh scheme’s continuous refinement, the drag coefficient and the vibration frequency calculation errors decrease first and then increase. The error of mesh scheme III is the minimum. The error of the vibration frequency decreases gradually with mesh densification, and the difference between scheme IV and scheme III is insignificant. The average error index of the above three evaluation indexes shows that mesh scheme III is the optimal refinement strategy. The error of the drag coefficient is the smallest at a time step of 0.0005 s. The average vibration error decreases with decreasing time steps. The drag coefficient error is smallest when employing a time step of 0.0005 s. Considering the calculation cost and accuracy, the following co-simulation calculations employed the time step of 0.001 s.
As shown in Figure 5c, the SST k-ω model exhibits a minimal error between the calculated drag coefficient and the average vibration value. Additionally, the vibration frequency calculation error of Realizable k-ε is the smallest. After averaging the three errors, it can be found that the SST k-ω model exhibits the minimal error. Consequently, the following wind-induced vibration numerical simulation adopted the SST k-ω model.
Each simulation was computed in parallel on the high-performance computing (HPC) system using 64 processors. The co-simulation of each test condition employing the above-selected parameters takes approximately 172 to 228 h.
Figure 6 compares the wind tunnel experimental data and computed results. The results of the numerical calculations matched well with the experimental data at wind speeds of 10–20 m/s. As wind speed increased, the average displacement results obtained by the test gradually become larger than those obtained by the simulation. Remarkably, the results exhibit consistent agreement under different wind angles. The vibration displacement’s frequency domain curve of the structure was tested by the DIC system at a wind angle of 60°. The dominant frequency measured by the test is 11 Hz, while the dominant frequency calculated by the simulation is 11.9 Hz, and the relative error of vibration frequency is small. Notably, the vibration cloud diagram of the simulation achieved a perfect match with the experimental result.

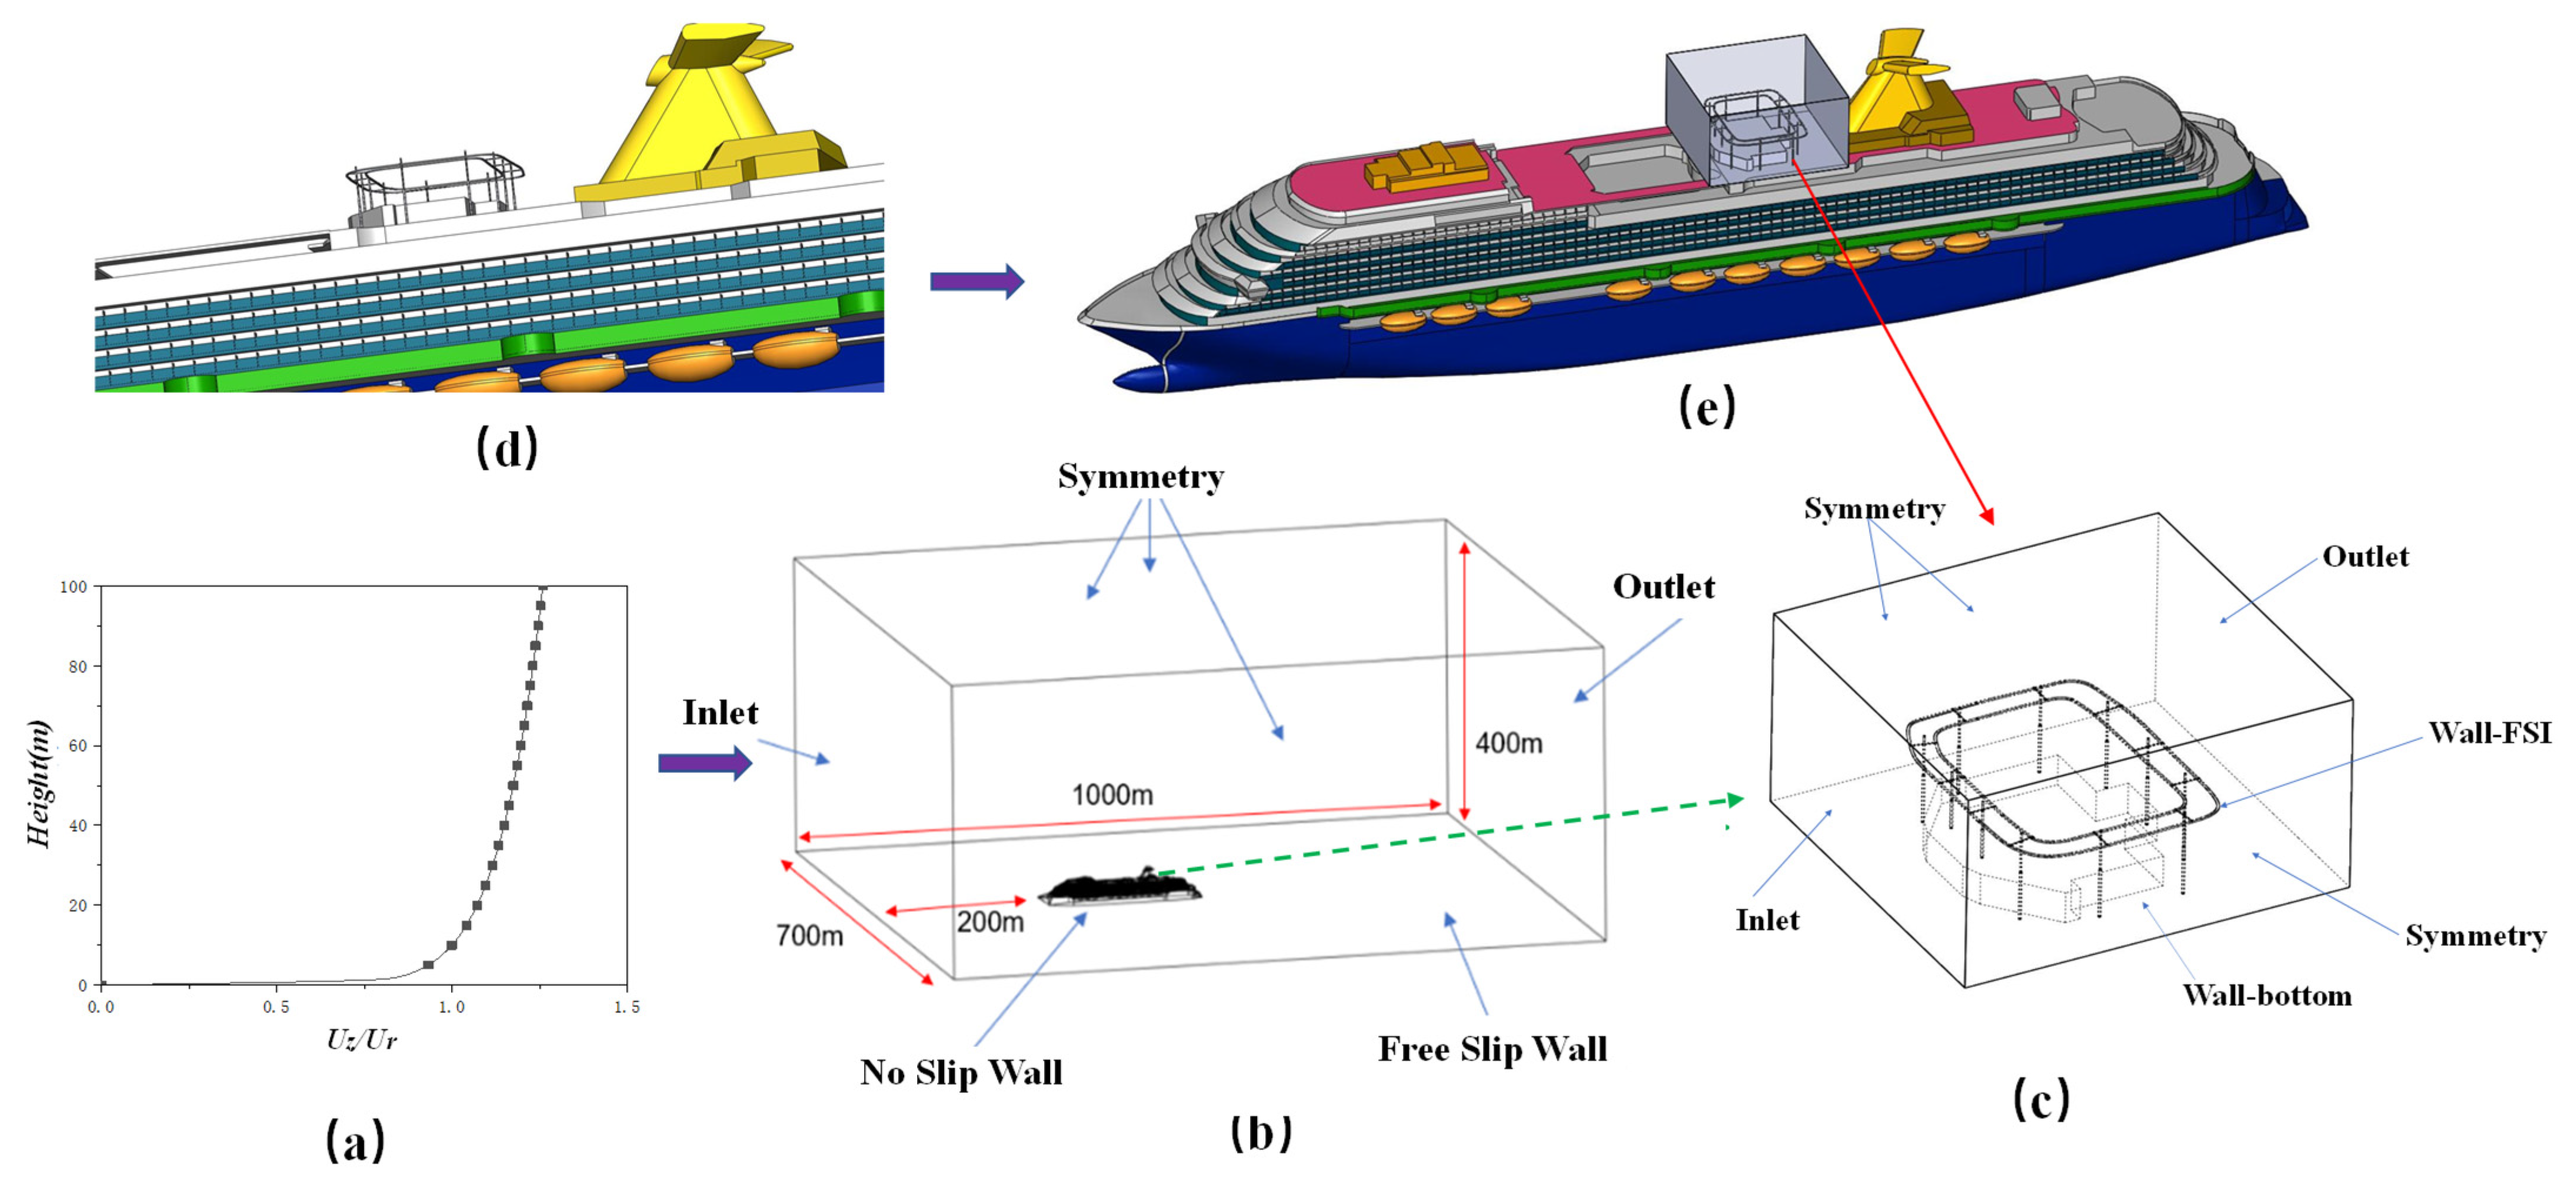
2.2. Open Deck Wind Field Inputs in Ship Wind Field Environments Based on the Subdomain Method

2.2.1. Velocity Mapping Based on Subdomain Method

Through the CFD simulations of the building group, it becomes feasible to capture the wind environment distribution surrounding the target structure—the small square building within the group—as shown in Figure 7. The calculation results of the whole domain are used as the initial conditions to carry out the CFD calculation of the target building subdomain.
As shown in Figure 8, the velocity cross-section cloud diagram is obtained at a distance of 0.015 m from the inlet. Notably, the wind field distributions of the whole domain and subdomain exhibit substantial similarity. Figure 9 shows the pressure curve of the target building structure distributed along the central ring of the building. The negative pressure amplitude of the subdomain at positions 3–7 in front of the structure was slightly smaller than that of the whole domain. Conversely, at positions 11–17 in the rear, the negative pressure amplitude of the subdomain was slightly larger than that of the whole domain. The predicted pressure values within the subdomain exhibited consistent variation with the whole domain.

2.2.2. Open Deck Subdomain Wind Field Input Based on Whole Ship Wind Environment

The CFD calculation domain of the ship above the waterline was established. The inlet was set as the exponential velocity profile, as shown in Figure 10a. The wind velocity gradient over the ocean is expressed as follows:
U z = U r × ( z z r ) α
where U r is the wind velocity at the corresponding reference elevation position and the reference elevation z r is 10 m above the ocean. α is the roughness coefficient, which is taken as 0.1. Different reference wind speeds are set in the following study. The wind speed in this study is taken as the relative wind speed during cruise navigation [43].
The bottom of the domain was set as a slip wall, while the hull and superstructure were set as non-slip walls. The outlet was set as a static pressure outlet. Symmetry planes were implemented on the domain’s left, right, and top sides. The dimensions of the computational domain are depicted in Figure 10b, and the computed blockage ratio, computed according to the ship’s longitudinal section area, was found to be 4.3%, which falls below the threshold of 5%.
Due to the variety of structural forms on the open deck of cruise ships, a representative guide rail frame structure was selected for wind-induced vibration research. The guide rail structure is situated on the open deck in front of the chimney, as shown in Figure 10d. Notably, its structural feature is the track above the support of the circumferentially arranged pillars. Its subdomain was established (as shown in Figure 10e). This enabled the wind field to be input into subdomain Figure 10c based on the wind field results calculated in the whole domain.
Figure 11 shows the mesh division of the whole ship’s computational domain and local mesh refinement. Due to the cruise ship as a complex bluff body structure, a hybrid approach involving Cartesian cut-body and polyhedral body mesh can be effectively employed to simulate the complex boundary. Wang et al. [43] conducted the wind tunnel test and numerical simulation on the cruise ship. They conducted a convergence analysis of mesh dimensionless size based on the aerodynamic coefficients obtained from the test. According to this document’s mesh convergence analysis results, the basic size/LOA was determined as 0.035. The basic mesh size was 11.3 m, the outermost densified size was 5.65 m, the inner refinement area was 2.82 m, and the ship wall refinement size was 0.375 m. Moreover, eight layers of prism meshes with a growth rate of 1.05 were distributed on the ship’s surface, and a total of 4.51 million meshes were set at a wind angle of 0°. The Realizable k-ε turbulence model was utilized for the closure of the RANS equations. Numerical computation of the wind field for the whole ship was iterated for 5000 steps and reaches convergence for each wind condition.
Figure 12 exhibits the cruise whole ship wind field distribution for various wind directions as well as the subdomain wind field inputs of the target open deck. Under different wind angles, the wind field on the open deck is influenced not only by the wake generated from the flow separation in the front area, but also by the flow separation on the left and right sides of the whole ship. The wind field of the whole ship varies at different wind angles. Due to the combined effects of the flow separation of the whole ship and the wake from the front structure, the open deck’s wind field has complex and varied wind inputs. The subdomain method reveals that the wind field in the open area is greatly influenced by the wind angles within the overall wind environment of the ship. For instance, at wind angles of 30° and 60°, the wind field input in the subdomain is impacted by the open deck ahead, resulting in the formation of low-speed regions in the lower right portion. Conversely, at wind angles of 150° and 180°, the wind field is significantly shielded by the chimney, resulting in the formation of low-speed regions on the left and in the middle areas of the open deck.

3. Results and Discussion

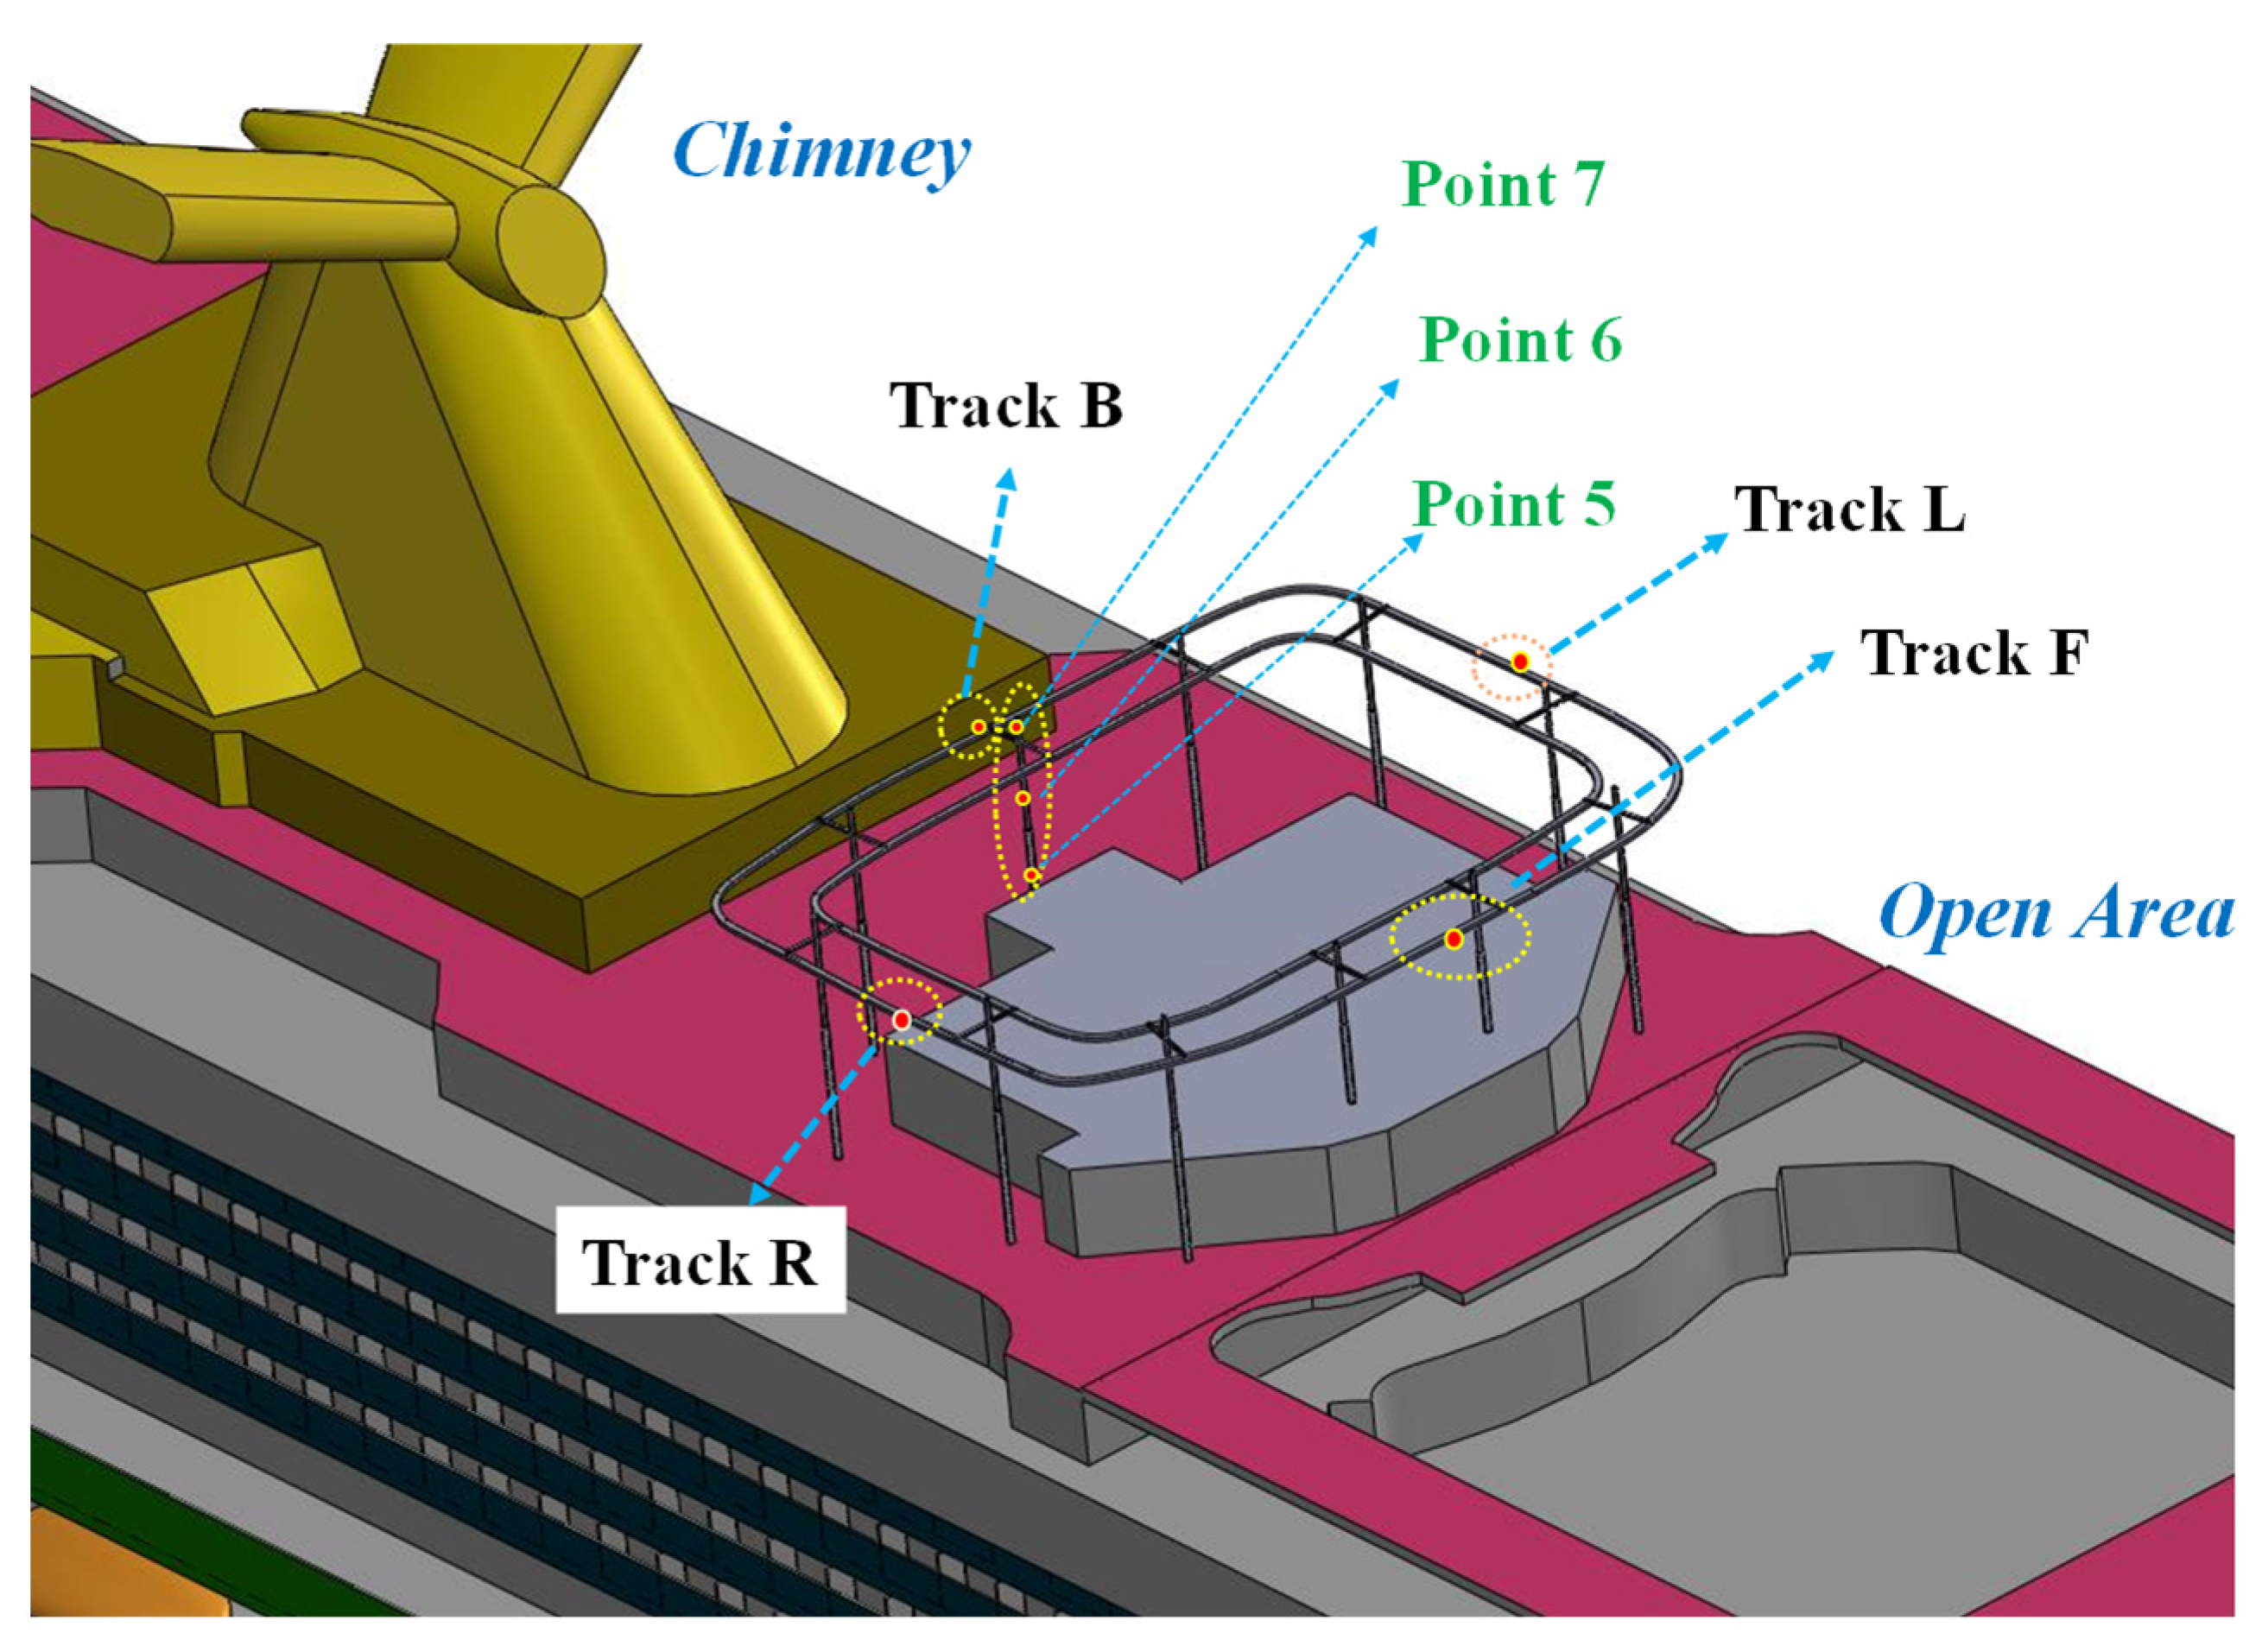
3.1. Wind-Induced Vibration Analysis of Typical Guide Rail Frame Structure on Open Deck

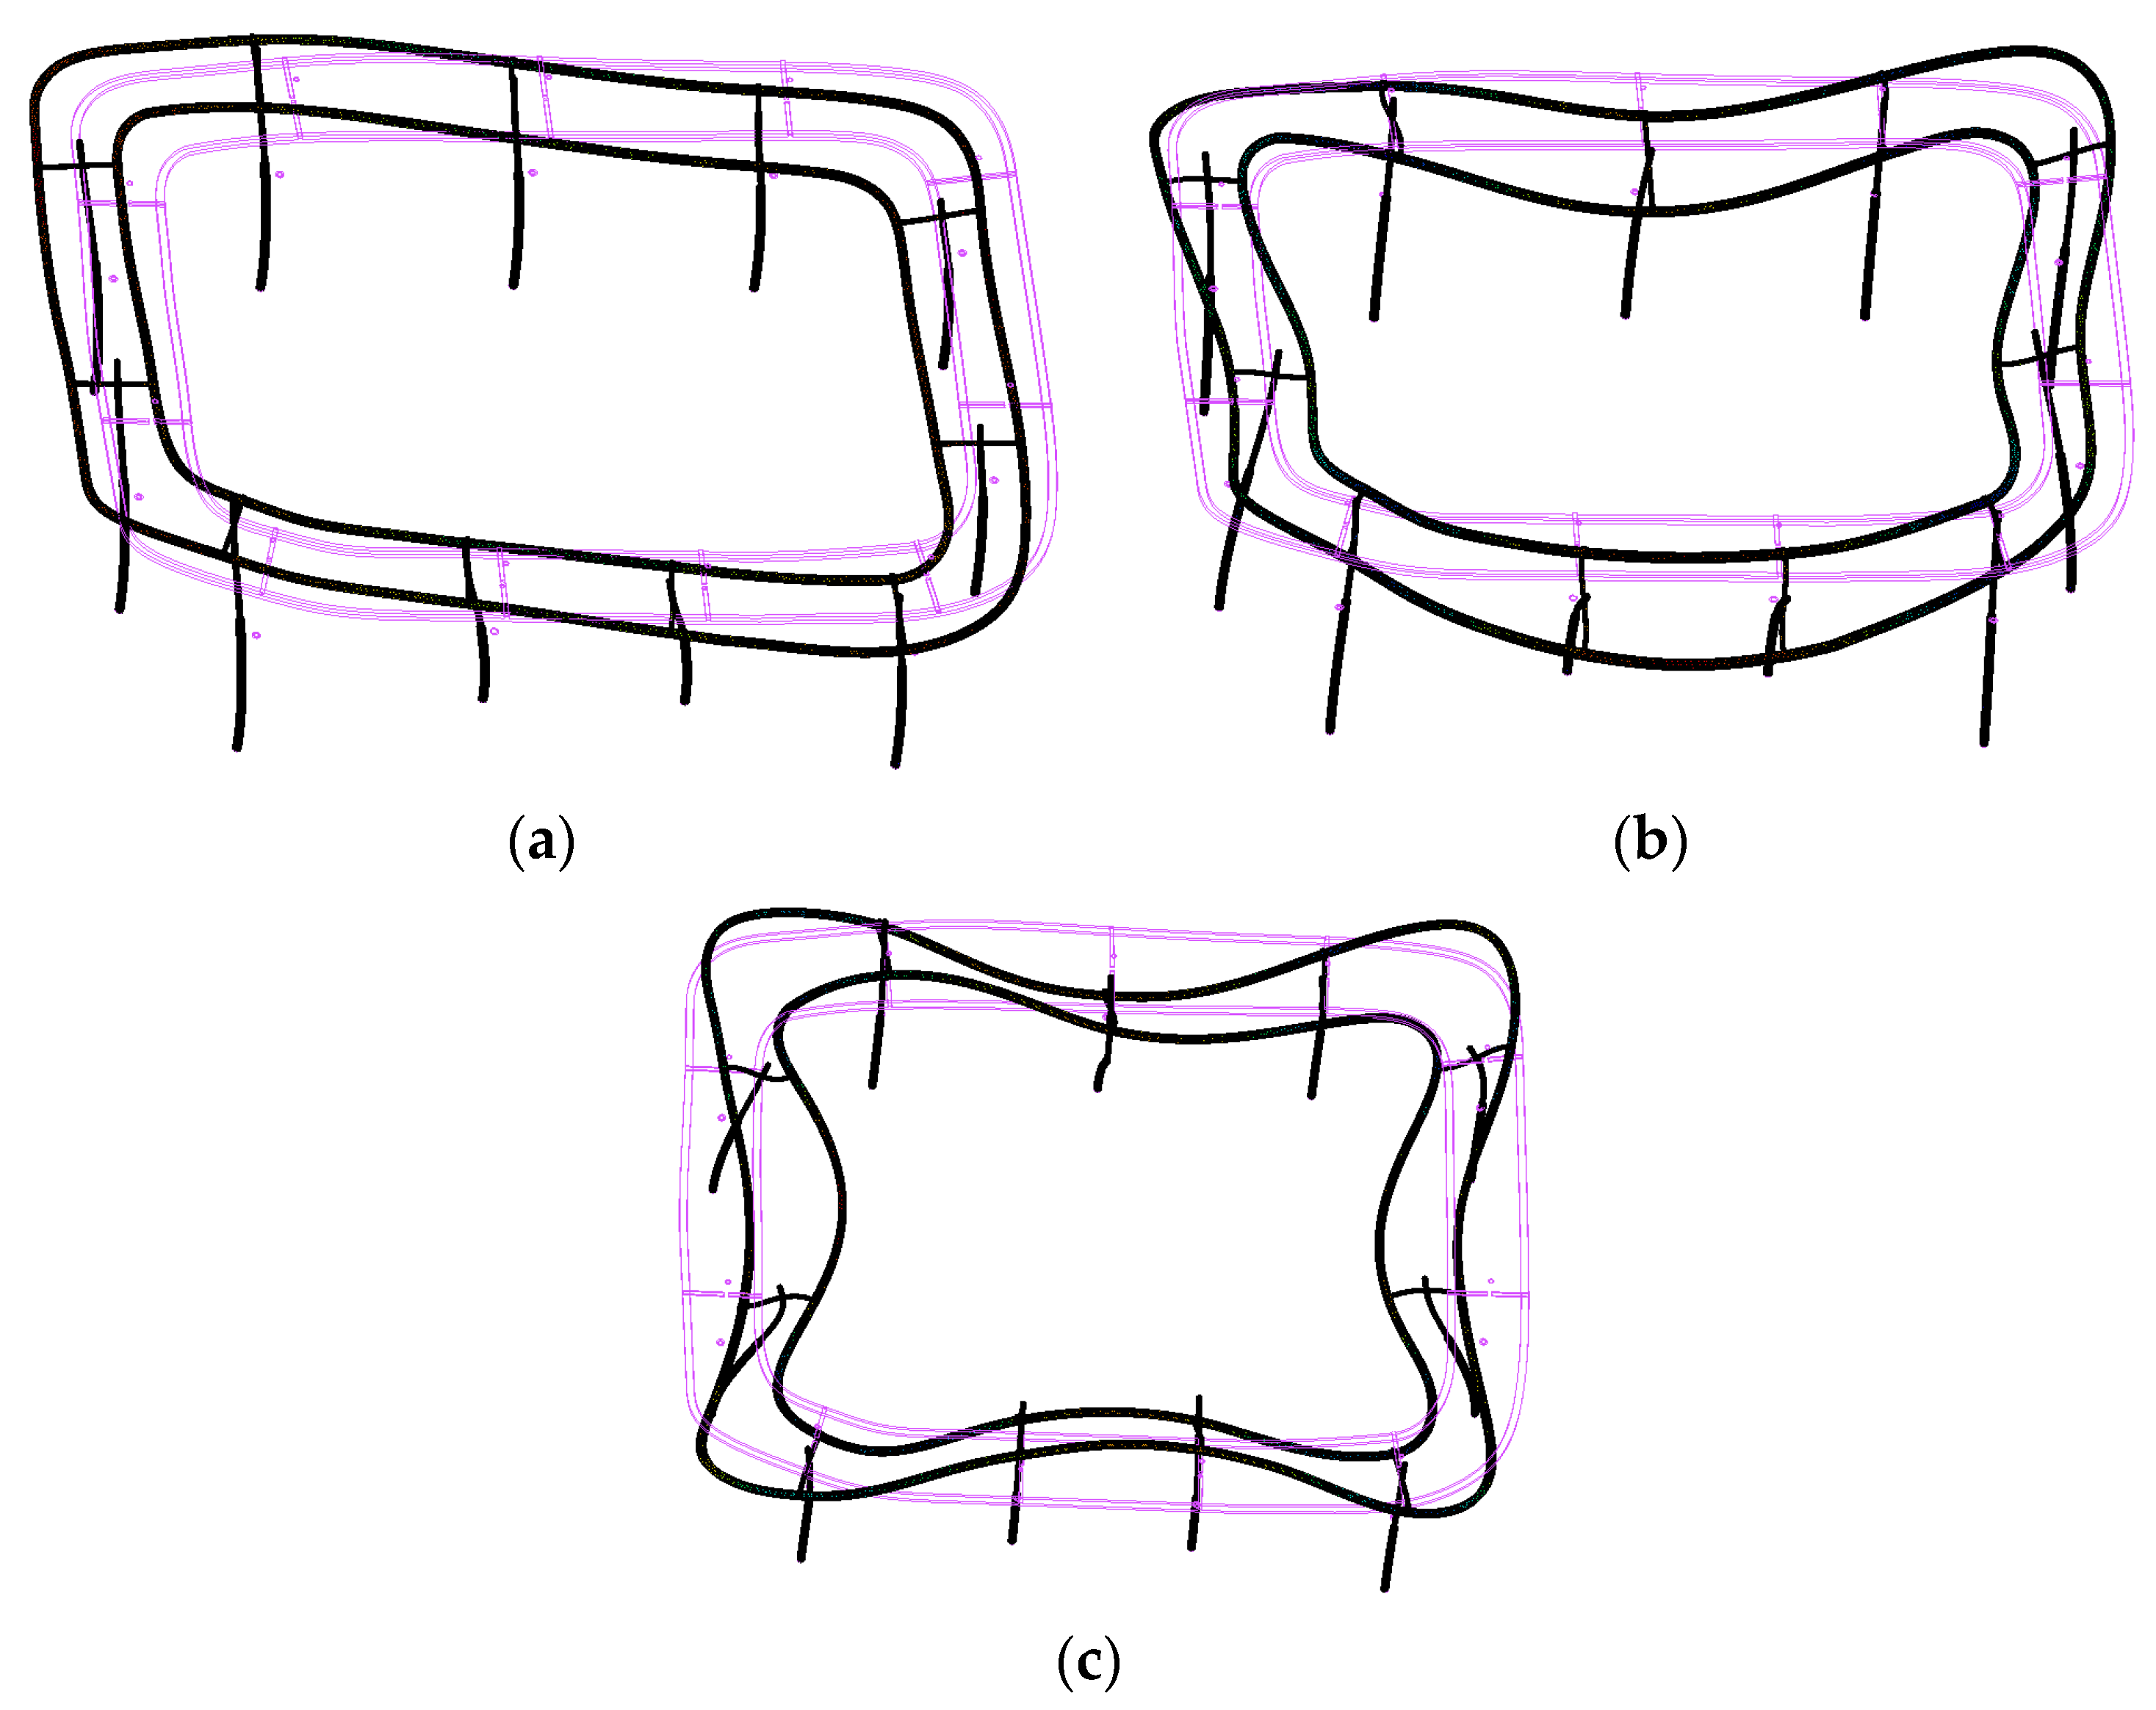
3.1.1. Modal Analysis of Guide Rail Frame Structure

The guide rail frame structure is presented in the Figure 13. Its topology and dimensions are similar to those of typical amusement facilities on the upper deck of the modern cruise ships, and it is a typical outdoor high-altitude amusement program. The structure is made of Q235 steel, the elastic modulus is 2.06 × 10⁵ MPa, Poisson’s ratio is 0.3, and the density is 7.85 × 10⁻⁹ t/mm3. The diameter of the bottom pillar is 440 mm, the distance between the two tracks is 2500 mm, and the height of the whole guide rail frame structure is 10,000 mm. The structure is located in vertical zone 3 on deck 12/14 of the cruise ship.
The modal calculations were carried out using the finite element method. Three representative global vibration modes were selected, and the black lines represent vibration patterns at various frequencies, and the red lines represent the original structure, as shown in Figure 14. The third-order mode exhibits an offset in the upper left corner and lower right corner of the structure. The seventh-order mode is characterized by the inward bending of the left and right side tracks, while the front and rear tracks are offset towards the front side. The thirteenth-order mode primarily involves the inward bending of the tracks. The structure’s natural frequencies are mainly concentrated in the low-frequency band. The maximum vibration occurs at the front and rear sides of the track and the top of the pillar.

3.1.2. FSI Parameter Settings of the Subdomain

To ensure the accuracy of the wind field input in the subdomain, the coordinate system of the subdomain was aligned with that of the whole domain. As shown in Figure 10c, the inlet of the subdomain was configured as a vector mapping of the wind field from the whole domain, while other boundary conditions of the subdomain remained consistent with the boundaries of the whole domain. The guide rail frame structure was designated as a non-slip wall surface, serving as the fluid–structure interaction interface. The two-way fluid–structure interaction calculations have been carried out according to the aforementioned calculation settings, including mesh division, time step size, turbulence model, and structural finite element settings.

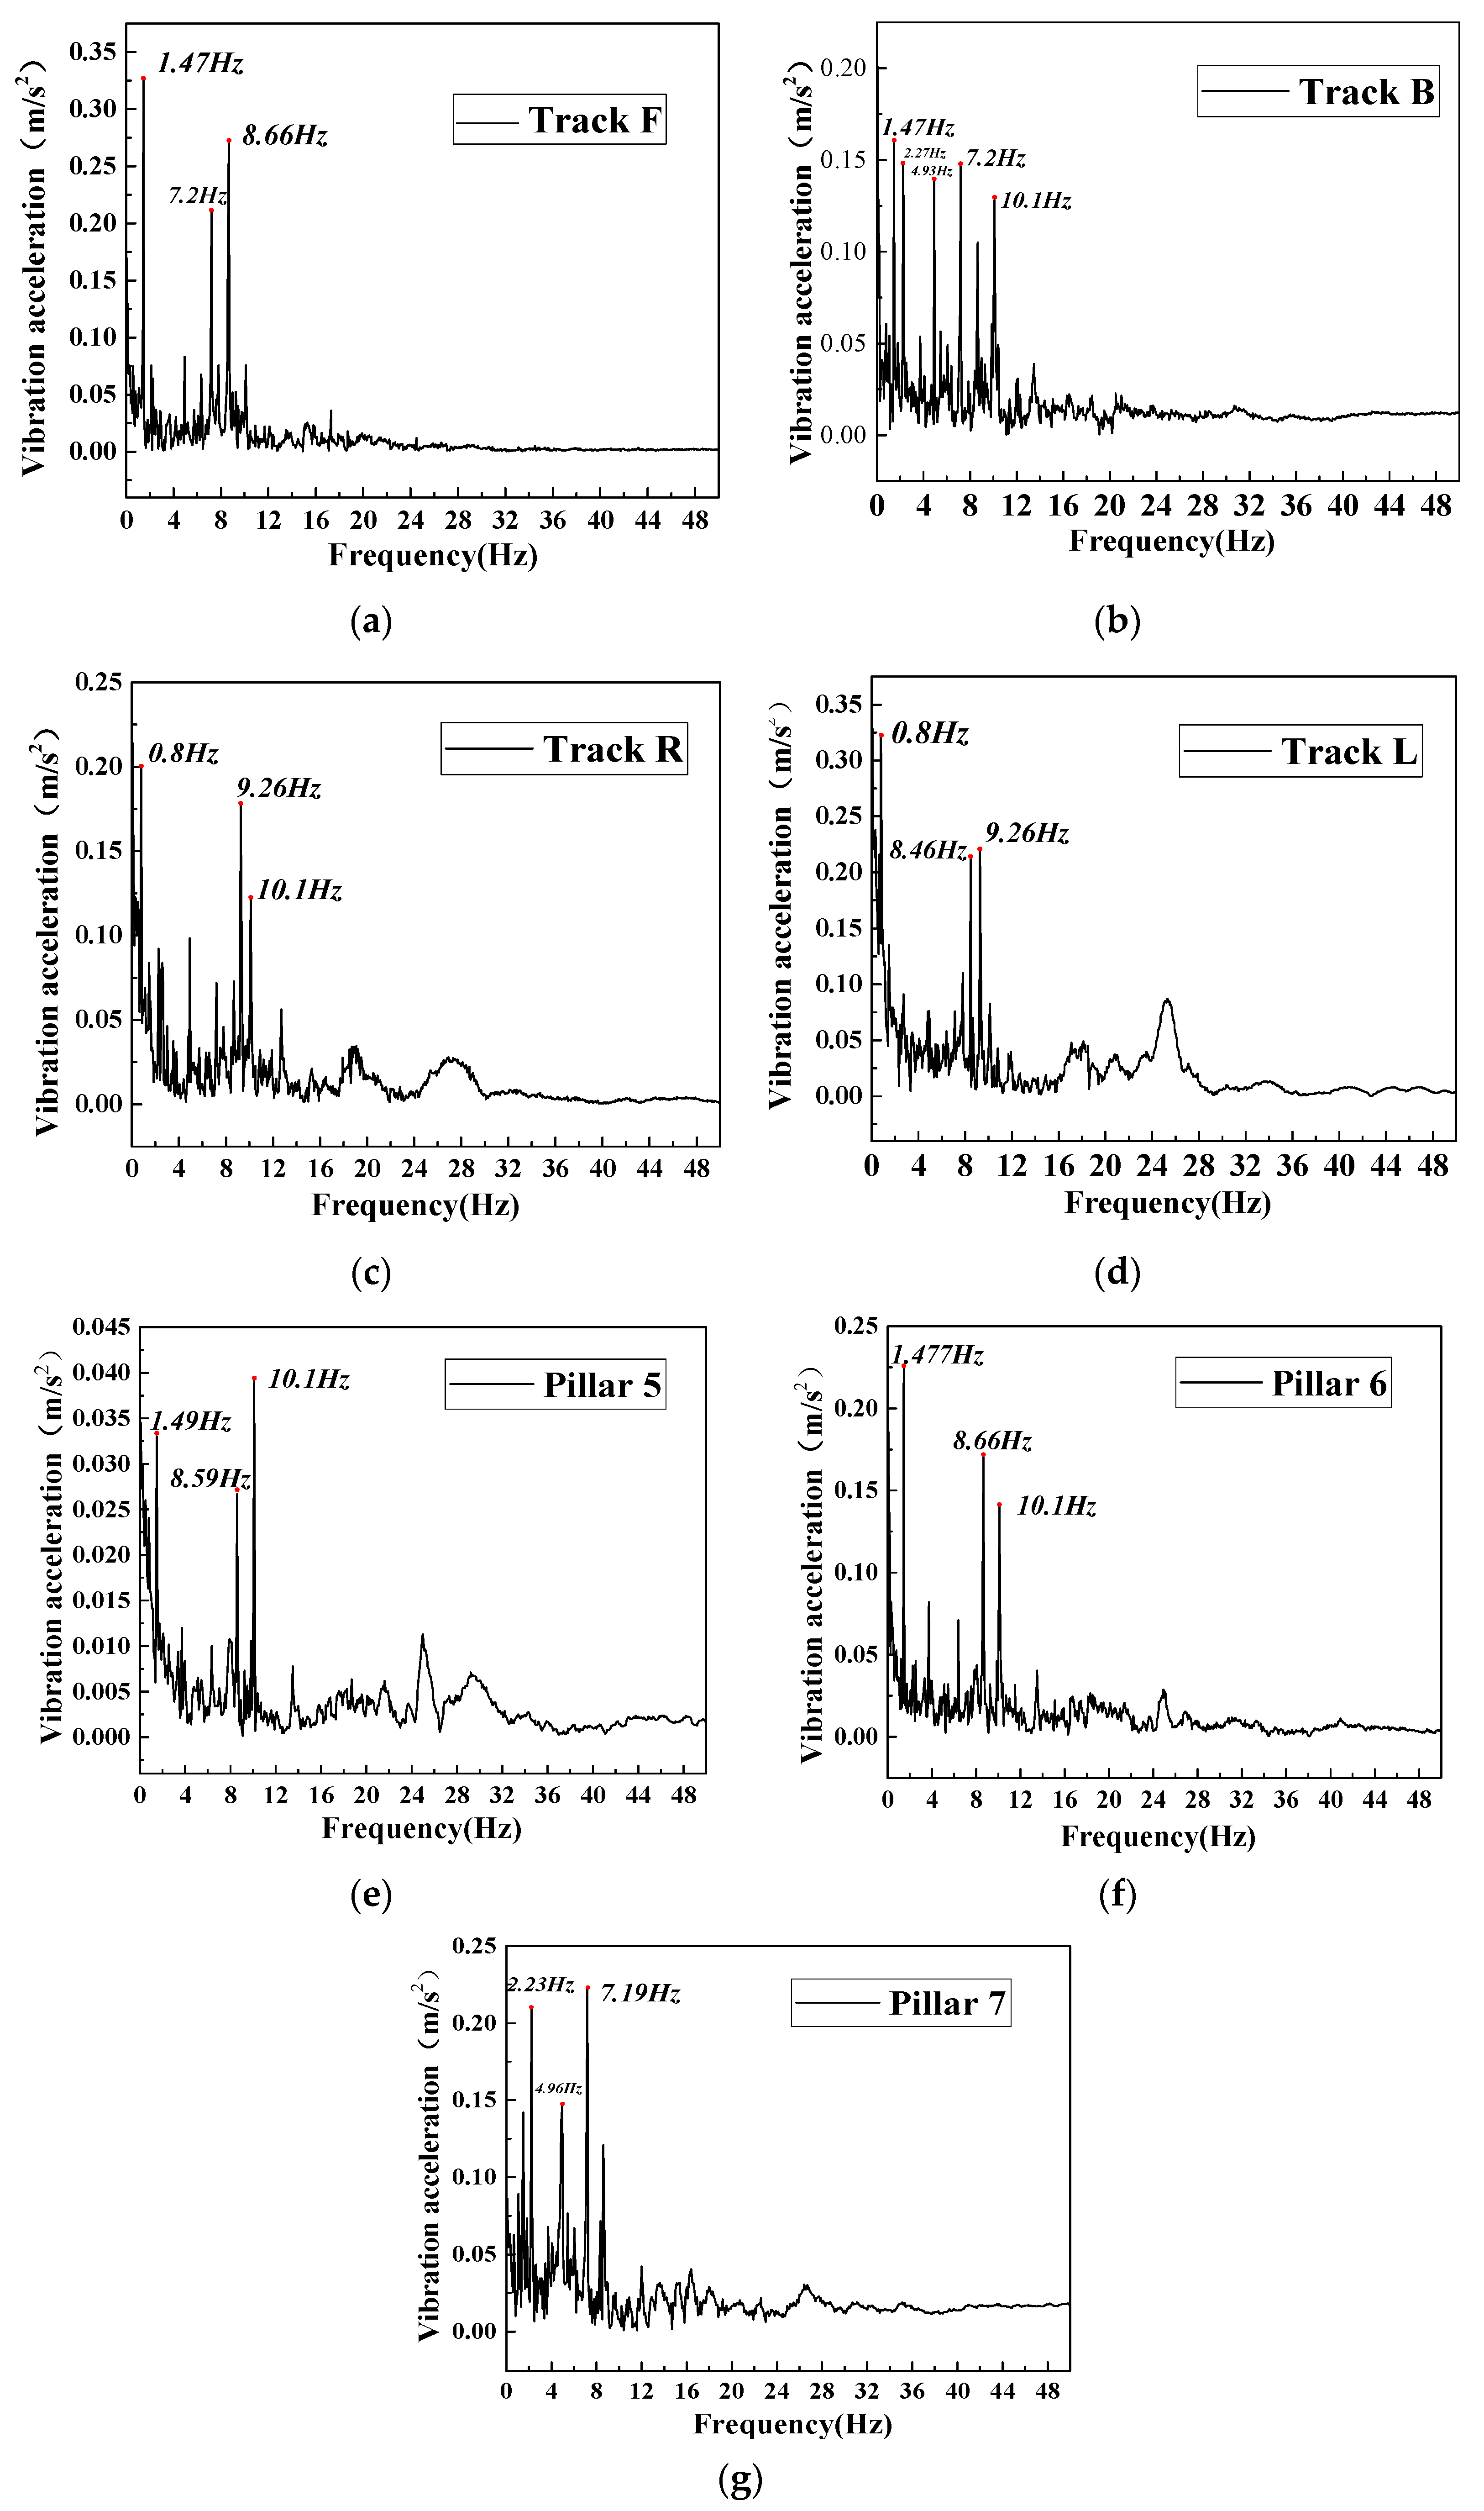
3.1.3. Wind-Induced Vibration Analysis of Guide Rail Frame Structure

The vibration monitoring points are shown in Figure 13. Through Fourier transform analysis [47], the vibration frequency domain curves for various positions of the guide rail frame are derived, as illustrated in Figure 15. It is evident that tracks F and B share a dominant vibration frequency of 1.47 Hz, which is close to the third-order natural frequency of the structure (1.52 Hz). Additionally, both tracks exhibit significant vibration peaks at 7.2 Hz. For tracks L and R, the dominant frequency is 0.8 Hz, accompanied by a vibration peak at 9.26 Hz. In comparison to tracks F and B, tracks L and R exhibit additional peaks at 27.5 Hz. Track B demonstrates the most abundant vibration frequency among the four cases, mainly because track B is affected by the complex incoming flow. The vibrations of the four tracks are concentrated in the low-frequency band within 10.1 Hz.
Analyzing the frequency domain curve of the vibration acceleration at the vertical monitoring points of the pillar, it can be observed that point 5 and point 6 exhibit similar distribution patterns of vibration peak frequency components. Both points show peaks at 1.48 Hz, 8.6 Hz, and 10.1 Hz. However, the dominant frequency differs between the two points, with point 5 at 10.1 Hz and point 6 at 1.47 Hz. Point 7, located at the vertex position, is significantly influenced by the nearby track vibration and the wind field ahead, leading to different vibration frequency components compared to the lower part of the pillar.

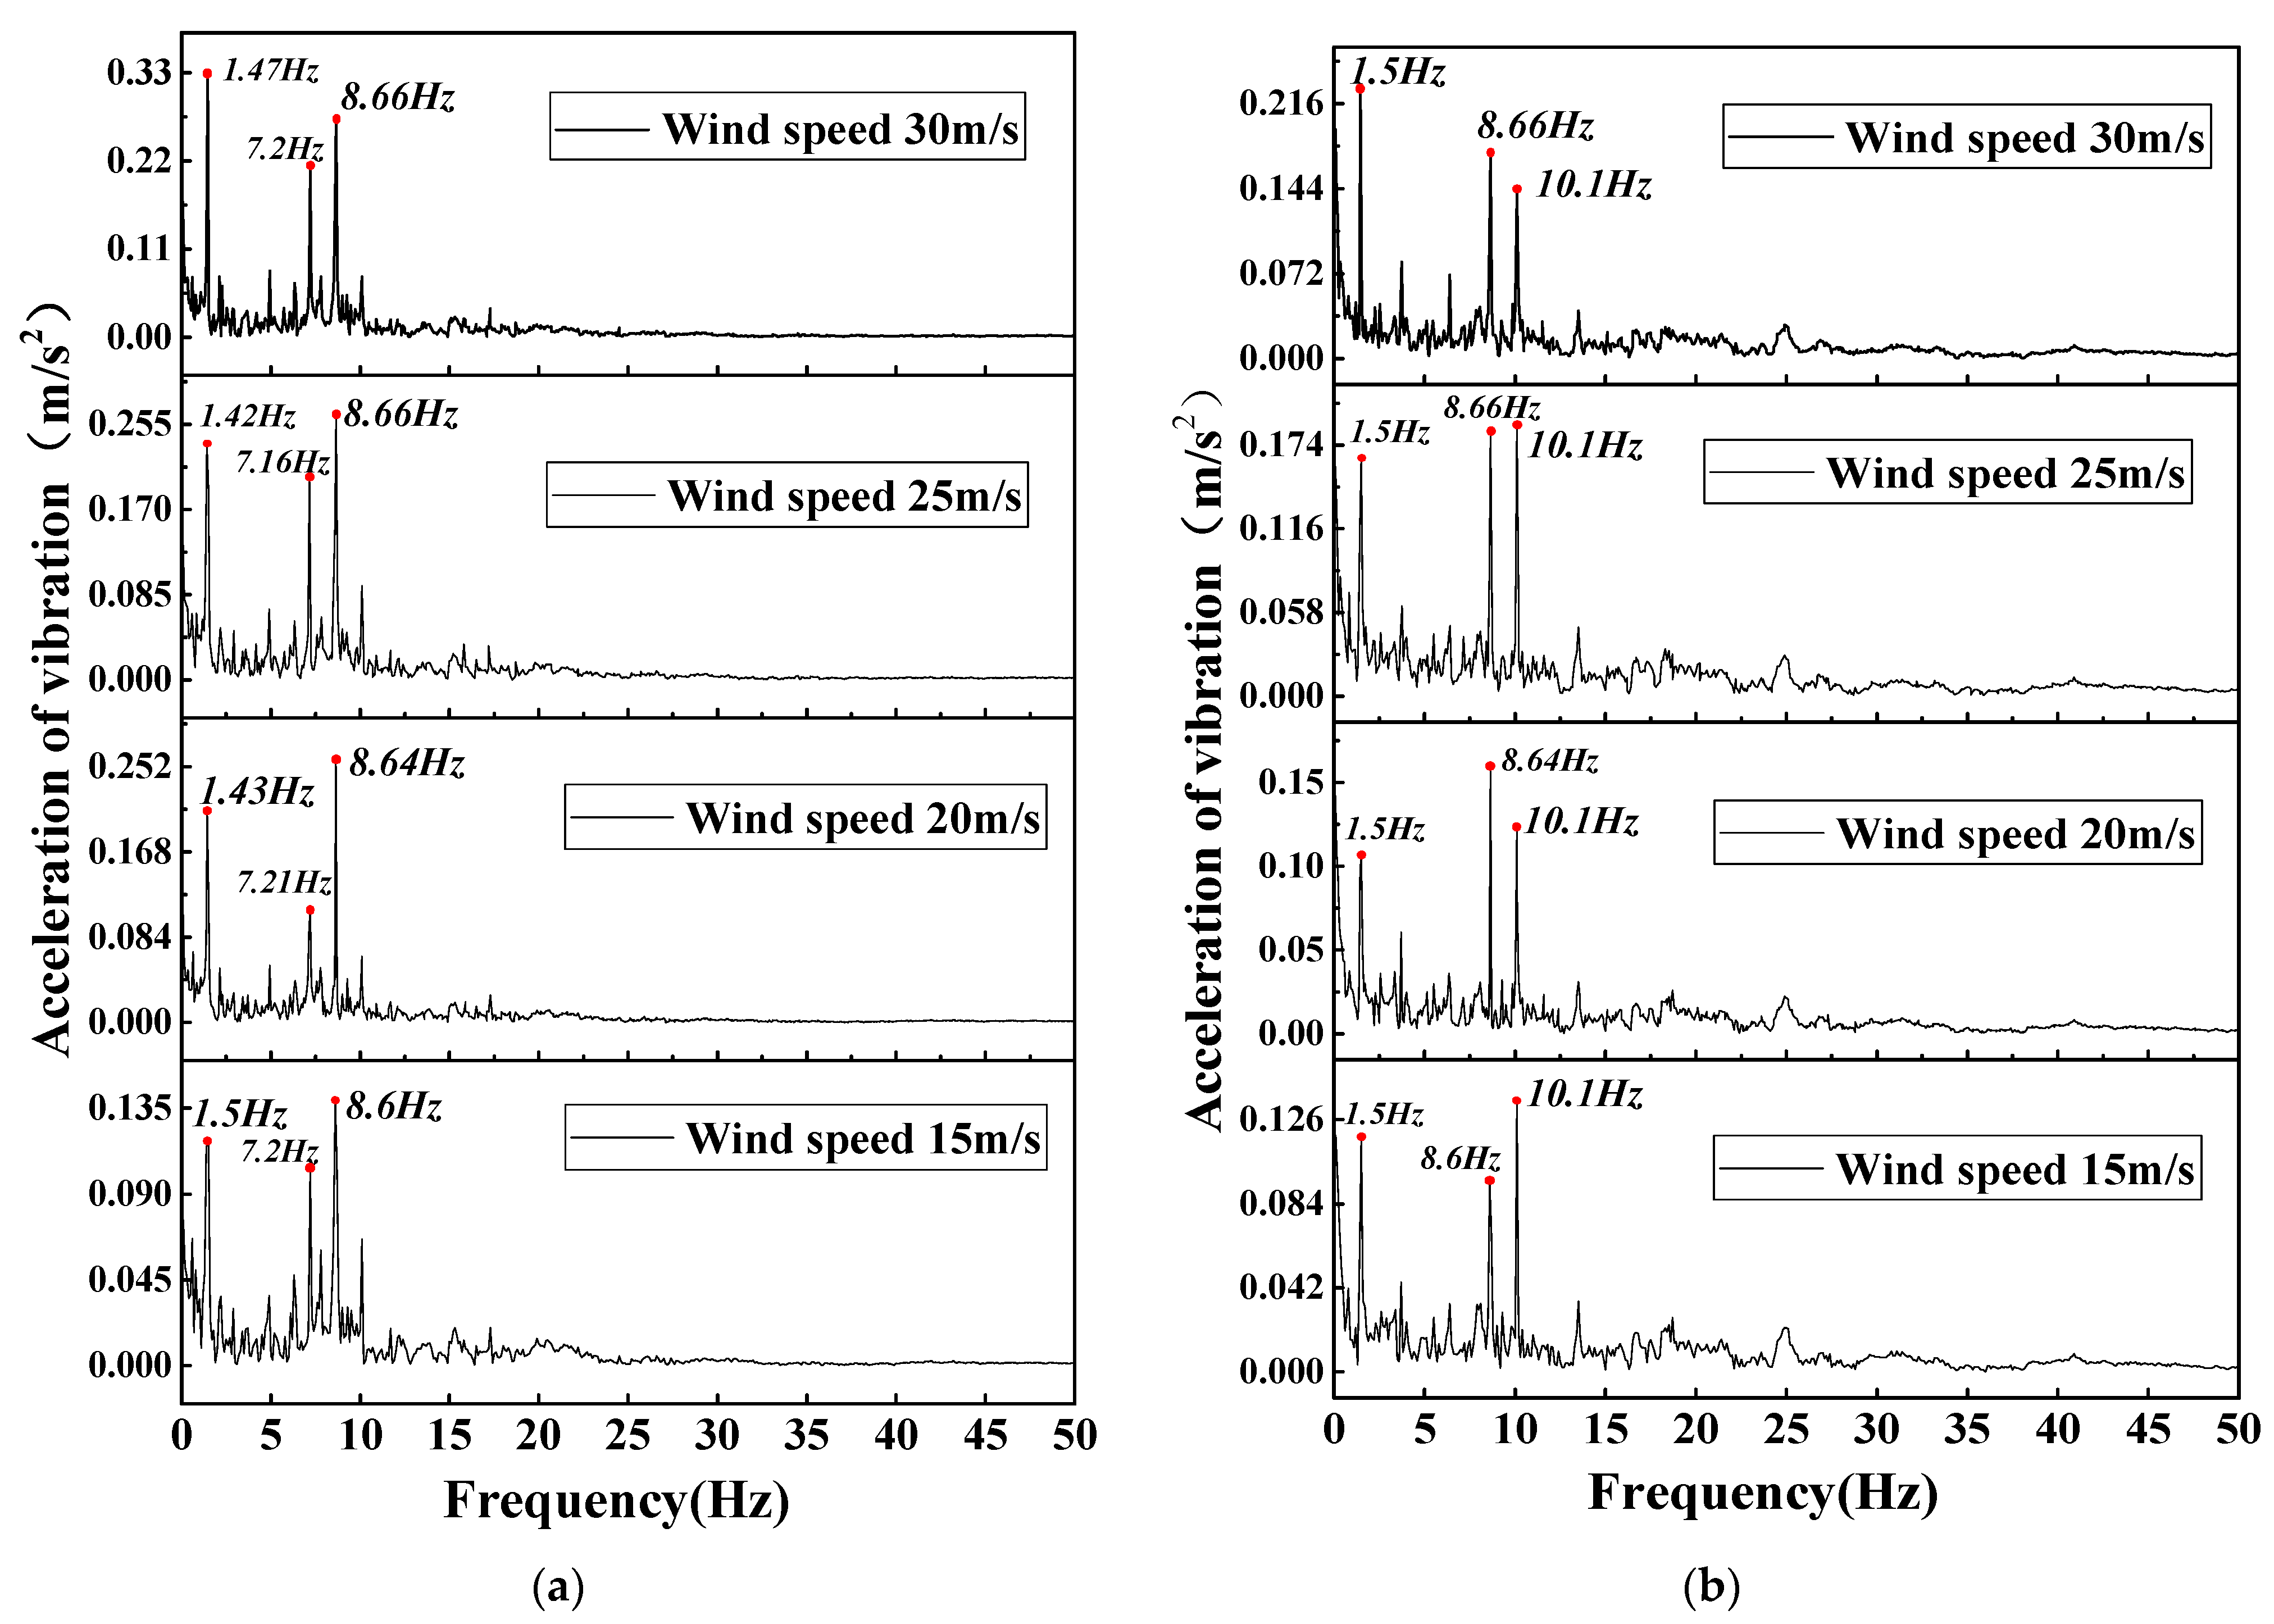
3.1.4. Wind-Induced Vibration Analysis of Guide Rail Frame Structure under Different Offshore Wind Conditions

Figure 16a illustrates that the vibration frequency remains relatively consistent across different wind speed conditions. The fundamental frequency of the track is close to the third-order natural frequency of 1.52 Hz, with significant vibration peaks at 7.2 Hz. Under wind speeds of 15 m/s, 20 m/s, and 25 m/s, the dominant vibration frequency is 8.6 Hz, which is close to the 26th-order natural frequency of 8.7 Hz. However, under a wind speed of 30 m/s, the dominant vibration frequency returns to 1.47 Hz, resembling the third-order natural frequency.
In Figure 16b, the vibration frequency of the pillar exhibits similar characteristics across different wind speed conditions. The fundamental frequency aligns closely with the third-order natural frequency, accompanied by vibration frequency components at 8.6 Hz and 10.1 Hz. At a wind speed of 15 m/s, the dominant vibration frequency attains 10.1 Hz. The dominant frequency of vibration is 8.64 Hz at 20 m/s, and at 25 m/s, the amplitude at 8.66 Hz is comparable to that at 10.1 Hz. Under a wind speed of 30 m/s, the dominant vibration frequency decreases to 1.5 Hz. The observed trend aligns with that of the track, where the amplitude tends to increase for lower frequencies as the wind speed increases.
Figure 17a illustrates the vibration displacement curves of the track in the frequency domain for various wind angles. The highest dominant vibration frequency is observed at a wind angle of 0° in all wind directions, and the dominant vibration frequency measures 3.6 Hz, closely resembling the seventh-order natural frequency of 3.611 Hz. At wind angles of 30° and 180°, a consistent dominant vibration frequency of 1.39 Hz is observed, which is close to the second-order natural frequency of 1.34 Hz. Similarly, for wind angles of 60° and 120°, the vibration characteristics exhibit similarities, featuring two main components at 1.49 Hz and 2.07 Hz, closely corresponding to the third-order natural frequency (1.52 Hz) and the fourth-order natural frequency (2.095 Hz), respectively. At wind angles of 90° and 150°, the dominant vibration frequencies are 1.69 Hz and 1.6 Hz, respectively.
Figure 17b displays the frequency domain curve of vibration displacement of the pillar for various wind angles. The dominant frequency of the pillar’s vibration remains consistent across different wind angles, ranging from 1.2 Hz to 1.39 Hz. These frequencies closely match the first-order natural frequency of 1.234 Hz and the second-order natural frequency of 1.34 Hz. The highest dominant frequency occurs at a wind angle of 180°, with the smallest vibration displacement of the dominant frequency (1.39 Hz, 0.72 mm) at this angle. Conversely, the lowest dominant frequency is observed at a wind angle of 120°, with the largest vibration amplitude (1.2 Hz, 1.5 mm) at this angle.
The frequency domain results above reveal the distinct vibration characteristics of the track and pillar structures in response to various wind angles. Specifically, the track structure exhibits the highest vibration frequency and amplitude when subjected to a wind direction of 0°. Conversely, the pillar structure displays the highest vibration frequency but the smallest amplitude at a wind angle of 180°, and the lowest vibration frequency with the maximum amplitude at a wind angle of 120°. Notably, these observed vibration frequencies closely align with the seventh-order, second-order, and first-order natural frequencies of the frame structure.
Figure 18 illustrates the time domain vibration amplitudes under various wind directions. Figure 18a illustrates the distribution of vibration amplitudes at different horizontal positions of the track, while Figure 18b depicts the distribution of vibration amplitudes at various vertical positions of the pillar. The track structure exhibits the greatest displacement amplitudes at wind angles of 0° and 120°. Specifically, the left track(Track L)exhibits the highest displacement amplitude at a wind angle of 0°, while the rear track (Track B) demonstrates its highest displacement amplitude at a wind angle of 120°. Track F consistently exhibits the smallest displacement amplitude across all wind directions, followed by track R. As shown in the Figure 18b, the vibration displacement amplitude of the pillar increases with the pillar height in each wind direction. Consistent with the track structure, the largest vibration displacement amplitude occurs at wind angles of 0° and 120°.

4. Conclusions

This study focused on investigating the wind-induced vibration of a typical frame structure on the open deck of a cruise ship. Firstly, the fluid–structure interaction numerical method was explored and verified based on wind tunnel tests. Then, the subdomain method was employed to extract the initial wind field based on the ship’s overall wind environment calculation. Finally, the wind-induced vibration of the guide rail frame structure on the open deck was analyzed. The conclusions are as follows:
(1)
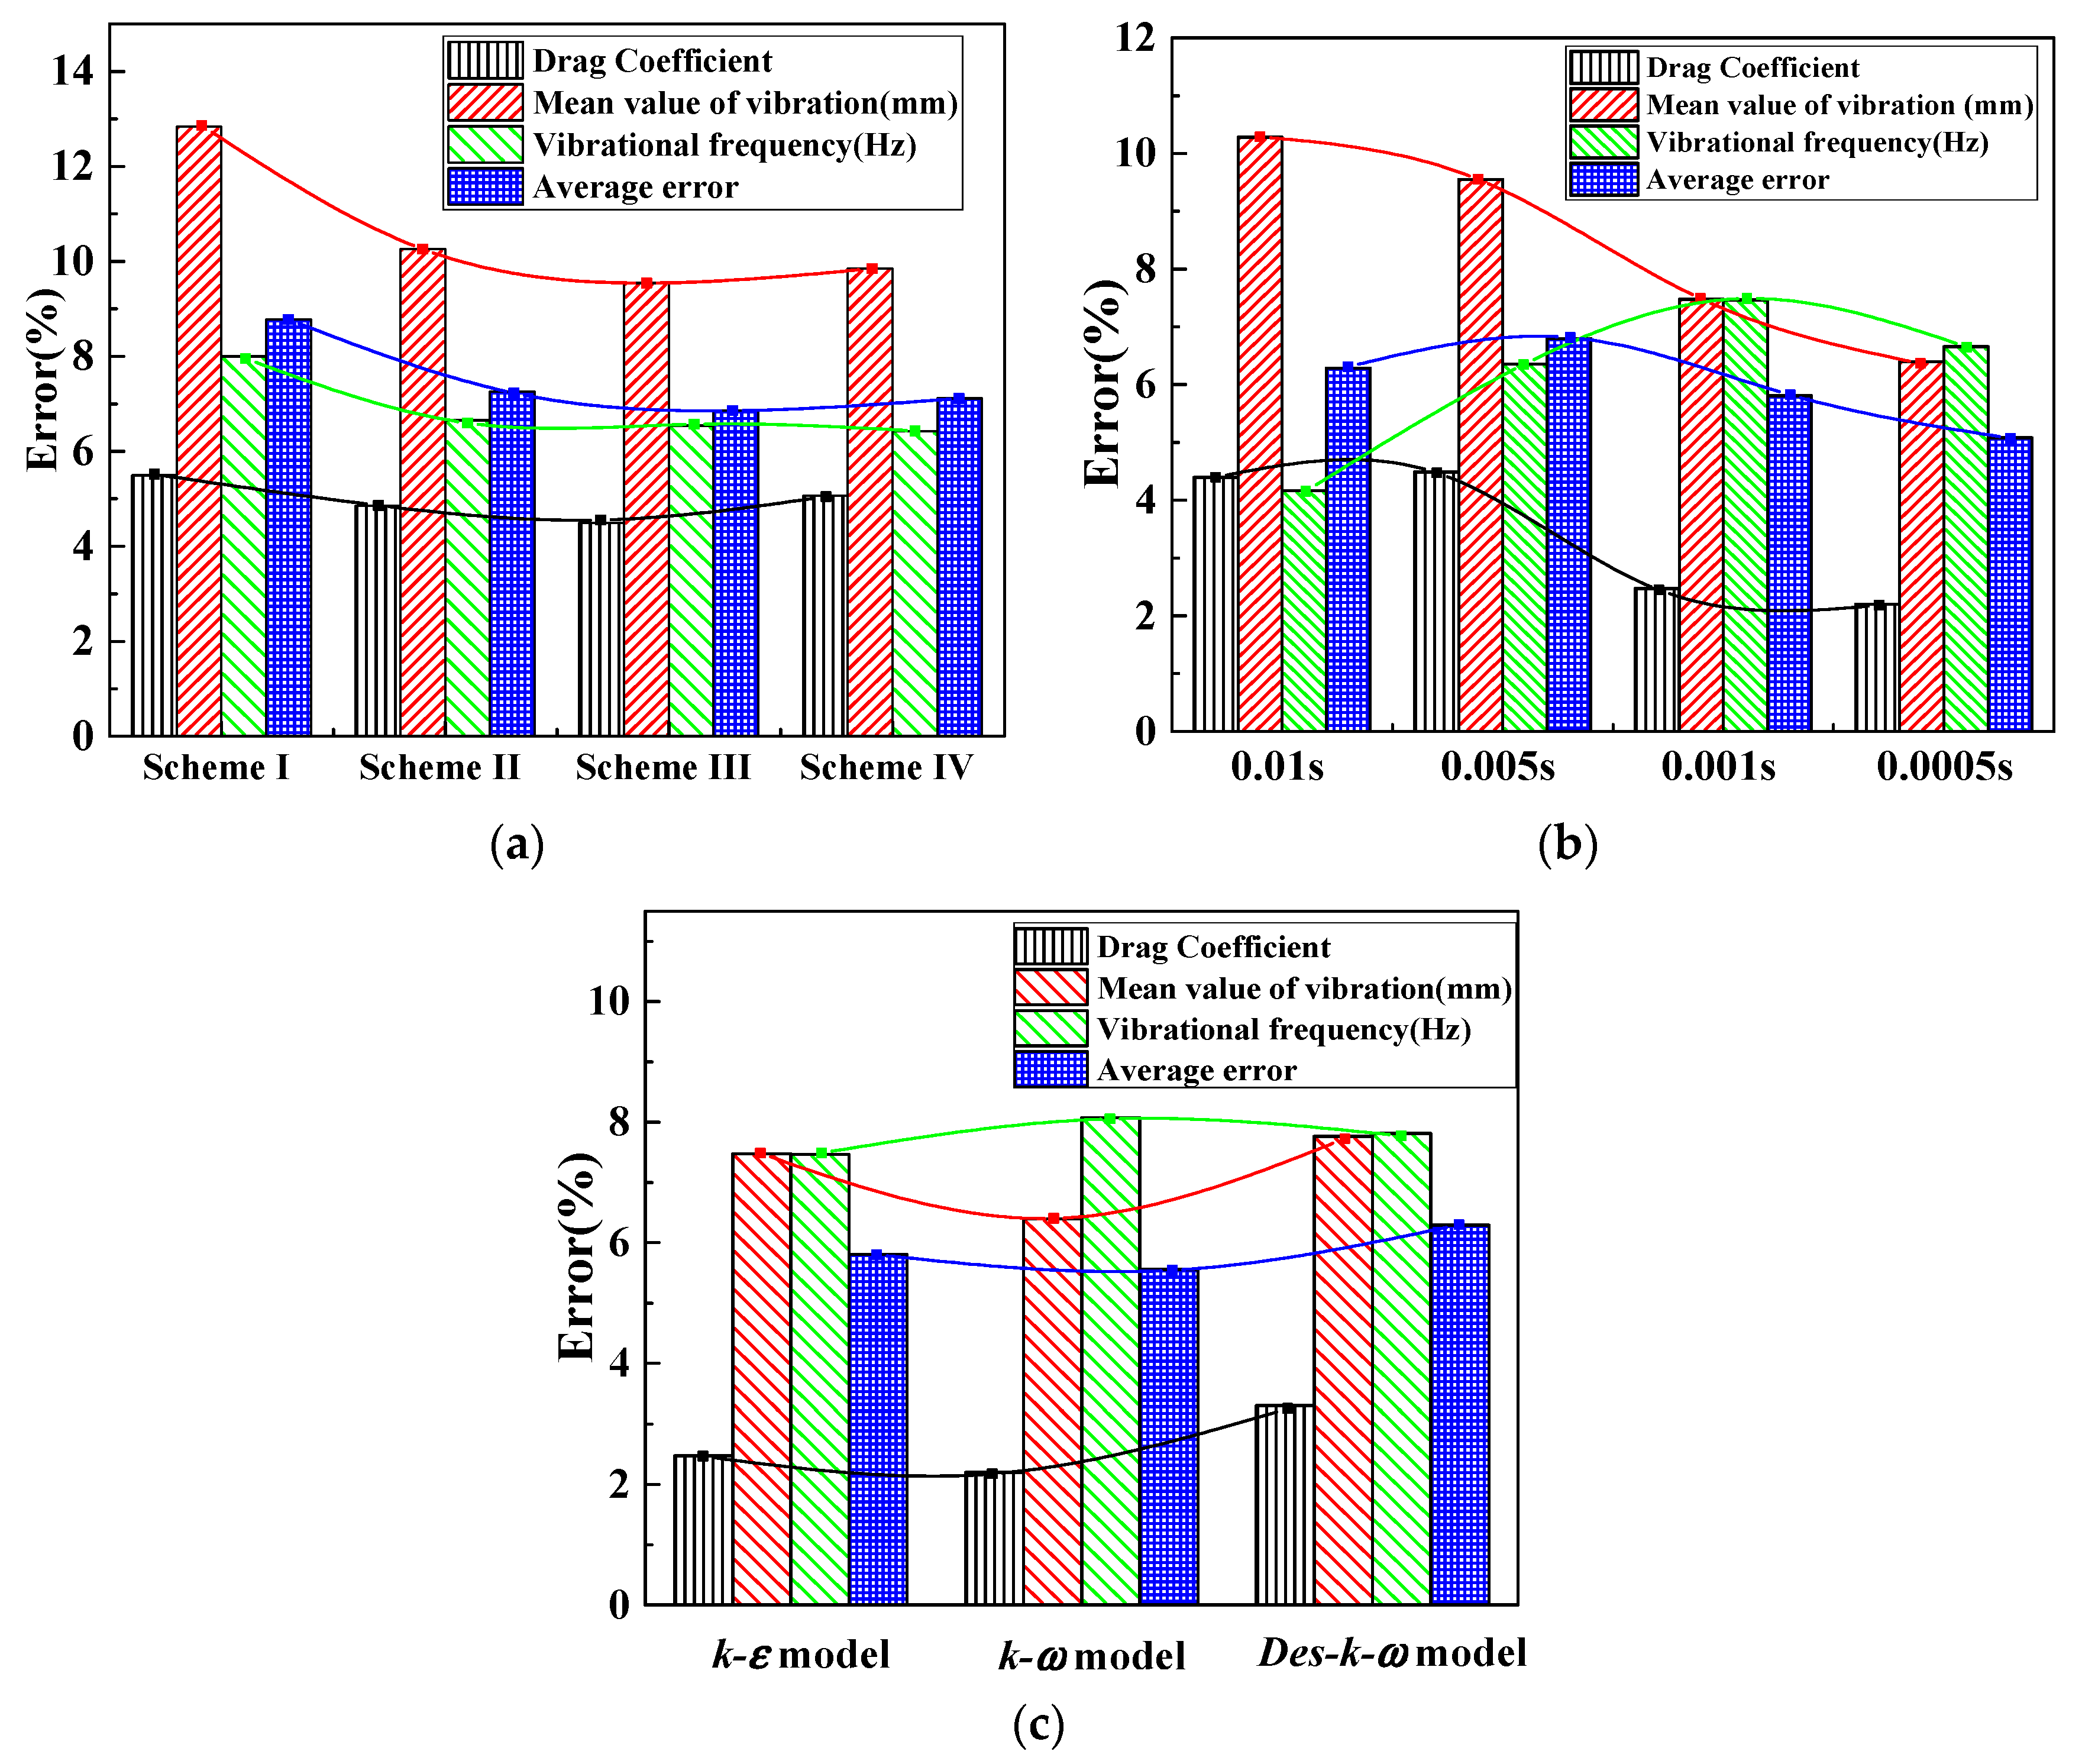
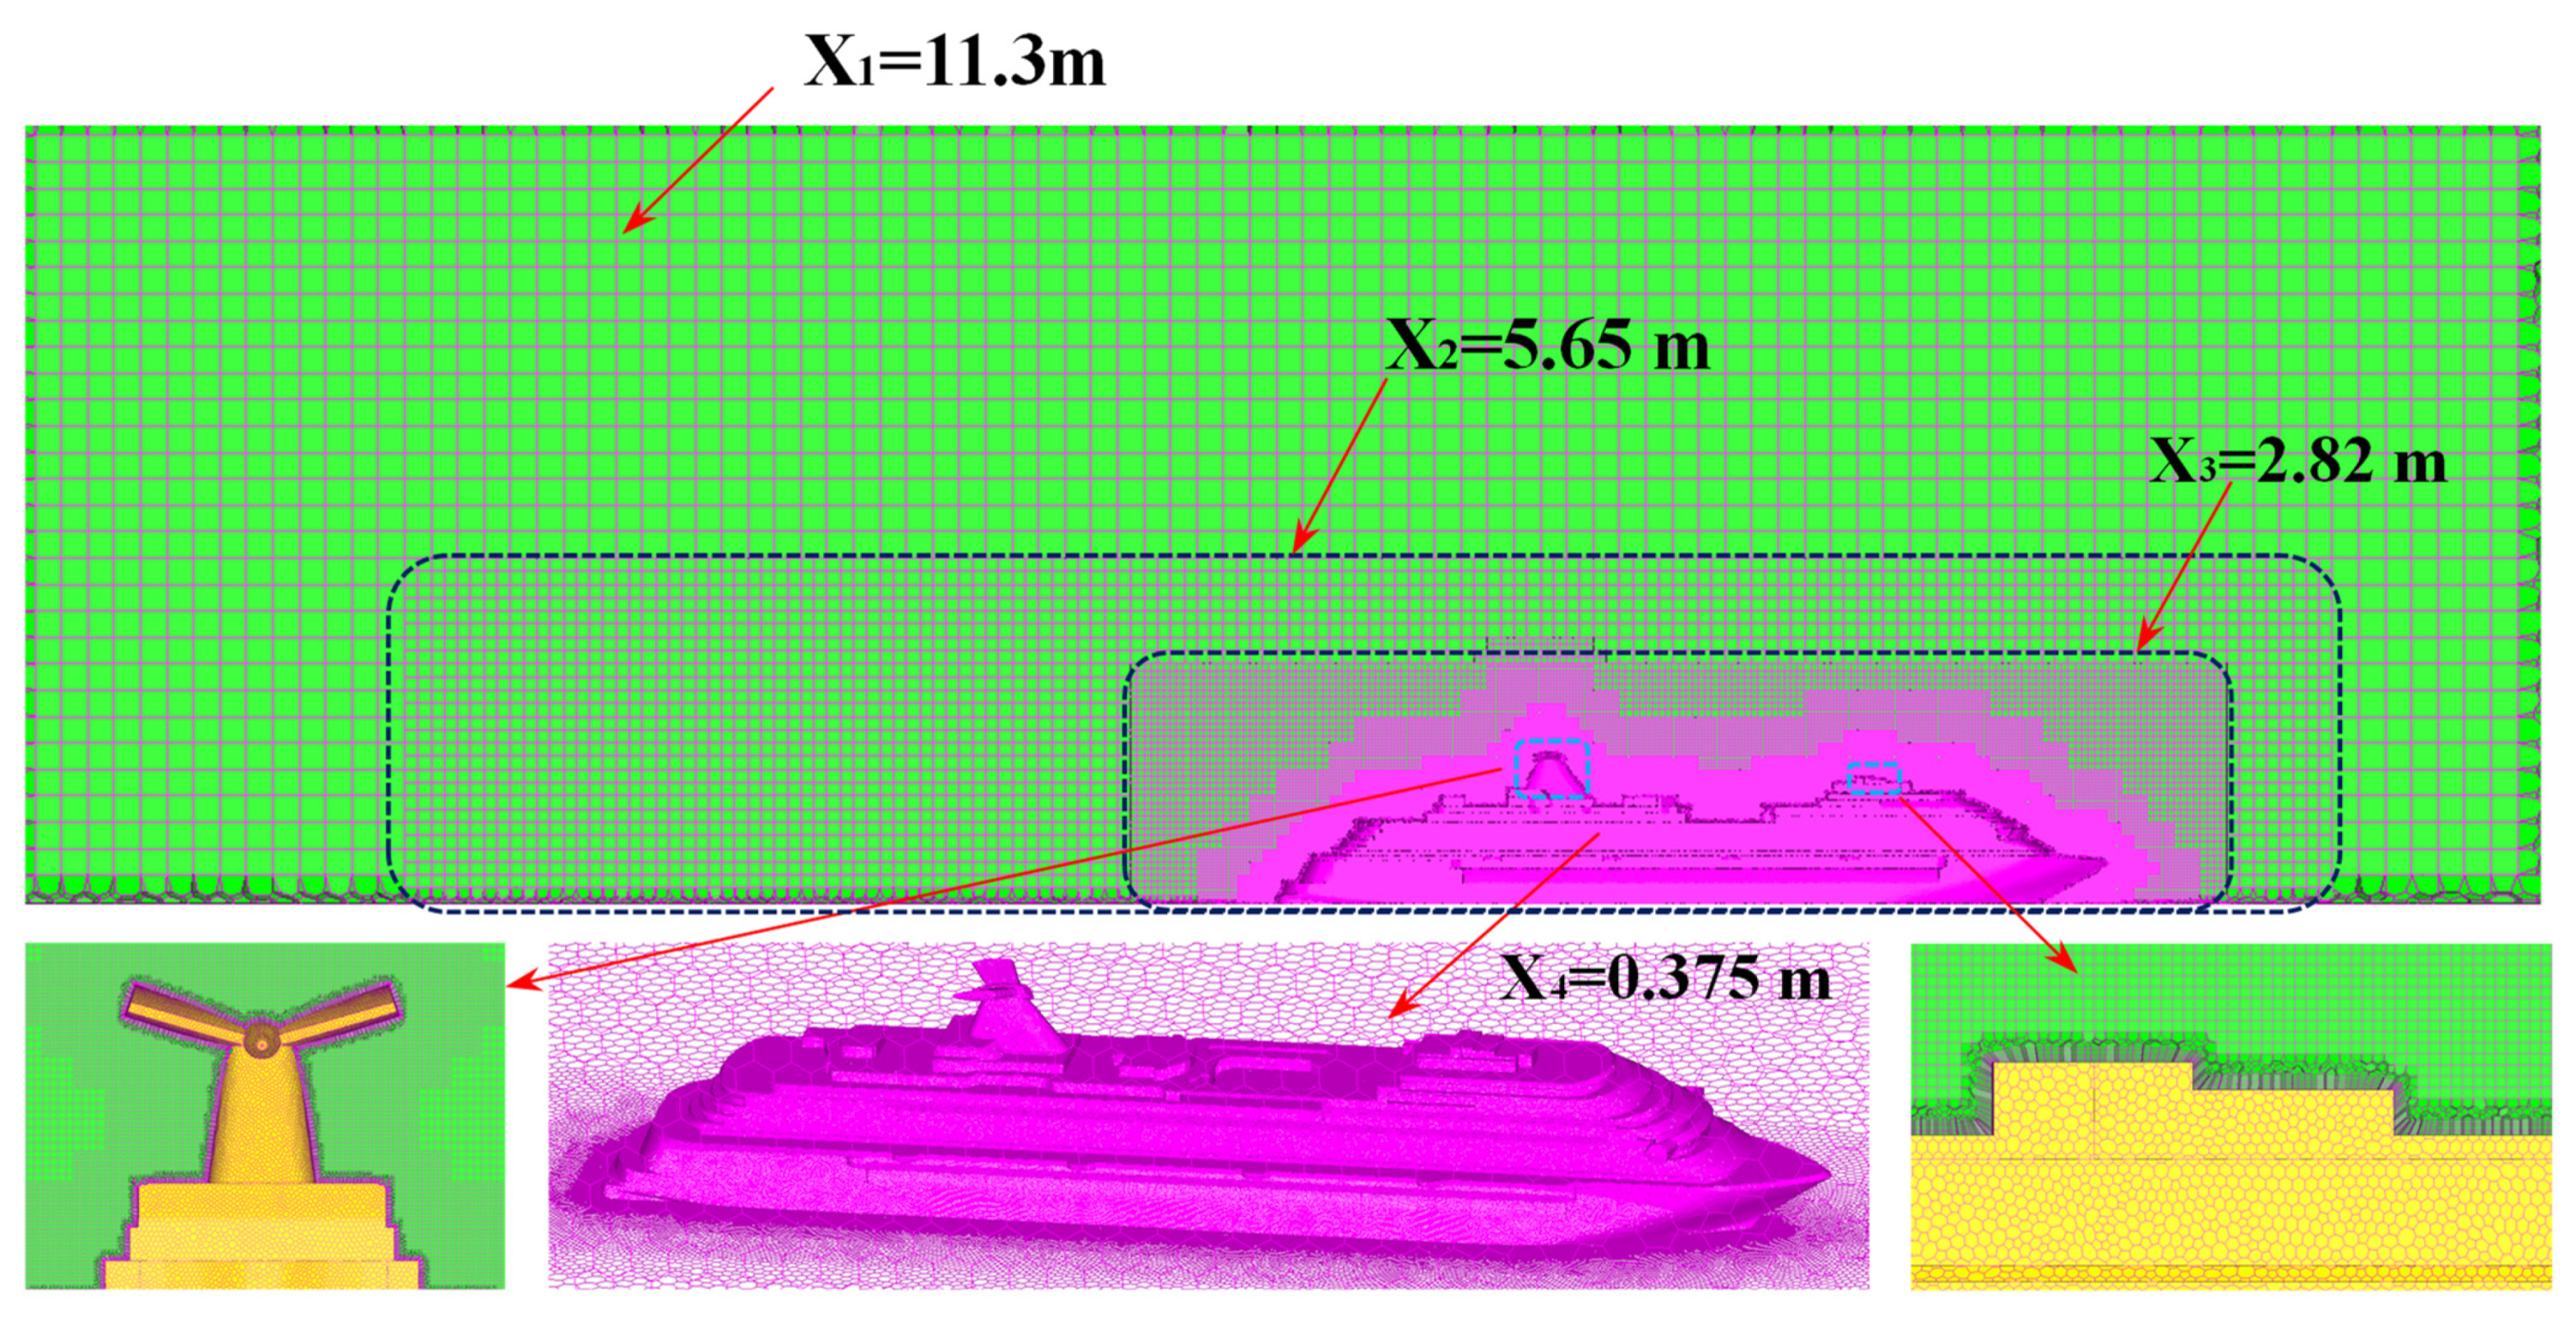
Based on the comparison with experimental data, it was determined that mesh refinement scheme III exhibited the smallest error. Moreover, the turbulence model was discussed, and it was found that the error of simulation calculation of the SST k-ω model is minimal.
(2)
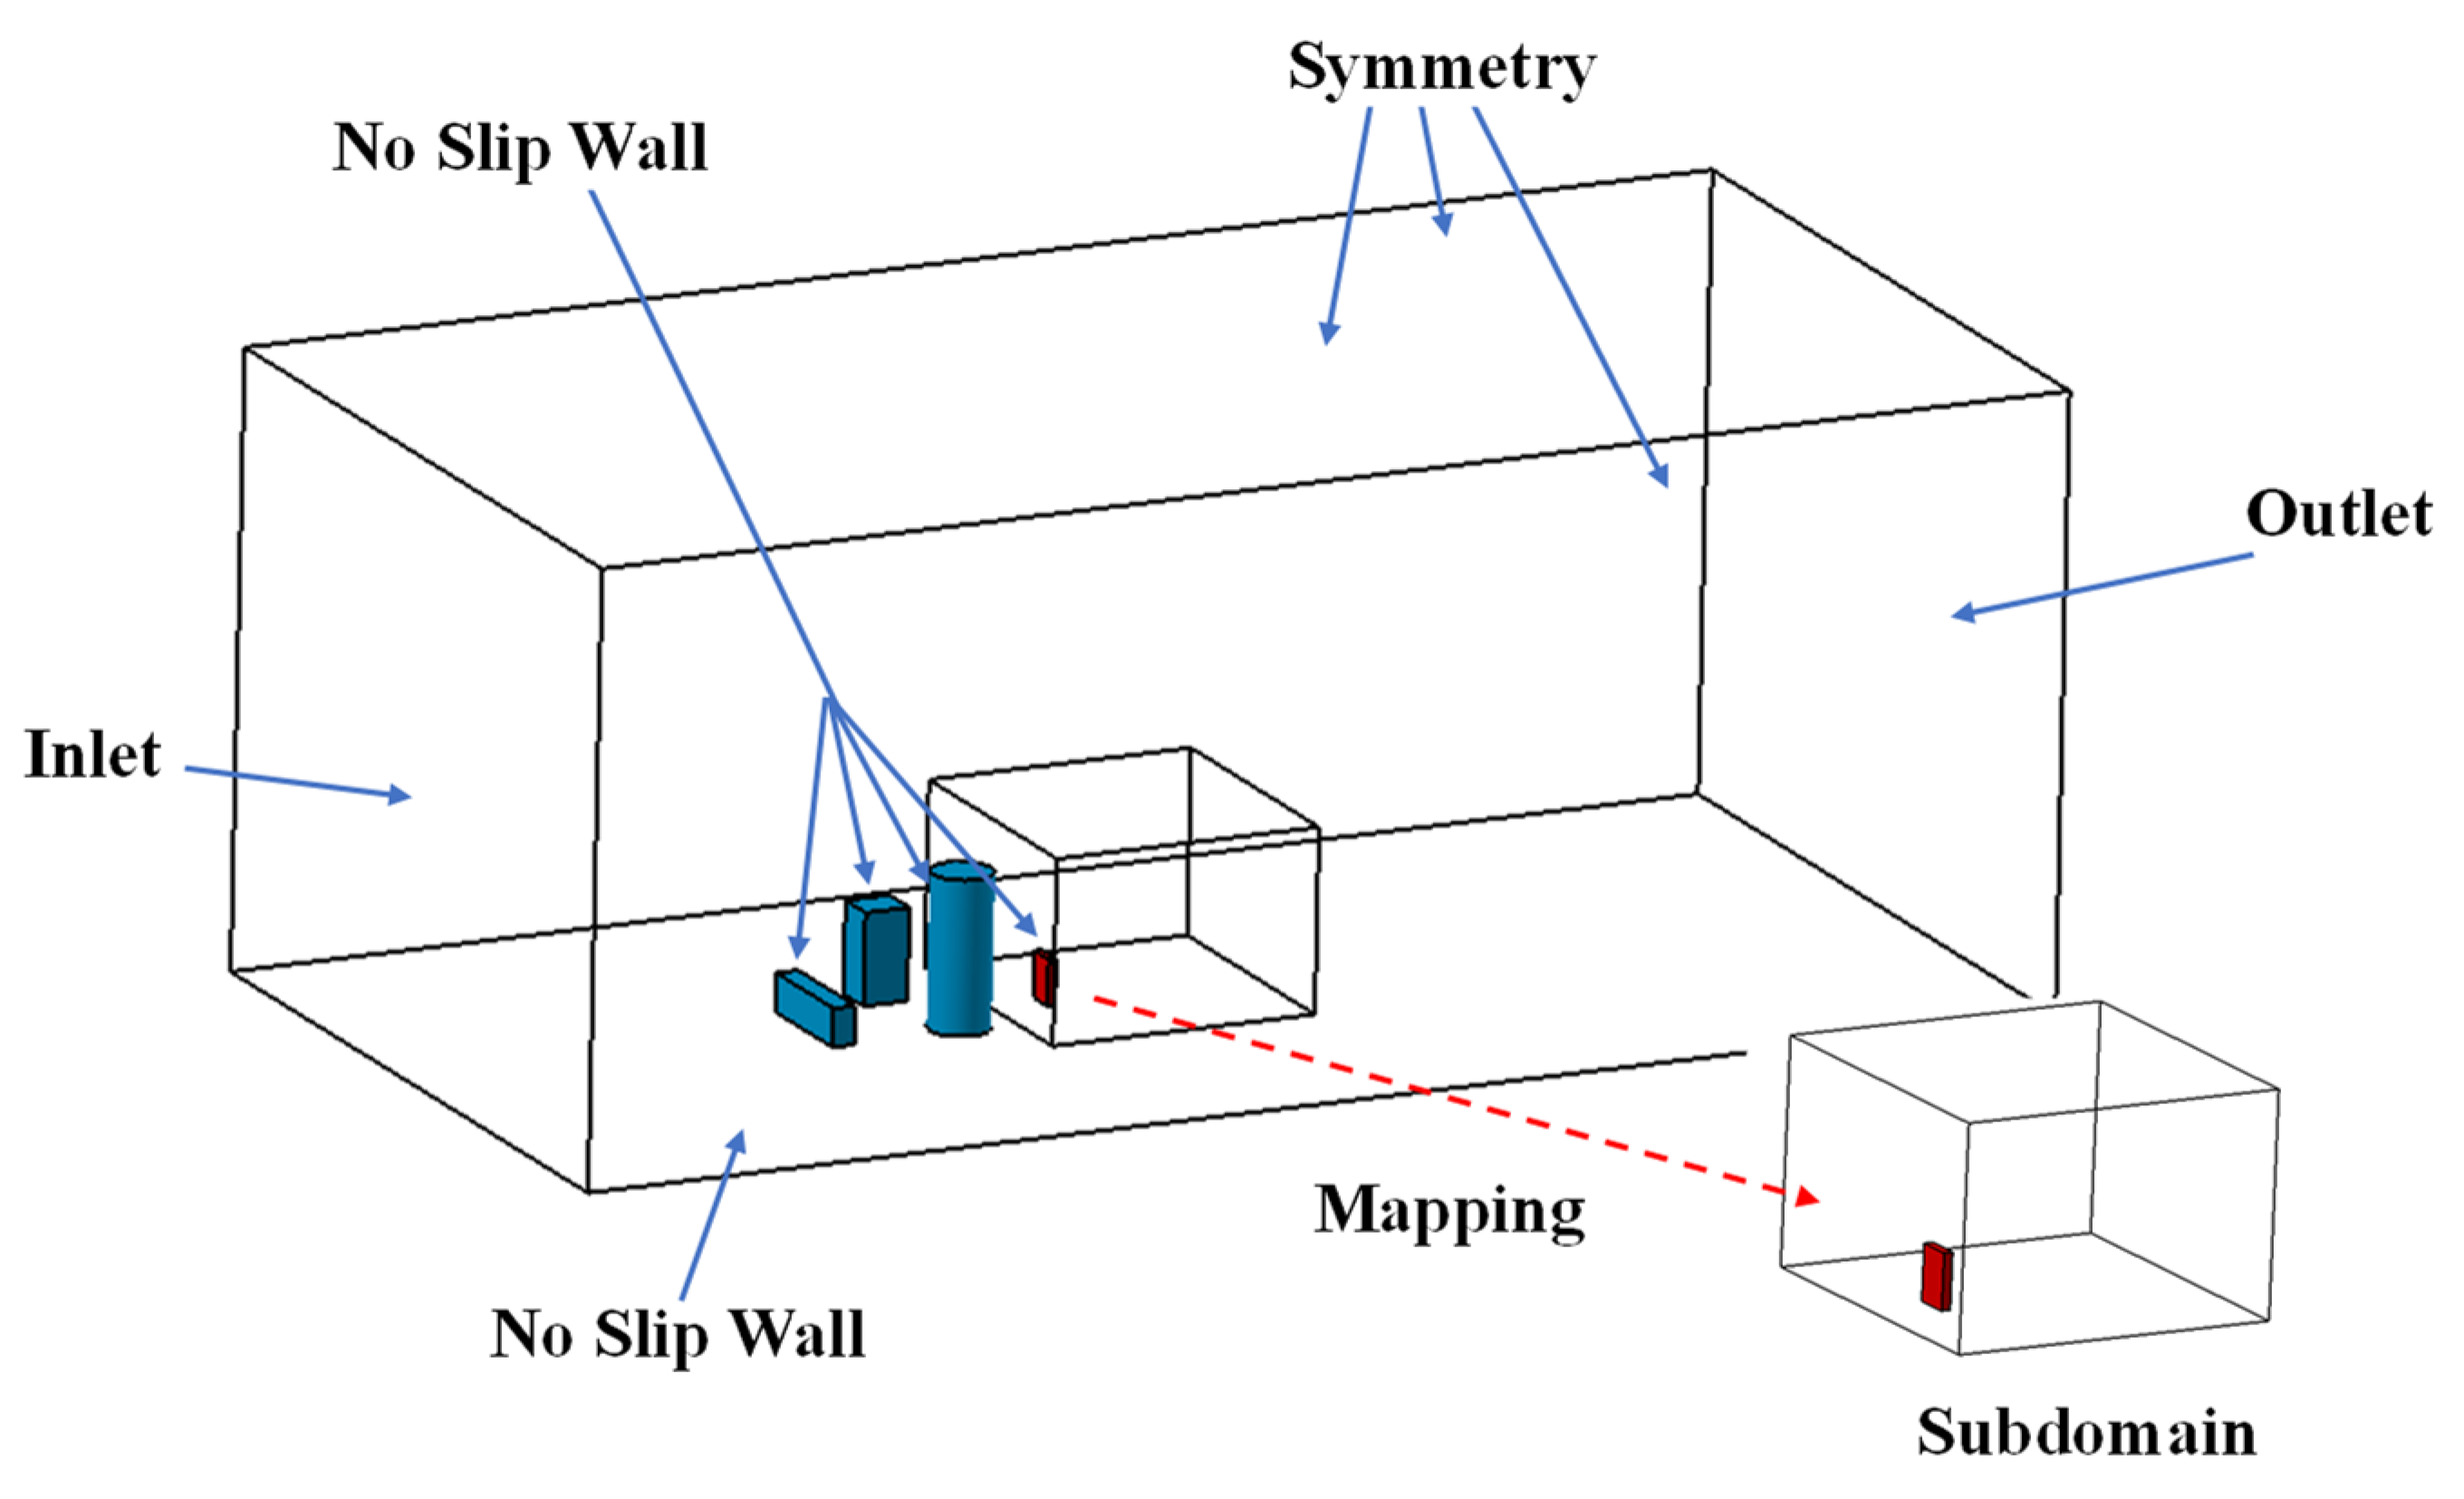
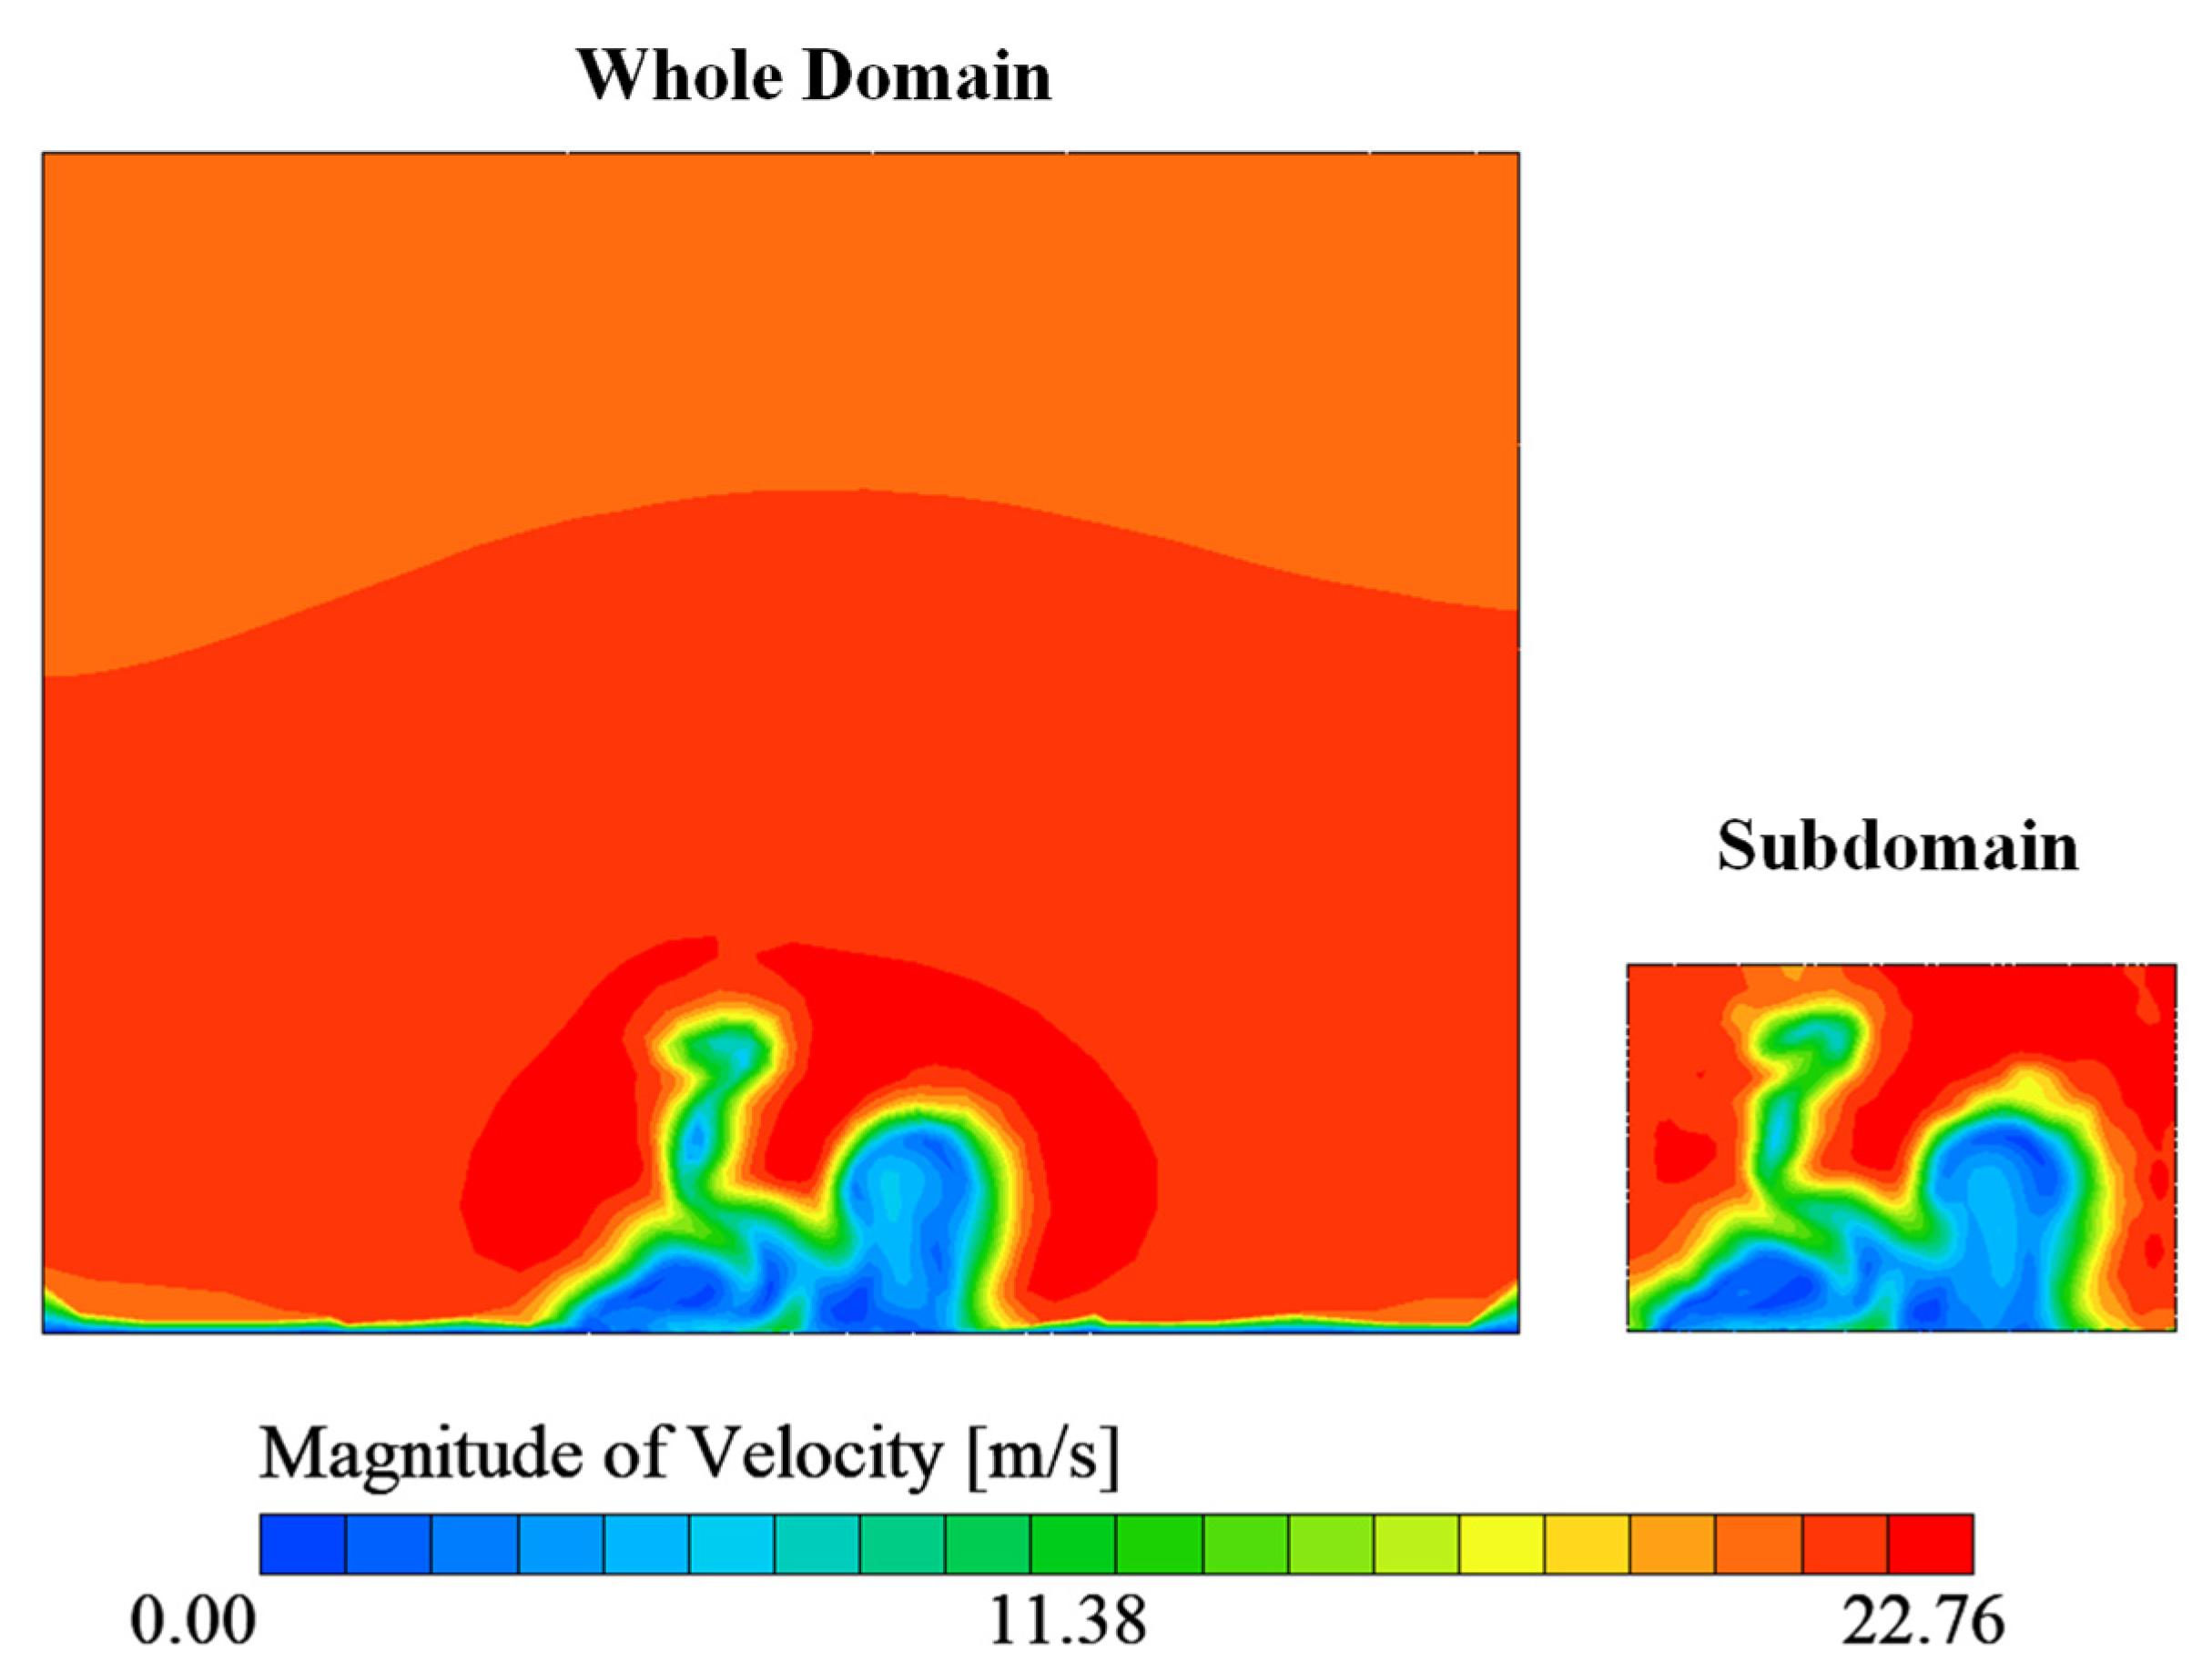
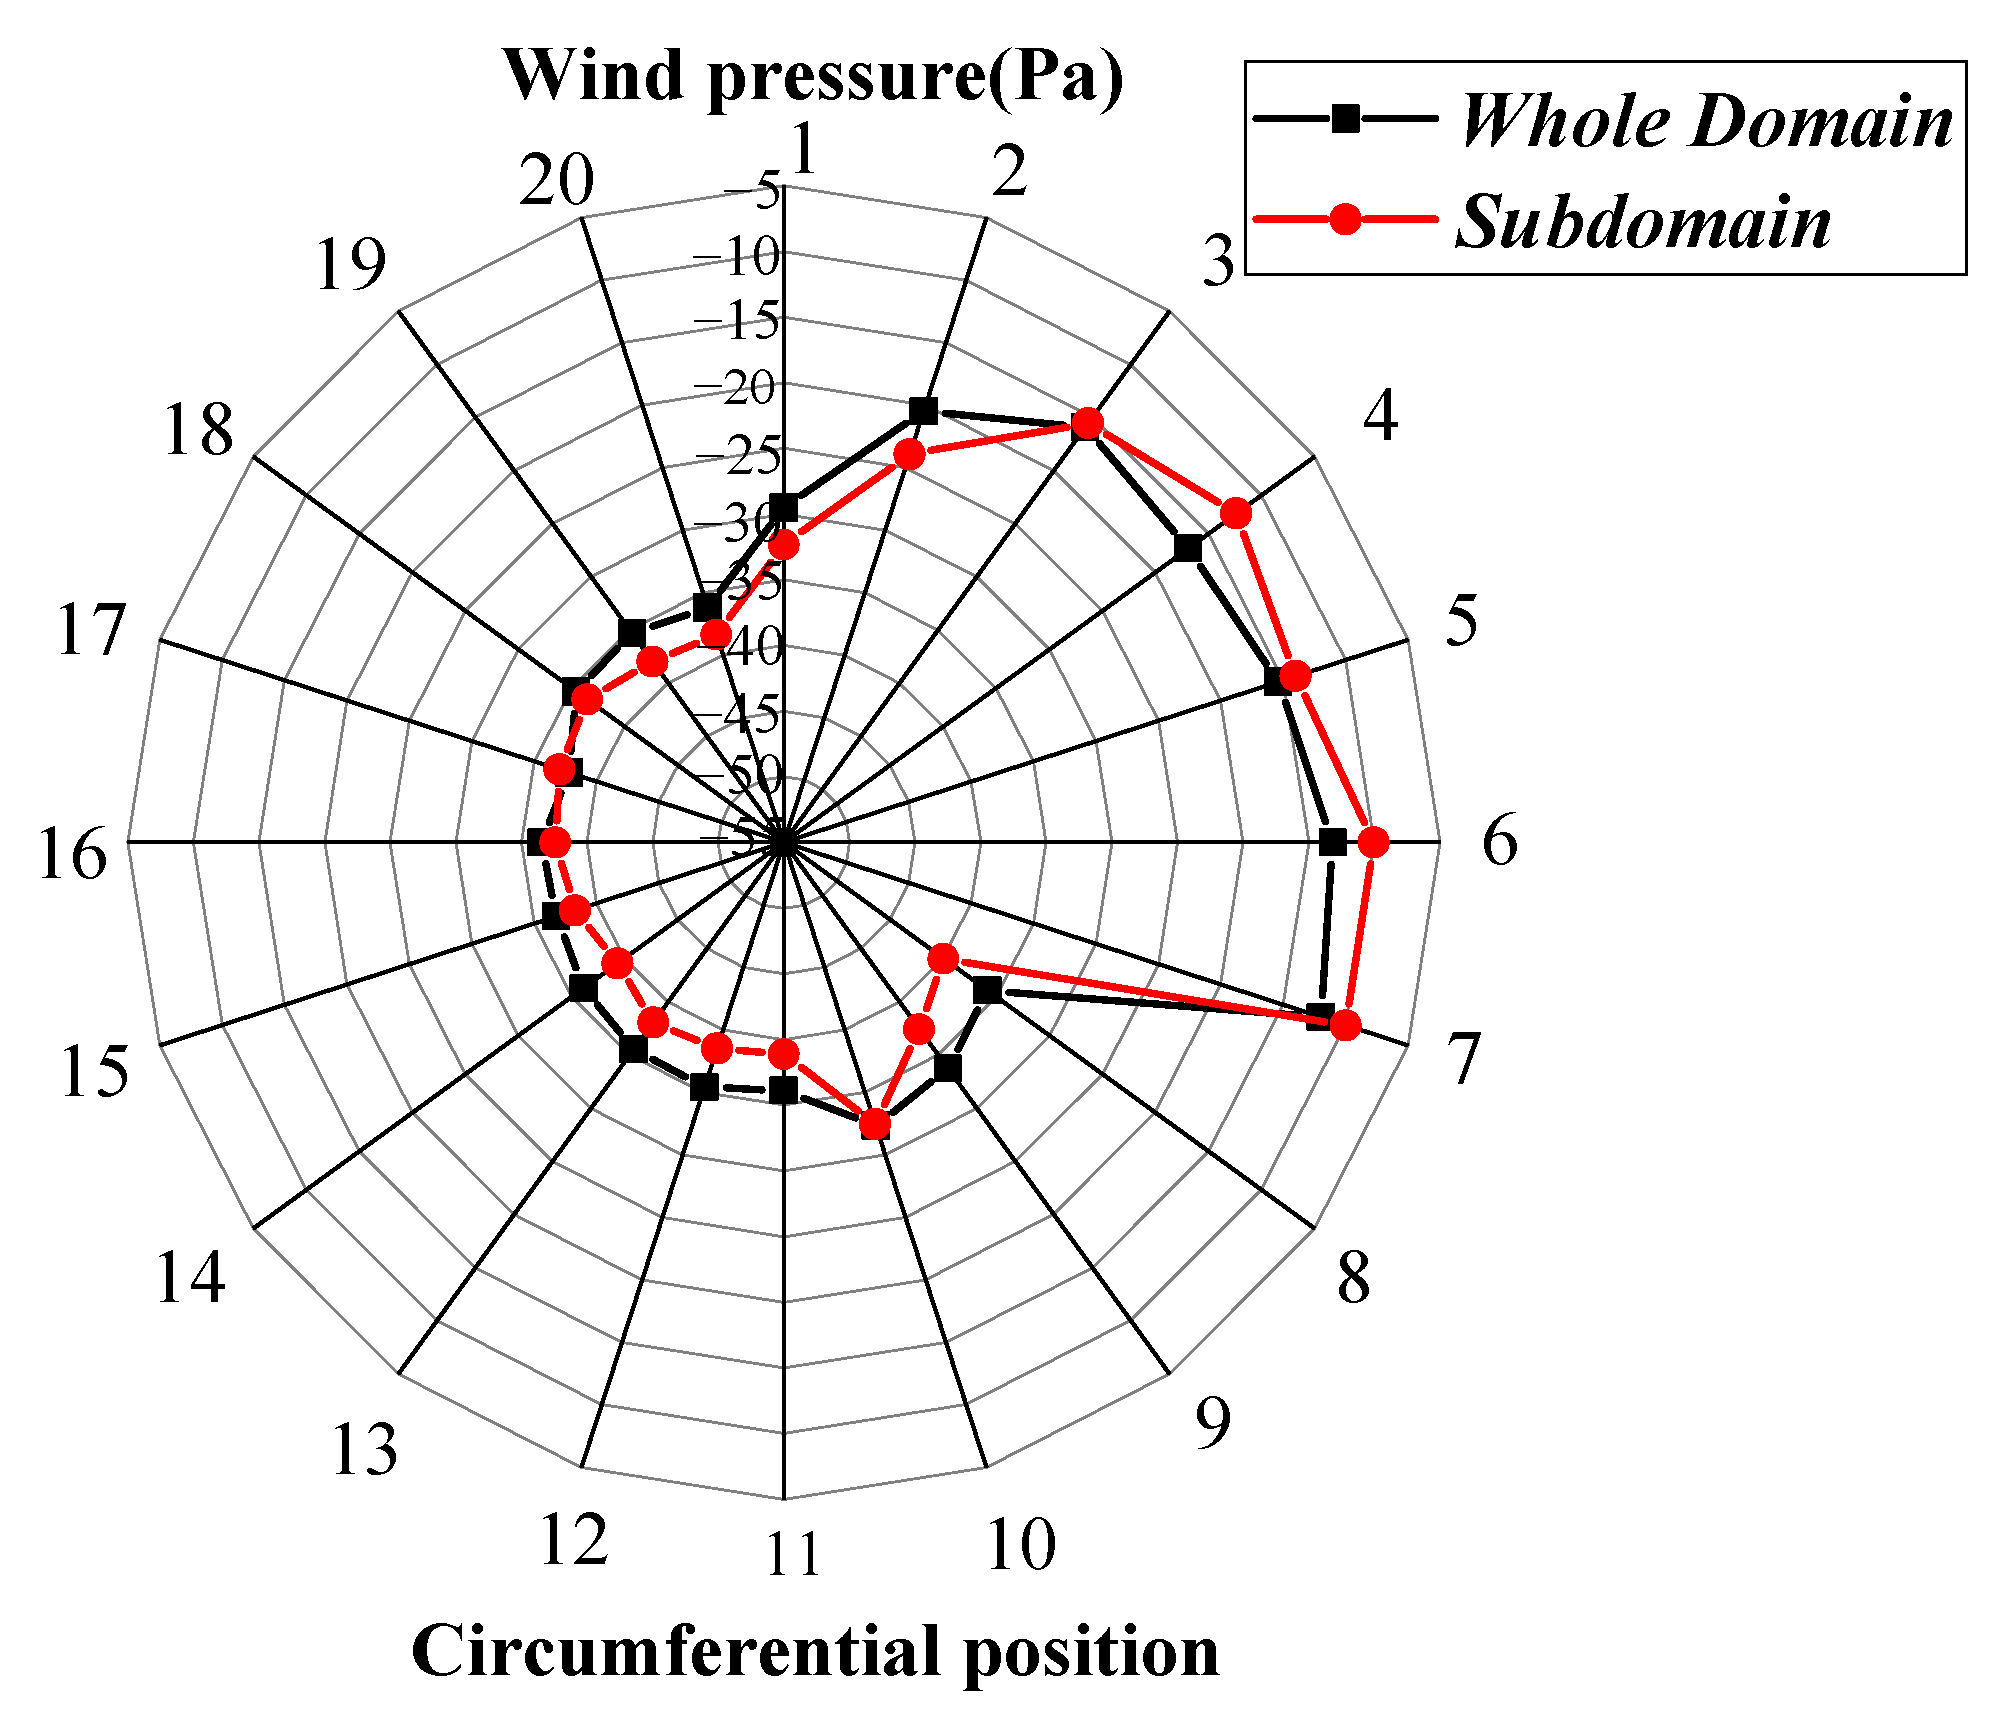
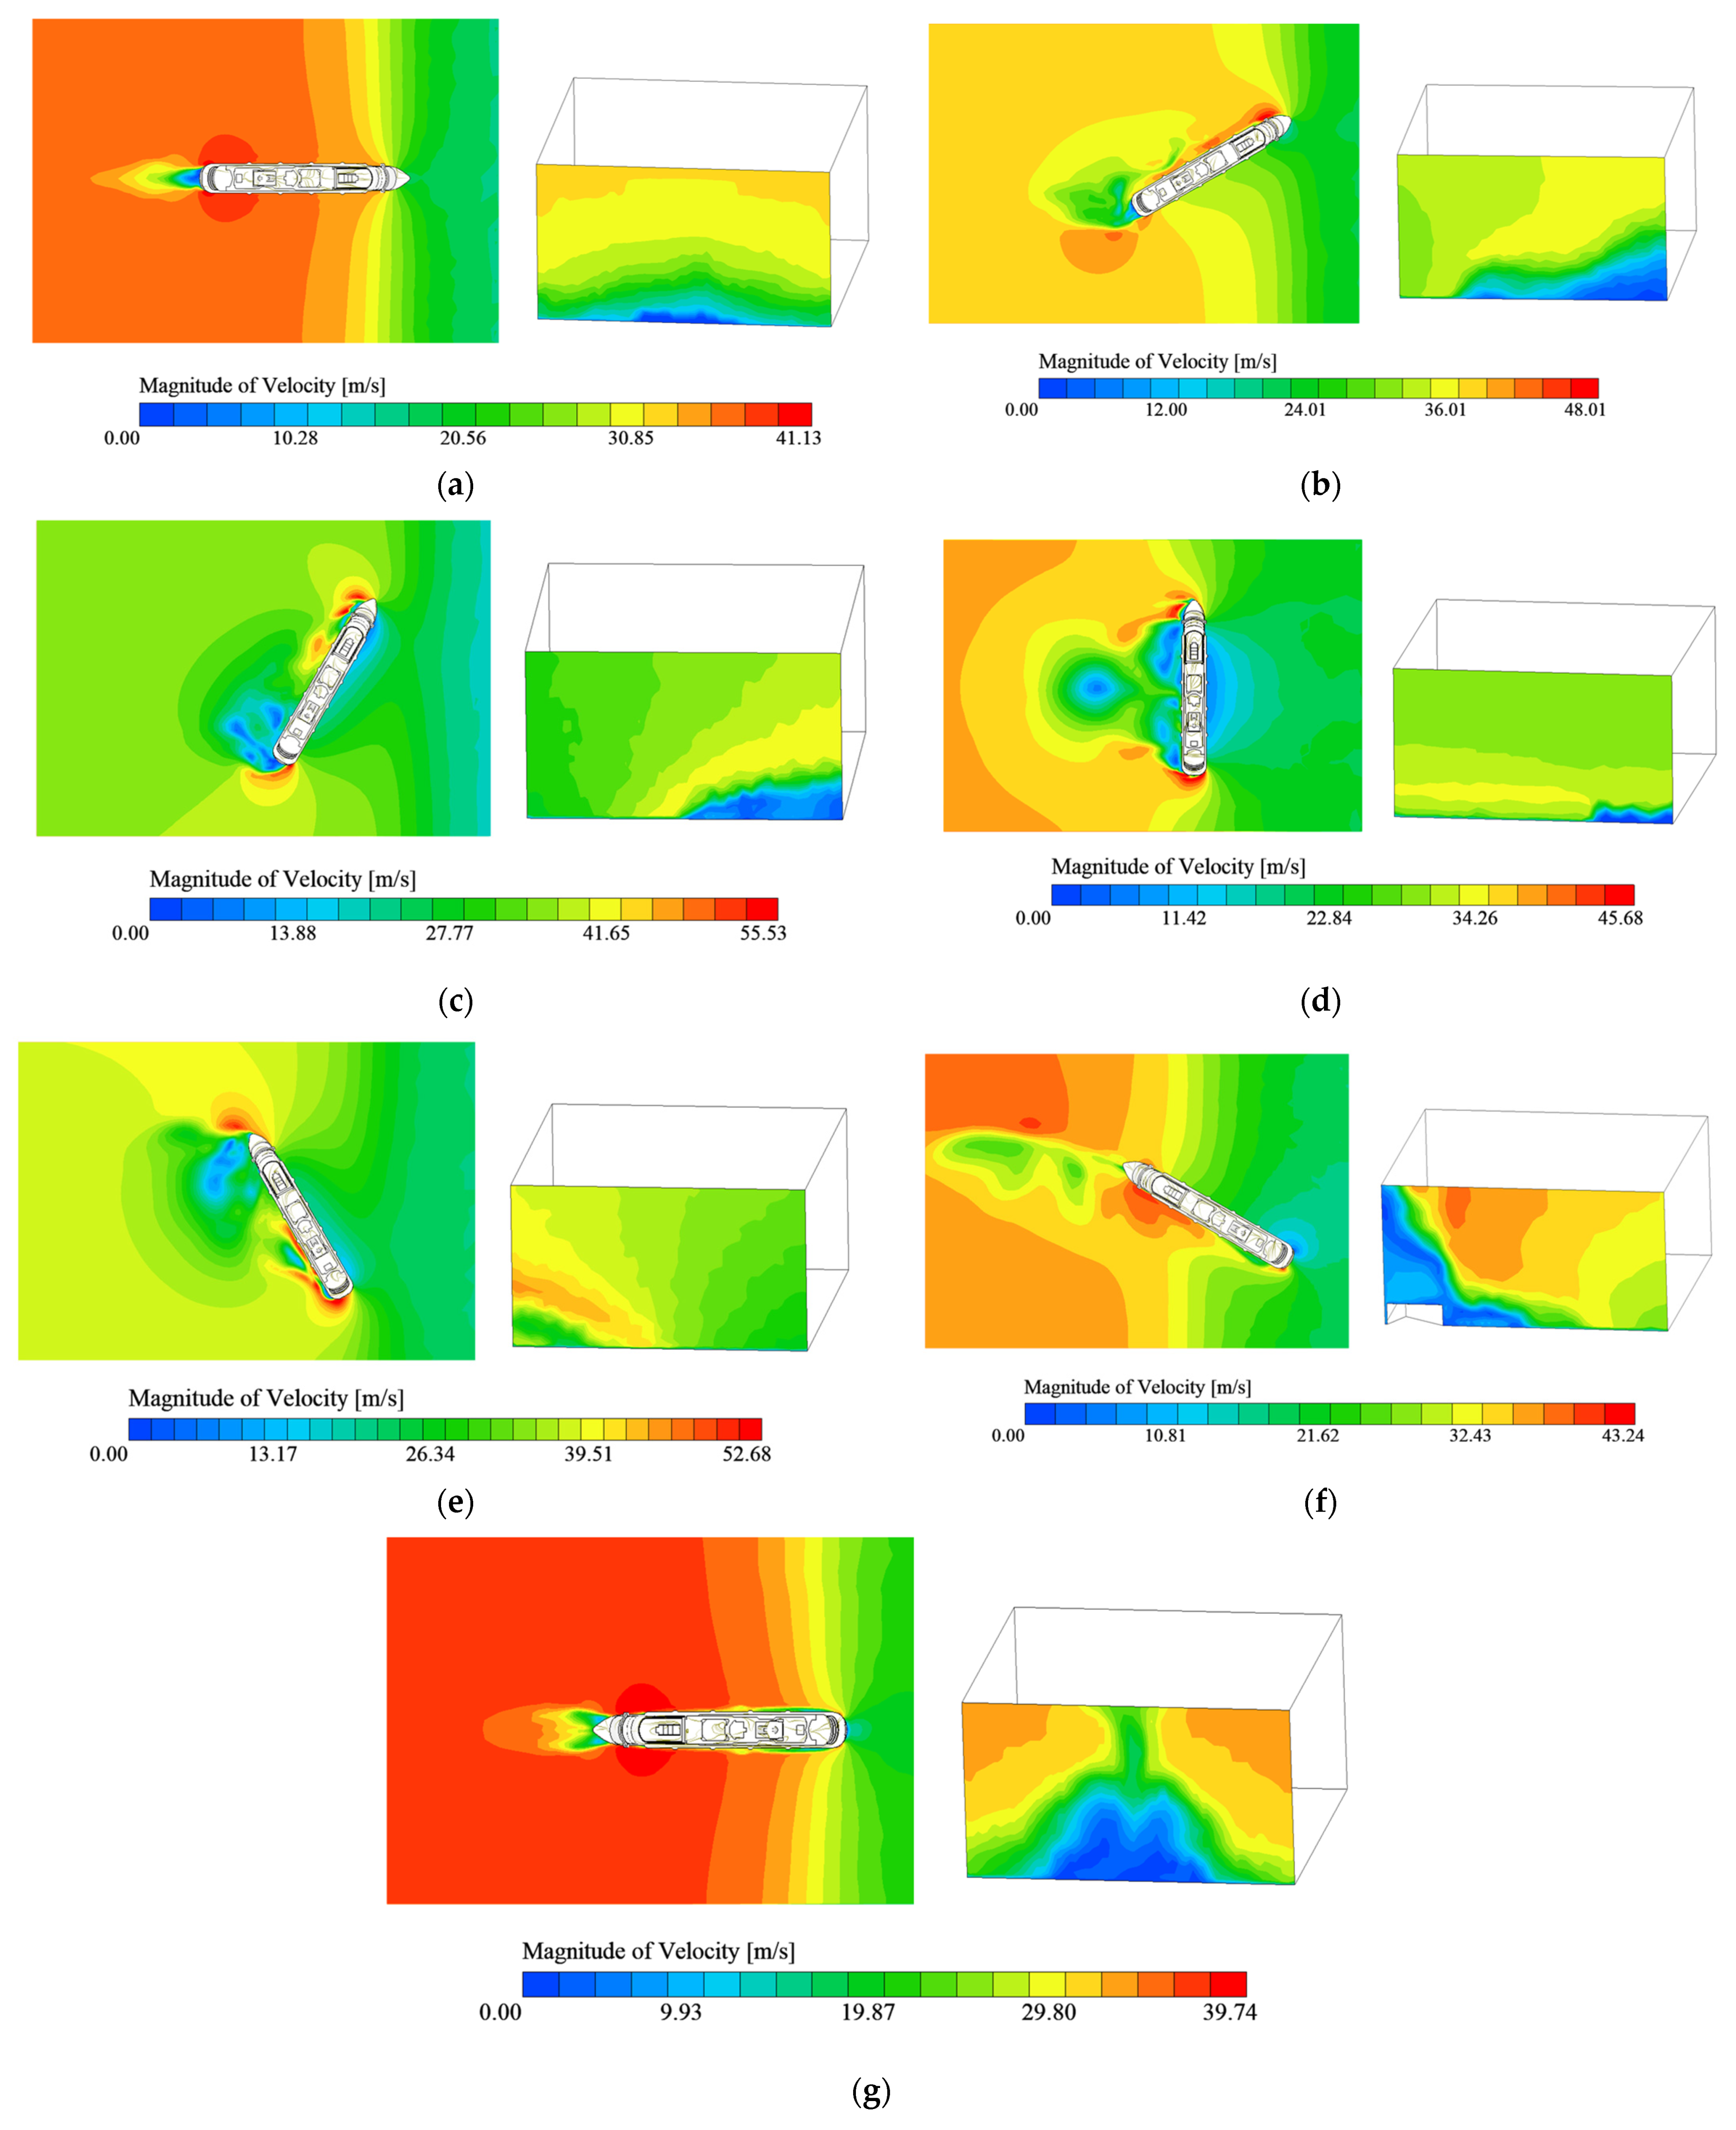
It was verified that the subdomain method has good applicability and accuracy. The wind field input and distribution in the open entertainment area will be directly influenced by the wake generated from the flow separation in the front area and the diversion of airflow around the ship’s sides. Notably, the entire ship’s CFD results have a significant impact on the subdomain’s wind input, and the wind field input varied significantly under different wind directions.
(3)
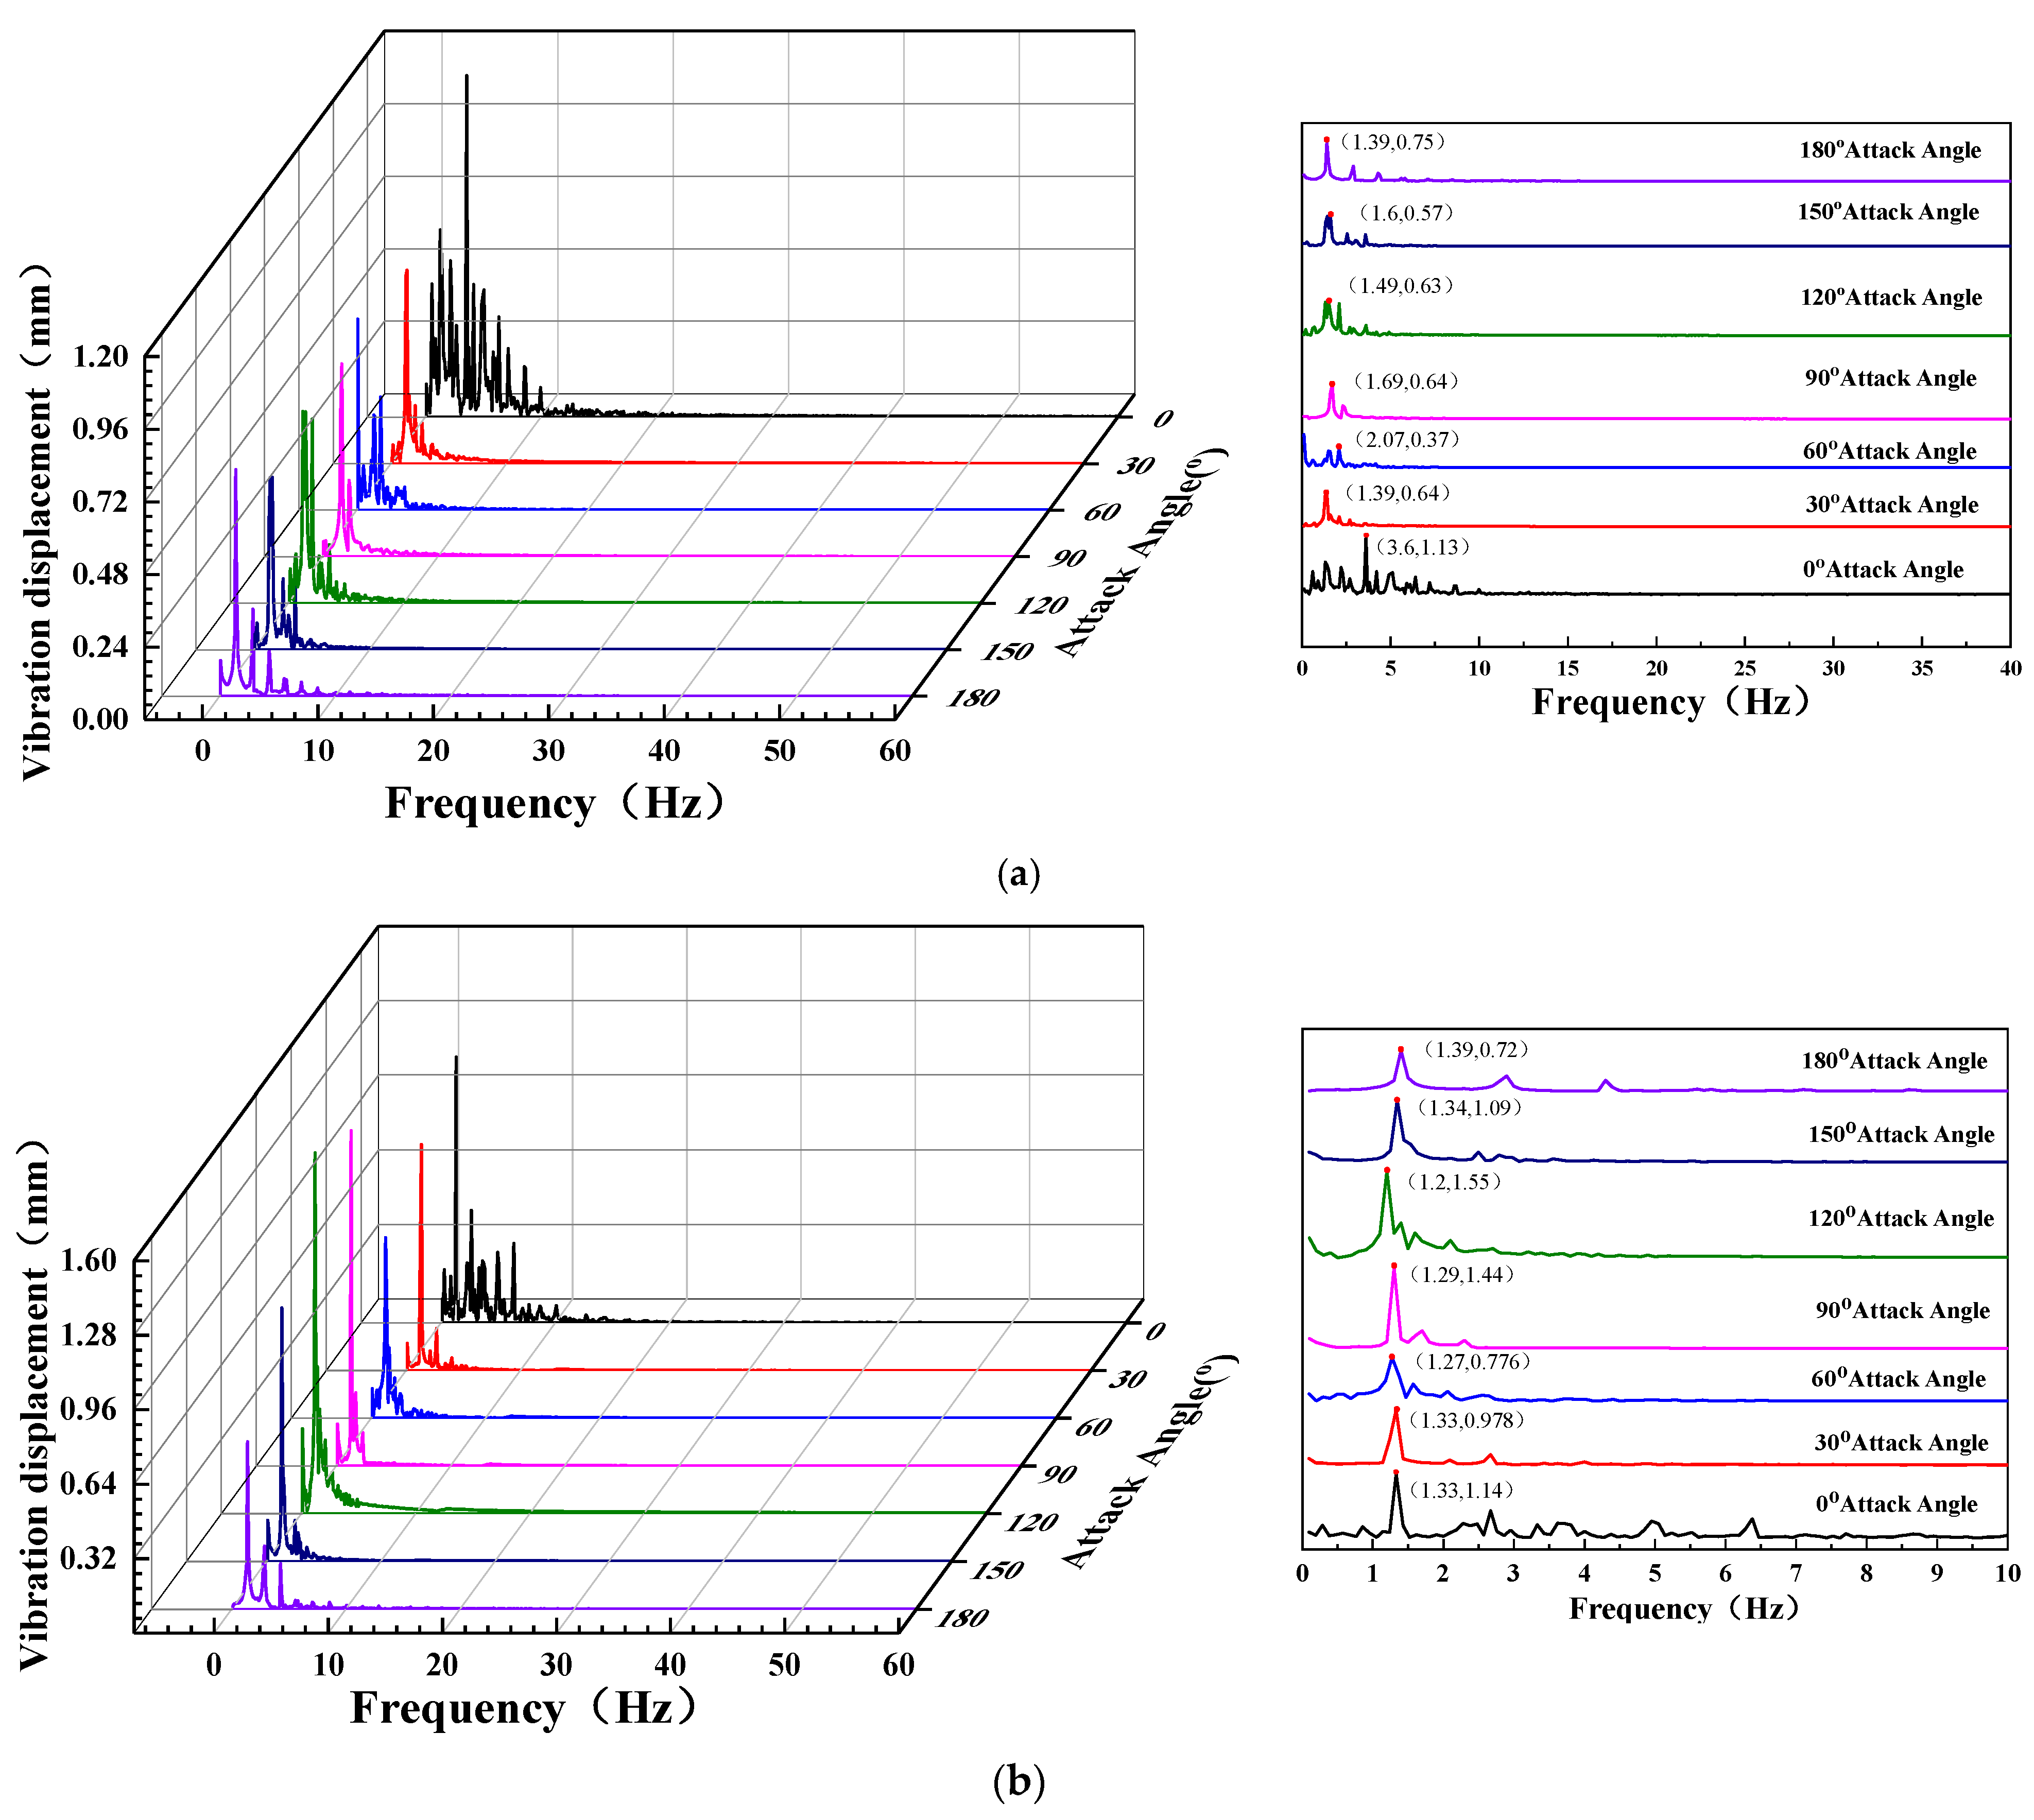
The vibration characteristics of the guide rail frame indicated that the dominant vibration frequency of the front and rear tracks were consistent, as were the left and right tracks. The vibration frequency of the guide rail frame structure is predominantly concentrated in the range of 0.8–10.1 Hz. The wind field on the open deck had a significant impact on the vibration of the guide rail’s rear side and the top of the pillar.
(4)
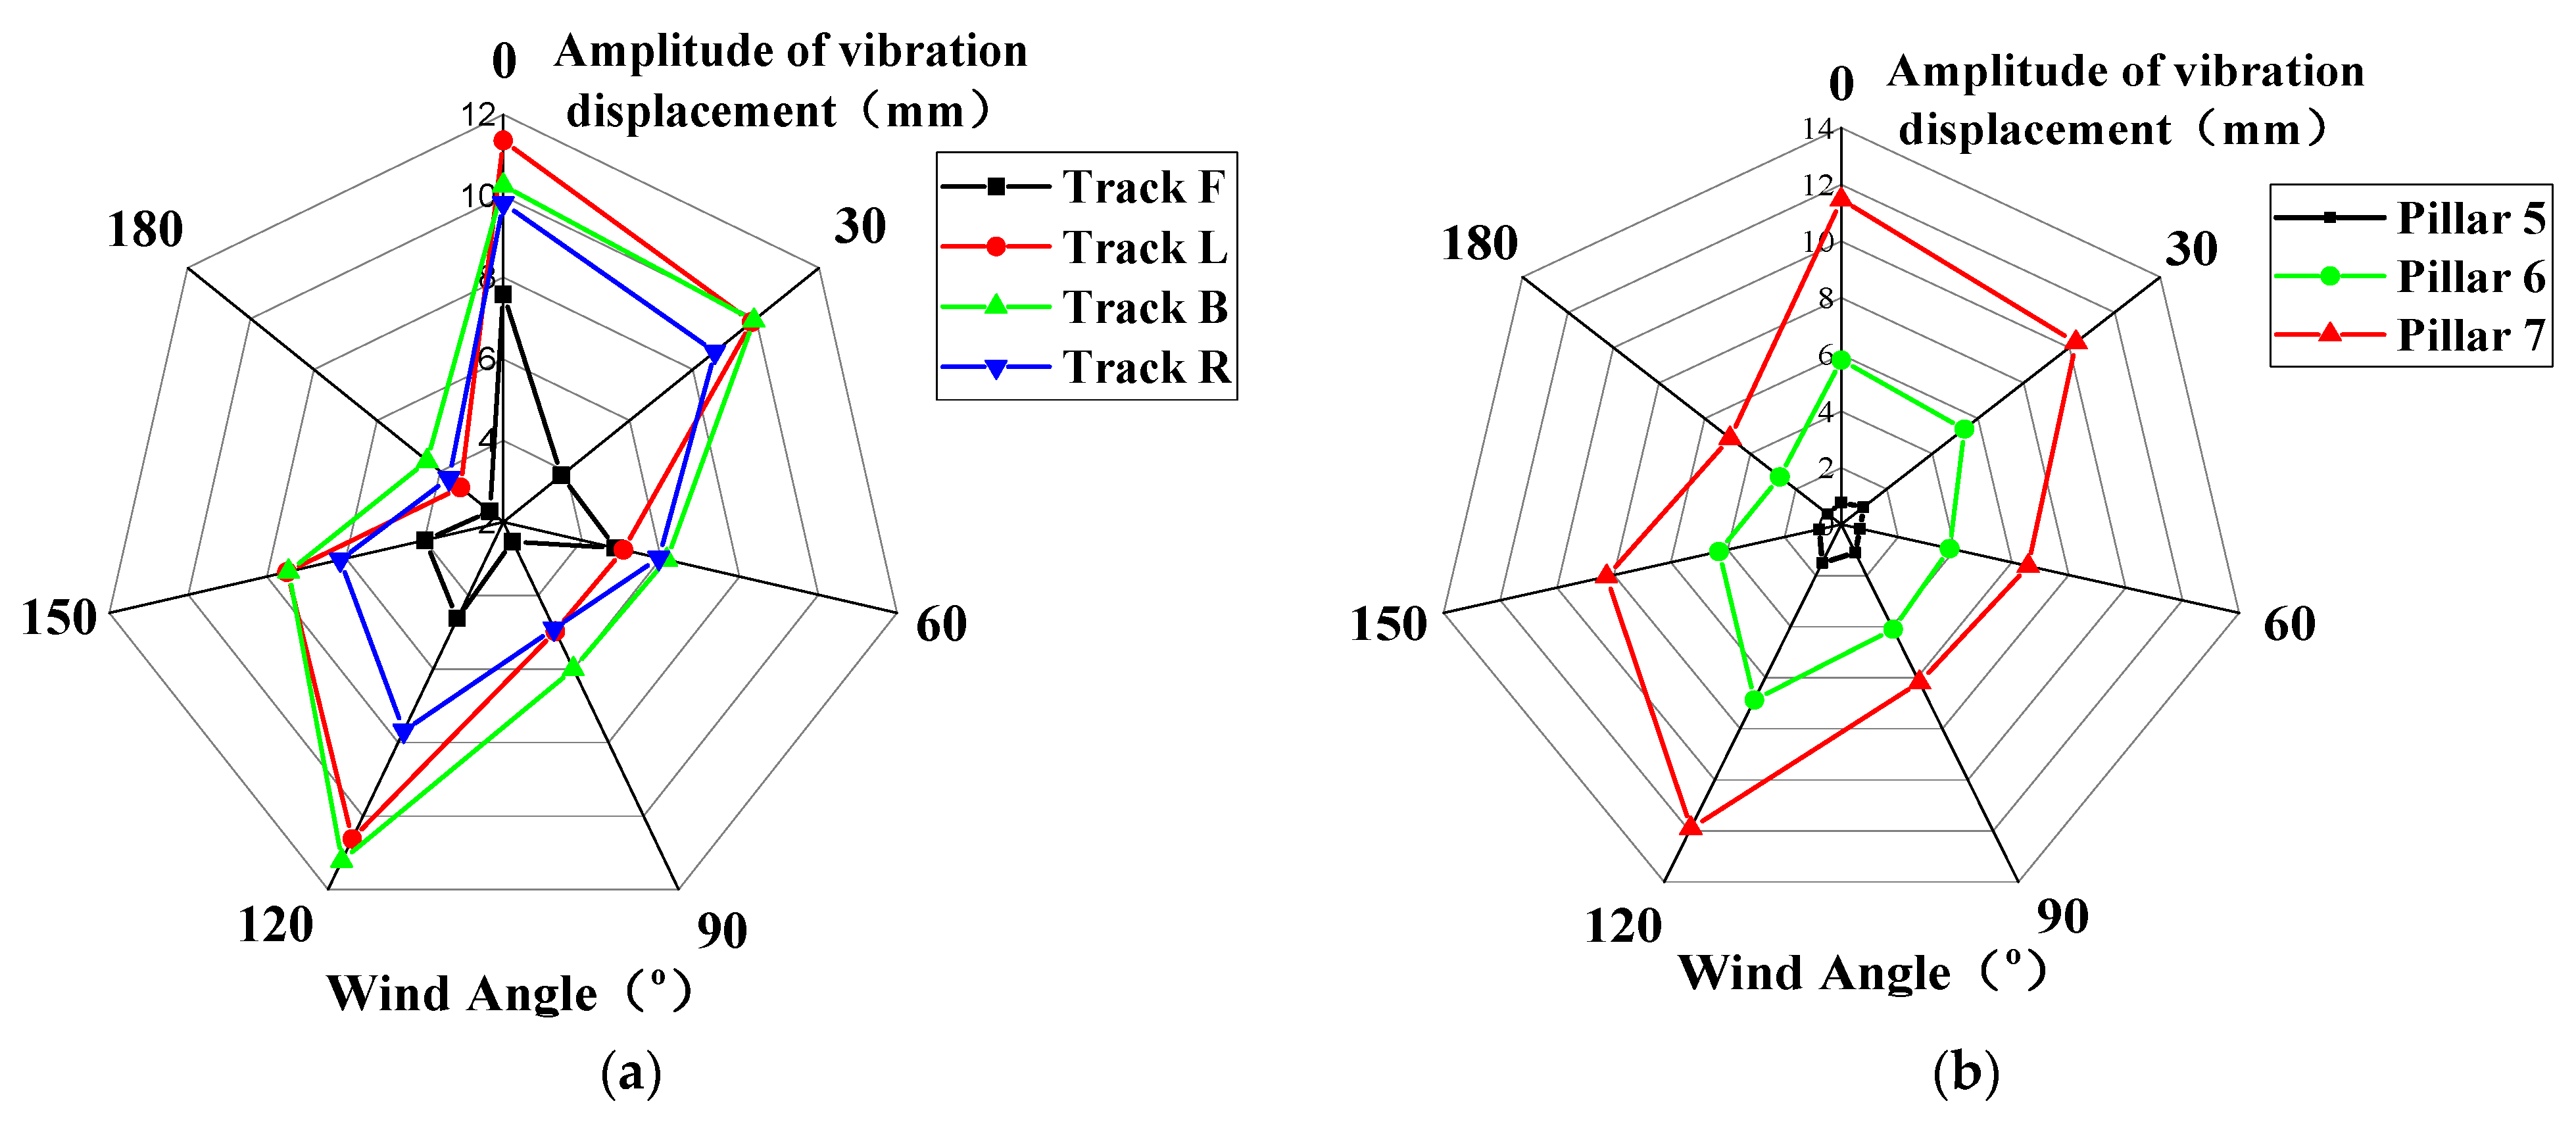
The frequency distribution of the track structure’s vibration acceleration remained consistent across different wind speeds, except that the dominant frequency was not consistent and tended to gradually approach the third-order natural frequency. The largest dominant frequency and vibration displacement amplitude were observed at a wind angle of 0°, closely aligned with the seventh natural frequency. For the pillar, the largest dominant frequency of vibration displacement occurred at a wind angle of 180°, while the smallest dominant frequency was observed at a wind angle of 120°, but with the largest vibration displacement amplitude. In terms of the vibration amplitude, wind angles of 0° and 120° were deemed the most unfavorable wind directions.
However, the limitation of this study is that the model of the guideway frame is appropriately simplified, and further details of the guideway frame should subsequently be established for wind-induced vibration analysis. Meanwhile, this study focuses on analyzing the vibration response of the structure under wind loading, and further aerodynamic characterization should be carried out to explore the causes of the vibration components. The use of the two-way FSI method requires larger computational resources, and the applicability of one-way FSI should subsequently be comparatively analyzed. The aerodynamic and structural parameters of the structure should be further investigated to provide reference for vibration and noise reduction.

Author Contributions

Conceptualization, X.F., Y.Z., J.G. and W.W.; methodology, X.F. and J.L.; software, X.F., J.L. and Y.Z.; validation, X.F., J.G. and Z.C.; formal analysis, X.F. and J.G.; investigation, X.F. and Z.C.; resources, W.W.; data curation, X.F. and Y.L.; writing—original draft preparation, X.F.; writing—review and editing, X.F., Y.Z., J.G., Z.C. and W.W.; visualization, X.F.; supervision, W.W.; project administration, W.W.; funding acquisition, W.W. All authors have read and agreed to the published version of the manuscript.

Funding

This research received no external funding.

Institutional Review Board Statement

Not applicable.

Informed Consent Statement

Not applicable.

Data Availability Statement

The data presented in this study are available in this article (in tables and figures).

Conflicts of Interest

Author Jing Li was employed by the company Hexagon Manufacturing Intelligence (Qingdao) Co., Ltd. The remaining authors declare that the research was conducted in the absence of any commercial or financial relationships that could be construed as a potential conflict of interest.

References

  1. Lorenzino, M.; D’Agostin, F.; Rigutti, S.; Bovenzi, M.; Fantoni, C.; Bregant, L. Acoustic comfort depends on the psychological state of the individual. Ergonomics 2020, 63, 1485–1501. [Google Scholar] [CrossRef] [PubMed]
  2. Kim, J.H.; Kim, Y. Time-domain analysis of passenger comfort on cruise ships under motion responses in waves. Proc. Inst. Mech. Eng. Part M-J. Eng. Marit. Environ. 2014, 228, 331–347. [Google Scholar] [CrossRef]
  3. Kivelä, E. The Use of FSI Models for the Prediction of Wind-Induced Vibration of Modern Cruise Ship Deck Outfitting Structures. Master’s Thesis, Aalto University, Espoo, Finland, 2019. Available online: http://urn.fi/URN:NBN:fi:aalto-201906264217 (accessed on 25 October 2023).
  4. Feng, X.L.; Gan, J.; Zhu, Y.; Chen, Z.H.; Wu, W.G. Wind-induced vibration characteristics of typical guide rail frame structure in open area of large cruise ships. Adv. Anal. Des. Mar. Struct. 2023, 9, 161–170. Available online: https://www.taylorfrancis.com/chapters/edit/10.1201/9781003399759-18 (accessed on 25 October 2023).
  5. Hou, F.W.; Jafari, M. Investigation approaches to quantify wind-induced load and response of tall buildings: A review. Sustain. Cities Soc. 2020, 62, 102376. [Google Scholar] [CrossRef]
  6. Kang, J.H.; Lee, S.J. Experimental study of wind load on a container crane located in a uniform flow and atmospheric boundary layers. Eng. Struct. 2008, 30, 1913–1921. [Google Scholar] [CrossRef]
  7. Andersen, I.M.V. Wind loads on post-panamax container ship. Ocean Eng. 2013, 58, 115–134. [Google Scholar] [CrossRef]
  8. Liu, C.; Xie, Z.; Zhang, L.; Yu, X. Investigation on modal coupling–aeroelastic effect of a super tall building by MDOF aeroelastic model test. J. Wind. Eng. Ind. Aerodyn. 2022, 231, 105248. [Google Scholar] [CrossRef]
  9. Chen, Z.; Jia, X.; Lin, Y.; Liu, H.; Wu, W. Experimental Investigation on Vibro-Acoustic Characteristics of Stiffened Plate Structures with Different Welding Parameters. J. Mar. Sci. Eng. 2022, 10, 1832. [Google Scholar] [CrossRef]
  10. He, X.H.; Ding, H.; Jing, H.Q.; Zhang, F.; Wu, X.P.; Weng, X.J. Wind-induced vibration and its suppression of photovoltaic modules supported by suspension cables. J. Wind Eng. Ind. Aerodyn. 2020, 206, 102376. [Google Scholar] [CrossRef]
  11. Hou, F.; Sarkar, P.P. Aeroelastic model tests to study tall building vibration in boundary-layer and tornado winds. Eng. Struct. 2020, 207, 110259. [Google Scholar] [CrossRef]
  12. Li, S.; Deng, Y.; Zhong, Z.; Chen, Z. Effects of corner modifications on wind-induced responses of super high-rise buildings by wind tunnel tests based on a novel low-damping elastic test model. J. Build. Eng. 2023, 67, 105881. [Google Scholar] [CrossRef]
  13. Chen, B.; Qin, M.; Du, K.; Yang, Q. Interference Effects of Adjacent High-Rise Building on Wind-Induced Response of Low-Rise Flat Roof Building. Int. J. Struct. Stab. Dyn. 2022, 22, 1–18. [Google Scholar] [CrossRef]
  14. Hu, Z.; Wang, J.; Sun, Y. Cross-flow vibrations of two identical elastically mounted cylinders in tandem arrangement using wind tunnel experiment. Ocean Eng. 2020, 209, 107501. [Google Scholar] [CrossRef]
  15. Tang, U.F.; Kwok, K.C.S. Interference excitation mechanisms on a 3DOF aeroelastic CAARC building model. J. Wind Eng. Ind. Aerodyn. 2004, 92, 1299–1314. [Google Scholar] [CrossRef]
  16. Rothberg, S.J.; Allen, M.S.; Castellini, P.; Di Maio, D.; Dirckx, J.J.J.; Ewins, D.J.; Halkon, B.J.; Muyshondt, P.; Paone, N.; Ryan, T.; et al. An international review of laser Doppler vibrometry: Making light work of vibration measurement. Opt. Lasers Eng. 2017, 99, 11–22. [Google Scholar] [CrossRef]
  17. Kononov, I.Y.; Velichko, E.N.; Aksenov, E.T. Development of non-contact laser vibrometer. J. Phys. Conf. Ser. 2015, 643, 012035. [Google Scholar] [CrossRef]
  18. Su, J.; Xia, Y.; Zhu, L.; Zhu, H.; Ni, Y. Typhoon- and temperature-induced quasi-static responses of a supertall structure. Eng. Struct. 2017, 143, 91–100. [Google Scholar] [CrossRef]
  19. Wang, L.; Liang, S.; Song, J.; Wang, S. Analysis of vortex induced vibration frequency of super tall building based on wind tunnel tests of MDOF aero-elastic model. Wind Struct. 2015, 21, 523–536. [Google Scholar] [CrossRef]
  20. Sun, G.Y.; Li, W.J.; Luo, Q.T.; Li, Q. Modal identification of vibrating structures using singular value decomposition and nonlinear iteration based on high-speed digital image correlation. Thin-Wall. Struct. 2021, 163, 107377. [Google Scholar] [CrossRef]
  21. Beberniss, T.J.; Ehrhardt, D.A. High-speed 3D digital image correlation vibration measurement: Recent advancements and noted limitations. Mech. Syst. Signal Process. 2017, 86, 35–48. [Google Scholar] [CrossRef]
  22. Yu, L.P.; Pan, B. Single-camera high-speed stereo-digital image correlation for full-field vibration measurement. Mech. Syst. Signal Process. 2017, 94, 374–383. [Google Scholar] [CrossRef]
  23. Wang, Y.; Huang, Z.; Zhu, P.; Zhu, R.; Hu, T.; Zhang, D.; Jiang, D. Effects of compressed speckle image on digital image correlation for vibration measurement. Measurement 2023, 217, 113041. [Google Scholar] [CrossRef]
  24. David, K.; Chiang, C.H.; Lin, Y.C. Experimental vibration analysis of large structures using 3D DIC technique with a novel calibration method. J. Civ. Struct. Health Monit. 2022, 12, 391–409. [Google Scholar] [CrossRef]
  25. Ji, Q.; Kun, L. Numerical Simulation Solutions for Wind-Induced Vibration of Ship Rearview Mirrors Caused by Airflow Noise in Shallow Seas. J. Coastal Res. 2018, 82, 29–34. [Google Scholar] [CrossRef]
  26. Tao, L.L.; Du, G.S.; Liu, L.P.; Liu, Y.H.; Shao, Z.F. Experimental study and finite element analysis of wind-induced vibration of modal car based on fluid-structure interaction. J. Hydrodynam. B 2013, 25, 118–124. [Google Scholar] [CrossRef]
  27. Xu, Z.; Zhu, J.; Wang, D. Analysis and Optimisation of Wind-Induced Vibration Control for High-Rise Chimney Structures. Int. J. Acoust. Vib. 2014, 19, 42–51. [Google Scholar] [CrossRef]
  28. Feng, R.; Zhong, C.; He, J. Analysis of Wind-Induced Vibration Response of High-Rise Structure of Heat Sink Tower Based on Large Eddy Simulation. Int. J. Steel Struct. 2022, 22, 70–93. [Google Scholar] [CrossRef]
  29. Han, Y.; Chun, Q.; Jin, H. Wind-induced vibration performance of early Chinese hall-style timber buildings. J. Wood Sci. 2021, 67, 1–18. [Google Scholar] [CrossRef]
  30. Yan, B.; Ren, H.; Li, D.; Yuan, Y.; Li, K.; Yang, Q.; Deng, X. Numerical Simulation for Vortex-Induced Vibration (VIV) of a High-Rise Building Based on Two-Way Coupled Fluid-Structure Interaction Method. Int. J. Struct. Stab. Dyn. 2022, 22, 1. [Google Scholar] [CrossRef]
  31. Zhang, M.; Zhou, Z.; Zhao, G.; Wang, F. Numerical Simulation Study of Vibration Characteristics of Cantilever Traffic Signal Support Structure under Wind Environment. CMES-COMP Model Eng. 2023, 134, 673–698. [Google Scholar] [CrossRef]
  32. Huang, S.; Li, R.; Li, Q. Numerical simulation on fluid-structure interaction of wind around super-tall building at high reynolds number conditions. Struct. Eng. Mech. 2013, 46, 197–212. [Google Scholar] [CrossRef]
  33. Park, S.C.; Kim, H.J.; Han, S.E. A Study on the Wind-Induced Response Characteristics of Freeform Shaped Tall Building using FSI Analysis. J. Struct. Eng. 2014, 27, 223–230. [Google Scholar] [CrossRef]
  34. Yassen, Y.E.S.; Abdelhameed, A.S.; Elshorbagy, K.A. An examination of hub wind turbine utilizing fluid-structure interaction strategy. Alexandria Eng. J. 2022, 64, 1–11. [Google Scholar] [CrossRef]
  35. Prpić-Oršić, J.; Valčić, M.; Čarija, Z. A Hybrid Wind Load Estimation Method for Container Ship Based on Computational Fluid Dynamics and Neural Networks. J. Mar. Sci. Eng. 2020, 8, 539. [Google Scholar] [CrossRef]
  36. Janssen, W.D.; Blocken, B.; van Wijhe, H.J. CFD simulations of wind loads on a container ship: Validation and impact of geometrical simplifications. J. Wind. Eng. Ind. Aerodyn. 2017, 166, 106–116. [Google Scholar] [CrossRef]
  37. Grlj, C.G.; Degiuli, N.; Tukovi’c, Ž.; Farkas, A.; Martic’, I. The effect of loading conditions and ship speed on the wind and air resistance of a containership. Ocean Eng. 2023, 273, 113991. [Google Scholar] [CrossRef]
  38. Seok, J.; Park, J.C. Comparative study of air resistance with and without a superstructure on a container ship using numerical simulation. J. Mar. Sci. Eng. 2020, 8, 267. [Google Scholar] [CrossRef]
  39. Kobayashi, H.; Kume, K.; Orihara, H.; Ikebuchi, T.; Aoki, I.; Yoshida, R.; Yoshida, H.; Ryu, T.; Arai, Y.; Katagiri, K.; et al. CFD assessment of the wind forces and moments of superstructures through RANS. Appl. Ocean Res. 2022, 129, 103364. [Google Scholar] [CrossRef]
  40. Yan, K.; Oh, J.; Seo, D.-W. Computational Analysis for Estimation of Mooring Force Acting on Various Ships in Busan New Port. J. Mar. Sci. Eng. 2023, 11, 1649. [Google Scholar] [CrossRef]
  41. Ricci, A.; Vasaturo, R.; Blocken, B. An integrated tool to improve the safety of seaports and waterways under strong wind conditions. J. Wind. Eng. Ind. Aerodyn. 2023, 234, 105327. [Google Scholar] [CrossRef]
  42. Ricci, A.; Janssen, W.D.; Wijhe, H.J.V.; Blocken, B. CFD simulation of wind forces on ships in ports: Case study for the Rotterdam Cruise Terminal. J. Wind Eng. Ind. Aerodyn. 2020, 205, 104315. [Google Scholar] [CrossRef]
  43. Wang, P.; Wang, F.; Chen, Z. Investigation on aerodynamic performance of luxury cruise ship. Ocean Eng. 2020, 213, 107790. [Google Scholar] [CrossRef]
  44. Huang, L.; Xue, M.; Dong, H.; Yang, B. A Subdomain Method for the Aeroacoustic Simulation of a Generic Side View Mirror. ICIDMP 2013, 437, 321–324. [Google Scholar] [CrossRef]
  45. Pendar, M.-R.; Roohi, E. Cavitation characteristics around a sphere: An LES investigation. Int. J. Multiphas. Flow. 2018, 98, 1–23. [Google Scholar] [CrossRef]
  46. Pendar, M.-R.; Páscoa, J.C. Numerical modeling of electrostatic spray painting transfer processes in rotary bell cup for automotive painting. Int. J. Heat Fluid Flow. 2019, 80, 108499. [Google Scholar] [CrossRef]
  47. Pendar, M.-R.; Páscoa, J.C. Study of the Plasma Actuator Effect on the Flow Characteristics of an Airfoil: An LES Investigation. SAE Aero Tech. Int. 2021, 3, 1206–1215. [Google Scholar] [CrossRef]
Figure 1. Model measuring points and wind angle conditions; (a) measuring point layout; (b) wind angles.
Jmse 11 02210 g001
Figure 2. Turntable base fixture.
Jmse 11 02210 g002
Figure 3. Wind-induced vibration test of a plate structure. (a) Test using vibrometer laser; (b) test using DIC.
Jmse 11 02210 g003
Figure 4. Calculation domain of wind tunnel.
Jmse 11 02210 g004
Figure 5. FSI parameters analysis. (a) Mesh scheme; (b) time step; (c) turbulence model.
Jmse 11 02210 g005
Figure 6. Comparison of simulation and experimental results. (a) Average vibration displacement; (b) vibration cloud diagram and displacement frequency response curve.
Jmse 11 02210 g006
Figure 7. Whole domain and subdomain.
Jmse 11 02210 g007
Figure 8. The velocity cloud diagram of the transverse section at 0.015 m position.
Jmse 11 02210 g008
Figure 9. Wind pressure circumferential distribution curve.
Jmse 11 02210 g009
Figure 10. Whole ship domain and open deck subdomain of the cruise ship. (a) Inlet wind profile; (b) Whole ship computational domain; (c) Guide rail frame subdomain; (d) Guide rail frame structure; (e) Subdomain’s location in the whole ship.
Jmse 11 02210 g010
Figure 11. Mesh division of the whole domain.
Jmse 11 02210 g011
Figure 12. Wind speed distribution of the whole ship and open deck under different wind angles. (a) 0°; (b) 30°; (c) 60°; (d) 90°; (e) 120°; (f) 150°; (g) 180°.
Jmse 11 02210 g012
Figure 13. Guide rail frame structure on open deck.
Jmse 11 02210 g013
Figure 14. Typical vibration mode and natural frequency of guide rail frame. (a) The third order (1.53 Hz); (b) the seventh order (3.611 Hz); (c) the thirteenth order (5.106 Hz).
Jmse 11 02210 g014
Figure 15. Frequency domain curves of acceleration at different positions. (a) Track F; (b) track B; (c) track R; (d) track L; (e) pillar 5; (f) pillar 6; (g) pillar 7.
Jmse 11 02210 g015
Figure 16. Frequency domain curves under different wind speeds. (a) Track; (b) pillar.
Jmse 11 02210 g016
Figure 17. Frequency domain curves of vibration displacement under different wind angles. (a) Track; (b) pillar.
Jmse 11 02210 g017
Figure 18. Vibration displacement amplitude of structure under different wind angles. (a) Track; (b) pillar.
Jmse 11 02210 g018
Table 1. Four mesh refinement schemes.
Mesh Schemex/L (10−2)y/L (10−4) z/L (10−3) Number of Meshes (106)
Scheme I1.426.82 (4.8%)2.84 (20%)2.64
Scheme II1.46.72 (4.8%)2.8 (20%)3.81
Scheme III0.783.74 (4.8%)1.56 (20%)5.19
Scheme IV0.622.98 (4.8%)1.24 (20%)7.35
Disclaimer/Publisher’s Note: The statements, opinions and data contained in all publications are solely those of the individual author(s) and contributor(s) and not of MDPI and/or the editor(s). MDPI and/or the editor(s) disclaim responsibility for any injury to people or property resulting from any ideas, methods, instructions or products referred to in the content.

