Article

Spatial Transferability of Residential Building Damage Models between Coastal and Fluvial Flood Hazard Contexts

1
National Institute of Water and Atmospheric Research (NIWA), 301 Evans Bay, Greta Point, Wellington 6021, New Zealand
2
Moffatt & Nichol, 1780 Hughes Landing Boulevard, Suite 575, The Woodlands, TX 77380, USA
*
Author to whom correspondence should be addressed.
J. Mar. Sci. Eng. 2023, 11(10), 1960; https://doi.org/10.3390/jmse11101960
Submission received: 27 August 2023 / Revised: 27 September 2023 / Accepted: 10 October 2023 / Published: 11 October 2023
(This article belongs to the Special Issue Coastal Flooding: Causes, Impacts and Mitigation)

Abstract

:
This study investigates residential building damage model transferability between coastal and fluvial flood hazard contexts. Despite the frequency of damaging coastal flood events, empirical damage models from fluvial flooding are often applied in quantitative coastal flood risk assessments. This assumes that building damage response is similar from the exposure to different flood sources. Here, we use empirical data from coastal, riverine and riverine-levee breach flooding events to analyse residential building damage. Damage is analysed by applying univariable and multivariable learning models to determine the importance of explanatory variables for relative damage prediction. We observed that the larger explanatory variable range considered in multivariable models led to higher predictive accuracy than univariable models in all flood contexts. Transfer analysis using multivariable models showed that models trained on event-specific damage data had higher predictive accuracy than models learned on all damage data or on data from other events and locations. This finding highlights the need for damage models to replicate local damage factors for reliable application across different flood hazard contexts.

1. Introduction

Economic losses from flooding hazards have increased annually in the last 20 years [1]. In coastal areas, rising sea levels in this century are anticipated to increase the frequency and magnitude of losses from episodic flooding. Major coastal cities around the world could surpass US $1 trillion by 2050 if no measures are taken to address this issue [2]. In Europe, present-day expected annual damages from coastal flooding could increase three orders of magnitude by 2100 in response to limited investment in flood adaptation [3]. Continual population and economic growth within low-lying coastal areas compound and exacerbate the potential for these projections to manifest in the future.
Physical damage and financial loss estimations for buildings inform optimal risk interventions to limit the social and economic harm from flooding. Building vulnerability to damage and loss is an important model component in flood damage assessments. For buildings, it often represents the physical damage and tangible loss from exposure to flood hazard characteristics and their intensities. Models typically represent relative (i.e., ratio) or absolute (i.e., financial value) damage, usually in response to increasing water depth [4]. These so-called ‘depth-damage’ functions (DDFs) or curves are a standard approach in flood damage modelling. While DDFs for buildings are extensively developed for fluvial hazard contexts [5], a paucity of empirical damage information collected from coastal flooding events means that fluvial DDFs are regularly applied in coastal flood damage assessments [3,6]. This approach assumes building damage in different locations is similar for different flood hazard sources, characteristics and intensities.
A major advancement in flood damage assessment for buildings is the application of multivariable model approaches [7]. Univariable DDFs relating a single hazard characteristic to relative or absolute damage often fail to represent local factors which influence building damage. This can lead to uncertain damage assessment outcomes, particularly when models developed for other locations or flood events are applied to predict local damage [8]. On the other hand, multivariable models consider a broader range of explanatory damage variables and can analyse interactions between variables that lead to different damage outcomes. Supervised and unsupervised learning algorithms such as Bayesian networks [9,10,11], neural networks [12] and regression and bagging trees [8,13,14] are commonly applied in empirically based flood damage analyses for buildings. Several studies applying these models have demonstrated their higher performance for local damage predictions compared to univariable DDFs [8,12]. In contrast, models learned to predict damage for specific locations transfer to other geographical or different fluvial or coastal flood hazard contexts with lower predictive performance [14,15,16,17]. Understanding the transferability of building damage models between locations with different flood hazard sources and characteristics requires further investigation.
This study compares the performance of empirical residential building flood damage models when transferred across coastal and fluvial flood hazard contexts. New Zealand provides the study focus area, which in recent decades has experienced numerous damaging fluvial flood events [18,19]. Residential building damage from storm-driven coastal flooding events has been significantly lower during this period, meaning there have been fewer opportunities for post-event damage data collection. In this case, the absence of empirical data means damage models developed for fluvial hazard contexts are likely to be applied in coastal flood risk analyses. It is thus important to understand the potential limitations and implications of applying damage models across different flood hazard contexts.
We analyse empirical damage data collected from several flood events representing coastal, mixed coastal and fluvial, and fluvial sources. Our damage analysis has two main objectives: (1) develop and evaluate the predictive performance of event-specific univariable and multivariable models and (2) evaluate the capacity for model transfer between locations and events. This paper first describes the empirical damage data for model learning followed by univariable and multivariable damage model development and evaluation methods. Variables important for causing direct damage are identified and compared for each event, followed by evaluations of model predictive performance across single and multiple events and locations. Finally, we discuss the findings and their implications for flood damage assessments in coastal areas.

2. Materials and Methods

2.1. Residential Building Damage Assessments

Residential building damage data were collected from on-site assessments after three New Zealand flood events (Figure 1). Each event represented damage caused by a different flood hazard type. Riverine (Westport flood, 2021) and riverine-levee breach (Edgecumbe flood, 2017) damage to buildings recorded and described in [20] represent 220 and 247 building samples, respectively (Table 1). Coastal flooding from Extra-Tropical Cyclone Fehi on 1 February 2018 affected over 100 properties across the Tasman and Nelson Regions in the South Island of New Zealand. Three weeks after the event, on-site assessments following the methods in [19] were completed for 57 flood-damaged buildings over a two-day period. Information on the flood hazard characteristics, physical and non-physical building characteristics and relative building component damage was collected.
Damage data collection for Extra-Tropical Cyclone Fehi (CF2018) was concentrated on the settlements of Ruby Bay (Tasman District) and Monaco (Nelson City) (Figure 1). On-site assessments were consistent for the E2017 and WP2021 events (Table 1). Building attributes included construction period, dwelling type, structural frame, floor height, foundation type, number of storeys and wall cladding (refer to Table 2). In addition, building roof outline area was measured in GIS. These attributes were categorised as nominal or ordinal or as continuous data structures.
The water depths, as indicated by the water marks on buildings, represent the maximum inundation levels relative to both ground level and floor level (please refer to Table 2 for details). When access was available, we measured the water depth above the floor level by examining high water marks and debris lines visible on internal walls. In situations where access was limited, depths were determined from external doorsteps. Unfortunately, accurate measurements of other factors such as flow velocity, debris deposition (e.g., sediment) and the presence of contamination were not possible during our on-site assessments. Nevertheless, we documented any building damage resulting from these characteristics.
We determined damage ratios (DRb), a dimensionless parameter ranging from 0 to 1, which quantifies relative damage by comparing the cost to repair with the cost to replace building components. To compute these ratios for damaged buildings in CF2018, we employed the methodology outlined in [19]. This process involved two key steps. First, an observed damage ratio (ODR) was calculated for individual components using an ordinal scale from 0 to 1, with increments of 0.25 (e.g., 0% to 25% … 75% to 100%). Second, we computed a construction cost ratio (CCR) for subcomponents based on their replacement value relative to the total building replacement value on the date of the flood event using local construction guidelines [19]. The estimation of CCR accounted for various factors, including area, dwelling type, foundations, number of storeys, structural framework and wall cladding. DRb was then enumerated from the ODR and CCR multiplicative for each component. This provided a continuous value for predictive models of relative damage caused by relationships between hazard and building variables.

2.2. Damage Model Development

Univariable and multivariable regression models were learned for DRb prediction using the combinations of hazard and exposure variables shown in Table 2. Model learning applied a train-test split procedure using two-thirds of the observed data for training and one-third for validation. This procedure was repeated 1000 times, resampling the training data for each iteration cycle. Model DRb prediction performance was then evaluated using several common metrics for measuring regression performance, described further in Section 2.3.
Univariable models established a correlation between DRb and the water depth measured above ground level. Several regression models, including linear, power, second-order polynomial and square root functions, were employed to ascertain the relationship between water depth and DRb. These regression models were trained and assessed for their ability to predict DRb. Nominal hazard variables, such as flow velocity, were not considered in these univariable regression models.
We applied Random Forest (RF) and Extreme Gradient Boosting (XGB) as tree ensemble models for DRb prediction. These regression models were chosen for several reasons: (1) use of multiple explanatory variables for DRb prediction, (2) bootstrap sampling to reduce potential for overfitting and (3) determination of non-parametric uncertainty distribution from variations amongst the tree ensemble predictions. RF and XGB algorithms were implemented in Python using the scikit-learn [21] and Extreme Gradient Boosting (XGBoost) [22] libraries, respectively.
The procedure was repeated 1000 times, with the training data resampled for each iteration. The choice of hyperparameters is crucial for tree ensemble methods [23,24]. RF models were configured to minimise out-of-bag (OOB) errors, which were calculated as the sum of squared residuals following the recommendation in [13]. The RF tree and predictor variable ranges were tested with 100 reproductions for each combination to find the optimal combination that yielded the lowest OOB error. In this case, we used 1000 trees with 10 variables randomly sampled at each node. For the XGB model, tree growth was halted when 10 trees were added without any further predictive improvement. The maximum number of XGB model trees was set to 100, and the maximum tree depth was limited to 6.
Finally, variable importance for DRb was determined based on tree ensemble predictions. Variable importance was measured using mean decrease accuracy [23]. Here, model accuracy was initially computed for all variables and then for each variable individually by excluding the other variables. The reduction in each variable’s accuracy relative to the overall model accuracy was measured, with a higher mean decrease in accuracy indicating the higher importance of the variable for DRb prediction.

2.3. Damage Model Evaluation

Univariable and multivariable model predictive performance for DRb was evaluated using precision and reliability metrics based on [13] (Table 3). Models were evaluated using 10-fold cross-validation to produce regression error metrics [25]. For relatively small damage samples for model learning (Table 1), cross-validation implements a folding technique to shuffle and split damage samples into smaller subsamples. Models are then learned and evaluated on each subsample to enumerate the mean performance value for each fold. Precision was represented by mean squared error (MSE), mean absolute error (MAE) and mean bias error (MBE). MSE calculates the average squared deviation between the observed and predicted DRb values, where smaller values indicate higher model performance. MAE is an absolute metric that measures the average error between the predicted and observed DRb. MBE then quantifies the mean difference between the predicted and observed DRb, with positive and negative values representing overprediction or underprediction, respectively. Reliability was analysed from the modelled DRb distributions. The quantile range (QR) represents the prediction range of DRb values between the 5th (q5) and 95th (q95) quantiles, indicating a 90% quantile range. A larger QR indicates higher prediction uncertainty. Hit rate (HR) measures the proportion of DRb predictions within the observed QR, with high prediction reliability represented by a value of 0.9 or greater [26].
Empirical data for different locations and events supported the spatial transfer evaluation of model prediction performance. Data samples were separated into subsets for each event prior to predictive modelling. Models were learned on data samples for each location and event, then transferred to predict DRb for other locations and events. In addition, models learned on data samples for all events were developed to evaluate and compare prediction performance relative to models for specific locations and events.

3. Results and Discussion

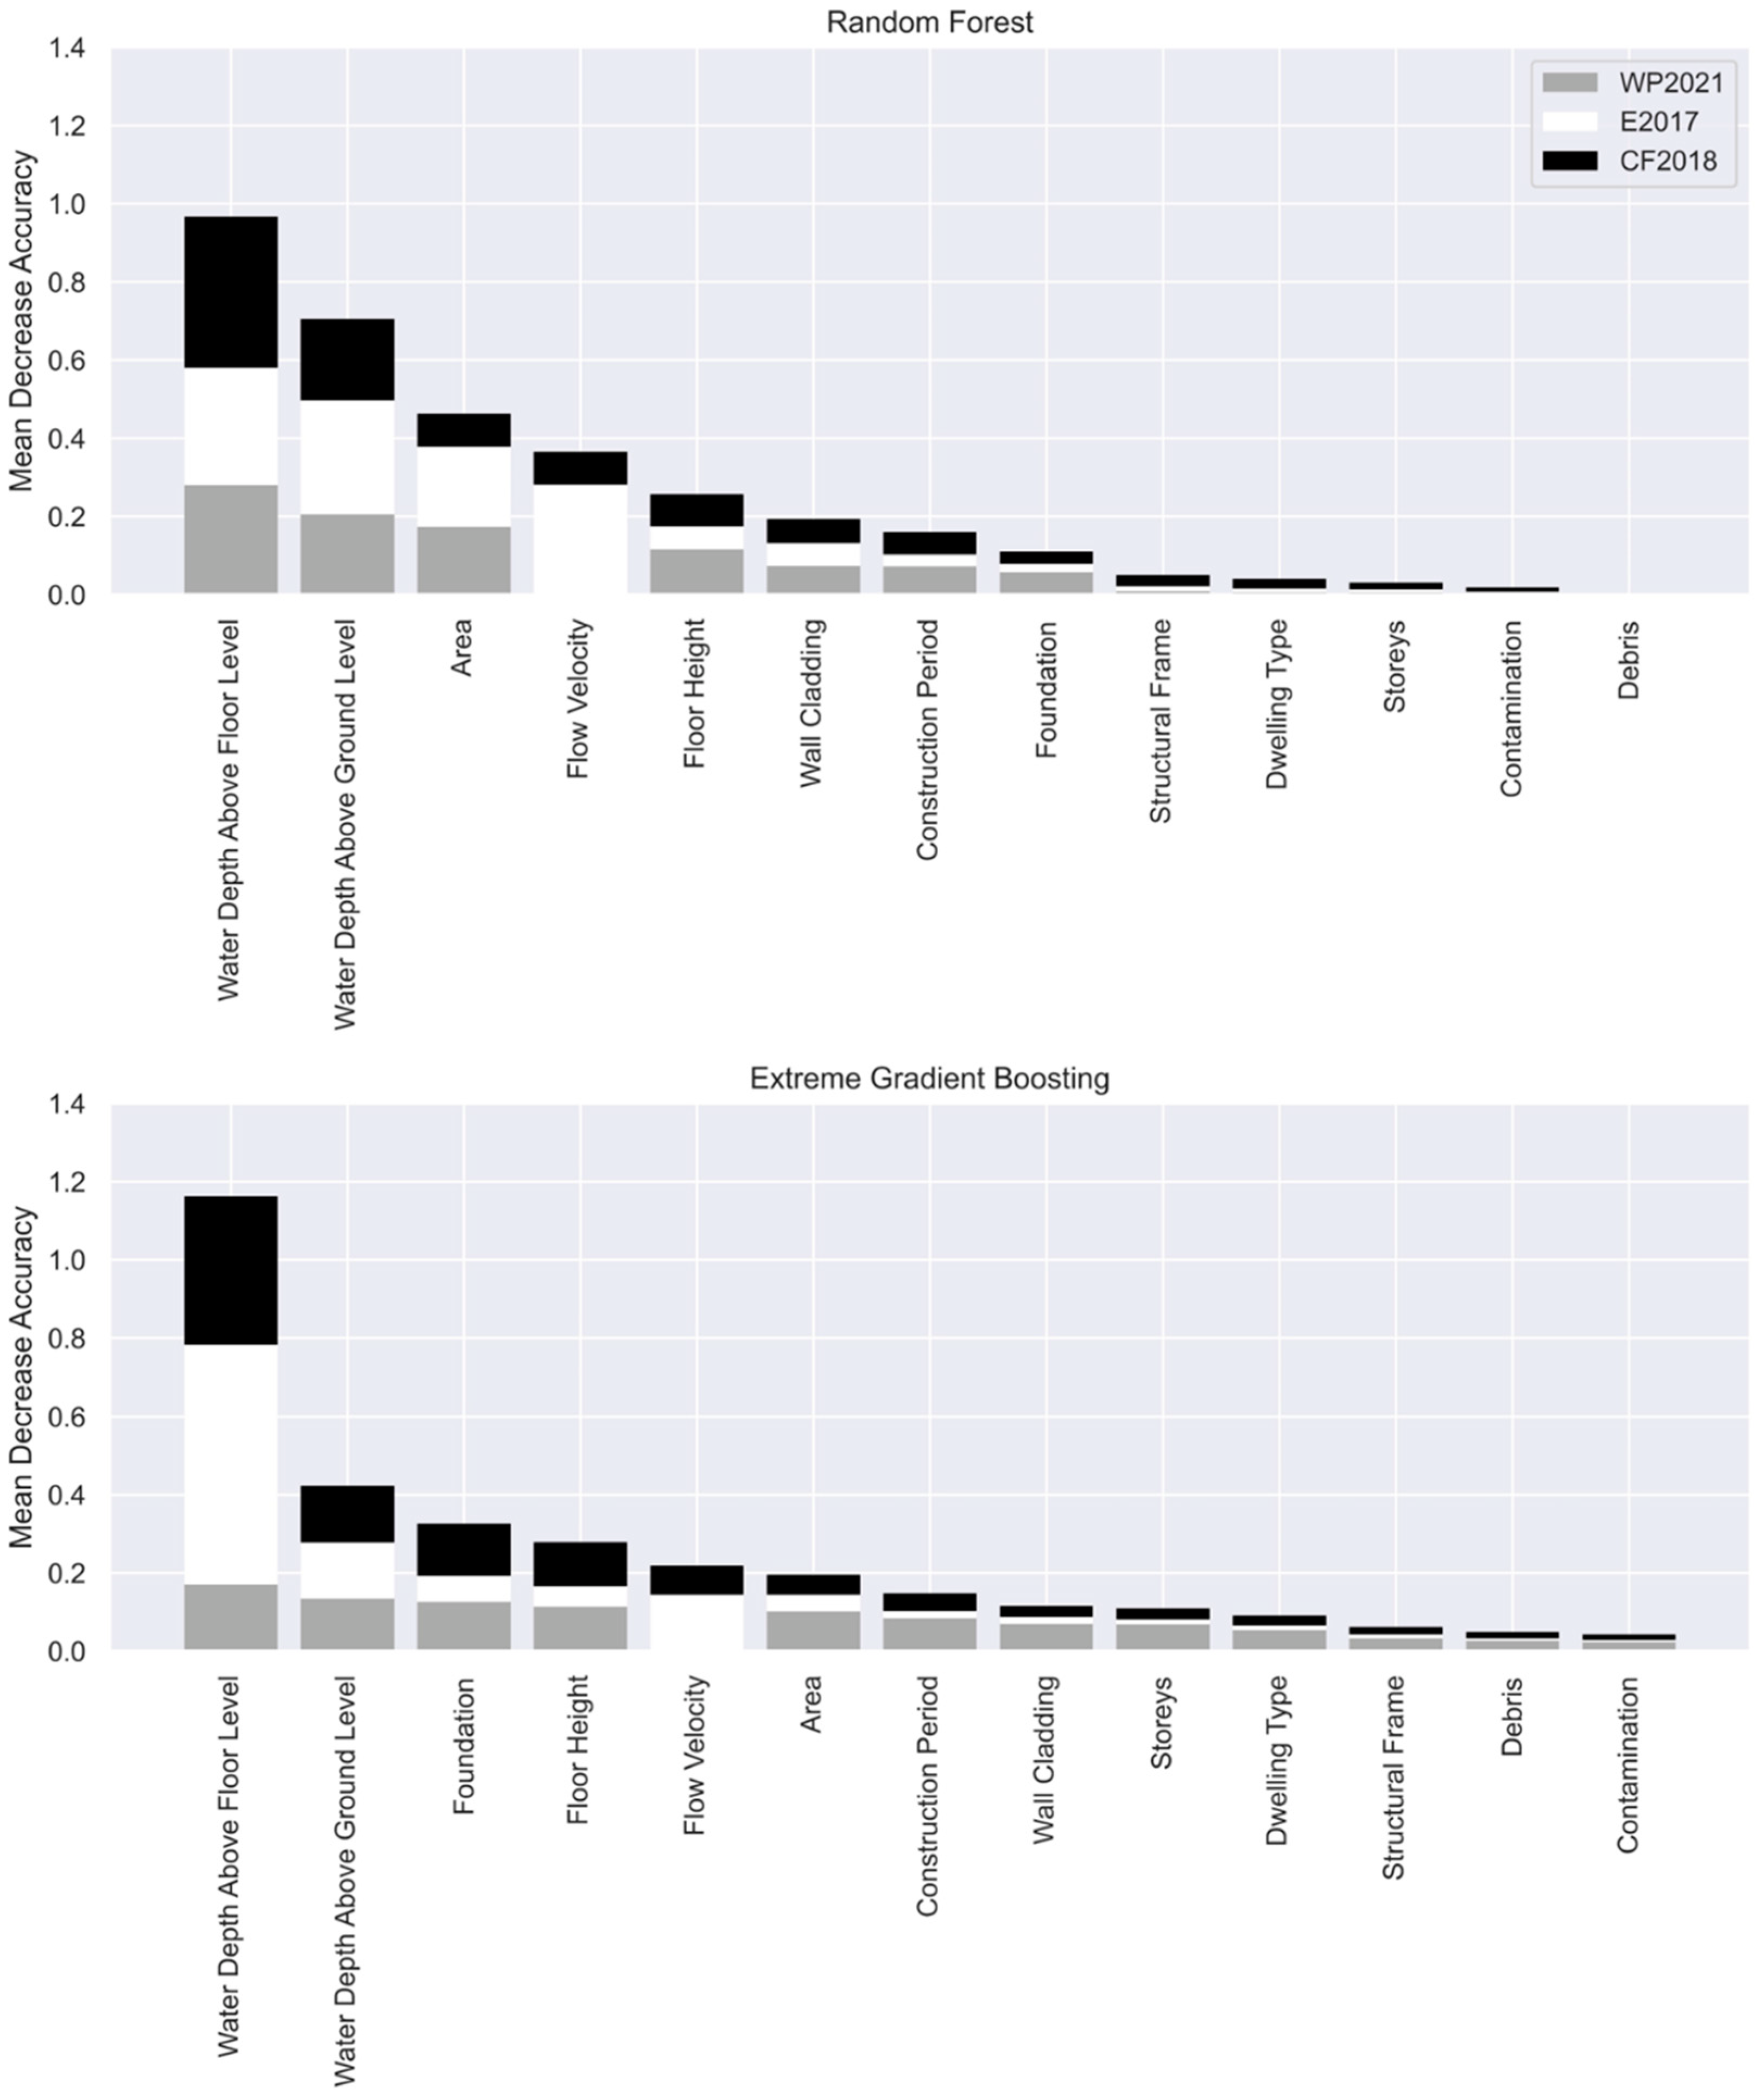
3.1. Variable Importance and Damage Relationships

The relative importance of explanatory variables for the relative damage returned by RF and XGB models is presented in Figure 2. The models demonstrated the high importance of water depth above floor level and ground level as causative factors for building damage across all flood events. This is consistent with the global literature indicating water depth being a principle explanatory variable for building damage (e.g., [5]). Water depth above floor level showed a higher influence on damage, which can be attributed to damage to non-structure components (e.g., internal finishes) located at or above floor level and with a high susceptibility to damage upon water contact [16]. The presence of flow velocity on damage was observed for events E2017 and CF2018. Despite comparatively fewer observations (n = 13), the variable had a relatively high influence on building damage. The limited observations indicated that conditions causing damage were highly localised. Debris and contamination showed little influence on building damage for the studied events. This could be influenced by high material susceptibility to damage on water contact across all flood sources.
Building characteristics showed disparities in the importance of rankings between RF and XGB models (Figure 2). The XGB model returned the highest importance for foundation and floor height across all events. This could be expected, as both variables influence water depth above floor level. The variables influenced damage more highly for events WP2021 and CF2018. This could be attributed to the low influence of flow velocity, elevating the importance of water depth for observed damage in these events. While the RF model demonstrated moderately high importance for floor height, building area highly influenced damage in events WP2021 and E2017. This could be attributed to the prevalence of single-storey, timber-framed buildings exposed to flooding in these events, which covered a smaller footprint area. These buildings are typically constructed with internal finishes comprising timber and composite materials [27], forming a high proportion of building replacement value [28] and having a high susceptibility to water damage. The lower importance of storeys and the structural frame suggests that damage susceptibility from non-structure components was influential in the damage outcomes observed for different flood contexts.

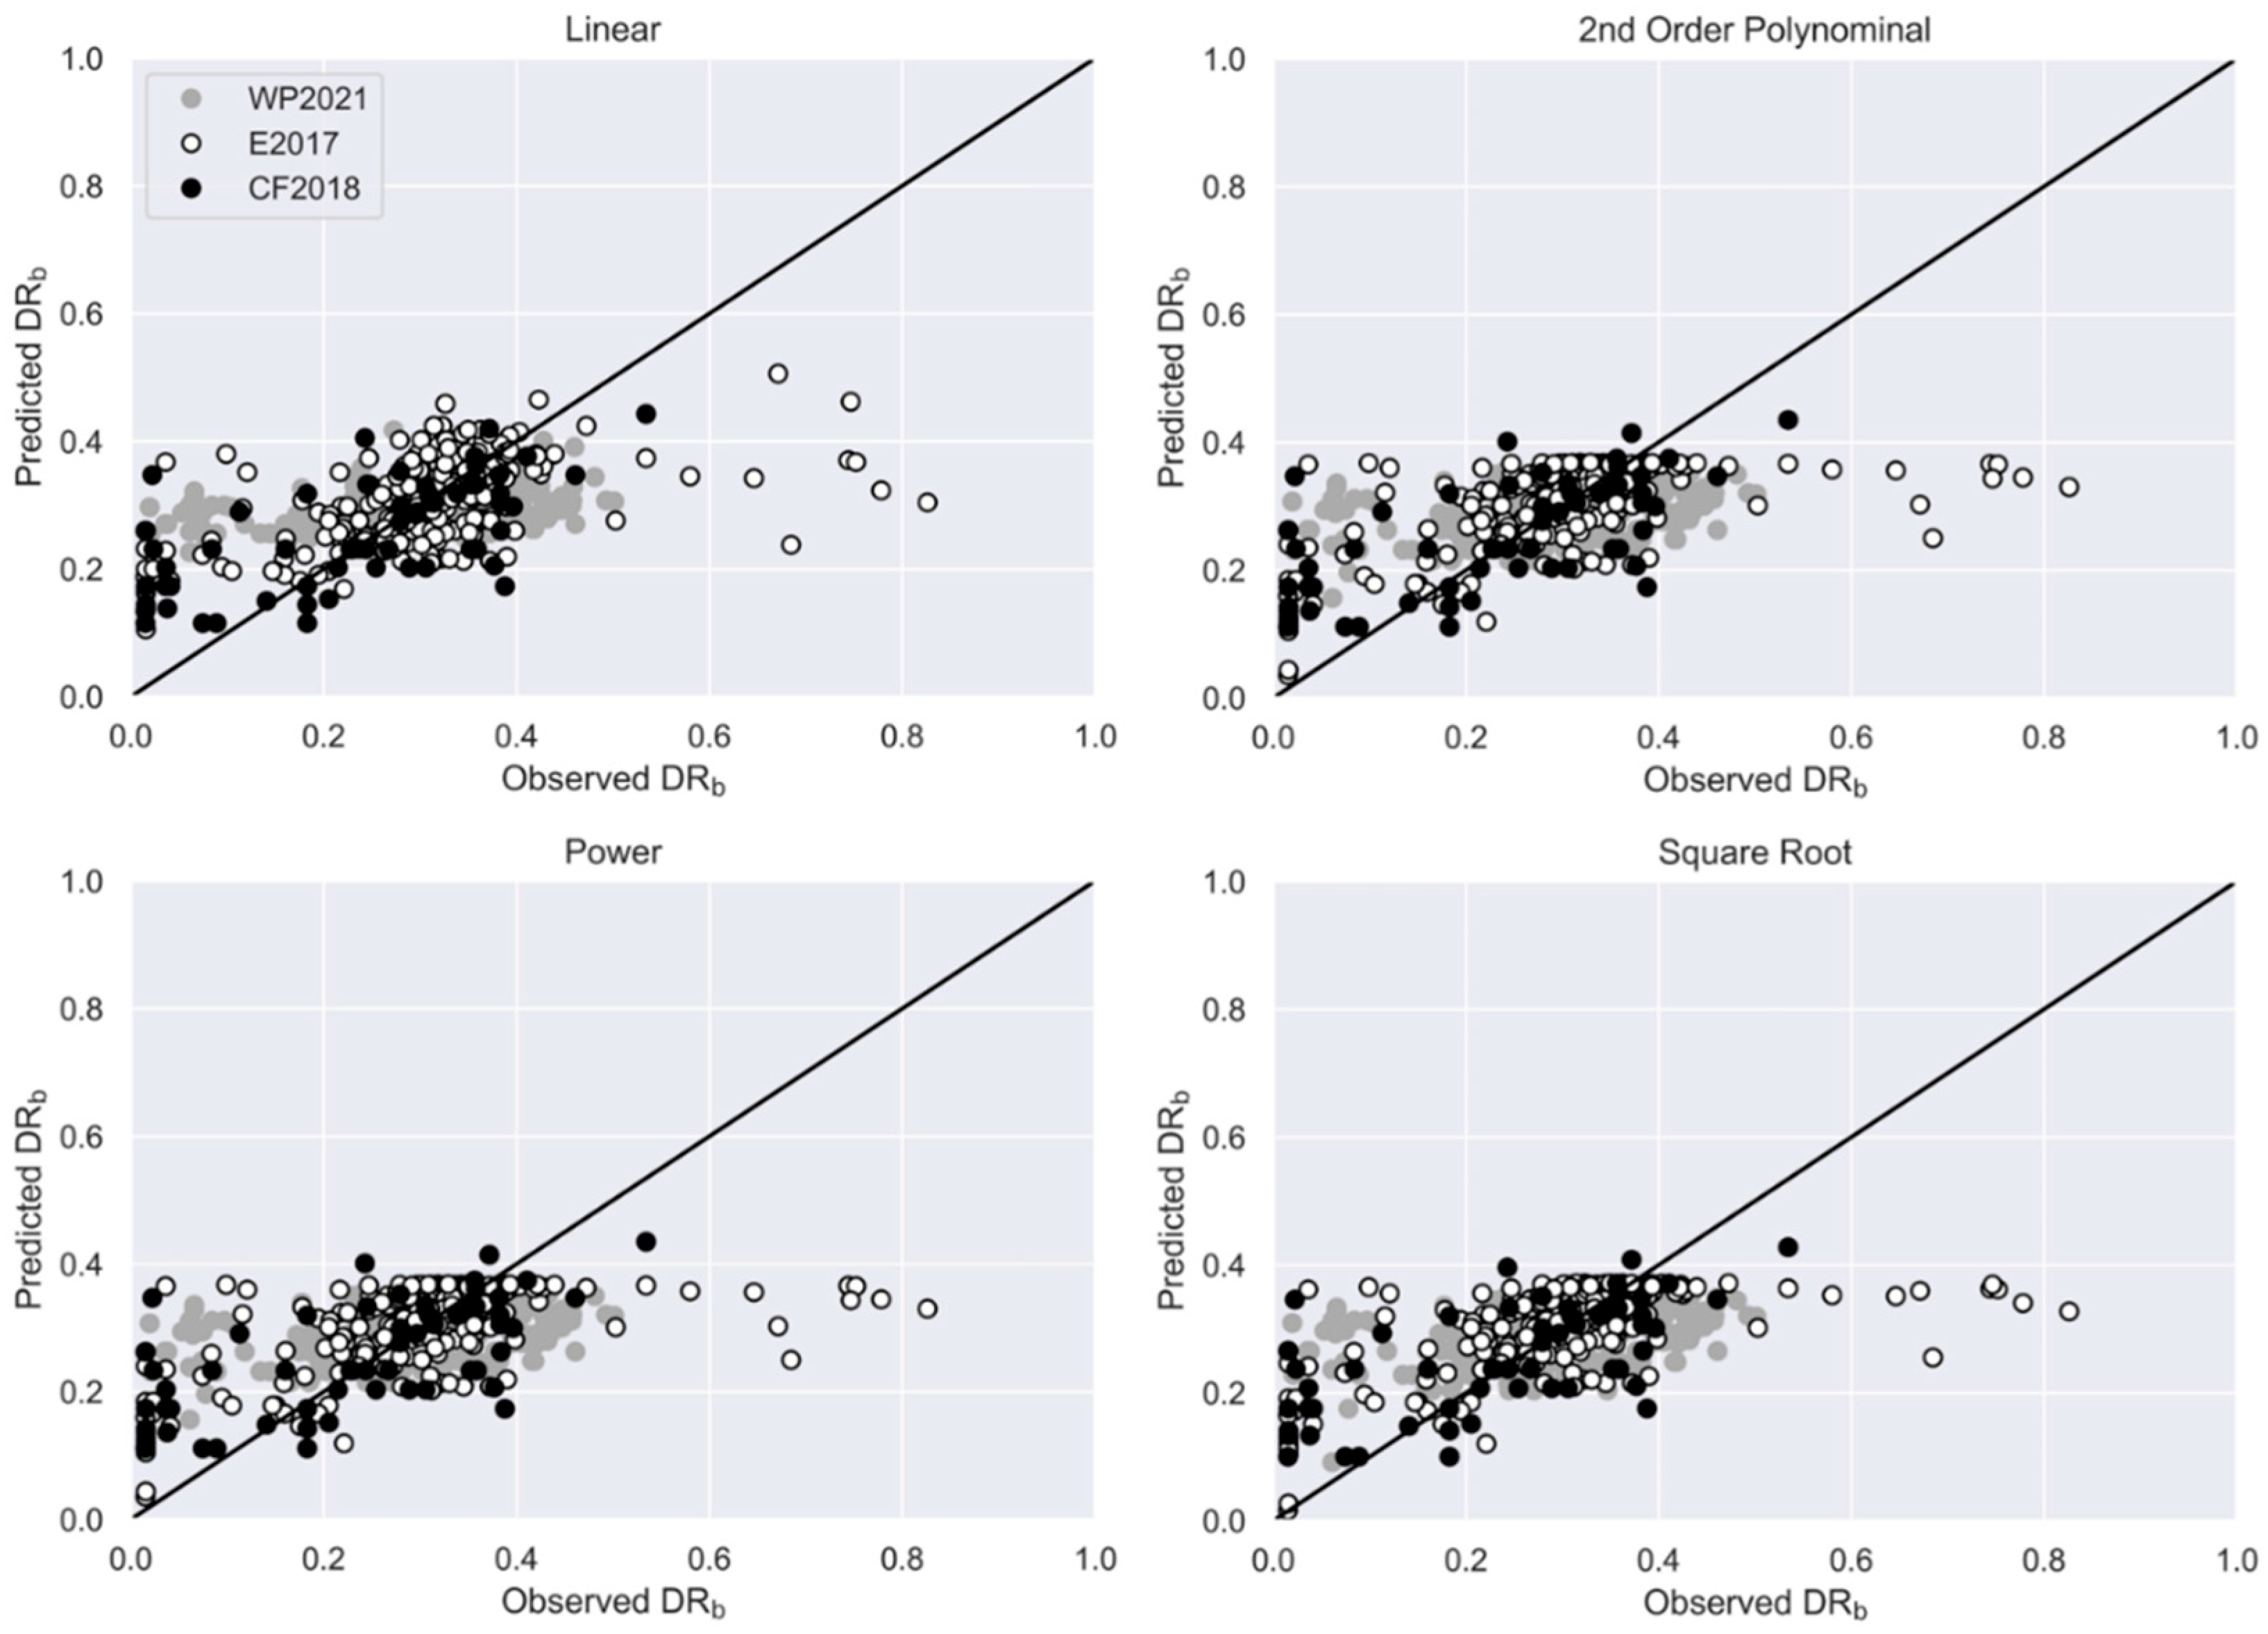
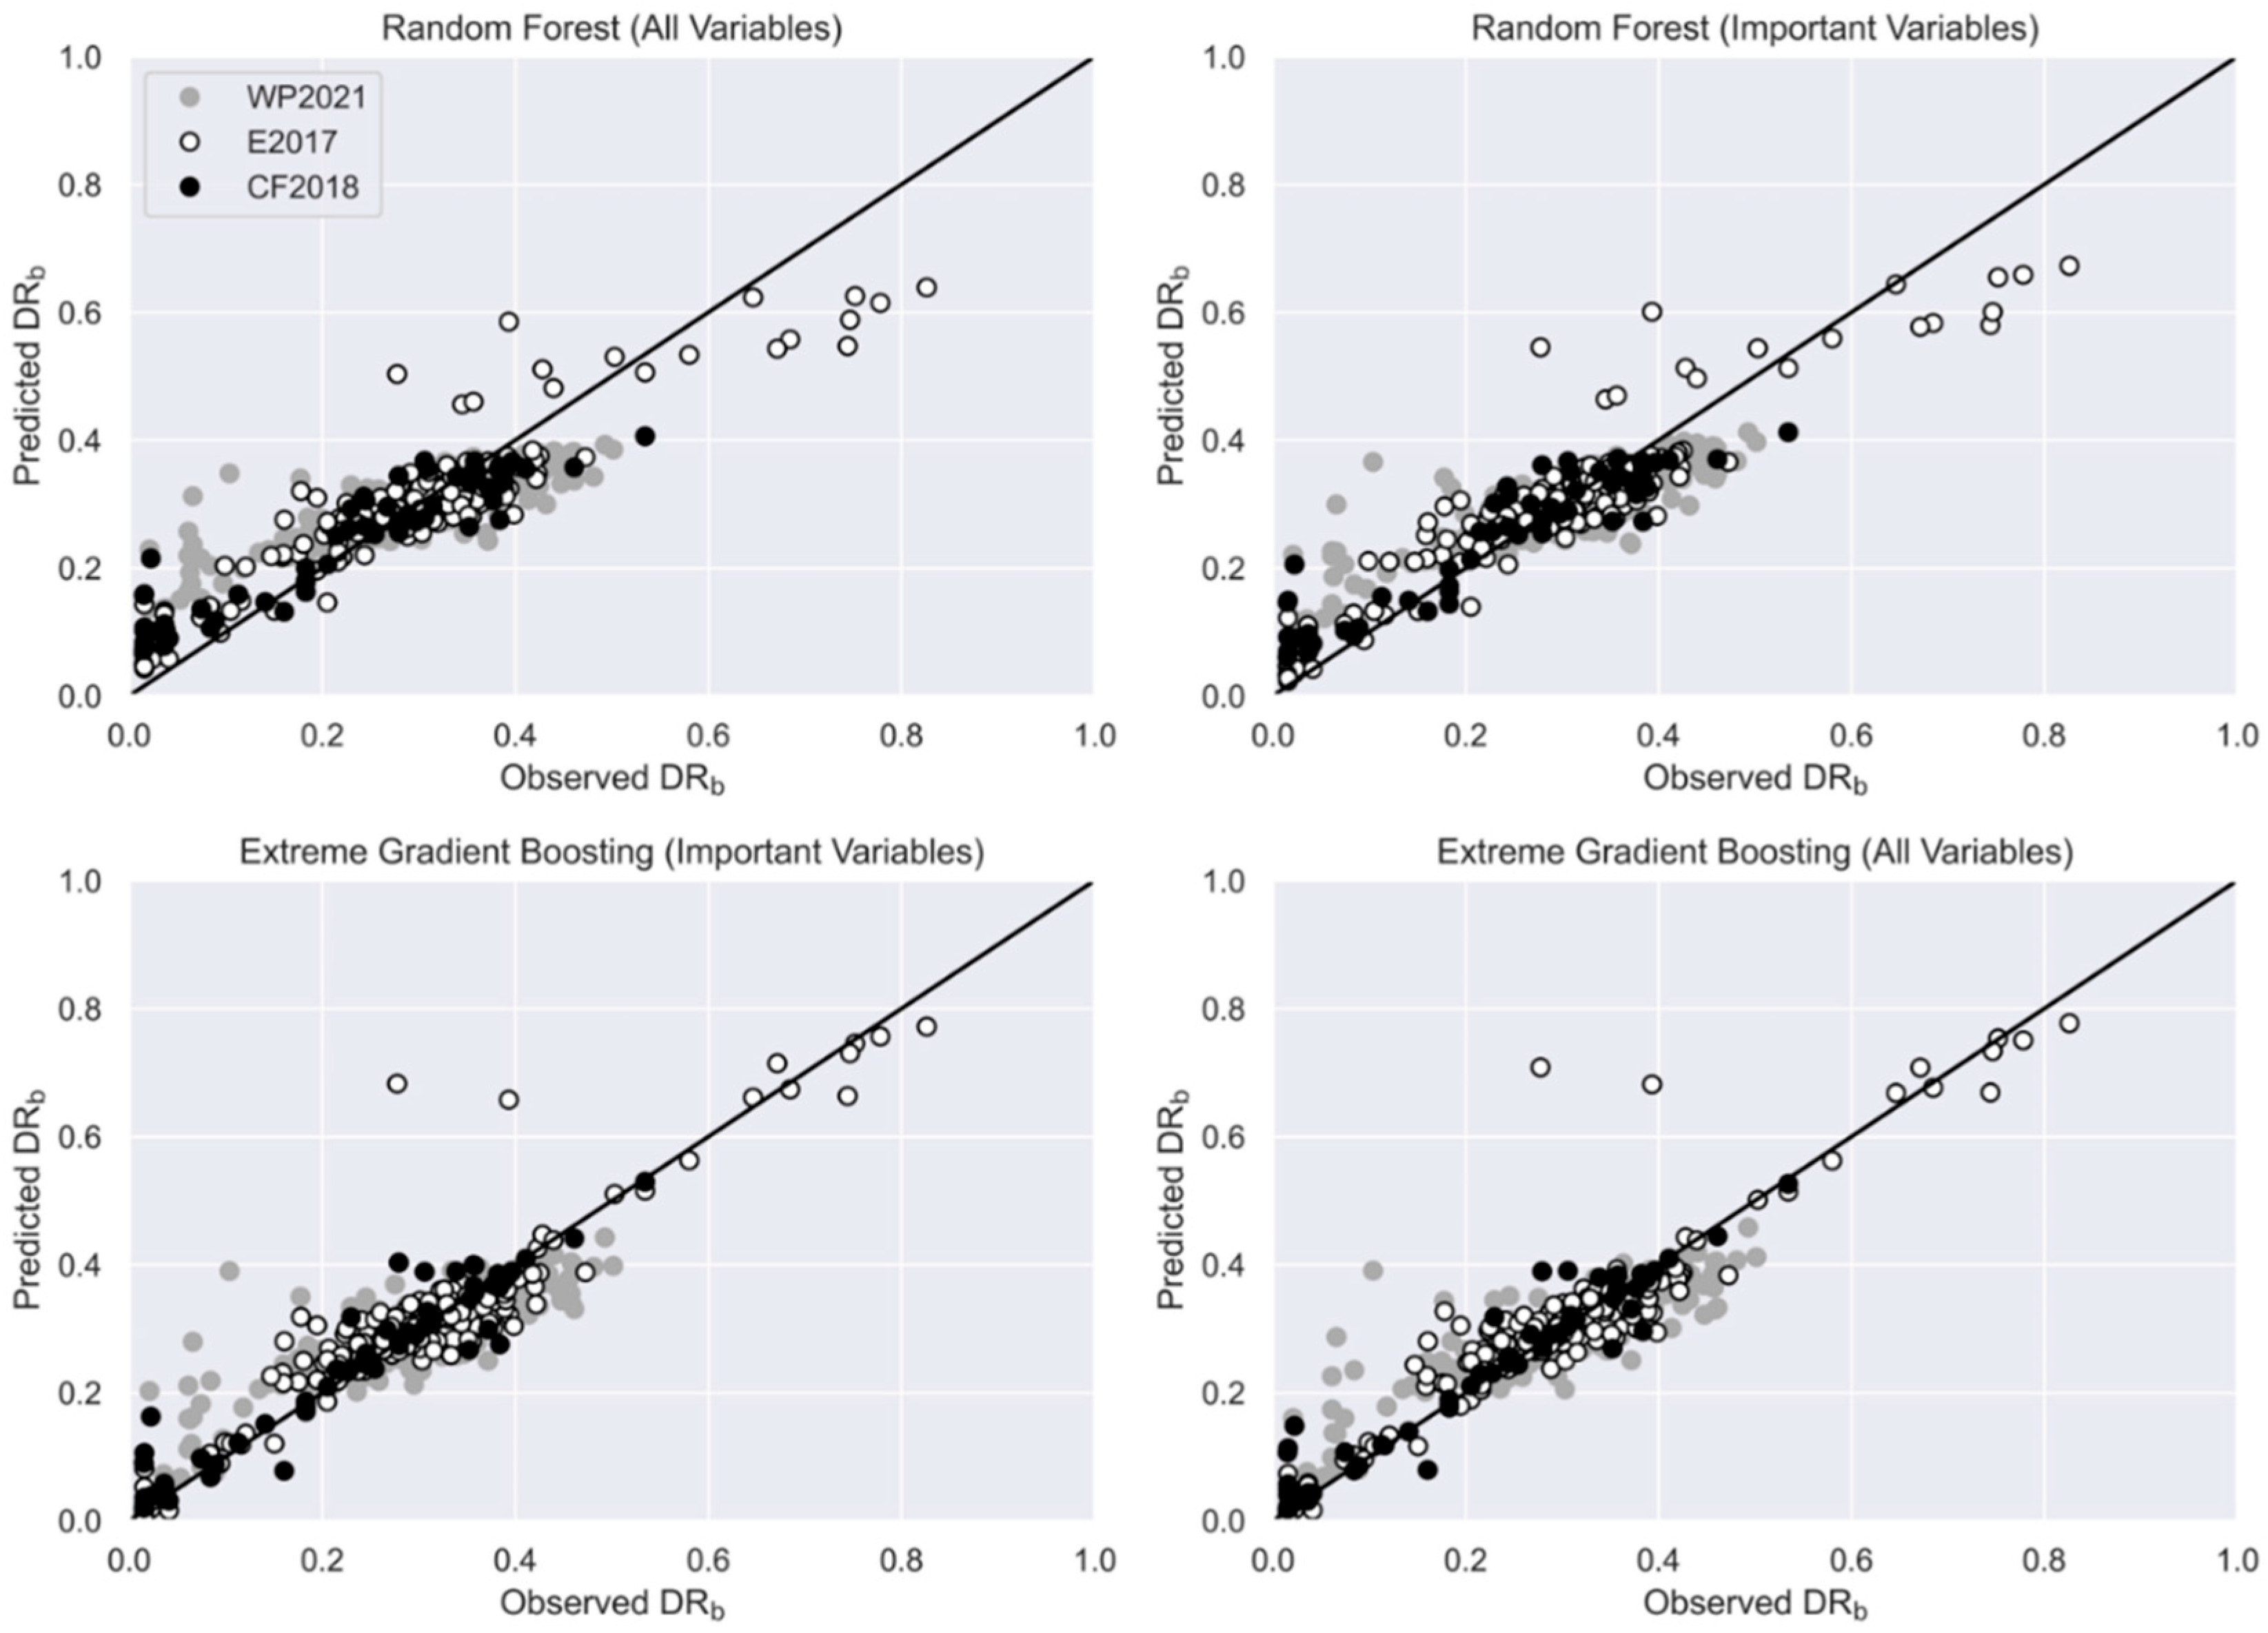
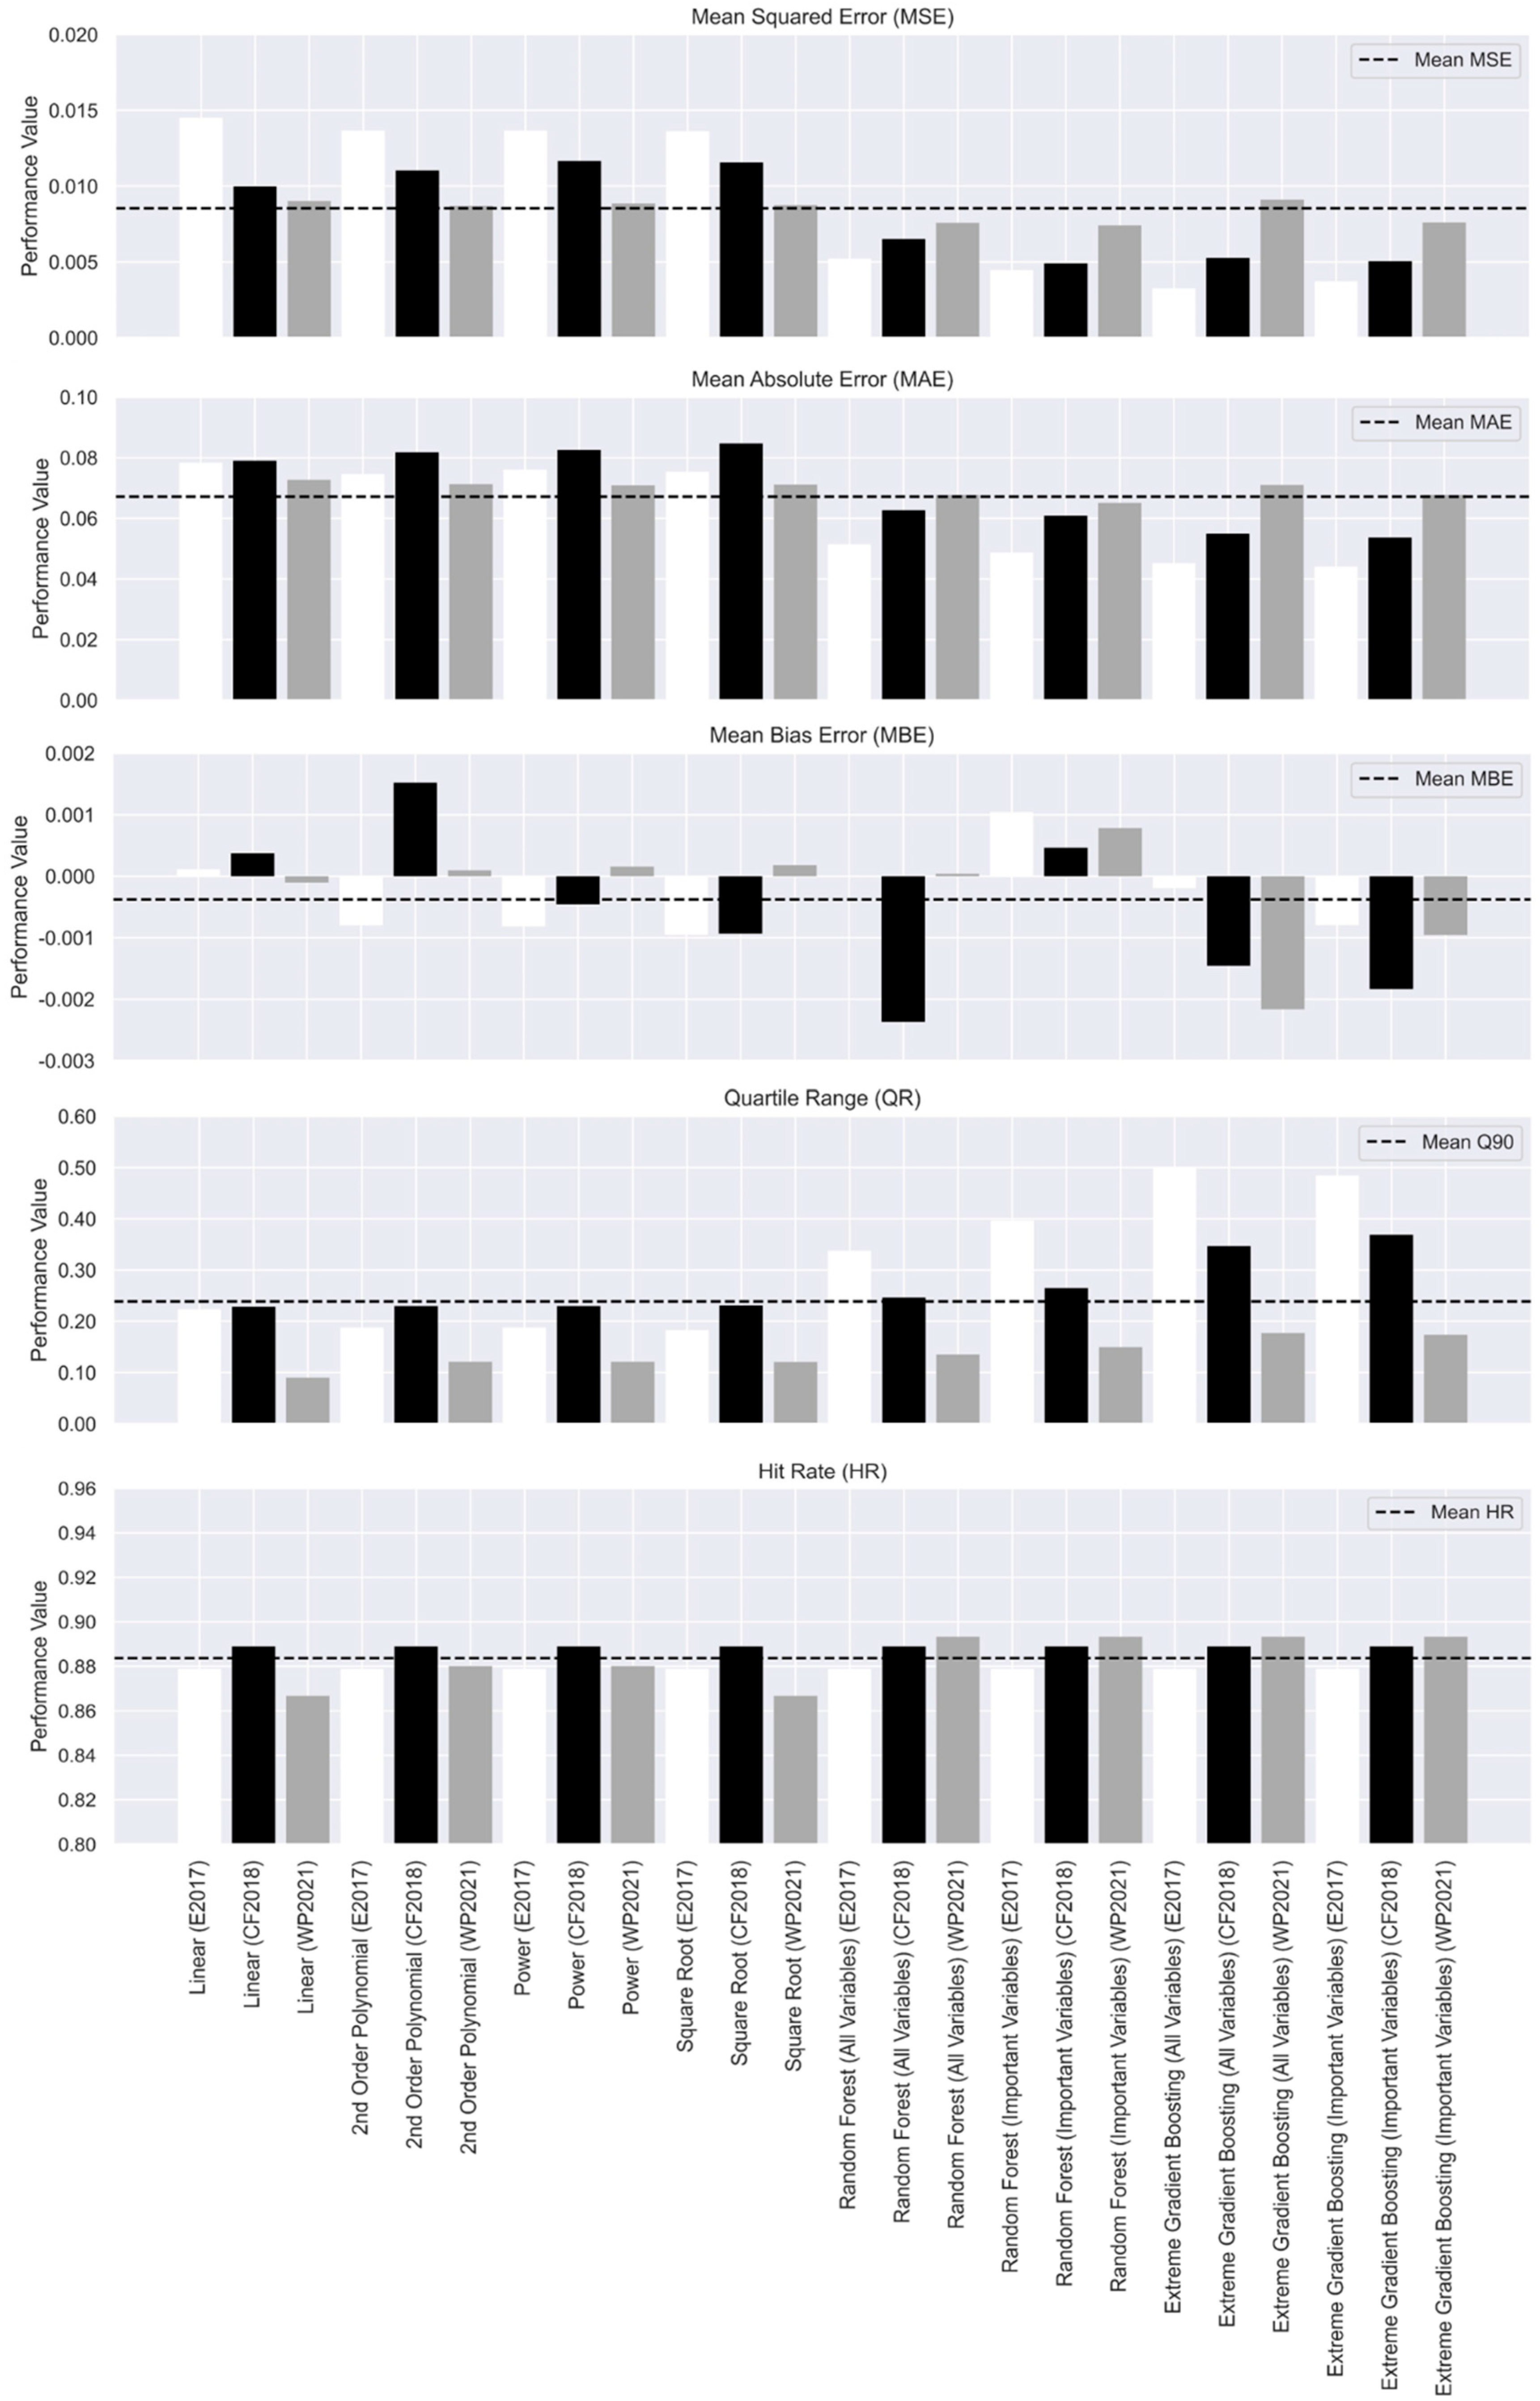
3.2. Event Damage Model Performance

The event damage predictions for univariable and multivariable models compared to observations are presented in Figure 3 and Figure 4, respectively. For consistency with international studies [5], univariable models predicted DRb in response to water depth above ground level. Square root and second-order polynomial regression demonstrated the highest prediction precision and reliability overall for the univariable models tested (Figure 5). Precision in terms of MSE and MAE was slightly higher (12% and 15%, respectively) than the linear regression model, the simplest and lowest-performing univariable model. The higher-performing square root regression was consistent with several international studies which observed similar univariable model trends in fluvial flood hazard contexts. Univariable hit rates (HRs) were higher for WP2021, ranging from 0.86 to 0.88, with a relatively lower uncertainty for its QR (0.08 to 0.12) compared to other events. Models for E2017 and CF2018 returned similar HR values but demonstrated larger uncertainties with QR, ranging between 0.18 and 0.23. Prediction uncertainties for these events could be attributed to highly localised flow conditions due to levee-breach failure (E2017) or wave action (CF2018), as indicated by the presence of flow velocity damage. Such conditions were not observed for WP2021, with damage more highly influenced by water depth (Figure 2). Additionally, larger uncertainties for CF2018 DRb predictions could be attributed to the small damage sample (n = 57) for model learning. Here, univariable model predictions demonstrated large variations relative to the 1:1 identity line shown in Figure 3. Model over- and under-prediction represents the inability of simple univariable models to represent the relationship between DRb and water depth above ground level when fewer damage samples are available for model learning.
Multivariable models assess interdependent relationships between various hazard and exposure factors to determine a damage outcome [10]. Here, Random Forest (RF) and Extreme Gradient Boosting (XGB) algorithms were learned for DRb prediction using two sets of explanatory variables: (1) all hazard and exposure variables and (2) the variables with cumulatively high importance for DRb prediction (i.e., mean decrease accuracy ≥0.2) across the studied events. The highest-performing algorithm and variable combination was then selected to compare model spatial transfer between different locations and flood hazard contexts.
Higher DRb prediction precision was observed for RF and XGB models compared to the univariable models investigated (Figure 4). MSE and MAE precision increases of over 40% were observed for multivariable models compared to square root and second-order polynomial regression. Such improvements in model predictions are visualised in Figure 4, whereby observed and predicted DRb returned by multivariable regression models demonstrate closer proximity to the 1:1 identity line compared to univariable models in Figure 3. Across all flood events, models learned on important explanatory variables for damage demonstrated higher precision than models considering all variables. This suggests that a larger explanatory variable range may cause model overfitting for damage prediction [14], highlighting a need to replicate local damage factors for reliable damage model applications.
RF and XGB models demonstrated similar predictive precision and reliability overall across flood events but showed relative variability for individual events (Figure 5). XGB models showed slightly higher prediction precision (i.e., MSE and MAE) for E2017 and CF2018 but lower precision for WP2021. XGB models also underpredicted DRb (i.e., MBE) for most events, whereas RF overpredicted more frequently. In addition, similar prediction reliability with HR values between 0.87 and 0.89 was observed, although XGB models demonstrated higher uncertainty (i.e., QR) for all flood events. Model uncertainty was higher for E2017 and CF2018, with both events observing building damage from a broader range of flood hazard characteristics (e.g., flow velocity). Limited damage-causing hazard characteristics observed for WP2021 likely resulted in comparatively lower uncertainties returned by multivariable models. These observations suggest that despite their potential for higher predictive precision, multivariable models predict damage with higher uncertainty when a larger range of hazard and exposure variables influence relative building damage for a location or flood event.

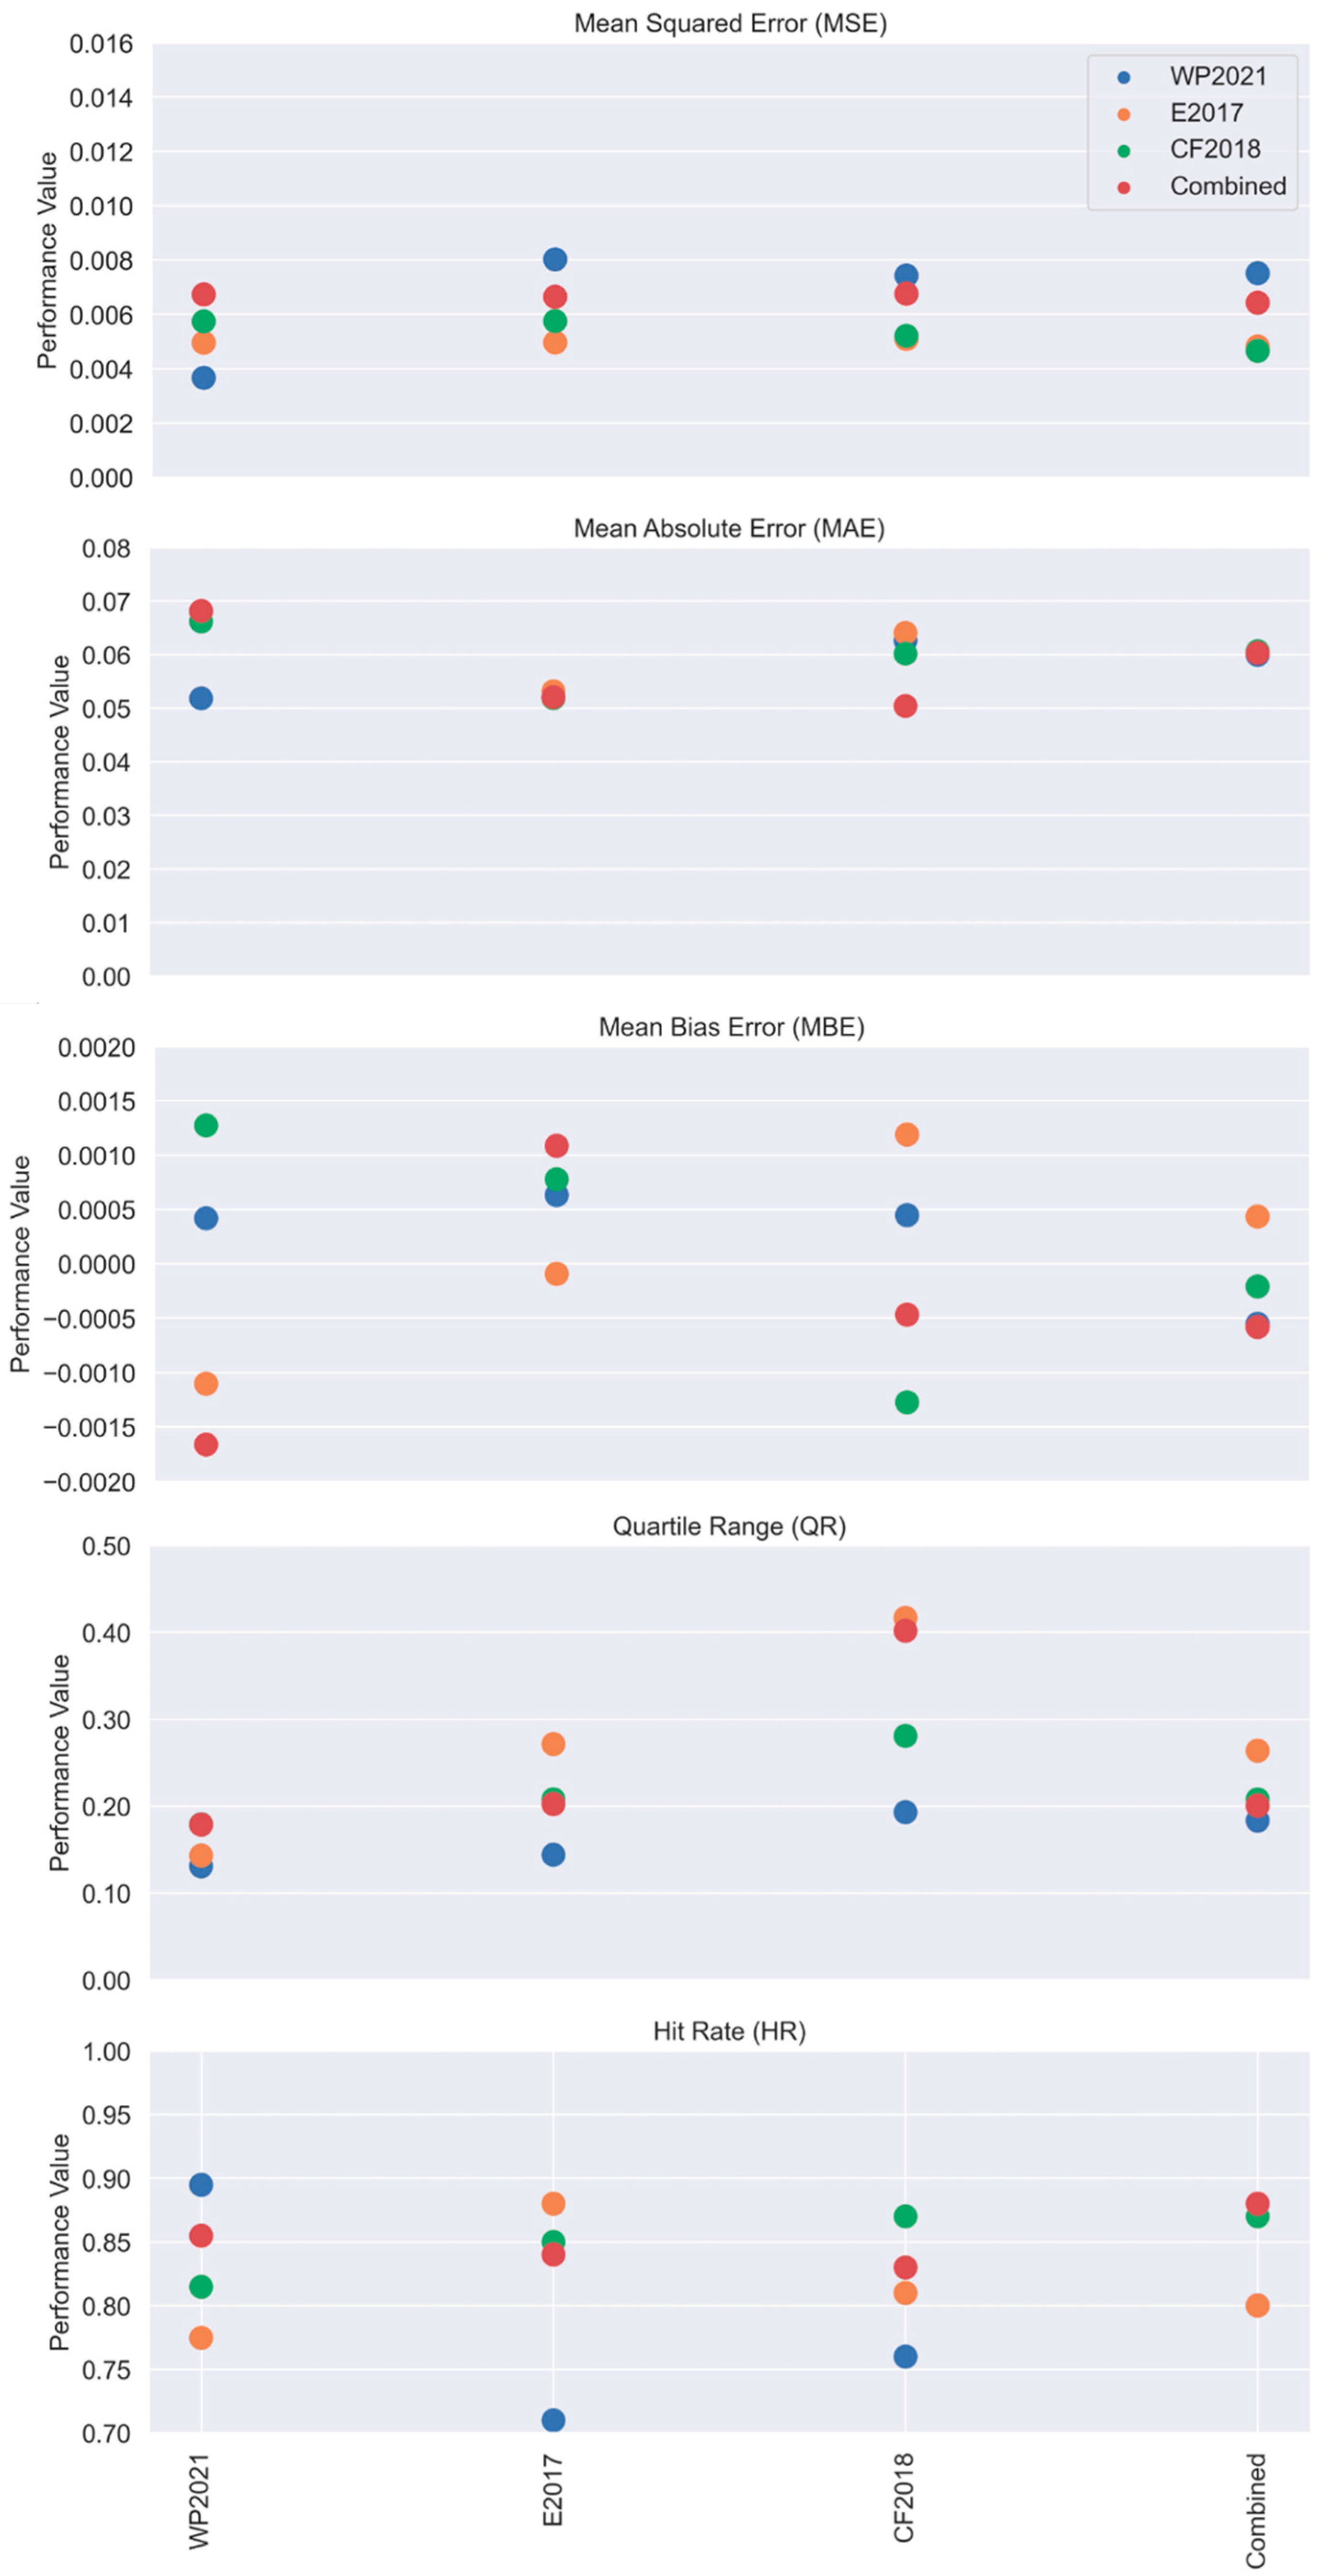
3.3. Model Transfer across Coastal and Fluvial Flood Events

Spatial transfer analysis was performed using the RF model and all explanatory variables across the studied flood events. A combined model learned for damage prediction using the complete WP2021, E2017 and CF2018 datasets was included. Precision and reliability metrics from transfer test models are presented in Figure 6.
Models learned for location-specific flood events showed relatively higher precision (i.e., MSE and MAE) for damage prediction compared to models learned for other locations and events. The combined model produced higher precision metrics with lower uncertainty (i.e., MBE) when applied to CF2018. This may suggest that explanatory damage variables across studied fluvial and coastal flood events adequately represent hazard and exposure characteristics leading to damage outcomes observed for CF2018. Buildings damaged in CF2018 were located on coastlines bordering sheltered wave environments [29,30], as confirmed by the importance of the water depth variable in explaining the observed damage (Figure 2). While higher precision was observed, high QR values indicated greater uncertainty in the combined model’s predicted damage outcomes for CF2018. This likely reflects the combined model’s inability to determine highly localised hazard conditions which influence building damage, such as wave impacts. This was also observed in fluvial events, as indicated by the WP2021 model’s lower precision and reliability when transferred to E2017, where high-velocity flows opposite a levee breach caused structure component damage [19]. These findings indicate that additional damage collection and analysis for buildings exposed to high-energy wave conditions are required to confirm the reliable use for models learned on fluvial and coastal flood events across different hazard contexts.
Explanatory variables representing localised hazard and building characteristics are critical for multivariable model applications in different flood hazard contexts [10]. Here, we observed that event models learned for E2017 and CF2018 predicted damage with higher precision for the combined event dataset compared with WP2021. The presence of velocity damage was not observed for buildings affected by the WP2021 event. Therefore, learned event model applications in flood contexts with high-energy conditions may return unreliable damage predictions. This was confirmed with WP2021 having lower HR values for E2017 and CF2018 (Figure 6) and conversely when these events were applied to WP2021.
While these findings indicate a need for location-based damage models which represent local damage conditions for coastal and fluvial flood hazard contexts, such approaches are highly data-driven, resource-intensive and reliant on frequent damaging events in locations of interest. With these limitations, future model improvements should focus on heterogeneous flood damage data collection to form an empirical dataset for model learning that is based on a broader range of hazard and building characteristics across coastal and fluvial flood hazard contexts.

4. Conclusions

This study analysed building damage model transfer across coastal and fluvial flood hazard contexts. We used empirical data from coastal, riverine and riverine-levee breach flooding events to analyse residential building damage. Damage was analysed by learning univariable and multivariable models to predict relative damage and determine the importance of explanatory variables for damage. We then evaluated the predictive performance of each event model and the combined event model to determine the capacity for reliable model transfer across different flood hazard contexts.
The damage analysis showed that a larger hazard and exposure explanatory variable range improved damage prediction precision. Multivariable models using Random Forest and Extreme Gradient Boosting algorithm implementations using all explanatory variables, or important variables, for damage demonstrated higher precision than univariable models learned to predict damage in response to water depth above ground. This finding supports a move towards multivariable model applications that consider hazard and exposure explanatory variables influencing building damage for the location or flood hazard context.
Multivariable model transfer analysis showed that models learned on event-specific damage data frequently predicted damage with higher precision compared to models learned on all damage data or data from other locations and events. Localised phenomena, such as conditions leading to velocity damage, influenced model transfer performance. Where local damage factors were not represented by models learned for other flood events, damage prediction precision and reliability were reduced. These findings further highlight the need for damage models to replicate local damage factors for reliable application across different flood hazard contexts.

Author Contributions

Conceptualisation, R.P. and S.W.; methodology, R.P.; software, R.P. and B.P.; writing—original draft preparation, R.P. and S.W.; writing—review and editing, R.P., S.W. and B.P.; visualisation, R.P. and B.P.; project administration, R.P. and S.W.; funding acquisition, R.P. All authors have read and agreed to the published version of the manuscript.

Funding

The work presented was funded by the National Institute of Water and Atmospheric Research (NIWA) Strategic Scientific Interest Fund work programme on ‘Hazard Exposure and Vulnerability’ (CARH2305); the New Zealand Ministry of Business, Innovation, and Employment (MBIE) Endeavour Fund (CONT-69394-ENDRP-NIW); and the National Science Challenge: Resilience Challenge ‘Coasts’ programme (GNS-RNC040).

Data Availability Statement

The data that support the findings of this study are available from the corresponding author upon reasonable request.

Acknowledgments

The authors would like to thank the organisations in the Bay of Plenty (Whakatane District Council and Environment Bay of Plenty), Tasman and Nelson (Tasman District Council, Tasman-Nelson Civil Defence Emergency Management Group) and West Coast (Buller District Council, West Coast Regional Council and West Coast Civil Defence Emergency Management Group) for providing intelligence on flood damaged building locations and local communications with affected residents for the purposes of our damage assessment activities. Jeff Farrell, Mark Ivamy, Matt Harrex, Glenn Stevens, Jake Langdon, Jolene Patterson and Erica Andrews are especially thanked for their assistance and helpful advice in the field. The anonymous reviewers are thanked.

Conflicts of Interest

The authors declare no conflict of interest.

References

  1. Munich Re Risks Posed by Natural Disasters. Losses from Natural Disasters. Available online: https://www.munichre.com/en/risks/natural-disasters.html (accessed on 24 April 2023).
  2. Hallegatte, S.; Green, C.; Nicholls, R.J.; Corfee-Morlot, J. Future flood losses in major coastal cities. Nat. Clim. Chang. 2013, 3, 802–806. [Google Scholar] [CrossRef]
  3. Vousdoukas, M.I.; Mentaschi, L.; Voukouvalas, E.; Bianchi, A.; Dottori, F.; Feyen, L. Climatic and socioeconomic controls of future coastal flood risk in Europe. Nat. Clim. Chang. 2018, 8, 776–780. [Google Scholar] [CrossRef]
  4. Merz, B.; Kreibich, H.; Schwarze, R.; Thieken, A. Review article “Assessment of economic flood damage”. Nat. Hazards Earth Syst. Sci. 2010, 10, 1697–1724. [Google Scholar] [CrossRef]
  5. Gerl, T.; Kreibich, H.; Franco, G.; Marechal, D.; Schröter, K. A review of flood loss models as basis for harmonization and benchmarking. PLoS ONE 2016, 11, e0159791. [Google Scholar] [CrossRef] [PubMed]
  6. Vousdoukas, M.I.; Bouziotas, D.; Giardino, A.; Bouwer, L.M.; Mentaschi, L.; Voukouvalas, E.; Feyen, L. Understanding epistemic uncertainty in large-scale coastal flood risk assessment for present and future climates. Nat. Hazards Earth Syst. Sci. 2018, 18, 2127–2142. [Google Scholar] [CrossRef]
  7. Merz, B.; Kreibich, H.; Lall, U. Multi-variate flood damage assessment: A tree-based data-mining approach. Nat. Hazards Earth Syst. Sci. 2013, 13, 53–64. [Google Scholar] [CrossRef]
  8. Carisi, F.; Schröter, K.; Domeneghetti, A.; Kreibich, H.; Castellarin, A. Development and assessment of uni-and multivariable flood loss models for Emilia-Romagna (Italy). Nat. Hazards Earth Syst. Sci. 2018, 18, 2057–2079. [Google Scholar] [CrossRef]
  9. Wagenaar, D.; De Jong, J.; Bouwer, L.M. Multi-variable flood damage modelling with limited data using supervised learning approaches. Nat. Hazards Earth Syst. Sci. 2017, 17, 1683–1696. [Google Scholar] [CrossRef]
  10. Wagenaar, D.; Lüdtke, S.; Schröter, K.; Bouwer, L.M.; Kreibich, H. Regional and temporal transferability of multivariable flood damage models. Water Resour. Res. 2018, 54, 3688–3703. [Google Scholar] [CrossRef]
  11. Schröter, K.; Kreibich, H.; Vogel, K.; Riggelsen, C.; Scherbaum, F.; Merz, B. How useful are complex flood damage models? Water Resour. Res. 2014, 50, 3378–3395. [Google Scholar] [CrossRef]
  12. Amadio, M.; Scorzini, A.R.; Carisi, F.; Essenfelder, A.H.; Domeneghetti, A.; Mysiak, J.; Castellarin, A. Testing empirical and synthetic flood damage models: The case of Italy. Nat. Hazards Earth Syst. Sci. 2019, 19, 661–678. [Google Scholar] [CrossRef]
  13. Schröter, K.; Lüdtke, S.; Redweik, R.; Meier, J.; Bochow, M.; Ross, L.; Nagel, C.; Kreibich, H. Flood loss estimation using 3D city models and remote sensing data. Environ. Model. Softw. 2018, 105, 118–131. [Google Scholar] [CrossRef]
  14. Cerri, M.; Steinhausen, M.; Kreibich, H.; Schröter, K. Are OpenStreetMap building data useful for flood vulnerability modelling? Nat. Hazards Earth Syst. Sci. 2021, 21, 643–662. [Google Scholar] [CrossRef]
  15. Cammerer, H.; Thieken, A.H.; Lammel, J. Adaptability and transferability of flood loss functions in residential areas. Nat. Hazards Earth Syst. Sci. 2013, 13, 3063–3081. [Google Scholar] [CrossRef]
  16. Di Bacco, M.; Rotello, P.; Suppasri, A.; Scorzini, A.R. Leveraging data driven approaches for enhanced tsunami damage modelling: Insights from the 2011 Great East Japan event. Environ. Model. Softw. 2023, 160, 105604. [Google Scholar] [CrossRef]
  17. Vescovo, R.; Adriano, B.; Mas, E.; Koshimura, S. Beyond tsunami fragility functions: Experimental assessment for building damage estimation. Sci. Rep. 2023, 13, 14337. [Google Scholar] [CrossRef]
  18. Smart, G.M.; McKerchar, A.I. More flood disasters in New Zealand. J. Hydrol. 2010, 49, 69–78. [Google Scholar]
  19. Paulik, R.; Wild, A.; Zorn, C.; Wotherspoon, L. Residential building flood damage: Insights on processes and implications for risk assessments. J. Flood Risk Manag. 2022, 15, e12832. [Google Scholar] [CrossRef]
  20. Paulik, R.; Zorn, C.; Wotherspoon, L. Evaluating the spatial application of multivariable flood damage models. J. Flood Risk Manag. 2023, e12934. [Google Scholar] [CrossRef]
  21. Pedregosa, F.; Varoquaux, G.; Gramfort, A.; Michel, V.; Thirion, B.; Grisel, O.; Blondel, M.; Prettenhofer, P.; Weiss, R.; Dubourg, V.; et al. Scikit-learn: Machine learning in Python. J. Mach. Learn. Res. 2011, 12, 2825–2830. [Google Scholar]
  22. Chen, T.; Guestrin, C. Xgboost: A scalable tree boosting system. In Proceedings of the 22nd ACM SIGKDD International Conference on Knowledge Discovery and Data Mining, San Francisco, CA, USA, 13–17 August 2016; pp. 785–794. [Google Scholar]
  23. Breiman, L. Random forests. Mach. Learn. 2001, 45, 5–32. [Google Scholar] [CrossRef]
  24. Liaw, A.; Wiener, M. Classification and regression by Random Forest. R News 2002, 2, 18–22. [Google Scholar]
  25. Kohavi, R. A study of cross-validation and bootstrap for accuracy estimation and model selection. Ijcai 1995, 14, 1137–1145. [Google Scholar]
  26. Thordarson, F.Ö.; Breinholt, A.; Møller, J.K.; Mikkelsen, P.S.; Grum, M.; Madsen, H. Evaluation of probabilistic flow predictions in sewer systems using grey box models and a skill score criterion. Stoch. Environ. Res. Risk Assess. 2012, 26, 1151–1162. [Google Scholar] [CrossRef]
  27. BRANZ. Renovate—The Technical Resource for Industry on the Renovation of Houses from Different Eras. Available online: https://www.renovate.org.nz/ (accessed on 23 May 2023).
  28. Quotable Value. CostBuilder. Available online: https://costbuilder.qv.co.nz/ (accessed on 23 May 2023).
  29. Godoi, V.A.; Bryan, K.R.; Stephens, S.A.; Gorman, R.M. Extreme waves in New Zealand waters. Ocean Model. 2017, 117, 97–110. [Google Scholar] [CrossRef]
  30. Paulik, R.; Wild, A.; Stephens, S.; Welsh, R.; Wadhwa, S. National assessment of extreme sea-level driven inundation under rising sea levels. Front. Environ. Sci. 2023, 10, 1045743. [Google Scholar] [CrossRef]
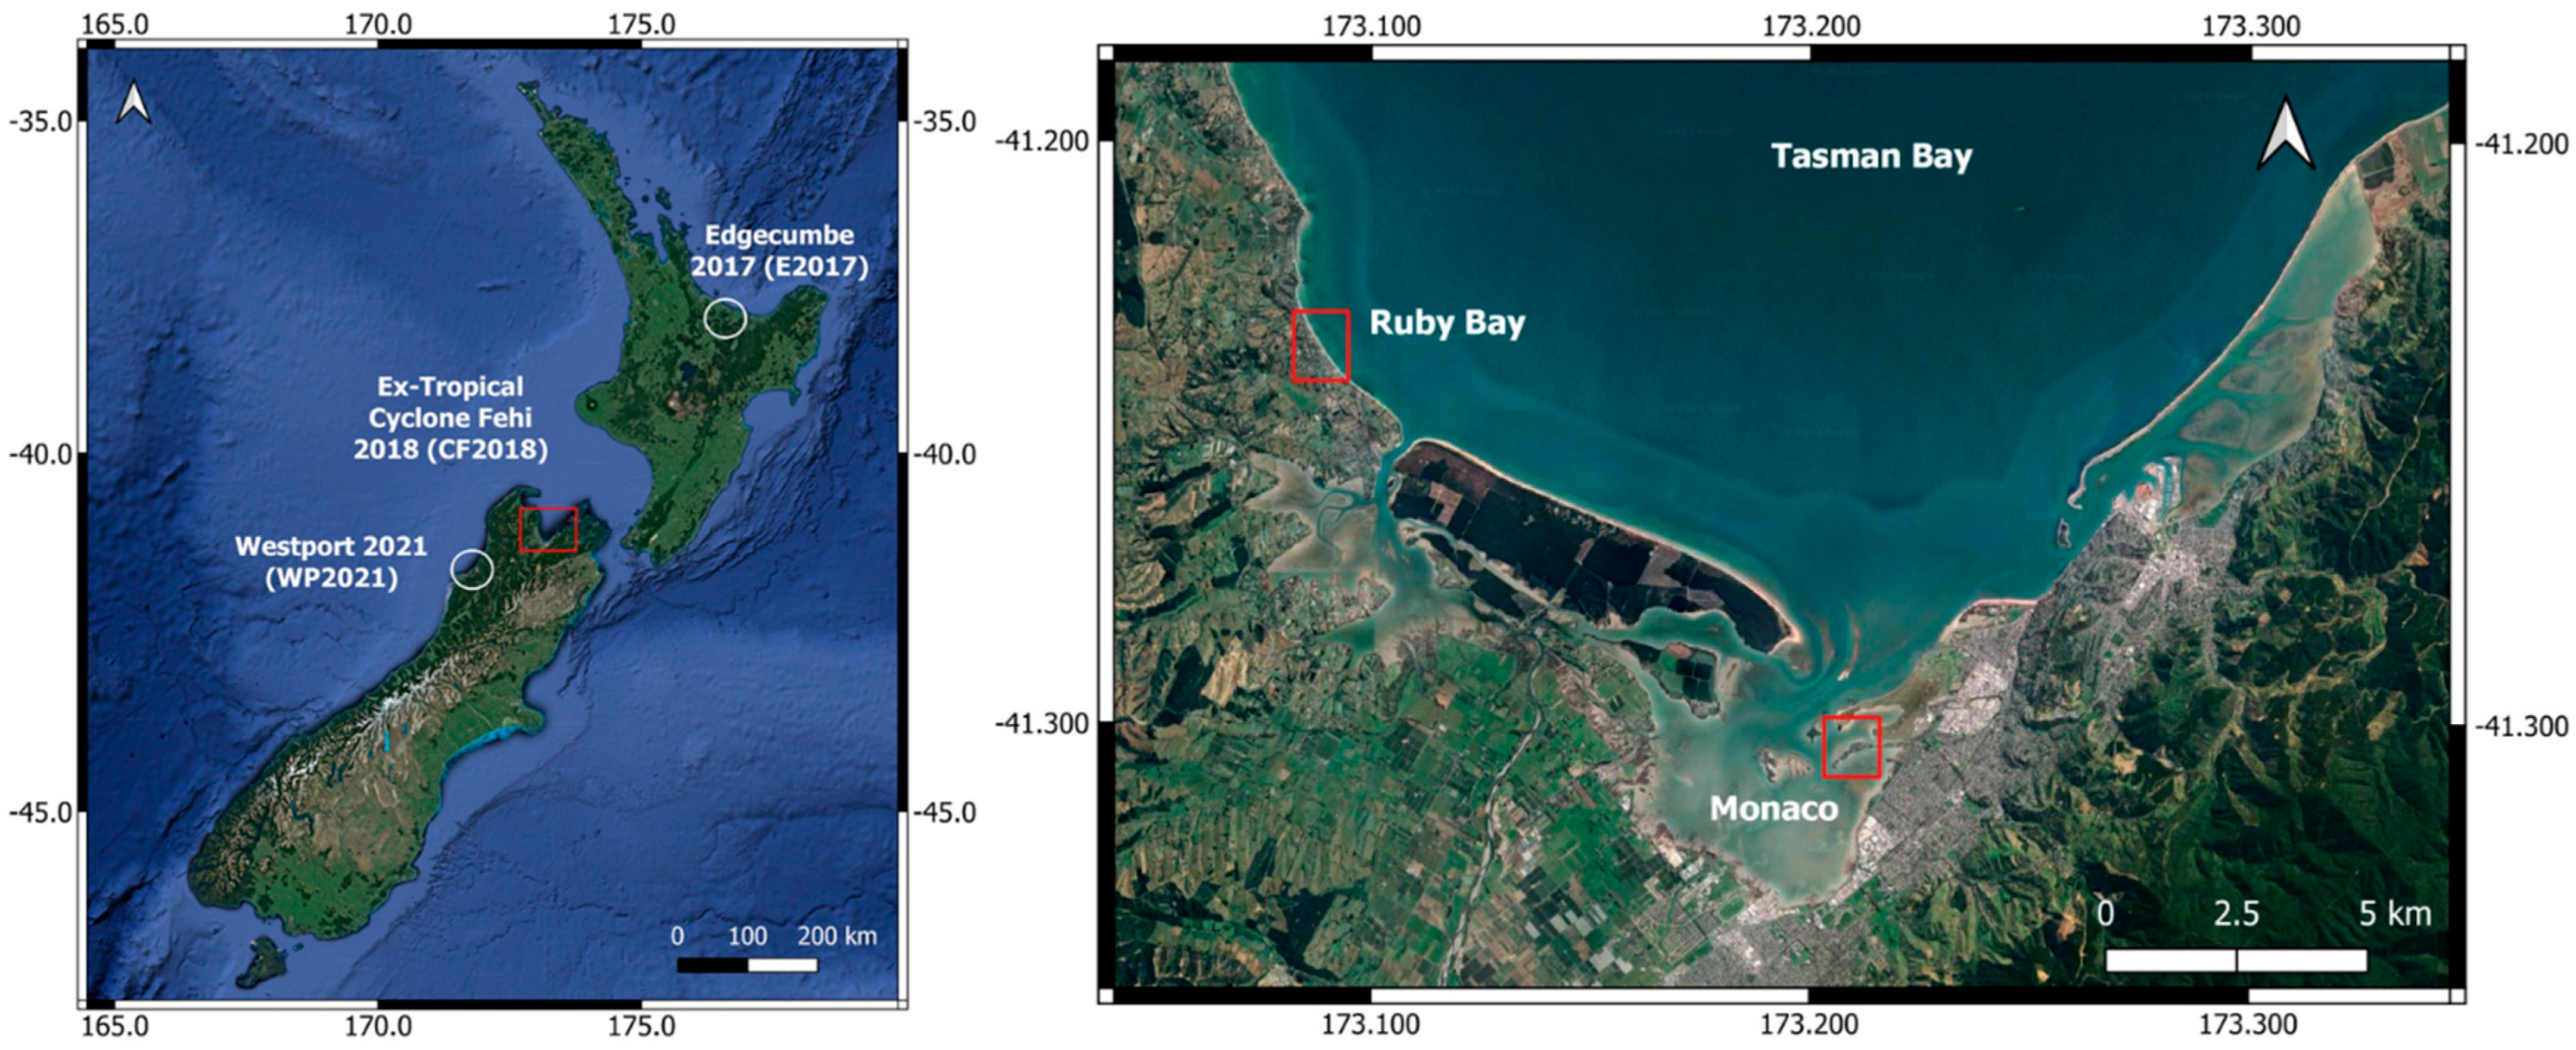
Figure 1. Flood events and locations of empirical building damage data analysed in this study. Fluvial (white circles) and coastal (red square) flooding events are denoted with Ex-Tropical Cyclone Fehi 2018 damage assessment locations shown in the right-hand panel.
Jmse 11 01960 g001
Figure 2. Feature importance for relative building damage (DRb) prediction returned from Random Forest and Extreme Gradient Boosting models.
Jmse 11 01960 g002
Figure 3. Prediction performance for relative building damage (DRb) estimated from univariable models.
Jmse 11 01960 g003
Figure 4. Prediction performance for relative building damage (DRb) estimated from multivariable models.
Jmse 11 01960 g004
Figure 5. Mean prediction performance values for study events returned by univariable and multivariable models for relative building damage (DRb) prediction.
Jmse 11 01960 g005
Figure 6. Mean prediction performance values for relative building damage (DRb) prediction returned for model spatial transfer between study events.
Jmse 11 01960 g006
Table 1. Summary of damage samples collected from New Zealand flood events analysed in this study (adapted from [20]). Explanatory variables are presented in Table 2.
Flood EventDateLocation (Territory)Flood TypeData Samples Explanatory Variables
Edgecumbe 2017 (E2017)6 April
2017
Edgecumbe
(Whakatane District)
Riverine-Levee Breach22028
Ex-Tropical Cyclone Fehi 2018 (CF2018)1 February
2018
Ruby Bay
(Tasman District),
Monaco (Nelson City)
Coastal5726
Westport 2021 (WP2021)17 July
2021
Westport
(Buller District)
Riverine24735
Table 2. Residential building damage variables assessed in studied flood events (adapted from [17]).
VariableTypes or DescriptionData TypeUnit or Value
Hazard Water depth above ground levelMaximum water depth above ground level Decimalm
Water depth above floor levelMaximum water depth above first finished floor level Decimalm
Flow VelocityPresence of flow velocity damage on building Boolean0 = false; 1 = true
DebrisPresence of debris damage on building Boolean0 = false; 1 = true
ContaminationPresence of contamination damage on building Boolean0 = false; 1 = true
ExposureAreaBuilding roof outline areaIntegerm2
Dwelling TypeDetached; Joined; Attached; Apartment Text4 classes
Structural FrameBrick masonry; Concrete masonry; Timber; SteelText4 classes
Floor HeightFirst finished floor level height above ground level Decimalm
FoundationConcrete slab; Pile; Solid wall; MixedText4 classes
Construction Period<1900; 1900–1920; 1920–1940; 1940–1960; 1960–1980; 1980–2000; 2000–2020Text7 classes
StoreysNumber of complete building floor levels Integer1 to ∞
Wall CladdingBrick masonry; Concrete block; Fibre-cement; Fibrolite; Mixed material; Roughcast; Sheet metal; WeatherboardText8 classes
DamageDamage Ratio Relative damage to the residential building or its componentsDecimal0 to 1
Table 3. Evaluation metrics for model DRb predictions (pred) relative to DRb observations (obs).
Performance MetricFormula
Mean Squared Error (MSE) M S E = 1 n i = 1 n ( p r e d o b s ) 2
Mean Absolute Error (MAE) M A E = 1 n i = 1 n p r e d o b s
Mean Bias Error (MBE) M B E = 1 n i = 1 n ( p r e d o b s )
Quantile Range (QR) Q R = 1 n i = 1 n p r e d q 95 p r e d q 5
Hit Rate (HR) H R = 1 n i = 1 n h i   ; h = 1   w h e r e   p r e d q 5 i   o b s i p r e d q 95 i 0   o t h e r w i s e ,
Disclaimer/Publisher’s Note: The statements, opinions and data contained in all publications are solely those of the individual author(s) and contributor(s) and not of MDPI and/or the editor(s). MDPI and/or the editor(s) disclaim responsibility for any injury to people or property resulting from any ideas, methods, instructions or products referred to in the content.

