Article

Empirical Fragility Assessment of Three-Waters and Railway Infrastructure Damaged by the 2015 Illapel Tsunami, Chile

1
School of Earth and Environment, University of Canterbury, Christchurch 8041, New Zealand
2
National Institute of Water and Atmospheric Research, Wellington 6021, New Zealand
*
Author to whom correspondence should be addressed.
J. Mar. Sci. Eng. 2023, 11(10), 1991; https://doi.org/10.3390/jmse11101991
Submission received: 29 August 2023 / Revised: 2 October 2023 / Accepted: 9 October 2023 / Published: 16 October 2023
(This article belongs to the Special Issue Coastal Flooding: Causes, Impacts and Mitigation)

Abstract

:
Despite the importance of critical infrastructure for the effective functioning of communities, their vulnerability to tsunamis remains unstudied. This study addresses this issue by developing empirical fragility curves for infrastructure components currently absent from tsunami vulnerability research. This research applies post-event damage data from the 2015 Illapel tsunami in a cumulative link model (CLM) to form fragility curves for three-waters (manholes, culverts, and drain inlets) and railway infrastructure components. The synthesized fragility curves reveal that in response to the flow depth, culverts exhibit the highest vulnerability of all the infrastructures studied. The curves also suggest that culverts, drain inlets, and railways have higher vulnerability when compared to infrastructure such as roads or utility poles.

1. Introduction

Critical infrastructure networks are vital for the socio-economic functioning of coastal communities [1,2]. Tsunamis have a high potential to physically damage network components and disrupt their services. To better manage the risks of tsunamis for the built environment, impact assessments are commonly performed to inform disaster risk managers in their decision-making [3,4,5]. Impact assessments use hazard, exposure, and vulnerability information to estimate the socio-economic consequences of tsunami events.
Tsunami vulnerability models define a metric of impact (e.g., damage level) for a given hazard intensity (e.g., flow depth) [6,7,8,9]. The model approaches include vulnerability indices (e.g., [10,11]), damage matrices (e.g., [8]), damage curves (e.g., [12]), multivariate models (e.g., [13]), non-linear models (e.g., [14]), and fragility curves (e.g., [15,16]). Vulnerability indices represent a qualitative system ranking susceptibility to impacts. Damage matrices define the probability of a specific hazard intensity level. Damage curves provide a continuous impact or loss ratio for a given hazard intensity measure (HIM) [9]. Fragility curves derive the probability of the exceedance of different damage limit states for a given intensity measure (HIM) (e.g., [16]) and are widely considered a best-practice approach for tsunami impact assessment, provided appropriate curves are available for the local hazard and exposure context.
Previous tsunami vulnerability studies have focused on various infrastructures, including roads [2], bridges [17], and structures [12,16,18]. The approaches for evaluating the vulnerability of these stated infrastructures have included the development of fragility curves and damage matrices [12,18,19]. While previous studies have examined the damage inflicted on three-waters and railway infrastructure qualitatively [19], quantitative vulnerability assessments of these assets remain a knowledge gap. This knowledge gap extends to other critical infrastructures like electricity, fuel, and telecommunications [20]. The present study contributes to overcoming this knowledge gap by developing quantitative fragility curves for three-waters and railway infrastructure components impacted by the 2015 Illapel tsunami.
The 2015 Illapel tsunami occurred on the 16th of September following an Mw 8.3 earthquake off the central coast of Chile at 7:54 p.m. local time (Figure 1 [21,22]). The Illapel tsunami prompted several post-event field surveys [22,23,24]. A post-event field survey carried out by Paulik et al. [23] recorded the tsunami inundation depth watermarks and levels of damage to the built environment in Coquimbo. Areas of interest that were included in this post-event survey are shown in the four insets in Figure 1. Subsequent studies have utilized these data to develop fragility curves for roads [2,25]. However, three-waters and railway survey data from Paulik et al. [23] are yet to be used for the development of fragility curves.
This research uses empirical post-event hazard [20] and asset damage [23] data from the 2015 Illapel tsunami in Chile (Section 2.1) to develop tsunami vulnerability models for three-waters and railway network components (Section 2.2). The resulting fragility curves are discussed (Section 3) with respect to their limitations (Section 3.4), applications and recommendations for future research (Section 3.4).

2. Materials and Methods
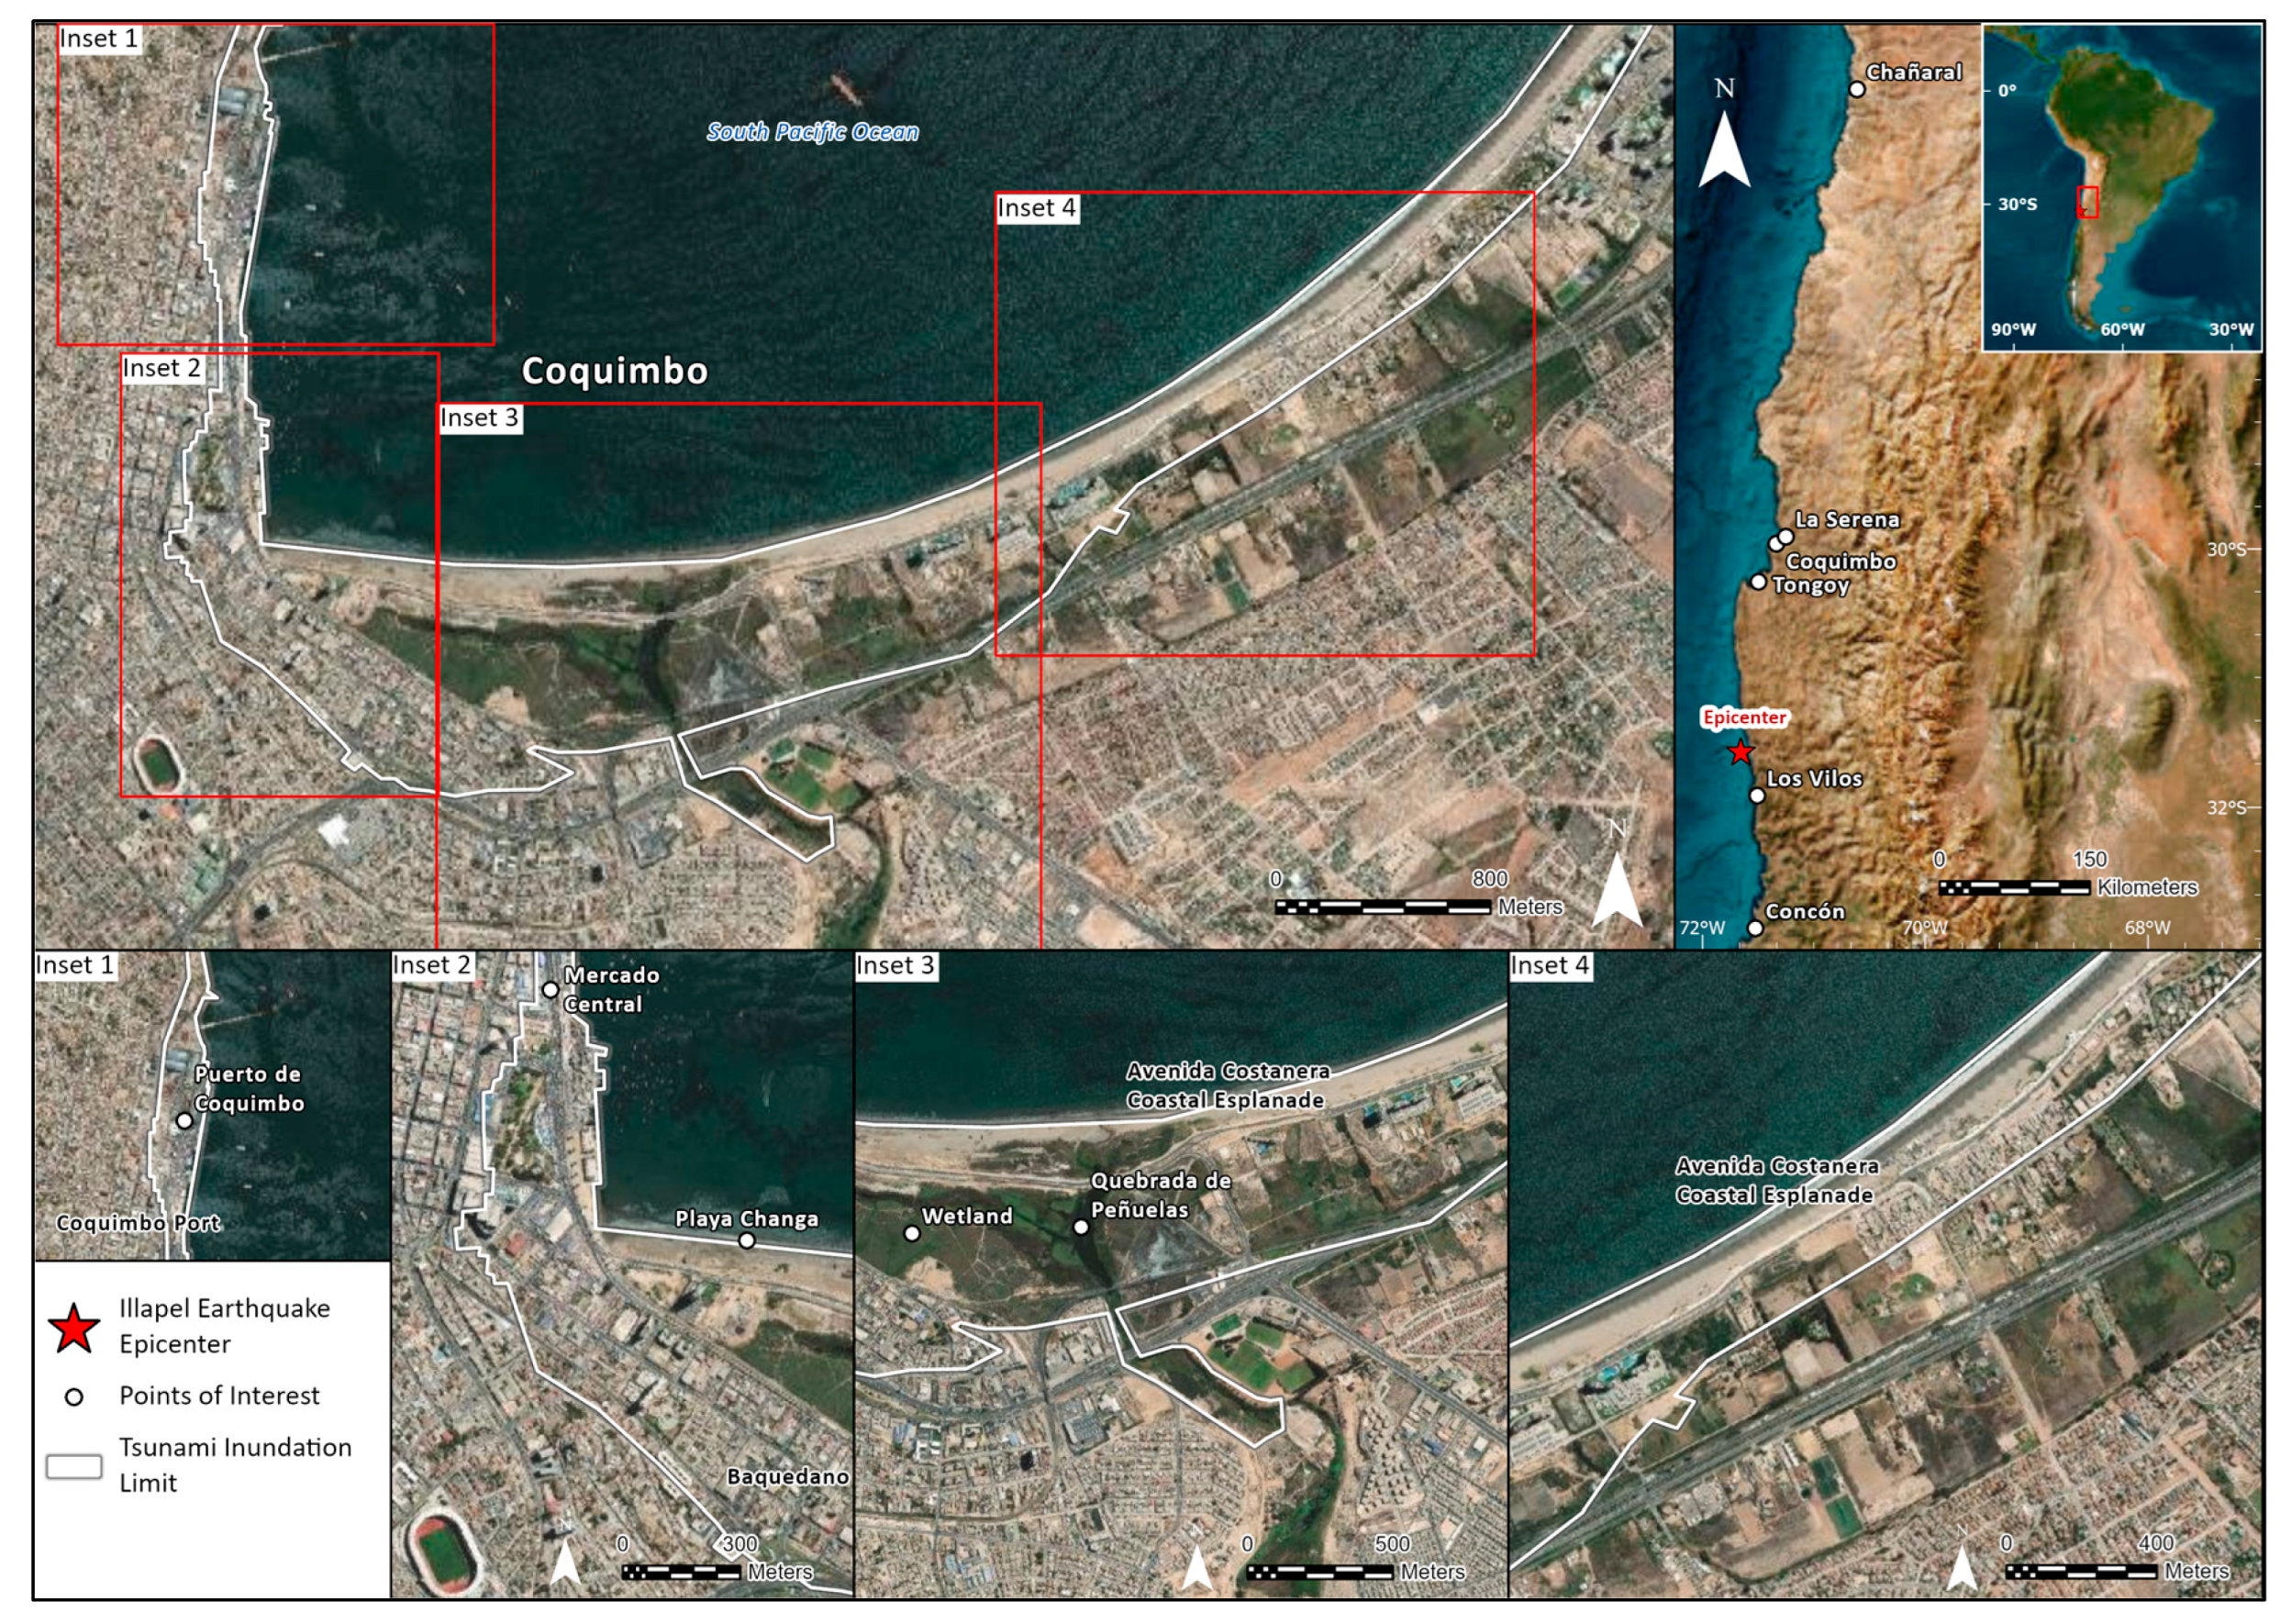
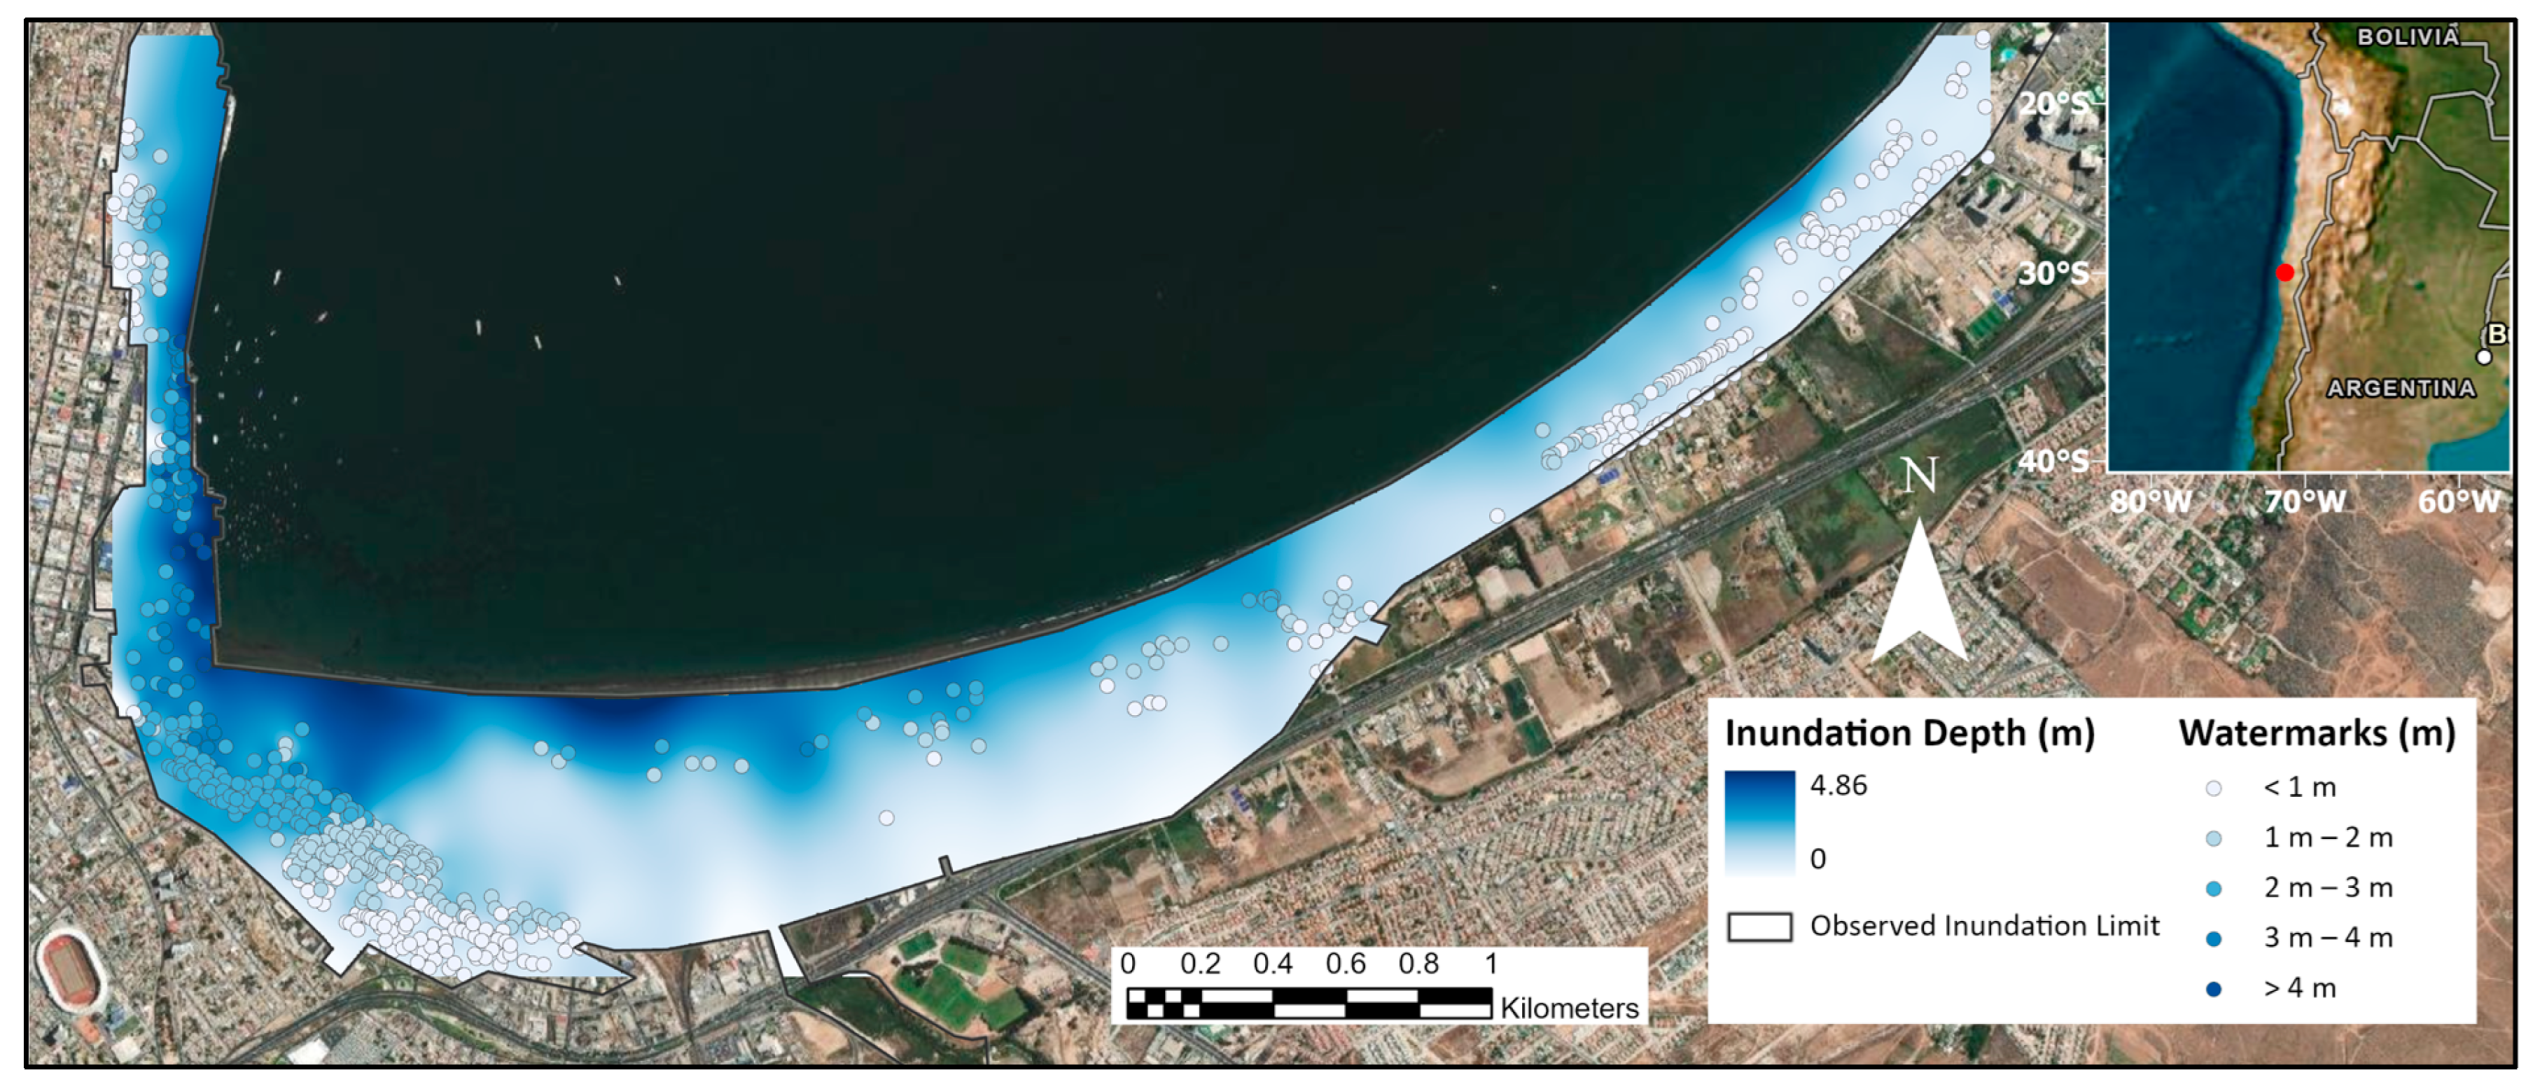
2.1. Survey Data

Empirical damage data were collected from on-site assessments of three-waters and railway infrastructure components in Coquimbo affected by the 2015 Illapel tsunami [23]. Here, we used attribute and damage characteristics of stormwater (manholes, culverts, drain inlets), wastewater (pipeline), potable water (hydrant, pump station), and railway tracks. The damage was categorized using four ordinal damage levels (DLs), ranging from DL0 (No damage) to DL3 (Complete damage) (Table 1). Damage-level definitions relevant to the components included in the present study are displayed in Table 1. In total, 314 water network components and 2.05 km of railway were surveyed in the study [23]. Out of the 314 water infrastructure components, 19 were removed from the dataset due to low component-specific empirical data, which included hydrants, pipelines, and pump stations. The remaining 295 components (including railways, culverts, manholes, and drain inlets) were considered in the development of the fragility curves. Water infrastructure data considered in this survey were spatially refined by co-locating it with other assets (e.g., adjusting drain inlets to be better co-located with roads).
Surveyors from Paulik et al. [23] recorded 655 flow depths, ranging from 0.1 to 4.7 m (Figure 2). Williams et al. [25] utilized these watermarks to interpolate the tsunami depth across the study area. This hazard interpolation adopted a spline-type ‘tension’ to represent the data more accurately and to avoid exaggerating inundation [25]. The present study used this hazard model to represent the tsunami hazard intensity (HIM variable). The inundation depth ranged from a height of 0 m to 4.86 m. Inundation depths up to approximately 4.8 m were observed (Figure 2).

2.2. Developing Fragility Functions

This study applied a cumulative link model (CLM) method to fit the fragility curves [7,19]. CLMs plot ordinal damage data (e.g., damage levels) into cumulative probabilities simultaneously. This method prevents synthesized curves from crossing paths, as is the case with previous studies that used a general link model method. The CLM method for fitting fragility curves in this study is represented by:
P D L d l H I M = Φ ( β ^ j + β ^ 2 1 n H I M )
where Φ is the standard cumulative normal distribution function and P is the probability of the asset equaling or exceeding a given damage level in reference to a given hazard intensity metric (HIM, which in this study refers to the inundation depth). β ^ j represents the intercept of the curve, while β ^ 2 represents the slope coefficient. Evaluation of the derived fragility curves involved using a classification performance metric of ‘accuracy’. This metric measured the percentage of correctly predicted attributes [26].

3. Results and Discussion

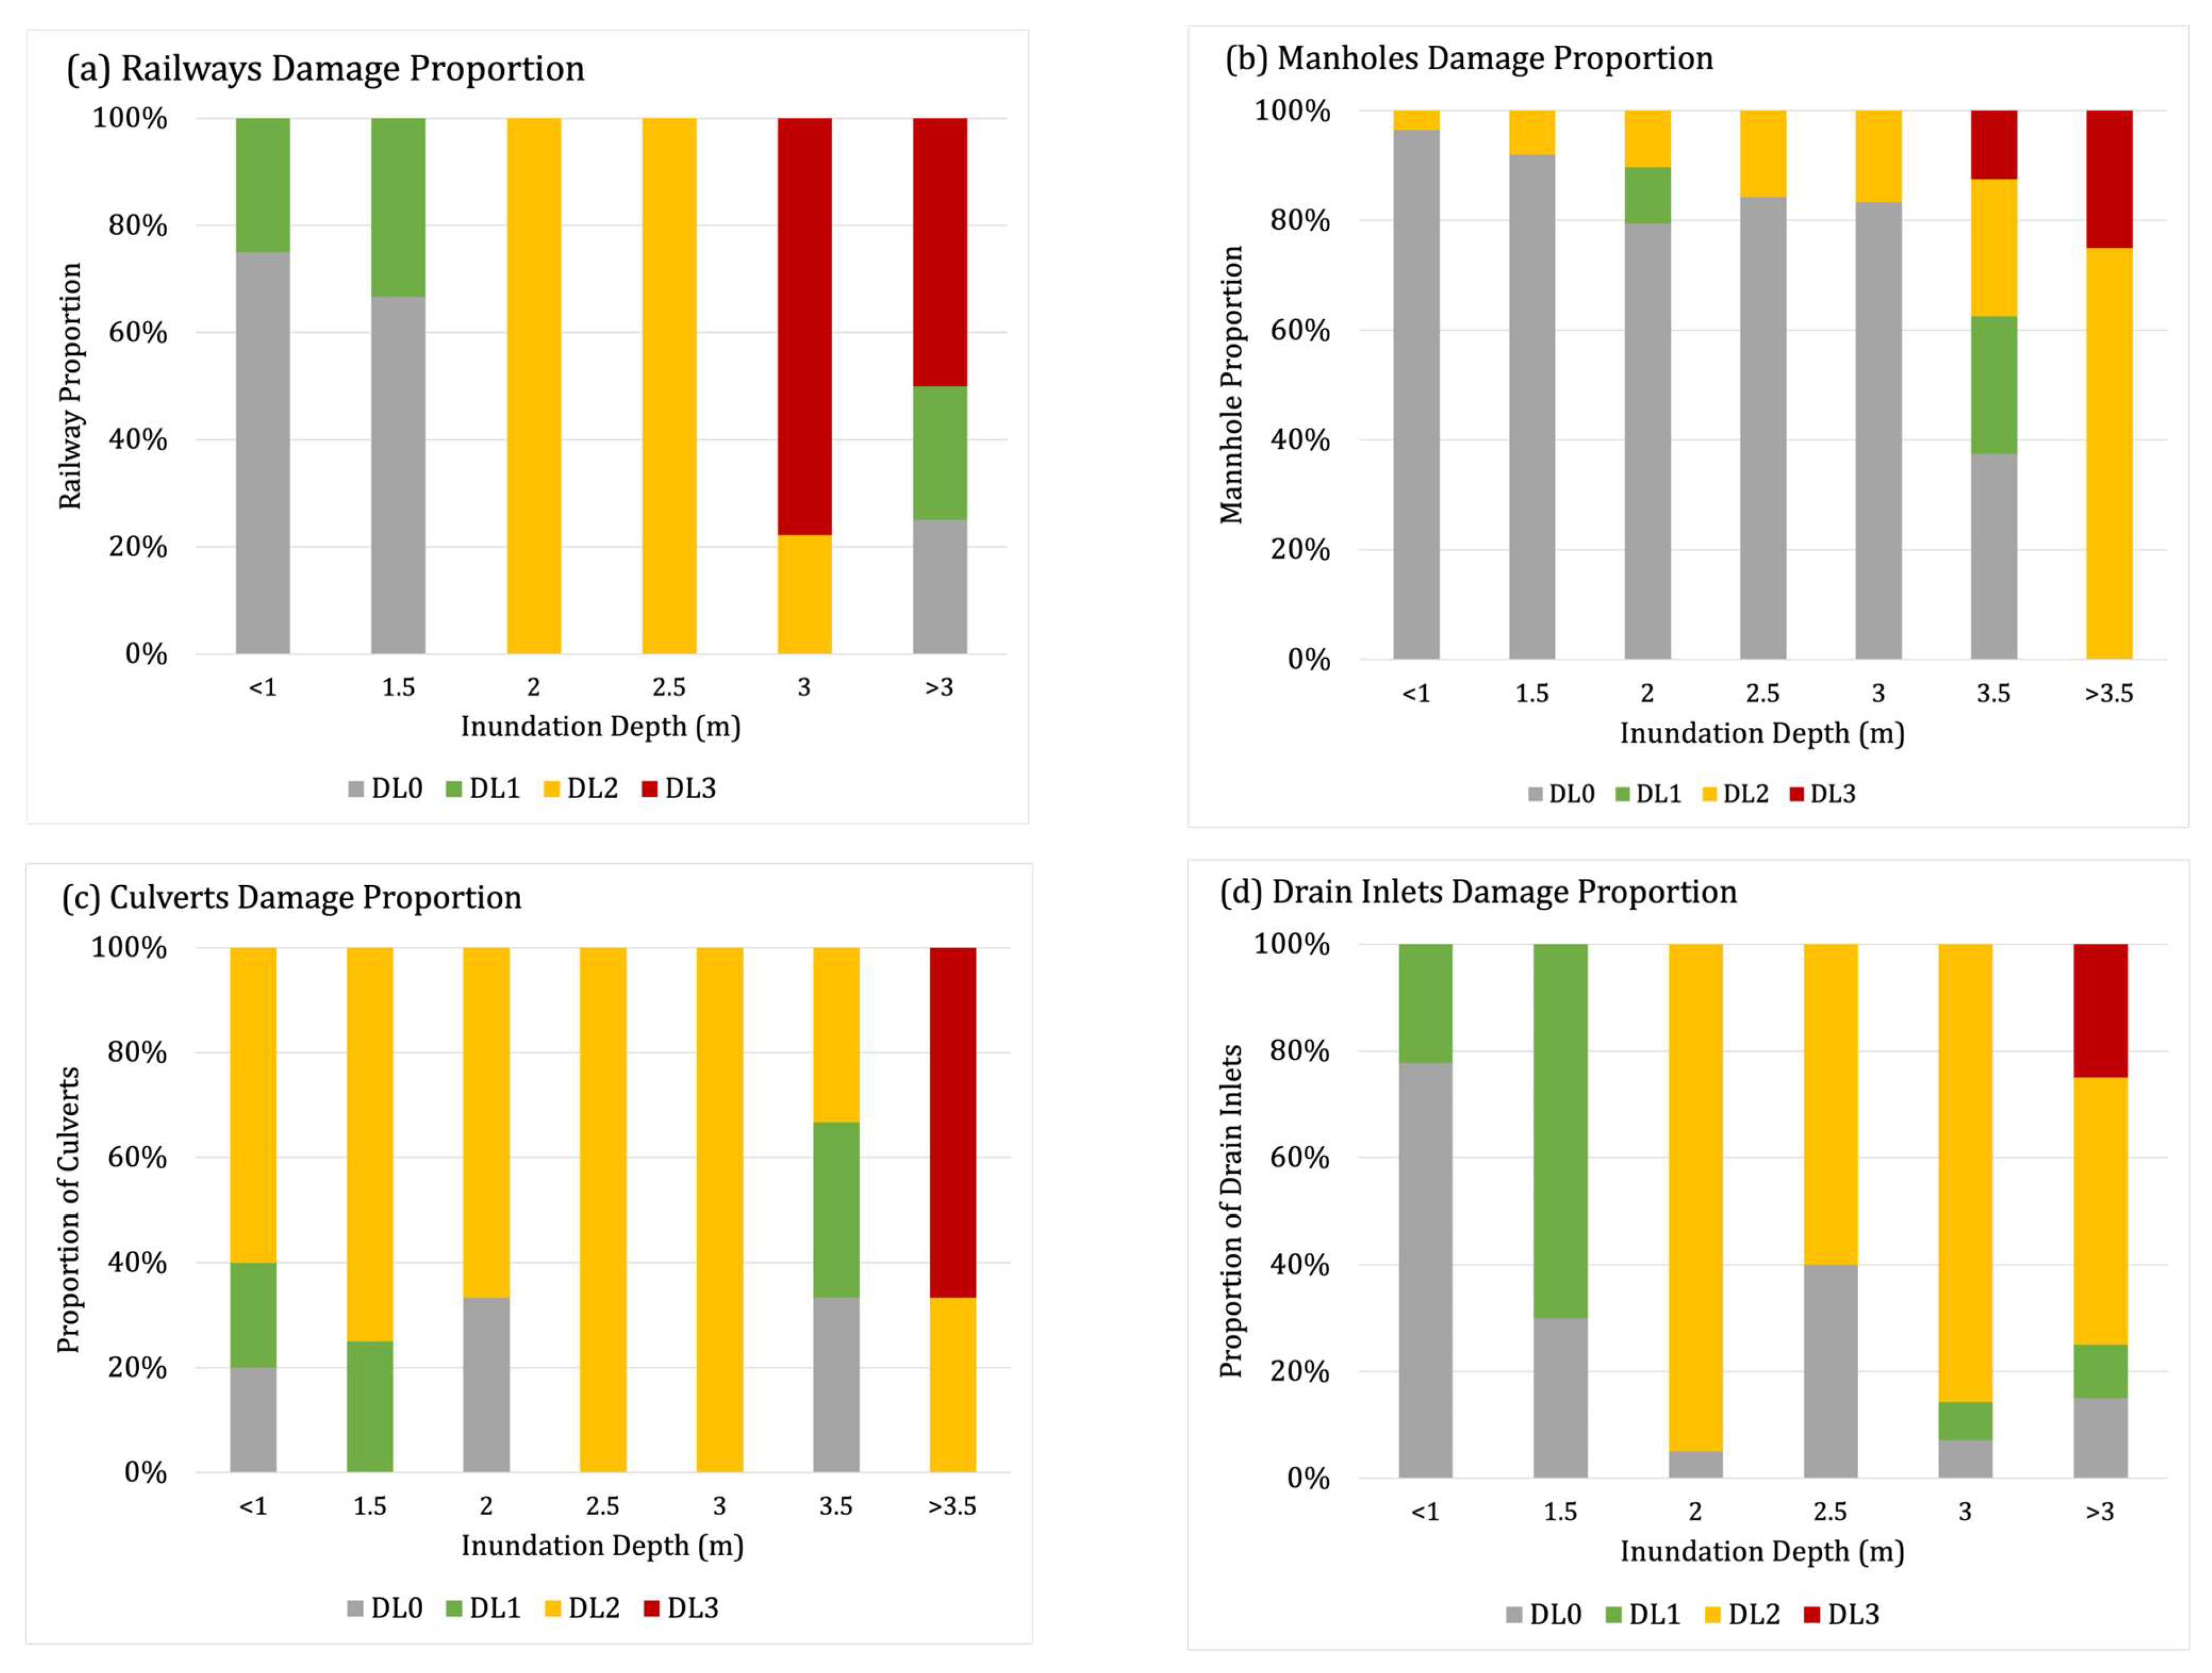
3.1. Network Component Damage Distribution

The distribution of the three-waters infrastructure components and their assigned damage levels can be viewed in Figure 3b–d and Figure 4, and they have been summarized in Table 2. Across the three-waters infrastructure (manholes, culverts, and drain inlets), higher damage levels (DL2 and DL3) can generally be seen at high inundation depths that are 3 m and over (Figure 3b–d). Components sustaining unrepairable damage and complete damage were observed in the western parts of Coquimbo near the port and in the neighborhood of Baquedano (Figure 4). Proportionally, culverts sustained the highest damage, with approximately 23% of culverts sustaining complete damage (DL3). In contrast, only 1% and 5% of manholes and drain inlets sustained complete damage, respectively.
The distribution of the railway damage levels can be viewed in Figure 3a and Figure 5, and it has been summarized in Table 2. Approximately 2.05 km of the railway, which connects Coquimbo Port to the national railway network, was inundated by the 2015 tsunami [23]. Approximately 1.2 km of this track sustained damage from the tsunami (a damage level above 1), with 0.65 km of railways sustaining a damage level of 3 (complete damage). It was observed by Paulik et al. [23] that a seawall failure caused a reduction in the protection of the railway, causing the greater embankment to experience scour which removed the track support. Spatially, there is a distinct concentration of high damage levels (DL3) in the western corner of Coquimbo near the port and in Baquedano (Figure 5). Bordering this area are railway segments with lower damage levels (DL < 3) (Figure 5).

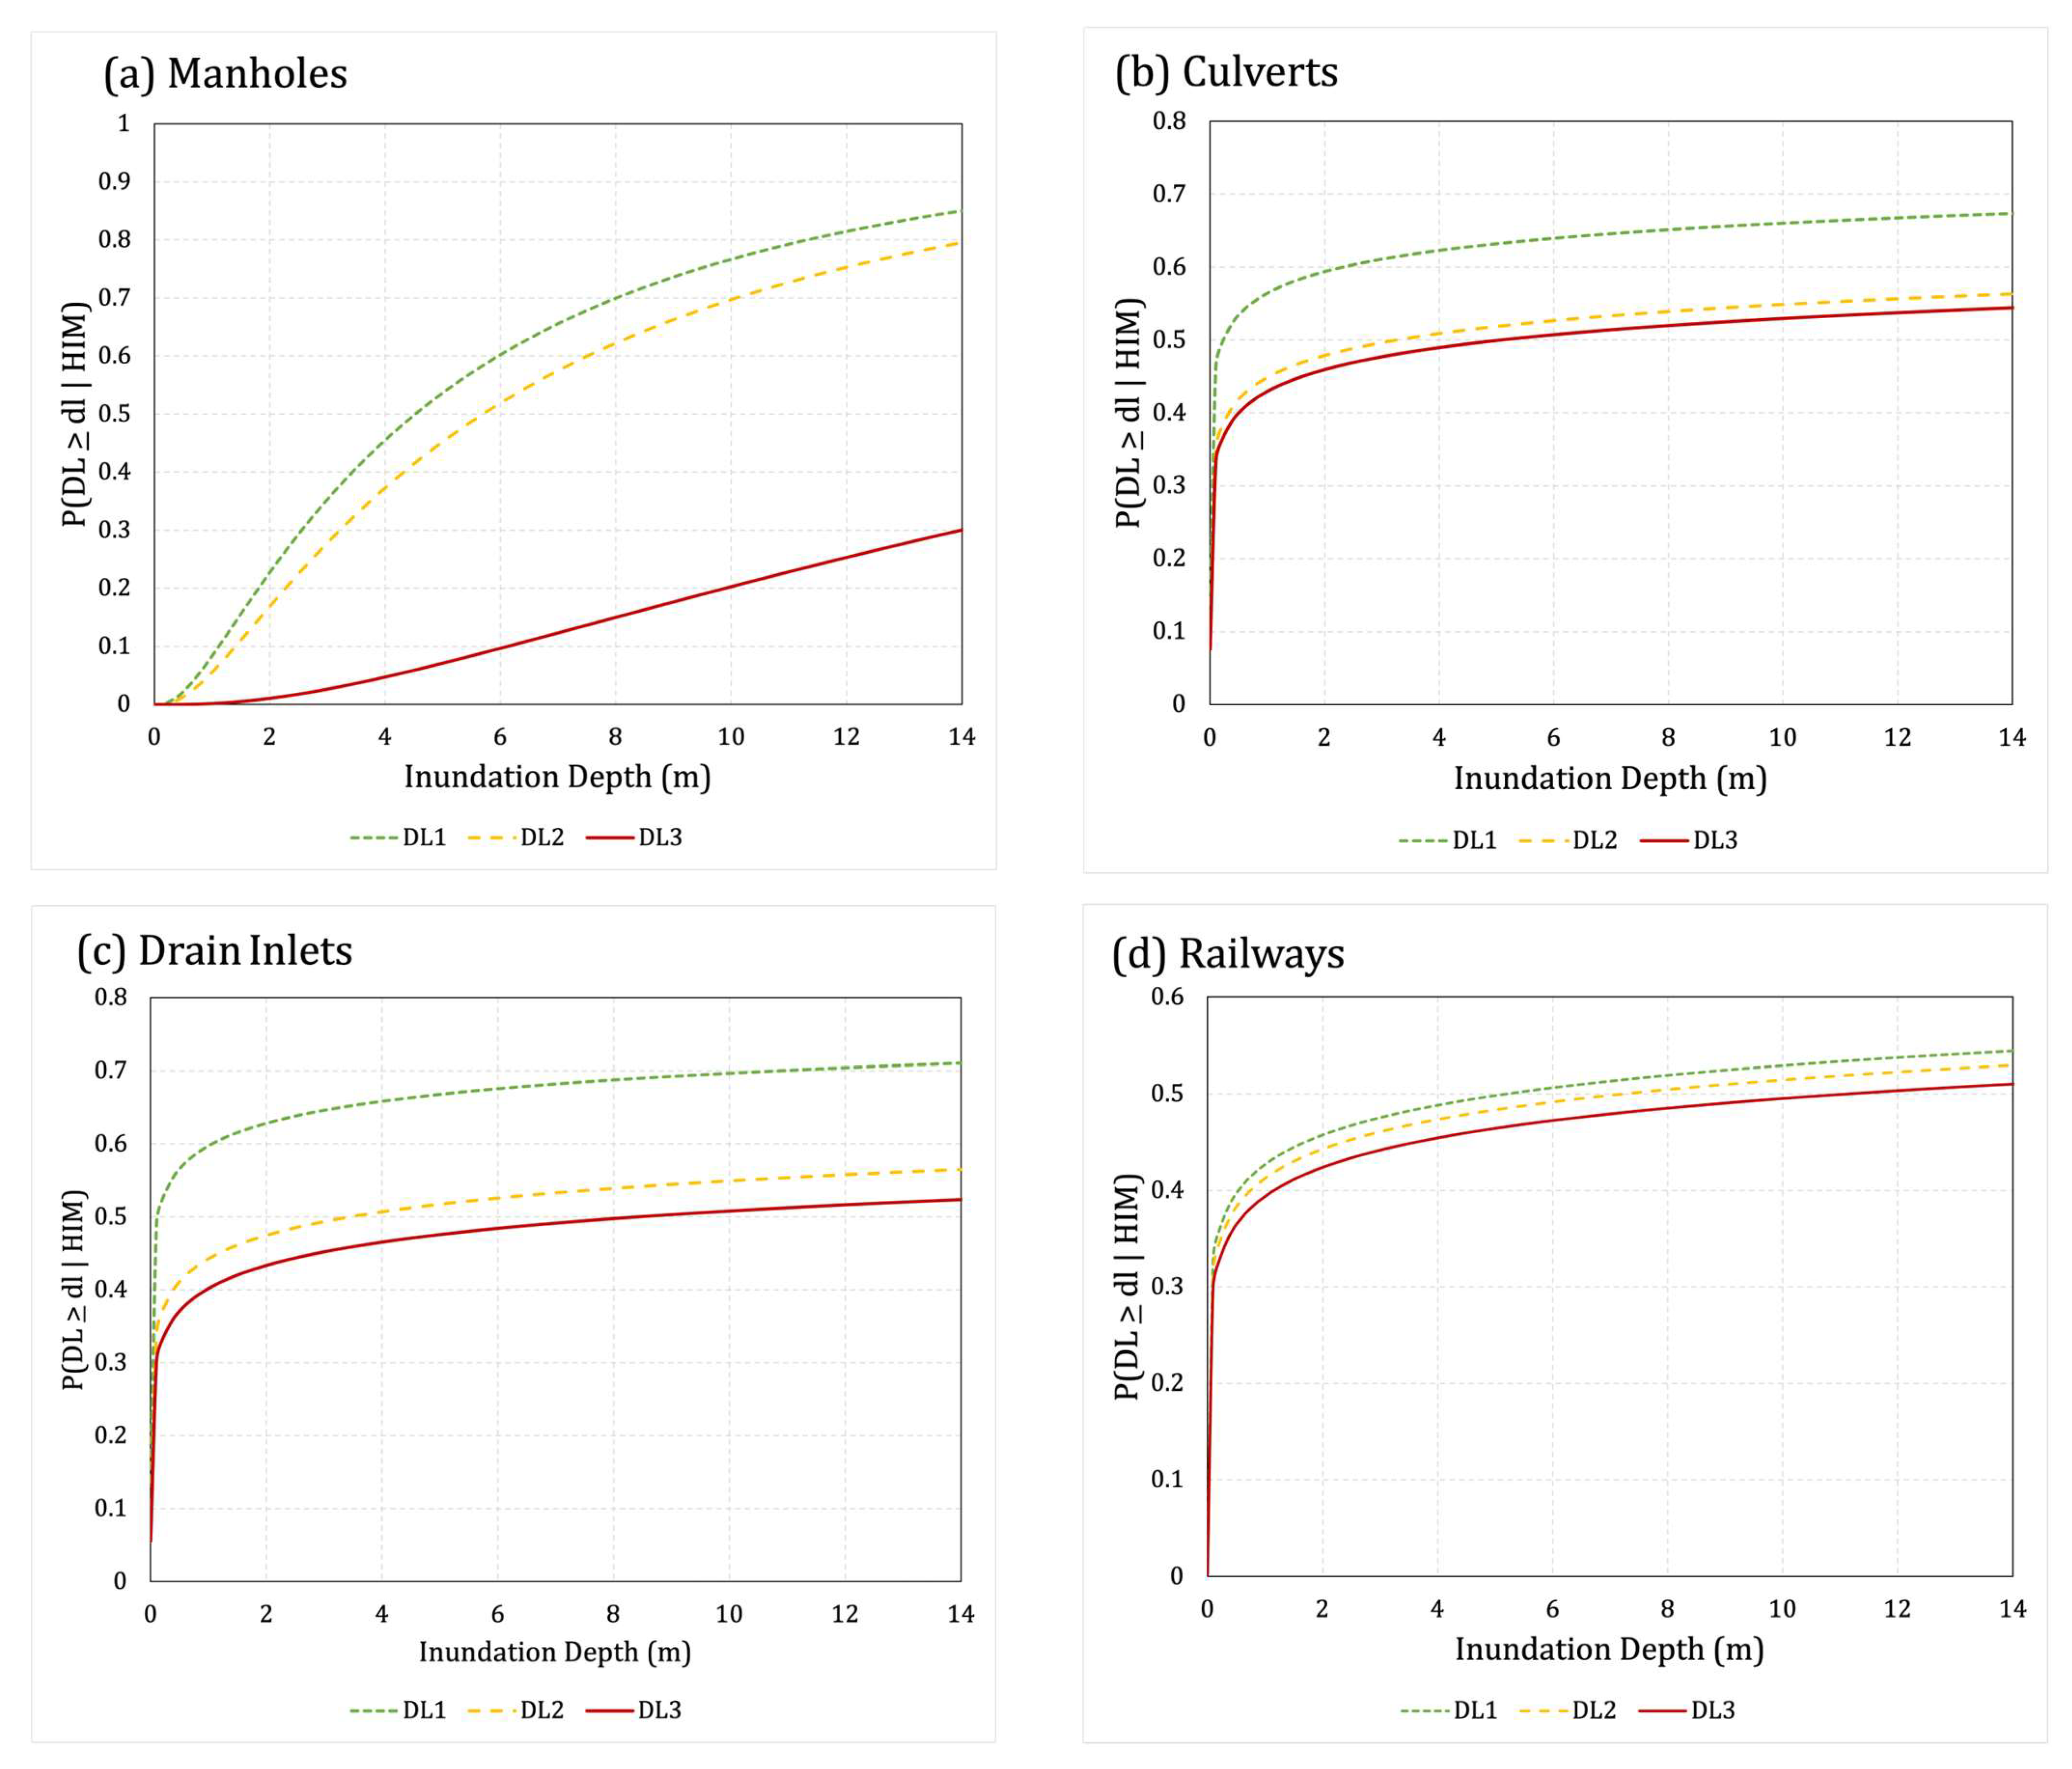
3.2. Three-Waters Infrastructure Fragility Curves

In the following text (Section 3.2 and Section 3.3), a 2 m inundation depth is used as a standard reference value across the results. This inundation depth was chosen as it represents an accepted, approximate hazard intensity threshold required to mobilize large debris and enable damaging hydrodynamic forces [27,28,29,30].
The fragility curve parameters for the three-waters and railway infrastructure are presented in Table 3 and displayed in Figure 6. Overall, manholes have the lowest damage probability at 2 m of inundation across all three damage levels, with the probability of manholes reaching or exceeding DL1, DL2, and DL3 being 0.23, 0.17, and 0.01, respectively (Figure 6a). Manholes have a 0.5 probability of reaching or exceeding DL1, DL2, and DL3 at 4.6 m, 5.6 m, and >20 m respectively. There is a minimal difference between culverts and drain inlets across their three designated damage levels at 2 m of inundation (Figure 6b,c). Culverts, however, show a higher probability of reaching or exceeding DL3 at 2 m (0.46) when compared to drain inlets (0.43). For culverts, there is a 0.5 probability of reaching or exceeding DL1, DL2, and DL3 at 0.4 m, 3.4 m, and 5.2 m (Figure 6b). For drain inlets, there is a 0.5 probability of reaching or exceeding DL1, DL2, and DL3 at 0.2 m, 3.6 m, and 8.6 m (Figure 6c).
Culverts show the highest vulnerability to the tsunami hazard among the assessed infrastructure network components in this study. The probability of complete damage (DL3) for culverts at 2 m of inundation depth is 0.46, whereas for drain inlets, manholes, and railways, the probability of complete damage is 0.43, 0.1, and 0.42, respectively. As culverts and outfall pipes are designed to drain surface water, they are inherently exposed to the effects of contraction scour, which is caused when the flow becomes contracted and forced through a structure, increasing the velocity and shear stress around the structure [20,31]. Drain inlets performed very similarly to culverts, with a damage probability of 0.43. Again, considering the built function of drains being to channel excess water, this higher damage probability may be expected from contraction scour [31].
Manholes show the least vulnerability to tsunamis out of the studied infrastructure components, with a complete damage (DL3) probability of 0.01 at 2 m of inundation depth. This may be because manholes are inset and flat in roads, reducing exposure to turbulent flow [32], potentially alleviating damage.

3.3. Railway Infrastructure Fragility Curves

At 2 m of inundation depth, the probability of railways reaching or exceeding DL1, DL2, and DL3 at 2 m of inundation depth is 0.46, 0.44, and 0.42, respectively (Figure 6d). Comparatively, the railway damage probability for complete damage at 2 m is lower than those of drain inlets and culverts; however, it remains higher than manholes. There is a 0.5 probability of railways reaching or exceeding DL1, DL2, and DL3 at 5.4 m, 7.4 m, and 11.2 m (Figure 6d).
Overall, across all the infrastructure components considered, culverts have the highest overall damage probability across all three damage levels at 2 m of inundation. Manholes have the lowest damage probability across all three damage levels at 2 m of inundation; however, at higher inundation depths (of 8 m and above), manholes have the highest damage probability for DL1 and DL2 compared to all the other components (Figure 6a). The damage potential for railways is consistently lower than for all the other components across all the damage levels and inundation depths (Figure 6d).
Railways perform relatively similar to drain inlets and culverts within their fragility curves, with railways obtaining a damage probability of 0.42 for complete damage (DL3) at 2 m of inundation compared to culverts and drain inlets, which have probability values of 0.46 and 0.43, respectively. Railways obtaining a lower probability may stem from them being less disruptive to water flows as they are more level with the ground surface. However, this probability is not as low as the probability for manholes (0.01), which may stem from the reduced protection the railways had after an observed seawall failure, which resulted in embankment scour and removal of track support to much of the railways (causing an overall greater proportion of DL3) [23].

3.4. Fragility Curve Comparison with Network Components

The synthesized fragility curves (Section 2) vary in terms of consistency with those from comparable studies (Table 4). The fragility curves obtained for culverts, drain inlets, and railways in this current study are higher than the results derived from both [2,25]. These three infrastructure components lie within the damage probability range of 0.4–0.5 for complete damage (DL3) at 2 m of flow depth, whereas the road and pole components from Williams et al. [25] and Williams et al. [2] showed probabilities < 0.15 (Table 4). This may be attributed to culverts, drain inlets and railways having more protruding/sunken structures, which may cause greater turbulent flow than poles or flat-lying roads, which in turn may cause greater damage [33].
This study used the tsunami inundation depth as the hazard intensity model for developing fragility curves from the Illapel 2015 tsunami event. However, it is well documented that the distribution caused by tsunami damage to assets is influenced by more factors than the inundation depth alone. Other tsunami hazard intensity measures that may be driving the impacts include the velocity, duration, hydrostatic force, hydrodynamic force and scour [19,27,34,35]. It has been considered that the inundation velocity is just as important as the inundation for damage or impact [35,36]. Because of this importance, ideally, future hazard models would incorporate both depth and velocity measures to inform impact and risk models more accurately. Conversely, Williams et al. [25] correlated the inundation depth strongly (relative to other HIMs) with the damage (for damaged infrastructure in the 2015 Illapel tsunami), so it could be said that the inundation depth remains a fair proxy for assessing tsunami vulnerability and impact, at least in the case of the present study. Future infrastructure-based tsunami fragility curves might consider a multivariate hazard model including the flow depth, velocity, and debris impact [25,27].
Although the infrastructure damage data collected by Paulik et al. [23] contain a high level of detail, the data represent a relatively small empirical study (i.e., in comparison to the 2011 Tohoku and 2004 Indian Ocean tsunami data) and a small sample size for the development of fragility curves. Having too small of a data sample size can result in large confidence bounds [37] and less accurate estimations of the damage probabilities for assets. While testing for confidence intervals in the dataset was outside the scope of this study, accuracy estimates were provided as a way to validate the fragility curves. Due to the small sample of empirical data collected, some three-waters infrastructure assets were omitted from this study when the data were insufficient, which included hydrants, pipes, and pump stations. Alongside the differing infrastructure types, case studies utilizing fragility functions developed from Coquimbo may have different topographic conditions. It is known that topography (among other factors) has an important influence on the inundation depth and flow velocity, and therefore, it has a strong influence on the damage [38]. When using fragility curves that only consider the inundation depth, such as the ones developed in this study, the limitations of topography should also be considered. Future work may consider using a different tsunami case study (previously collected or future data) to obtain a similar damage survey to Paulik et al. [23] with sufficient data quantities.

4. Conclusions

Fragility curves for critical infrastructure are crucial for ensuring tsunami risk assessments can be implemented. This study is a first for tsunami fragility curves for three-waters and railway infrastructure. The vulnerability models were developed using post-event field data from the 2015 Illapel tsunami, Coquimbo, Chile. The fragility curves were fitted using a cumulative link model (CLM) method. A damage classification using four levels of infrastructure damage was used, ranging from DL0 ‘no damage’ to DL3 ‘complete damage’.
The synthesized curves present manholes as showing the lowest vulnerability to tsunamis, with a 0.01 probability of reaching or exceeding DL3 at 2 m of inundation. The remaining infrastructure—culverts, drain inlets, and railways—showed similar vulnerability (probabilities of 0.46, 0.43, 0.42 of reaching or exceeding DL3 at 2 m of inundation, respectively), with culverts showing the highest vulnerability out of all the components considered.
The limitations of the local hazard and sample size should be considered in the application of these synthesized fragility functions in other future case studies. Utilization of the developed fragility curves in subsequent international tsunami impact and risk assessments could better inform mitigation and response strategies for tsunami risk reduction. Future work in this research field should consider the use of multivariate hazard models and post-event field surveys.

Author Contributions

Conceptualization, J.H.W. and R.P.; methodology, J.R., J.H.W. and R.P.; software, J.R.; writing—original draft preparation, J.R.; writing—review and editing, J.R., J.H.W. and R.P.; visualization, J.R.; supervision, J.H.W.; project administration, J.H.W.; funding acquisition, J.H.W. and R.P. All authors have read and agreed to the published version of the manuscript.

Funding

This work was supported by the School of Earth and Environment, University of Canterbury, and the New Zealand Ministry of Business, Innovation and Employment (MBIE) under the Strategic Science Investment Fund (Project CARH2405—National Institute of Water and Atmospheric Research).

Institutional Review Board Statement

Not applicable.

Informed Consent Statement

Not applicable.

Data Availability Statement

Data are available upon reasonable request to the corresponding author.

Acknowledgments

The authors thank the people of Coquimbo for supporting the 2015 field survey activities. The authors thank the field team members Nick Horspool (GNS Science), Richard Woods (Auckland Council and EQC), Richard Mowll (Wellington Lifelines Group) and Pablo Cortés (Departamento de Obras Civiles, Universidad Técnica Federico Santa María). We thank Patricio A. Catalan (Departamento de Obras Civiles, Universidad Técnica Federico Santa María and Research Center for Integrated Disaster Risk Management (CIGIDEN)) for the in-country support and post-field work collaborations. We also thank the Chilean Navy Hydrographic and Oceanographic Service (SHOA), National Emergency Office (ONEMI) and Universidad de Valparaíso for hosting the field survey team for on-site visits and supporting the survey activities through logistics and damage information provision. The authors also acknowledge the support of the 2015 field work from the Ministry of Foreign Affairs and Trade (NZ).

Conflicts of Interest

The authors declare no conflict of interest.

References

  1. Palliyaguru, R.; Amaratunga, D. Managing Disaster Risks through Quality Infrastructure and Vice Versa. Struct. Surv. 2008, 26, 426–434. [Google Scholar] [CrossRef]
  2. Williams, J.H.; Paulik, R.; Wilson, T.M.; Wotherspoon, L.; Rusdin, A.; Pratama, G.M. Tsunami Fragility Functions for Road and Utility Pole Assets Using Field Survey and Remotely Sensed Data from the 2018 Sulawesi Tsunami, Palu, Indonesia. Pure Appl. Geophys. 2020, 177, 3545–3562. [Google Scholar] [CrossRef]
  3. Jelínek, R.; Krausmann, E.; González, M.; Álvarez-Gómez, J.A.; Birkmann, J.; Welle, T. Approaches for Tsunami Risk Assessment and Application to the City of Cádiz, Spain. Nat. Hazards 2012, 60, 273–293. [Google Scholar] [CrossRef]
  4. Okumura, N.; Jonkman, S.N.; Esteban, M.; Hofland, B.; Shibayama, T. A Method for Tsunami Risk Assessment: A Case Study for Kamakura, Japan. Nat. Hazards 2017, 88, 1451–1472. [Google Scholar] [CrossRef]
  5. UNISDR (United Nations International Strategy for Disaster Reduction) Sendai Framework for Disaster Risk Reduction 2015–2030. Available online: http://www.wcdrr.org/uploads/Sendai_Framework_for_Disaster_Risk_Reduction_2015-2030.pdf (accessed on 9 March 2023).
  6. Koshimura, S.; Oie, T.; Yanagisawa, H.; Imamura, F. Developing Fragility Functions for Tsunami Damage Estimation Using Numerical Model and Post-Tsunami Data from Banda Aceh, Indonesia. Coast. Eng. J. 2009, 51, 243–273. [Google Scholar] [CrossRef]
  7. Lallemant, D.; Kiremidjian, A.; Burton, H. Statistical Procedures for Developing Earthquake Damage Fragility Curves. Earthq. Eng. Struct. Dyn. 2015, 44, 1373–1389. [Google Scholar] [CrossRef]
  8. Williams, J.H.; Wilson, T.M.; Horspool, N.; Lane, E.M.; Hughes, M.W.; Davies, T.; Le, L.; Scheele, F. Tsunami Impact Assessment: Development of Vulnerability Matrix for Critical Infrastructure and Application to Christchurch, New Zealand. Nat. Hazards 2019, 96, 1167–1211. [Google Scholar] [CrossRef]
  9. Williams, J.H.; Wilson, T.M.; Wotherspoon, L.; Paulik, R.; Lane, E.M.; Horspool, N.; Weir, A.; Hughes, M.W.; Schoenfeld, M.R.; Brannigan, D.; et al. Tsunami Damage and Post-Event Disruption Assessment of Road and Electricity Infrastructure: A Collaborative Multi-Agency Approach in Ōtautahi Christchurch, Aotearoa New Zealand. Int. J. Disaster Risk Reduct. 2022, 72, 102841. [Google Scholar] [CrossRef]
  10. González-Riancho, P.; Aliaga, B.; Hettiarachchi, S.; González, M.; Medina, R. A Contribution to the Selection of Tsunami Human Vulnerability Indicators: Conclusions from Tsunami Impacts in Sri Lanka and Thailand (2004), Samoa (2009), Chile (2010) and Japan (2011). Nat. Hazards Earth Syst. Sci. 2015, 15, 1493–1514. [Google Scholar] [CrossRef]
  11. Álvarez-Gómez, J.A.; Aniel-Quiroga, Í.; Gutiérrez-Gutiérrez, O.Q.; Larreynaga, J.; González, M.; Castro, M.; Gavidia, F.; Aguirre-Ayerbe, I.; González-Riancho, P.; Carreño, E. Tsunami Hazard Assessment in El Salvador, Central America, from Seismic Sources through Flooding Numerical Models. Nat. Hazards Earth Syst. Sci. 2013, 13, 2927–2939. [Google Scholar] [CrossRef]
  12. Aránguiz, R.; Urra, L.; Okuwaki, R.; Yagi, Y. Development and Application of a Tsunami Fragility Curve of the 2015 Tsunami in Coquimbo, Chile. Nat. Hazards Earth Syst. Sci. 2018, 18, 2143–2160. [Google Scholar] [CrossRef]
  13. Di Bacco, M.; Rotello, P.; Suppasri, A.; Scorzini, A.R. Leveraging Data Driven Approaches for Enhanced Tsunami Damage Modelling: Insights from the 2011 Great East Japan Event. Environ. Model. Softw. 2023, 160, 105604. [Google Scholar] [CrossRef]
  14. Virtriana, R.; Harto, A.B.; Atmaja, F.W.; Meilano, I.; Fauzan, K.N.; Anggraini, T.S.; Ihsan, K.T.N.; Mustika, F.C.; Suminar, W. Machine Learning Remote Sensing Using the Random Forest Classifier to Detect the Building Damage Caused by the Anak Krakatau Volcano Tsunami. Geomat. Nat. Hazards Risk 2023, 14, 28–51. [Google Scholar] [CrossRef]
  15. Izquierdo, T.; Fritis, E.; Abad, M. Analysis and Validation of the PTVA Tsunami Building Vulnerability Model Using the 2015 Chile Post-Tsunami Damage Data in Coquimbo and La Serena Cities. Nat. Hazards Earth Syst. Sci. 2018, 18, 1703–1716. [Google Scholar] [CrossRef]
  16. Tarbotton, C.; Dall’Osso, F.; Dominey-Howes, D.; Goff, J. The Use of Empirical Vulnerability Functions to Assess the Response of Buildings to Tsunami Impact: Comparative Review and Summary of Best Practice. Earth Sci. Rev. 2015, 142, 120–134. [Google Scholar] [CrossRef]
  17. Akiyama, M.; Frangopol, D.M.; Arai, M.; Koshimura, S. Reliability of Bridges under Tsunami Hazards: Emphasis on the 2011 Tohoku-Oki Earthquake. Earthq. Spectra 2013, 29, 295–314. [Google Scholar] [CrossRef]
  18. Suppasri, A.; Mas, E.; Charvet, I.; Gunasekera, R.; Imai, K.; Fukutani, Y.; Abe, Y.; Imamura, F. Building Damage Characteristics Based on Surveyed Data and Fragility Curves of the 2011 Great East Japan Tsunami. Nat. Hazards 2013, 66, 319–341. [Google Scholar] [CrossRef]
  19. Macabuag, J.; Rossetto, T.; Ioannou, I.; Eames, I. Investigation of the Effect of Debris-Induced Damage for Constructing Tsunami Fragility Curves for Buildings. Geosciences 2018, 8, 117. [Google Scholar] [CrossRef]
  20. Williams, J.H.; Wilson, T.M.; Horspool, N.; Paulik, R.; Wotherspoon, L.; Lane, E.M.; Hughes, M.W. Assessing Transportation Vulnerability to Tsunamis: Utilising Post-Event Field Data from the 2011 Tōhoku Tsunami, Japan, and the 2015 Illapel Tsunami, Chile. Nat. Hazards Earth Syst. Sci. 2020, 20, 451–470. [Google Scholar] [CrossRef]
  21. USGS M 8.3–48 Km W of Illapel, Chile (2015). Available online: https://earthquake.usgs.gov/earthquakes/eventpage/us20003k7a/technical (accessed on 9 March 2023).
  22. Aránguiz, R.; González, G.; González, J.; Catalán, P.A.; Cienfuegos, R.; Yagi, Y.; Okuwaki, R.; Urra, L.; Contreras, K.; Del Rio, I.; et al. The 16 September 2015 Chile Tsunami from the Post-Tsunami Survey and Numerical Modeling Perspectives. Pure Appl. Geophys. 2016, 173, 333–348. [Google Scholar] [CrossRef]
  23. Paulik, R.; Williams, J.H.; Horspool, N.; Catalan, P.A.; Mowll, R.; Cortés, P.; Woods, R. The 16 September 2015 Illapel Earthquake and Tsunami: Post-Event Tsunami Inundation, Building and Infrastructure Damage Survey in Coquimbo, Chile. Pure Appl. Geophys. 2021, 178, 4837–4851. [Google Scholar] [CrossRef]
  24. Tomita, T.; Arikawa, T.; Takagawa, T.; Honda, K.; Chida, Y.; Sase, K.; Olivares, R.A.O. Results of Post-Field Survey on the Mw 8.3 Illapel Earthquake Tsunami in 2015. Coast. Eng. J. 2016, 58, 1650003-1-1650003–1650017. [Google Scholar] [CrossRef]
  25. Williams, J.; Paulik, R.; Aránguiz, R.; Wild, A. Infrastructure Network Component Vulnerability to Damage from the 2015 Illapel Tsunami, Coquimbo, Chile. Res. Sq. 2022; preprint. [Google Scholar] [CrossRef]
  26. Baldi, P.; Brunak, S.; Chauvin, Y.; Andersen, C.A.F.; Nielsen, H. Assessing the Accuracy of Prediction Algorithms for Classification: An Overview. Bioinformatics 2000, 16, 412–424. [Google Scholar] [CrossRef] [PubMed]
  27. Charvet, I.; Suppasri, A.; Kimura, H.; Sugawara, D.; Imamura, F. A Multivariate Generalized Linear Tsunami Fragility Model for Kesennuma City Based on Maximum Flow Depths, Velocities and Debris Impact, with Evaluation of Predictive Accuracy. Nat. Hazards 2015, 79, 2073–2099. [Google Scholar] [CrossRef]
  28. Eguchi, R.T.; Eguchi, M.T.; Bouabid, J.; Koshimura, S.; Graf, W.P. HAZUS Tsunami Benchmarking, Validation and Calibration; 2013. National Weather Service (NWS). Available online: https://nws.weather.gov/nthmp/2013mesmms/abstracts/TsunamiHAZUSreport.pdf (accessed on 13 July 2023).
  29. Graf, W.P.; Lee, Y.; Eguchi, R.T. New Lifelines Damage and Loss Function For Tsunami. In Proceedings of the 10th National Conference in Earthquake Engineering, Earthquake Engineering Research Institute, Anchorage, AK, USA, 21–25 July 2014; Available online: https://datacenterhub.org/resources/11732/download/10NCEE-000350.pdf (accessed on 13 June 2023).
  30. Marchand, M.; Buurman, J.; Pribadi, A.; Kurniawan, A. Damage and Casualties Modelling as Part of a Vulnerability Assessment for Tsunami Hazards: A Case Study from Aceh, Indonesia. J. Flood Risk Manag. 2009, 2, 120–131. [Google Scholar] [CrossRef]
  31. Duc, B.M.; Rodi, W. Numerical Simulation of Contraction Scour in an Open Laboratory Channel. J. Hydraul. Eng. 2008, 134, 367–377. [Google Scholar] [CrossRef]
  32. Sullivan, P.P.; McWilliams, J.C.; Moeng, C.-H. Simulation of Turbulent Flow over Idealized Water Waves. J. Fluid Mech. 2000, 404, 47–85. [Google Scholar] [CrossRef]
  33. Muhammad, N.; Ullah, N. Simulation of Flow on the Hydroelectric Power Dam Spillway via OpenFOAM. Eur. Phys. J. Plus 2021, 136, 1191. [Google Scholar] [CrossRef]
  34. Horspool, N.A.; Fraser, S. An Analysis of Tsunami Impacts to Lifelines. GNS Science 2016. Available online: https://www.eqc.govt.nz/assets/Publications-Resources/1605-Analysis-of-tsuami-impacts-to-lifelines.pdf (accessed on 3 October 2023).
  35. Reese, S.; Bradley, B.A.; Bind, J.; Smart, G.; Power, W.; Sturman, J. Empirical Building Fragilities from Observed Damage in the 2009 South Pacific Tsunami. Earth Sci. Rev. 2011, 107, 156–173. [Google Scholar] [CrossRef]
  36. Fritz, H.M.; Petroff, C.M.; Catalán, P.A.; Cienfuegos, R.; Winckler, P.; Kalligeris, N.; Weiss, R.; Barrientos, S.E.; Meneses, G.; Valderas-Bermejo, C.; et al. Field Survey of the 27 February 2010 Chile Tsunami. Pure Appl. Geophys. 2011, 168, 1989–2010. [Google Scholar] [CrossRef]
  37. Rossetto, T.; D’Ayala, D.; Ioannou, I.; Meslem, A. Evaluation of Existing Fragility Curves; Pitilakis, K., Crowley, H., Kaynia, A.M., Eds.; Springer: Dordrecht, The Netherlands, 2014; Volume 27, ISBN 978-94-007-7871-9. [Google Scholar]
  38. De Risi, R.; Goda, K.; Yasuda, T.; Mori, N. Is Flow Velocity Important in Tsunami Empirical Fragility Modeling? Earth Sci. Rev. 2017, 166, 64–82. [Google Scholar] [CrossRef]
Figure 1. Location of the 2015 Mw 8.3 earthquake epicenter in Chile and locations of interest.
Jmse 11 01991 g001
Figure 2. Tsunami inundation measured via watermarks around Coquimbo and interpolated by the spline method.
Jmse 11 01991 g002
Figure 3. Proportion of exposed infrastructure for (a) railways, (b) manholes, (c) culverts, and (d) drain inlets.
Jmse 11 01991 g003
Figure 4. Tsunami impacts on three-waters infrastructure components in Coquimbo, Chile.
Jmse 11 01991 g004
Figure 5. Tsunami impacts on railways in Coquimbo, Chile. Point locations represent the center point of each line segment (used for developing the fragility curves).
Jmse 11 01991 g005
Figure 6. Fragility curves for manholes (a), culverts (b), drain inlets (c), and railways (d).
Jmse 11 01991 g006
Table 1. Damage level (DL) descriptions of water and railway infrastructure network components in Coquimbo. Adapted from Paulik et al. (2021) [23].
Component TypeDL0DL1DL2DL3
No DamagePartial Damage, RepairablePartial Damage, UnrepairableComplete Damage
Railway-Minor scour of ballast, tracks in placeScour to ballast, tracks pushed off ballastComplete washout of ballast and tracks
Culvert-Minor scour around the culvert, may be blockedCulvert heavily scoured out but in place, scour or aggradation may render culvert uselessCulvert completely scoured out, washed away
Manhole-Minor scour around manhole/foundation, minor damage to coverModerate–major damage to manhole surface or cover, shaft in placeManhole shaft scoured out, washed away
Drain Inlet-Minor damage to grate, no damage to subsurface, temporary blockage or capacity reductionGrate damaged, drain blocked, scour around drain, requires sediment removal or replacementDrain inlet completely scoured out, washed away
Table 2. Tsunami exposure and damage levels of three-waters and railway infrastructure affected from the 2015 Illapel tsunami.
Infrastructure TypeFlow DepthDamage Level
<1 mm>2 mDL0DL1DL2DL3
Manholes 56646914712282
Culverts351851146
Drain Inlets92941108574
Hydrants6444190
Pipes-2--1-1
Pump Stations-1---1-
Railways50 m550 m1100 m500 m300 m250 m650 m
Table 3. Fragility curve parameters for the three-waters and railway infrastructure network components.
Fragility CurveDamage LevelμσAccuracy
ManholesDL11.511.0983%
DL21.741.09
DL33.211.09
CulvertsDL1−1.489.1612%
DL21.189.16
DL31.639.16
Drain InletsDL1−2.128.5819%
DL21.238.58
DL32.138.58
RailwaysDL11.658.9429%
DL21.988.94
DL32.418.94
Table 4. Probability of reaching or exceeding DL3 at a 2 m flow depth for infrastructure components damaged in the 2015 Illapel tsunami.
Infrastructure TypeDL3 Probability at 2 m Inundation DepthSource
Manholes0.01Present study
Culverts0.46
Drain Inlets0.43
Railways0.42
Mixed Roads0.07Williams et al. [2]
Asphalt Roads0.09
Concrete Roads0.04
Mixed-Attribute Utility Poles0.13
Mixed Roads≈0.05Williams et al. [20]
Disclaimer/Publisher’s Note: The statements, opinions and data contained in all publications are solely those of the individual author(s) and contributor(s) and not of MDPI and/or the editor(s). MDPI and/or the editor(s) disclaim responsibility for any injury to people or property resulting from any ideas, methods, instructions or products referred to in the content.

