Article

Exploring Drivers Shaping the Choice of Alternative-Fueled New Vessels

1
School of Economics and Management, Shanghai Maritime University, Shanghai 201306, China
2
College of Transport and Communications, Shanghai Maritime University, Shanghai 201306, China
*
Author to whom correspondence should be addressed.
J. Mar. Sci. Eng. 2023, 11(10), 1896; https://doi.org/10.3390/jmse11101896
Submission received: 1 September 2023 / Revised: 22 September 2023 / Accepted: 25 September 2023 / Published: 29 September 2023
(This article belongs to the Special Issue Advanced Research on the Sustainable Maritime Transportation)

Abstract

:
The urgent imperative for maritime decarbonization has driven shipowners to embrace alternative marine fuels. Using a robust orderbook dataset spanning from January 2020 to July 2023 (encompassing 4712 vessels, 281 shipyards, and 967 shipping companies), four distinct multinomial logit models were developed. These models, comprising a full-sample model and specialized ones for container vessels, dry bulk carriers, and tankers, aim to identify the key determinants influencing shipowners’ choices of alternative fuels when ordering new vessels. It is interesting to find that alternative fuels (e.g., liquefied natural gas) are the most attractive choice for gas ships and ro-ro carriers; others prefer to use conventional fuels. Furthermore, this study reveals that shipowners’ choices of new fuels significantly correlate with their nationality. While it is well-established that economic factors influence shipowners’ choices for new ship fuel solutions, the impacts of bunker costs, freight rates, and CO2 emission allowance prices remain relatively limited. It is evident that the policies of the International Maritime Organization (IMO) to reduce carbon emissions have increased the demand for building new energy ships. This research contributes to bridging research gaps by shedding light on the intricate interplay of factors that influence shipowners’ preferences for alternative marine fuels amidst global regulatory shifts. It also offers valuable insights for policymakers aiming to incentivize shipowners to transition towards sustainable energy sources.

1. Introduction

International shipping, responsible for moving over 90% of globally traded goods, plays a pivotal role in the world economy. Currently, it contributes about 2–3% of global emissions, a figure projected to rise to 17% by 2050 [1]. The IMO has set crucial milestones for the industry, targeting a minimum 40% reduction in carbon intensity by 2030 and 70% by 2050, compared to 2008 levels. Additionally, a 50% reduction in total annual greenhouse gas emissions from shipping by 2050 is aimed, all underpinned by the adoption of low-carbon fuels to accommodate the sector’s growth [2].
The maritime sector’s intricate nature, characterized by high capital requirements, risks, and specialization, makes ordering new vessels a complex decision. Shipowners must assess market conditions before investment, considering shipbuilding capacity, compliance with conventions, and market competitiveness. Adhering to new emissions standards, however, necessitates significant adjustments that could cost the container shipping industry up to USD 10 billion [3], exerting a substantial influence on shipping companies’ revenue. Approximately 47% of voyage costs in the maritime sector are attributed to bunker costs, contingent upon fuel prices and vessel specifications [4].
Given the shipping sector’s magnitude and reliance on fuel expenditures, even incremental energy efficiency improvements can yield significant outcomes [5]. To align with IMO goals, ships need to transition to low-carbon alternative fuels like liquefied natural gas (LNG), methanol, liquefied petroleum gas (LPG), and biofuels, with future adoption of even more environmentally friendly options like hydrogen and ammonia anticipated [6]. While existing research mainly focuses on emissions and fuel performance, a gap exists between academic findings on alternative fuels and shipowners’ practical responses to changing regulations. Meeting the IMO’s 2050 carbon intensity targets prompts shipowners to assess when and whether to invest in vessels powered by alternative fuels.
This study employs the multinomial logit (MNL) model to identify key factors influencing shipowners’ decisions to invest in such vessels. These factors include ship-related, shipowner-related, market-related, and regulation-related ones. This research draws on a robust dataset derived from a vessel orderbook spanning from January 2020 to July 2023, encompassing 4712 vessels, 281 shipyards, and 967 shipping companies.
This research bears three significant contributions. Firstly, most existing studies in the literature have primarily focused on assessing the commercial, operational, and technical viability of alternative marine fuels, as well as their potential for reducing carbon emissions on an experimental basis. Little attention has been given to the practical applications of these alternative fuels in new vessels and the factors influencing shipowners’ decisions to adopt them. Our analysis in this paper fills this gap and enhances our understanding of shipowners’ choices in alternative marine fuels when constructing new ships. Secondly, our findings reveal that vessel type, shipowner nationality, and IMO policies significantly influence fuel choices, whereas the effects of bunker costs, freight rates, and CO2 emission allowance prices remain relatively limited. These findings hold important policy implications. They underscore that economic incentives alone may not be sufficient to drive the industry’s adoption of new environmentally friendly fuels. Prompt technological advancements, government policy support, regulatory requirements, and a well-developed supply chain and infrastructure are crucial catalysts for this transition. Thirdly, the methodology proposed in this study can be effectively applied and extended to analyze behaviors of navigating the transition towards sustainable energy sources by various stakeholders.
The remainder of this paper is structured as follows: Section 2 reviews the literature on shipowners’ choices of alternative marine fuels. Section 3 outlines the methodology. Section 4 offers the descriptions and analysis of orderbook data for new ships. Section 5 demonstrates the regression results of multinomial logit models and discussions. The conclusions drawn from this study are presented in Section 6.

2. Literature Review

2.1. Review of Alternative Marine Fuels and Shipowners’ Choices

The urgent need for maritime decarbonization has motivated shipowners to adopt various emission abatement solutions, including improving energy efficiency, slow steaming, using innovative power plants, and renewable fuels [7,8,9,10,11,12]. For newbuilding vessels, adopting alternative fuels could be one of the most important solutions, especially when considering the more stringent carbon emission regulations set to be stipulated by the IMO in the future. Thus, research into alternative marine fuels has gained extensive attention. Previous research has heavily focused on LNG, with growing interest in methanol, ammonia, and hydrogen due to their potential to lower or have zero net carbon emissions [13,14]. LNG served as an interim solution [15,16], while e-fuel, methanol and ammonia will be the source of future fuels [14]. The competitiveness of methanol, compared with conventional fuels, depends mainly on ship productivity and the price difference between methanol and marine diesel oil (MDO) [17,18]. The marginal abatement costs and greenhouse gas (GHG) abatement potential of alternative marine fuels including methanol, ammonia, liquid hydrogen, LNG, LPG and bio-diesel for a newbuilding vessel depend on the cost of carbon capture and storage, electricity cost, and shipping route [19].
Key drivers behind shipowners’ decisions to invest in emission abatement solutions, including alternative marine fuels, have been investigated. Previous research has showed that financial factors, such as investment costs, operational costs, and government support and regulations, all have significant impacts on shipowner decisions [20,21,22]. Furthermore, freight rate index, ship type, and shipowner nationality are all highly correlated with shipowners’ emission abatement solutions [23]. Some authors have argued that for Norwegian shipowners, long-term profitability, company strategy, and financial and intellectual resources serve as significant factors affecting their adoption of alternative fuels [24]. IMO policies have accelerated shipping decarbonization, but some measures still remain uncertain and discrepancies exist between the IMO’s incentives and industry perspectives [25]. Practicality and short-term returns matter in shipowners’ preferences for emission abatement solutions. When fuel oil prices are relatively high, regulations can stimulate shipowners to complete the fuel transition in a more aggressive direction [26].

2.2. Review on Multinomial Logit Model
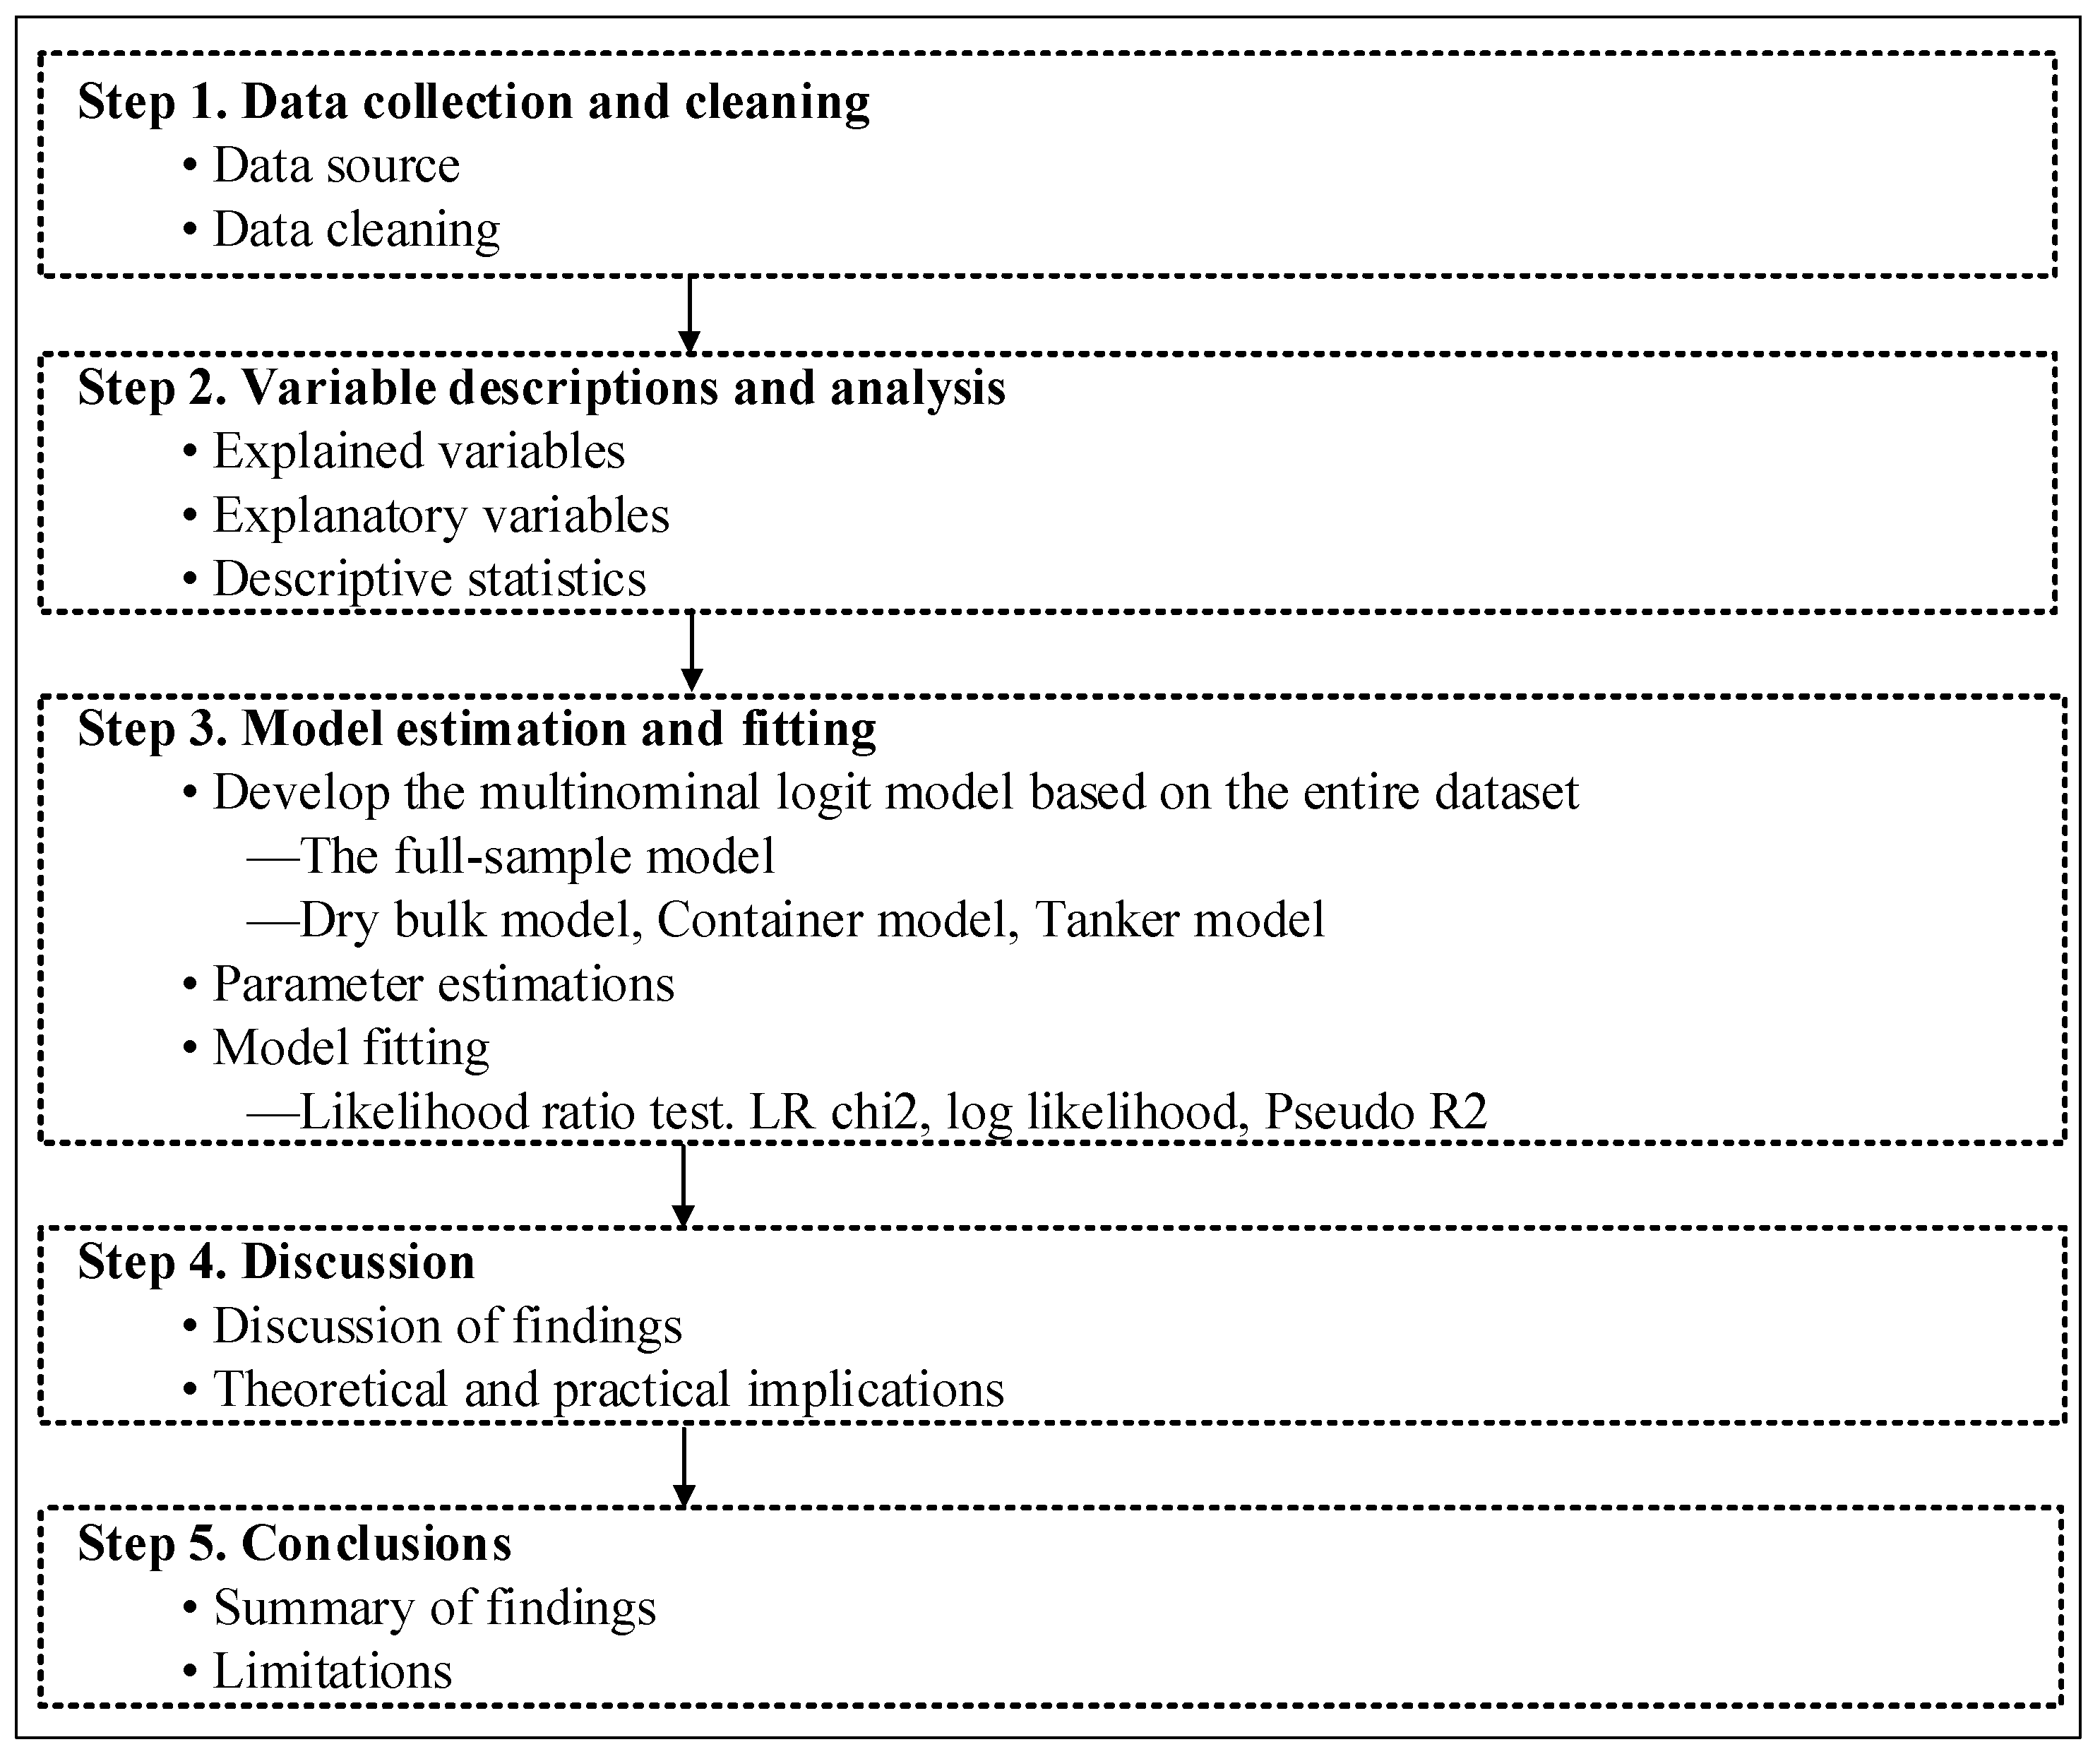
The well-established multinomial logit model serves as a valuable tool for estimating choice probabilities and discerning influential factors. It has been applied in various contexts to shed light on critical decision-making processes within the maritime industry.
It was used to investigate cruise lines’ compliance decisions with the 2020 sulfur cap, revealing that fuel price fluctuations and government support had a minimal impact, while new vessel orders favored alternative fuels like LNG [27]. It was also applied to assess scrapping probabilities, considering vessel characteristics, market factors, and deviations from average freight rates [28]. Some authors explored shipowners’ vessel selection and size preferences using a multinomial logit model, and synthesized factors including internal company traits, market conditions, and competitor performance [29]. In addition, the model proved instrumental in estimating port-to-port cargo flow. By employing multinomial logit models, one study analyzed the effect of trade volume on ship size choice. It was found that trade volume, voyage distance, and dry bulk shipping index all impacted ship size preferences [30].
The existing literature predominantly focuses on assessing the commercial, operational, and technical viability of alternative marine fuels, as well as their potential for carbon emission reductions on an experimental basis. Notably, little research investigates the practical applications of these alternative fuels in the construction of new vessels. Furthermore, limited attention has been given to investigating the influential factors that shape shipowners’ decisions regarding the adoption of alternative fuels, and the temporal evolution of such choices. This study bridges the gap between academic research on energy choices in building new vessels and the actual responses of shipowners to regulations. It enriches the understanding of emission compliance decisions made by shipowners when ordering new vessels.

3. Methodology

3.1. Conceptual Framework

The orderbook data underwent preprocessing before being used in the study. Empirical analysis was conducted using multinomial logit models, including the full-sample model, dry bulk model, container model, and tanker model. This process is illustrated in Figure 1, which outlines the conceptual framework consisting of five steps.
(1) Data collection and cleaning: orderbook data collected from the Clarksons, spanning from January 2020 to July 2023, cover 4712 vessels, 281 shipyards, and 967 shipping companies. Records with errors or missing data were excluded. (2) Variable description and analysis: this study defines and describes both the explained and explanatory variables. The explained variables relate to different fuels used in new vessels, while the explanatory variables encompass ship-related, shipowner-related, market-related, and regulation-related factors. The descriptive analysis is presented. (3) Model estimation and fitting: four distinct models were developed, namely the full-sample model along with specialized models for container vessels, dry bulk carriers, and tankers. These latter three models focus on dissecting shipowners’ decision-making processes within each respective category. Model fit was assessed using likelihood ratio tests within the context of the multinomial logit model. (4) Discussion: the findings are discussed with theoretical explanations and the practical implications of the observed findings. (5) Conclusions and limitations: in the final section, we will present our conclusions and highlight any limitations of the study.

3.2. Model Building

A shipowner’s choice of fuel for a new vessel is a complex interplay of individual circumstances, market dynamics, and environmental concerns. Discrete choice models, treating decision-makers as utility maximizers, offer a robust framework to explain and predict selections from multiple alternatives [31]. The multinomial logit model, commonly employed in such analyses, is suitable for scenarios with various choices. It comprises binomial logit models, each catering to specific choice behaviors, and encompasses diverse explanatory variables.
The discrete choice model, grounded in random utility theory, captures preference as a utility value, combining observable and unobservable random variables. Observable attributes and personal traits constitute the observable aspect, while other influences are encapsulated in an unobservable error term. Given the impact of random errors on precise utility prediction, choice probability represents the decision-maker’s utility. Thus, the utility function guiding a shipowner’s selection of an alternative-fueled vessel can be expressed as:
U i j = V i j + ε i j
where the utility value ( U i j ) of alternative fueled vessel j for shipowner i is determined by two components: the observable component ( V i j ) and the unobservable component ( ε i j ). V i j can often be approximated as a linear function of a set of explanatory variables. This linear approximation can be expressed as:
V i j = β 1 X i 1 + β 2 X i 2 + β k X i k
where X i 1 , X i 2 , X i k are the explanatory variables affecting the shipowner’s decision to order an alternative-fueled vessel, and β 1 , β 2 , β k are the estimated corresponding parameters for the explanatory variables.
The probability of shipowner i choosing alternative fueled vessel j is given by:
P i ( j ) = Pr U i j > U i k ,   for k j , j = 1 , 2 , 3,4 , 5,6 .
where U i j represents the maximum utility that shipowner i obtains when selecting alternative fueled vessel j . It is assumed that all ε i j are independently and identically distributed (i.i.d.) following a Gumbel distribution with a mean value η = 0 and a scalar value u . Consequently, the probability of shipowner i selecting an alternative fueled vessel j can be expressed as follows:
P i ( j ) = e V i j k J e V i k = exp X β j k J exp X β k
j = 1 J P i ( j ) = 1
where X is the set of attributes, β j is the parameter vector of attributes to be estimated, and j denotes the selection set. Selection probabilities are then calculated using collected data [32]. Equation (5) ensures probabilities sum to one. Different parameter sets are estimated for each alternative-fueled vessel. The β j for a new energy vessel type is set to 1 as the baseline, with coefficients of other options explained relative to this baseline.
The probability of the alternative fueled vessel scenario j can be expressed as:
P i ( j ) = exp X β j 1 + j = 2 J 1 exp X β j
Similarly, the probability of the baseline option can be represented as:
P i ( j ) = 1 1 + j = 2 J 1 exp X β j

4. Descriptions and Analysis of Variables

4.1. Explained and Explanatory Variable

4.1.1. Explained Variables

The explained variables in this study are different fuels of new vessels, which are classified as follows: conventional fuel, LNG capable, methanol, ready (including LNG ready, ammonia ready, methanol ready, LPG ready), and “other fuels” (battery, LPG, ethane, and other blended fuels). “LNG ready” refers to a type of vessel that currently operates using conventional fuels but is designed and built with the necessary infrastructure and adaptations to be easily converted to use LNG as fuel in the future. This concept applies similarly to ammonia ready, methanol ready, and LPG ready.
LNG is widely considered an option, with emissions about 15% lower than conventional fuel after accounting for leakage. However, LNG faces storage challenges due to its low temperature and requires specialized infrastructure [33,34,35]. Methanol, possessing a low sulfur content and igniting easily, presents competitiveness and can store surplus power through carbon capture [36,37]. DNV data show that container vessels using methanol fuel slightly exceed capital costs but are one-third of the cost of LNG counterparts [38]. Ammonia, a hydrogen carrier, emits no CO2 but necessitates emission reduction measures for nitrogen oxides [38,39]. LPG fuels have good environmental performance, but their long-term decarbonization efficacy is limited. Batteries and hydrogen fuel cells offer potential, with the latter needing infrastructure enhancements. Hydrogen is promising, but it is the least mature among several fuels, facing obstacles in production, transportation, and storage [40,41,42,43].
None of these alternative green, zero-carbon, or low-carbon fuels currently have a globally available or cost-effective infrastructure to support the global shipping fleet. The shipping industry has yet to determine which fuel is the best choice. We define conventional fuel as the baseline category, and the options include LNG capable, methanol “ready”, and “other fuels”.

4.1.2. Explanatory Variables

The study’s explanatory variables encompass ship-related, shipowner-related, market-related, and regulation-related variables.
Research indicates that vessel size and type significantly influence shipowners’ newbuilding order decisions [23]. For instance, Gas carriers tend to prefer LNG, while smaller vessels often opt for conventional fuel [44].
Shipowner nationality also plays a pivotal role [23]. Distinct development levels and cultural factors across countries lead to varying incentives and policies. Research has established a symbiotic relationship between the freight and shipbuilding markets [45,46]. However, the impact of freight rates on shipowners’ newbuilding decisions remains unclear. The ClarkSea Index gauges global freight performance, now covering 80% of fleet capacity, including LNG and chemical vessels since early 2022. In parallel, Clarkson Average Earnings have been adopted for dry bulkers, container vessels, and tankers, respectively.
Fuel expenses, constituting a substantial portion of voyage costs, significantly influence shipowners’ responses to emission policies [47]. Among the leading alternatives, the cost of LNG stands as a pivotal consideration. Shipowners’ sensitivity may be heightened by the interplay between LNG bunker prices and those of very low sulfur fuel. Notably, capital-intensive shipping operations remain susceptible to fluctuations in interest rates [48]. A marked transition from the London Interbank Offered Rate (LIBOR) to risk-free rates, such as the Secured Overnight Financing Rate (SOFR), Sterling Overnight Index Average (SONIA), and Swiss Average Rate Overnight (SARON), has been observed. SOFR, intricately linked to US Treasury repurchase rates, has replaced LIBOR and serves as a benchmark for gauging the capital costs of ships.
The idle rate, representing the ratio of idle vessels to the total fleet, serves as an indicator of how prevailing freight market conditions influence shipowners’ decisions. The global carbon emissions trading system exerts an influence on the shipping industry, fostering the construction of energy-efficient vessels [48]. Notably, the European Union Emissions Trading System relies upon the CO2 EUA price as a pivotal parameter. The utilization of CO2 EUA price data, procured from Europe’s primary carbon trading market, assumes a crucial role in scrutinizing its impact on shipowners’ investments in vessels utilizing alternative fuels. This strategic approach aims at attaining the objectives of carbon emission reduction.
The growing alignment with the ambitious emission targets set by the IMO is steering the trajectory of new vessel orders towards alternative fuels [44]. The transition from a goal of reducing emissions by 50% to a more profound objective of completely eliminating greenhouse gases by 2050 underscores the need to scrutinize the influence of policies released by the IMO on shipowners’ preference for alternative fuels.
All these explanatory datasets are matched with each individual vessel order, ensuring a comprehensive analysis for each distinct case. A comprehensive overview of the explanatory variables is presented in Table 1.

4.2. Data and Variable Analysis

4.2.1. Data Collection

This study employs vessel orderbook data from the Clarkson database spanning January 2020 to July 2023. The “Alternative Fuel Types” column specifies the vessel fuel type, with blanks indicating conventional fuel use. Order details include status, builder, contract date, gross tonnage (GT), DWT, vessel type, construction date, owner, etc. Earnings, LNG/FO, SOFR, idle rate, CO2 price and policy are matched with contract dates. Data cleaning eliminated orders lacking DWT info. The final dataset comprises 4712 vessels from 281 shipyards and 967 companies. Table 2 summarizes vessel distribution by type.

4.2.2. Descriptive Statistics

(1)
Alternative fuels
Alternative fuels are categorized into five groups (Table 3) across 4712 vessels. Conventional fuel is used by 67.98% of vessels, while LNG capable, methanol, ready, and “other fuels” are chosen by 16.36%, 2.99%, 6.92%, and 5.75%, respectively. Notably, shipowners favor low-sulfur fuel oil and scrubbers, with about 15.35% opting for scrubbers with conventional fuel, which is consistent with the results of other studies on in-service fleets [44]. LNG remains the prime alternative fuel due to improved infrastructure.
“Ready vessels” such as LNG ready, methanol ready, ammonia ready, and LPG ready vessels follow LNG as viable options. These vessels provide flexibility and adaptability, allowing shipowners to transition to cleaner fuels gradually as market conditions and regulations evolve. This approach acknowledges the uncertainty and challenges associated with the rapid adoption of new fuels while still positioning companies to embrace sustainability initiatives.
Methanol is gaining attention as a potential alternative marine fuel due to its relatively lower emissions and wider availability. The “other” category, representing 5.75% of vessels, likely includes vessels exploring less common or emerging alternative fuels such as biofuels, ethane, battery propulsion, and LPG. This choice suggests a willingness to experiment with newer technologies and fuels that might not yet be widely adopted due to factors like technological maturity, availability, or cost-effectiveness.
It is significant to highlight that both ammonia and hydrogen fuel cells are currently in developmental stages and have not yet been deployed for maritime operations based on the observations of the sample vessels.
(2)
Vessel type analysis
Table 4 shows the percentage distribution of each alternative fuel based on vessel type. Notably, over 60% of bulk, container, tanker, gas carrier, and general cargo vessels favor conventional fuels. Bulk carriers, in particular, exhibit the highest preference at 92.2%, as their uncertain routes per voyage and the prolonged downturn in the market lead to a greater reliance on the stable returns provided by conventional fuels [49].
Container shipowners, accounting for over 24% of the orderbook, display a greater inclination towards alternative fuels, with 18.1% opting for LNG capable vessels. Tankers also prefer conventional fuels (70.3%), with a notable 13.5% showing interest in “ready” vessels. Gas carriers (53.4%) and ro-ro vessels (59.5%) predominantly utilize LNG due to ample onboard storage. Container and general cargo vessels exhibit higher methanol usage. Remarkably, container, tanker, and ro-ro vessels exhibit a higher percentage in the “ready” category. Additionally, gas carriers and ro-ro vessels display an elevated preference for other fuels such as batteries, LPG, ethane, and blends.
(3)
DWT analysis
Table 5 underscores the trend that vessels employing LNG, methanol fuels, and ready fuels exhibit notably higher average DWT (deadweight tonnage) compared to those relying on conventional fuels. The data demonstrate that shipowners show a greater inclination toward alternative fuels as ship size increases. Remarkably, ships using methanol fuel possess the largest average and minimum DWT.
It is worth noting that other fuels such as battery, biofuels, and ethane predominantly find application in small- and medium-sized vessels with substantially lower DWT due to their ranges and technical limitations.
(4)
Policy analysis
Considering that our dataset encompasses the period from January 2020 to July 2023, our primary focus lies on decarbonization policies within this timeframe (Table 6). Our key objective is to assess whether these policies had a significant impact on shipowners’ decision-making.
To ensure a thorough examination, we chose two crucial IMO policies: one issued in November 2020 and another in June 2021. It is worth noting that the policy introduced in June 2022 primarily involves a revision of the Initial IMO Strategy, while the one from December 2022 mainly pertains to a data collection system for fuel oil consumption, with seemingly minimal impact on alternative fuels. Additionally, the policy introduced in July 2023 holds significant relevance to marine fuels, but due to limited available data, its impact remains inconclusive.
In November 2020, the IMO encouraged member states to develop voluntary National Action Plans to address GHG emissions from ships. These efforts were paralleled by amendments to the MARPOL Annex VI, aimed to enhance and strengthen the Energy Efficiency Existing Ship Index (EEXI) Phase 3 requirements for three specific ship types, including container, general cargo, and LNG carriers. In June 2021, the IMO adopted amendments to MARPOL Annex VI introducing short-term GHG reduction measures containing a technical EEXI, an operational CII, and an enhanced SEEMP, and approved a work plan to advance the development of mid- and long-term GHG reduction measures in alignment with the Initial IMO Strategy.
These IMO policies incentivize shipowners to invest in ordering new vessels utilizing alternative fuels. Figure 2 showcases the orderbook distribution across different fuels from Q1 2020 to Q2 2023. The impact of the pandemic in 2020 had a noticeable effect on the orderbook, with percentages indicating the proportion of new vessels opting for conventional fuel. Notably, this percentage rose to 86.9% in Q3 2020 and then steadily decreased. It dropped to 66.9% in Q4 2022 and further declined to 44.2% by the end of 2022. Although there was a slight increase in the first three quarters of 2023, the trend of ordering more new energy vessels becomes evident. Meanwhile, there was an increase in the ordering of LNG capable vessels since 2020 since LNG is favored by shipowners for meeting the 2030 mid-term emissions reduction target, and the ratio of LNG capable vessels to the whole fleet reached 34.8% in Q3 2022. Methanol exhibited upward trends post Q3 2021. Since the end of 2022, there was a tendency toward the adoption of other fuels, such as biofuels, batteries, ethane, and blends. The maturation of technologies surrounding new alternative fuel production, storage, and utilization is driving shipowners to explore options beyond LNG.
(5)
Shipowner analysis
Table 7 sheds light on the leading shipowners based on their orderbook volumes, revealing an interesting trend in their fuel category utilization. Noteworthy entities like CDB Leasing, Nisshin, Wan Hai, and SITC predominantly opt for conventional fuel, suggesting a cautious approach, possibly awaiting industry advancements before fully committing to alternative fuels.
Conversely, Eastern Pacific Shipping, CMA CGM, MSC, Seaspan, and BoCom prominently emphasize LNG-fueled orders, indicative of recognizing LNG’s transitional role in emission reduction. Additionally, CMA CGM and Evergreen display a notable volume of methanol-fueled orders, while Eastern Pacific Shipping features significant orders across various alternative fuels, including six ethane-fueled ones. While LNG adoption is relatively widespread, the lesser prevalence of methanol adoption might imply an ongoing industry exploration of its feasibility and benefits as a marine fuel.
The varying degrees of adoption suggest that the industry is in a phase of transition, with some companies leading the way and others assessing the best path forward.
In terms of shipowner nationalities, this study covers shipowners from 83 different countries. However, our focus has been on the top seven countries (Table 8), which collectively contribute to over 75% of all orders in the maritime industry. It is noteworthy that Singapore, the Republic of Korea, and Norway exhibit relatively higher proportions of orders (each exceeding 40%) which involve the utilization of alternative fuels. In particular, Korean shipowners have undergone a noticeable shift from their prior inclination towards scrubber installations on conventionally fueled vessels to actively adopting alternative fuels as a strategy for emissions reduction, as documented by Kim and Seo (2019) [20].
In contrast, shipowners originating from major shipbuilding nations such as China and Japan continue to exhibit a comparatively lower inclination towards embracing alternative fuel options in their new orders. This intriguing dynamic reflects the intricate interplay between various factors influencing shipowners’ decisions, ranging from environmental considerations to economic viability, and underscores the evolving nature of the maritime industry’s response to sustainability challenges.

5. Empirical Analysis

5.1. Model Estimation

This study encompasses four distinct models, namely the full-sample model along with specialized models for container vessels, dry bulk carriers, and tankers. The latter three models concentrate on dissecting the decision-making processes of shipowners within each respective category. The logit regression model for the complete dataset is expressed by the following equation:
ln P i ( j ) 1 P i ( j ) = β 0 + β 1 D W T i + β 2 N A T I O N i + β 3 T Y P E i + β 4 E a r n i n g s i + β 5 L N G / F O i                             + β 6 S O F R i + β 7 I d l e R a t e i + β 8 C O 2 P r i c e i + β 9 P o l i c y 1 i + β 10 P o l i c y 2 i
where P i ( j ) denotes the probability of shipowner i choosing alternative fuels j ; β 1 , β 2 , β 3 β 10 are the estimated corresponding parameters for the explanatory variables. For dry bulk ships, container ships and tankers, the variable T Y P E i is not included in the regression model. P o l i c y 1 i is the dummy variable assigned a value of one after November 2020 and zero before that. P o l i c y 2 i is the dummy variable assigned a value of one after June 2021 and zero before that.
We employ two types of tests to assess the significance of individual independent variables. The likelihood ratio test evaluates the overall relationship between the dependent variable and a series of independent variables in the model. Conversely, the Wald test scrutinizes whether a specific independent variable holds statistical significance in distinguishing between two alternative groups. The results of the likelihood ratio tests for the four models are presented in Table 9.
In the full sample model, we observe that nearly all the explanatory variables, with the exception of Policy1, exhibit significance at the 1% significance level. In the container model, Policy2 demonstrates significance at the 5% level, while all other variables are significant at the 1% level. Turning to the dry bulk model, both LNG/FO and CO2 prices are deemed insignificant, and others are all significant at the 5% level. Finally, in the tanker model, LNG/FO and earnings are not found to be significant, while the remaining variables hold significance at the 10% level.
To explore whether the explanatory variables exhibit varying effects on different groups, a Wald test is conducted on the model. One of the key advantages of the MNL model is its capability to discern the specific impact of individual explanatory variables on each group. The Wald test quantifies the significance of particular explanatory variables by testing the null hypothesis that their estimates are equal to zero. Conventional fuel is established as the baseline group and serves as a basis for comparison with other alternative fuels. The parameter estimates and results of the Wald test are illustrated in Table 10, Table 11, Table 12 and Table 13.
The coefficient represents the estimated value in the MNL model, whereas the relative risk ratio (RRR) reflects the modification in the odds ratio for each explanatory variable concerning the reference group. The RRR is computed by raising the estimated coefficient to a certain power. Economically, interpreting the relative risk coefficient entails observing the alteration in the log odds of selecting a specific category relative to the reference group. An RRR exceeding 1 indicates that an increase in the explanatory variable amplifies the log odds of choosing that particular option group. Conversely, an RRR lower than 1 suggests that an increase in the explanatory variable diminishes the log odds of selecting that option group. An RRR of 1 signifies that a change in the explanatory variable has no discernible impact on the log odds of the group.

5.2. Model Fitting

The likelihood ratio test is a commonly used method for evaluating model fit in the context of MNL models [50], and the results are presented in Table 14. The LR chi-squared test statistic serves as an indicator of the overall goodness of fit of the model, testing the joint significance of all variables except the constant. The p-values are all 0, indicating that, compared to the model containing only the constant term, the comprehensive model provides a significantly better fit. Thus, this set of explanatory variables has a substantial and statistically significant effect on the explained variables. The log likelihood is calculated for both the null model containing only a constant variable and the full model containing all explanatory variables, facilitating the comparison of nested models in terms of their explanatory power.
Pseudo R2, also known as McFadden’s R2, is a likelihood ratio index used to compare the relative size of log likelihood values between models incorporating only the constant term and those incorporating all explanatory variables. The higher the value, the better the fit of the model. An R2 value between 0.2 and 0.4 is considered “very satisfactory” [51]. The full sample model has an R2 value of 0.40, while the dry bulk, container vessels, and tanker models present R2 values of 0.21, 0.51, and 0.23, respectively. These findings collectively indicate that all four models achieve a high level of goodness of fit.

5.3. Discussion

New orders from top-ranking nations such as China, Japan, and Greece predominantly favor conventional fuels in the full sample model. Similar trends are observed in both the dry bulk and tanker models. Conversely, Singapore, Norway, and France exhibit a propensity for LNG capable-fueled vessels with odds ratios of alternative fuels over conventional fuels significantly surpassing 1. Shipowners from Singapore and France are more likely to choose methanol. Furthermore, “ready” vessels are favored by shipowners from the Republic of Korea and Germany, while Singapore and Norway display an inclination towards exploring “other fuels”.
In the container model, shipowners from France, Singapore, Italy, and Germany are more inclined to LNG capable with probabilities of roughly 96 times, 21 times, 28 times, and 11 times that of conventional fuels, respectively. Additionally, shipowners from Singapore, France, and the Republic of Korea demonstrate a preference for methanol usage. The tendency for the Republic of Korea and Germany to favor “ready” vessels is also evidenced within the container vessel category. For dry bulk vessels and tankers, shipowners from top-ranking nations in terms of orderbook volume tend to favor conventional fuel vessels.
Different national policies and shipping power dynamics drive varied preferences, suggesting emission reduction progress varies by nation.
Despite the significant correlation observed between the independent variable “DWT” and the dependent variable across all models, the RRRs associated with “DWT” for each alternative fuel option remain remarkably close to 1. In other words, even though distinct ship sizes are associated with each alternative fuel choice, the influence of ship size on the decision-making process of shipowners is limited. This same pattern holds true for dry bulkers, container ships, and tankers. Similar findings have been noted in prior studies investigating the determinants influencing emission abatement strategies within operational fleets [44].
When analyzing ship preferences by type, it becomes evident that conventional fuels are more favored by dry bulkers, container ships, tankers, and multipurpose vessels compared to LNG. In contrast, gas carriers and ro-ro vessels tend to prefer LNG, with probabilities approximately 14 times and 50 times higher than those of conventional fuels. For gas carriers, this preference can likely be attributed to their ability to leverage existing LNG infrastructure. Additionally, the unit newbuilding prices of gas carriers and ro-ro vessels are higher than those of conventional ships, making it more feasible for them to better manage the increased expenses related to constructing and operating new energy vessels.
The independent variable “earnings” exhibits a significant relationship with the dependent variable in the full sample model for various fuel options. For instance, the probability ratio of opting for LNG compared to conventional fuel is 1.011. Likewise, the probability ratios of choosing “ready” and “other fuels” relative to conventional fuels are 1.001 and 1.003, respectively. Consequently, higher levels of earnings correlate with an elevated inclination among shipowners to contemplate alternative fuels when placing orders for new ships.
However, the odds ratios, which are in proximity to 1, indicate that the impact of “earnings” is relatively modest in all models. The extent of the “earnings” variable does not play a significant role in steering shipowners toward selecting alternative fuels. Economic factors hold limited sway over shipowners’ decisions, consistent with prior research [23]. Fuel maturity, ease of refueling, and compliance with IMO policies drive decisions.
The price spread between LNG bunker prices and very low sulfur fuel oil prices is not significant in most cases. In the full sample model, shipowners are more likely to choose conventional vessels compared to “Ready” ones when the price spread is larger, and the finding is the same for container vessels. For dry bulkers, the price spread does not have an impact on shipowners’ decisions on choosing alternative fuels. For tankers, when LNG bunker prices are less competitive, shipowners prefer to order new vessels powered by methanol or other fuels.
It is worth highlighting that as the SOFR level rises, there is an observable increase in the likelihood of selecting methanol, “ready”, and “other fuels” in the full sample model. This finding is consistent with the observation that, under elevated interest rates, shipowners tend to favor investments in LNG capable, methanol, or “ready” options for container vessels and lean towards methanol and “other fuels” for tankers. In a higher-interest-rate financial environment, conventional-fuel-powered vessels might be attractive in the short term. However, new energy vessels could potentially offer advantages in terms of reduced operational costs and environmental benefits over the long term. For dry bulkers, the interest rate appears to have no significant impact on shipowners’ decision-making processes.
Fleet idle rates exert a substantial impact on LNG-fueled vessel orders across all models. Elevated idle rates diminish shipowners’ proclivity towards LNG-fueled vessels, reflecting concerns about market oversupply. Notably, new energy vessels typically entail higher costs than conventional counterparts. In the case of container vessels, shipowners’ preference for methanol would also be reduced to approximately 0.492 times that for conventional vessels, while their interest in “ready” vessels would increase. For tankers, a higher idle rate would likely lead shipowners to be less inclined towards ordering methanol-powered vessels.
The price of CO2 EUAs significantly influences the options of alternative fuels. As the CO2 EUA price escalates, the likelihood of shipowners placing orders for LNG capable-, LNG ready-, and methanol-powered vessels experiences a slight decrease. It is worth noting that both LNG and methanol fuels emit certain greenhouse gases and may not fully align with the current carbon-neutral policy of the IMO. However, due to the odds ratio being in proximity to 1, the impact of the CO2 EUA price is relatively muted. This pattern holds true for container ships and tankers. For dry bulkers, the CO2 price holds no relevance in explaining shipowners’ preferences for alternative fuel options.
Regarding the regulation-related variable, our findings highlight the noteworthy influence of the “policy” variable on shipowners’ decisions. In our investigation, we delved into the impact of the IMO policies released in both November 2020 and June 2021. “Policy1” was designed to assess the effect of the policy unveiled in November 2020 on shipowners’ inclination towards new energy vessels. Notably, this variable demonstrates statistical significance at a level of p < 0.01 for the “other fuels” option, though it does not yield significance for the other alternatives in the full sample model. In the context of dry bulk, container, and tanker vessels, “Policy1” acts as a catalyst, prompting shipowners to increase their investments in LNG capable vessels. Specifically, the odds ratios stand at 9.641, 14.939, and 44.345, respectively. This underscores a substantial shift in shipowners’ preferences towards LNG capable ships influenced by the policy implemented in November 2020.
The dummy variable “Policy2” was employed to investigate the effects of the policy introduced in June 2021 on the selection of new energy vessels. In the full sample model, the RRRs for the “Policy2” variable are 2.45, 297, and 2.164 for the LNG capable, methanol, and “other fuels” options, respectively. This observation signifies that the policy endorsed by the IMO in June 2021 carries notable influence over shipowners’ inclinations to invest in alternative fuels.
In the case of dry bulkers and tankers, following the release of this policy, shipowners exhibit an increased likelihood of ordering vessels propelled by alternative fuels other than those initially considered. For container vessels, shipowners are more prone to selecting LNG, methanol, and “ready” vessels. This attests to the policy’s impact on reshaping shipowners’ preferences in favor of various new energy options.

6. Conclusions

Implementing more stringent environmental regulations has placed significant pressure on the maritime industry. Meeting the IMO 2050 targets necessitates a profound transformation within global fleets. One part of the effort to achieve low or zero carbon shipping is to diversify marine fuels away from fossil fuels. This paper may be among the first to present an empirical analysis of drivers shaping shipowners’ preferences for alternative fuels when ordering new vessels. We propose an MNL model and employ worldwide newbuilding ship data spanning from January 2020 to July 2023 (encompassing 4712 vessels, 281 shipyards, and 967 shipping companies) for this analysis. Several noteworthy findings have emerged.
First, shipowners’ choices exhibit a significant correlation with their nationality. For example, shipowners from France, Singapore, Italy, and Germany display a greater inclination toward LNG capable, while shipowners from Singapore, France, and the Republic of Korea demonstrate a preference for methanol usage. “Ready” vessels are favored by shipowners from the Republic of Korea and Germany, while Singapore and Norway display an inclination towards exploring “other fuels” such as biofuel, battery, and ethane.
Second, vessel type emerges as a significant factor in shipowners’ selection of alternative fuels, while the size of the ship wields limited influence. Gas ships and ro-ro carriers tend to favor LNG, while others exhibit a higher probability for conventional fuels.
Third, the impact of freight market conditions is relatively modest, although a more favorable freight market may induce the adoption of alternative fuels when procuring new ships. But higher fleet idle rates diminish shipowners’ adoption of LNG and methanol. Notably, the ratio of LNG-to-fuel prices appears to exert no influence on shipowners’ inclination toward alternative fuels.
Fourthly, interest rates play a significant role in shaping shipowners’ decisions regarding various alternative marine fuels, primarily due to their association with financing costs.
Furthermore, the carbon emissions trading system acts as a catalyst for shipowners’ leanings towards wholly zero-carbon fuels, underlining the potency of policy mechanisms in shaping industry behaviors. It is also interesting to find that IMO policies and regulations have spurred demand for the construction of new energy-efficient ships.
These findings underscore that economic incentives alone may not be sufficient to motivate the maritime industry to embrace environmentally friendly fuels. Technological improvements and national policies wield substantial influence over these decisions. As the shipping industry charts its course towards sustainability, the shifting landscape necessitates that shipowners carefully assess the impact of various drivers on their investments. An in-depth understanding of these dynamics can lead to a balanced approach that aligns economic viability, environmental responsibility, and compliance with evolving regulations.
This research primarily focuses on examining the impacts of two IMO policies on shipowners’ choices, with the potential to expand our analysis to include other policy conditions such as carbon taxes or emission trading systems. Moreover, our study relies on a dataset spanning only the most recent three years and seven months, suggesting that future investigations could benefit from a more extensive and precise newbuilding orderbook dataset for a deeper analysis.

Author Contributions

Conceptualization, S.C. and S.Z.; methodology, X.W.; software, X.W. and Y.C.; validation, S.C., X.W., S.Z. and Y.C.; formal analysis, S.C.; investigation, S.C.; data curation, X.W.; writing—original draft preparation, S.C. and Y.C.; writing—review and editing, S.Z.; supervision, S.Z.; project administration, S.Z.; funding acquisition, S.C. All authors have read and agreed to the published version of the manuscript.

Funding

This work is supported by China National Social Science Fund Post-Funding Project (22FGLB113).

Institutional Review Board Statement

Not applicable.

Informed Consent Statement

Not applicable.

Data Availability Statement

Readers can access our data by sending an email to the corresponding author Shiyuan Zheng.

Acknowledgments

The authors are grateful to the anonymous reviewers and the editor for their valuable comments.

Conflicts of Interest

The authors declare no conflict of interest.

References

  1. Zis, T.; Psaraftis, H.N. Operational Measures to Mitigate and Reverse the Potential Modal Shifts Due to Environmental Legislation. Marit. Policy Manag. 2019, 46, 117–132. [Google Scholar] [CrossRef]
  2. Psaraftis, H.N. Decarbonization of Maritime Transport: To Be or Not to Be? Marit. Econ. Logist. 2019, 21, 353–371. [Google Scholar] [CrossRef]
  3. Hoffmann, P.N.; Eide, M.S.; Endresen, O. Effect of Proposed Co2 Emission Reduction Scenarios on Capital Expenditure. Marit. Policy Manag. 2012, 39, 443–460. [Google Scholar] [CrossRef]
  4. Kim, K.; Lim, S.; Lee, C.H.; Lee, W.J.; Jeon, H.; Jung, J.W.; Jung, D.H. Forecasting Liquefied Natural Gas Bunker Prices Using Artificial Neural Network for Procurement Management. J. Mar. Sci. Eng. 2022, 10, 1814. [Google Scholar] [CrossRef]
  5. Vilhelmsen, C.; Lusby, R.; Larsen, J. Tramp Ship Routing and Scheduling with Integrated Bunker Optimization. EURO J. Transp. Logist. 2013, 32, 143–175. [Google Scholar] [CrossRef]
  6. Xing, H.; Stuart, C.; Spence, S.; Chen, H. Alternative Fuel Options for Low Carbon Maritime Transportation: Pathways to 2050. J. Clean. Prod. 2021, 297, 126651. [Google Scholar] [CrossRef]
  7. Halim, R.A.; Kirstein, L.; Merk, O.; Martinez, L.M. Decarbonization Pathways for International Maritime Transport: A Model-Based Policy Impact Assessment. Sustainability 2018, 10, 2243. [Google Scholar] [CrossRef]
  8. Balcombe, P.; Brierley, J.; Lewis, C.; Skatvedt, L.; Speirs, J.; Hawkes, A.; Staffell, I. How to Decarbonise International Shipping: Options for Fuels, Technologies and Policies. Energy Convers. Manag. 2019, 182, 72–88. [Google Scholar] [CrossRef]
  9. Serra, P.; Fancello, G. Towards the Imo’s Ghg Goals: A Critical Overview of the Perspectives and Challenges of the Main Options for Decarbonizing International Shipping. Sustainability 2020, 12, 3220. [Google Scholar] [CrossRef]
  10. Romano, A.; Yang, Z. Decarbonisation of Shipping: A State of the Art Survey for 2000–2020. Ocean. Coast. Manag. 2021, 214, 105936. [Google Scholar] [CrossRef]
  11. Mallouppas, G.; Yfantis, E.A. Decarbonization in Shipping Industry: A Review of Research, Technology Development, and Innovation Proposals. J. Mar. Sci. Eng. 2021, 9, 415. [Google Scholar] [CrossRef]
  12. Bouman, E.A.; Lindstad, E.; Rialland, A.I.; Strømman, A.H. State-of-the-Art Technologies, Measures, and Potential for Reducing Ghg Emissions from Shipping—A Review. Transp. Res. Part D Transp. Environ. 2017, 52, 408–421. [Google Scholar] [CrossRef]
  13. Ampah, J.D.; Yusuf, A.A.; Afrane, S.; Jin, C.; Liu, H.F. Reviewing Two Decades of Cleaner Alternative Marine Fuels: Towards Imo’s Decarbonization of the Maritime Transport Sector. J. Clean. Prod. 2021, 320, 128871. [Google Scholar] [CrossRef]
  14. Tadros, M.; Ventura, M.; Soares, C.G. Review of Current Regulations, Available Technologies, and Future Trends in the Green Shipping Industry. Ocean. Eng. 2023, 280, 114670. [Google Scholar] [CrossRef]
  15. Moshiul, A.M.; Mohammad, R.; Hira, F.A.; Maarop, N. Alternative Marine Fuel Research Advances and Future Trends: A Bibliometric Knowledge Mapping Approach. Sustainability 2022, 14, 4947. [Google Scholar] [CrossRef]
  16. Le Fevre, C. A Review of Demand Prospects for Lng as a Marine Transport Fuel; Oxford Institute for Energy Studies: Oxford, UK, 2018. [Google Scholar]
  17. Hansson, J.; Brynolf, S.; Fridell, E.; Lehtveer, M. The Potential Role of Ammonia as Marine Fuel-Based on Energy Systems Modeling and Multi-Criteria Decision Analysis. Sustainability 2020, 12, 3265. [Google Scholar] [CrossRef]
  18. Priyanto, E.M.; Olcer, A.I.; Dalaklis, D.; Ballini, F. The Potential of Methanol as an Alternative Marine Fuel for Indonesian Domestic Shipping. Int. J. Marit. Eng. 2020, 162, 115–129. [Google Scholar] [CrossRef]
  19. Lagouvardou, S.; Lagemann, B.; Psaraftis, H.N.; Lindstad, E.; Erikstad, S.O. Marginal Abatement Cost of Alternative Marine Fuels and the Role of Market-Based Measures. Nat. Energy 2023, 1–12. [Google Scholar] [CrossRef]
  20. Kim, A.R.; Seo, Y.J. The Reduction of Sox Emissions in the Shipping Industry: The Case of Korean Companies. Mar. Policy 2019, 100, 98–106. [Google Scholar] [CrossRef]
  21. Stalmokaite, I.; Yliskyla-Peuralahti, J. Sustainability Transitions in Baltic Sea Shipping: Exploring the Responses of Firms to Regulatory Changes. Sustainability 2019, 11, 1916. [Google Scholar] [CrossRef]
  22. Hansson, J.; Mansson, S.; Brynolf, S.; Grahn, M. Alternative Marine Fuels: Prospects Based on Multi-Criteria Decision Analysis Involving Swedish Stakeholders. Biomass Bioenergy 2019, 126, 159–173. [Google Scholar] [CrossRef]
  23. Zhang, X.; Bao, Z.H.; Ge, Y.E. Investigating the Determinants of Shipowners’ Emission Abatement Solutions for Newbuilding Vessels. Transp. Res. Part D Transp. Environ. 2021, 99, 102989. [Google Scholar] [CrossRef]
  24. Makitie, T.; Steen, M.; Saether, E.A.; Bjorgum, O.; Poulsen, R.T. Norwegian Ship-Owners’ Adoption of Alternative Fuels. Energy Policy 2022, 163, 112869. [Google Scholar] [CrossRef]
  25. Chen, S.; Zheng, S.Y.; Sys, C. Policies Focusing on Market-Based Measures Towards Shipping Decarbonization: Designs, Impacts and Avenues for Future Research. Transp. Policy 2023, 137, 109–124. [Google Scholar] [CrossRef]
  26. Kaya, A.Y.; Erginer, K.E. An Analysis of Decision-Making Process of Shipowners for Implementing Energy Efficiency Measures on Existing Ships: The Case of Turkish Maritime Industry. Ocean. Eng. 2021, 241, 110001. [Google Scholar] [CrossRef]
  27. Bao, Z.H.; Zhang, X.; Fu, G.Y. Factors Influencing Decision to Sulphur Oxide Emission Abatement for Cruise Shipping Companies. Int. J. Logist. Res. Appl. 2022, 1–20. [Google Scholar] [CrossRef]
  28. Alizadeh, A.H.; Strandenes, S.P.; Thanopoulou, H. Capacity Retirement in the Dry Bulk Market: A Vessel Based Logit Model. Transp. Res. Part E-Logist. Transp. Rev. 2016, 92, 28–42. [Google Scholar] [CrossRef]
  29. Fan, L.X.; Xie, J.Q. Identify Determinants of Container Ship Size Investment Choice. Marit. Policy Manag. 2023, 50, 219–234. [Google Scholar] [CrossRef]
  30. Kanamoto, K.; Liwen, M.R.; Nakashima, M.; Shibasaki, R. Can Maritime Big Data Be Applied to Shipping Industry Analysis? Focussing on Commodities and Vessel Sizes of Dry Bulk Carriers. Marit. Econ. Logist. 2021, 23, 211–236. [Google Scholar] [CrossRef]
  31. Talluri, K.; van Ryzin, G. Revenue Management under a General Discrete Choice Model of Consumer Behavior. Manag. Sci. 2004, 50, 15–33. [Google Scholar] [CrossRef]
  32. Louviere, J.J.; Hensher, D.A.; Swait, J.D. Stated Choice Methods: Analysis and Applications; Cambridge University Press: Cambridge, UK, 2000. [Google Scholar]
  33. Balcombe, P.; Staffell, I.; Kerdan, I.G.; Speirs, J.F.; Brandon, N.P.; Hawkes, A.D. How Can Lng-Fuelled Ships Meet Decarbonisation Targets? An Environmental and Economic Analysis. Energy 2021, 227, 120462. [Google Scholar] [CrossRef]
  34. Lindstad, E.; Eskeland, G.S.; Rialland, A.; Valland, A. Decarbonizing Maritime Transport: The Importance of Engine Technology and Regulations for Lng to Serve as a Transition Fuel. Sustainability 2020, 12, 8793. [Google Scholar] [CrossRef]
  35. Wang, S.Y.; Notteboom, T. The Adoption of Liquefied Natural Gas as a Ship Fuel: A Systematic Review of Perspectives and Challenges. Transp. Rev. 2014, 34, 749–774. [Google Scholar] [CrossRef]
  36. Lee, B.; Lee, H.; Lim, D.; Brigljevic, B.; Cho, W.; Cho, H.S.; Kim, C.H.; Lim, H. Renewable Methanol Synthesis from Renewable H-2 and Captured Co2: How Can Power-to-Liquid Technology Be Economically Feasible? Appl. Energy 2020, 279, 115827. [Google Scholar] [CrossRef]
  37. Verhelst, S.; Turner, J.W.G.; Sileghem, L.; Vancoillie, J. Methanol as a Fuel for Internal Combustion Engines. Prog. Energy Combust. Sci. 2019, 70, 43–88. [Google Scholar] [CrossRef]
  38. Inal, O.B.; Zincir, B.; Deniz, C. Investigation on the Decarbonization of Shipping: An Approach to Hydrogen and Ammonia. Int. J. Hydrogen Energy 2022, 47, 19888–19900. [Google Scholar] [CrossRef]
  39. Zincir, B. Environmental and Economic Evaluation of Ammonia as a Fuel for Short-Sea Shipping: A Case Study. Int. J. Hydrogen Energy 2022, 47, 18148–18168. [Google Scholar] [CrossRef]
  40. Foretich, A.; Zaimes, G.G.; Hawkins, T.R.; Newes, E. Challenges and Opportunities for Alternative Fuels in the Maritime Sector. Marit. Transp. Res. 2021, 2, 100033. [Google Scholar] [CrossRef]
  41. Lindstad, E.; Lagemann, B.; Rialland, A.; Gamlem, G.M.; Valland, A. Reduction of Maritime Ghg Emissions and the Potential Role of E-Fuels. Transp. Res. Part D Transp. Environ. 2021, 101, 103075. [Google Scholar] [CrossRef]
  42. Solakivi, T.; Paimander, A.; Ojala, L. Cost Competitiveness of Alternative Maritime Fuels in the New Regulatory Framework. Transp. Res. Part D Transp. Environ. 2022, 113, 103500. [Google Scholar] [CrossRef]
  43. Steen, M.; Bach, H.; Bjørgum, Ø.; Hansen, T.; Kenzhegaliyeva, A. Greening the Fleet: A Technological Innovation System (Tis) Analysis of Hydrogen, Battery Electric, Liquefied Biogas, and Biodiesel in the Maritime Sector; SINTEF: Trondheim, Norway, 2019. [Google Scholar]
  44. Li, K.; Wu, M.; Gu, X.H.; Yuen, K.F.; Xiao, Y. Determinants of Ship Operators’ Options for Compliance with Imo 2020. Transp. Res. Part D Transp. Environ. 2020, 86, 102459. [Google Scholar] [CrossRef]
  45. Beenstock, M. A Theory of Ship Prices. Marit. Policy Manag. 1985, 12, 215–225. [Google Scholar] [CrossRef]
  46. Xu, J.J.; Yip, T.L. Ship Investment at a Standstill? An Analysis of Shipbuilding Activities and Policies. Appl. Econ. Lett. 2012, 19, 269–275. [Google Scholar] [CrossRef]
  47. Jiang, L.; Kronbak, J.; Christensen, L.P. The Costs and Benefits of Sulphur Reduction Measures: Sulphur Scrubbers Versus Marine Gas Oil. Transp. Res. Part D Transp. Environ. 2014, 28, 19–27. [Google Scholar] [CrossRef]
  48. Zhu, M.; Yuen, K.F.; Ge, J.W.; Li, K.X. Impact of Maritime Emissions Trading System on Fleet Deployment and Mitigation of Co2 Emission. Transp. Res. Part D Transp. Environ. 2018, 62, 474–488. [Google Scholar] [CrossRef]
  49. Yang, J.L.; Zhang, X.; Ge, Y.E. Measuring Risk Spillover Effects on Dry Bulk Shipping Market: A Value-at-Risk Approach. Marit. Policy Manag. 2022, 49, 558–576. [Google Scholar] [CrossRef]
  50. Mazzanti, M. Discrete Choice Models and Valuation Experiments. J. Econ. Stud. 2003, 30, 584–604. [Google Scholar] [CrossRef]
  51. Law, P.K. A Theory of Reasoned Action Model of Accounting Students’ Career Choice in Public Accounting Practices in the Post-Enron. J. Appl. Account. Res. 2010, 11, 58–73. [Google Scholar] [CrossRef]
Figure 1. Conceptual framework of this research.
Jmse 11 01896 g001
Figure 2. Orderbook distribution across different fuels from Q1 2020 to Q2 2023.
Jmse 11 01896 g002
Table 1. Detailed description of the explanatory variables.
Explanatory VariablesDescription
Ship-relatedDWTDeadweight tonnage of the vessel
TypeShip type in the orderbook; 1 if ship type is dry bulker; 2 if container vessel; 3 if tanker; 4 if multipurpose; 5 if gas carrier; 6 if ro-ro; 7 if general cargo vessel
Shipowner-relatedNationChina, Japan, Greece, Singapore, Republic of Korea, Germany, Norway, France etc. The selected countries account for over 75% of all orders
Market-relatedEarnings (USD/day)Monthly value of ClarkSea Index for full sample model (composite index of freight market performance). For the dry bulk model, container model, and tanker model, Clarkson Average Earnings are used for dry bulks, containers, and tankers, respectively.
LNG/FOThe ratio of monthly LNG bunker prices over very low sulfur fuel oil prices
SOFR (%)Secured overnight financing rate
Idle rate (%)The ratio of the idle fleet over the total
CO2 price (USD/day)CO2 European Union Allowances price
Regulation-relatedPolicyDummy variables of decarbonization policies
Table 2. The number of merchant vessels categorized according to the vessel type.
Vessel TypeNumber of OrdersProportion
Bulk146731.13%
Container115224.45%
Tanker89018.89%
Multi-purpose1082.29%
Gas carrier54511.56%
Ro-ro1853.92%
General cargo3657.74%
Total4712100%
Source: compiled by authors.
Table 3. Fuel selection distribution statistics.
Alternative FuelsNumber of OrdersProportionTonnage (Million)Proportion
Conventional fuel320367.98%179.2456.47%
LNG capable77116.36%78.524.76%
Methanol1412.99%16.95.33%
Ready3266.92%32.810.35%
Other fuels2715.75%9.743.07%
Total4712100%317.18100%
Source: compiled by authors.
Table 4. The percentage distribution of each alternative fuel based on vessel type.
Vessel TypeConventionalLNG CapableMethanolReadyOther Fuels
Bulk92.2%4.9%0.5%2.2%0.1%
Container60.3%18.1%9.5%11.3%0.7%
Tanker70.3%8.7%2.5%13.5%5.1%
Multi-purpose83.3%2.8%0.0%9.3%4.6%
Gas carrier14.7%53.4%0.0%1.5%30.5%
Ro-ro13.0%59.5%1.1%13.5%13.0%
General cargo66.2%1.8%27.9%0.0%4.2%
Source: compiled by authors.
Table 5. Statistical description of newbuilding vessels’ DWT according to alternative fuels.
Alternative FuelDWT
MeanStd. Dev.Max.Min.Median
Conventional fuel55,962.0451,921.87319,2027249,000
LNG capable101,803.7467,689.98321,020250096,000
Methanol119,532.9368,809.73225,0004000140,000
Ready100,661.8489,198.77320,00011063,598
Other fuels35,936.3422,722.5064,01290030,108
Total67,305.9861,627.50321,0207255,077
Source: compiled by authors.
Table 6. IMO actions to reduce GHG emissions from ships.
YearMilestone Actions
2020.11Encouraging member states to develop and submit voluntary National Action Plans to address GHG emissions from ships
2021.06Three additional measures adopted including a mandatory Carbon Intensity Indicator (CII), an Energy Efficiency Existing Ship Index (EEXI), and a strengthening SEEMP
2021.12Initiating the revision of the Initial IMO Strategy on Reduction of GHG Emissions from Ships
2022.06A series of 10 technical Guidelines adopted to support the implementation of the short-term GHG reduction measure
2022.12Amendments adopted to MARPOL Annex VI to revise the data collection system for fuel oil consumption for the implementation of the EEXI and the CII framework
2023.07Resolution adopted on Guidelines on lifecycle GHG intensity of marine fuels (LCA guidelines)
Source: compiled from the IMO website.
Table 7. Top ten shipowners in terms of orderbook volume.
RankShipownersConventional FuelLNG CapableMethanolReadyOther FuelsTotal
1Eastern Pacific Shpg35360234107
2CMA CGM1655240095
3CDB Leasing81000081
4MSC126003075
5Evergreen Marine470240071
6Seaspan Corporation402500065
7BoCom Leasing441800062
8Nisshin Shipping50000050
9Wan Hai Lines48000048
10SITC47000047
Notes: CDB Leasing, known as China Development Bank Financial Leasing Co., Ltd., Shenzheng China. BoCo Leasing, known as Bank of Communications Financial Leasing Co., Ltd., Shanghai China. Source: Compiled by authors.
Table 8. Top seven countries in terms of orderbook volume.
RankTop 7Conventional FuelLNG CapableMethanolReadyOther FuelsTotal
1China11331111650381348
2Japan746100122236916
3Greece3127607019477
4Singapore1135519639232
5Republic of Korea8670103121218
6Germany1201923511187
7Norway495801122140
Source: compiled by authors.
Table 9. Likelihood ratio test of explanatory variables.
Explanatory
Variable
FullDry BulkContainerTanker
Chi-SquareSigChi-SquareSigChi-SquareSigChi-SquareSig
Nation491.770.00067.580.000501.270.000177.550.000
Type2097.350.000(-)(-)(-)(-)(-)(-)
DWT460.810.00025.650.000263.230.00093.540.000
Idle29.340.00016.670.00054.590.0007.930.09
SOFR95.880.0006.680.0327.180.00010.760.03
LNG/FO22.230.0000.160.9237.020.0007.290.12
CO2 price26.400.0002.010.3735.530.00010.570.03
Earnings39.720.0009.610.00014.990.0006.710.15
Policy15.460.249.600.00011.160.0223.500.000
Policy253.320.0006.190.0433.370.00010.260.03
Notes: (-) in the table represents that the variable “TYPE” is not applicable in the Likelihood ratio test.
Table 10. Parameter estimates and Wald test results for alternative fuels in full sample model.
LNG CapableMethanolReadyOther Fuels
ParametersRRRParametersRRRParametersRRRParametersRRR
Nation (China)−1.105 ***
(0.172)
0.331−0.928 ***
(0.333)
0.395−0.819 ***
(0.193)
0.441−1.488 ***
(0.246)
0.226
Nation (Japan)−1.172 ***
(0.197)
0.310−0.704 *
(0.379)
0.495−1.096 ***
(0.258)
0.334−1.829 ***
(0.270)
0.161
Nation (Greece)−1.162 ***
(0.214)
0.313−16.39
(678.3)
00.0404
(0.197)
1.041−1.935 ***
(0.331)
0.144
Nation (Singapore)0.489 **
(0.217)
1.6310.821 **
(0.343)
2.273−1.298 ***
(0.441)
0.2731.136 ***
(0.275)
3.114
Nation (Republic of Korea)−0.185
(0.262)
0.8310.717
(0.449)
2.0480.697 ***
(0.255)
2.008−0.750 **
(0.357)
0.472
Nation (Germany)0.356
(0.296)
1.428−0.574
(0.779)
0.5631.222 ***
(0.253)
3.394−0.239
(0.447)
0.787
Nation (Norway)1.151 ***
(0.287)
3.161−13.94
(1037)
00.945 **
(0.384)
2.5730.856 **
(0.352)
2.354
Nation (France)2.100 ***
(0.287)
8.1661.472 ***
(0.430)
4.358−19.62
(7574)
00.102
(0.769)
1.107
TYPE (Dry Bulk)−2.393 ***
(0.420)
0.09112.18
(729.0)
1.94 × 10514.42
(836.5)
1.83 × 10⁶−3.977 ***
(0.772)
0.019
TYPE (Container)−1.098 ***
(0.411)
0.33415.70
(729.0)
6.58 × 10616.47
(836.5)
1.42 × 10⁷−2.377 ***
(0.472)
0.093
TYPE (Tanker)−1.086 **
(0.425)
0.33814.04
(729.0)
1.25 × 10616.49
(836.5)
1.45 × 10⁷−0.367
(0.326)
0.693
TYPE (Multipurpose)−1.586 **
(0.711)
0.205−0.685
(1615)
0.50415.79
(836.5)
7.20 × 10⁶−0.698
(0.547)
0.498
TYPE (Gas carrier)2.675 ***
(0.412)
14.512−1.481
(1854)
0.24216.04
(836.5)
9.25 × 1063.679 ***
(0.318)
39.607
TYPE (Ro-ro)3.915 ***
(0.438)
50.14915.04
(729.0)
3.40 × 10618.79
(836.5)
1.45 × 1082.397 ***
(0.401)
10.990
DWT 11.355 ***
(0.0794)
1.0140.681 ***
(0.129)
1.0070.440 ***
(0.0699)
1.0040.110
(0.0743)
1.001
Earnings 11.599 ***
(0.378)
1.016−1.428
(0.883)
0.9861.926 ***
(0.425)
1.01691.327 ***
(0.496)
1.013
LNG/FO0.153
(0.0933)
1.165−0.0936
(0.171)
0.911−0.468 ***
(0.141)
0.6260.194
(0.127)
1.214
SOFR0.0612
(0.0509)
1.0630.630 ***
(0.099)
1.8780.388 ***
(0.0604)
1.4740.348 ***
(0.0714)
1.416
Idle Rate−1.107 ***
(0.249)
0.331−0.252
(0.448)
0.777−0.905 ***
(0.313)
0.4050.123
(0.351)
1.131
CO2 Price 1−1.180 ***
(0.396)
0.988−3.880 ***
(0.951)
0.962−0.974 **
(0.461)
0.990−1.224 **
(0.551)
0.988
Policy1−0.207
(0.327)
0.813−0.388
(0.984)
0.678−0.104
(0.400)
0.9010.904 *
(0.470)
2.469
Policy20.896 ***
(0.303)
2.4505.694 ***
(1.090)
297.080.0585
(0.338)
1.0600.772 *
(0.426)
2.164
Constant−23.02 ***
(3.598)
2.239
(729.1)
−34.24
(836.5)
−12.89 ***
(4.718)
Traditional_fuel (based outcome)
Observations4712471247124712
Notes: 1 means variables are transformed into logarithms in order to make sense in explanations, *** p < 0.01, ** p < 0.05, * p < 0.1. RRR, known as relative risk ratio, is calculated by taking the exponential of the parameter estimate. Shipowner nations were selected for the analysis based on a single criterion: accounting for over 70% of orderbook volume, combined.
Table 11. Parameter estimates and Wald test results for alternative fuels in dry bulk model.
LNG CapableOther Alternative Fuels
ParametersRRRParametersRRR
Nation (China)−0.959 ***
(0.312)
0.383−2.312 ***
(0.517)
0.099
Nation (Japan)−1.363 ***
(0.338)
0.256−2.090 ***
(0.512)
0.124
Nation (Greece)−0.872 *
(0.475)
0.418−15.99
(578.9)
0
DWT 10.481 **
(0.189)
1.0041.411 ***
(0.335)
1.014
Earnings 1−1.902 ***
(0.622)
0.981−1.008
(0.936)
0.989
LNG/VLSFO0.00925
(0.209)
1.0100.0866
(0.214)
1.090
SOFR−0.401 **
(0.183)
0.6700.318
(0.247)
1.374
Idle Rate−1.591 ***
(0.434)
0.2340.267
(0.408)
1.306
CO2 Price 11.026
(0.895)
1.010−1.267
(1.610)
0.987
Policy12.266 ***
(0.760)
9.6410.276
(1.397)
1.318
Policy2−0.795
(0.503)
0.4522.147 *
(1.248)
8.559
Constant13.44 **
(6.315)
−6.943
(10.08)
Traditional_fuel (based outcome)
Observations14671467
Notes: 1 means variables are transformed into logarithms in order to make sense in explanations, *** p < 0.01, ** p < 0.05, * p < 0.1. RRR, known as relative risk ratio, is calculated by taking the exponential of the parameter estimate. Top three shipowner nations make up over 70% of total orderbook volume in terms of dry bulk vessels.
Table 12. Parameter estimates and Wald test results for alternative fuels in container model.
LNG CapableMethanolReadyOther Fuels
ParametersRRRParametersRRRParametersRRRParametersRRR
Nation (China)−0.802 *
(0.418)
0.448−1.700 *
(0.901)
0.183−1.207 ***
(0.327)
0.299−2.727 ***
(0.526)
0.065
Nation (Greece)−1.435 ***
(0.361)
0.238−16.96
(1667)
0−0.667 **
(0.271)
0.513−16.52
(1086)
0
Nation (Japan)−1.663 ***
(0.586)
0.190−1.480
(0.981)
0.228−17.84
(1053)
0−3.771 ***
(0.875)
0.023
Nation (Singapore)0.0807
(0.407)
1.0840.912
(0.708)
2.489−1.936 ***
(0.551)
0.144−1.146 *
(0.644)
0.318
Nation (Republic of Korea)−18.19
(1833)
0−16.58
(3897)
0−1.153 **
(0.470)
0.316−17.40
(1715)
0
DWT 10.864 ***
(0.141)
1.009−0.373
(0.232)
1.0030.252 ***
(0.0957)
1.003−0.924 ***
(0.176)
0.991
Earnings 10.525 *
(0.302)
1.005−4.804 **
(2.342)
0.953−6.5e−04
(0.252)
1.000−0.483
(0.450)
1.005
LNG/VLSFO0.303
(0.289)
1.3542.216 **
(0.959)
9.171−0.416
(0.320)
1.5160.503 *
(0.282)
1.654
SOFR0.0208
(0.168)
1.0213.090 **
(1.249)
21.9770.162
(0.148)
1.1760.596 ***
(0.223)
1.815
Idle Rate−0.995 **
(0.399)
0.369−3.879 **
(1.837)
0.021−0.0348
(0.304)
0.966−0.422
(0.519)
0.656
CO2 Price 1−2.771 ***
(1.004)
0.9734.359
(3.325)
1.045−0.953
(0.834)
0.991−1.692
(1.603)
0.983
Policy13.792 ***
(0.920)
44.345−2.997
(2.096)
0.0501.353 *
(0.698)
3.869−0.724
(1.508)
2.063
Policy2−0.742
(0.815)
0.476−3.482
(3.357)
0.031−0.137
(0.708)
0.8723.325 **
(1.420)
28.560
Constant−11.50 **
(5.503)
41.47
(28.05)
−0.0912
(4.549)
17.38 **
(8.821)
Traditional_fuel (based outcome)
Observations890890890890
Notes: 1 means variables are transformed into logarithms in order to make sense in explanations, *** p < 0.01, ** p < 0.05, * p < 0.1. RRR, known as relative risk ratio, is calculated by taking the exponential of the parameter estimate. Top five shipowner nations make up over 70% of total orderbook volume in terms of container vessels.
Table 13. Parameter estimates and Wald test results for alternative fuels in tanker model.
LNG CapableMethanolReady
ParametersRRRParametersRRRParametersRRR
Nation (China)−3.981 ***
(0.805)
0.019−1.698 ***
(0.614)
0.1830.406
(0.351)
1.501
Nation (France)4.572 ***
(0.472)
96.7373.309 ***
(0.574)
27.358−16.61
(4926)
0
Nation (Singapore)3.059 ***
(0.448)
21.3062.690 ***
(0.553)
14.7320.470
(0.777)
1.600
Nation (Italy)3.364 ***
(0.487)
28.904−17.00
(2428)
01.032
(0.710)
2.807
Nation (Republic of Korea)0.821
(0.670)
2.2731.449 **
(0.593)
4.2592.636 ***
(0.392)
13.957
Nation (Greece)−0.787
(0.794)
2.197−16.76
(1645)
02.427 ***
(0.379)
11.325
Nation (Germany)2.467 ***
(0.572)
11.7871.405
(0.858)
4.0763.358 ***
(0.409)
28.732
DWT 12.979 ***
(0.274)
1.0302.008 ***
(0.268)
1.0200.869 ***
(0.146)
1.009
Earnings 13.338 ***
(0.980)
1.0340.984
(1.052)
1.0101.552 **
(0.756)
1.016
LNG/VLSFO0.00525
(0.301)
1.0050.259
(0.308)
1.296−1.890 ***
(0.378)
0.151
SOFR1.134 ***
(0.283)
3.1081.268 ***
(0.291)
3.5540.429 **
(0.215)
1.536
Idle Rate−1.053 ***
(0.339)
0.349−0.710 **
(0.341)
0.4921.401 ***
(0.281)
4.059
CO2 Price 1−7.390 ***
(1.374)
0.929−6.028 ***
(1.630)
0.942−1.048
(1.083)
0.989
Policy12.704 ***
(0.835)
14.9392.428
(1.985)
11.3360.356
(0.972)
1.428
Policy22.300 ***
(0.881)
9.9743.55 ***
(1.91)
34.811.691 ***
(0.577)
5.425
Constant−42.90 ***
(8.031)
−30.60
(1731)
−27.03 ***
(6.089)
Observations114411441144
Notes: 1 means variables are transformed into logarithms in order to make sense in explanations, *** p < 0.01, ** p < 0.05. RRR, known as relative risk ratio, is calculated by taking the exponential of the parameter estimate. Top seven shipowner nations make up over 70% of total orderbook volume in terms of tankers.
Table 14. Likelihood ratio test for the MNL model.
Regression ModelLR chi2Prob > chi2−2 Log LikelihoodPseudo R2
Full sample model3854.570.005688.570.40
Dry bulk model185.820.007765.620.21
Container model1264.040.001219.920.51
Tanker model399.530.001330.230.23
Disclaimer/Publisher’s Note: The statements, opinions and data contained in all publications are solely those of the individual author(s) and contributor(s) and not of MDPI and/or the editor(s). MDPI and/or the editor(s) disclaim responsibility for any injury to people or property resulting from any ideas, methods, instructions or products referred to in the content.

