1. Introduction
Soil–structure interactions have gradually become a worldwide hot issue in offshore engineering since numerous offshore structure failures have been reported due to the reduction in the bearing capacity associated with the soil–structure interaction. The shear behavior of the soil–structure interface is often regarded as an essential factor affecting the bearing capacity of deep structures. Offshore structures, such as offshore oil platforms and offshore wind turbines (OWT), are often subjected to vertical cyclic loads under storm loads. Resistance degradation may occur at the soil–structure interface, thus reducing the vertical bearing capacity of the foundation [
1]. In this process, shear stiffness and damping ratio are crucial indicators to characterize its dynamic response [
2]. Therefore, it is of paramount importance for offshore engineering design and safety evaluation to clarify the mechanical properties, shear failure mode, and dynamic response law of the soil–structure interface and further reasonably determine its side friction.
The shear behavior and dynamic response at the soil–structure interface vary with the distinctive mechanical properties of different soil types. Some scholars have carried out cyclic shear research on different types of soil, such as sand [
3], coarse-grained soil [
4], frozen soil [
5], bentonite sand mixtures (BSM) [
6], and calcareous sand [
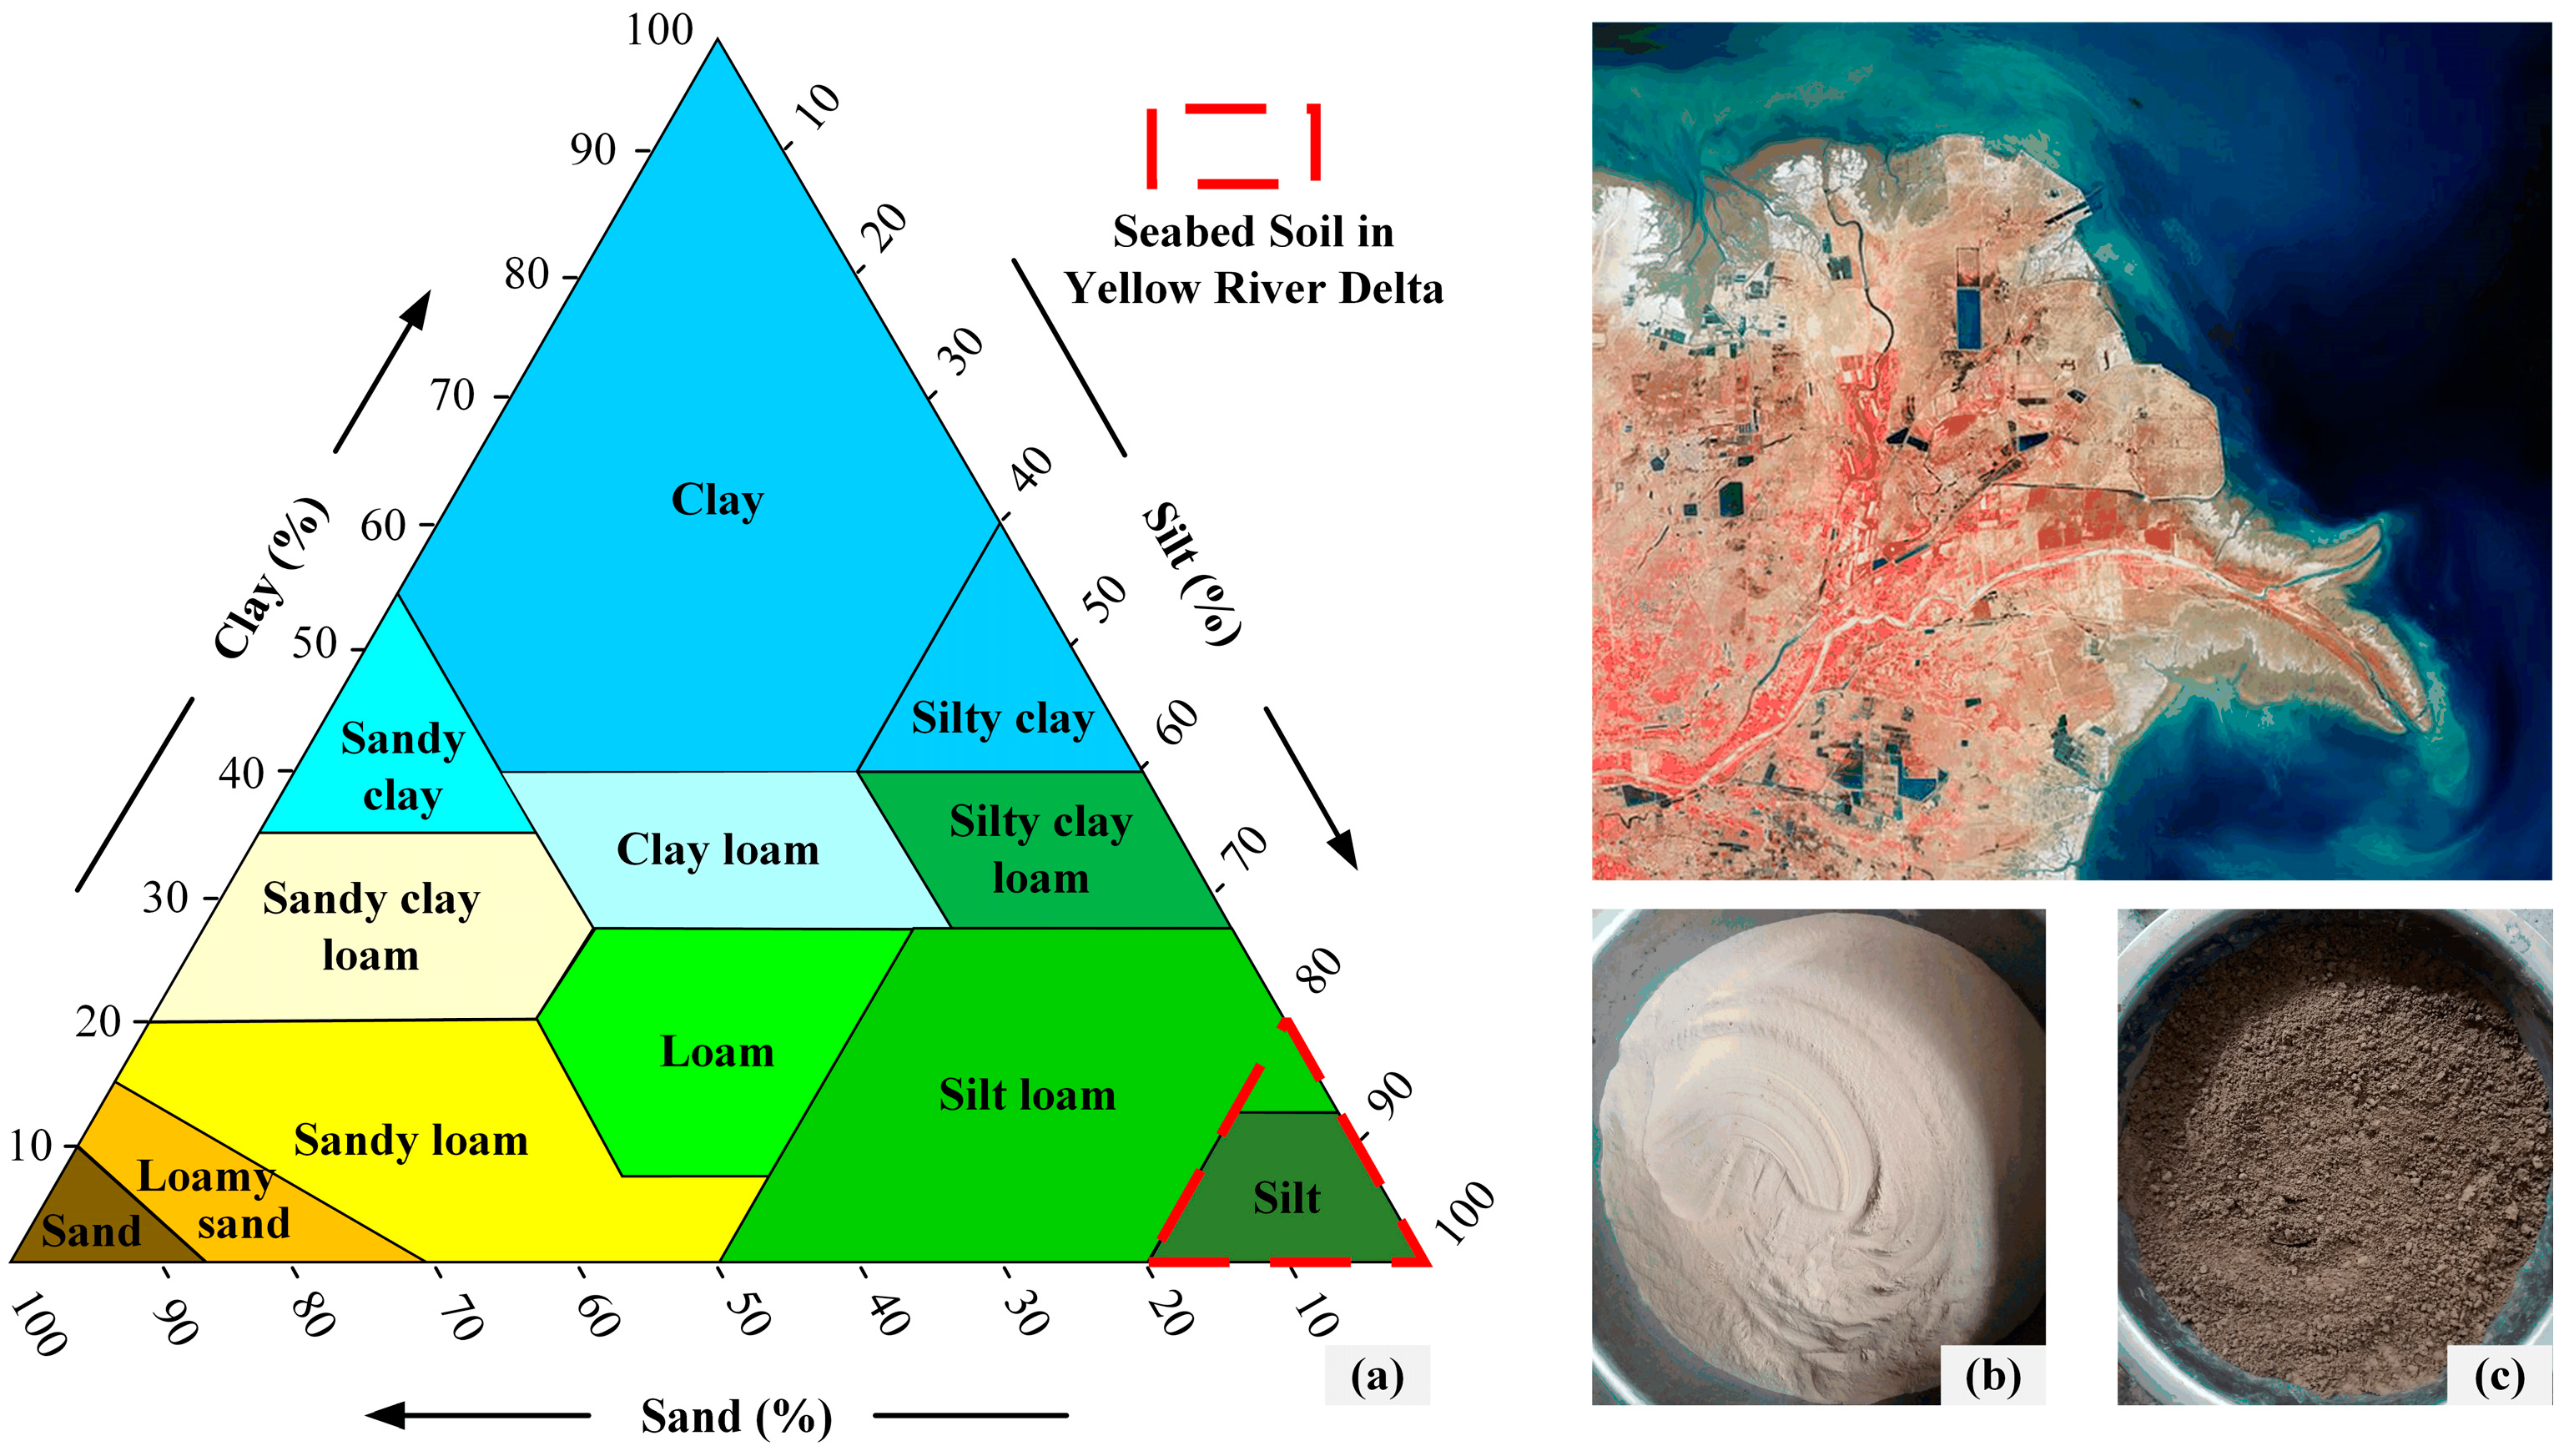
7]. However, only some studies have focused on the shear behavior and dynamic response of the silt–structure interface. As is known, silt possesses the composite mechanical characteristics of sand and clay and has a unique engineering property. Expressly, it should be noted that the silt in the Yellow River Delta is typically formed under rapid deposition, and the pore water inside the soil cannot be discharged in time [
8,
9]. In this regard, the sediment on the surface has no time for consolidation, which, in turn, induces a relatively large pore pressure, high water content, and compressibility—but low shear strength [
10] (
Figure 1).
Until now, there have been few studies on the silt–structure interface in the Yellow River Delta, and we reported most of these studies. In previous studies, the direct shear characteristics [
12] and volumetric strain [
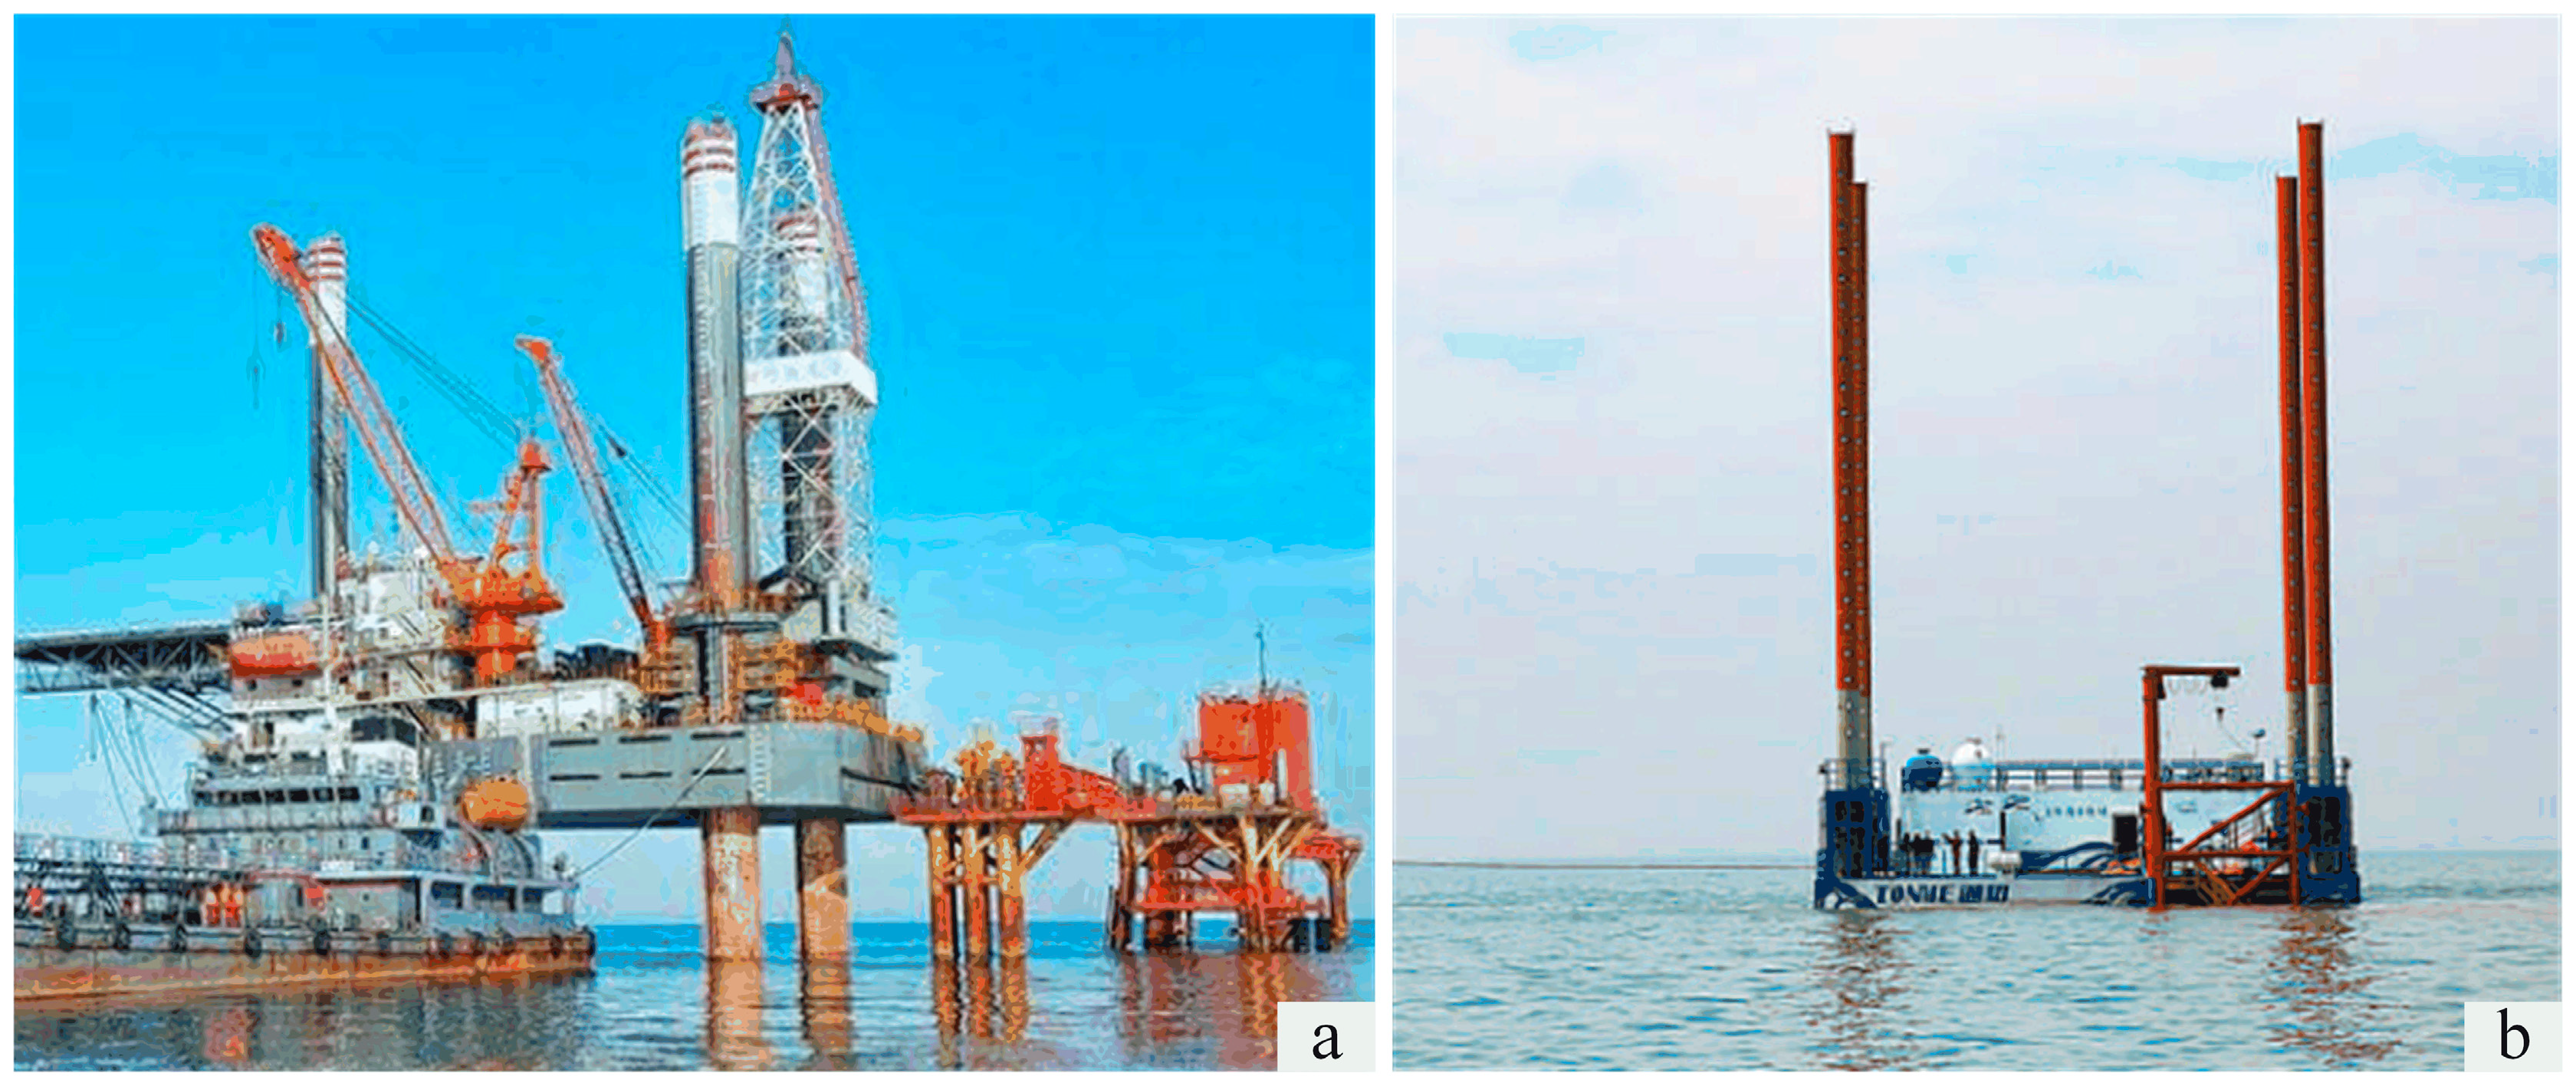
13] were investigated, and this paper is the follow-up of these precedent ones. In the present work, the effect of five factors, namely, the number of cycles, shear amplitude, normal stress, roughness, and water content, were clarified for the cycle shear mechanical characteristics and dynamic response law of the pile–soil interface under cyclic loads that were analogous to a storm. This paper aimed to provide a theoretical and technical reference for designing and evaluating offshore structures in the area (
Figure 2).
2. Large-Scale CNL Cyclic Shear Tests
2.1. Testing Apparatus
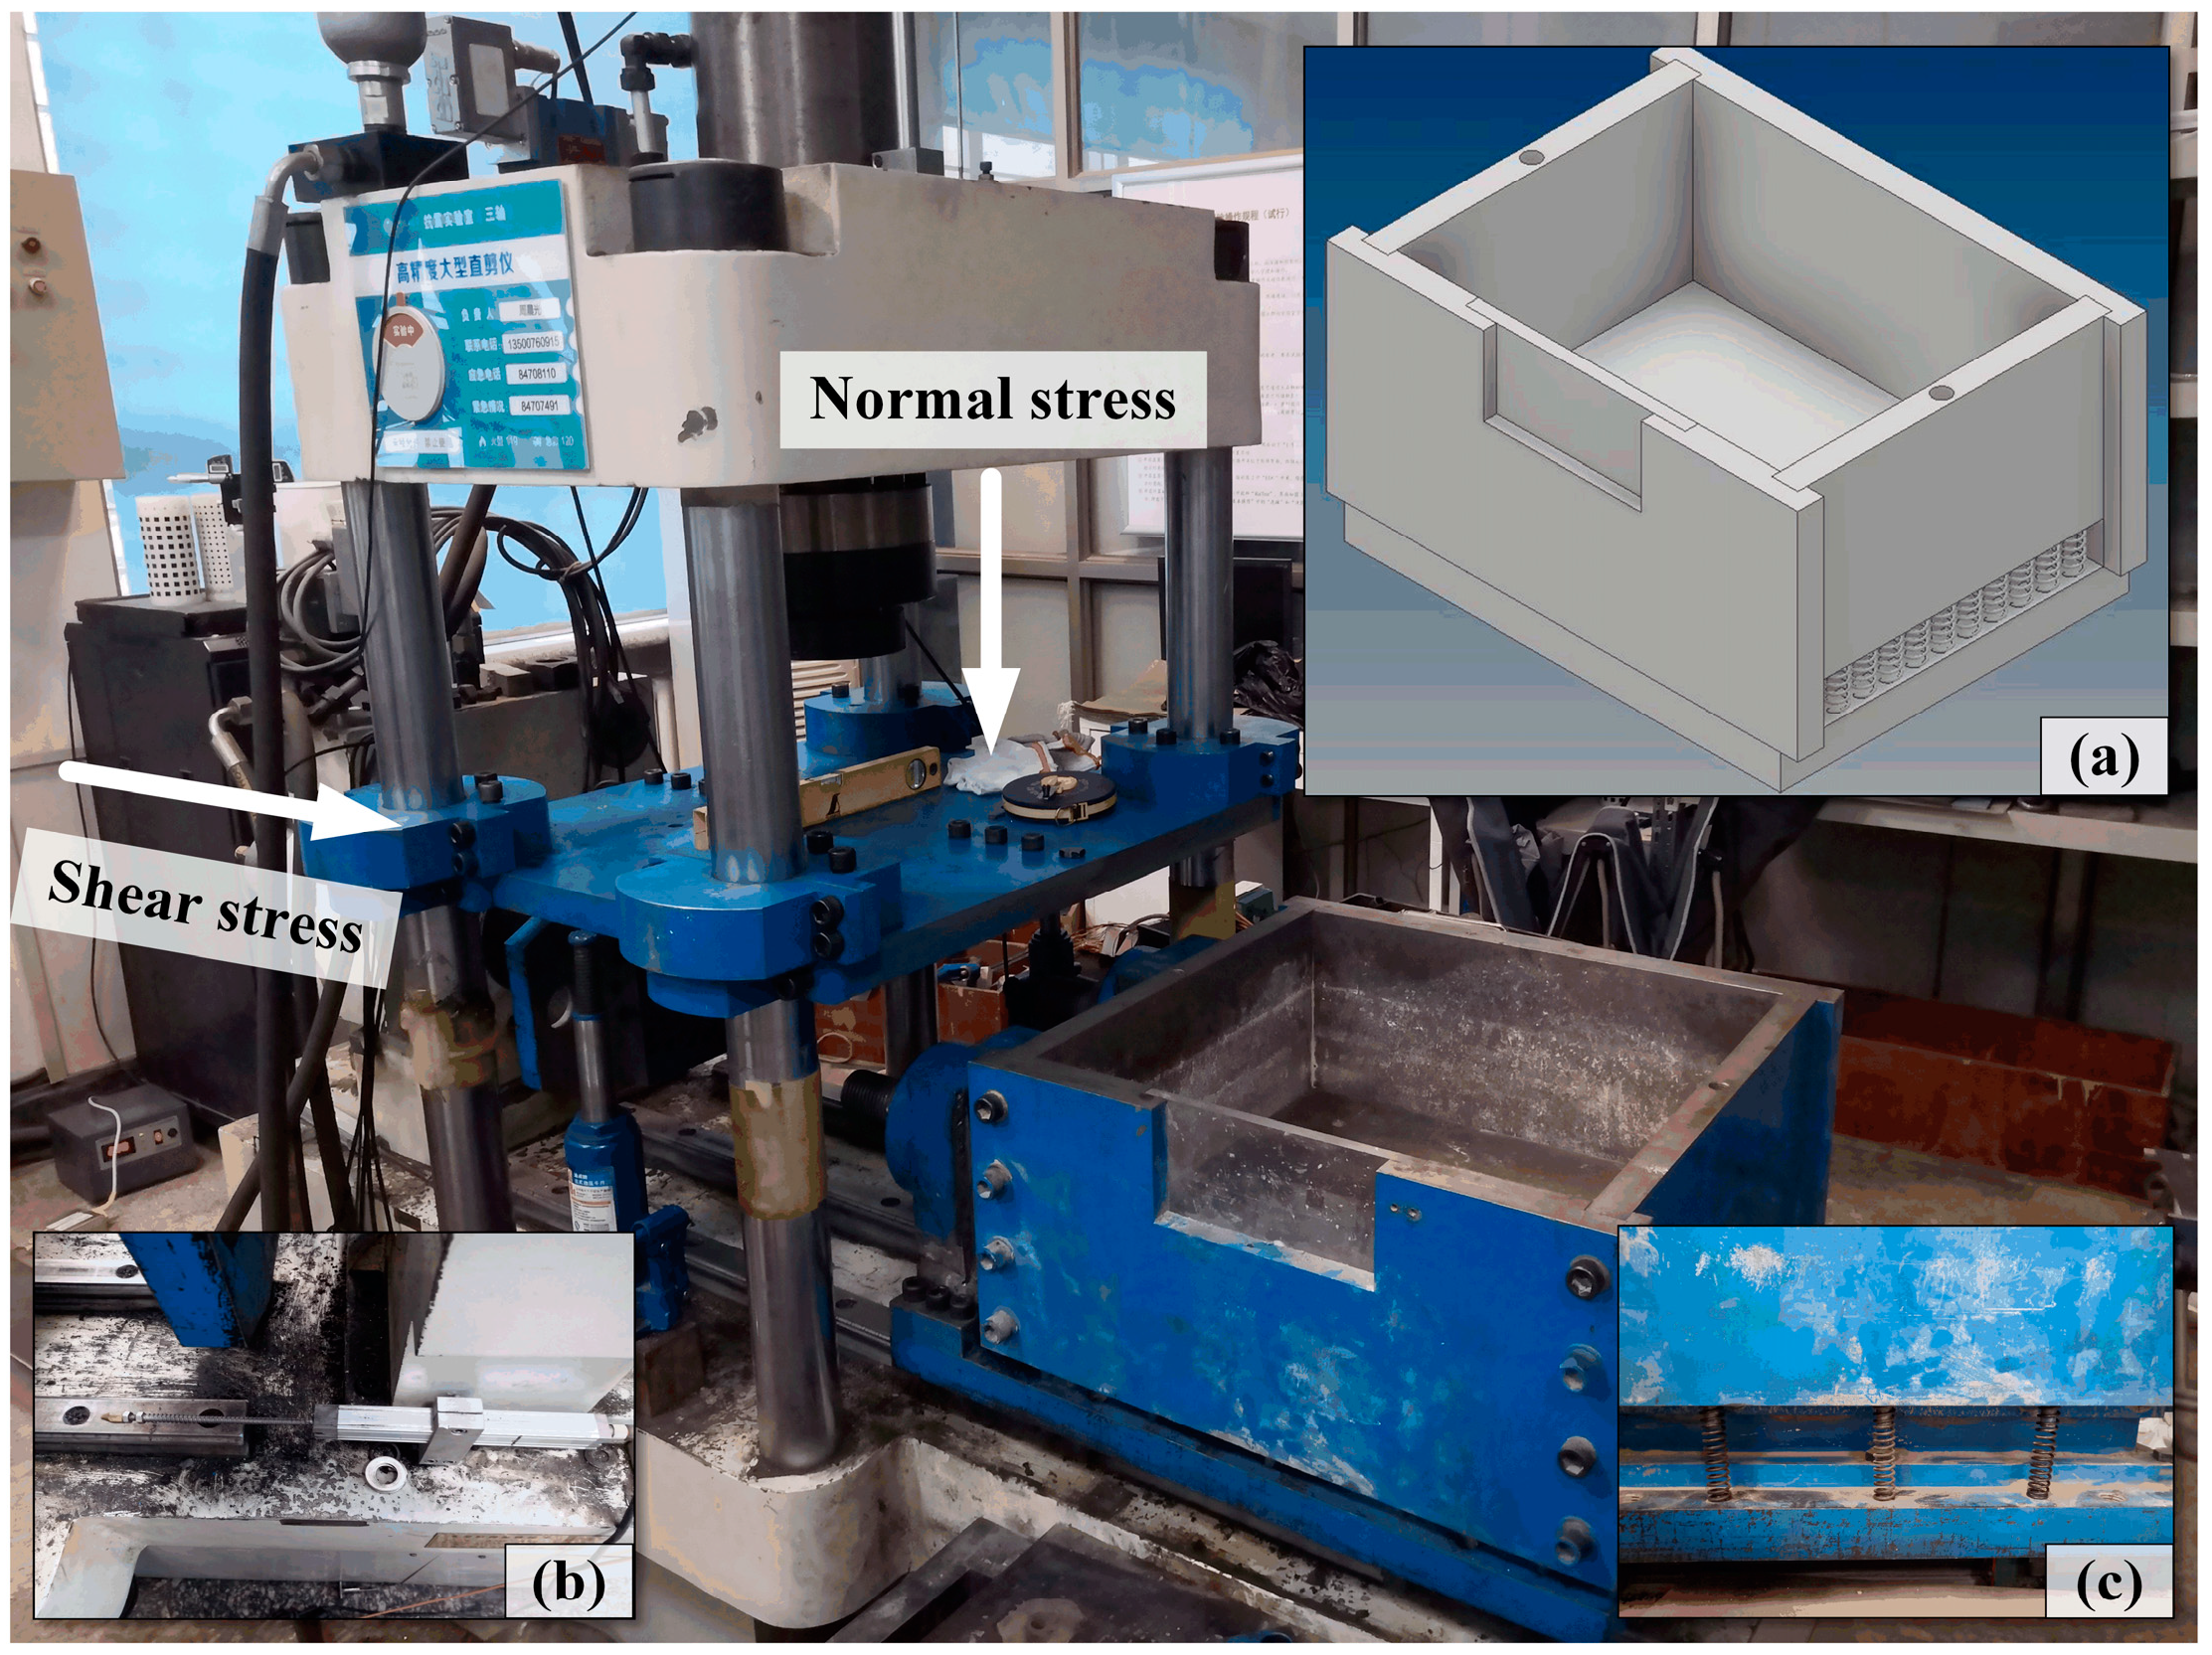
The tests were carried out under constant normal load conditions (CNL) with a JAW-500 large shear apparatus (
Figure 3). The shear instrument adopted computer-controlled hydraulic loading. It was equipped with a relevant cooling system to ensure efficient and constant loading during the test. Twenty springs were used to connect the shear box with a lower sliding plate; thus, it allowed for free movement in a vertical direction, which enabled the efficient measuring of the volume change during the shear process [
14,
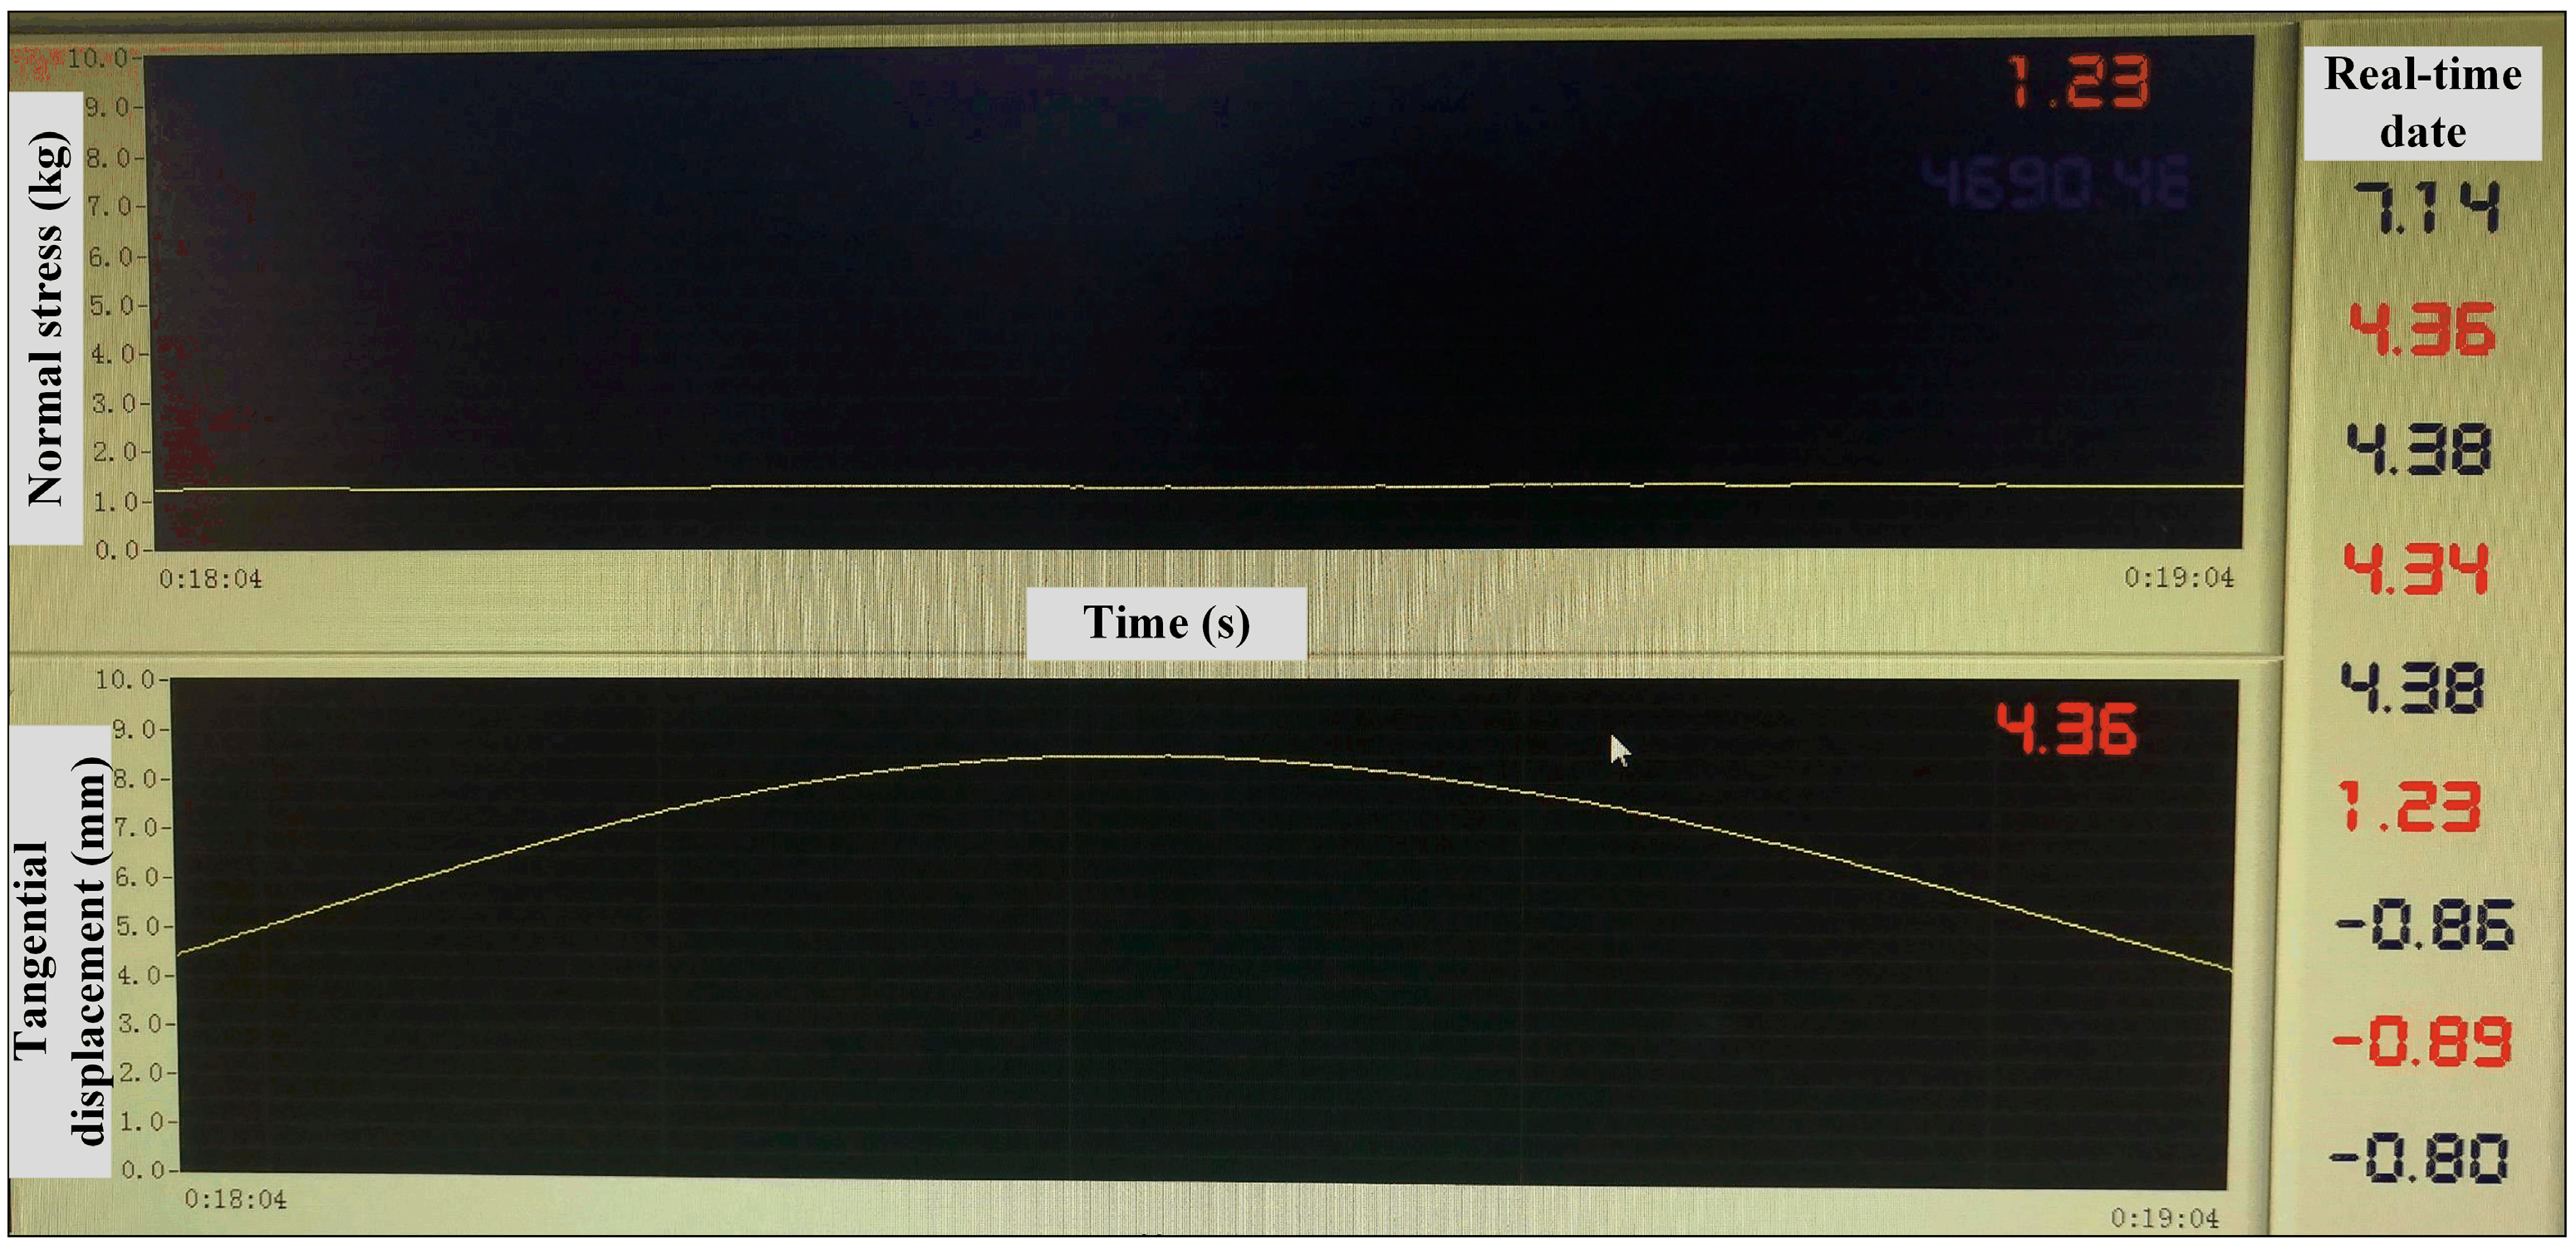
15]. The apparatus collected real-time data during the test through the matched monitoring instrument and data acquisition system (
Figure 4).
2.2. Testing Materials
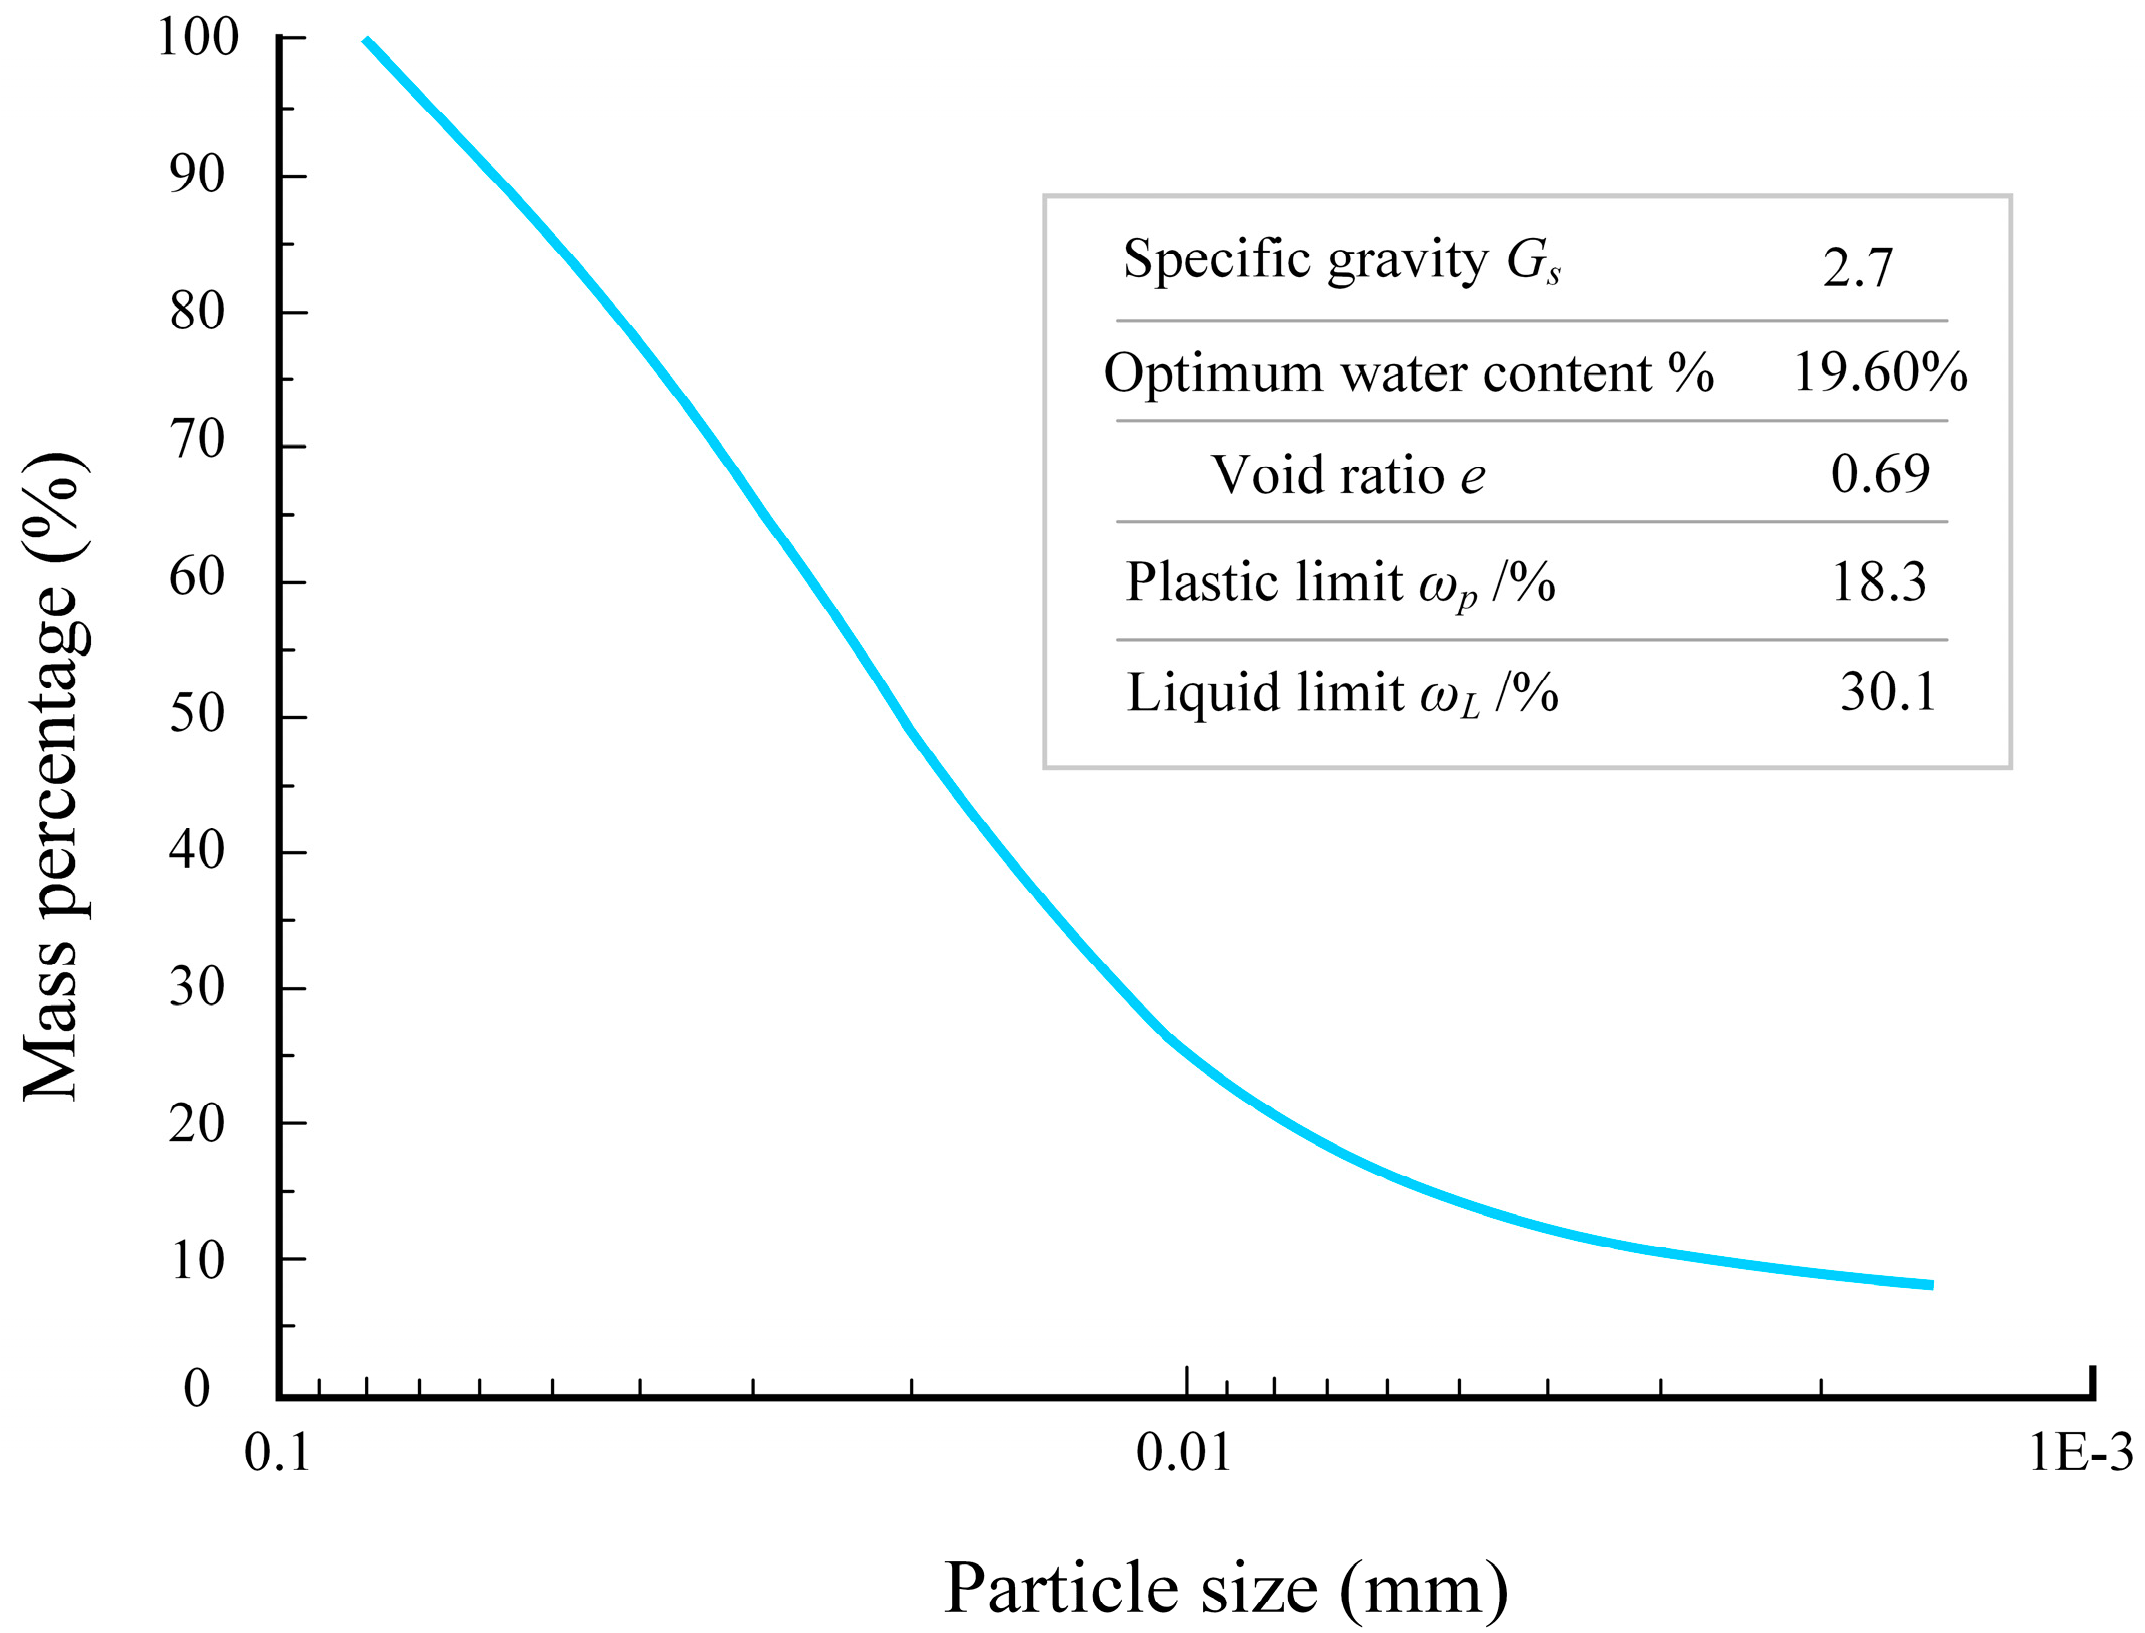
The soil used in the test was taken from the Yellow River silt of the Chendao Oilfield. Its physical characteristics included high roundness and porosity, poor permeability, and inter-particle occlusion. The particle size and basic physical properties of the soil sample are shown in
Figure 5. Considering the disturbance during the construction of the structure, the undisturbed soil was remolded according to Standard GB/T50123-2019 for soil testing. The process of running a series of interface tests must adopt the large instruments mentioned above, which consume many materials. Therefore, three soil samples with different saturations of 63.5%, 79.3%, and 95.2% (with water contents of 16%, 20%, and 24%, respectively) were prepared by controlling the dry density (1.61 g/cm
3).
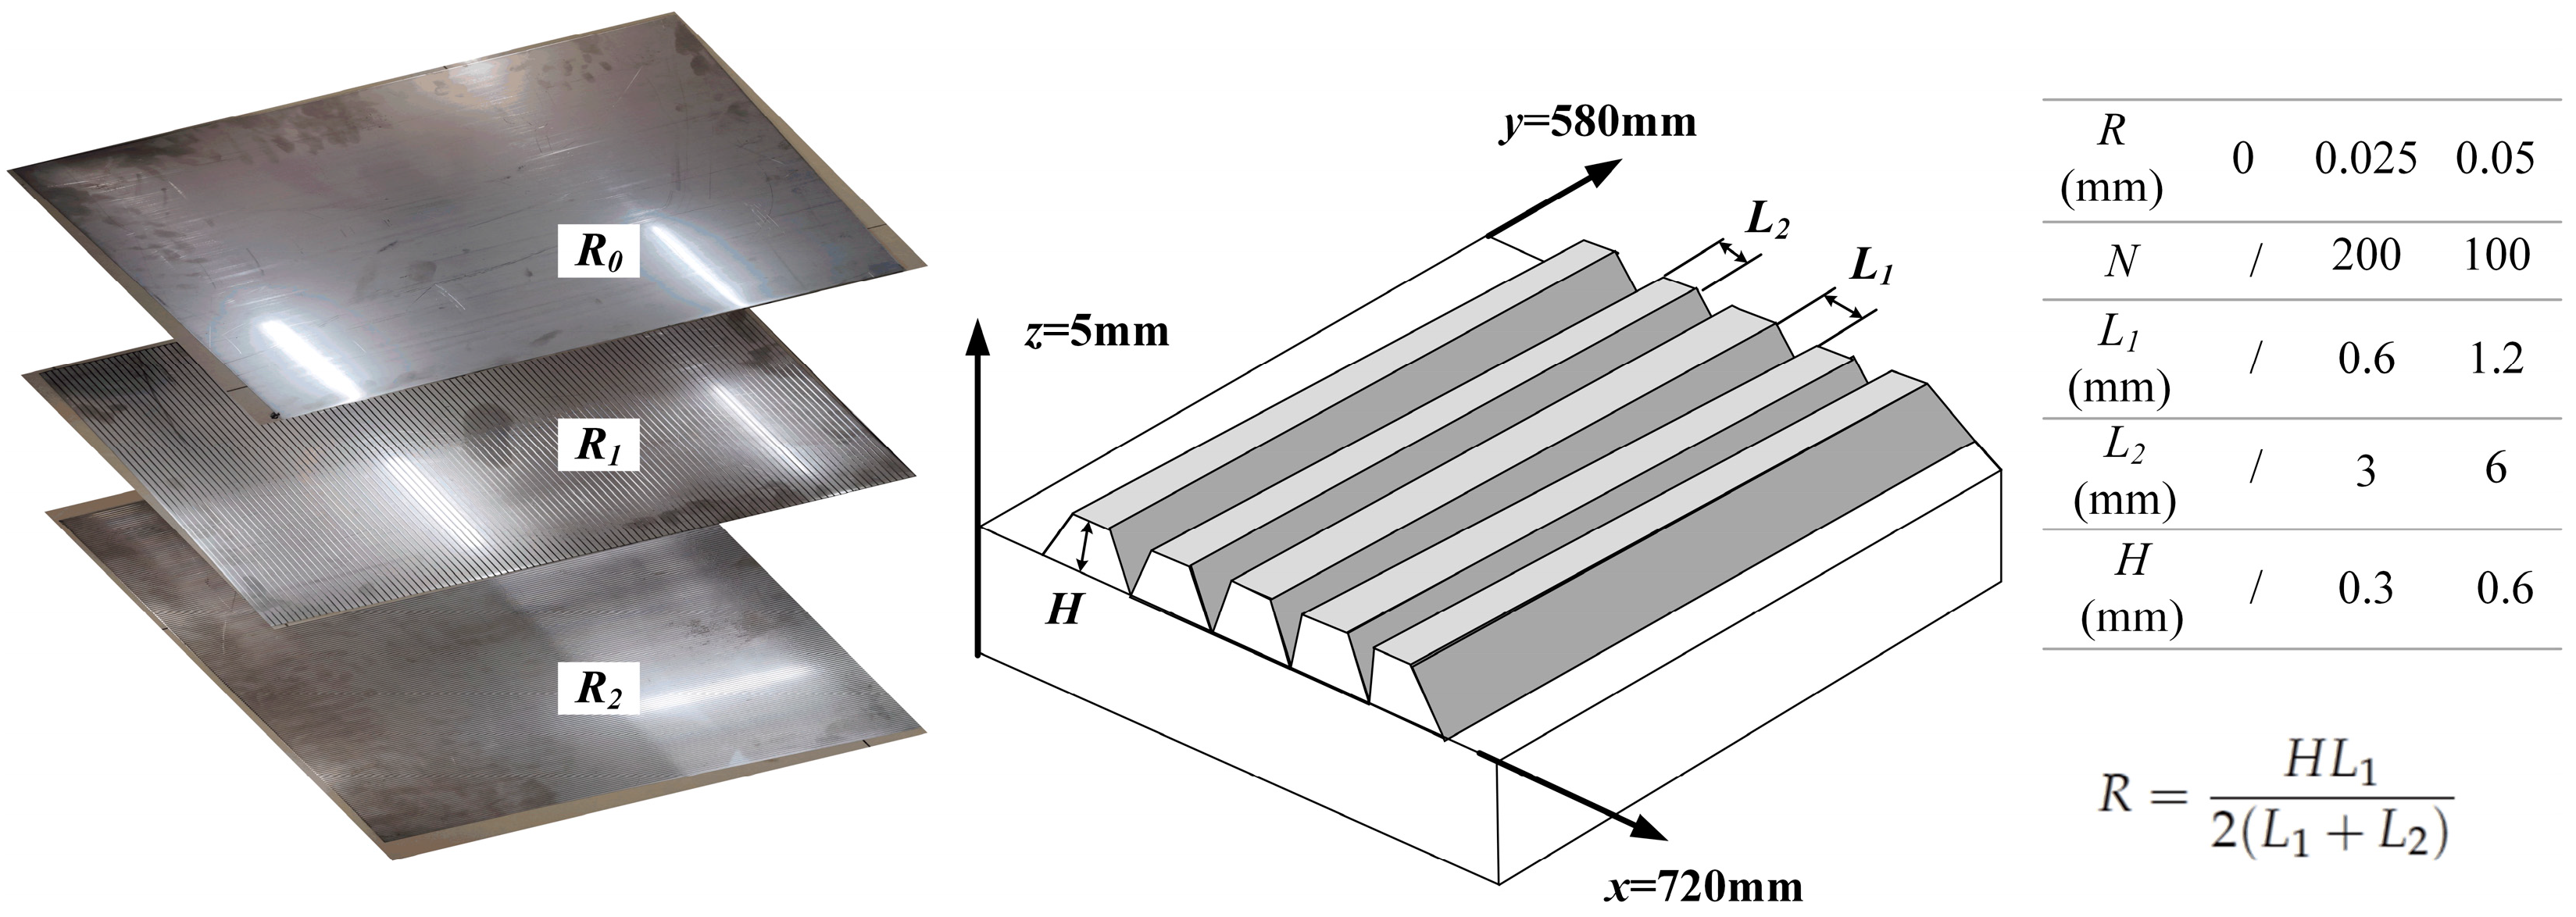
With consideration of the fact that the foundation surface was not entirely smooth in the actual project due to rust or erosion, the grooving process was used to process three different roughness levels of a steel plate:
R0 (smooth),
R1 (slightly rough), and
R2 (rough) (
Figure 6). The sand filling method, average profile height, fractal dimension method, etc., typically determine the surface roughness. In this test, three parameters (the peak valley distance
H, groove cross-section width
L1, and platform spacing
L2) were defined to determine the surface roughness according to the modified sand-filling method [
16]. The steel plate had no material loss during the tests.
2.3. Testing Scheme
The test scheme used was the same as that of our previous study on interfacial shear properties, and so it will not be repeated here [
13]. This test conducted nine undrained shear tests, which included three types of normal stress, shear amplitude, roughness, and water content (
Table 1). The maximum saturation of the sample was 95.2%, which met the requirements of the indoor shear test [
17]. Relevant studies have found that the influence of shear rate on interface shear properties under low-stress conditions can be ignored, and the test rate was 1 mm/s [
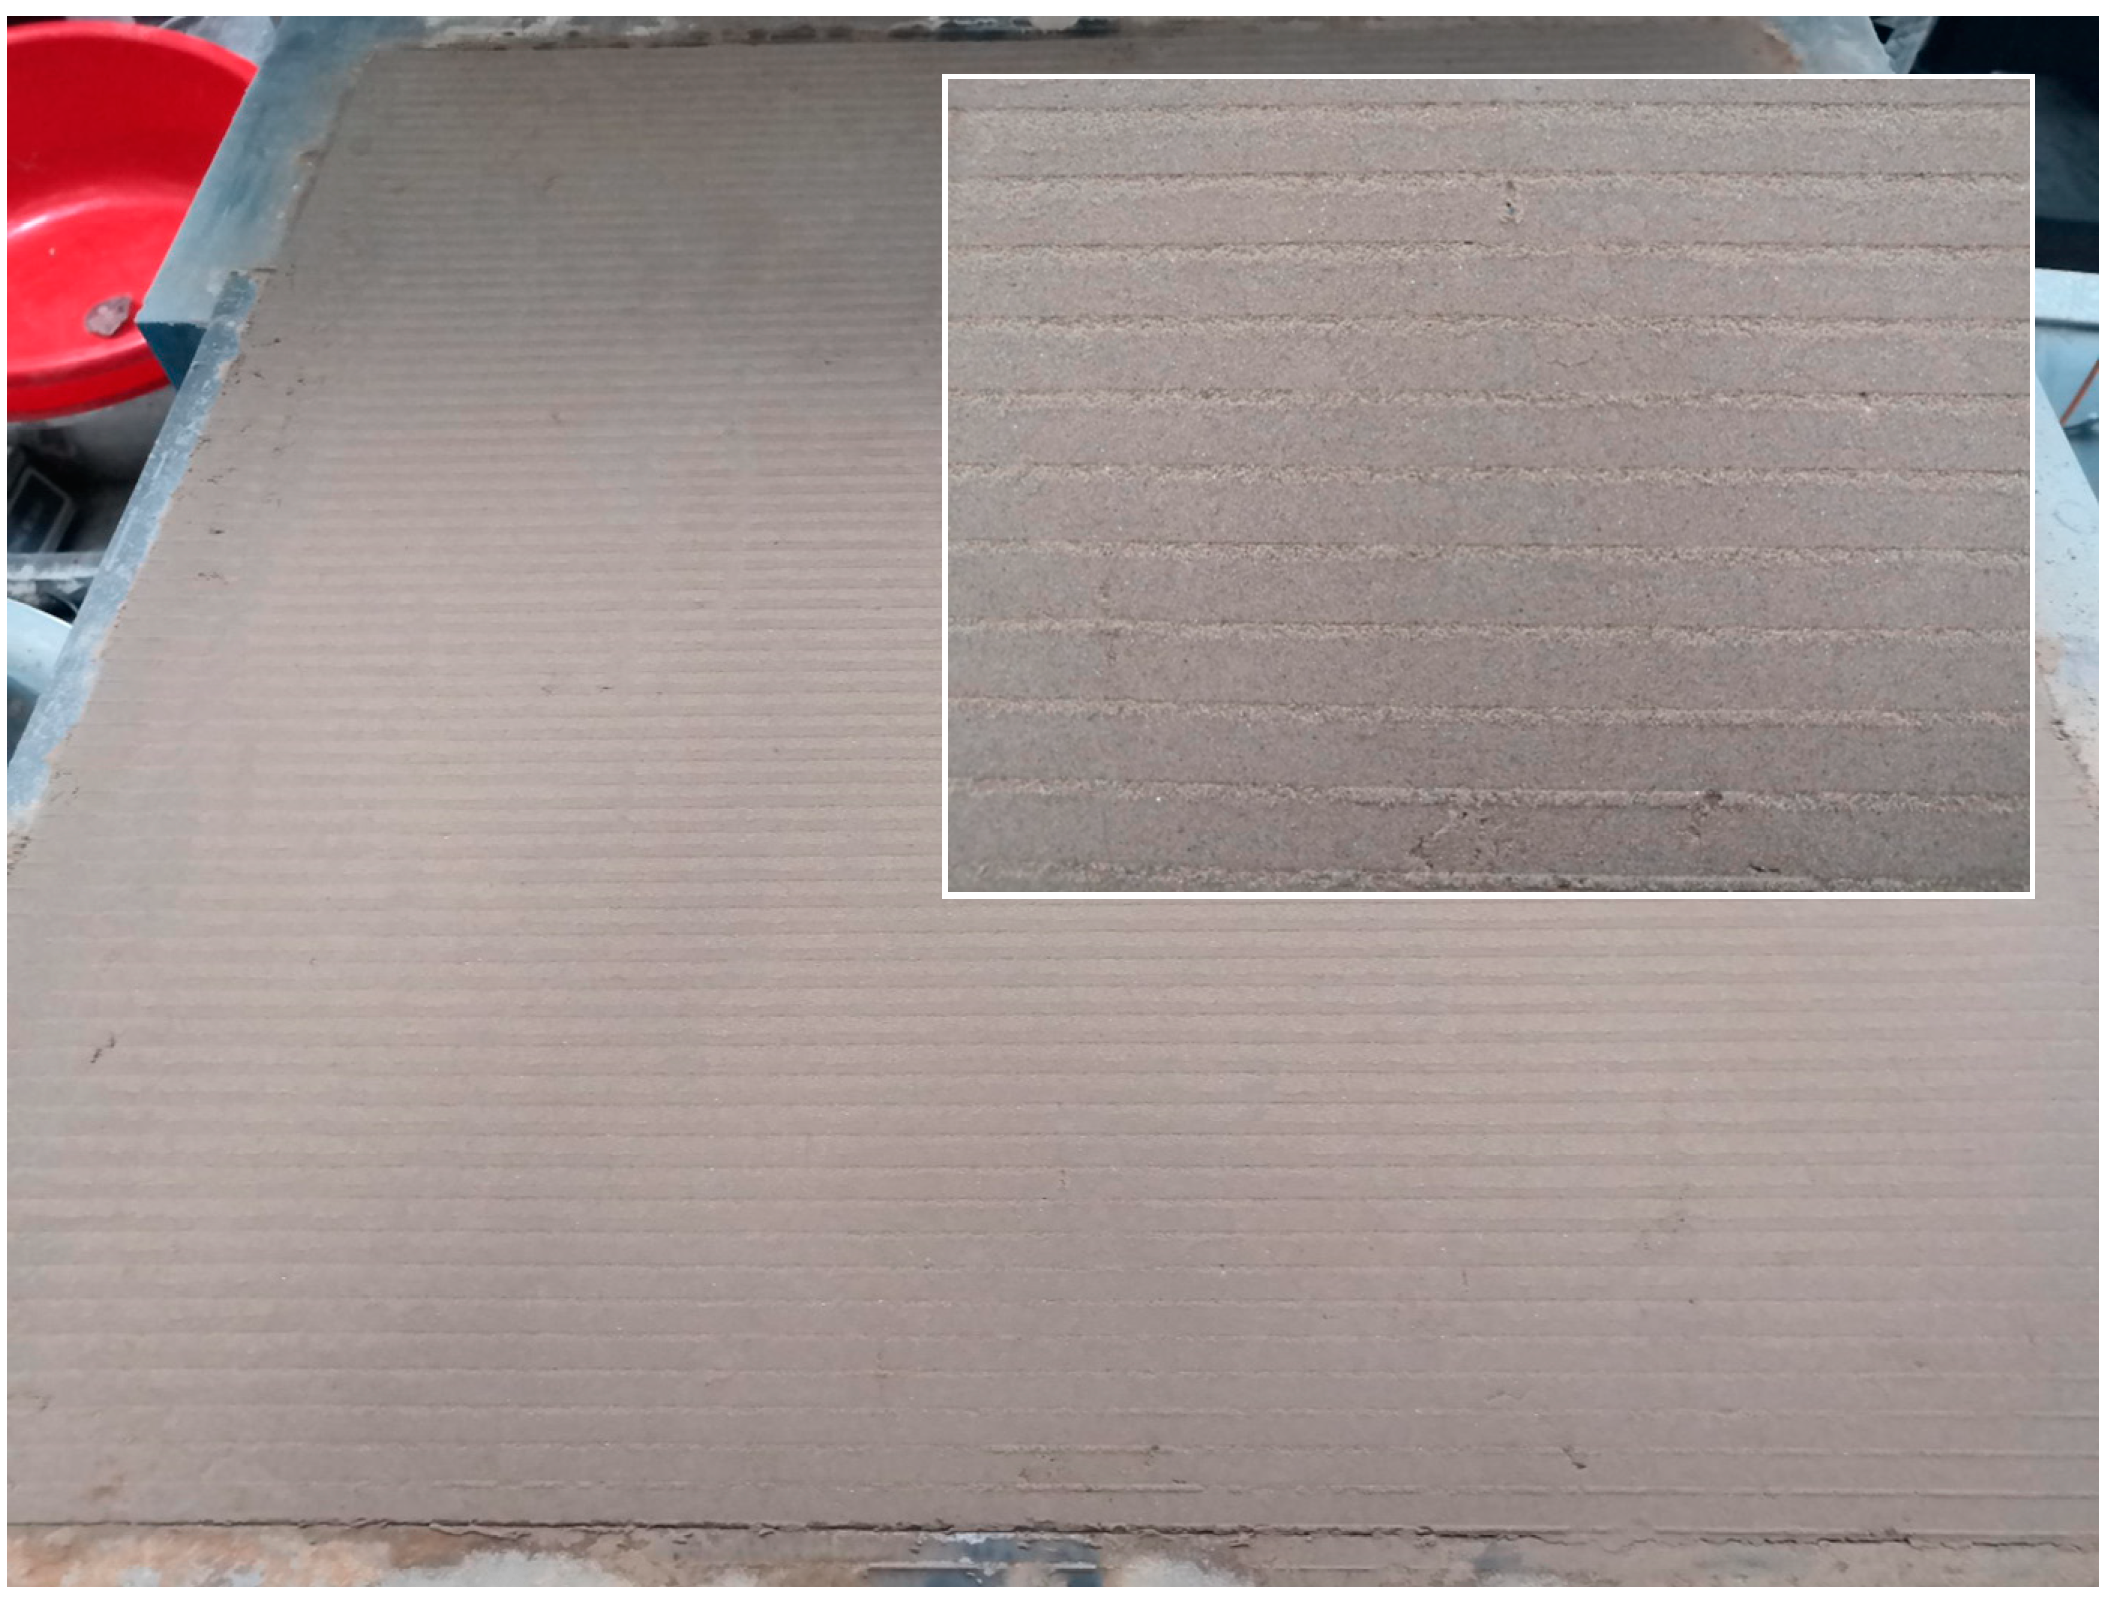
18]. The interface after the test was completed i9s shown in
Figure 7.
3. Results and Discussion
Since the data are too many to be displayed individually, the results of the 1st, 5th, 10th, 15th, 20th, 25th, and 30th cycle tests were selected as representative datasets for the analysis. In this section, the shear strength and dynamic response of the steel–silt interface will be studied in detail.
3.1. Interface Shear Strength
To further explore the shear mechanics under different cycles, the shear strength in each cycle was set as the peak shear stress
τmax. The peak shear stress was equal to the average magnitude of the positive and negative maximum shear stress. Furthermore, the definition of the stress ratio
Dτ was introduced to characterize the relationship between the peak shear stress and the cycle number and between the stress ratio and the cycle number.
where
is the maximum positive shear stress of one cycle and the maximum negative shear stress of one cycle, and
is the peak shear stress of the first cycle while
is the peak shear stress of the
n-th cycle.
3.1.1. The Influence of Normal Stress
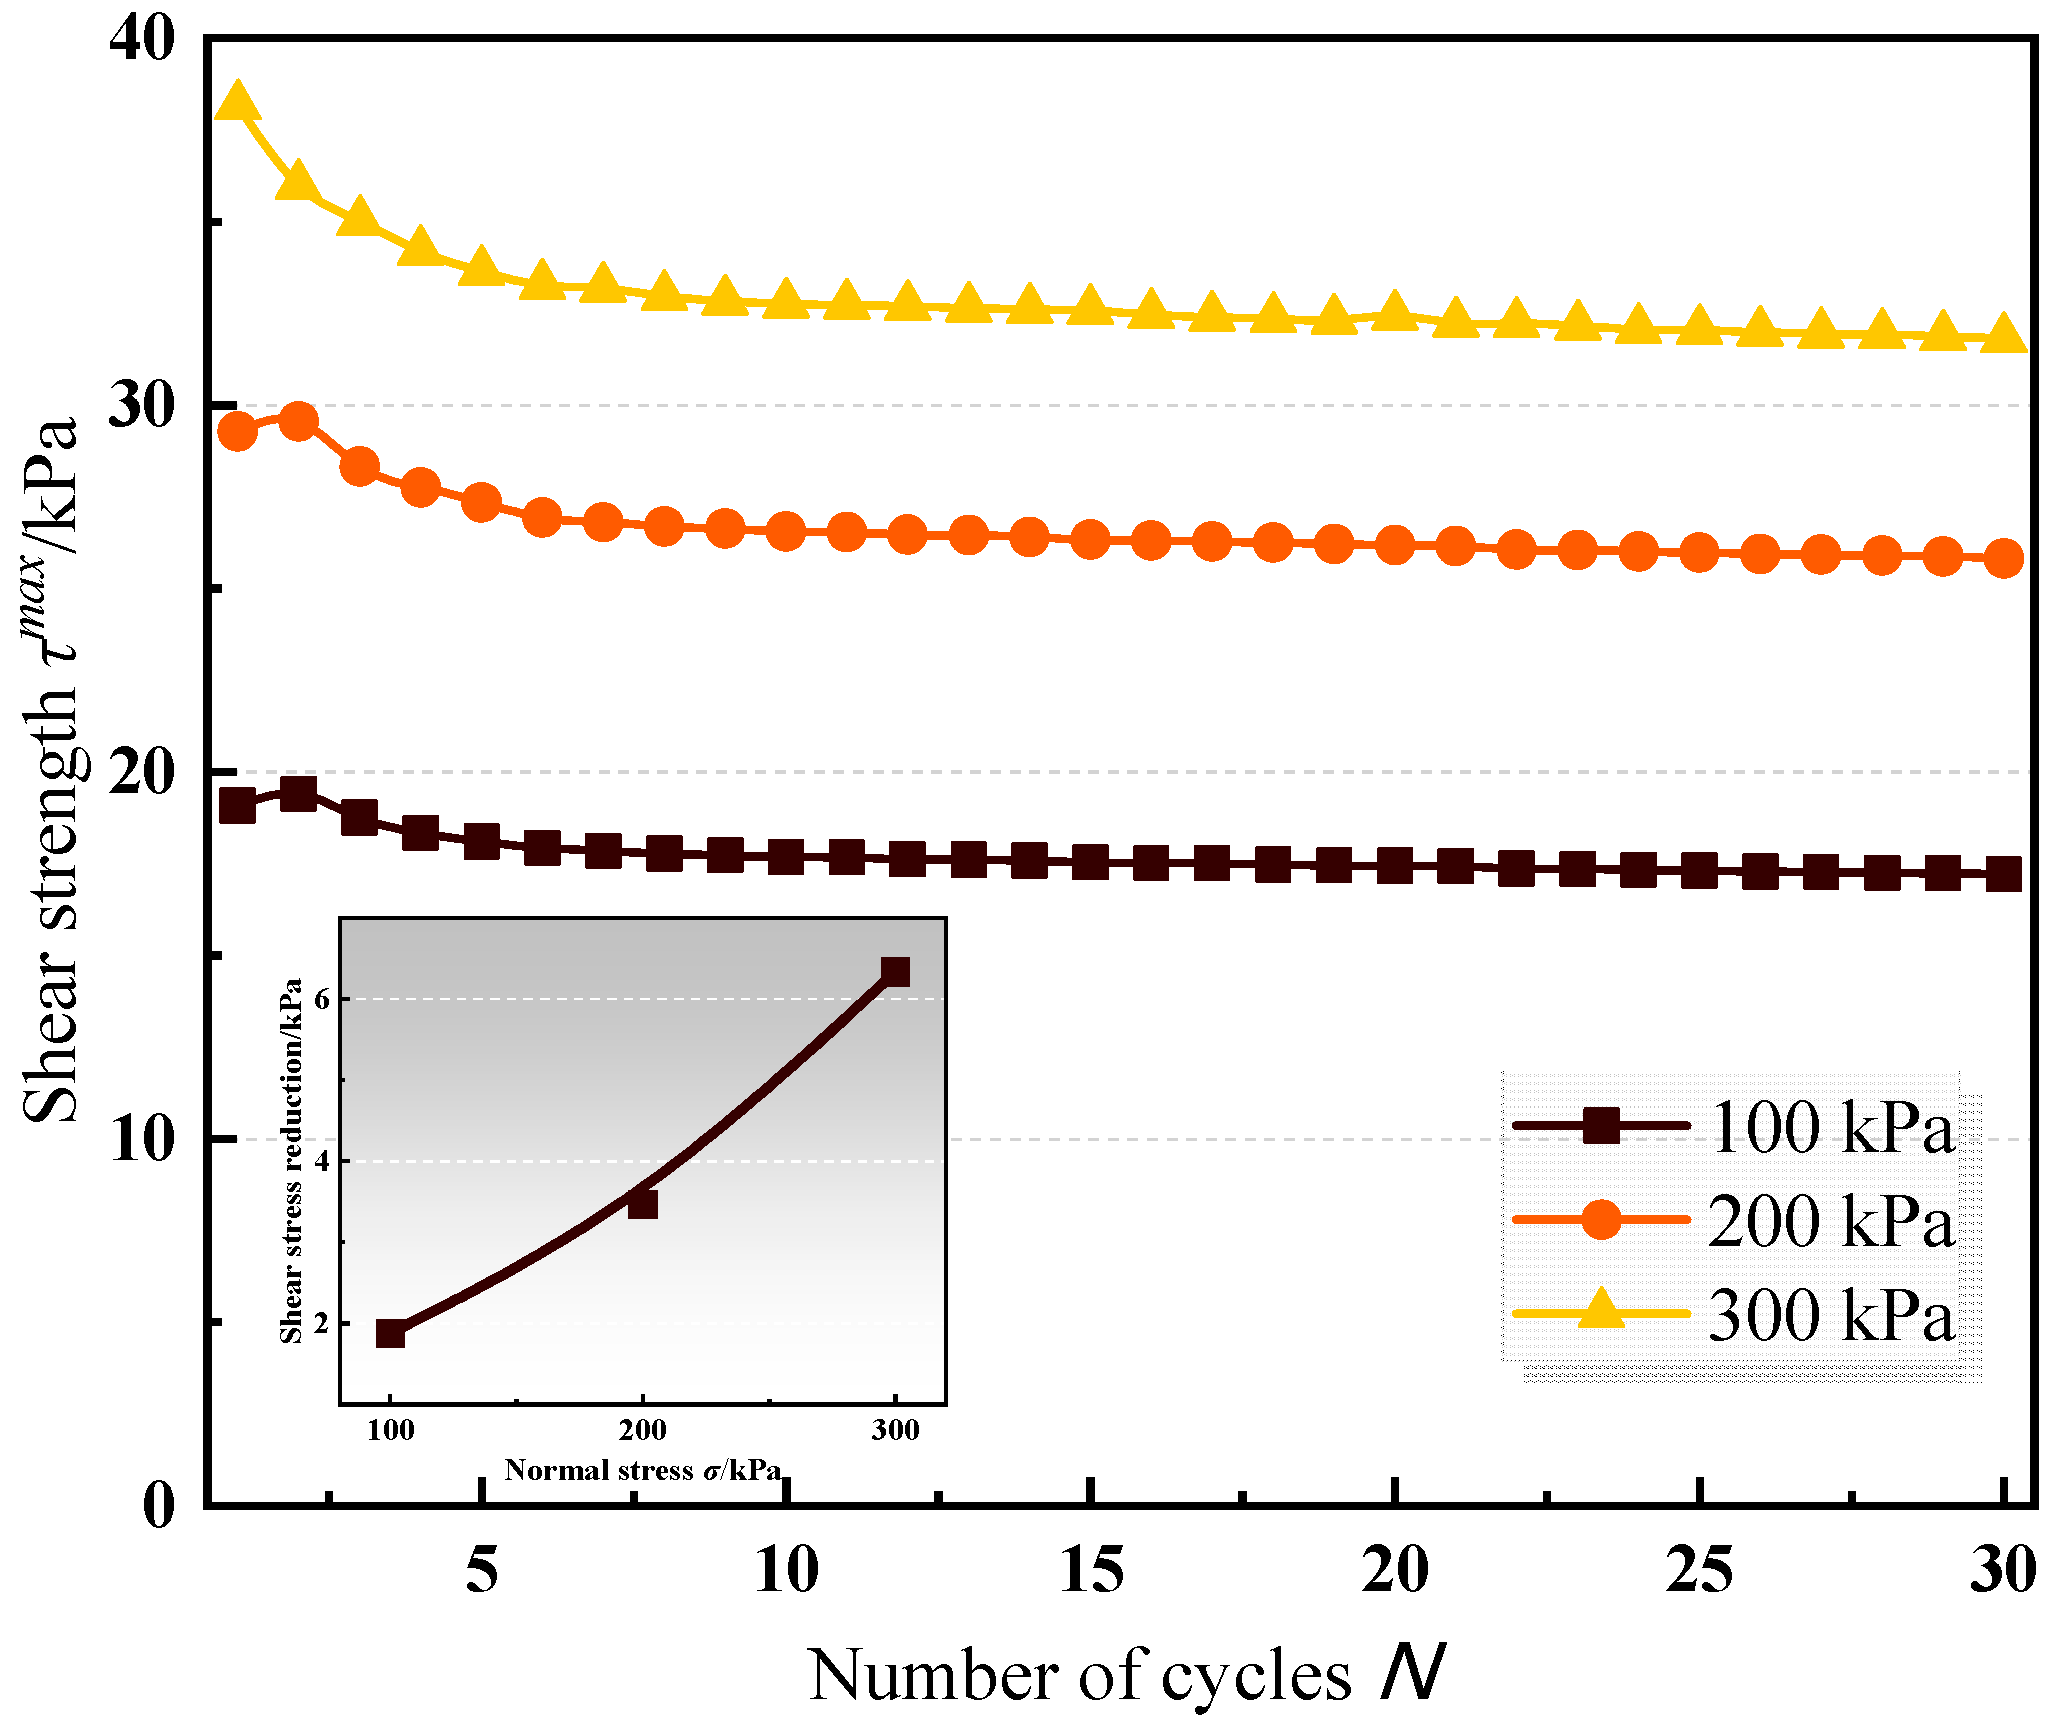
Figure 8 illustrates the shear strength-cycle number curve of test groups 1, 2, and 9 (where the normal stress levels were 100 kPa, 200 kPa, and 300 kPa, respectively). The test results showed that:
- (1)
The shear strength decreased with the increase in the number of cycles. At the beginning of shear, the soil particles occluded tightly under normal stress, and the cohesion between the steel soil interface was strong, resulting in the soil interface having a more remarkable ability to resist shear. With the increase in the shear cycle, the soil was compacted and the corners of the soil particles were rounded. After the first few shear cycles, the soil particles near the interface under the same repeated shear stress had a particular historical stress path, which led to the shear strength decreasing continuously and finally becoming stable.
- (2)
With the increase in normal stress, the shear strength and residual shear strength (the peak shear stress of the 30th cycle) also increased.
- (3)
The first two cycles showed hardening under the low-stress conditions of 100 kPa and 200 kPa. The results were inconsistent with the findings of Shang (2016), Li (2018), and others [
19,
20]. One possible reason could be attributed to the constant stress conditions used in the tests and the normal stress remaining unchanged during the whole test, resulting in a discontinuous reduction in normal stress under the low-stress conditions. Furthermore, combined with the direct test results, under the low-stress condition, the shear stress–shear displacement curve appeared to develop a hardening behavior, and so when the overall shear displacement was small (the first two cycles), the shear stress increased. The softening feature seemed to align with the rise in the overall shear displacement (after two cycles) [
12].
- (4)
Similar to the shear stress–shear displacement curve in the direct shear test, the peak shear stress–total shear displacement curve in the cyclic test could be used as the shear strength–cycle number curve. Three stages could be recognized, i.e., the elastic stage of the rapid change in shear stress (the first five cycles), the plastic stage of the slow evolution of the shear stress (5–10 cycles), and the shear failure stage of equilibrium of the shear stress (10–30 cycles).
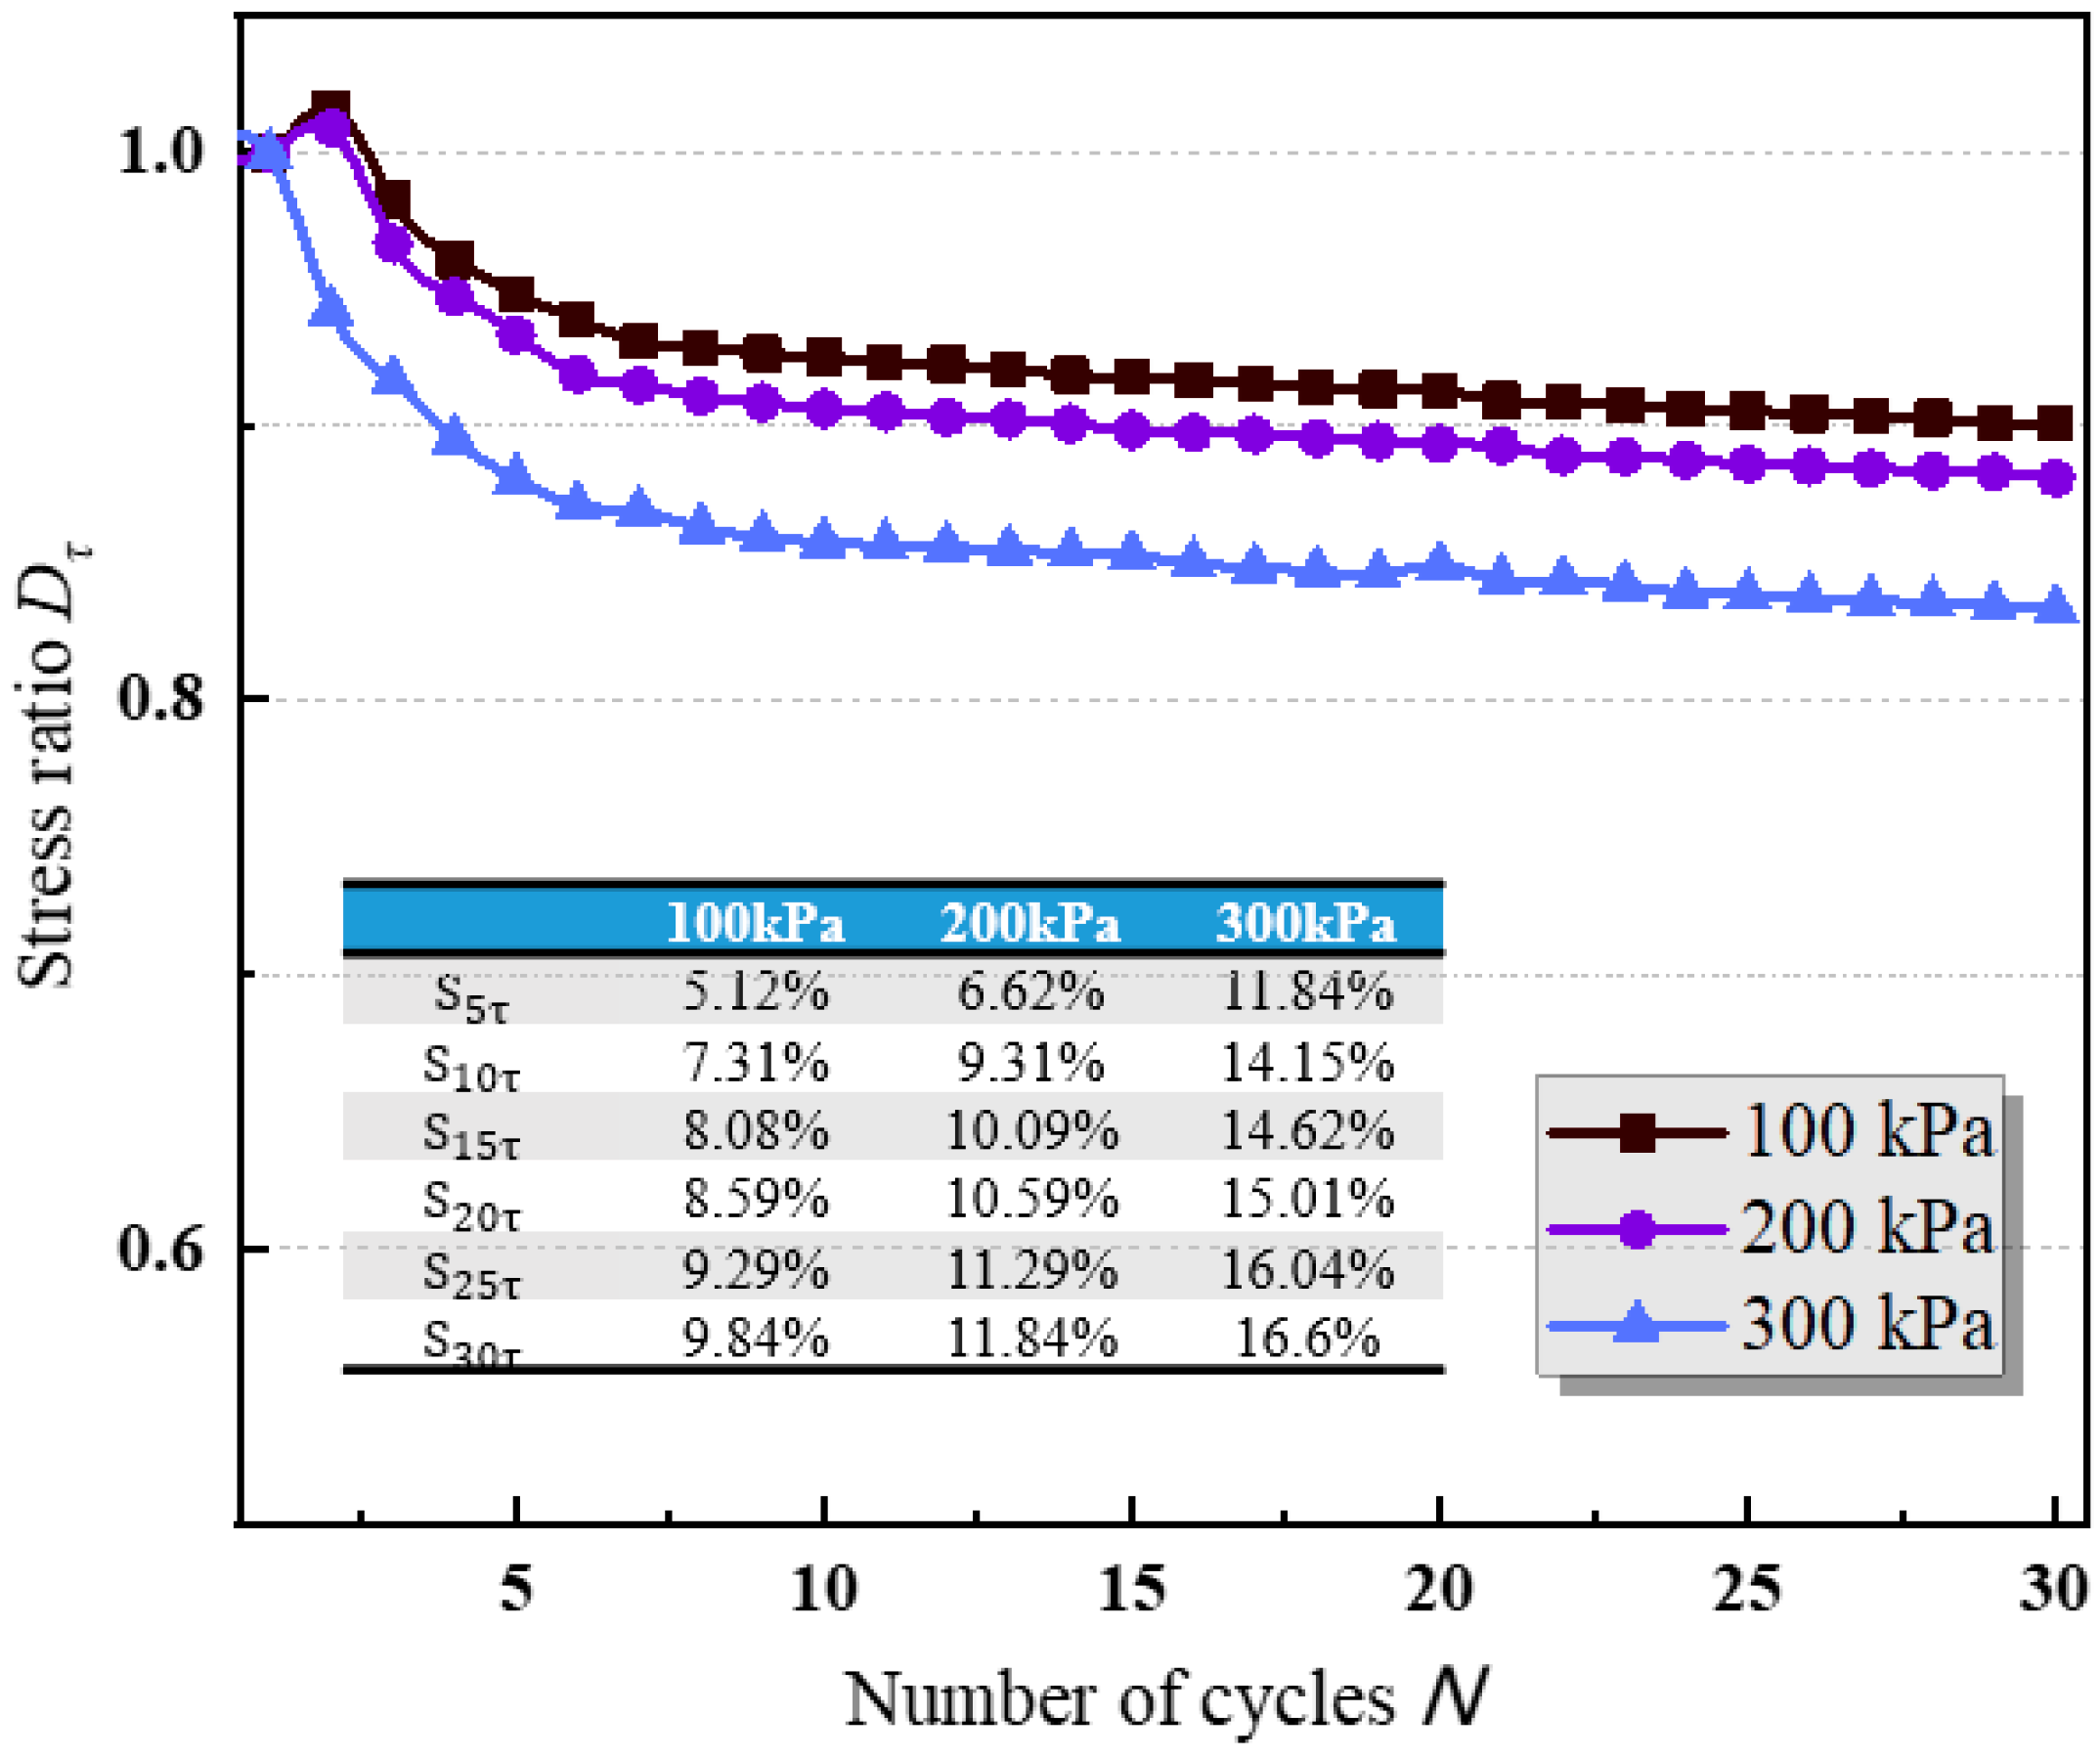
The stress ratio–cycle number curve in
Figure 9 shows that normal stress significantly impacted the interface cyclic weakening profile. With the increase in normal stress, the weakening degree increased. The trend agreed with those reported by Oumarou et al. (2005) and Feng et al. (2018) [
21,
22].
To more clearly capture the relationship between this weakening phenomenon and the number of cycles, the shear strength weakening coefficient
Snτ was further adopted based on the stress ratio
Dτ to characterize the cumulative weakening degree of the first n cycles. The representative weakening coefficients
S5τ,
S10τ,
S15τ,
S20τ,
S25τ, and
S30τ under the three normal stresses were calculated. The results are shown in
Figure 9. The maximum weakening coefficients
S30τ under the three normal stresses were 9.84%, 11.84%, and 16.6%, respectively.
3.1.2. The Influence of Shear Amplitude
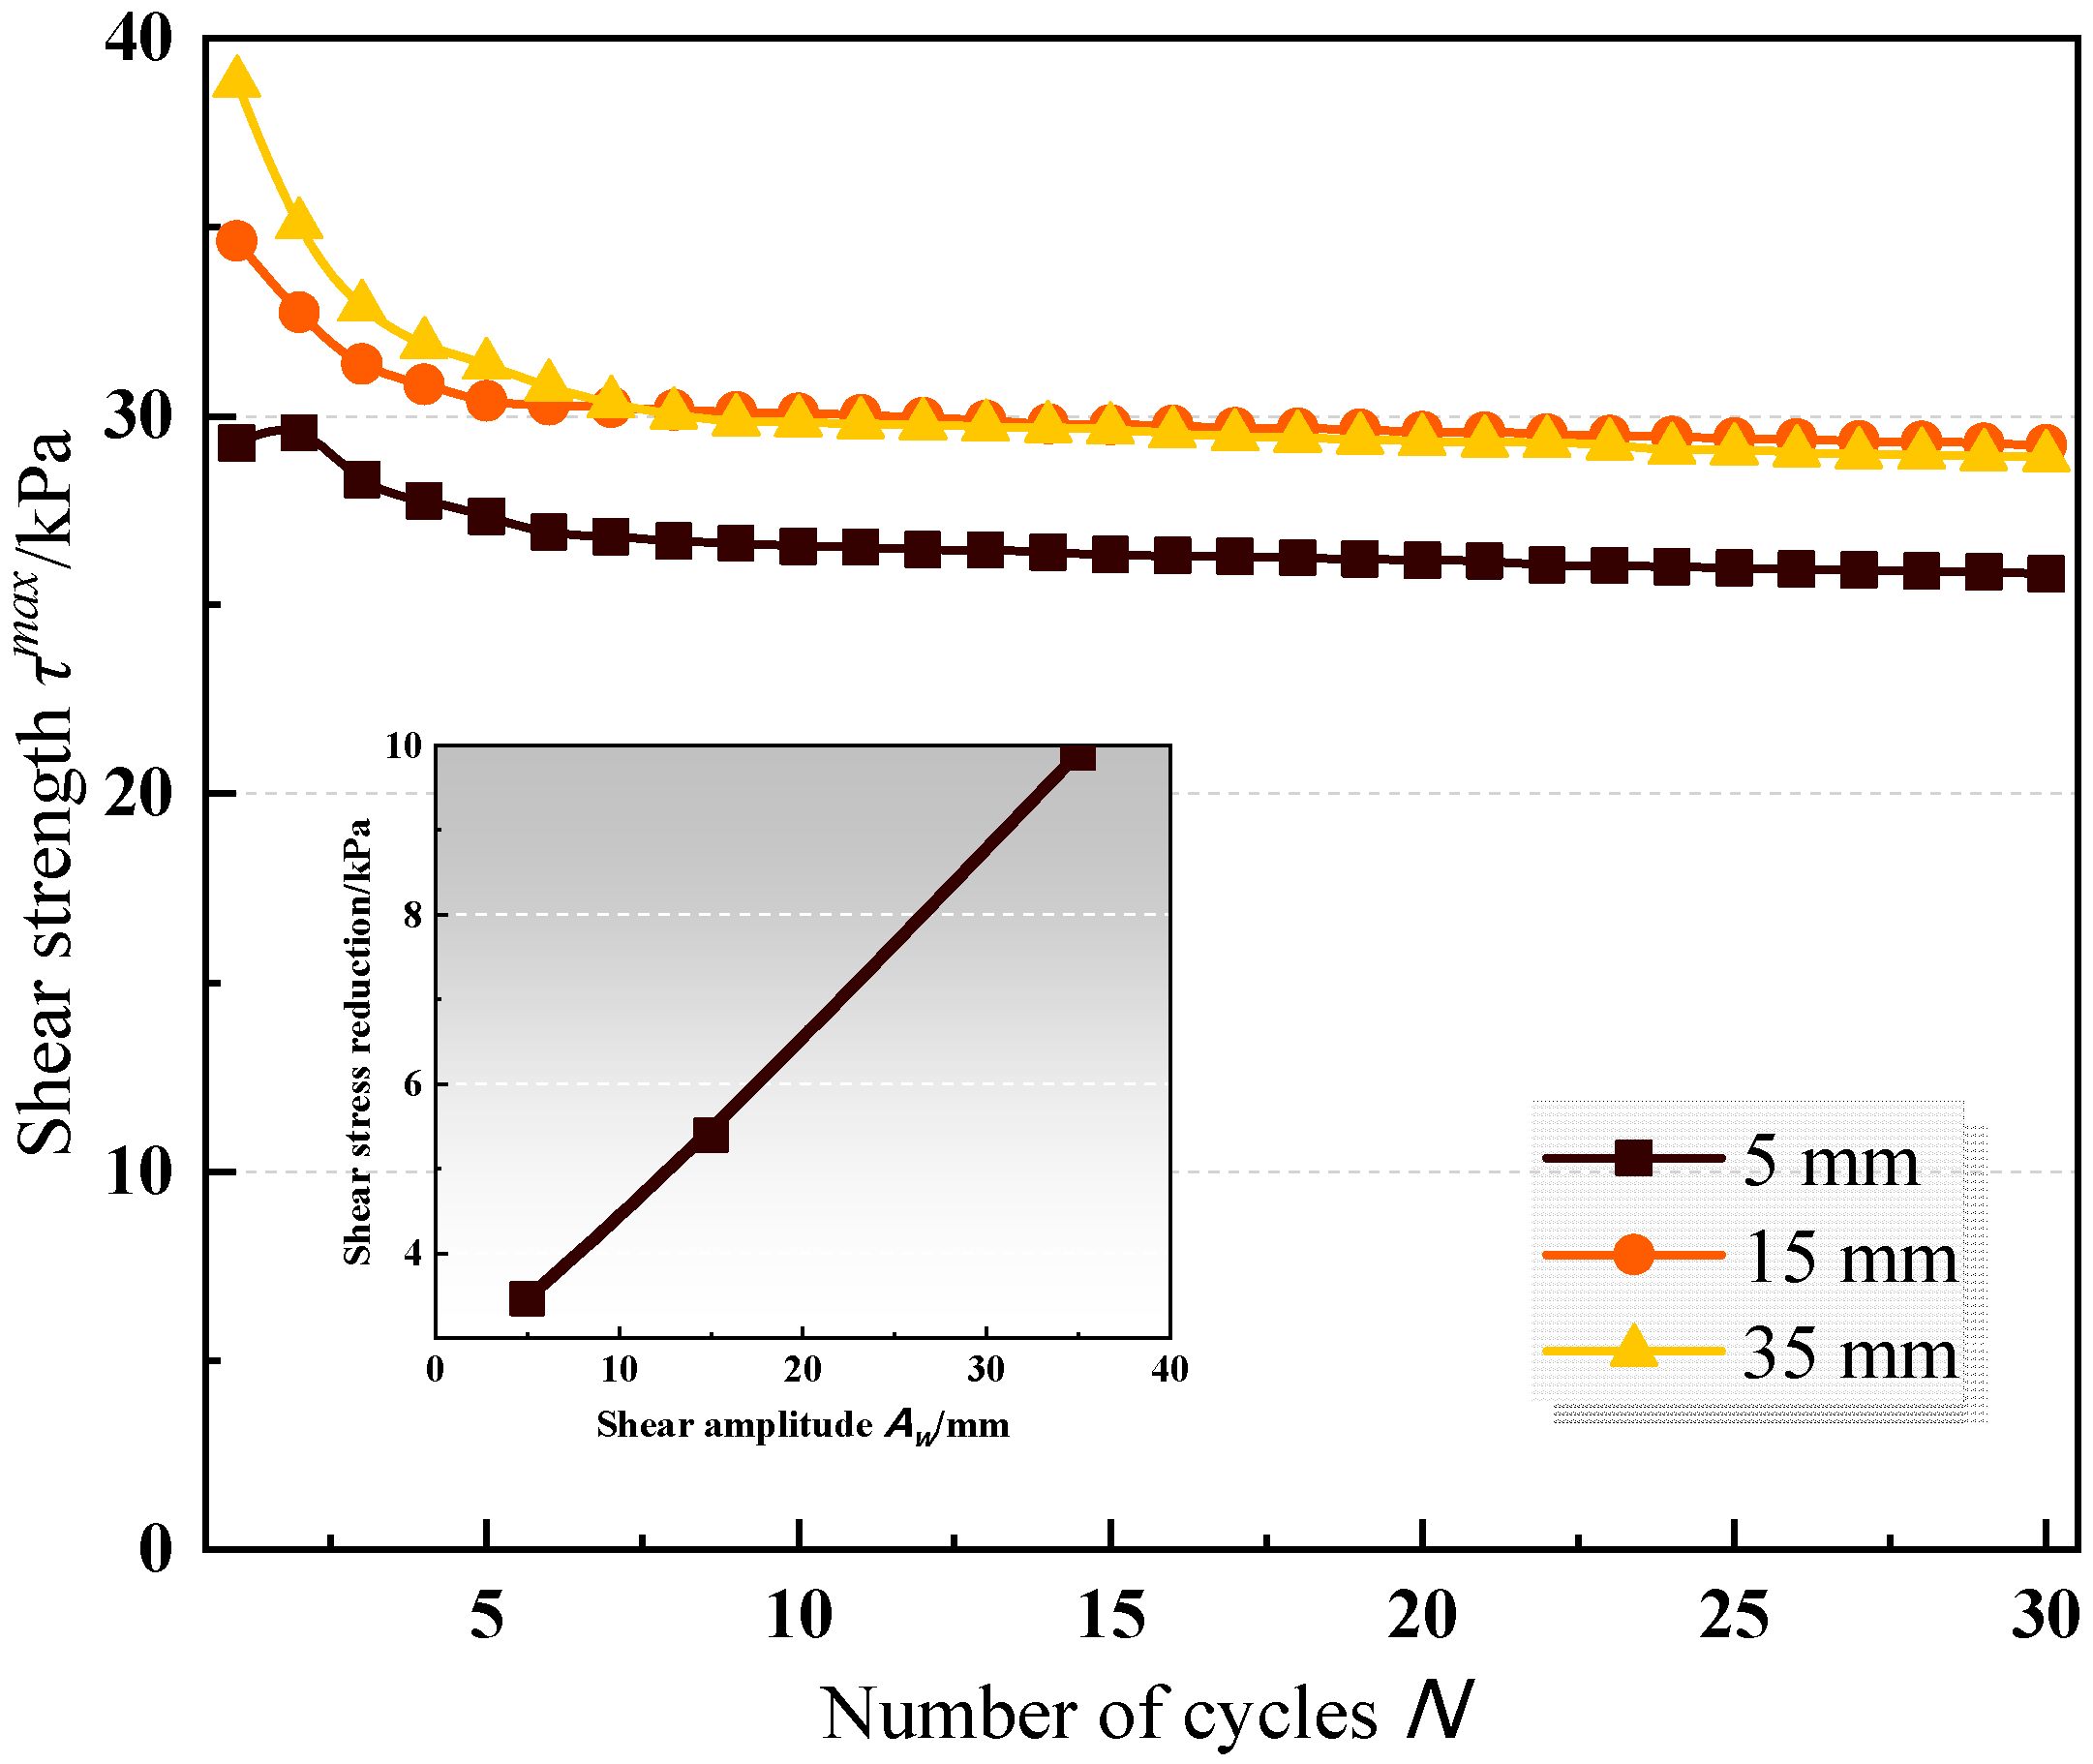
Figure 10 illustrates the shear strength–cycle number curve of test groups 2, 3, and 8 (where the shear amplitudes were 5 mm, 15 mm, and 35 mm, respectively). It was found from the test results that:
- (1)
With the increase in the shear amplitude, the peak and residual shear strength increased. However, with the increased shear amplitude, its increasing rate decreased and the residual shear strength was similar to those when the amplitude was 15 mm and 35 mm.
- (2)
The test group with a shear amplitude of 5 mm showed hardening in the first two cycles. With the increase in the number of cycles, the shear strength decreased. The results were similar to the findings of Vieira et al. (2013), indicating that the cyclic loading of the interface under a small displacement would not reduce the shear strength, while the cyclic shear strength decreased significantly under a large displacement [
23]. The explanation is the same as the previous one. In the case of large shear amplitude, the interface has reached the direct shear strength under the same conditions in the first few cycles (approximately 2–5), which affected the development of the subsequent cycle shear strength.
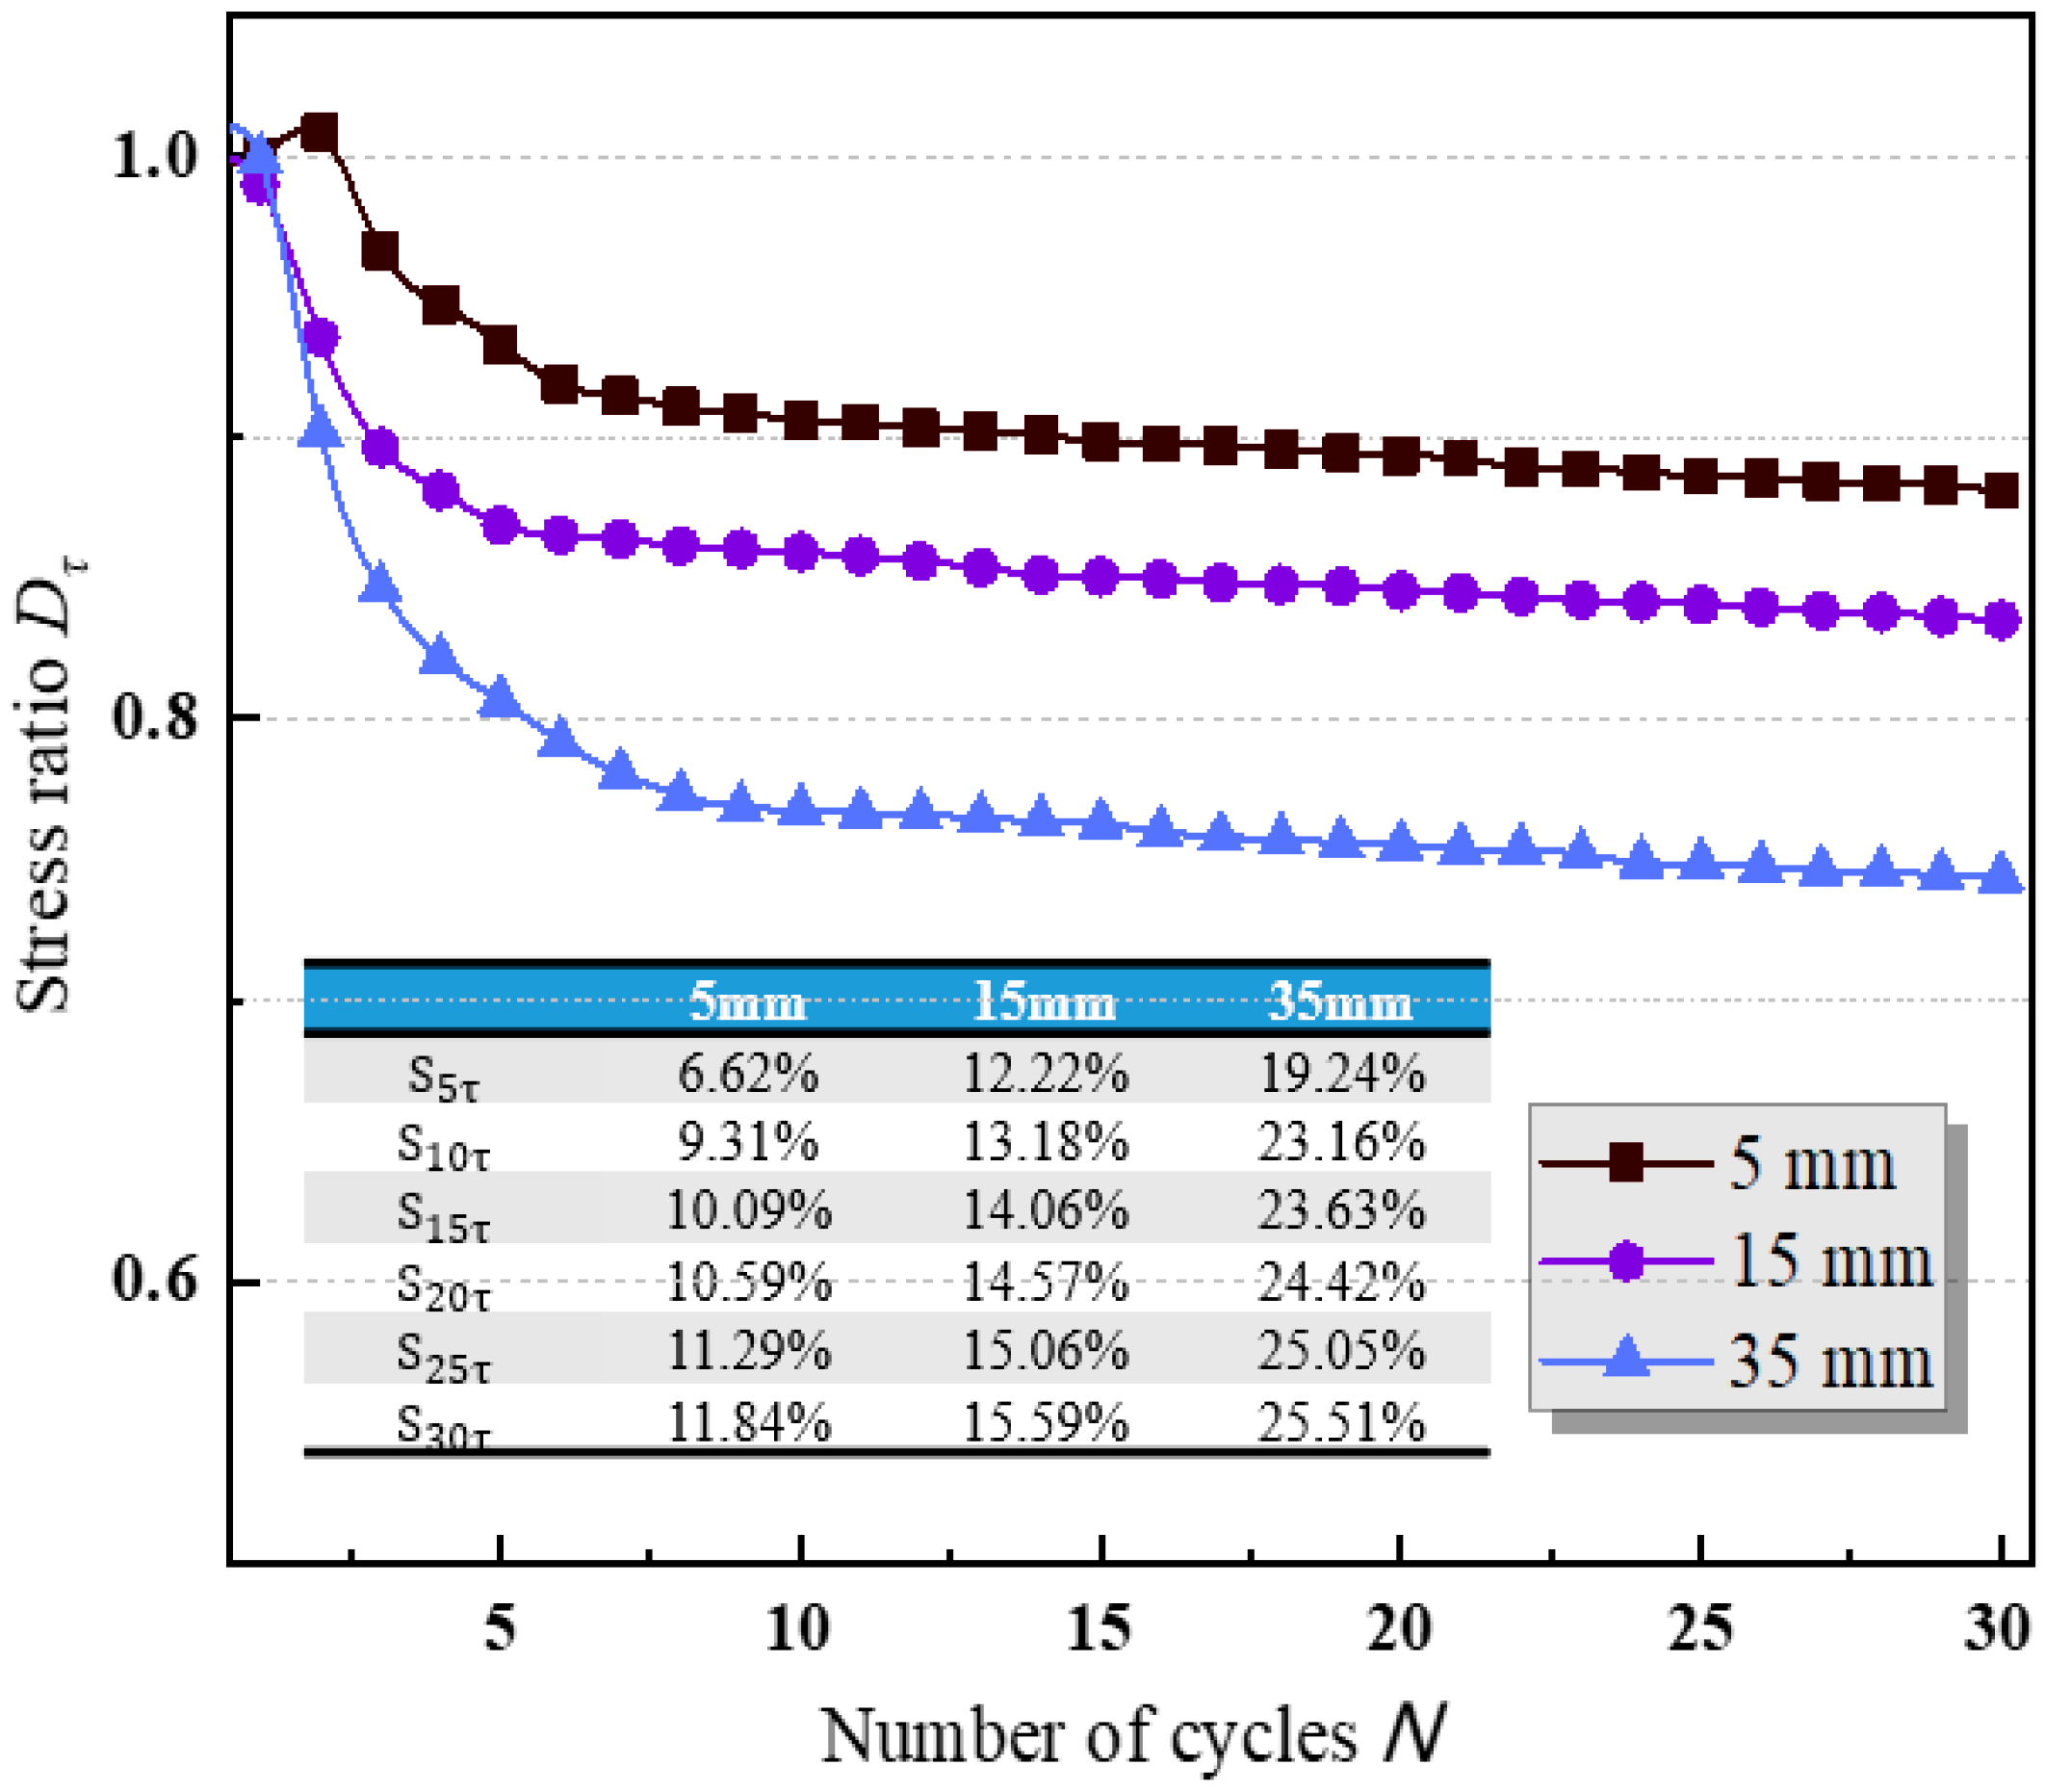
Similarly, the stress ratio–cycle number curve demonstrated in
Figure 11 implies that the shear strength decreased significantly with the increase in the shear amplitude corresponding to the shear displacement. Liu et al. (2021) reached the same conclusion [
24]. To explain this phenomenon, the total shear displacement was the product of the shear amplitude and the number of cycles. With the amplitude increase, the number of cycles required for achieving shear failure decreased, and the total shear displacement increased under the same number of cycles. Therefore, the weakening degree became intense until it reached equilibrium. The representative weakening coefficient
Snτ under the three shear amplitudes was calculated, as shown in
Figure 11. The maximum weakening coefficients
S30τ under the three shear amplitudes were 11.84%, 15.59%, and 25.51%, respectively.
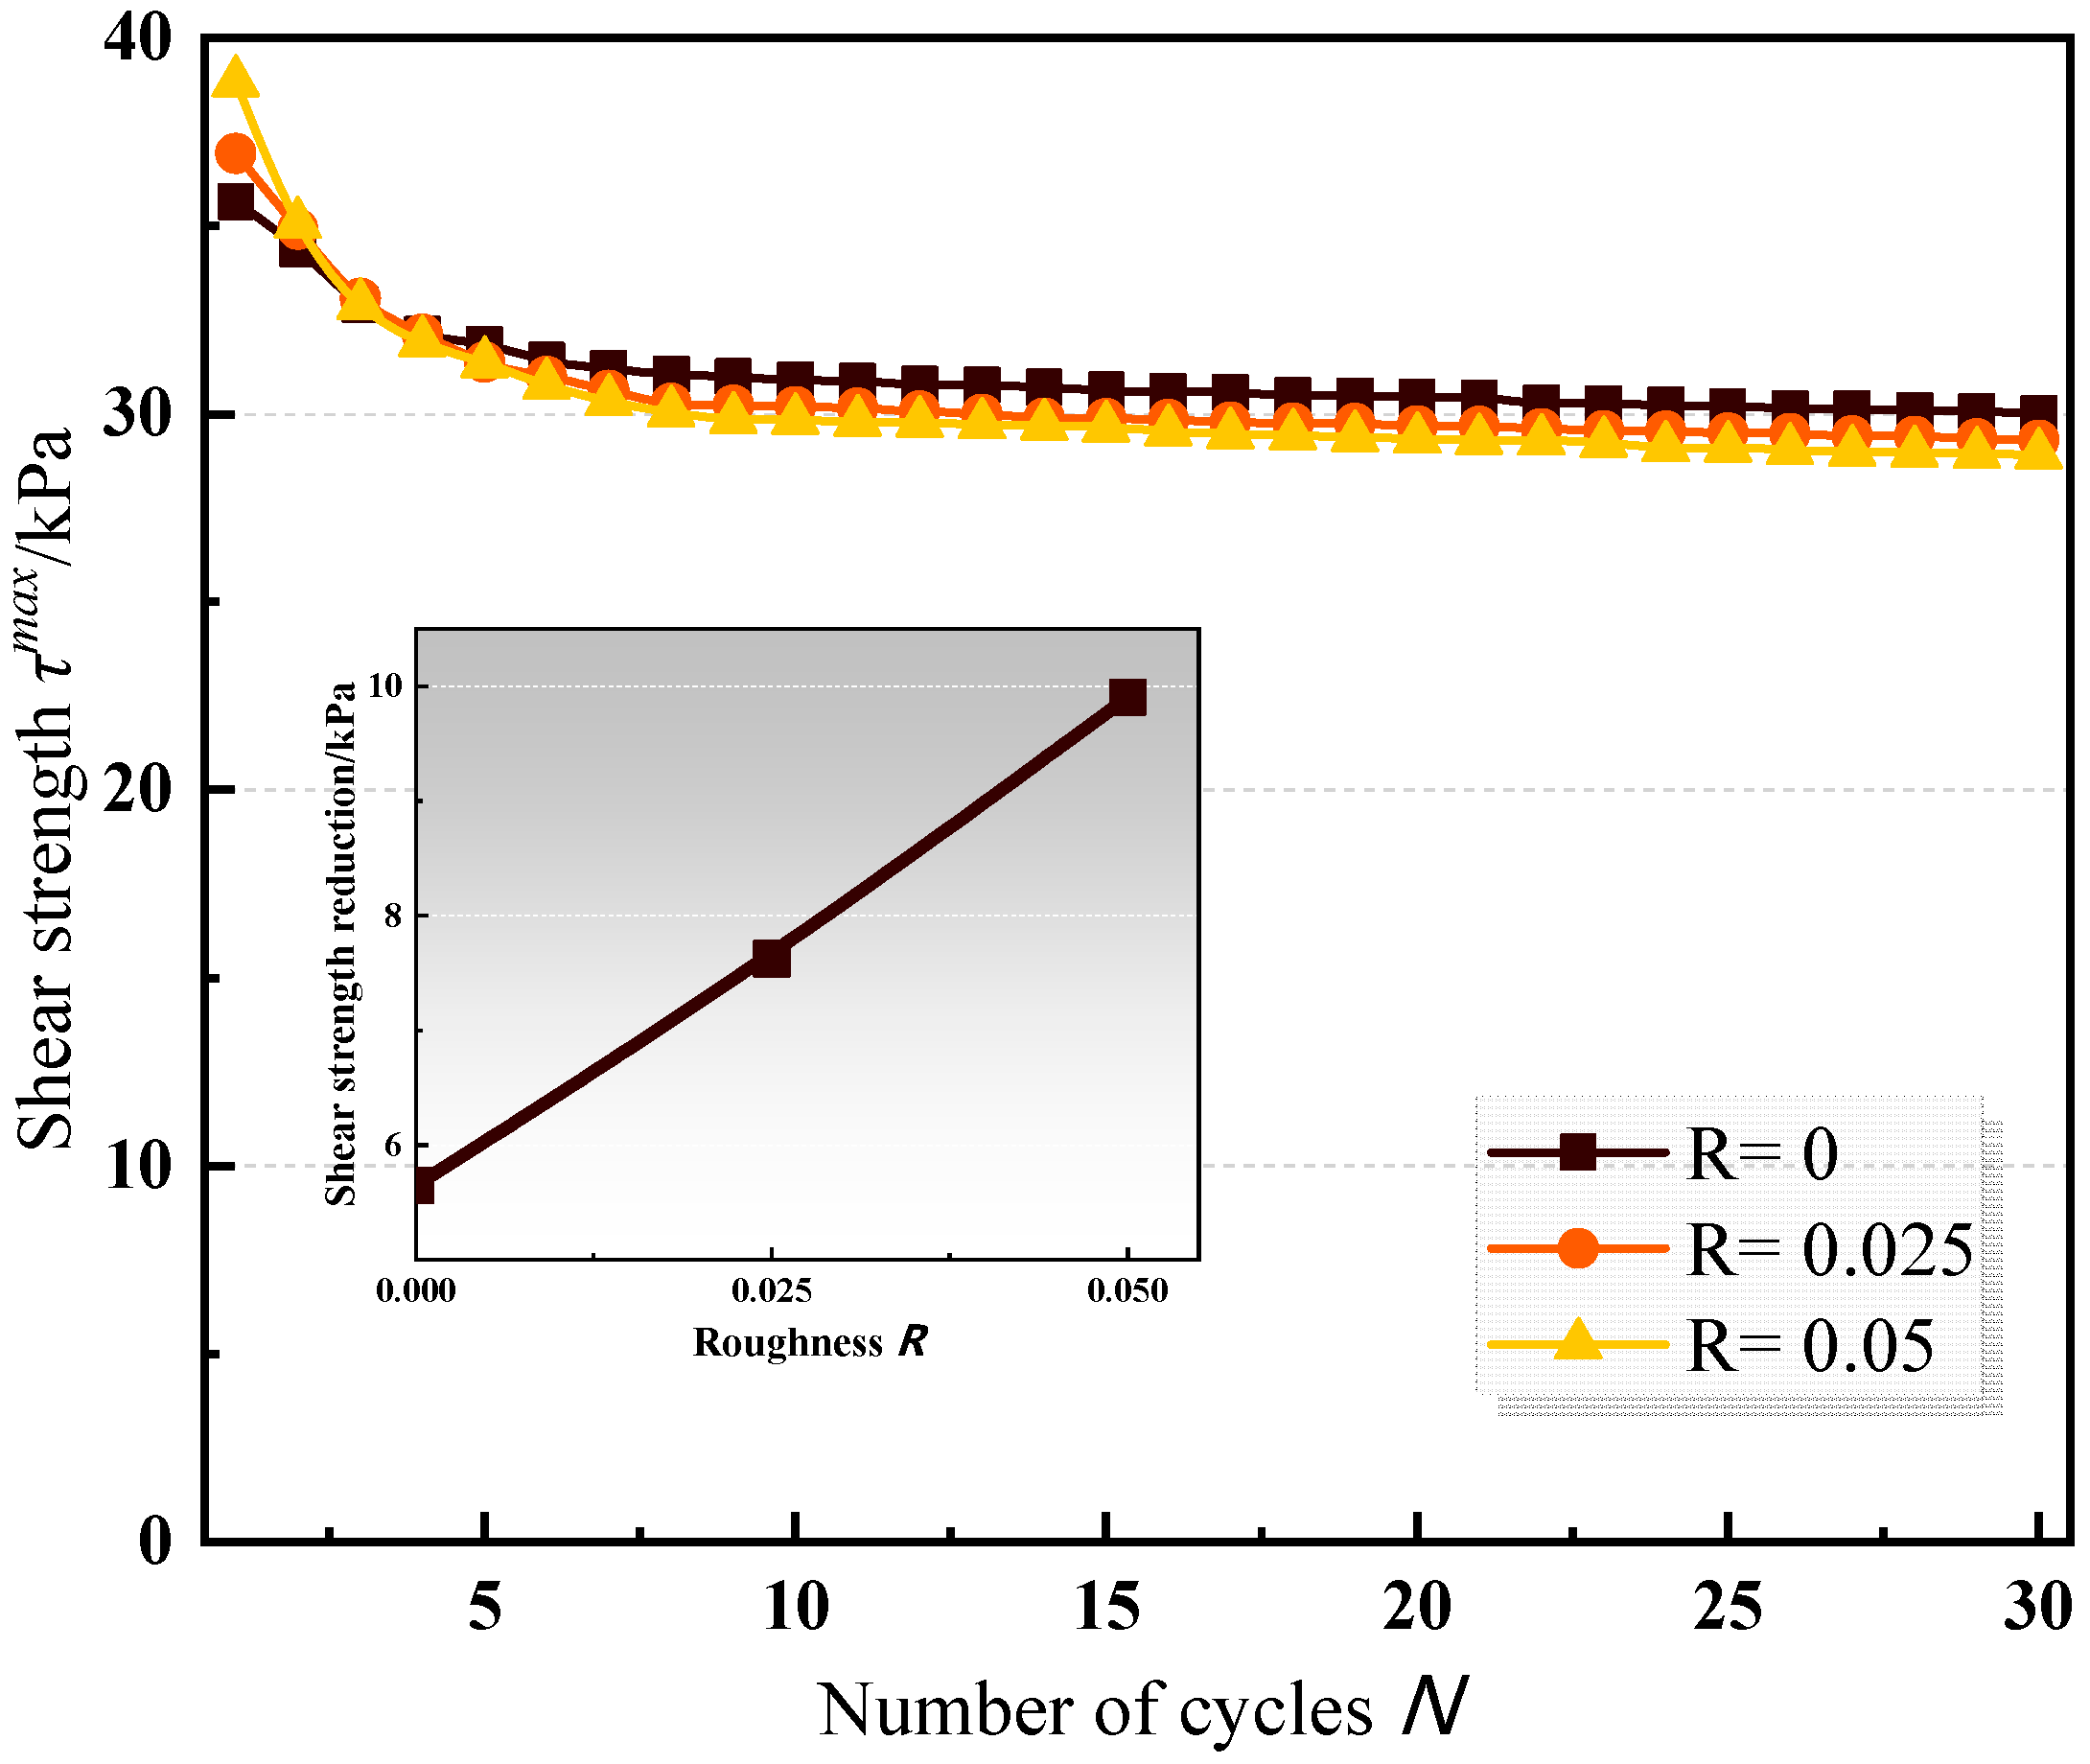
3.1.3. The Influence of Roughness
Figure 12 illustrates the shear strength–cycle number curve of test groups 4, 5, and 8 (where the roughness
R was 0 mm, 0.025 mm, 0.05 mm, respectively). The test results show that:
- (1)
With the roughness increase, the shear strength of the first cycle increased, but the difference was insignificant. Referring to the conclusion of the direct test, the influence of roughness on shear stress decreased under a larger normal stress, which could reasonably explain the above phenomenon [
12].
- (2)
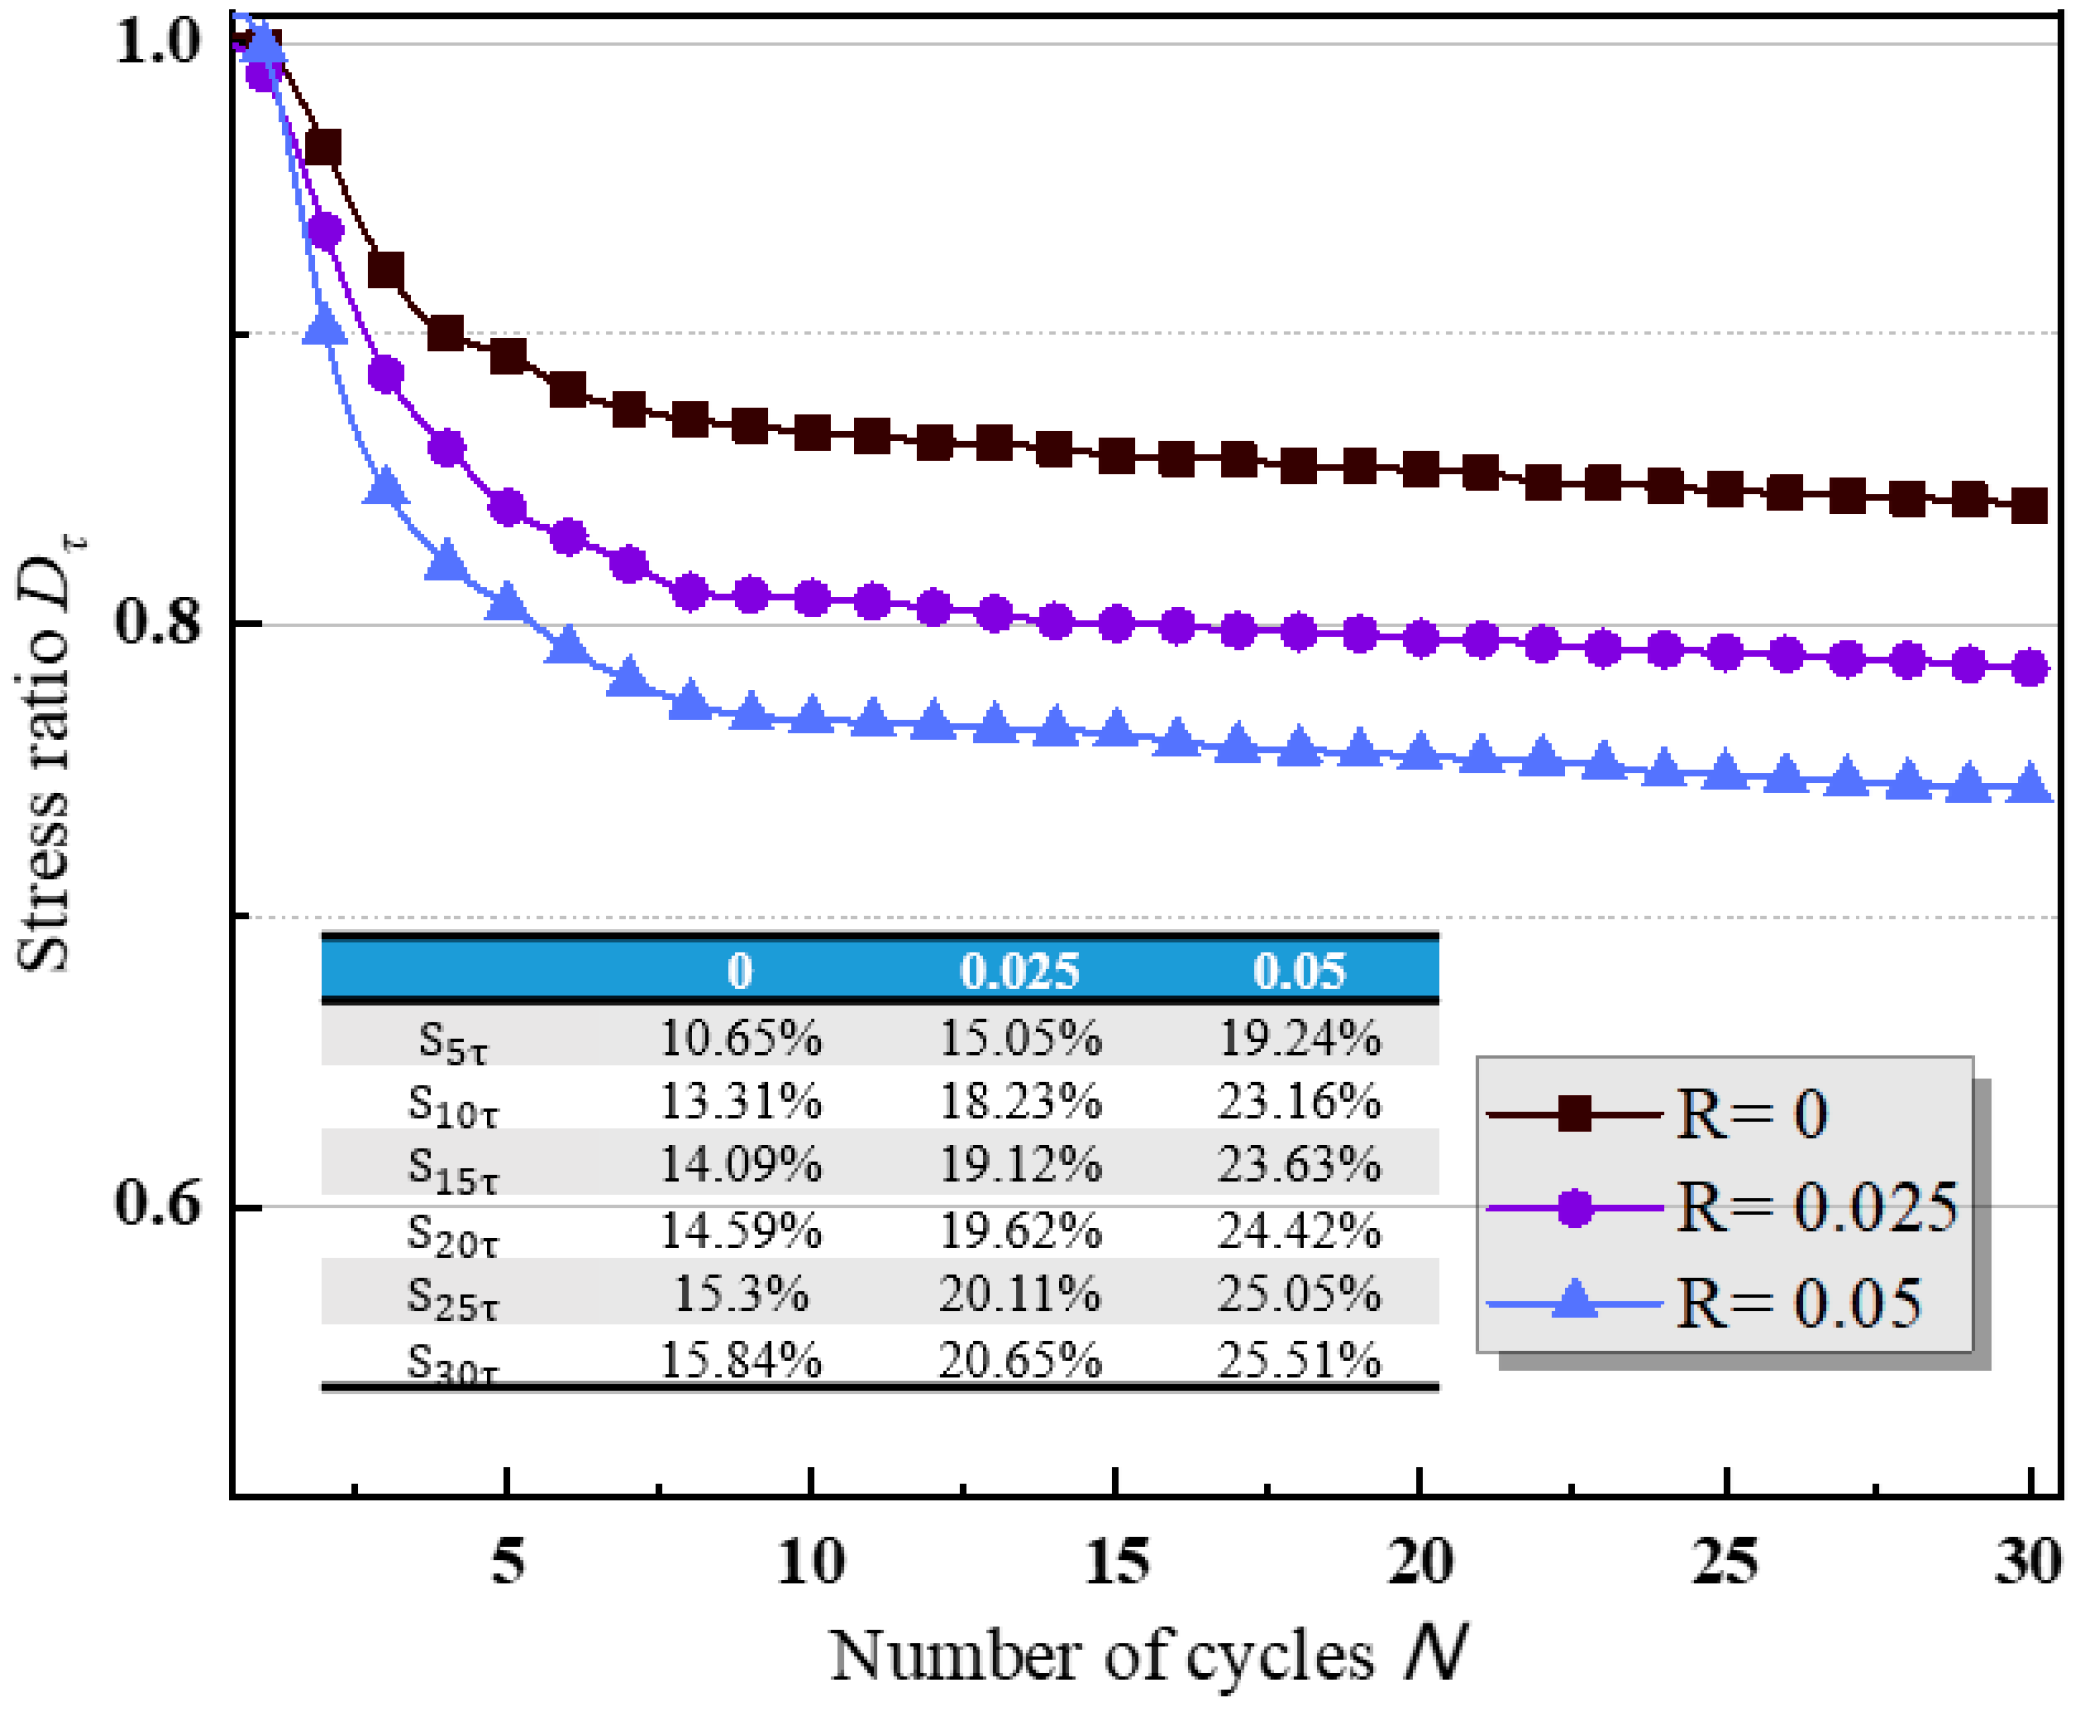
Smaller roughness levels reached the shear failure stage earlier, but the residual shear strength decreased with the roughness increase. The stress ratio–cycle number curve presented in
Figure 12 demonstrates that the weakening of the shear strength became apparent with the increase in roughness. Taha and Fall (2014) drew a similar conclusion for their cyclic shear test on steel marine clay [
25]. With the roughness increase, the dislocation and rearrangement process of the soil particles near the interface became intense. With the progressive number of cycles, the strength degradation became more significant.
The representative weakening coefficients
Snτ under the three shear amplitudes were calculated, as shown in
Figure 13. The maximum weakening coefficients
S30τ under the three roughness conditions were 15.84%, 20.65%, and 25.51%, respectively, which verified the above conclusions.
3.1.4. The Influence of Water Content
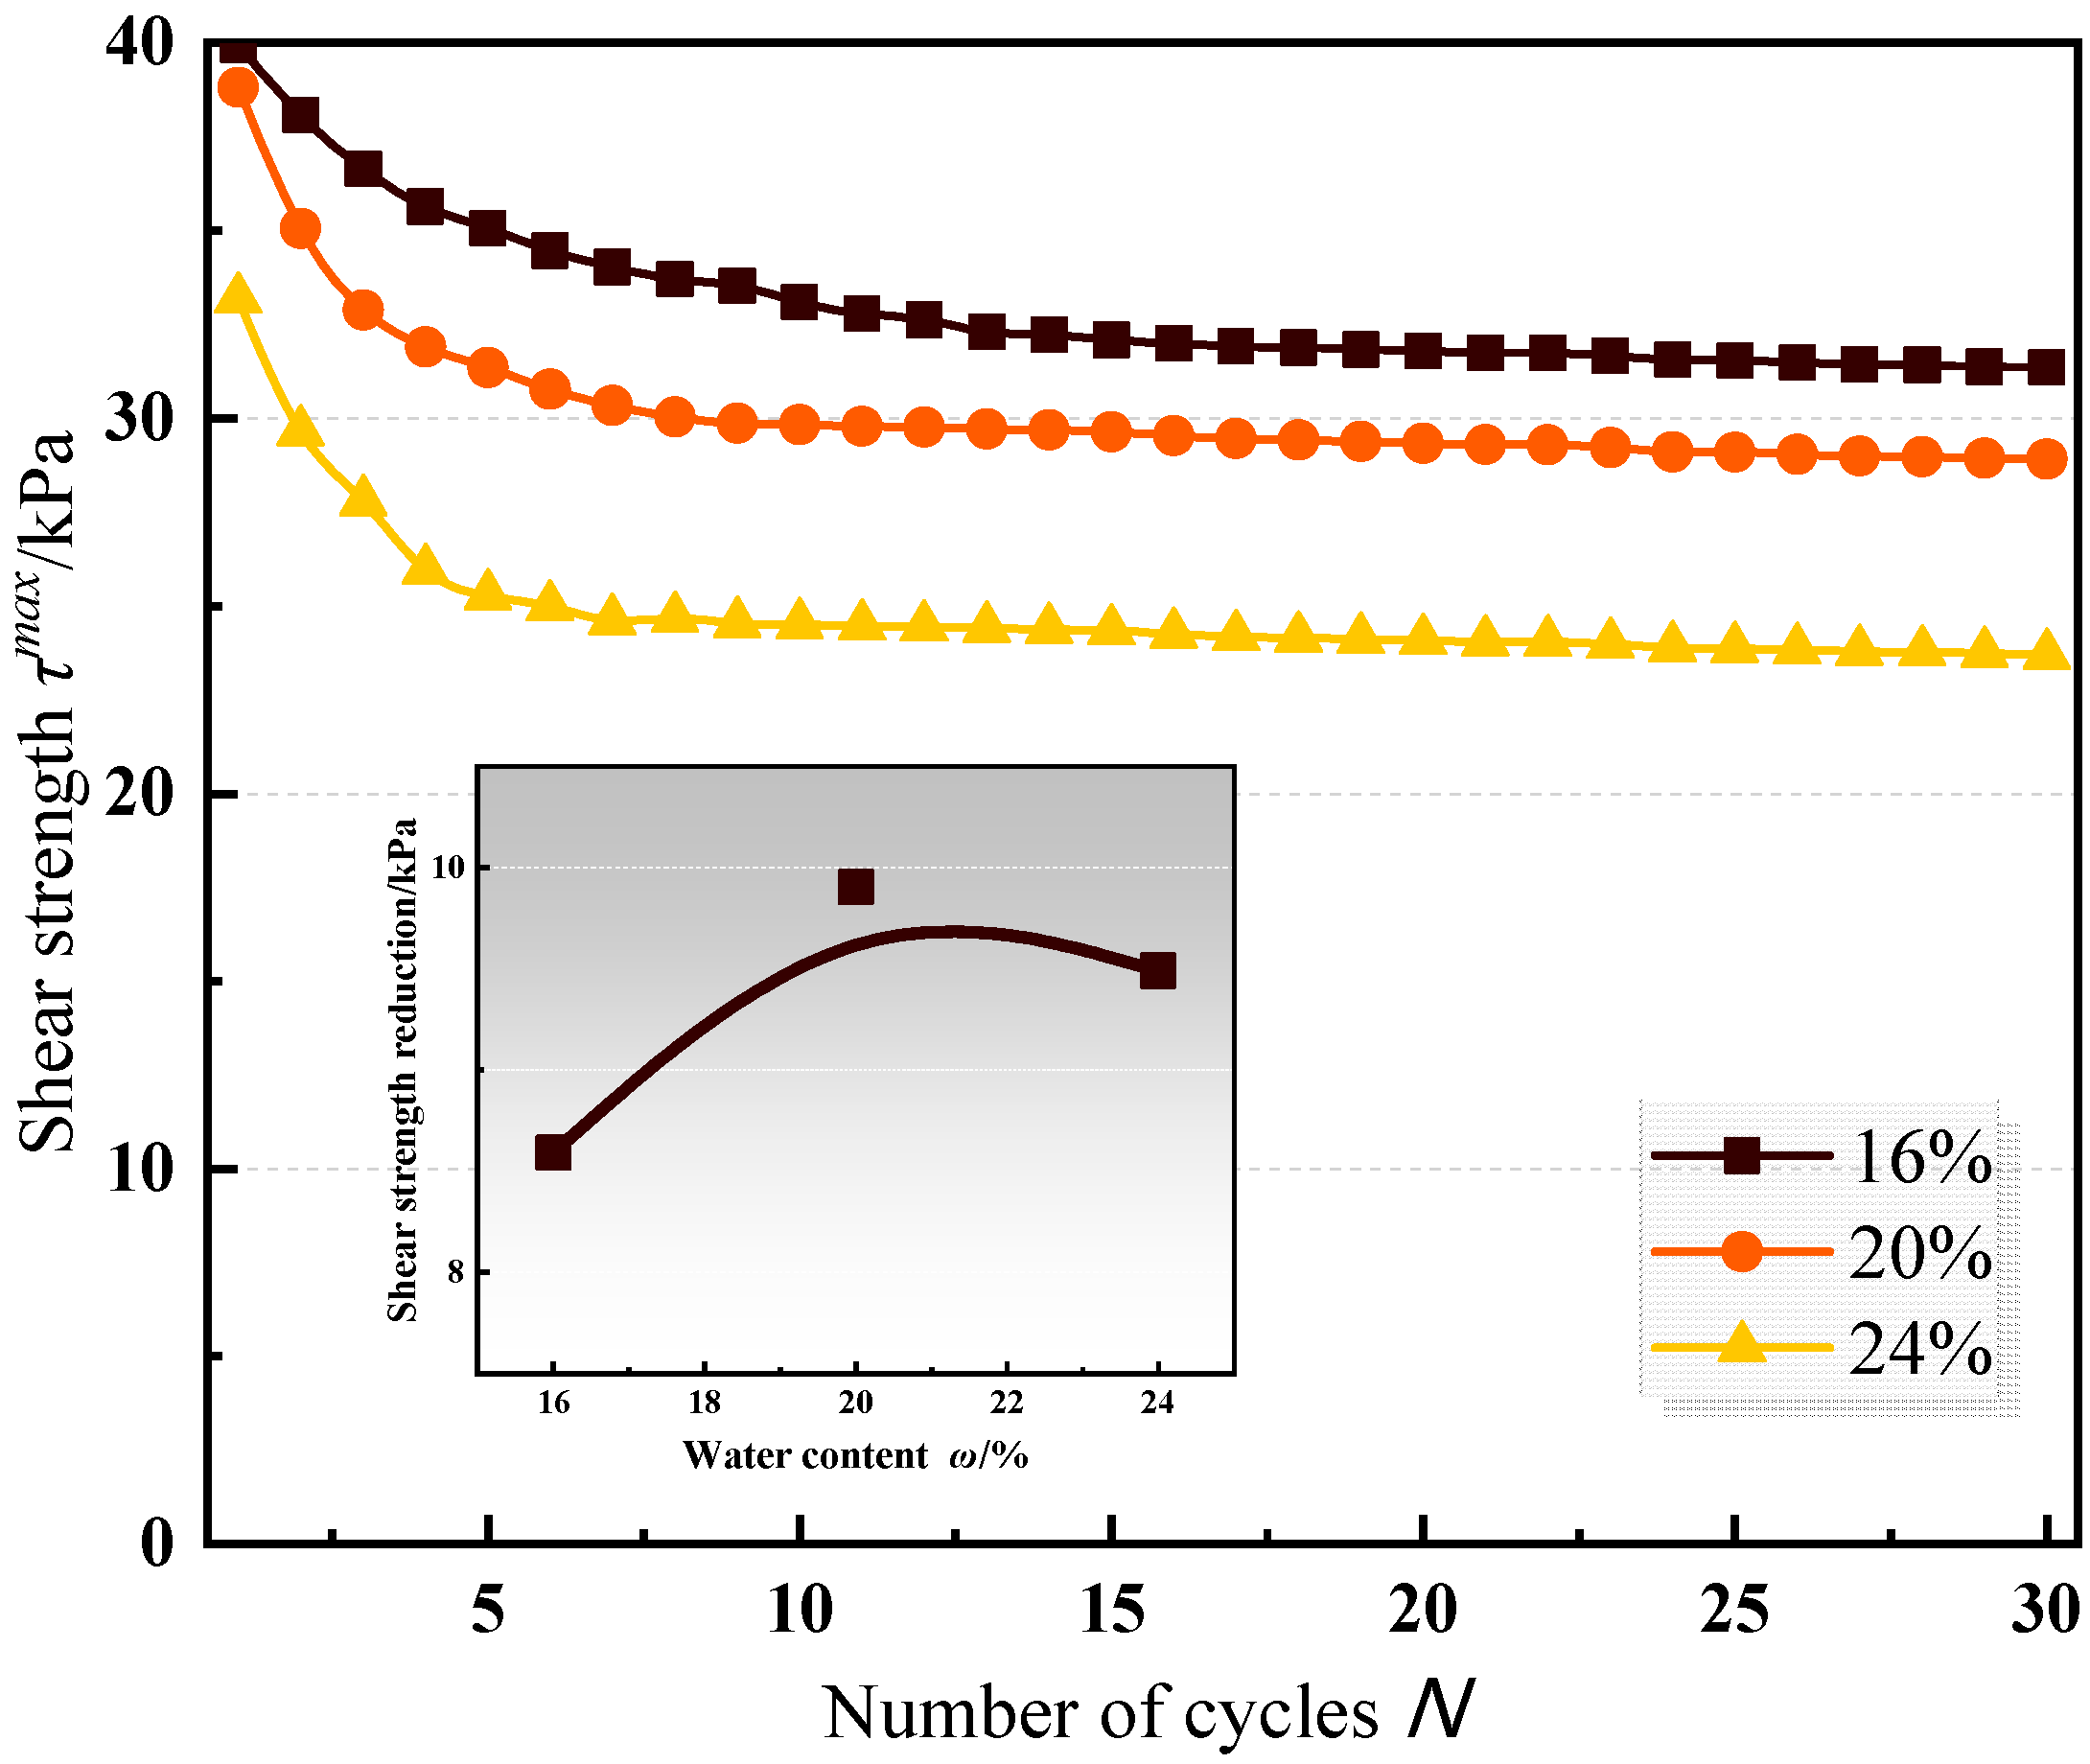
Figure 14 illustrates the shear strength–cycle number curve of test groups 6, 7, and 8 (where the water contents were 16%, 24%, and 20%, respectively). The results suggested that shear strength increased with the decrease in water content. However, the difference between the test results for the 16% and 20% water content levels was smaller than those of 20% and 24%. The shear behavior in the positive direction of the first cycle of the cyclic test was equivalent to that of the direct shear test. According to the conclusion of the direct shear test, the distinction mentioned above was induced by the optimal water content (19.6%) [
12]. With the increase in water content, the cohesion first increased and then decreased. The cohesion peak occurred when the water content reached the plastic limit or when the optimal water content was used.
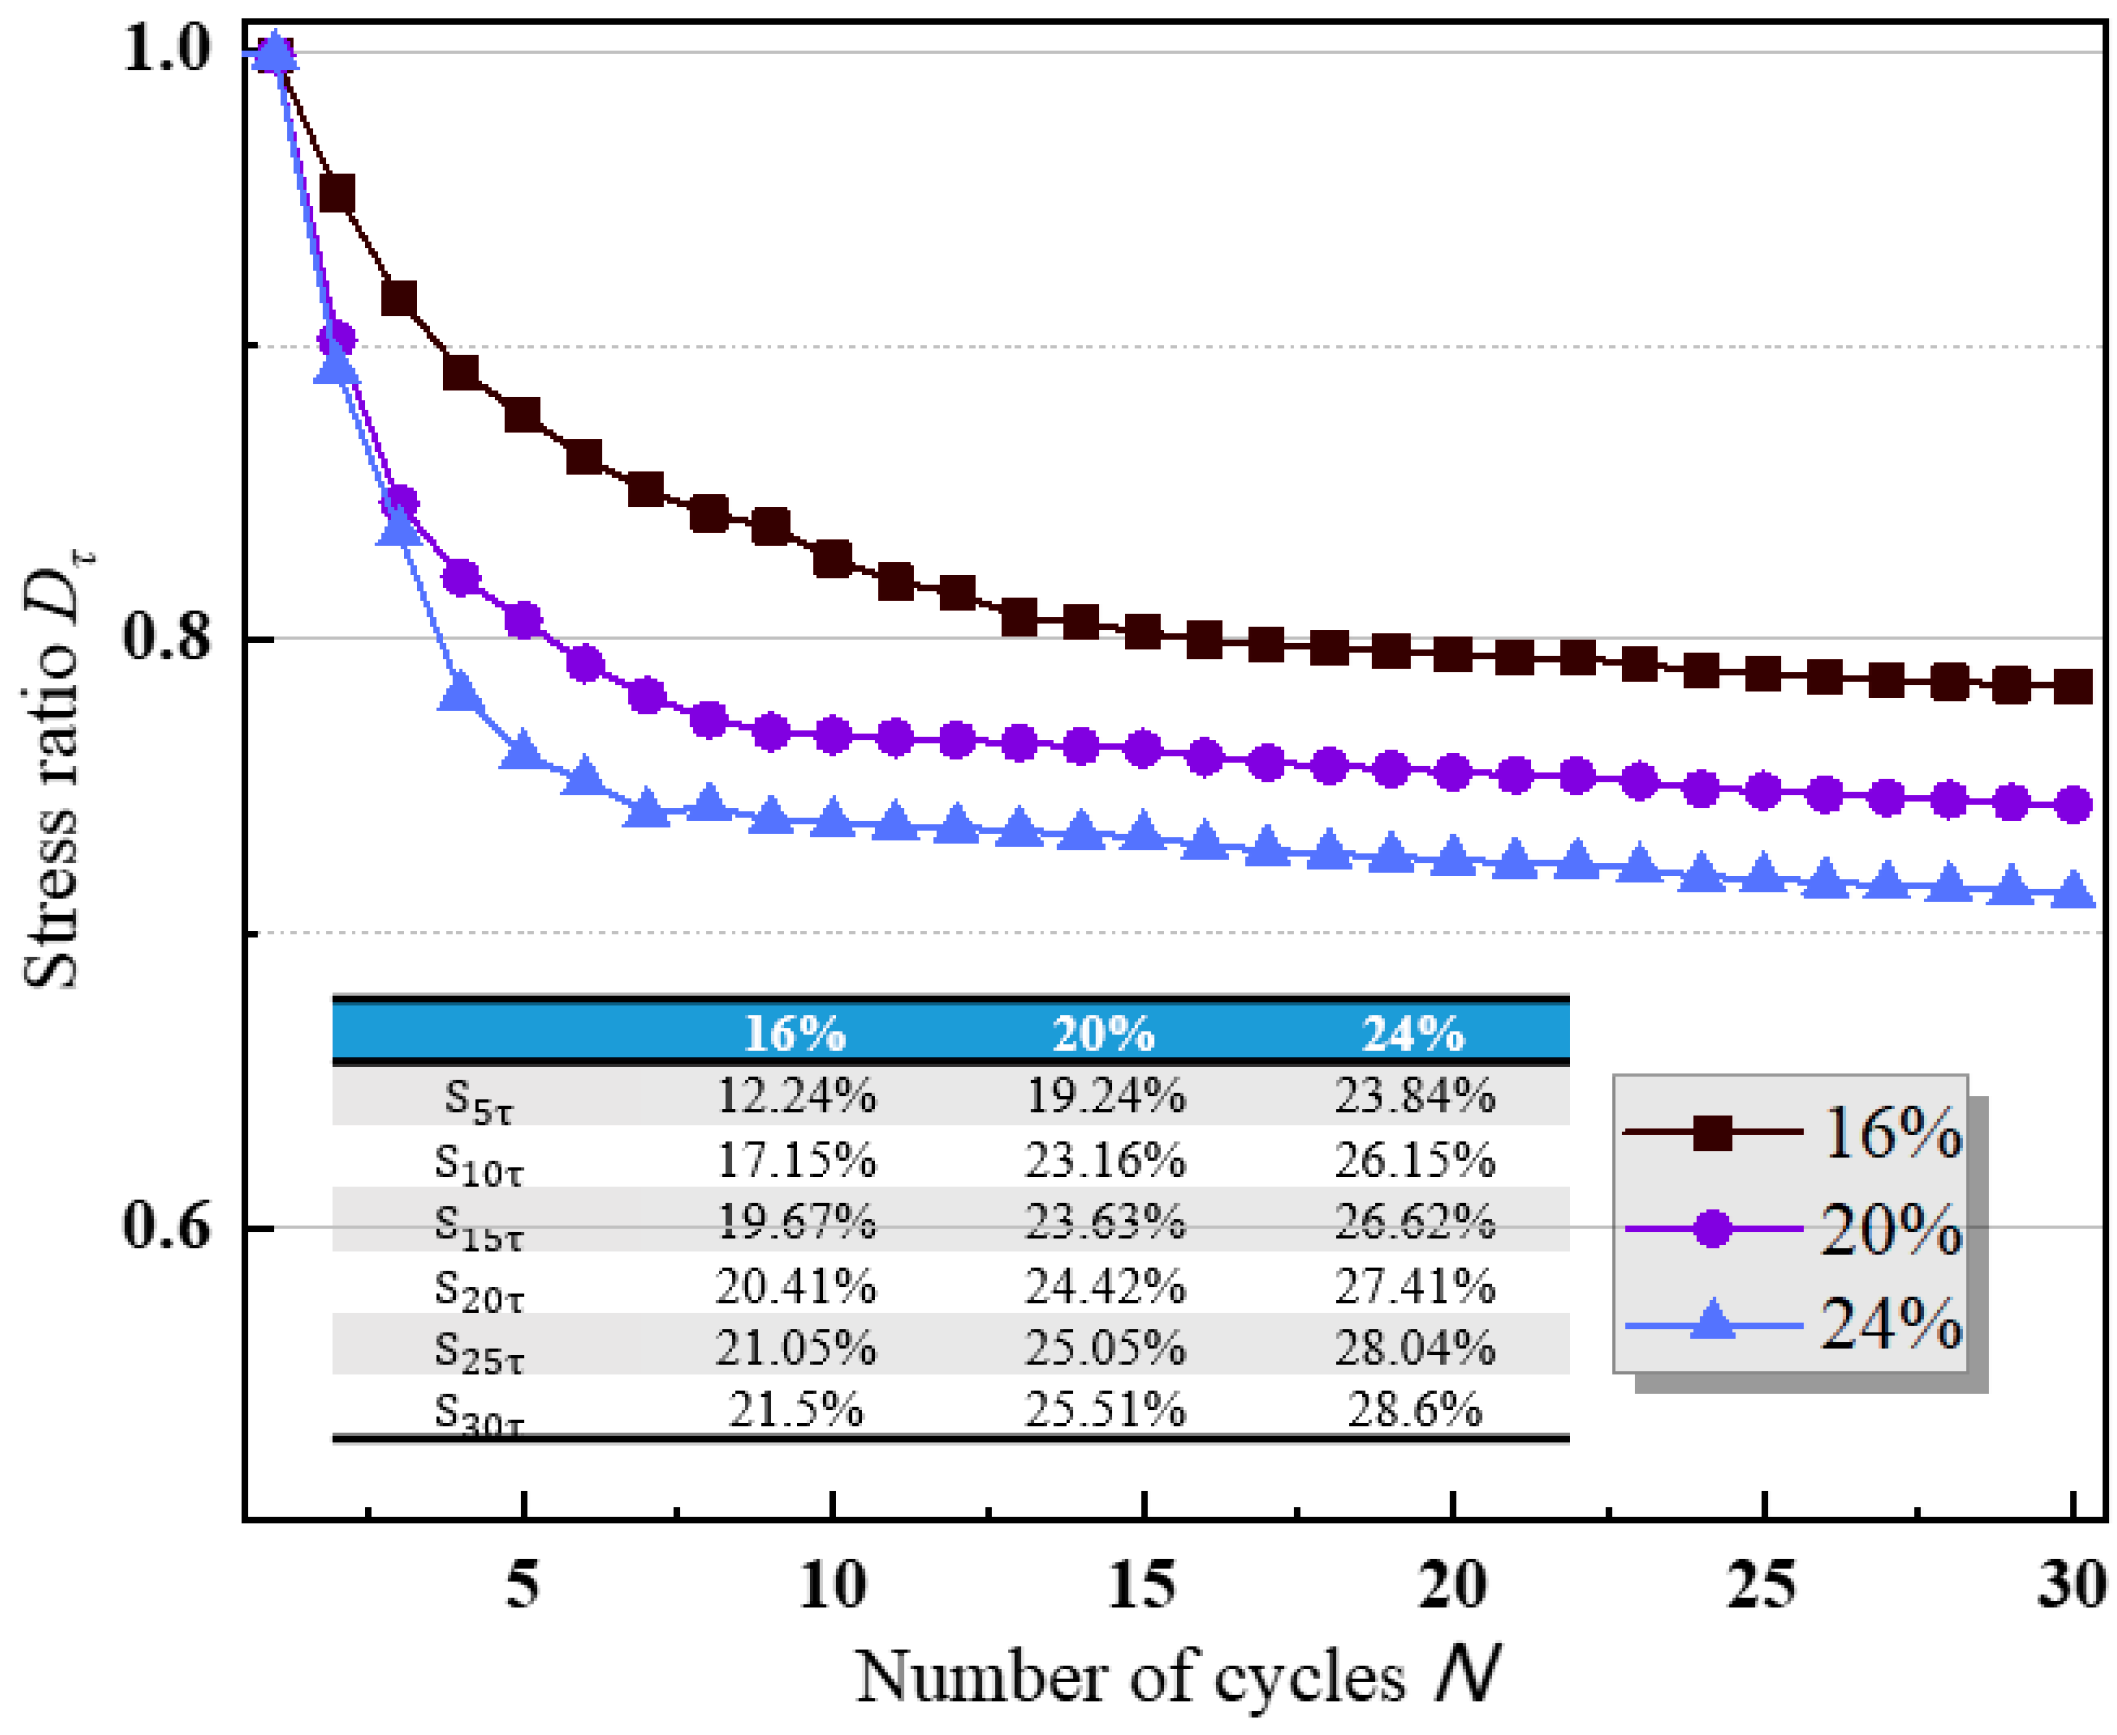
The curves of the stress ratio–cycle number presented in
Figure 15 show that the number of cycles required to reach the shear failure stage decreased with the increase in water content. With the increased water content, the thickness of the interface water film increased and the shear work was reduced due to the lubrication during the reciprocating shear process such that the shear failure stage could be reached earlier. In addition, the correlation between the shear strength reduction and the water content shown in
Figure 15 implied that the weakening degree of the interface did not increase further with the increase in water content, but rather, it reached the maximum value of 20% near the optimal water content. The reason for this is that the cohesion first increased and then decreased. Liu (2017) and Chen (2018) reached similar conclusions [
26,
27]. The maximum weakening coefficient
S30τ were 21.5%, 25.51%, and 28.6% under the three water content conditions, respectively.
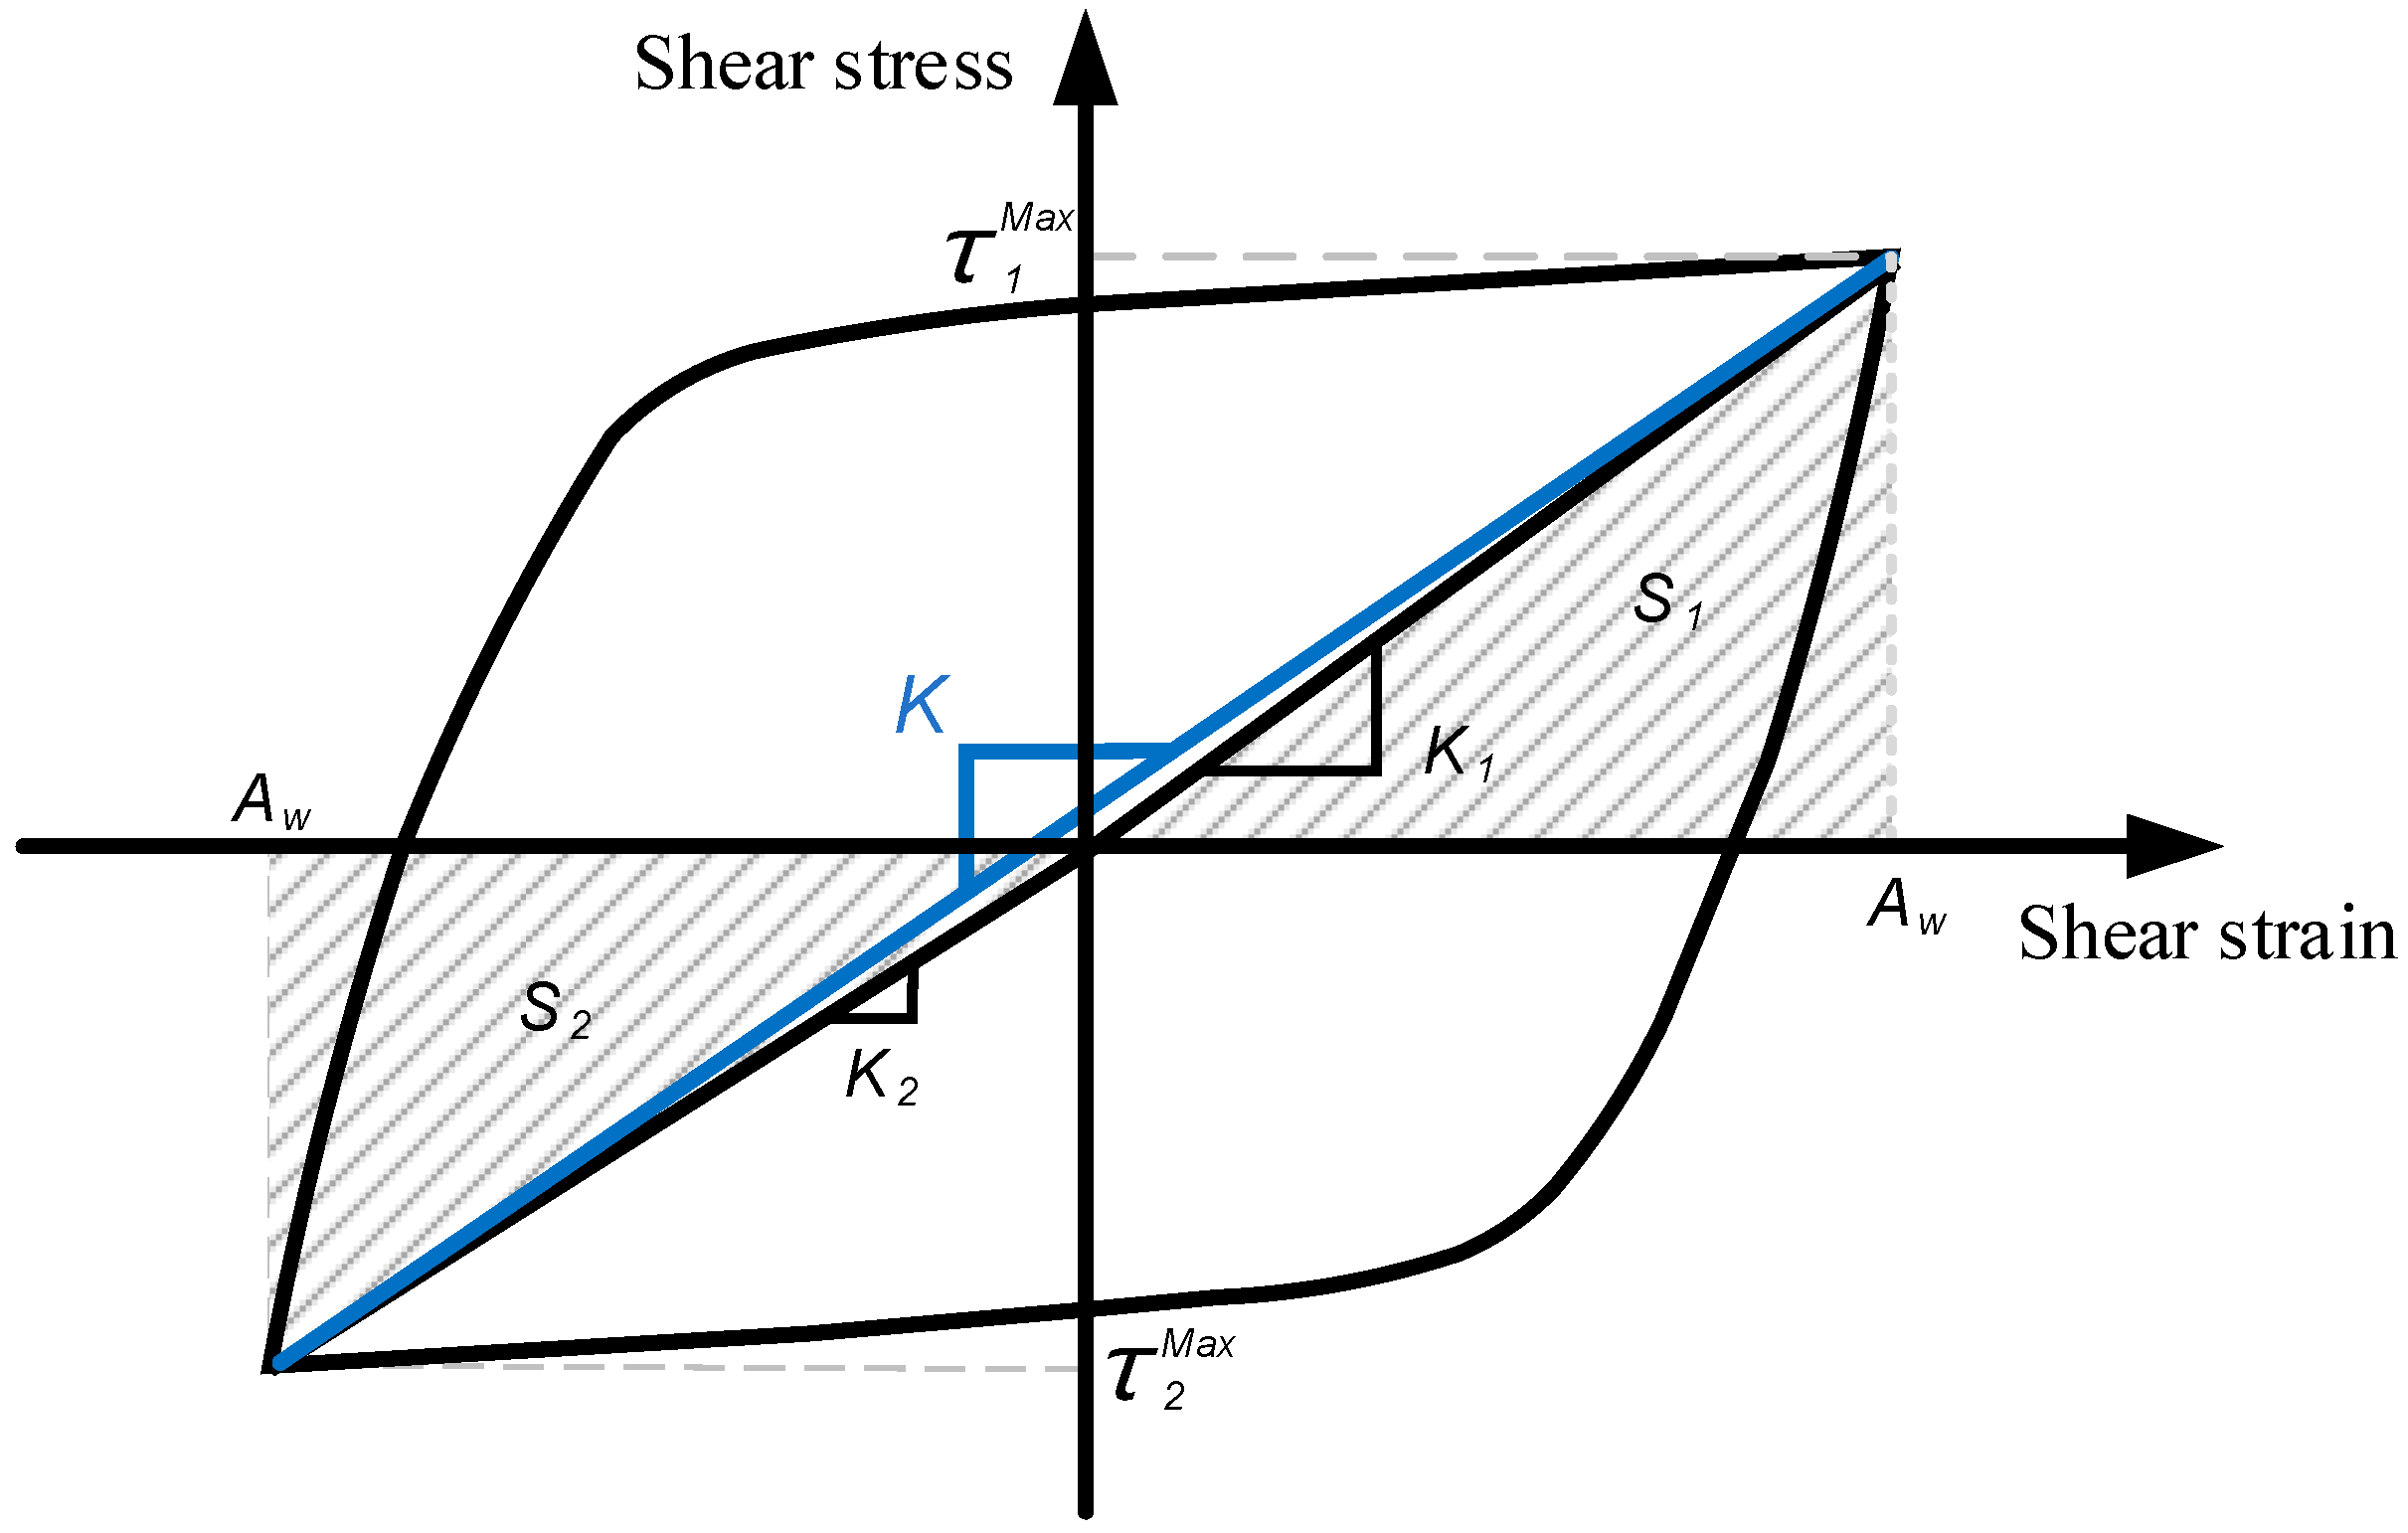
3.2. Shear Stiffness and Damping Ratio
Compared with the direct shear test, the number of cycles and shear amplitude were considered in the cyclic shear tests. Similar to Nye et al. (2007), Fox et al. (2011), and others, the shear stiffness and damping ratio were introduced to describe the dynamic characteristics and response analysis of soil mass and to analyze the weakening behavior of the steel–silt interface under the cyclic shear scenario [
28,
29]. The schematic diagram is shown in
Figure 16, and the formula used is as follows:
where
K1 and
K2 represent the shear stiffness in the positive and negative shear directions, respectively, and
is the peak shear stress, while
Aw is the shear amplitude.
where
D1 and
D2 represent the damping ratio in the positive and negative shear directions,
S is the hysteresis loop area, and
S1 and
S2 are shadow areas.
Due to a large number of data points, the cycle data for cycles 1, 5, 10, 15, 25, and 30 were selected as representative points for the following analysis. The area of each cycle hysteresis loop was calculated using the Origin commercial software, and the curves of the shear stiffness–cycle number and damping ratio–cycle number were plotted, respectively.
3.2.1. The Influence of Normal Stress
It has been reported that different normal stresses lead to an additional cyclic shear stiffness and damping ratio of the interface [
30,
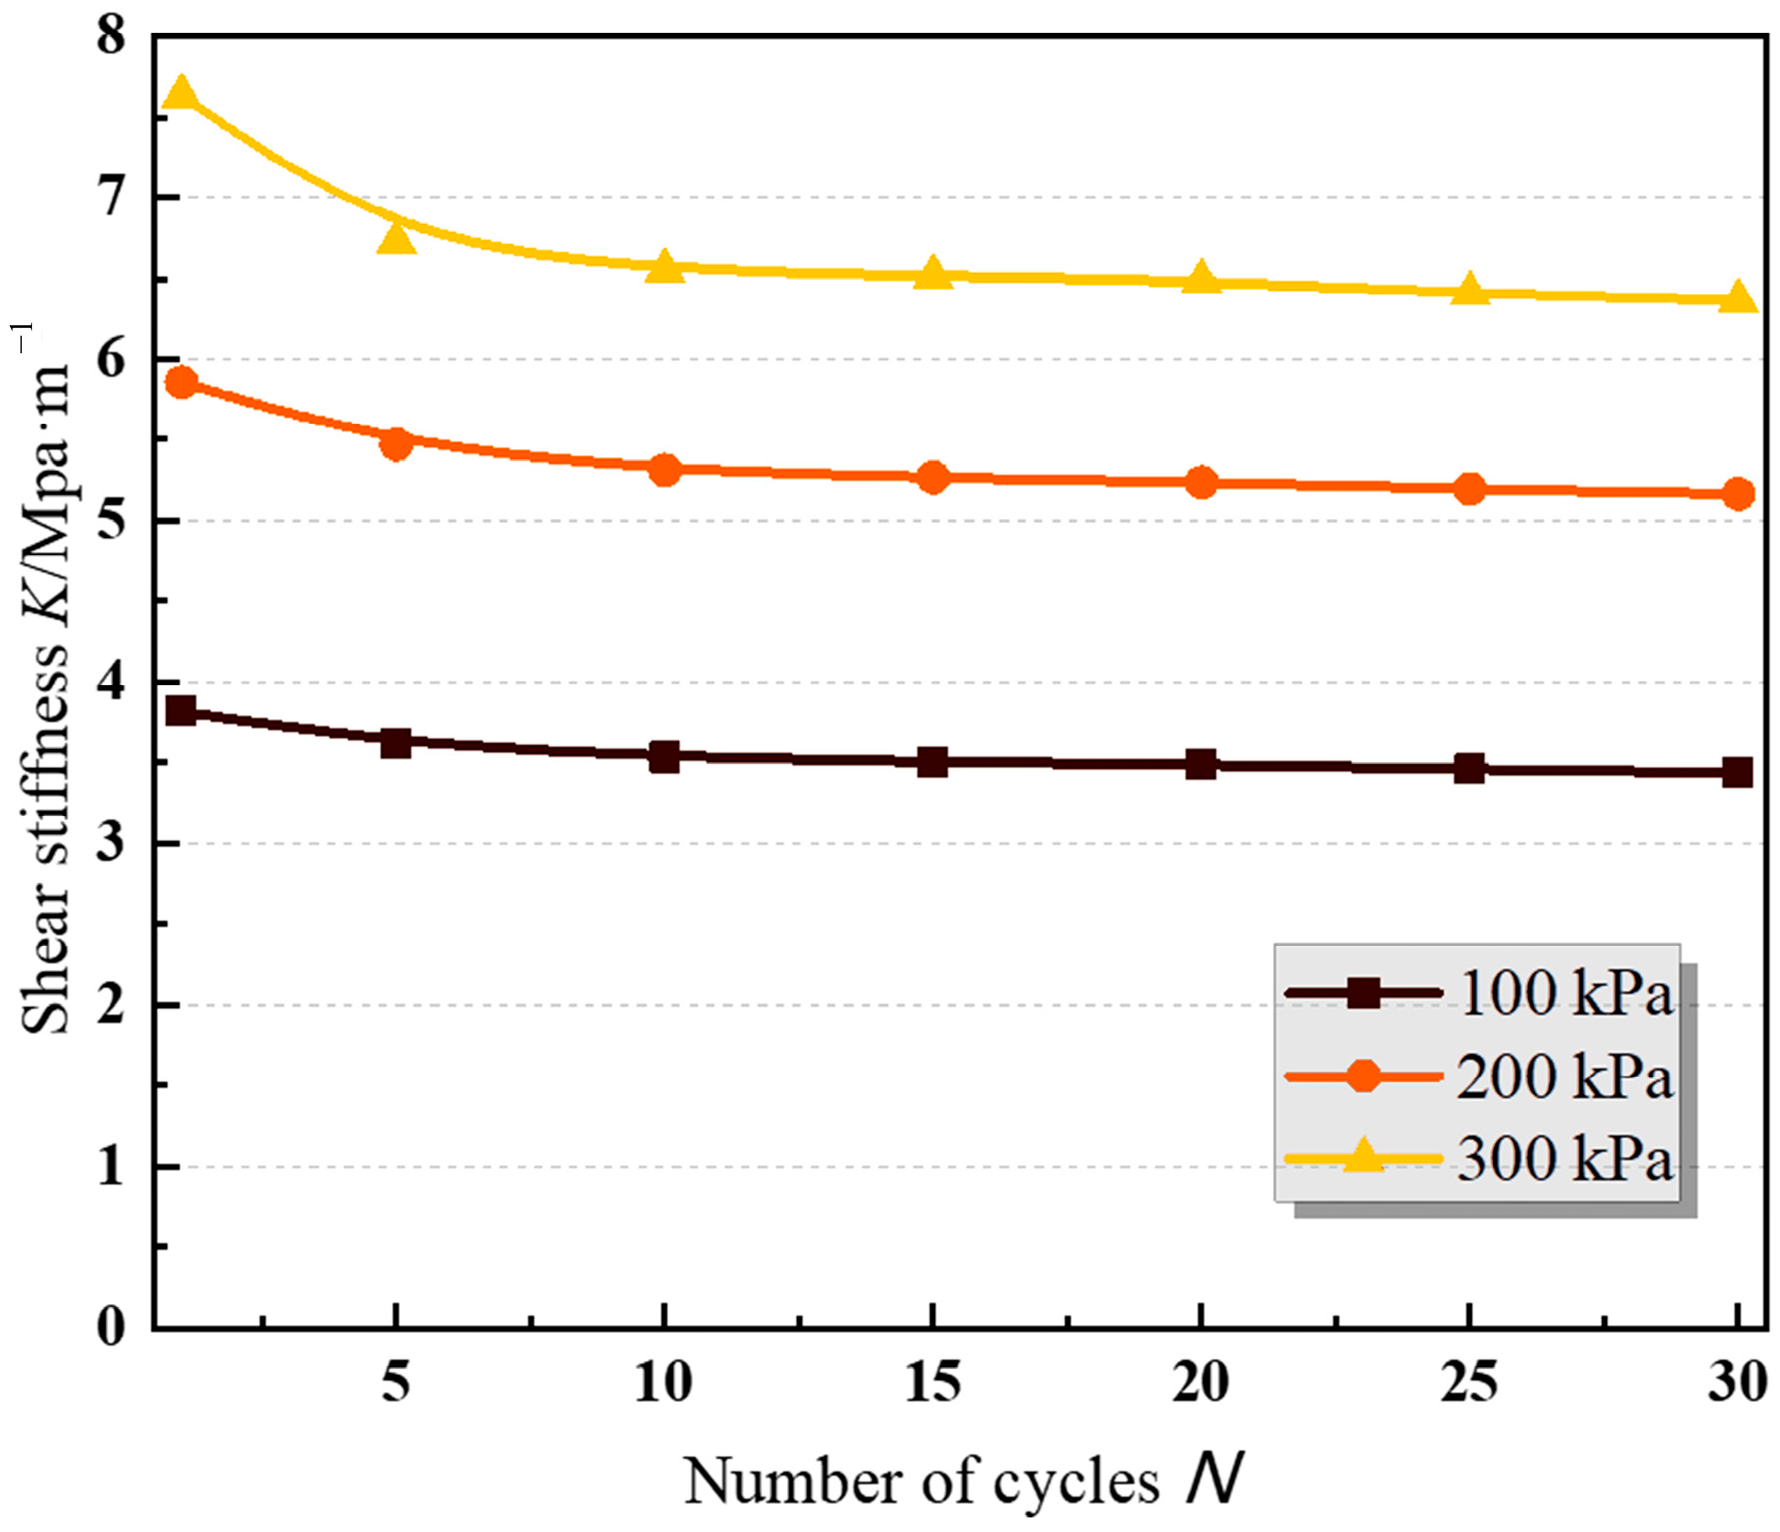
31]. As shown in
Figure 17, in the
K–N (shear stiffness–cycle number) curve, a weakening feature tends to appear under all normal stress conditions. For the same number of cycles, with the increase in normal stress, shear stiffness increased, and its softening trend became apparent with the number of cycles, which was consistent with the influence of normal stress on shear strength.
The
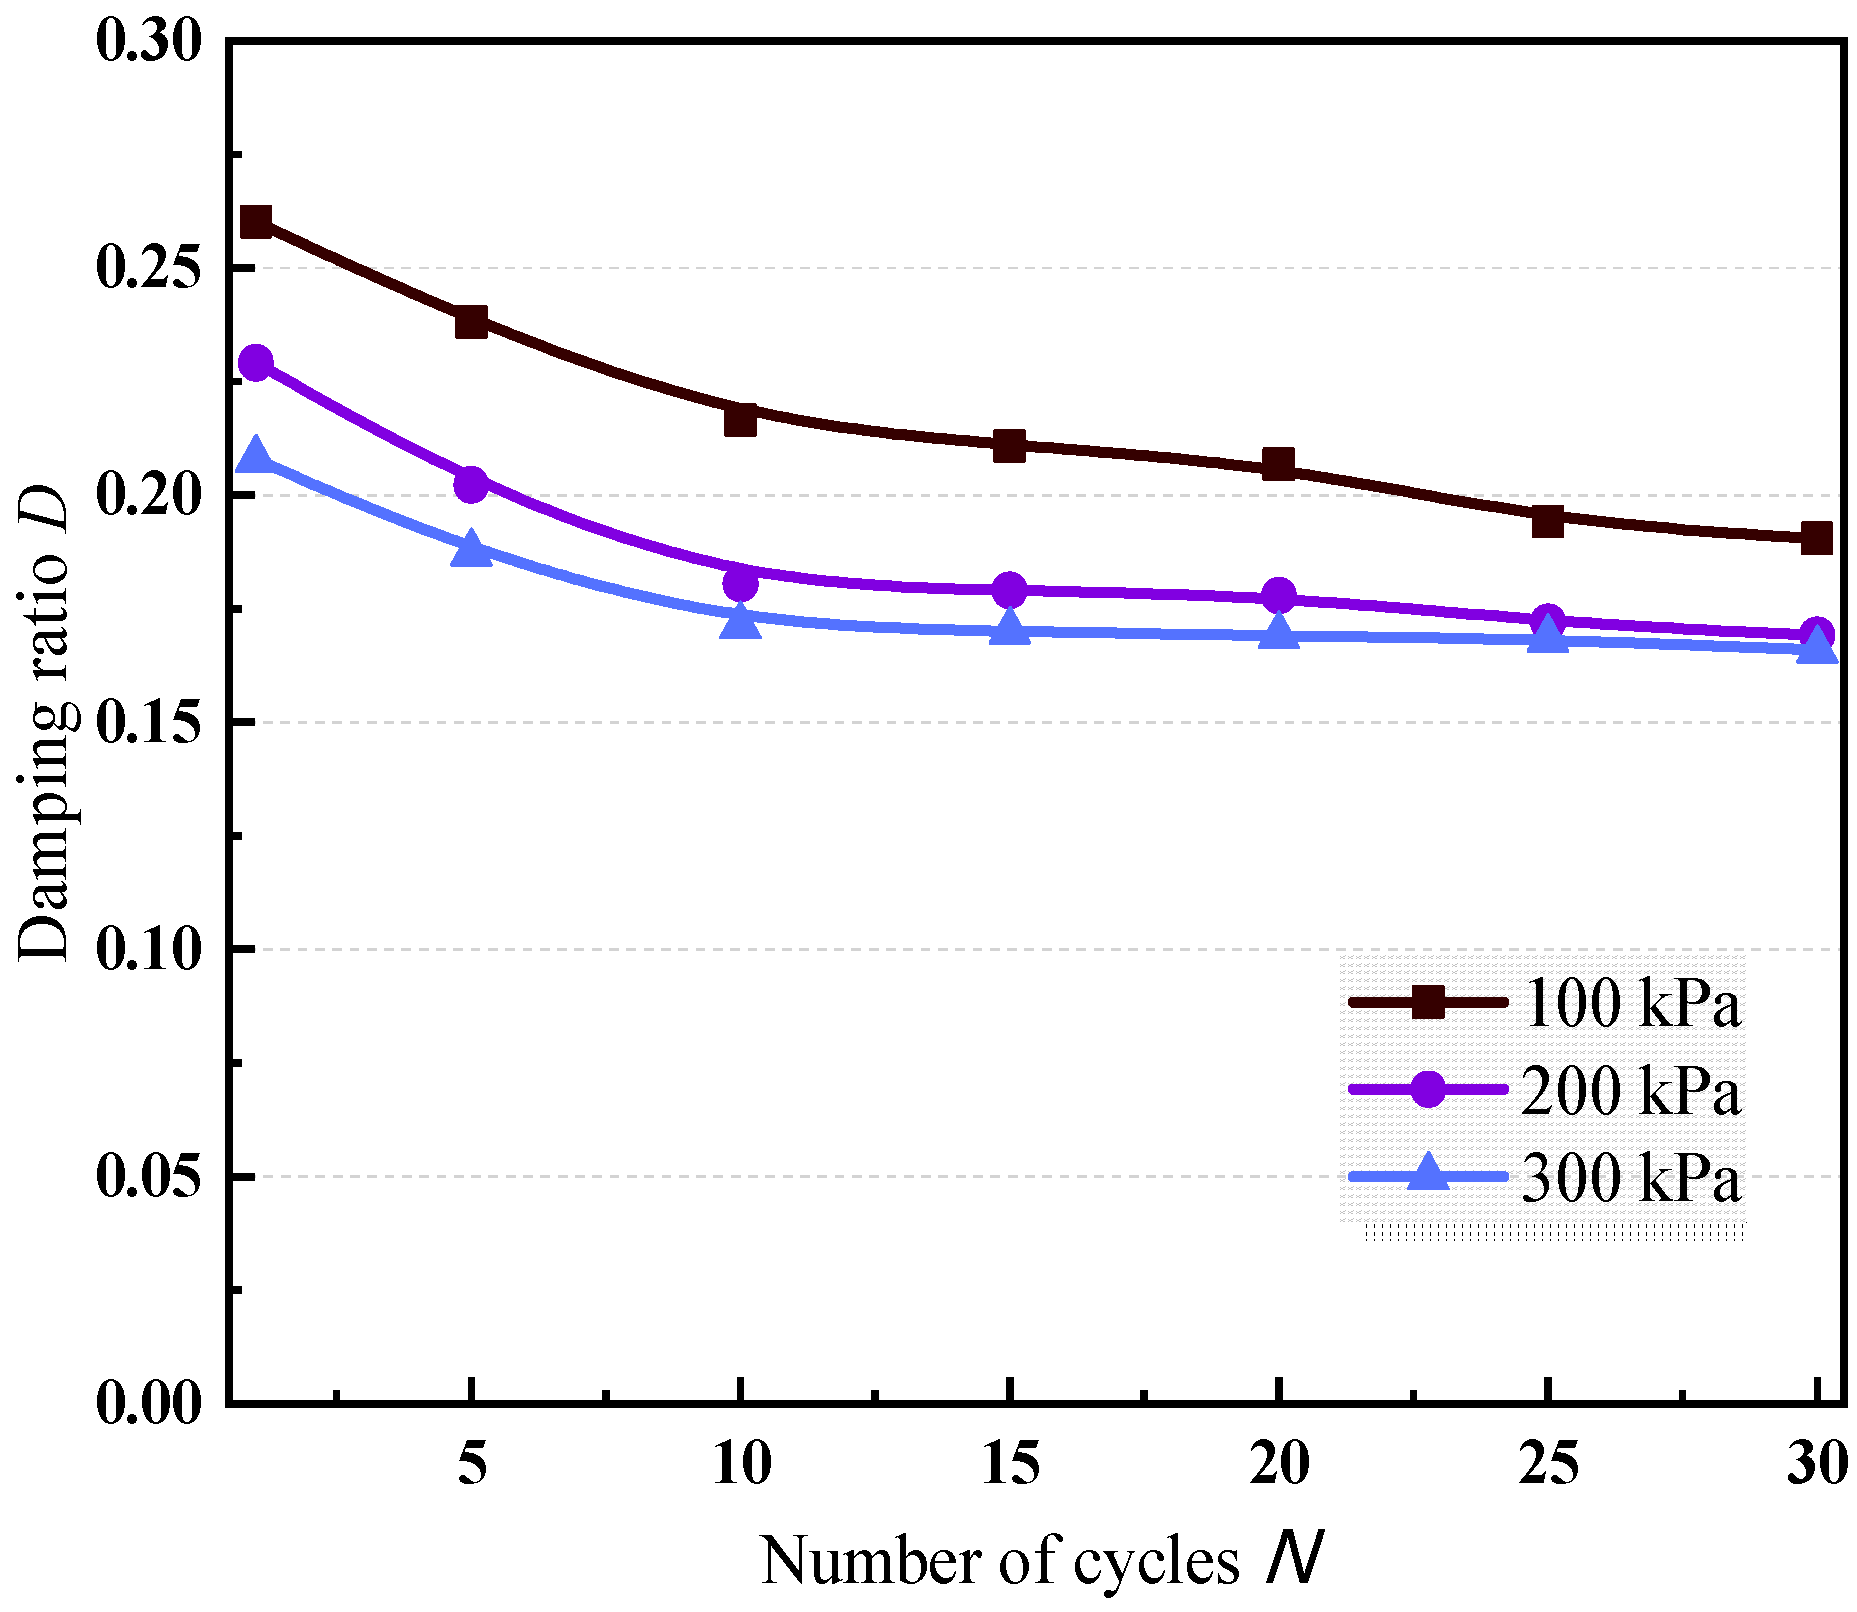
D–N (damping ratio–cycle number) curve in
Figure 18 shows that with the progress in cyclic shear, the
D–N curve also tended to present a weakening trend, indicating that the cyclic shear had an adverse impact on the safety and stability of the interface. The damping ratio and the reduction rate decreased with the increase in normal stress. In addition, with the progress in cyclic shear, the difference in the damping ratio under different normal stress conditions decreased. Similar conclusions emerged in the research conducted by Ying et al. (2020), i.e., the energy dissipation tended to converge with the progress in cyclic shear [
32].
3.2.2. The Influence of Shear Amplitude
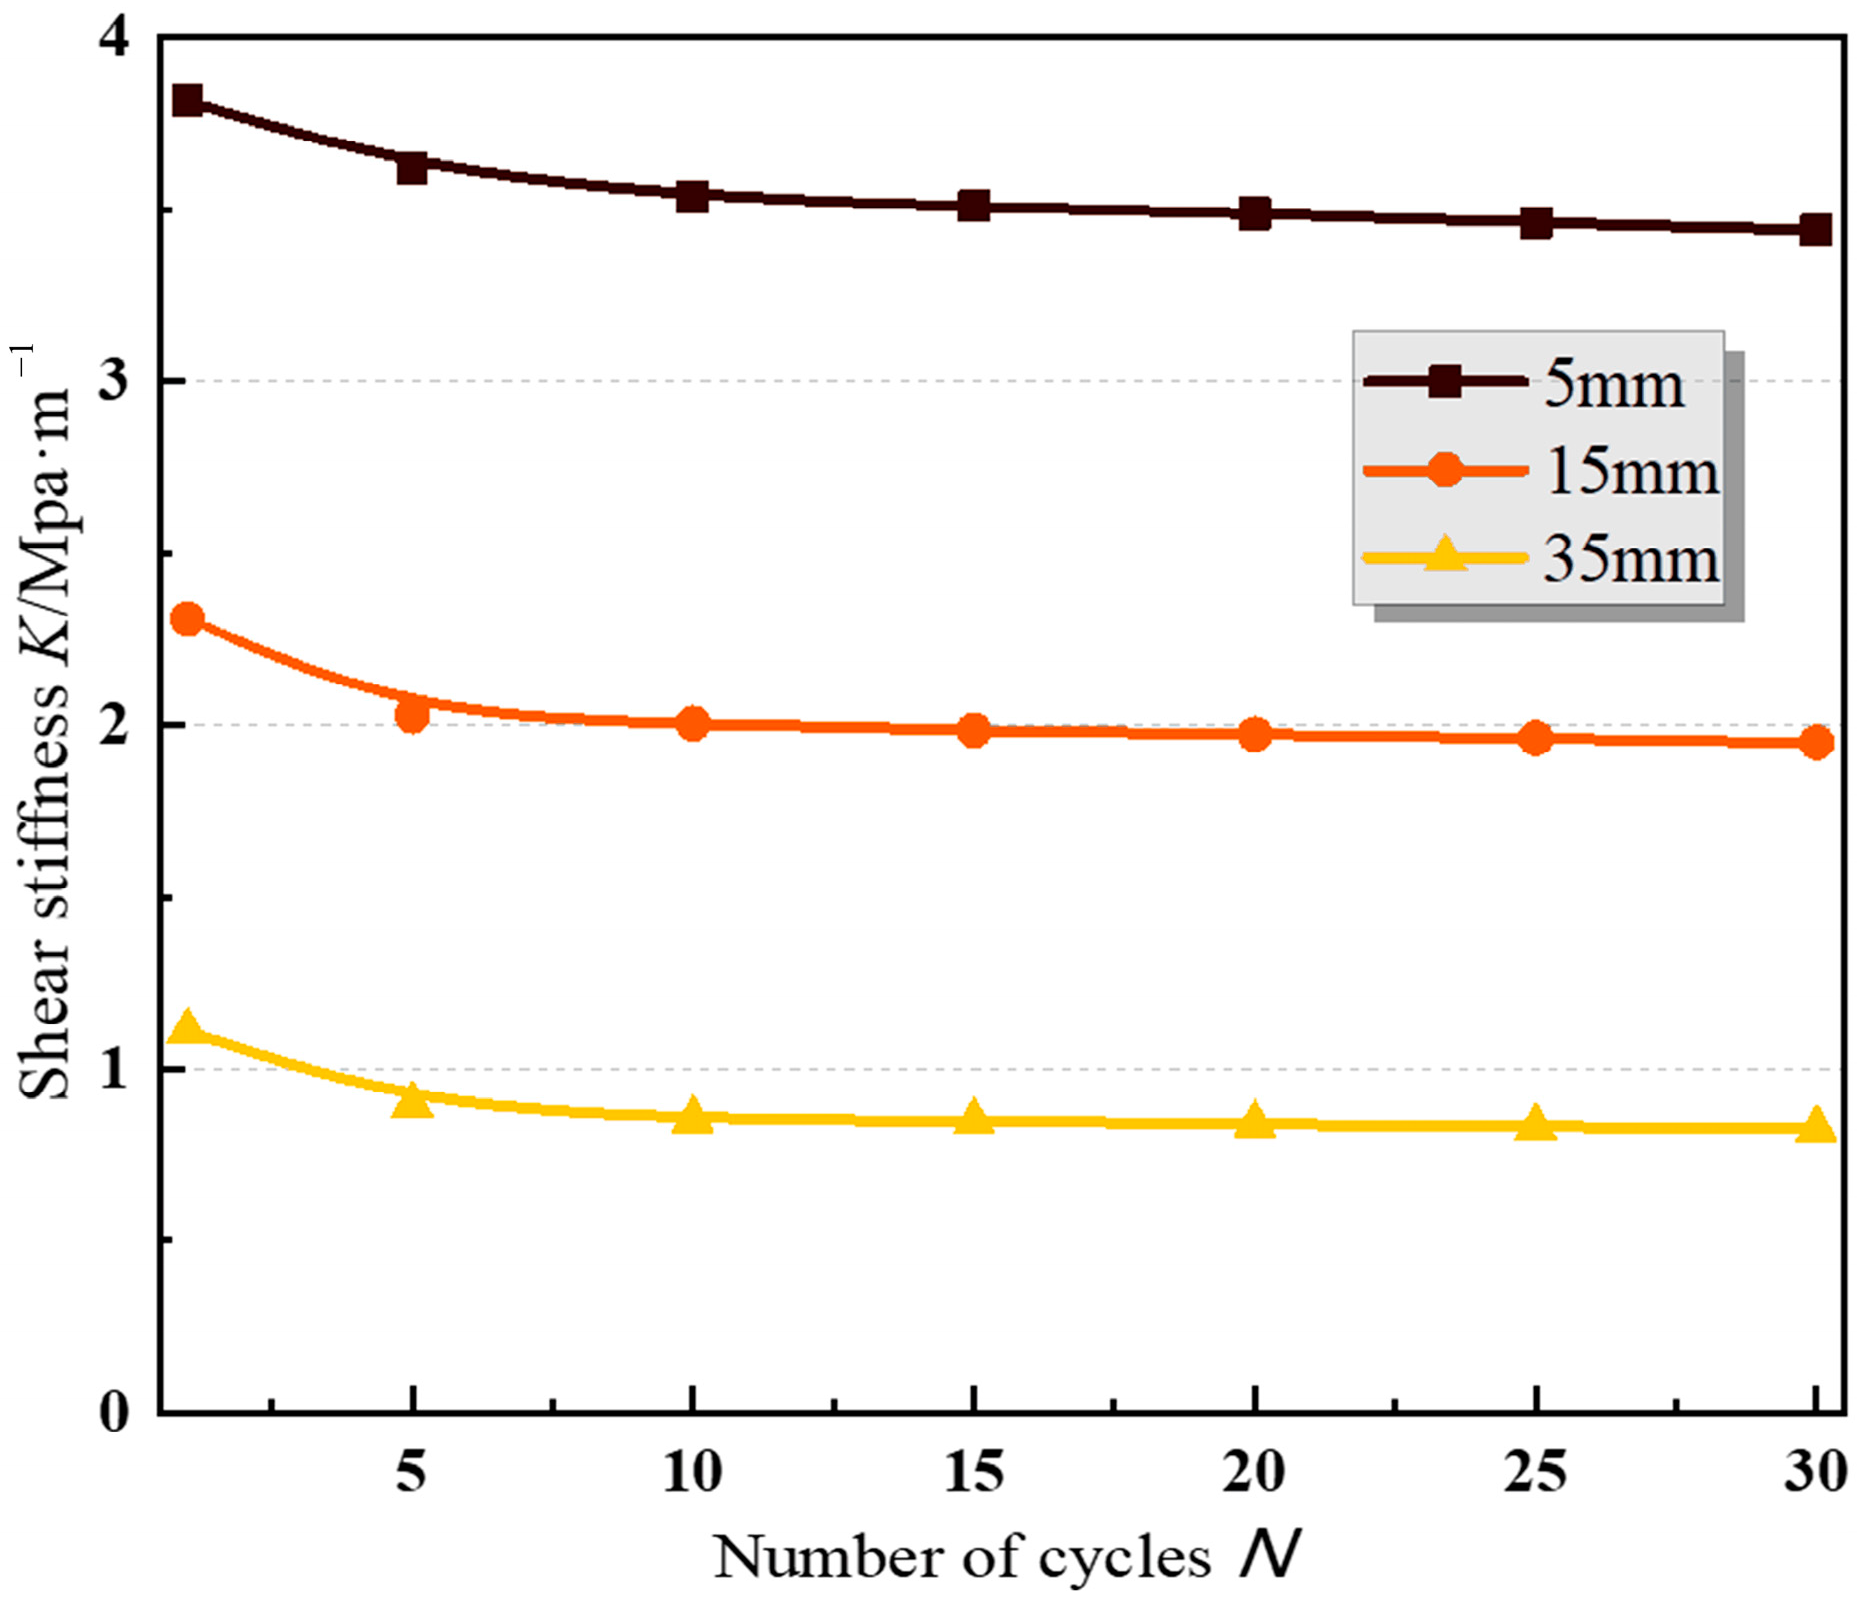
Figure 19 and
Figure 20 show the
K–N and
D–N curves of the interface under different shear amplitudes conditions (test groups 2, 3, and 8). The
K–N curve in
Figure 19 indicates that with the increase in cyclic shear amplitude, the shear stiffness corresponding to the same number of cycles decreased. Vieira et al. (2013) obtained the same test results [
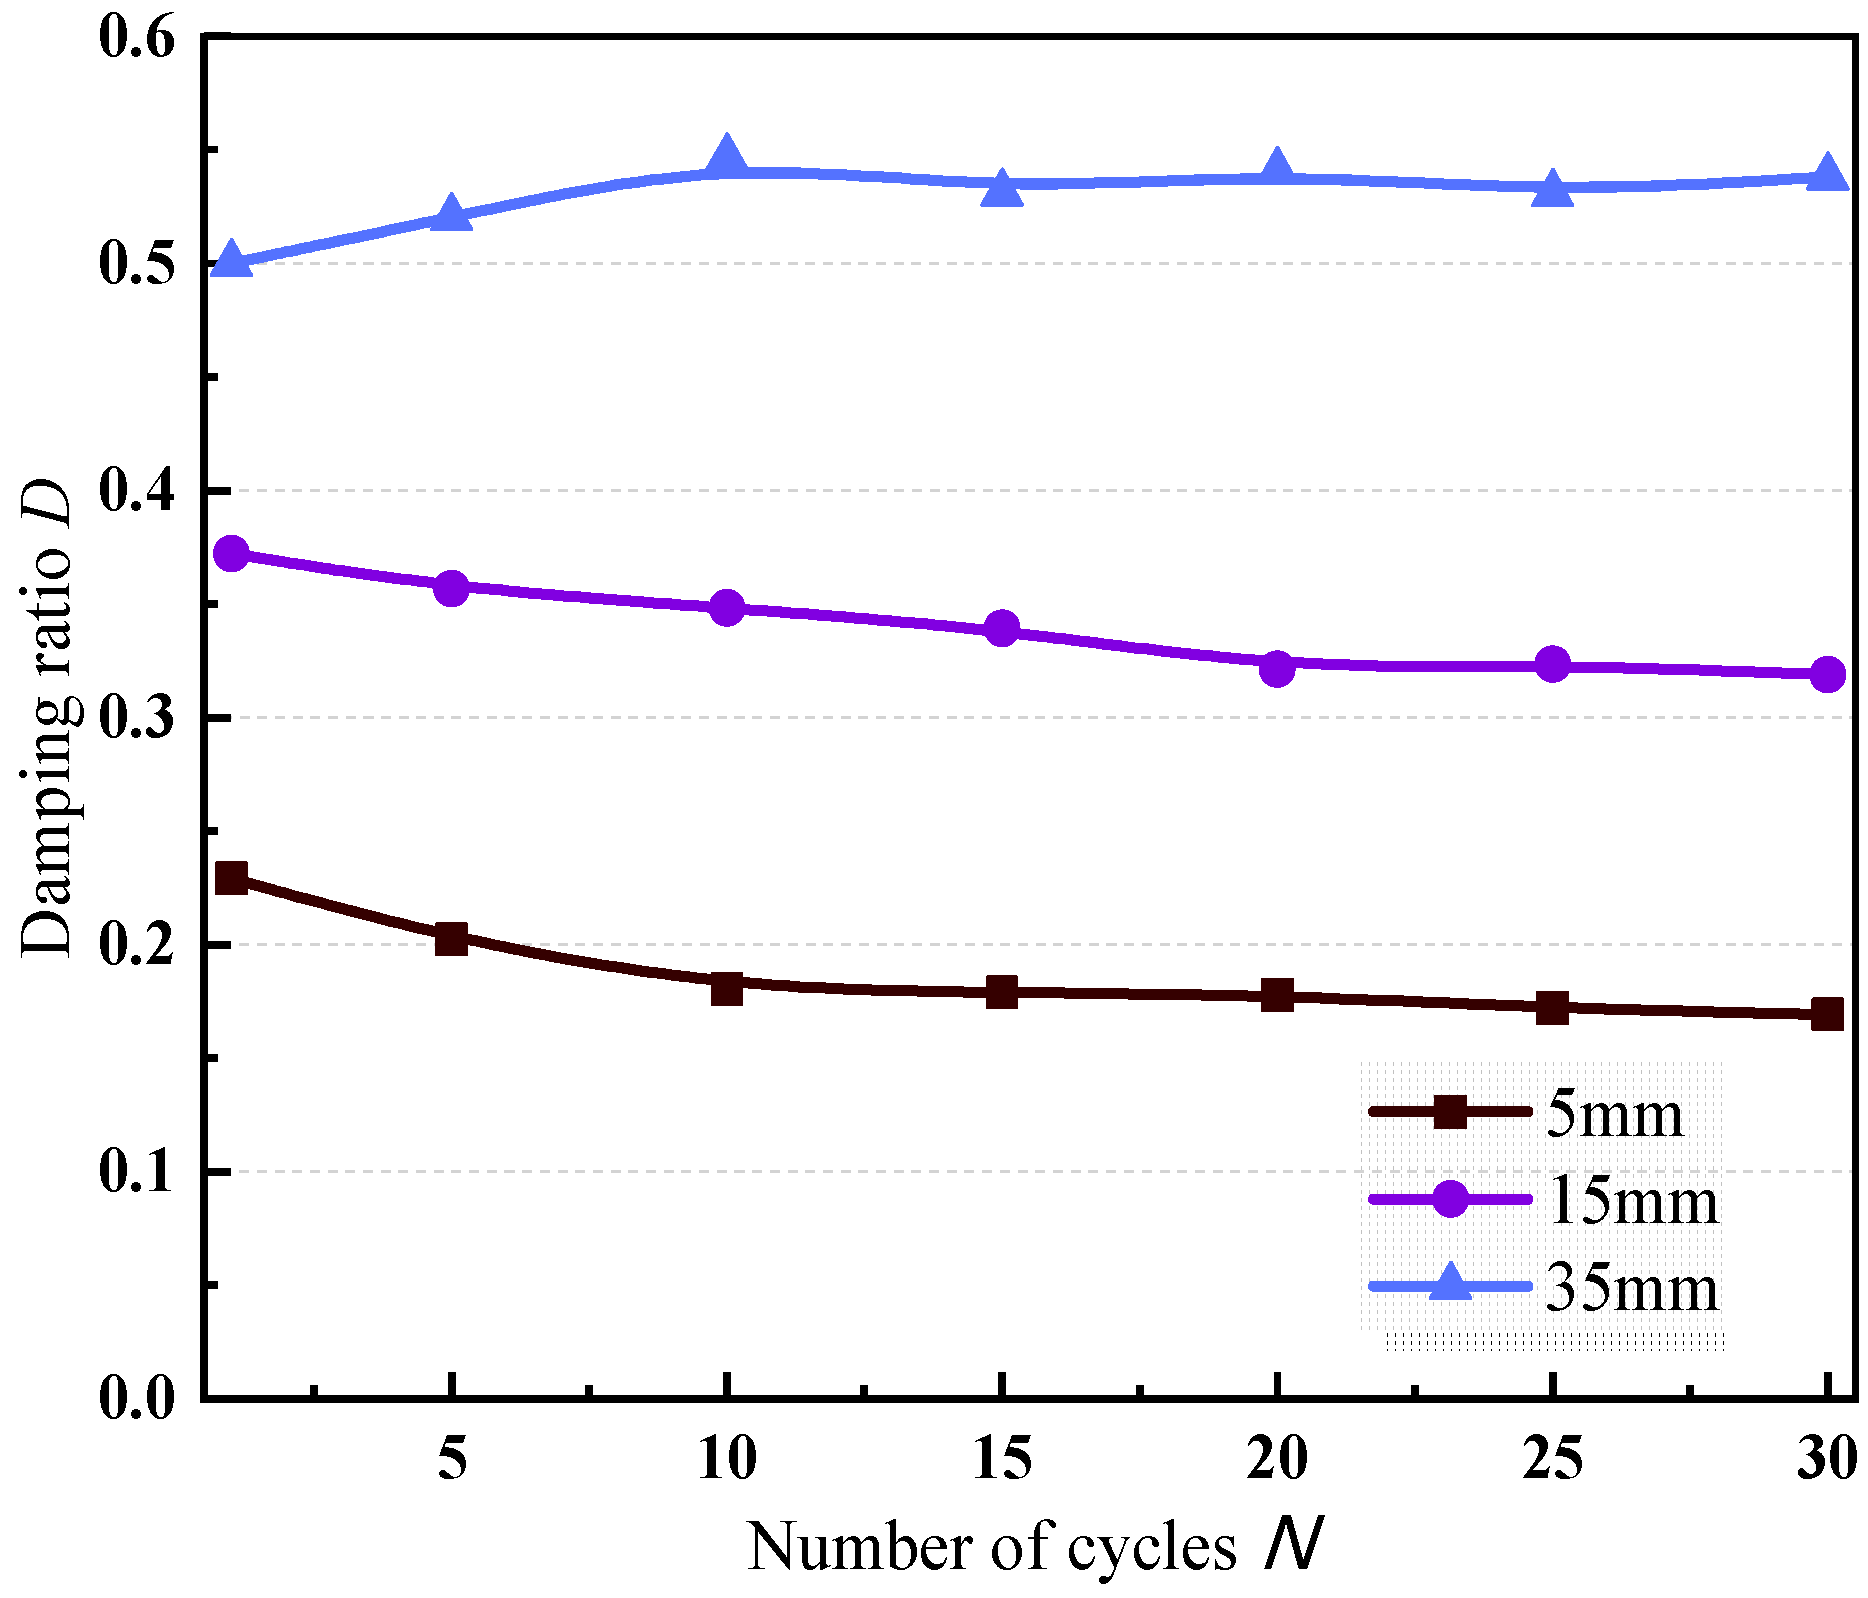
23]. The
D–N curve in
Figure 20 implies that with the increase in shear amplitude, the energy dissipation and the damping ratio increased. However, the group with a shear amplitude of 35 mm had an opposite rule to the other two groups. With the rise in shear, the damping ratio increased first and then appeared asymptotic.
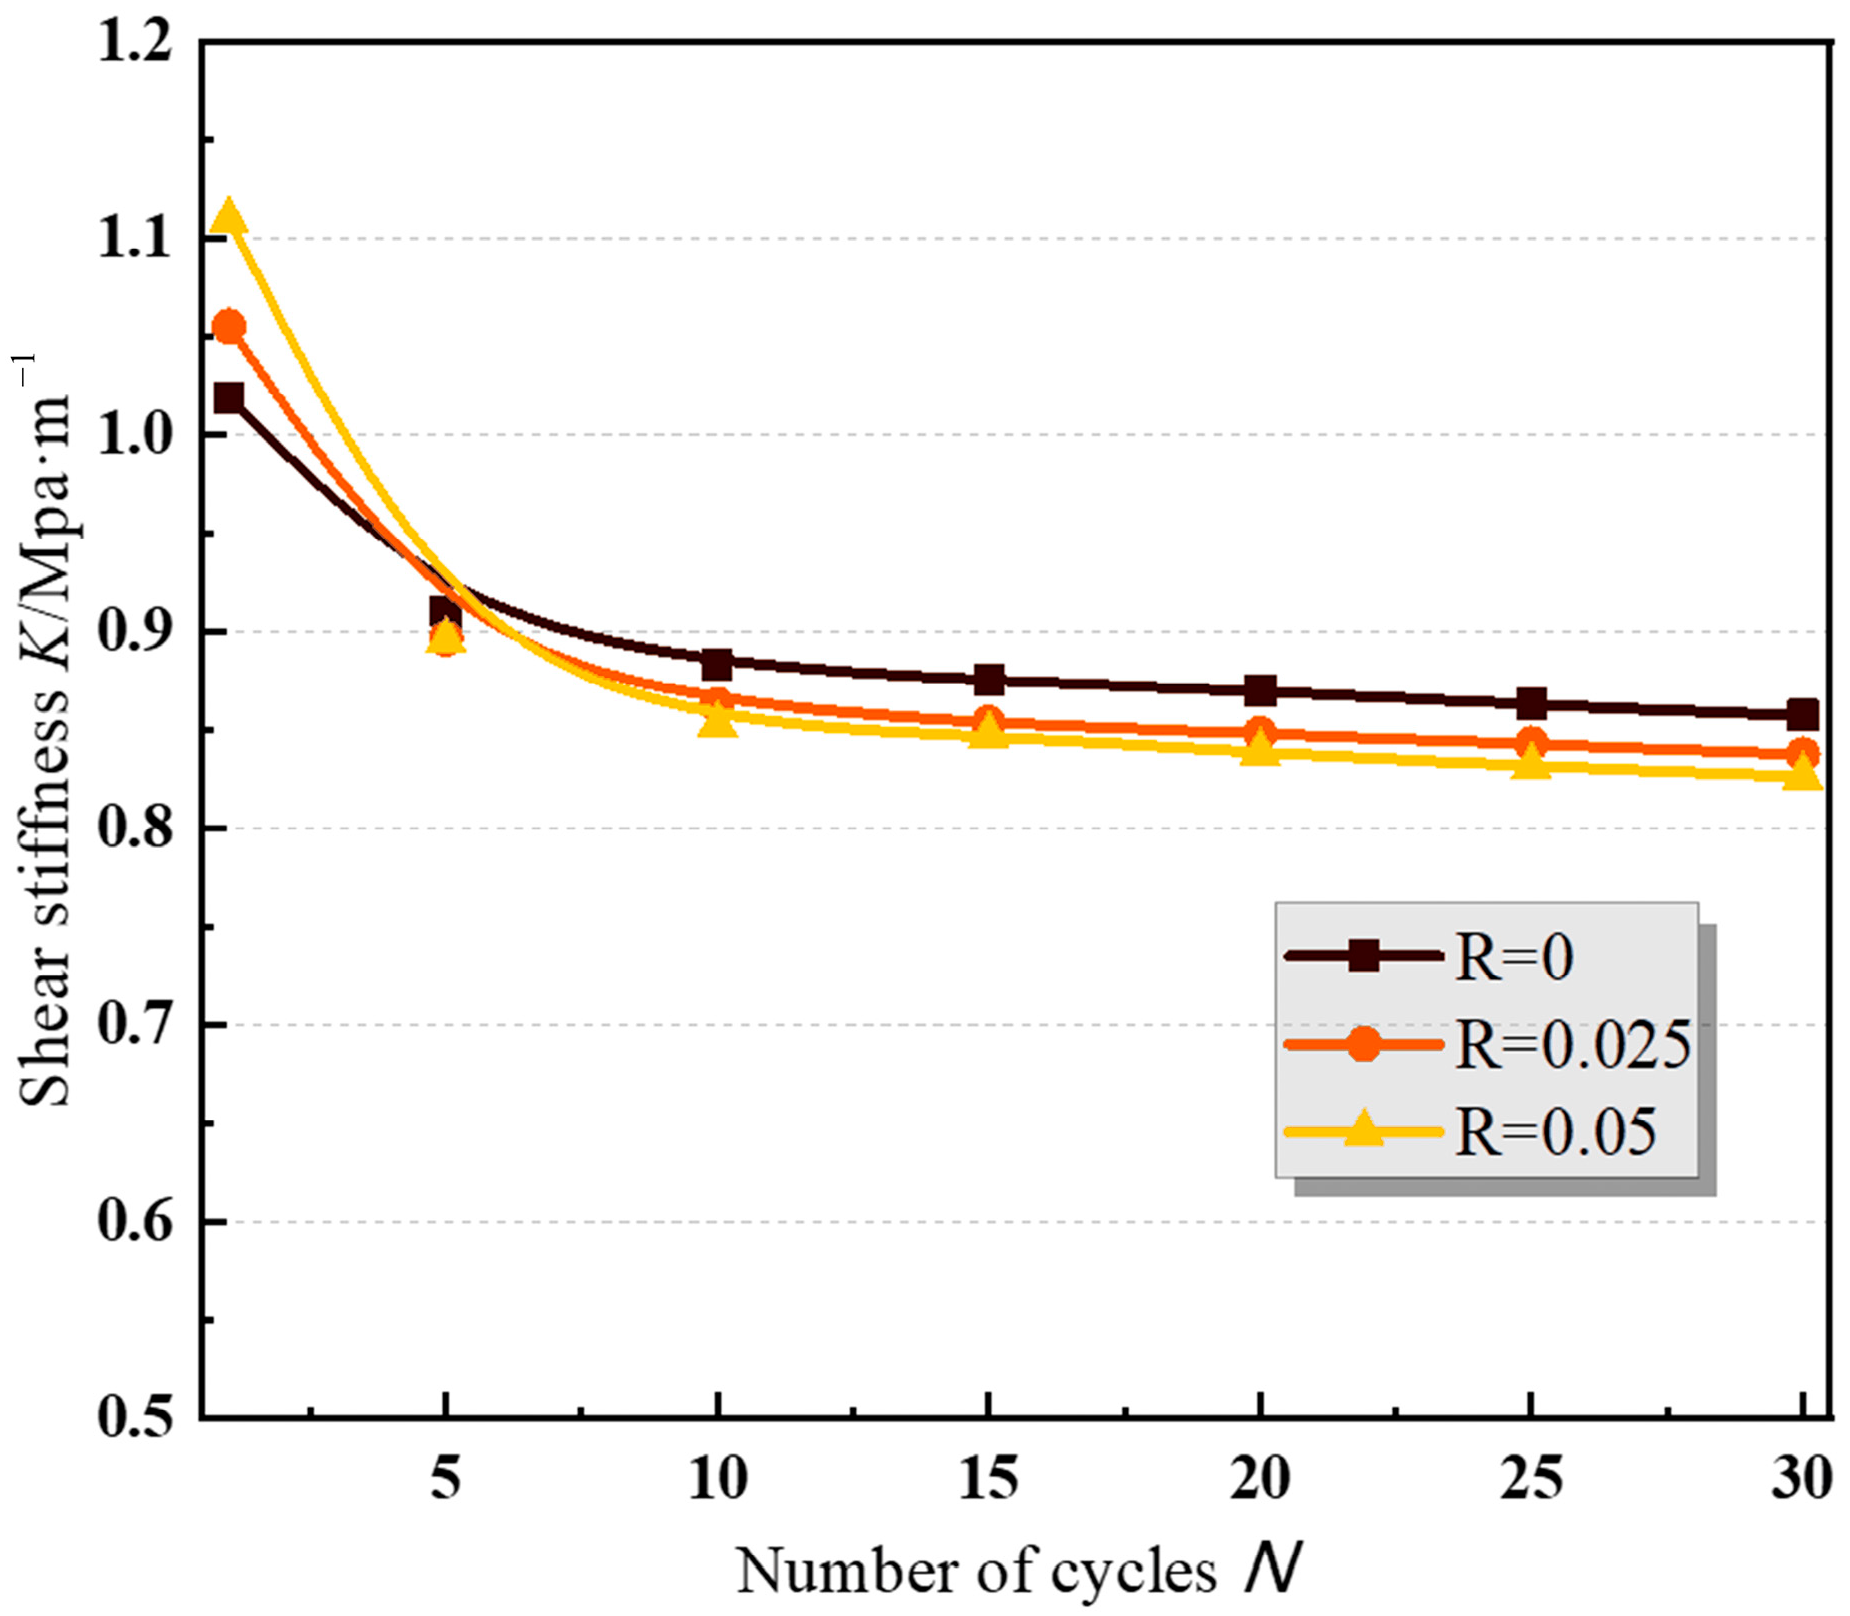
3.2.3. The Influence of Roughness
Figure 21 and
Figure 22 demonstrate the
K–N and
D–N curves of the interface under different roughness conditions (test groups 4, 5, and 8). The
K–N curve in
Figure 21 shows that with the progress in cyclic shear, the shear stiffness passed through three stages: rapid decline, slow decline, and equilibrium. The relationship between shear stiffness and roughness was the same as the relationship between shear strength and roughness in the previous section. The rough interface made the frictional occlusion effect apparent at the beginning of cyclic shear, and then the shear stiffness increased. With the roughness increase, the strength degradation of the interface became remarkable, and the decrease in the shear stiffness became significant.
The
D–N curve in
Figure 22 implies that with the roughness increase, the interface’s energy dissipation caused by cyclic shear became fast, and the damping ratio increased [
33]. In addition, the damping ratios of the interfaces with different roughness levels varied significantly in the first few cycles. As the number of cycles increased, the damping ratio difference decreased. A possible reason for this may be that during the shear process, the grooves having various roughness levels were filled with soil particles to different extents, and their contact surfaces tended to be smooth. Thus, the differences in the volume and shape between the grooves were gradually reduced, which ultimately weakened the impact of the roughness on the damping ratio.
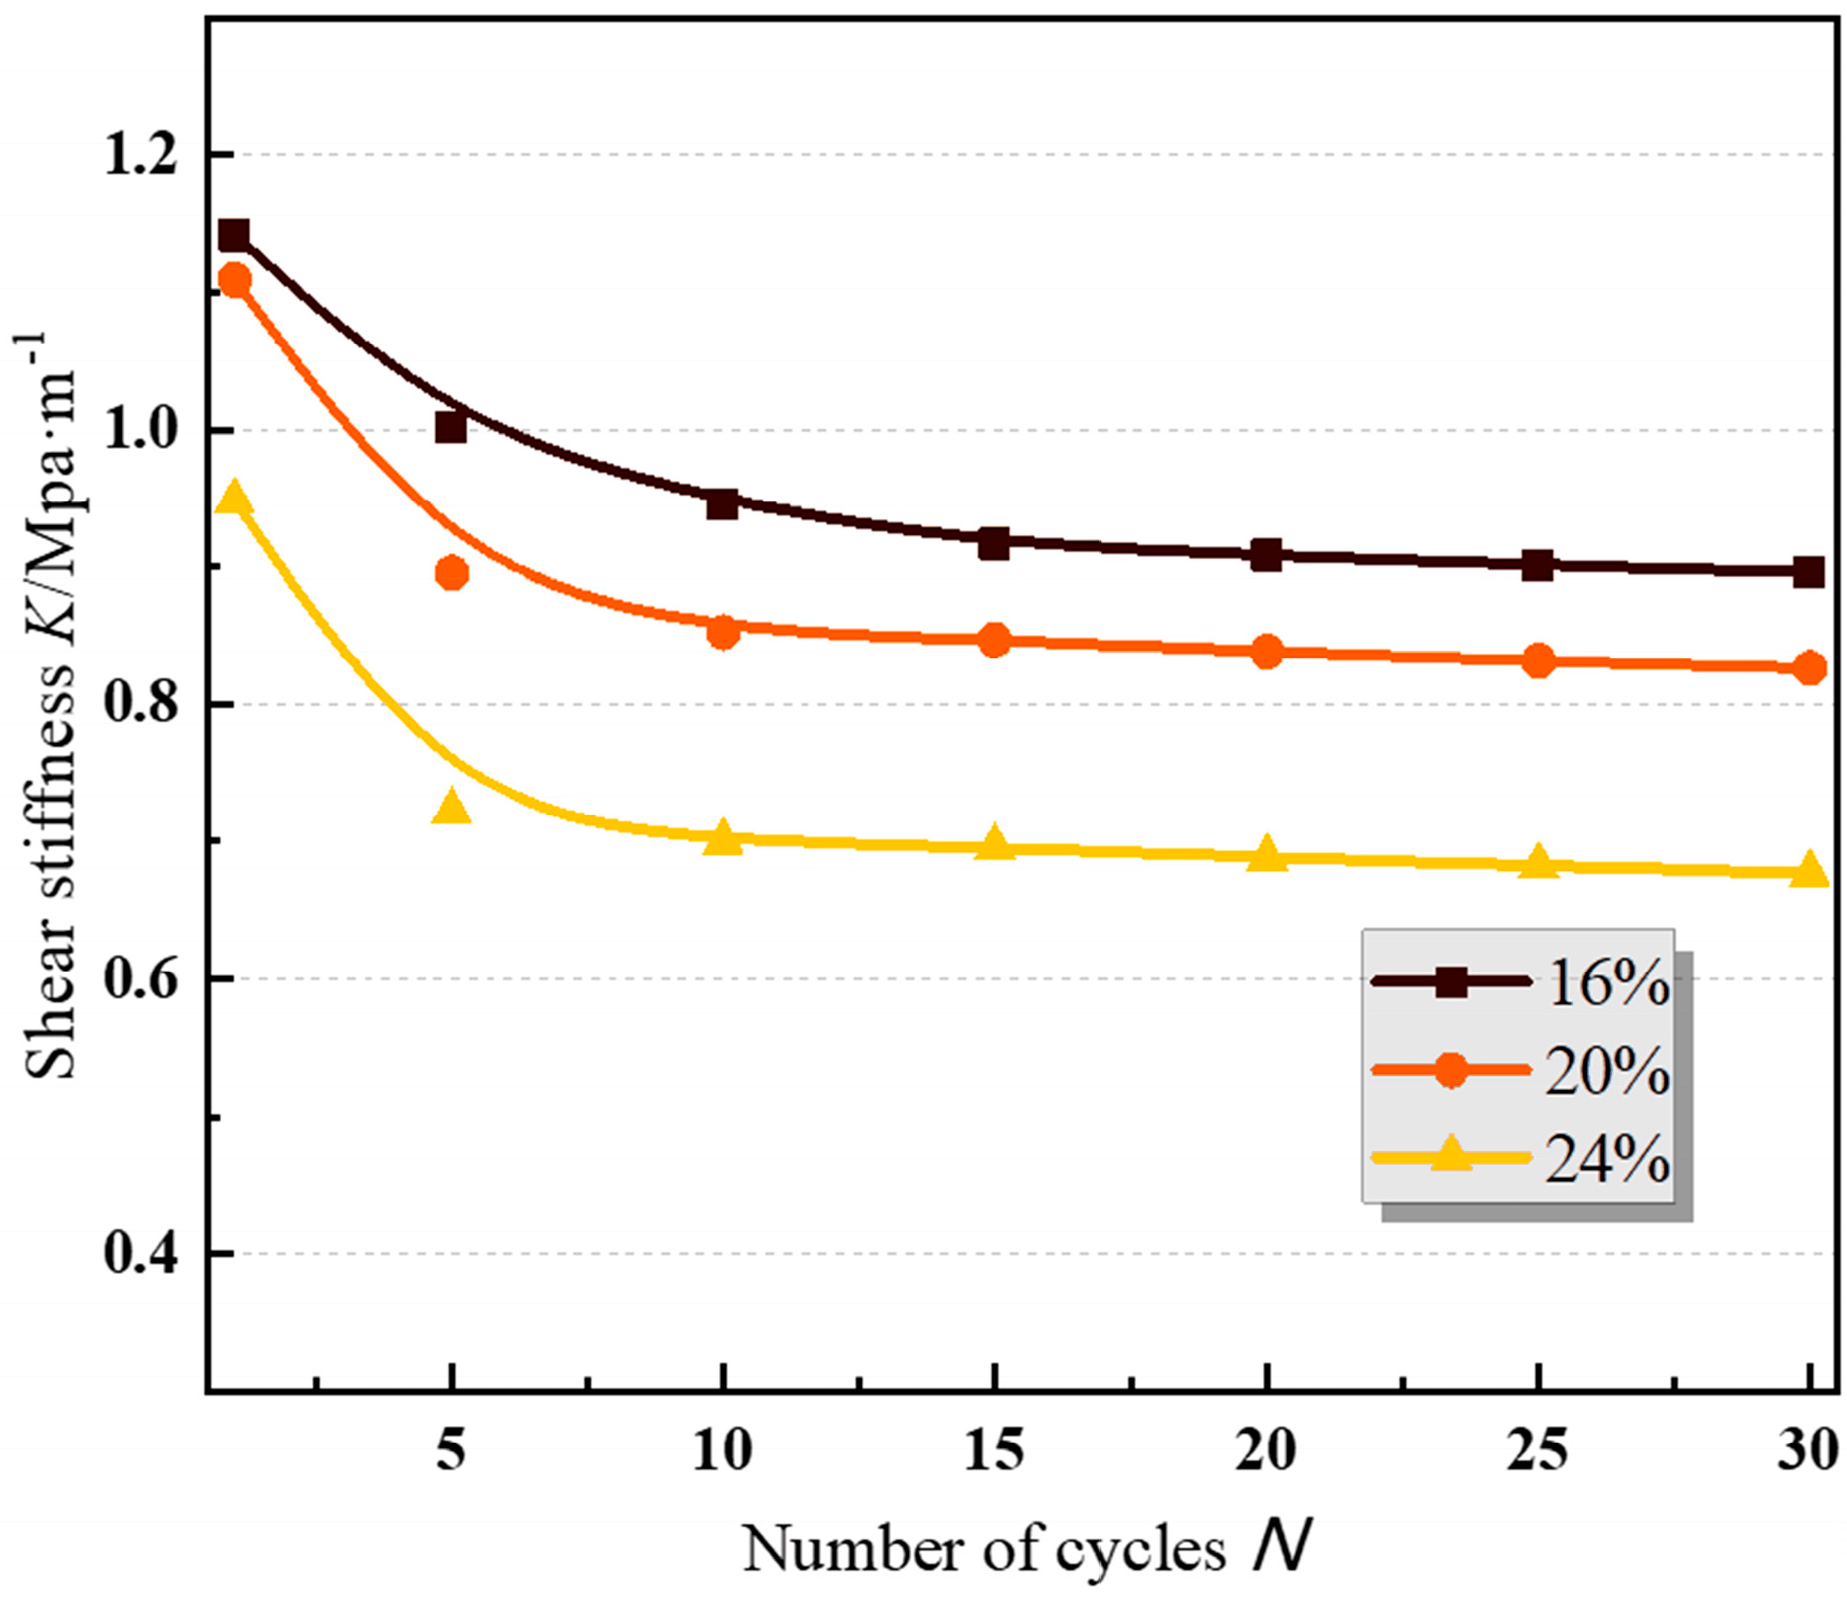
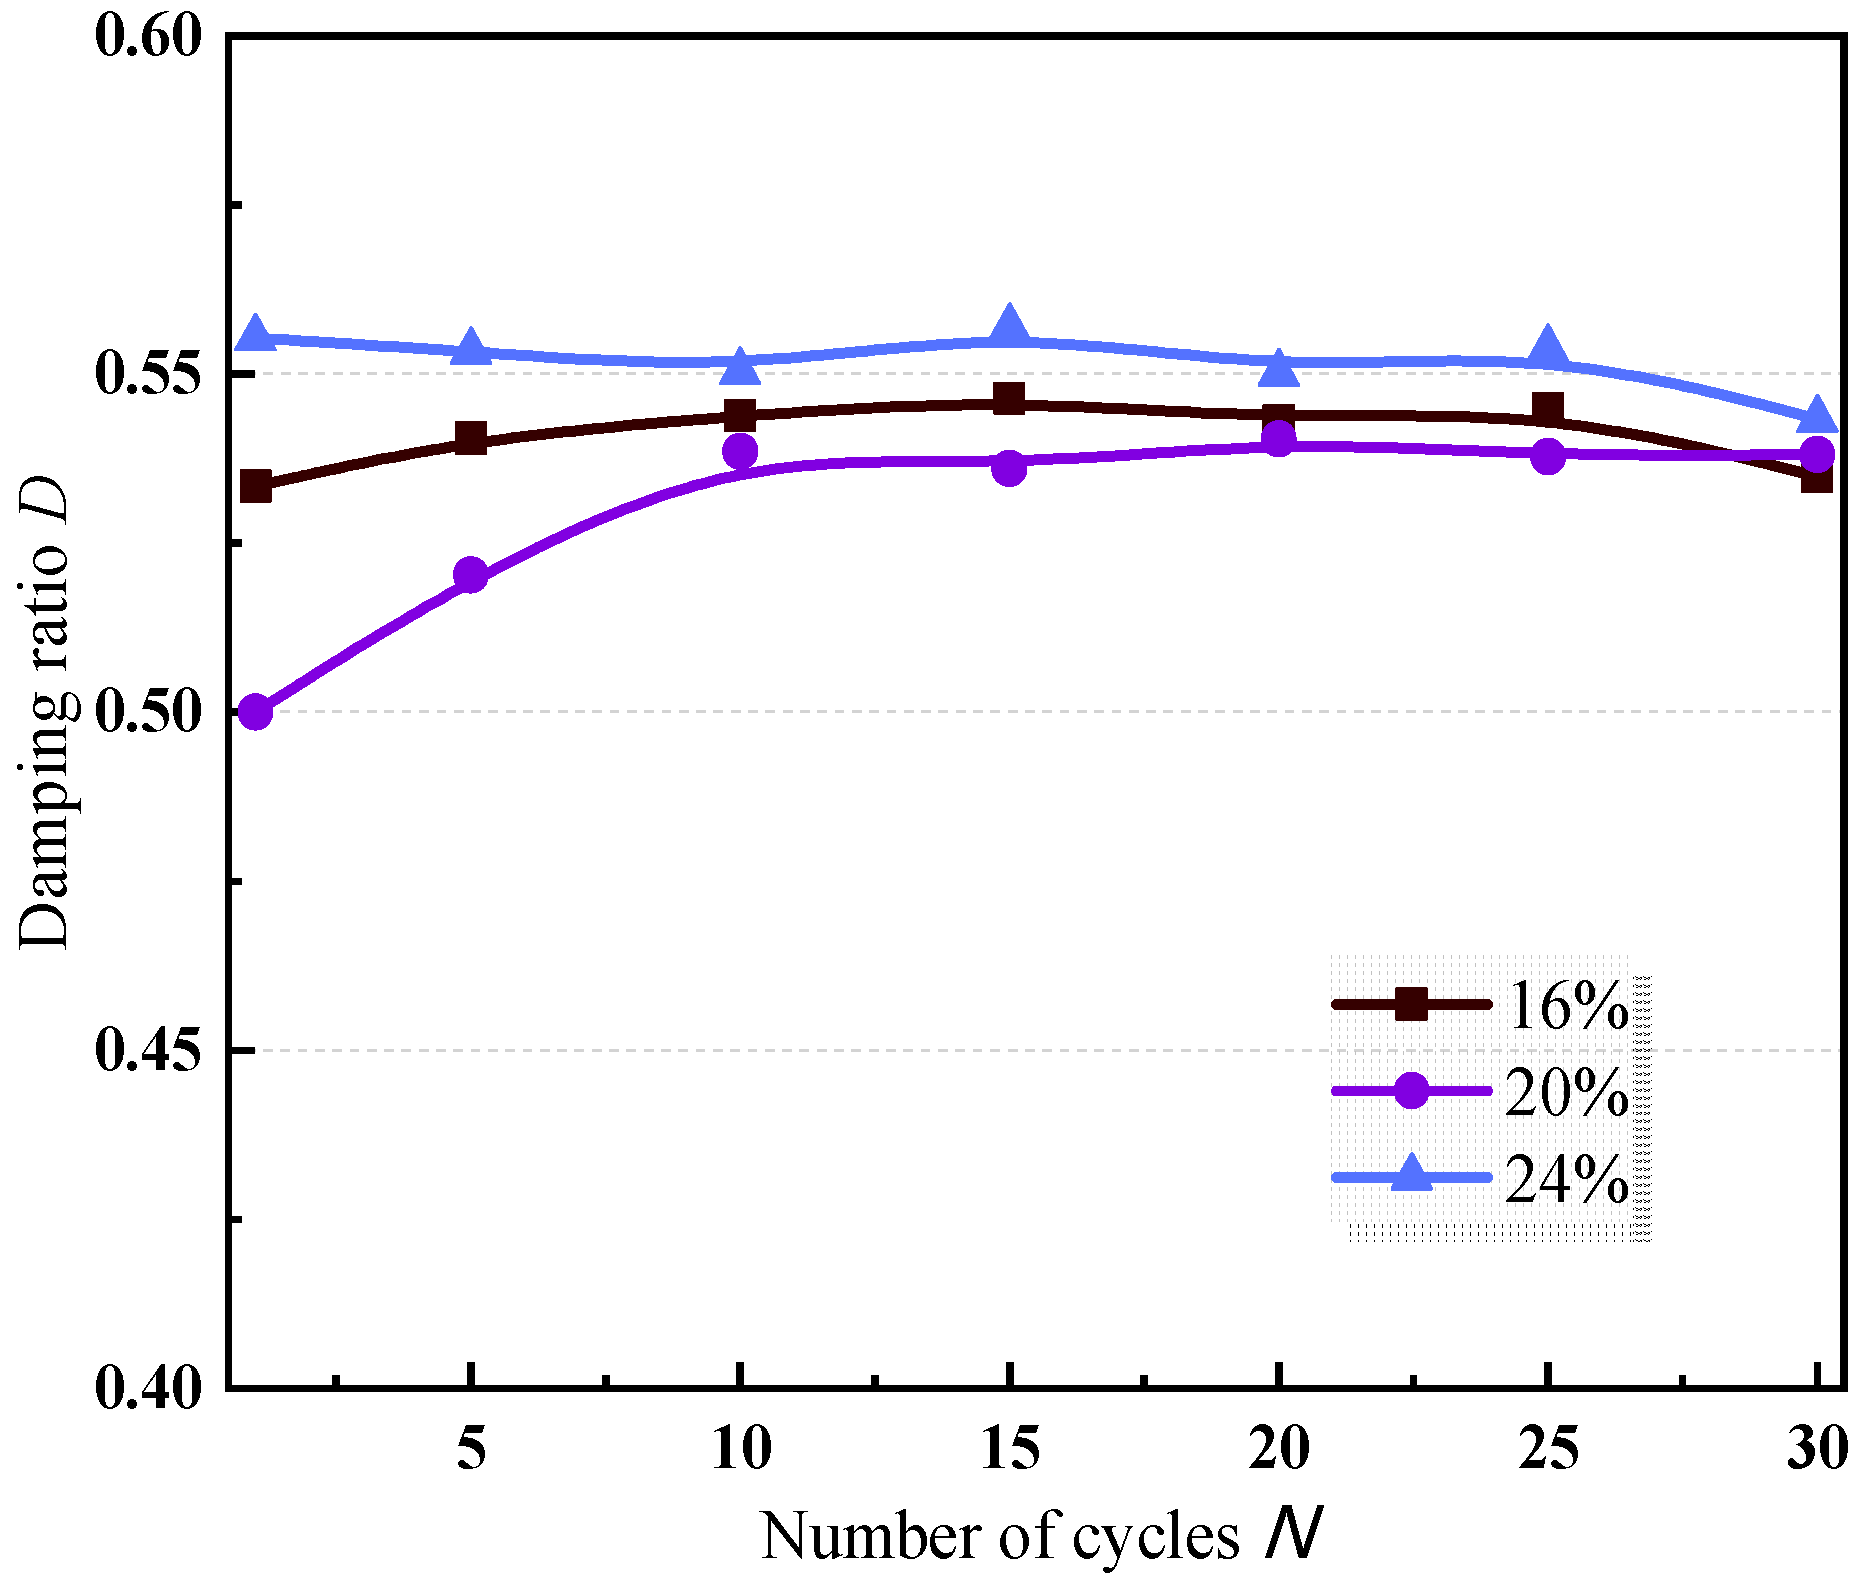
3.2.4. The Influence of Water Content
Figure 23 and
Figure 24 present the interface
K–N and
D–N curves under different water content conditions (test groups 6, 7, and 8). The
K–N curve shows that the relationship between the water content and the shear stiffness was the same as the relationship between the water content and the shear strength.
The
D–N curve in
Figure 24 shows that the relationship between water content and damping ratio was complex and did not show a general rule. For the soil sample with a high water content, its damping ratio was relatively large, indicating that the energy dissipation of the interface of the soil sample with a high water content under the action of cyclic shear was fast because the interface was near a saturation state. As the number of cycles increased, some water may have flowed out during the shear process, which decreased the water content, leading to a downward trend in the damping ratio. The damping ratio of 20% water content, which was closer to the optimal moisture content, was greater than that of the 16% condition, which may have been related to many factors, such as the compactness and suction of the unsaturated soil matrix [
34]. The reasons will be further explored and analyzed. In addition, the damping ratio under the three water contents tended to reach a specific value with the increase in the cycle number. The results indicated that the difference in damping ratio caused by the water content gradually was reduced, resulting in the convergence of energy dissipation at the interface in the late period of cyclic shear.
4. Conclusions
In this work, using a JAW-500 apparatus, a series of cyclic shear tests were carried out on the steel–silt interfaces concerning a background of the Yellow River Delta. The results indicated that the normal stress and shear amplitude can affect the steel–silt interface’s shear strength, shear stiffness, and damping ratio. The roughness and water content can significantly influence the variations in shear strength, shear stiffness, and damping ratio with the number of cycles. The following conclusions may be drawn based on the current results:
- (1)
Generally, three distinctive stages appeared in the curve of the peak shear stress: the elastic stage, in which the shear stress changed rapidly (the first five cycles); the plastic stage, in which the shear stress changed slowly (5–10 cycles), and the shear failure stage, in which shear stress equilibrium was achieved (10–30 cycles). The shear strength, shear stiffness, and damping ratio decreased, and the energy dissipation tended to be asymptotic with the increase in the cycle number.
- (2)
The normal stress conditions significantly influenced the action of the cyclic interface weakening. As the normal stress increased, the degree of interface weakening increased. At the same time, the shear strength and shear stiffness of the interface increased while the damping ratio decreased.
- (3)
With the increase in the shear amplitude, the degree of the interface weakening, the shear strength, the damping ratio, and the energy dissipation increased, while the shear stiffness also decreased.
- (4)
As the roughness increased, the shear strength’s weakening became apparent and the energy dissipation became fast.
- (5)
The shear strength and stiffness increased when the water content decreased. The weakening degree of the interface reached its maximum near the optimal water content.
Author Contributions
Conceptualization, Q.Y. and P.Y.; formal analysis, Y.G. and Q.W.; data curation, S.J. and P.Y.; writing—original draft preparation, P.Y. and H.L.; writing—review and editing, Q.Y. and P.Y.; visualization, M.X. and P.Y.; project administration, J.D.; funding acquisition, J.D. and P.Y. All authors have read and agreed to the published version of the manuscript.
Funding
This research was funded by the Scientific Research Fund Project of the Qingdao Geo-Engineering Surveying Institute (grant no. 2022-QDDZYKY06) and the Shandong Provincial Bureau of Geology and Mineral Resources (grant no. KY202223).
Institutional Review Board Statement
Not applicable.
Informed Consent Statement
Not applicable.
Data Availability Statement
The data presented in this study are available on request from the corresponding author.
Conflicts of Interest
The authors declare no conflict of interest.
References
- Yang, Q.; Pan, G.; Liu, H.J.; Wang, Q. Bearing capacity of offshore umbrella suction anchor foundation in silty soil under varying loading modes. Mar. Georesources Geotechnol. 2018, 36, 781–794. [Google Scholar] [CrossRef]
- Carneiro, D.; White, D.J.; Danziger, F.A.B.; Ellwanger, G. A novel approach for time-dependent axial soil resistance in the analysis of subsea pipelines. Comput. Geotech. 2015, 69, 641–651. [Google Scholar] [CrossRef]
- Pra-Ai, S.; Boulon, M. Soil–structure cyclic direct shear tests: A new interpretation of the direct shear experiment and its application to a series of cyclic tests. Acta Geotech. 2017, 12, 107–127. [Google Scholar] [CrossRef]
- Rehman, Z.; Zhang, G. Three-dimensional elasto-plastic damage model for gravelly soil-structure interface considering the shear coupling effect. Comput. Geotech. 2021, 129, 103868. [Google Scholar] [CrossRef]
- Wang, T.L.; Wang, H.H.; Hu, T.F.; Song, H.-F. Experimental study on the mechanical properties of soil-structure interface under frozen conditions using an improved roughness algorithm. Cold Reg. Sci. Technol. 2019, 158, 62–68. [Google Scholar] [CrossRef]
- Li, L.; Fall, M.; Fang, K. Shear behavior at interface between compacted clay liner–geomembrane under freeze-thaw cycles. Cold Reg. Sci. Technol. 2020, 172, 103006. [Google Scholar] [CrossRef]
- Li, Y.J.; Guo, Z.; Wang, L.Z.; Li, Y.; Liu, Z. Shear resistance of MICP cementing material at the interface between calcareous sand and steel. Mater. Lett. 2020, 274, 128009. [Google Scholar] [CrossRef]
- Liu, X.L.; Zhang, H.; Zheng, J.W.; Guo, L.; Jia, Y.; Bian, C.; Li, M.; Ma, L.; Zhang, S. Critical role of wave–seabed interactions in the extensive erosion of Yellow River estuarine sediments. Mar. Geol. 2020, 426, 106208. [Google Scholar] [CrossRef]
- Liu, X.L.; Zheng, J.W.; Zhang, H.; Zhang, S.-T.; Liu, B.-H.; Shan, H.-X.; Jia, Y.-G. Sediment Critical Shear Stress and Geotechnical Properties along the Modern Yellow River Delta, China. Mar. Georesources Geotechnol. 2018, 36, 875–882. [Google Scholar] [CrossRef]
- Zhang, H.; Liu, X.L.; Jia, Y.G.; Du, Q.; Sun, Y.; Yin, P.; Shan, H. Rapid consolidation characteristics of Yellow River–derivedsediment: Geotechnical characterization and its implications for the deltaicgeomorphic evolution. Eng. Geol. 2020, 270, 105578. [Google Scholar] [CrossRef]
- Ren, Y.; Xu, G.; Xu, X.; Zhao, T.; Wang, X. The initial wave induced failure of silty seabed: Liquefaction or shear failure. Ocean Eng. 2020, 106990. [Google Scholar] [CrossRef]
- Yu, P.; Liu, C.; Liu, H.J. Large–scale direct shear test study on the silt–steel interface in the Yellow River Delta. Period. Ocean Univ. China 2021, 51, 71–79. (In Chinese) [Google Scholar]
- Yu, P.; Dong, J.; Liu, H.S.; Xu, R.; Wang, R.; Xu, M.; Liu, H. Analysis of cyclic shear stress–displacement mechanical properties of silt–steel interface in the Yellow River Delta. J. Mar. Sci. Eng. 2022, 10, 1704. [Google Scholar] [CrossRef]
- Guo, X.S.; Nian, T.K.; Zhao, W.; Gu, Z.; Liu, C.; Liu, X.; Jia, Y. Centrifuge experiment on the penetration test for evaluating undrained strength of deep-sea surface soils. Int. J. Min. Sci. Technol. 2022, 32, 363–373. [Google Scholar] [CrossRef]
- Guo, X.S.; Nian, T.K.; Wang, D.; Gu, Z. Evaluation of undrained shear strength of surficial marine clays using ball penetration-based CFD modeling. Acta Geotech. 2022, 17, 1627–1643. [Google Scholar] [CrossRef]
- Liu, J.W.; Cui, L.; Zhu, N.; Han, B. Investigation of cyclic pile-sand interface weakening mechanism based on large-scale CNS cyclic direct shear tests. Ocean Eng. 2019, 194, 106650. [Google Scholar] [CrossRef]
- Lu, Z.H.; Qi, C.Z.; Jin, T.W. Experimental study on the mechanical characteristics of saturated sandy soil under different loading stress paths. Sci. Technol. Eng. 2019, 19, 294–301. (In Chinese) [Google Scholar]
- Wang, Y.H.; Zhang, M.Y.; Bai, X.Y. Experimental research on effect of shear rate on shear strength of clayey soil-concrete interface. J. Civ. Environ. Eng. 2019, 41, 48–54. (In Chinese) [Google Scholar]
- Shang, W.C. Study on the Degenerate Mechanism of Pile–Soil Interface under Cyclic Loading. Master’s Thesis, Qingdao Technological University, Qingdao, China, 2016. (In Chinese). [Google Scholar]
- Li, X.L. Study on the Degenerate Mechanism of Pile–Soil Interface under Cyclic Loading. Master’s Thesis, Qingdao Technological University, Qingdao, China, 2018. (In Chinese). [Google Scholar]
- Oumarou, T.A.; Evgin, E. Cyclic behavior of a sand–steel plate interface. Can. Geotech. J. 2005, 42, 1695–1704. [Google Scholar] [CrossRef]
- Feng, D.K.; Zhang, J.M.; Deng, L.J. Three–dimensional direct and cyclic behavior of a gravel–steel interface from large–scale simple shear tests. Can. Geotech. J. 2018, 55, 1657–1667. [Google Scholar] [CrossRef]
- Vieira, C.S.; Lopes, M.L.; Caldeira, L.M. Sand geotextile interface characterization through direct and cyclic direct shear tests. Geosynth. Int. 2013, 20, 26–38. [Google Scholar] [CrossRef]
- Liu, F.Y.; Ying, M.J.; Yuan, G.H.; Wang, J.; Gao, Z.Y.; Ni, J.F. Particle shape effects on the cyclic shear behaviour of the soil–geogrid interface. Geotext. Geomembr. 2021, 49, 991–1003. [Google Scholar] [CrossRef]
- Taha, A.; Fall, M. Shear behavior of sensitive marine clay–steel interfaces. Acta Geotech. 2014, 9, 969–980. [Google Scholar] [CrossRef]
- Liu, Z.Y. Reciprocating Shear Behavior and Strength Weakening Mechanism of Steel–Soil Interface in Rock–Socketed Filling Pile with Steel Tube. Master’s Thesis, Chongqing Jiaotong University, Chongqing, China, 2017. (In Chinese). [Google Scholar]
- Chen, C. Reciprocating Shear Behavior and Strength Weakening Mechanism of Coarse–Grained Soil–Steel Interface. Master’s Thesis, Chongqing Jiaotong University, Chongqing, China, 2018. (In Chinese). [Google Scholar]
- Nye, C.J.; Fox, P.J. Dynamic shear behavior of a needle–punched geosynthetic clay liner. J. Geotech. Geoenvironmental Eng. 2007, 133, 973–983. [Google Scholar] [CrossRef]
- Fox, P.J.; Ross, J.D.; Sura, J.M. Geomembrane damage due to static and cyclic shear over compacted gravelly sand. Geosynth. Int. 2011, 18, 272–279. [Google Scholar] [CrossRef] [Green Version]
- Lee, K.M.; Manjunath, V.R. Soil–geotextile interface friction by direct shear tests. Can. Geotech. J. 2000, 37, 238–252. [Google Scholar] [CrossRef]
- Li, M.J.; Fang, H.Y.; Du, M.; Zhang, C.; Su, Z.; Wang, F. The behavior of polymer-bentonite interface under shear stress. Constr. Build. Mater. 2020, 248, 118680. [Google Scholar] [CrossRef]
- Ying, M.J.; Liu, F.Y.; Wang, J.; Wang, C.; Li, M. Coupling effects of particle shape and cyclic shear history on shear properties of coarse-grained soil–geogrid interface. Transp. Geotech. 2020, 27, 100504. [Google Scholar] [CrossRef]
- Jotisankasa, A.; Rurgchaisri, N. Shear strength of interfaces between unsaturated soils and composite geotextile with polyester yarn reinforcement. Geotext. Geomembr. 2018, 46, 338–353. [Google Scholar] [CrossRef]
- Shahrour, I.; Rezaie, F. An elastoplastic constitutive relation for the soil-structure interface under cyclic loading. Comput. Geotech. 1997, 21, 21–39. [Google Scholar] [CrossRef]
Figure 1.
Silt in the Yellow River Delta. (
a) Concept map of the soil classification adapted from Ren et al., 2020 [
11]. (
b) Dry condition. (
c) Wet condition.
Figure 1.
Silt in the Yellow River Delta. (
a) Concept map of the soil classification adapted from Ren et al., 2020 [
11]. (
b) Dry condition. (
c) Wet condition.
Figure 2.
The offshore structures in the Yellow River Delta. (a) The Chengdao offshore oil platform. (b) The Hekou jack-up marine ranching platform.
Figure 2.
The offshore structures in the Yellow River Delta. (a) The Chengdao offshore oil platform. (b) The Hekou jack-up marine ranching platform.
Figure 3.
Large-scale shear instrument. (a) 3D schematic diagram of the shear box. (b) Displacement measuring device. (c) Spring under the shear box.
Figure 3.
Large-scale shear instrument. (a) 3D schematic diagram of the shear box. (b) Displacement measuring device. (c) Spring under the shear box.
Figure 4.
Data acquisition system.
Figure 4.
Data acquisition system.
Figure 5.
Silt particle size curve and physical properties.
Figure 5.
Silt particle size curve and physical properties.
Figure 6.
Steel plates with different roughness levels.
Figure 6.
Steel plates with different roughness levels.
Figure 7.
Shear interface after the test was completed.
Figure 7.
Shear interface after the test was completed.
Figure 8.
Shear strength–number of cycles curve under different normal stress levels.
Figure 8.
Shear strength–number of cycles curve under different normal stress levels.
Figure 9.
Stress ratio–number of cycles curve under different normal stress levels.
Figure 9.
Stress ratio–number of cycles curve under different normal stress levels.
Figure 10.
Shear strength–number of cycles curve under different shear amplitude levels.
Figure 10.
Shear strength–number of cycles curve under different shear amplitude levels.
Figure 11.
Stress ratio–number of cycles curve under different shear amplitude.
Figure 11.
Stress ratio–number of cycles curve under different shear amplitude.
Figure 12.
Shear strength–number of cycles curve under different roughness levels.
Figure 12.
Shear strength–number of cycles curve under different roughness levels.
Figure 13.
Stress ratio–number of cycles curve under different roughness levels.
Figure 13.
Stress ratio–number of cycles curve under different roughness levels.
Figure 14.
Shear strength–number of cycles curve under different water content levels.
Figure 14.
Shear strength–number of cycles curve under different water content levels.
Figure 15.
Stress ratio–number of cycles curve under different water content conditions.
Figure 15.
Stress ratio–number of cycles curve under different water content conditions.
Figure 16.
Stiffness and damping ratio.
Figure 16.
Stiffness and damping ratio.
Figure 17.
Shear stiffness–cycle number curve under different normal stress conditions.
Figure 17.
Shear stiffness–cycle number curve under different normal stress conditions.
Figure 18.
Damping ratio–cycle number curve under different normal stress conditions.
Figure 18.
Damping ratio–cycle number curve under different normal stress conditions.
Figure 19.
Shear stiffness–cycle number curve under different shear amplitude levels.
Figure 19.
Shear stiffness–cycle number curve under different shear amplitude levels.
Figure 20.
Damping ratio–cycle number curve under different shear amplitude levels.
Figure 20.
Damping ratio–cycle number curve under different shear amplitude levels.
Figure 21.
Shear stiffness–cycle number curve under different roughness levels.
Figure 21.
Shear stiffness–cycle number curve under different roughness levels.
Figure 22.
Damping ratio–cycle number curve under different roughness levels.
Figure 22.
Damping ratio–cycle number curve under different roughness levels.
Figure 23.
Shear stiffness–cycle number curve under different water content conditions.
Figure 23.
Shear stiffness–cycle number curve under different water content conditions.
Figure 24.
Damping ratio–cycle number curve under different water content conditions.
Figure 24.
Damping ratio–cycle number curve under different water content conditions.
Table 1.
Testing scheme.
| Number | Normal Stress
(kPa) | Shear Amplitude
(mm) | Roughness
(mm) | Water Content
(%) | Others |
|---|
| 1 | 100 | 5 | 0.05 | 20 | Number of cycles = 30
Frequency = 0.01 HZ
Shear rate = 1 mm/s |
| 2 | 200 | | | | |
| 3 | 15 |
| 4 | 35 | 0 |
| 5 | 0.025 |
| 6 | 0.05 | 16 | |
| 7 | | | 24 | |
| 8 | 20 | |
| 9 | 300 | 5 | |
| Disclaimer/Publisher’s Note: The statements, opinions and data contained in all publications are solely those of the individual author(s) and contributor(s) and not of MDPI and/or the editor(s). MDPI and/or the editor(s) disclaim responsibility for any injury to people or property resulting from any ideas, methods, instructions or products referred to in the content. |
© 2023 by the authors. Licensee MDPI, Basel, Switzerland. This article is an open access article distributed under the terms and conditions of the Creative Commons Attribution (CC BY) license (https://creativecommons.org/licenses/by/4.0/).

 ,
, 


