Article

Design of Control System for Multistage Distillation Seawater Desalination Device Driven by Photovoltaic-Thermal

1
College of Mechanical Naval Architecture & Ocean Engineering, Beibu Gulf University, Qinzhou 535011, China
2
Guangxi Key Laboratory of Ocean Engineering Equipment and Technology, Qinzhou 535011, China
3
Key Laboratory of Beibu Gulf Offshore Engineering Equipment And Technology, Beibu Gulf University, Qinzhou 535011, China
4
CSSC Guangxi Shipbuilding and Offshore Engineering Co., Ltd., Qinzhou 535011, China
*
Authors to whom correspondence should be addressed.
J. Mar. Sci. Eng. 2023, 11(1), 222; https://doi.org/10.3390/jmse11010222
Submission received: 22 December 2022 / Revised: 3 January 2023 / Accepted: 10 January 2023 / Published: 14 January 2023
(This article belongs to the Special Issue Advanced Marine Electronic Applications in Smart Ocean)

Abstract

:
This research proposes a seawater desalination system driven by photovoltaic and solar thermal energy for remote regions such as islands and seaside villages where fresh water is not accessible. The performance of this system is demonstrated through experiments, and the main concerns are the output of the photovoltaic power generation system, power quantity, water yield, and the loads under different solar irradiance and temperature. In this system, a PLC is used as the controller to adjust the water pump by the collection and processing of sensor data. A load switching time system is designed to select different operating schemes under different environments in order to save energy. The control method of this system is developed to ensure that the photovoltaic power generation system does not undervoltage while maintaining the normal operation of the desalination system. An improved Perturbation and Observation (P&O) algorithm is also proposed as a new Maximum Point Power Tracking (MPPT) method to solve the problem of misjudgment and oscillation after tracking the maximum power point (MPP) in the traditional P&O algorithm. The simulation test in the MATLAB/Simulink environment shows that when external irradiance changes, the improved P&O algorithm can track the MPP faster than the traditional P&O algorithm, and the amplitude of oscillation on the MPP is smaller. The hardware experiments show that this system can operate stably and flexibly, and it is capable of producing 5.18 kWh of electric energy and 335.81 kg of freshwater per day. The maximum yield of the unit can reach 565.75 kg per day and the maximum daily power generation is 8.12 kWh.

1. Introduction

The vast majority of the islands in the world are uninhabitable, and many of them are border islands with only a few guards on duty and are extremely short of fresh water and power resources [1,2,3]. Supplying water and electricity with traditional methods may cost the price of destroying the local fragile ecological environment, and therefore a healthy and environmentally friendly seawater desalination system is urgently needed to protect the ecosystem and environment of remote regions. In recent years, many desalination technologies have been developed for this purpose, including Multi-Effect Distillation (MED), Reverse Osmosis (RO), Multistage Flash (MSF), and Humidification and Dehumidification (HDH). However, the RO method is not suitable for treating seawater with high concentrations, and its equipment requires heavy maintenance, leading to serious environmental pollution. The RO system also takes a large amount of power input, which is not possible to supply in most of the remote regions. The MSF system requires a large amount of seawater to circulate, and the power consumption of the pumps is too high to use for remote areas. The RO and MSF technologies have been developed for large-scale production of freshwater and are consequently not suitable for small populations.
In the thermal-based desalination technologies, saline water is heated to generate vapor that is condensed to produce fresh water (distillate), such as solar distill desalination [3,4,5,6,7,8,9], HDH desalination [7,8,9,10,11,12,13,14,15,16], MED [13,14,15,16], MSF [17,18,19], Vapor Compression Distillation (VCD), Mechanical VCD (MVCD) [20,21,22], Thermal Vapor Compression (TVC) [23,24], freezing desalination [25,26,27], and hydrate formation desalination [28,29].
The membrane-based desalination technologies include RO technology, driven by hydraulic power (pressure difference) [30,31,32,33], Electrodialysis (ED), driven by an electrical potential difference (DC) [34,35,36,37,38], and Membrane Distillation (MD), driven by temperature difference [39,40,41,42,43,44,45,46,47]. Other technologies include adsorption desalination via adsorption cooling cycle [48,49,50], hydrogel desalination [51,52], and ionic exchange desalination [53].
Among these technologies, RO is the most widely used commercial seawater desalination technology, and ED is most suitable for brackish water desalination [54,55], while MED and MSF are the most widely used thermal-based desalination technologies [56]. Neither the RO system, which requires uninterrupted power supply, nor the MED/MSF are appropriate for the application of small-scale saline water desalination. The MSF system requires a large amount of seawater to circulate, and the power consumption of the pumps is too high to use for remote areas.
Therefore, efficient small-to-medium scale desalination systems combined with renewable energy (such as solar energy) are needed. The HDH system is one of the technologies powered by renewable energy or low-grade energy sources [57], including solar, geothermal, and low-grade energy such as the waste energy from photovoltaic thermal (PV/T) panels, refrigeration and heat pump systems, and power plants.
Wu [58] combined a multistage humidified solar desalination system with a Fresnel lens concentrator, in which the evaporator and solar collector are combined, and the solar energy is heated through the concentrator to spread out the film of seawater on the filler, causing the seawater to evaporate. The relationship between the water production rate of the device and the surface temperature of the receiver under the three-stage isothermal heating condition was measured. Compared with the theoretical calculation results, the maximum water production rate of the system is 3.4 kg/h and the GOR is 2.1 when the average radiation value is 867 W/m2.
Liu et al. [59] built a set of ramp type solar chimney humidification and dehumidification desalination systems, in which the water in the insulation pool is pumped by the pump to the heat exchange surface in the heat collecting shed and spread into liquid film, which can absorb heat and evaporate. Based on a simple structure and low cost, this device can produce water stably and is 52.1% more efficient than the system combined with chimney power generation and seawater desalination under the same working conditions.
The electricity current produced by the PV system varies depending on the daylight illumination and environmental temperature [60], and this is the main challenge to implement MPPT on a PV system [61]. There are two types of MPPT tracker being widely used nowadays, based on mechanical design and electrical design, respectively [62]. The mechanical MPPT tracker is also known as a solar tracker, which increases energy production by up to 40% [63]. However, due to the high cost of the mechanical tracking device, this equipment is recommended for industry scale applications [64]. The electrical MPPTs are greatly affected by the power–voltage and current–voltage curves, and therefore the optimal operation point can be tracked and adjusted [65]. The efficiency of the PV system depends on the operation point on the characteristic curve of the PV panel [66,67,68]. In addition, the Maximum Power Point (MPP) on the characteristics curve is influenced by the sunlight illumination and temperature. Figure 1 and Figure 2 illustrate the variation of MPP and the characteristic curves of voltage and power for different operating conditions. It can be seen that the temperature has little influence on the photovoltaic power generation, but the sunlight illumination plays a decisive role on the power output. In order to extract the maximum available power from the PV panel, a DC–DC converter is interfaced with the panel and controlled by a suitable MPPT algorithm. There are many MPPT algorithms available to increase the efficiency of the PV panel, the effectiveness of which is decided by both the steady state oscillations and the tracking time [69,70,71,72,73,74].
The Perturbation and Observation (P&O) algorithm is based on an intentional and periodic perturbation on the control command with a subsequent observation and evaluation of the system output [75]. In the PV system, the perturbation is generated through a variation in the voltage and current, such that the power of the PV can be measured to calculate ΔP/ΔV for MPP operation.
An interesting example of simulated implementation of P&O was given by Murtaza et al. [76], who demonstrated an algorithm for a two-stage coordinated PV distributed system to avoid the sensitive step size of conventional PV systems [77].
The P&O system is one of the most popular MPPT algorithms in industry due to its simplicity [78,79]; however, it is still vulnerable to the illumination level [80,81]. The Incremental Conductance (INC) technique is widely used for MPPT applications because of its high accuracy compared with the P&O. The calculation of the incremental change in conductance can be performed by evaluating the effect of voltage change [82]. The rate of slope of the P–V curve for MPP is positive when MPP is on the right side and negative when MPP is on the left side [83]. The controller injects a slight change in the duty cycle and observes the behavior of the conductance [84]. This algorithm was implemented in experimental conditions where a regulated step size routine is in place [85]; however, the trade-off between system dynamics and the steady state accuracy is missing in this scheme [86].
The INC shows some performance in the power–voltage curve, but alternatively, INR employs the power current to determine the sign of the following perturbation and was examined via experiment [87,88], and it was found that the convergence to the MMP is slower than P&O and INC [89].
In recent years, some artificial intelligence algorithms have also achieved good performance for the control method, such as fast responses, overshoot avoidance, and low fluctuations in illumination or temperature changes so that the operative point can stay at the MPP [90]. These algorithms include Fuzzy Logic Control (FLC), Particle Swarm Optimization (PSO), and Genetic Algorithm (GA).
This research introduces a multistage distillation seawater desalination system based on HDH technology to improve the energy consumption level. In this system, solar energy is used to provide heat and electrical energy for the operation of the system. This system can improve the utilization rate of solar energy and freshwater yield with minimum energy consumption. An improved P&O algorithm is also proposed in this paper to optimize the control method. Compared with the original P&O algorithm, the proposed version tracks the MPP more quickly, and the fluctuation in the output power is small under the stable state, which greatly improves the photovoltaic power generation efficiency. The innovation of this paper lies in the complete use of solar energy to provide energy for the HDH desalination system, and the designed control system can choose different operation modes under different environmental conditions to ensure that the photovoltaic power generation system does not undervoltage while maintaining the operation of the desalination system.
This paper reviews the related works of seawater desalination technology and MPPT technology in the first section. The second section introduces the principle of the proposed HDH seawater desalination theory and the data indicators for evaluating the performance of the seawater desalination system. In the third section, the control logic of the control system is determined according to the operation state, and an improved optimization algorithm is proposed. In the fourth section, a control system is developed and verified with experiments, and the experimental data are analyzed and processed to test the stability and feasibility of the control system. Finally, a conclusion is drawn based on the experimental results and analysis.

2. System Composition

The proposed control system is required to control two modules: the photovoltaic power generation module and the seawater desalination module.

2.1. Principle of Seawater Desalination Technology with HDH

The humidification–dehumidification of seawater desalination technology is to separate the heating, evaporation, and condensation processes, so that the energy utilization efficiency of heat and mass transfer process can be improved with only a simple control method. Using solar to provide heat energy for the humidification–dehumidification seawater desalination system can not only save the investment cost of the desalination device, but also reduce the pollution to the environment. Based on the above characteristics, the solar humidification–dehumidification seawater desalination system is considered as one of the most promising technologies for the efficient use of solar energy to produce fresh water [91,92]. In the HDH scheme, the seawater enters the dehumidifier and is preheated by the heat generated by the condensation of the hot and humid air followed by a humidifier, and the water is heated by the hot water provided by the heat collecting tank in the heat exchanger. After that, the air in the humidifier can be heated and humidified by spraying to turn it into hot and humid air. A fan is used to keep the strong circulation of hot and humid air, which is blown into the dehumidifier to heat the initial seawater and condense to produce fresh water.
This research is based on a two-stage solar humidification–dehumidification seawater desalination device, and compared with a single-stage one, the utilization times of condensation latent heat of humid and hot air and the utilization efficiency of heat of this device can be improved. A flowchart shown in Figure 3 describes the working principle of this device.
The two-stage humidification–dehumidification seawater desalination unit divides the dehumidification tower and the humidification tower into low-temperature dehumidification tower, high-temperature dehumidification tower, low-temperature humidification tower, and high-temperature humidification tower, respectively, so as to achieve the goal of repeatedly reusing the vaporization latent heat released during the condensation of hot and humid air. In addition, the high temperature humidification tower is used to reheat the incompletely evaporated seawater through a heat exchanger and reuse it in order to recover the functional heat contained in the brine. The following theoretical derivation is calculated to determine which metrics are needed to evaluate the efficiency of the control system and to design control methods. The Gain-Output Ratio (GOR) is a dimensionless ratio between the total fresh water and the steam consumed in the seawater desalination system [93], and it is an important parameter to measure the thermal performance. The higher the performance coefficient, the higher the rate of utilization for the seawater desalination [94], such that:
G O R = M e h f g Q t o t
where M e is the freshwater flow rate (m3/h), h f g is the latent heat of vaporization (kJ/kg), and Q t o t is the total energy for heating (kJ). According to the energy conservation relationship, the calculation formula of Q t o t can be given as:
Q t o t = q m w c p w t w i n t w o u t
where q m w is the seawater flow in the heat exchanger (m3/h), t w o u t   is the temperature of seawater flowing out of the heat exchanger (°C), t w i n is the temperature of seawater flowing into the heat exchanger (°C), and c p w is the specific heat capacity of seawater at constant pressure (kJ/(kg·K)), which is given by [95]:
c p w = ( 4206.8 1.1262 t w + 1.2026 × 10 2 t w 2 + 6.8777 × 10 7 t w 3 × 10 3                                                          
where t w refers to the seawater temperature (°C). According to reference [96], the calculation formula of h f g   can be given as:
h f g = 2501.897149 2.407064037 t w 1 + 1.192217 × 10 3 t w 1 2 1.5863 × 10 5 t w 1 3
where t w 1 refers to the condensation temperature (°C).
It can be inferred from the above formula that metrics such as seawater temperature, flow, and freshwater output in and out of the heat exchanger is required in order to evaluate the efficiency of the seawater desalination device and the control system. Therefore, the temperature sensor and the liquid level sensor are used to measure the exact temperature.
Figure 4 shows the block diagram of the two-stage HDH seawater desalination device and the heat collection cycle device.
The proposed system requires 6 pumps, 2 fans, and several sensors and controllers to realize automatic operation. The heat collecting circulation system mainly provides heat energy for the seawater desalination system. The M1 and M2 pumps are used to support the circulation of hot water between the heat collecting tank and the heat collector, and also to fulfil the function of filling seawater when needed. The M3 pumps seawater into the desalination system, and the M4 and M5 fans are used to realize the function of heat exchange between the desalination system and the heat collection circulation system, and the heat generated by the heat collecting circulation system is used for seawater desalination. The M6 pump helps to circulate the seawater in the desalination system, and M7 and M8 fans keep the hot and humid air circulating in the desalination system. The freshwater yield from the output of this system over time is measured by a high-precision liquid level sensor and is shown in Figure 5. The data are collected by communicating with PLC through 4~20 mA signals, and the liquid level of the freshwater tank is collected once an hour. By calculating the product of the bottom area of the freshwater storage vessel and the change of liquid level in unit time, the freshwater output of the desalination system in unit time is obtained. The range of the liquid level sensor used in this research is 0~2 m, and the accuracy is ±0.05 m.
It can be seen from Figure 5 that from 9:00 to 19:00, the seawater desalination system has produced 575 kg of freshwater, and the maximum hourly water yield was 77.85 kg and the average hourly water yield was 52.8 kg. The change curve of water yield of the seawater desalination system with time is shown in Figure 5. It can be seen that when the illumination is strong enough, the working efficiency of the seawater desalination system will be increased, and vice versa.

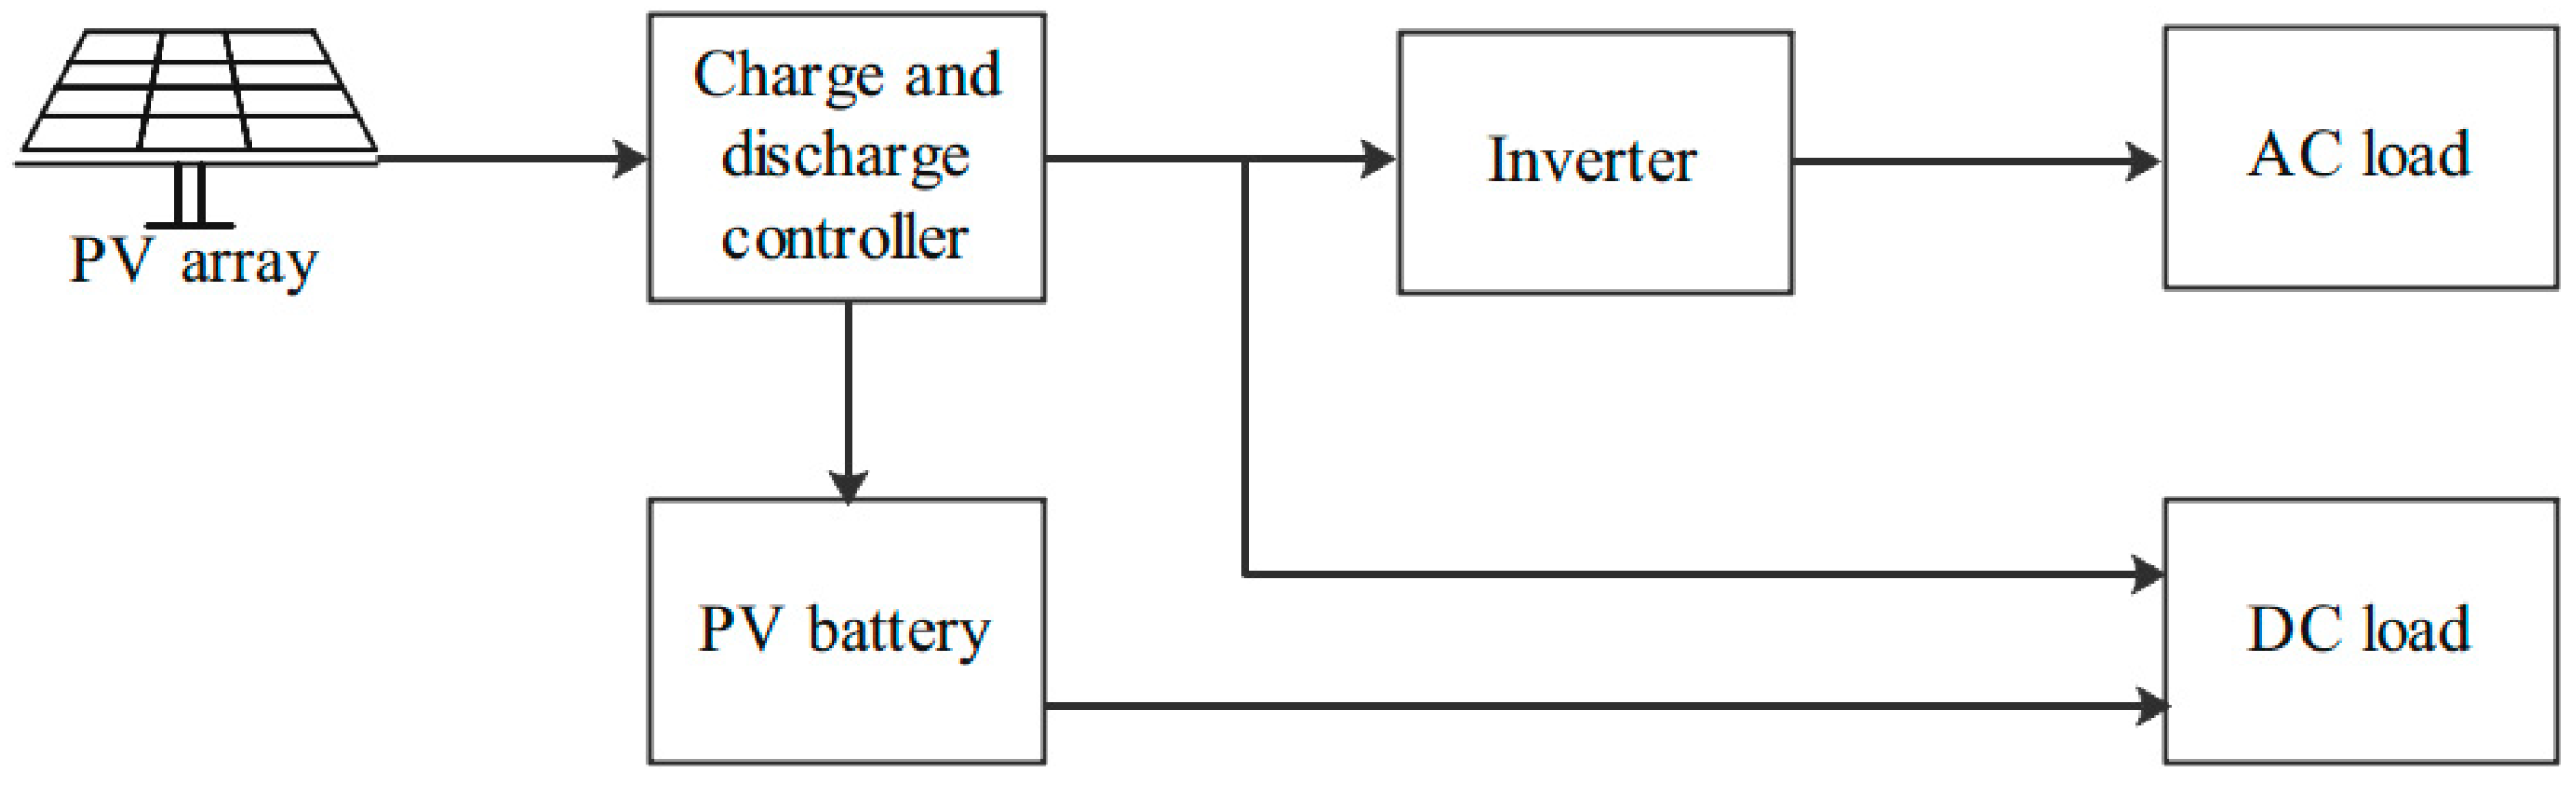
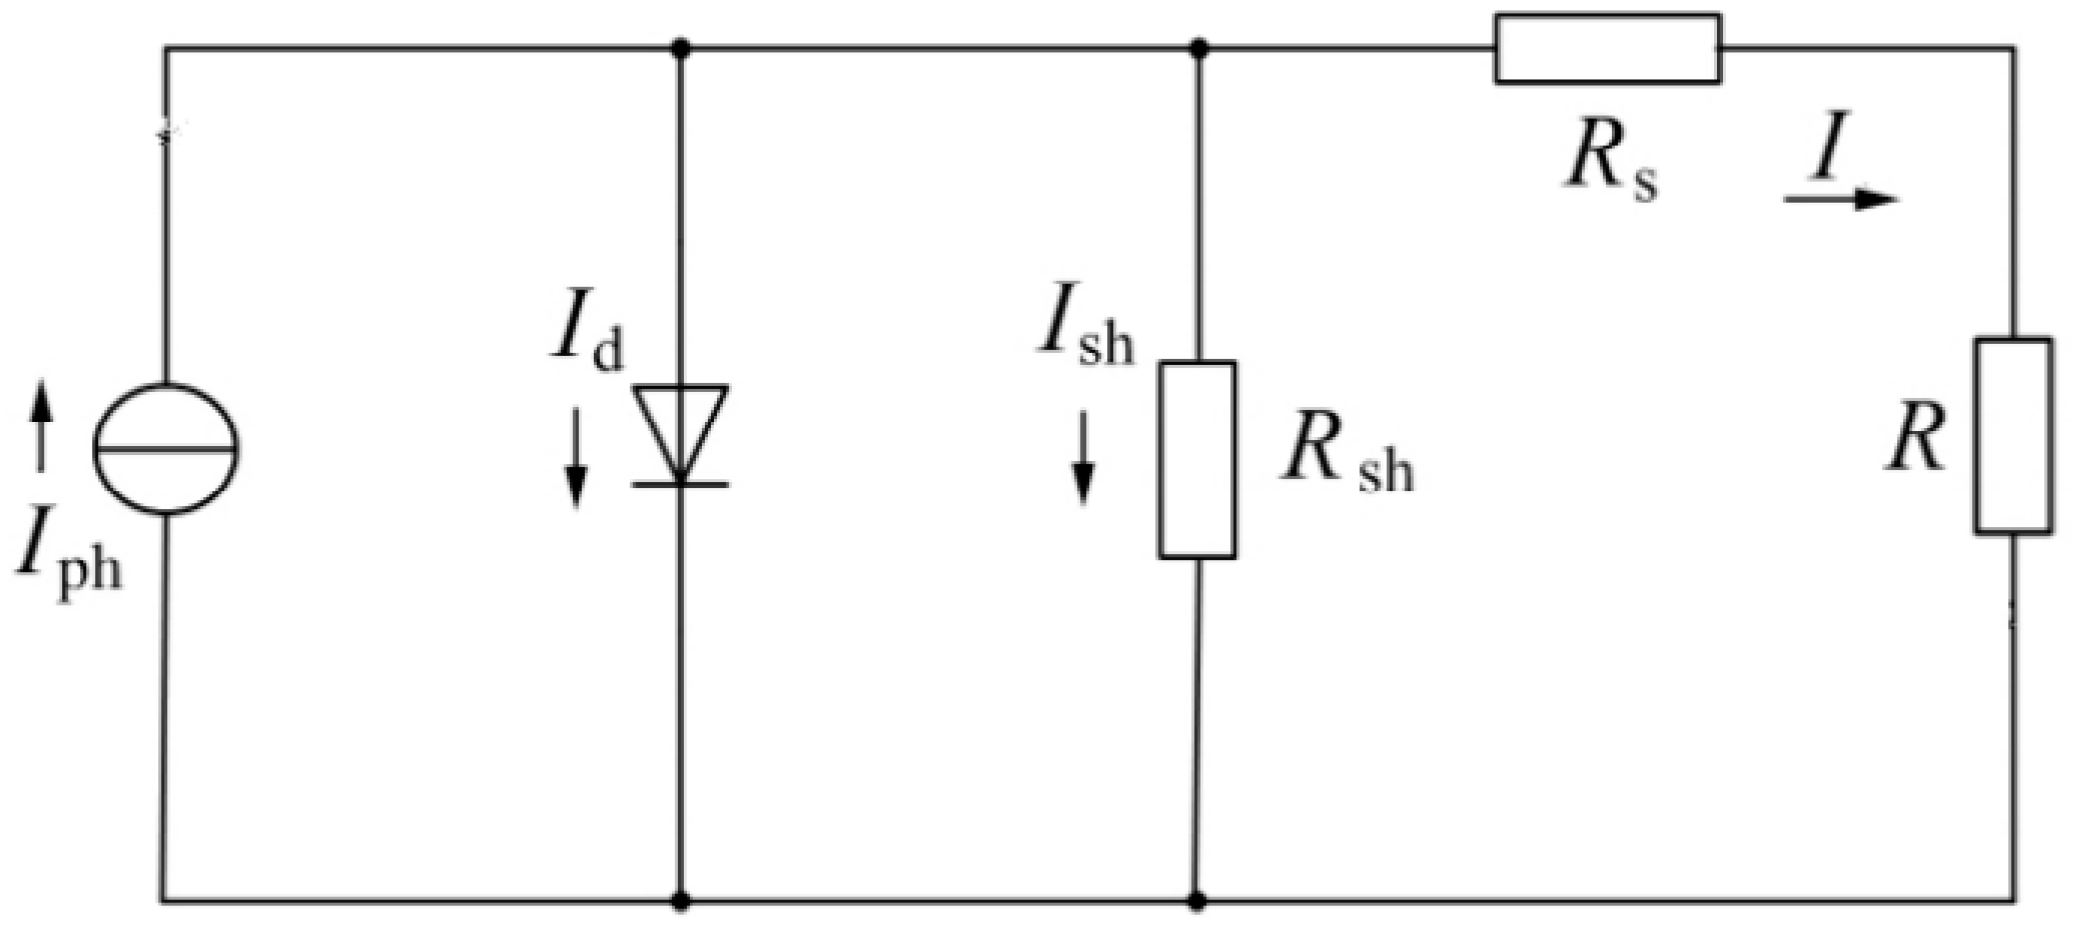
2.2. Principle of Photovoltaic Power Generation System

In the control system, an independent photovoltaic power generation system is comprised of a PV array, a charge and discharge controller, a PV battery, and an inverter. Figure 6 shows the structural diagram of this system. When the electric energy consumed is less than the total load, the PV array starts to charge the PV battery through the charge and discharge controller. When electricity consumption is larger than the output of the photovoltaic array, the PV battery starts to supply power to the load, together with the PV array [97].
The irradiance sensor and the temperature sensor are used to collect the current irradiance, temperature, and parameters of the PV module [98,99], as shown in Table 1, and the real-time power generation of the PV module is calculated using formulas (5–10) [100,101]. The power generation of PV modules is affected by many factors, such as dust, cloud cover, tilt angle, and the inverter efficiency [102,103]. In this research, the empirical coefficient K 1 of 0.88 is taken. The remaining electricity of the photovoltaic cell can be measured by a coulometer. Given by the PV cell manufacturer, I m ,   I s c ,   U m ,   U o c are under specific conditions (temperature T S T C = 25 °C, irradiance s S T C = 1000 W/m2); it is necessary to correct the data to suit the current application through Equations (6)–(9) such that:
T = T a i r + K · S
where T is the PV module temperature under actual illumination intensity (°C) and T a i r is the ambient temperature (°C). K is 0.03 °C·m2/W and S is the actual value of irradiation intensity (W/m2).
I s c = I s c S S S T C 1 + a Δ T
I m = I m S S S T C 1 + a Δ T
where Δ T is the difference between the actual temperature value of the PV module and the temperature under standard conditions. Δ S is the difference between the actual value of irradiation intensity and the standard value of irradiation intensity. S S T C is the standard value of irradiation intensity, 1000 W/m2. I s c , I m are the short circuit current of the PV module under standard conditions (A) and optimum working current (A). I s c ,   I m are the actual short circuit current (A) and optimum current (A). a is the compensation coefficient, 0.0025/°C.
U o c = U o c × 1 c Δ T × ln e + b Δ S
U m = U m × 1 c Δ T × ln e + b Δ S
where e is the base number of the natural logarithm, taking 2.71828. b is the compensation coefficient, 0.0005/°C. c is the compensation coefficient, 0.00288/°C. U o c , U m are the actual open circuit voltage (V) and optimum operating voltage (V), respectively, while U o c ,   U m are the actual open circuit voltage (V) and optimum operating voltage (V), respectively.
P = U m × I m × N × K 1
where P is the output power of the power station (W). N is the number of PV modules. Due to the limited number of fitting points for PV modules, the accuracy of the above calculation process can only meet the general engineering requirements. After verification by relevant scholars, it can be controlled within the range of 6%, which is consistent with the allowable error range of the PV module parameters provided by most photovoltaic panel module manufacturers [104,105].
Irradiance data will be collected once a minute, and the half-hour power generation will be calculated to obtain the irradiance and power generation change curve with time, as shown in Figure 7 (July, 2021).
The maximum power generation of the photovoltaic power generation module may reach 2.01 kW, the average power generation is 1.29 kW, and the daily total power generation is about 12.9 kWh. The relationship curve between irradiance and photovoltaic power is shown in Figure 7. There are two main possible uncertainties in the data shown in the figure. The first one is the data acquisition error caused by the irradiance sensor, and the second one is the error generated when calculating the formula of the original data collected. However, the error caused by the above factors is within 5%, which is acceptable according to industry standard.

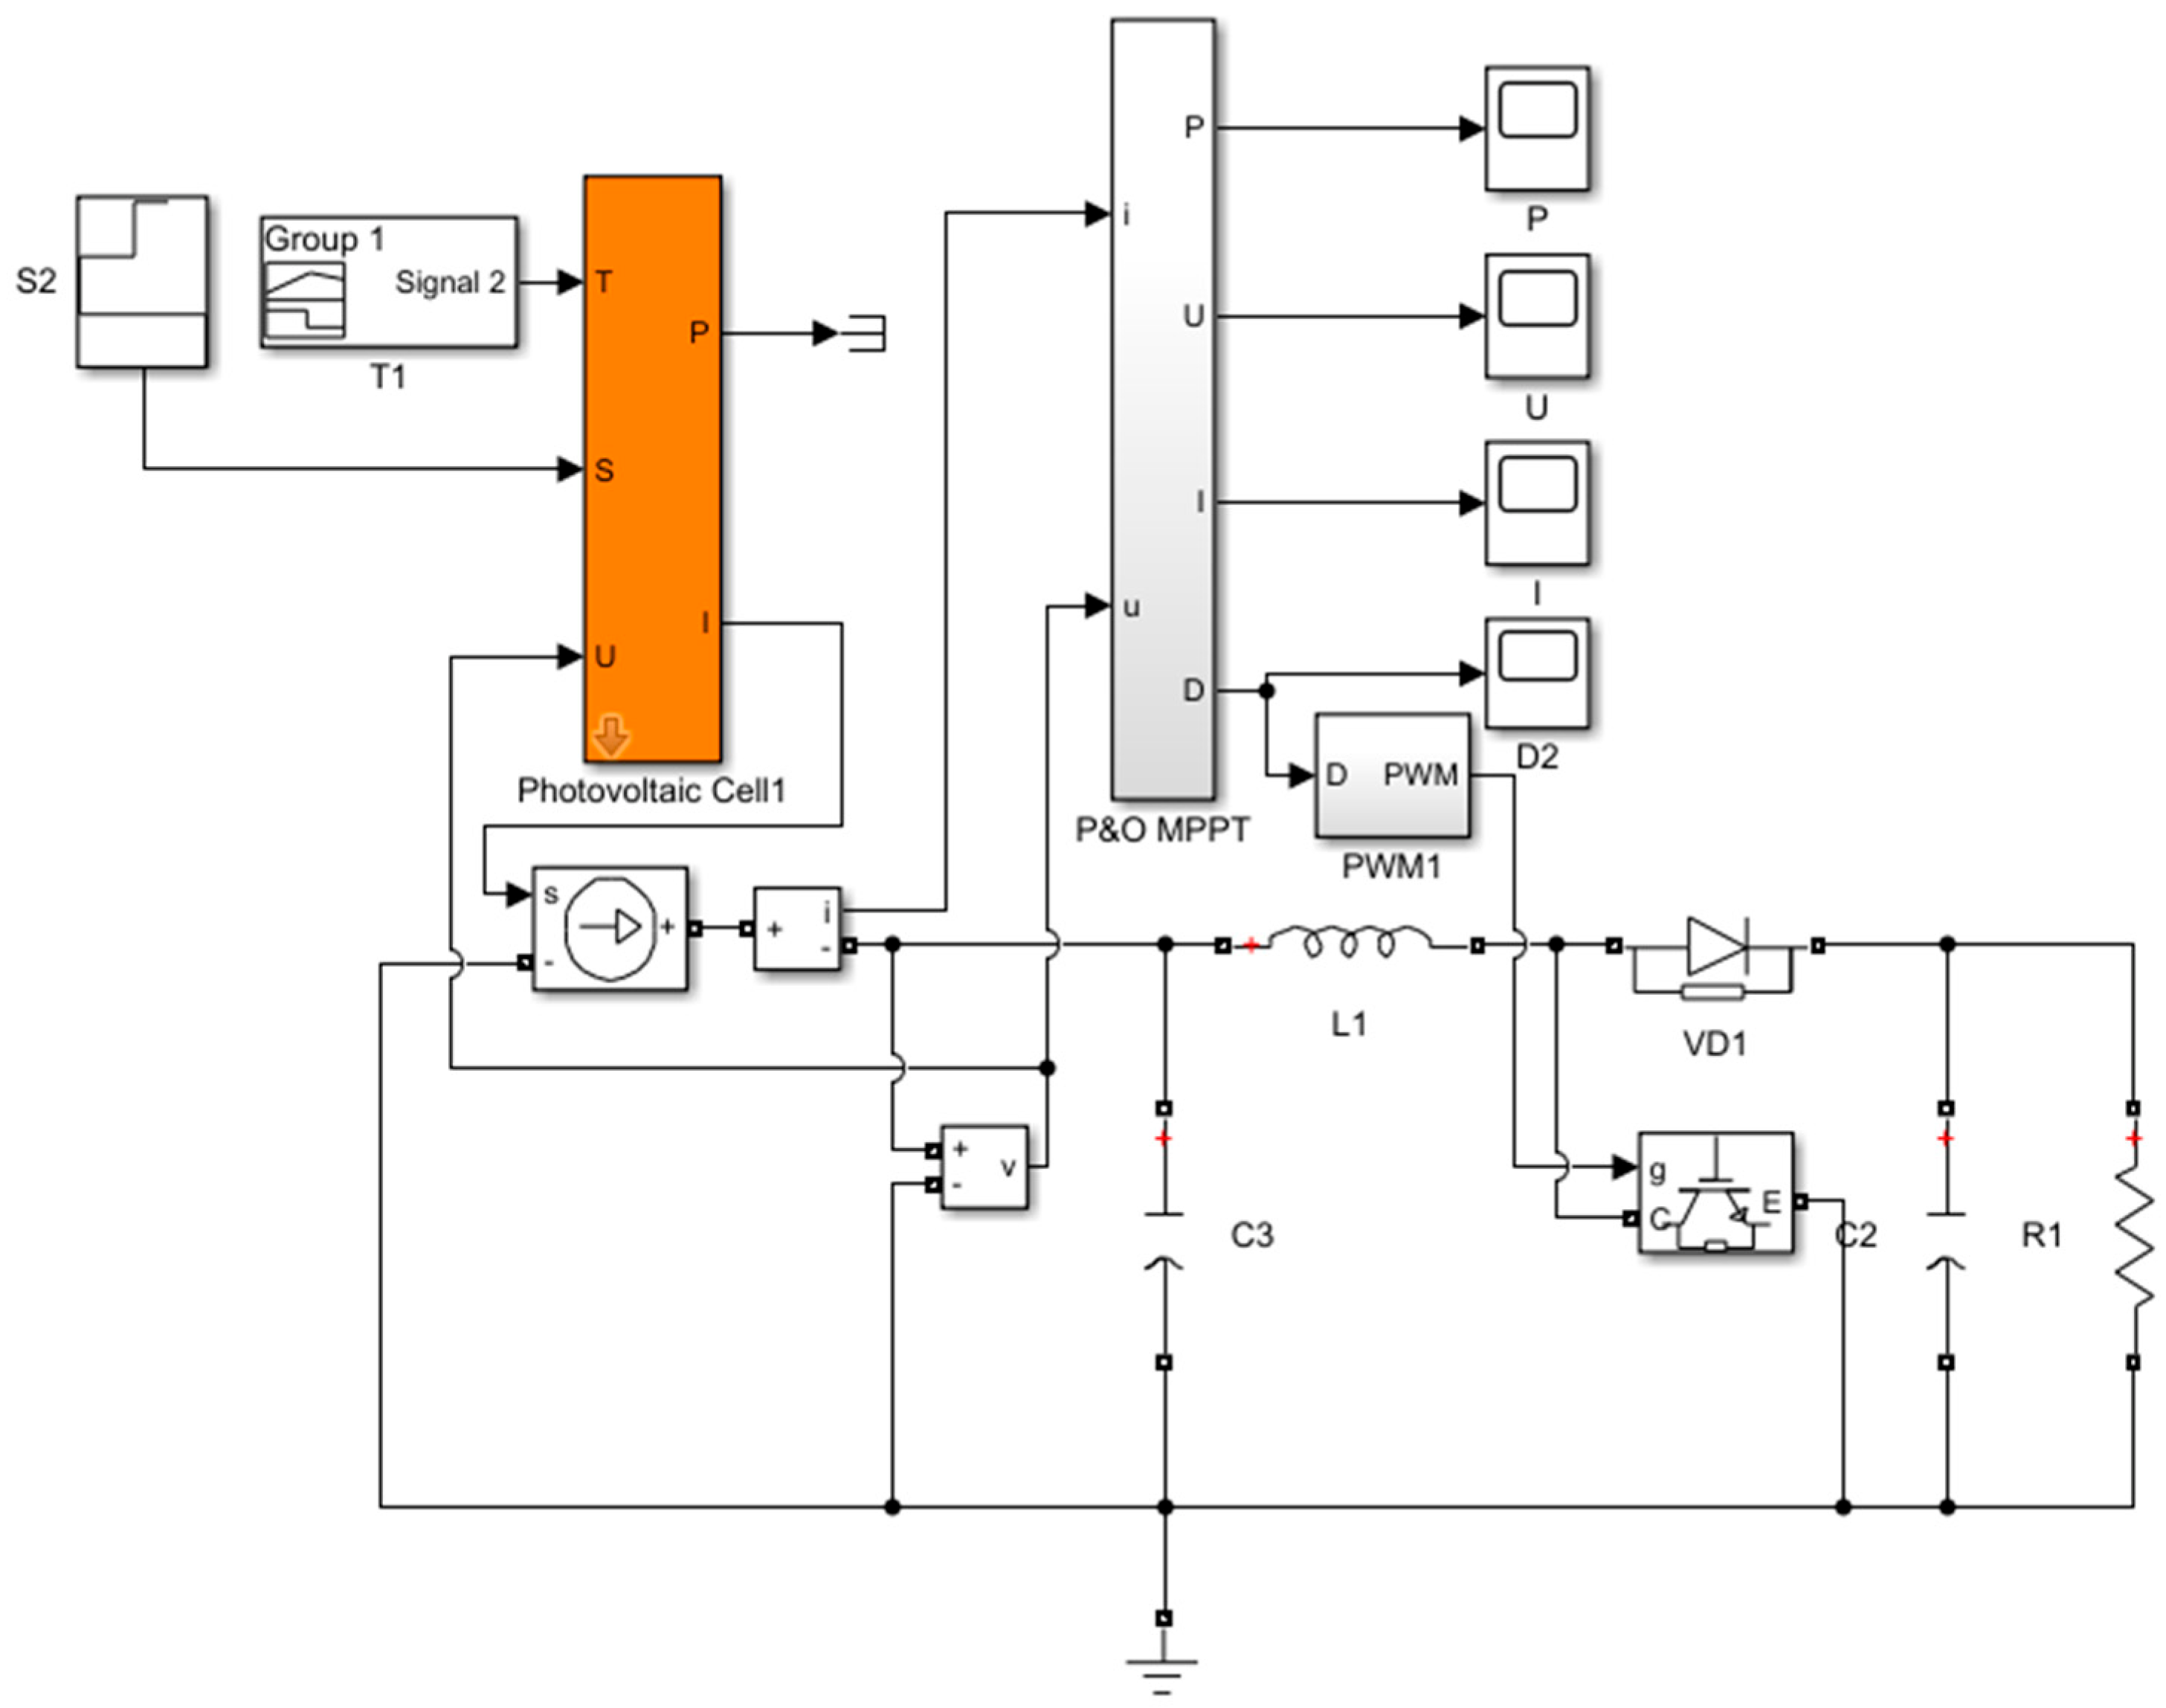
2.3. Power Generation Efficiency Optimization of PV Power Generation System

The photovoltaic cells work based on the principle of semiconductor photovoltaic effect [106]. When the semiconductor is irradiated by sunlight, the electrons and holes will be moved to different sides and accumulate at both ends of the PN junction to form an electromotive force due to the negative and positive charges. The equivalent circuit of the photovoltaic cell is shown in Figure 8, and Equation 11 presents the mathematical model, such that:
I = I p h I d I s h I d = I 0 e x p q U + I R s A k T 1 I s h = U + I R s R s h I = I p h I 0 e x p q U + I R s A k T 1 U + I R s R s h                                                                                                                    
where I p h is photocurrent, I d is diode reverse saturation current, R s is the internal equivalent series resistance, R s h is the internal equivalent bypass resistance, A is the diode factor, k = 1.38 × 10⁻²³ J/K is the Kalman constant, and T is the surface temperature of the photovoltaic cell.
In this experiment, the P&O algorithm is used to look for the MPPT and the block diagram of the control method is shown in Figure 9. The P&O algorithm is developed based on the slope change of (P–V) characteristics of the PV panel. The slope of the curve is adjusted to zero at the MPP, positive to the left of the MPP, and negative to the right side of the MPP. The panel voltage and current are measured for every perturbation, and the control parameter is perturbed with a step size. If power increases from the present iteration, the perturbation of the system continues in the same way as the previous iteration, or otherwise a counteraction will be taken.
There are two ways to implement the P&O algorithm: direct duty ratio control and voltage reference control. For direct duty ratio control [107,108,109,110,111], the P&O algorithm directly provides the required duty ratio for the DC–DC converter to reach the MPP. The step size of the duty ratio can be either fixed or varied adaptively. For a higher value of step size, the response time to reach the MPP will be shorter, while the steady-state oscillations will increase. Therefore, the fixed perturbation cannot meet both the performance and efficiency simultaneously. In the case of adaptive perturbation, there is no systematic procedure to decide the scaling factor for the adaptation of the step size. The power circuit comprises a DC–DC boost converter. The load impedance is matched by varying the converter duty cycle (D). The P&O algorithm is utilized for the duty cycle to obtain the reference voltage corresponding to the maximum power point. The flowchart of the P&O algorithm is shown in Figure 10.
The traditional P&O algorithm is limited by oscillation, misjudgment, and slow tracking speed [112,113,114,115,116,117]. Firstly, it can be seen from the dynamic tracking process of the P&O algorithm that there is always an interference voltage, Δ U . Even if the external environment does not fluctuate, the oscillation will still occur near the MPP. As shown in Figure 11, when the PV panel works at point A, its output power is P A , and the voltage at the operating point is disturbed, Δ U . When the operation status is updated to point B, Δ U > 0, Δ P > 0, according to traditional disturbance observation, the disturbance direction is correct, and the disturbance voltage will continue to increase in the positive direction as Δ U updates to point C. At this time, Δ U > 0 and Δ P < 0, the system will increase the disturbance voltage in the opposite direction, and Δ U returns to point B. The MPP bounces repeatedly at points A, B, and C, causing the output value to oscillate around the maximum value. Secondly, when the external environment changes suddenly, the traditional P&O algorithm is prone to miscalculation. As shown in Figure 12, the output power of the PV panel at a certain time is P A . If the environmental conditions are unchanged, the voltage disturbance will increase in the positive direction. At point L, when the time is the same, the output power becomes P L , Δ U > 0 and Δ P > 0. If the solar irradiance suddenly changes from point L to point B, the output power will also change to P A , and the interference will be on the left side of the MPP. If Δ P * < 0, it indicates that the interference is located on the right side of the MPP, resulting in the wrong judgment and affecting the accuracy of the output.
The output voltage of the PV power generation system selected in this paper is 31.2 V, which does not meet the load demand. In order to meet the demand of the PV system, this paper uses the boost circuit as the DC wave occupation circuit. Figure 13 shows the diagram of the boost simulation circuit.
The boost conversion circuit is a type of parallel switching circuit, which consists of diode, filter inductor, switch tube, filter capacitor, etc., and works in two modes of charging and discharging. During the charging process, the switch tube is closed, and the input current flows through the inductor. A diode is added to prevent the capacitor from discharging to the ground. Because the input is DC, the current on the inductor increases linearly to some extent, depending on the value of the inductor [118]. As the inductance current increases, some energy will be stored in the inductor. Assuming that the switch tube closing time is T o n , the energy on the inductor will be V i I l T o n , where V i is the input voltage and I i is the current flowing through the inductor.
During discharging, the switch tube is disconnected. Because the current in the inductor is maintained, the current in the inductor will not disappear immediately, but will slowly decrease to 0. Because the original circuit is turned off, the input voltage and inductance charge the capacitor together, and the voltage at both ends of the capacitor rises. At this time, the voltage is higher than the input voltage. Assuming that the switch tube closing time is T o f f , and the energy on the inductor is ( V o V i ) I l T o f f , where V o is the output voltage, when the circuit reaches steady state, the energy stored and released in the inductance will be equal, such that:
V i I l T o n = ( V o V i ) I l T o f f #
The relationship between input and output voltages is given as:
V o V i = 1 1 D
where D is the duty cycle, which can be represented as:
D = t o n t o n + t o f f = t o n T
Therefore, the change of output voltage can be controlled by adjusting the duty cycle.
According to [119], the formula of inductance, L , and capacitance, C , can be given as:
C = V 0 D T Δ V R L = V i 2 V o V i 1.38 f V o 2 I 0
The proposed P&O MPPT algorithm is designed to automatically change the disturbance step size on the basis of the traditional P&O algorithm. It can be seen from Figure 4 that different illumination conditions show very close voltage at the MPP. According to this characteristic, the improved P&O algorithm is designed to use a large step size disturbance when the voltage is detected to be far from the MPP′s voltage, and a small step size disturbance when the voltage is near the MPP′s voltage. It can be seen from empirical analysis that when the difference between real-time voltage and U 1 (31.2 V) is greater than U 2 (1.7 V), a large step of D L (0.01) is used, and when the difference is greater than U 2 , a small step of D S (0.000001) is used. It can quickly follow the MPP and reduce disturbance and oscillation after reaching the MPP to improve power generation efficiency. The flow chart of the improved P&O algorithm is shown in Figure 14.
The MARLAB/Simulink model of a solar PV array with P&O control algorithm is shown in Figure 15 to illustrate its performance characteristics at different illumination and cell temperatures. The Simulink model shown in Figure 14 was developed for the specifications listed in Table 1 and Table 2.
The experiment was carried out in 0, 0.1 s, and 0.2 s; the light irradiance was 1000 W/m2, 800 W/m2, and 600 W/m2; the temperature was 25 °C; and the simulation was completed in 0.3 s. The application of the P&O MPPT is shown in Figure 16 and Figure 17.
The step size in Figure 16 is as small as 0.005, while a larger step size of 0.02 is calculated in Figure 17. It shows that the generation power oscillation degree is small when the generation reaches the stable state with small step length; however, the MPP cannot be traced. When a large step length is set, the MPP can be reached quickly, but the degree of oscillation is larger after reaching the efficiency of stable state, reducing the photovoltaic power generation. Figure 18 shows the curve of the P&O MPPT and the improved P&O MPPT′s power generation versus time and irradiance. Figure 19 shows the duty cycle of two algorithms.
It can be seen that the improved P&O MPPT can track the MPP more quickly than the P&O MPPT, and it can oscillate with minimal disturbance in a stable state, improving the efficiency of PV power generation considerably. The range of output power fluctuation of P&O MPPT is 274 W~321 W under the condition of 1200 W/m2 irradiance. The output power fluctuation range of the improved P&O MPPT is 318 W~319 W under the same conditions. When the irradiance is from 1000 W/m2 to 1200 W/m2, it takes 0.015 s for P&O MPPT to track to the MPP, and 0.008 s for the improved P&O MPPT.
It can be inferred from the above formula that in order to evaluate the efficiency of the seawater desalination device and the control system, temperature sensors and liquid level sensors are introduced to measure the seawater temperature, flow, and freshwater output in and out of the heat exchanger.

3. Control System Development

3.1. Overview of Control System Functions

The control system designed in this research is capable of real-time data acquisition, process logic operation, and sequence control. In this experiment, Siemens Smart 200 SR200 series products are used as the control core. The power of the M1–M5 pumps is 250 W each, the power of the M6 pump is 375 W, and the powers of both fans, M7 and M8, are 550 W.

3.2. Design of Startup and Shutdown Conditions

In the startup and shutdown process, the control system firstly obtains the power of the PV cells and the power generation of the PV panel modules, so as to determine whether the water pumps and fans should be started. The capacity of the PV cells in the PV power generation system is 5.12 kWh, and the maximum power of the whole system is 2.6 kW when the entire system is in normal operation. Because M2 is a seawater pump, the average power consumption of the whole system can be estimated to be 2.4 kW in normal operation without continuous operation. In order to prevent the wear-and-tear on the battery cells caused by charging and discharging at the same time for an extended period, 100% of the photovoltaic battery power is taken as one of the necessary conditions for starting up. In addition, in order to improve the efficiency of freshwater production, if the remaining power of the photovoltaic cell exceeds 80% and the calculated photovoltaic power reaches 60% of the load under normal operation, the water pumps and fans are also turned on according to the control flow sequence to start the seawater desalination process.
Due to the uncertainty of weather conditions, PV cells must save part of the electricity to maintain the normal operation of equipment, such as data acquisition, data upload, and other functions, under continuous weak light weather conditions, so as to prevent PV cells from triggering under voltage protection. Therefore, the design control system will shut down all loads when it detects that the PV battery power is less than 30%; all the power generated by the PV modules will be stored in PV cells, and normal operation will resume when it comes to the start-up conditions.

3.3. Design of Operation Control Method

In the operation process, the M1 water pump works as the circulating pump between the heat collector and the water tank, and it will be started when the water temperature difference between the collector and the water tank is small, so as to avoid the waste of heat energy of the collector. At the same time, in order to avoid wasting electric energy, pump operation must be stopped within the acceptable temperature difference range. Therefore, according to the actual conditions, the M1 water pump is designed to turn on when the difference between water temperature T1 for the heat collector and water temperature T2 for the water tank is within 10 °C and turn off when the difference of temperature is less than 3 °C. The M2 water pump is used as the make-up water pump of the water tank, and when the liquid level of the water tank (H1) is less than 30%, the M2 water pump is triggered to maintain sufficient seawater in the heat collecting circulating system and heat exchange between the desalination systems. When the water level of the hot water tank is less than 70% and the photovoltaic module power generation reaches 80% or more, the M2 water pump is also turned on to avoid the operation of part of the power supply pump when the sunlight is weak. The M3, M4, and M5 pumps are the seawater feed pumps and heat exchange pumps, which will be turned on at the same time as the M6 seawater desalination circulating pump. However, the premise of the desalination system is that the heating water temperature of the heat collecting system is expected to reach the appropriate temperature of the fresh water produced by the desalination system. Figure 20 shows the relationship between the temperature T2, the hot water tank, and the output of fresh water.
It can be seen that freshwater output and GOR can reach a high level at 62 °C. Therefore, the control system designed in this paper will turn on the M3–M6 water pumps when the temperature of hot water tank T2 reaches 62 °C and starts desalination. In order to prevent the inverter from burning by excessive starting current when the load is started, the control system will delay the start of the M7 and M8 fans for 10 s to protect the inverter. The flowchart of the control system based on the above control method is shown in Figure 21.

3.4. PLC Program Design

The control system PLC program was developed in Siemens Smart200 programming software STEP7 Micro/WIN SMART V2.6. The control program is divided into three subsystems, with different functions such as heat collection cycle module, PV power generation module, and seawater desalination module. In this way, the program can be updated conveniently later according to requirements, and the program module can be reused for other similar projects.

3.5. System Programming

Due to the complexity of the process control requirements for the seawater desalination production, the PLC control program is divided into a basic program and a modular program, according to the structure. The basic program can be used as an independent program for simple production process control as well as a unit program in the combined module structure. The program is divided into multiple modules, each of which is assigned with a specific task designation and is individually developed, compiled, and debugged before integration. There are six modules being designed for the proposed system, which are the program initialization module, the heat collection cycle module, the PV power generation module, the seawater desalination module, the 4 mA~20 mA analog conversion module, and the system cumulative operation time module.

4. Experiment and Result Discussion

Figure 22 shows part of the experimental devices used in this research. The photovoltaic cells used are a Ys-ups-5 kw series product.
It can be seen that in July 2021, the average daily solar radiation amount was 4.79 kWh/m2, the total power generation of the PV modules was 160.64 kWh, and the average daily power generation was 5.18 kWh. The output of freshwater during this time was 10,410.12 kg, and the average daily output was 335.81 kg, which is enough for 2 to 3 adults′ daily freshwater demand. The relationship between the daily illumination amount and the water production and power generation is shown in Figure 23. It can be seen that there is a strong positive correlation between freshwater output, photovoltaic power generation, and irradiance. In the test of July 2021, the whole system continuously worked in completely automatic mode, and the optimal operation mode could be adjusted according to the collected, data such as irradiance, temperature, photovoltaic power, and photovoltaic cell power. It can also be found that system shutdown caused by the undervoltage of the photovoltaic power generation system can be avoided, which proves that the control system design is successful.
Figure 24 shows the difference between the water temperature of the heat collection tank and the feed seawater temperature with the freshwater production volume. It can be seen that there is a strong positive correlation between the temperature difference and the water production. However, when the temperature difference is greater than 54 °C, the water yield does not increase significantly because it reaches the water production limit. In future work, the temperature difference between the incoming seawater and the seawater of the heat storage tank can be input as a condition, so that the desalination system can be started when the water production reaches a higher level, which can further improve the utilization rate of electric energy.

5. Conclusions

This research proposes the design of a multistage humidification and dehumidification desalination system with photovoltaic-thermal control method. The P&O algorithm is improved for the MPPT control of the photovoltaic power generation system. The simulation test in MATLAB/Simulink environment proves that when the external irradiance suddenly changes, the resulted MPP can be tracked faster than the traditional P&O algorithm, and the amplitude of oscillation within the maximum power range is smaller. When the irradiance suddenly increases from 1000 Wm2 to 1200 W/m2, the tracking time of the MPP is reduced from 0.015 s to 0.008 s, the output power fluctuation in the stable state can be reduced from 47 W to 1 W, and the photovoltaic power generation efficiency can be greatly improved. According to the experimental results, the GOR of the multistage humidification and dehumidification desalination system can reach 1.2 when the temperature of the heat storage tank reaches 62 °C, and 1.7 when the temperature rises to 80 °C. The operation of water pumps and fans is controlled by the temperature difference value, and the operation mode can be automatically selected based on the irradiance and temperature, which greatly improves the utilization rate of solar energy and the output of freshwater. The operation of the whole system can work in completely automatic mode and does not require human intervention. Experiment results show that the proposed system is capable of producing 5.18 kWh of electric energy and 335.81 kg of freshwater per day. The maximum daily yield can reach 565.75 kg and the maximum daily power generation is 8.12 kWh.

Author Contributions

Conceptualization, C.Q.; software, J.Y.; validation, R.D., Y.Y. and Y.W. (Yuxuan Wu).; formal analysis, J.Y., G.Y. and Y.Y.; investigation, Y.W. (Yuangan Wang)., G.Y., R.D., J.G. and Y.W. (Yuxuan Wu).; resources, Y.W. (Yuangan Wang)., R.Z., J.G. and Y.W. (Yuxuan Wu).; data curation, J.Y., W.Q. and P.W.; writing—original draft preparation, J.Y. and N.W.; writing—review and editing, N.W. and W.Q.; visualization, J.G.; supervision, C.Q. and Y.Z.; project administration, J.Y.; funding acquisition, C.Q. and J.L. All authors have read and agreed to the published version of the manuscript.

Funding

This work was jointly supported by the Scientific Research Foundation for Advanced Talents of Beibu Gulf University: 18KYQD29; Project of Qinzhou Science and Technology Source: 202116622; CSSC Guangxi Shipbuilding and Offshore Engineerin Technology Collaboration Project: ZCGXJSB20226300222-06; The 100 Scholar Plan of the Guangxi Zhuang Autonomous Region of China.

Institutional Review Board Statement

Not applicable.

Informed Consent Statement

Not applicable.

Data Availability Statement

Data can be obtained by contacting the author, Jiaqi Yan (2002011128@stu.bbgu.edu.cn).

Conflicts of Interest

The authors declare no conflict of interest.

Nomenclature

c p w Specific heat capacity of seawater at constant pressure, kJ/(kg∙K)
C Capacitor, mF
f Switching frequency, kHz
h f g Latent heat of vaporization, kJ/kg
L Inductor, µH
I d Diode reverse saturation current, A
I ph Photocurrent, A
I d Diode reverse saturation current, A
I l Current flowing through the inductor, A
I s c Short circuit current of PV module under standard conditions, A
I m Optimum working current of PV module under standard conditions, A
I s c   Actual short circuit current, A
I m   Actual optimum working current, A
M e Freshwater flow rate, m3/h
q m w Seawater flow in the heat exchanger, kg/h
Q t o t Total energy for heating, kW
R sh Internal equivalent bypass resistance, Ω
S Actual value of irradiation intensity, W/m2
Δ S Difference between the actual value of irradiation intensity and the standard value of irradiation intensity, W/m2
t w Seawater temperature, °C
t w i n Temperature of seawater flowing into the heat exchanger, °C
t w 1 Condensation temperature, °C
T PV module temperature under actual irradiation intensity and ambient temperature, °C
T o n Switch tube closing time, ms
T o f f Switch tube closing time, ms
T a i r Ambient temperature, °C
Δ T Difference between the actual temperature value of PV module and the temperature under standard conditions, °C
U m Maximum power point voltage under standard conditions, V
U o c Open circuit voltage of PV module under standard conditions, V
U m   Actual maximum power point voltage, V
U o c   Actual open circuit voltage, V
V i Input voltage, V
V o Output voltage, V

Abbreviation

EDElectrodialysis
HDHHumidification and dehumidification
INCIncremental conductance
MDMembrane distillation
MEDMulti-effect distillation
MSFMultistage flash
MPPMaximum power point
MPPTMaximum power point tracking
MVCVapor can be attained mechanically
TVCVapor can be attained thermally
P&OPerturb and Observation
PV/TPhotovoltaic thermal
ROReverse osmosis
VCDVapor compression distillation
FLCFuzzy logic control
PSOParticle swarm optimization
GAGenetic algorithm

References

  1. Song, W.; Liu, W.; Qiu, G.; Chu, X.; Wang, S.; Huang, P.; Liu, E. Water resources and seawater desalination technology in Chinese islands. Ocean Dev. Manag. 2016, 33, 28–33. [Google Scholar]
  2. Van Dyke, J.M.; Brooks, R.A. Uninhabited islands: Their impact on the ownership of the oceans’ resources. Ocean Dev. Int. Law 1983, 12, 265–300. [Google Scholar] [CrossRef]
  3. Adham, S.; Hussain, A.; Matar, J.M.; Dores, R.; Janson, A. Application of Membrane Distillation for desalting brines from thermal desalination plants. Desalination 2013, 314, 101–108. [Google Scholar] [CrossRef]
  4. Velmurugan, V.; Kumar, K.N.; Haq, T.N.; Srithar, K. Performance analysis in stepped solar still for effluent desalination. Energy 2009, 34, 1179–1186. [Google Scholar] [CrossRef]
  5. Kabeel, A.E.; Khairat Dawood, M.M.; Ramzy, K.; Nabil, T.; Elnaghi, B.; Elkassar, A. Enhancement of single solar still integrated with solar dishes: An experimental approach. Energy Convers. Manag. 2019, 196, 165–174. [Google Scholar] [CrossRef]
  6. Srithar, K.; Rajaseenivasan, T. Recent fresh water augmentation techniques in solar still and HDH desalination—A review. Renew. Sustain. Energy Rev. 2018, 82, 629–644. [Google Scholar] [CrossRef]
  7. Narayan, G.P.; John MGSt Zubair, S.M.; Lienhard, V.J.H. Thermal design of the humidification dehumidification desalination system: An experimental investigation. Int. J. Heat Mass Transf. 2013, 58, 740–748. [Google Scholar] [CrossRef]
  8. Ahmed, H.A.; Ismail, I.M.; Saleh, W.F.; Ahmed, M. Experimental investigation of humidification-dehumidification desalination system with corrugated packing in the humidifier. Desalination 2017, 410, 19–29. [Google Scholar] [CrossRef]
  9. Narayan, G.P.; Sharqawy, M.H.; Leinhard, V.J.H.; Zubair, S.M. Thermodynamic analysis of humidification dehumidification desalination cycles. Desalin. Water Treat. 2010, 16, 339–353. [Google Scholar] [CrossRef] [Green Version]
  10. Zubair, S.M.; Antar, M.A.; Elmutasim, S.M.; Lawal, D.U. Performance evaluation of humidification-dehumidification (HDH) desalination systems with and without heat recovery options: An experimental and theoretical investigation. Desalination 2018, 436, 161–175. [Google Scholar] [CrossRef]
  11. Qasem, N.; Imteyaz, B.; Antar, M.A. Investigation of the effect of the top and the bottom temperatures on the performance of humidification dehumidification desalination systems. In Proceedings of the ASME International Mechanical Engineering Congress and Exposition; American Society of Mechanical Engineers: New York, NY, USA, 2016. [Google Scholar] [CrossRef]
  12. Ahmed, M.A.; Qasem, N.A.A.; Zubair, S.M. Analytical and numerical schemes for thermodynamically balanced humidification-dehumidification desalination systems. Energy Convers. Manag. 2019, 200, 112052. [Google Scholar] [CrossRef]
  13. Park, I.S.; Park, S.M.; Ha, J.S. Design and application of thermal vapor compressor for multi-effect desalination plant. Desalination 2005, 182, 199–208. [Google Scholar] [CrossRef]
  14. Kazemian, M.E.; Behzadmehr, A.; Sarvari, S.M.H. Thermodynamic optimization of multi-effect desalination plant using the DoE method. Desalination 2010, 257, 195–205. [Google Scholar] [CrossRef]
  15. Datsgerdi, H.R.; Chua, H.T. Thermo-economic analysis of low-grade heat driven multi-effect distillation based desalination processes. Desalination 2018, 448, 36–48. [Google Scholar] [CrossRef]
  16. Zhang, F.; Xu, S.; Feng, D.; Chen, S.; Du, R.; Su, C.; Shen, B. A low-temperature multieffect desalination system powered by the cooling water of a diesel engine. Desalination 2017, 404, 112–120. [Google Scholar] [CrossRef]
  17. Baig, H.; Antar, M.A.; Zubair, S.M. Performance evaluation of a once-through multistage flash distillation system: Impact of brine heater fouling. Energy Convers. Manag. 2011, 52, 1414–1425. [Google Scholar] [CrossRef]
  18. Hanshik, C.; Jeong, H.; Jeong, K.-W.; Choi, S.-H. Improved productivity of the MSF (multi-stage flashing) desalination plant by increasing the TBT (top brine temperature). Energy 2016, 107, 683–692. [Google Scholar] [CrossRef]
  19. Silver, R.S. An assessment of multiple effect boiling distillation in relation to multistage flash distillation. Desalination 1971, 9, 235–243. [Google Scholar] [CrossRef]
  20. Jamil, M.A.; Zubair, S.M. On thermoeconomic analysis of a single-effect mechanical vapor compression desalination system. Desalination 2017, 420, 292–307. [Google Scholar] [CrossRef]
  21. Jamil, M.A.; Zubair, S.M. Design and analysis of a forward feed multi-effect mechanical vapor compression desalination system: An exergo-economic approach. Energy 2017, 140, 1107–1120. [Google Scholar] [CrossRef]
  22. He, W.F.; Ji, C.; Han, D.; Wu, Y.K.; Huang, L.; Zhang, X.K. Performance analysis of the mechanical vapor compression desalination system driven by an organic Rankine cycle. Energy 2017, 141, 1177–1186. [Google Scholar] [CrossRef]
  23. Samaké, O.; Galanis, N.; Sorin, M. Thermodynamic study of multi-effect thermal vapour-compression desalination systems. Energy 2014, 72, 69–79. [Google Scholar] [CrossRef]
  24. Zhou, S.; Gong, L.; Liu, X.; Shen, S. Mathematical modeling and performance analysis for multi-effect evaporation/multi-effect evaporation with thermal vapor compression desalination system. Appl. Eng. 2019, 159, 113759. [Google Scholar] [CrossRef]
  25. Ong, C.W.; Chen, C.-L. Technical and economic evaluation of seawater freezing desalination using liquefied natural gas. Energy 2019, 181, 429–439. [Google Scholar] [CrossRef]
  26. Xie, C.; Zhang, L.; Liu, Y.; Lv, Q.; Ruan, G.; Hosseini, S.S. A direct contact type ice generator for seawater freezing desalination using LNG cold energy. Desalination 2018, 435, 293–300. [Google Scholar] [CrossRef]
  27. Jayakody, H.; Al-Dadah, R.; Mahmoud, S. Numerical investigation of indirect freeze desalination using an ice maker machine. Energy Convers. Manag. 2018, 168, 407–420. [Google Scholar] [CrossRef]
  28. Zheng, J.; Cheng, F.; Li, Y.; Lü, X.; Yang, M. Progress and trends in hydrate based desalination (HBD) technology: A review. Chin. J. Chem. Eng. 2019, 27, 2037–2043. [Google Scholar] [CrossRef]
  29. Khan, M.N.; Peters, C.J.; Koh, C.A. Desalination using gas hydrates: The role of crystal nucleation, growth and separation. Desalination 2019, 468, 114049. [Google Scholar] [CrossRef]
  30. Yan, W.; Shi, M.; Wang, Z.; Zhou, Y.; Liu, L.; Zhao, S.; Ji, Y.; Wang, J.; Gao, C. Aminomodified hollow mesoporous silica nanospheres-incorporated reverse osmosis membrane with high performance. J. Membr. Sci. 2019, 581, 168–177. [Google Scholar] [CrossRef]
  31. Qasim, M.; Badrelzaman, M.; Darwish, N.N.; Darwish, N.A.; Hilal, N. Reverse osmosis desalination: A state-of-the-art review. Desalination 2019, 459, 59–104. [Google Scholar] [CrossRef]
  32. Kim, J.; Park, K.; Yang, D.R.; Hong, S. A comprehensive review of energy consumption of seawater reverse osmosis desalination plants. Appl. Energy 2019, 254, 113652. [Google Scholar] [CrossRef]
  33. Yun, T.I.; Gabelich, C.J.; Cox, M.R.; Mofidi, A.A.; Lesan, R. Reducing costs for large-scale desalting plants using large-diameter, reverse osmosis membranes. Desalination 2006, 189, 141–154. [Google Scholar] [CrossRef]
  34. Qasem, N.A.A.; Qureshi, B.A.; Zubair, S.M. Improvement in design of electrodialysis desalination plants by considering the Donnan potential. Desalination 2018, 441, 62–76. [Google Scholar] [CrossRef]
  35. Doornbusch, G.J.; Tedesco, M.; Post, J.W.; Borneman, Z.; Nijmeijer, K. Experimental investigation of multistage electrodialysis for seawater desalination. Desalination 2019, 464, 105–114. [Google Scholar] [CrossRef]
  36. Campione, A.; Cipollina, A.; Bogle, I.D.L.; Gurreri, L.; Tamburini, A.; Tedesco, M.; Micale, G. A hierarchical model for novel schemes of electrodialysis desalination. Desalination 2019, 465, 79–93. [Google Scholar] [CrossRef]
  37. Campione, A.; Gurreri, L.; Ciofalo, M.; Micale, G.; Tamburini, A.; Cipollina, A. Electrodialysis for water desalination: A critical assessment of recent developments on process fundamentals, models and applications. Desalination 2018, 434, 121–160. [Google Scholar] [CrossRef]
  38. Qasem, N.A.A.; Zubair, S.M.; Qureshi, B.A.; Generous, M.M. The impact of thermodynamic potentials on the design of electrodialysis desalination plants. Energy Convers. Manag. 2020, 205, 112448. [Google Scholar] [CrossRef]
  39. Khalifa, A.; Lawal, D.; Antar, M.; Khayet, M. Experimental and theoretical investigation on water desalination using air gap membrane distillation. Desalination 2015, 376, 94–108. [Google Scholar] [CrossRef]
  40. Gopi, G.; Arthanareeswaran, G.; Af, I. Perspective of renewable desalination by using membrane distillation. Chem. Eng. Res. Des. 2019, 144, 520–537. [Google Scholar] [CrossRef]
  41. González, D.; Amigo, J.; Suárez, F. Membrane distillation: Perspectives for sustainable and improved desalination. Renew. Sustain. Energy Rev. 2017, 80, 238–259. [Google Scholar] [CrossRef]
  42. Khalifa, A.E.; Imteyaz, B.A.; Lawal, D.U.; Abido, M.A. Heuristic optimization techniques for air gap membrane distillation system. Arab. J. Sci. Eng. 2017, 42, 1951–1965. [Google Scholar] [CrossRef]
  43. Khalifa, A.E.; Lawal, D.U. Application of response surface and Taguchi optimization techniques to air gap membrane distillation for water desalination—A comparative study. Desalination Water Treat. 2016, 57, 28513–28530. [Google Scholar] [CrossRef]
  44. Lawal, D.U.; Khalifa, A.E. Experimental investigation of an air gap membrane distillation unit with double-sided cooling channel. Desalination Water Treat. 2016, 57, 11066–11080. [Google Scholar] [CrossRef]
  45. Lawal, D.U.; Khalifa, A.E. Flux prediction in direct contact membrane distillation. Int. J. Mater. Mech. Manuf. 2014, 2, 302–308. [Google Scholar] [CrossRef] [Green Version]
  46. Khalifa, A.E.; Lawal, D.U. Performance and optimization of air gap membrane distillation system for water desalination. Arab. J. Sci. Eng. 2015, 40, 3627–3639. [Google Scholar] [CrossRef]
  47. Khalifa, A.E.; Lawal, D.U.; Antar, M.A. Performance of air gap membrane distillation unit for water desalination. In Proceedings of the ASME 2014 International Mechanical Engineering Congress and Exposition, Montreal, QC, Canada, 14–20 November 2014. [Google Scholar] [CrossRef]
  48. Alsaman, A.S.; Askalany, A.A.; Harby, K.; Ahmed, M.S. A state of the art of hybrid adsorption desalination-cooling systems. Renew. Sustain. Energy Rev. 2016, 58, 692–703. [Google Scholar] [CrossRef]
  49. Saha, B.B.; El-Sharkawy, I.I.; Shahzad, M.W.; Thu, K.; Ang, L.; Ng, K.C. Fundamental and application aspects of adsorption cooling and desalination. Appl. Eng. 2016, 97, 68–76. [Google Scholar] [CrossRef] [Green Version]
  50. Qasem, N.A.A.; Zubair, S.M. Performance evaluation of a novel hybrid humidification-dehumidification (air-heated) system with an adsorption desalination system. Desalination 2019, 461, 37–54. [Google Scholar] [CrossRef]
  51. Richter, T.; Landsgesell, J.; Košovan, P.; Holm, C. On the efficiency of a hydrogel-based desalination cycle. Desalination 2017, 414, 28–34. [Google Scholar] [CrossRef]
  52. Rud, O.; Borisov, O.; Košovan, P. Thermodynamic model for a reversible desalination cycle using weak polyelectrolyte hydrogels. Desalination 2018, 442, 32–43. [Google Scholar] [CrossRef]
  53. Subban, C.V.; Gadgil, A.J. Electrically regenerated ion-exchange technology for desalination of low-salinity water sources. Desalination 2019, 465, 38–43. [Google Scholar] [CrossRef]
  54. Tsiakis, P.; Papageorgiou, L.G. Optimal design of an electrodialysis brackish water desalination plant. Desalination 2005, 173, 173–186. [Google Scholar] [CrossRef]
  55. Lopez, A.M.; Williams, M.; Paiva, M.; Demydov, D.; Do, T.D.; Fairey, J.L.; Lin, Y.P.J.; Hestekin, J.A. Potential of electrodialytic techniques in brackish desalination and recovery of industrial process water for reuse. Desalination 2017, 409, 108–114. [Google Scholar] [CrossRef]
  56. Prajapati, M.; Shah, M.; Soni, B. A review of geothermal integrated desalination: A sustainable solution to overcome potential freshwater shortages. J. Clean. Prod. 2021, 326, 129412. [Google Scholar] [CrossRef]
  57. Sharqawy, M.H.; Antar, M.A.; Zubair, S.M.; Elbashir, A.M. Optimum thermal design of humidification dehumidification desalination systems. Desalination 2014, 349, 10–21. [Google Scholar] [CrossRef]
  58. Gang, W.; Zheng, H.; Kang, H.; Yang, Y.; Cheng, P.; Chang, Z. Experimental investigation of a multi-effect isothermal heat with tandem solar desalination system based on humidification-dehumidification processes. Desalination 2015, 1, 100–107. [Google Scholar] [CrossRef]
  59. Liu, Q.; Cao, F.; Zhu, T.; Liu, D. Experimental study on slope solar chimney humidification and dehumidification of seawater desalination system. Eng. Therm. Matter Acta Sci. Sin. 2019, 40, 2720–2724. [Google Scholar]
  60. Murtaza, A.; Chiaberge, M.; De Giuseppe, M.; Boero, D. A duty cycle optimization based hybrid maximum power point tracking technique for photovoltaic systems. Int. J. Electr. Power Energy Syst. 2014, 59, 141–154. [Google Scholar] [CrossRef]
  61. Murtaza, A.; Chiaberge, M.; Spertino, F.; Boero, D.; De Giuseppe, M. A maximum power point tracking technique based on bypass diode mechanism for PV arrays under partial shading. Energy Build. 2014, 73, 13–25. [Google Scholar] [CrossRef]
  62. Abdel-Salam, M.; EL-Mohandes, M.T. History of Maximum Power Point Tracking. In Modern Maximum Power Point Tracking Techniques for Photovoltaic Energy Systems; Springer: Cham, Switzerland, 2019; pp. 1–29. [Google Scholar]
  63. Islam, H.; Mekhilef, S.; Shah, N.B.M.; Soon, T.K.; Seyedmahmousian, M.; Horan, B.; Stojcevski, A. Performance Evaluation of Maximum Power Point Tracking Approaches and Photovoltaic Systems. Energies 2018, 11, 365. [Google Scholar] [CrossRef]
  64. Awasthi, A.; Shukla, A.K.; Murali Manohar, S.R.; Dondariya, C.; Shukla, K.N.; Porwal, D.; Richhariya, G. Review on sun tracking technology in solar PV system. Energy Rep. 2020, 6, 392–405. [Google Scholar] [CrossRef]
  65. Albalawi, H.; Zaid, S.A. An H5 Transformerless Inverter for Grid Connected PV Systems with Improved Utilization Factor and a Simple Maximum Power Point Algorithm. Energies 2018, 11, 2912. [Google Scholar] [CrossRef] [Green Version]
  66. Tan, Y.T.; Kirschen, D.S.; Jenkins, N. A model of PV generation suitable for stability analysis. IEEE Trans. Energy Convers. 2004, 19, 748–755. [Google Scholar] [CrossRef]
  67. Soto, W.D.; Klein, S.A.; Beckman, W. Improvement and validation of a model for photovoltaic array performance. Sol. Energy 2006, 80, 78–88. [Google Scholar] [CrossRef]
  68. Xiao, W.; Dunford, W.G.; Palmer, P.R.; Capel, A. Reg ulation of photovoltaic voltage. IEEE Trans. Ind. Electron. 2007, 54, 1365–1374. [Google Scholar] [CrossRef]
  69. Hohm, D.P.; Ropp, M.E. Comparative study of max imum power point tracking algorithms. Prog. Photovolt. Res. Appl. 2003, 11, 47–62. [Google Scholar] [CrossRef]
  70. Salas, V.; Olias, E.; Barrado, A.; Lazaro, A. Review of the maximum power point tracking algorithms for stand alone photovoltaic systems. Sol. Energy Mater. Sol. Cells 2006, 90, 1555–1578. [Google Scholar] [CrossRef]
  71. Esram, T.; Chapman, P.L. Comparison of photovoltaic array maximum power point tracking techniques. IEEE Trans. Energy Convers. 2007, 22, 439–449. [Google Scholar] [CrossRef] [Green Version]
  72. Oshaba, A.S.; Ali, E.S.; Elazin, S.A. MPPT con trol design of PV system supplied SRM using BAT search algorithm. Sust. Energy Grids Netw. 2015, 2, 51–60. [Google Scholar] [CrossRef]
  73. Oshaba, A.S.; Ali, E.S.; Elazin, S.A. PI controller design using ABC algorithm for MPPT of PV system sup pling DC motor pump load. Neural Comput. Appl. 2017, 28, 353–364. [Google Scholar] [CrossRef]
  74. Oshaba, A.S.; Ali, E.S. Bacteria foraging: A new tech niqye for speed control of DC series motor supplied by photovoltaic system. Int. J. WSEAS Trans. Power. Syst. 2014, 9, 185–195. [Google Scholar]
  75. Yildirim, M.A.; Nowak-Ocłoń, M. Modified Maximum Power Point Tracking Algorithm under Time-Varying Solar Irradiation. Energies 2020, 13, 6722. [Google Scholar] [CrossRef]
  76. Murtaza, A.F.; Sher, H.A.; Spertino, F.; Ciocia, A.; Noman, A.M.; Al-Shamma’a, A.A.; Alkuhayli, A. A Novel MPPT Technique Based on Mutual Coordination between Two PV Modules/Arrays. Energies 2021, 14, 6996. [Google Scholar] [CrossRef]
  77. Lee, H.S.; Yun, J.J. Advanced MPPT Algorithm for Distributed Photovoltaic Systems. Energies 2019, 12, 3576. [Google Scholar] [CrossRef] [Green Version]
  78. Louzazni, M.; Cotfas, D.T.; Cotfas, P.A. Management and Performance Control Analysis of Hybrid Photovoltaic Energy Storage System under Variable Solar Irradiation. Energies 2020, 13, 3043. [Google Scholar] [CrossRef]
  79. Aourir, J.; Locment, F. Limited Power Point Tracking for a Small-Scale Wind Turbine Intended to Be Integrated in a DC Microgrid. Appl. Sci. 2020, 10, 8030. [Google Scholar] [CrossRef]
  80. Mahmod Mohammad, A.N.; Mohd Radzi, M.A.; Azis, N.; Shafie, S.; Atiqi Mohd Zainuri, M.A. An Enhanced Adaptive Perturb and Observe Technique for Efficient Maximum Power Point Tracking Under Partial Shading Conditions. Appl. Sci. 2020, 10, 3912. [Google Scholar] [CrossRef]
  81. Gil-Antonio, L.; Saldivar, B.; Portillo-Rodríguez, O.; Ávila Vilchis, J.C.; Martínez-Rodríguez, P.R.; Martínez-Méndez, R. Flatness-Based Control for the Maximum Power Point Tracking in a Photovoltaic System. Energies 2019, 12, 1843. [Google Scholar] [CrossRef] [Green Version]
  82. Veerachary, M. Fourth-order buck converter for maximum power point tracking applications. IEEE Trans. Aerosp. Electron. Syst. 2011, 47, 896–911. [Google Scholar] [CrossRef]
  83. Singh, G.K. Solar power generation by PV (photovoltaic) technology: A review. Energy 2013, 53, 1–13. [Google Scholar] [CrossRef]
  84. Ishaque, K.; Salam, Z.; Lauss, G. The performance of perturb and observe and incremental conductance maximum power point tracking method under dynamic weather conditions. Appl. Energy 2014, 119, 228–236. [Google Scholar] [CrossRef]
  85. Li, C.; Chen, Y.; Zhou, D.; Liu, J.; Zeng, J. A High-Performance Adaptive Incremental Conductance MPPT Algorithm for Photovoltaic Systems. Energies 2016, 9, 288. [Google Scholar] [CrossRef] [Green Version]
  86. Mei, Q.; Shan, M.; Liu, L.; Guerrero, J.M. A Novel Improved Variable Step-Size Incremental-Resistance MPPT Method for PV Systems. IEEE Trans. Ind. Electron. 2011, 58, 2427–2434. [Google Scholar] [CrossRef]
  87. Jately, V.; Azzopardi, B.; Joshi, J.; Venkateswaran, V.B.; Sharma, A.; Arora, S. Experimental Analysis of hill-climbing MPPT algorithms under low irradiance levels. Renew. Sustain. Energy Rev. 2021, 150, 111467. [Google Scholar] [CrossRef]
  88. Raedani, R.; Hanif, M. Design, testing and comparison of P&O, IC and VSSIR MPPT techniques. In Proceedings of the 2014 International Conference on Renewable Energy Research and Application (ICRERA), Milwaukee, WI, USA, 19–22 October 2014; pp. 322–330. [Google Scholar]
  89. AHMED, E.; Shoyama, M. Scaling Factor Design Based Variable Step Size Incremental Resistance Maximum Power Point Tracking for PV Systems. J. Power Electron. 2012, 12, 164–171. [Google Scholar] [CrossRef] [Green Version]
  90. Larbes, C.; Aït Cheikh, S.; Obeidi, T.; Zerguerras, A. Genetic algorithms optimized fuzzy logic control for the maximum power point tracking in photovoltaic system. Renew. Energy 2009, 34, 2093–2100. [Google Scholar] [CrossRef]
  91. Miller, J.A.; John, H.; Lienhard, V. Impact of extraction on a humidification–dehumidification desalination system. Desalination 2013, 313, 87–96. [Google Scholar] [CrossRef]
  92. Zhani, K.; Bacha, H.B.; Damak, T. Modeling and experimental validation of a humidification–dehumidification desalination unit solar part. Energy 2011, 36, 3159–3169. [Google Scholar] [CrossRef]
  93. Koschikowski, J.; Wieghaus, M.; Rommel, M. Solar thermal-driven desalination plants based on membrane distillation. Desalination 2003, 156, 295–304. [Google Scholar] [CrossRef]
  94. Wu, G.; Zheng, H.-F.; Wang, F.; Chang, Z.-H. Parametric study of a tandem desalination system based on humidification-dehumidification process with 3-stage heat recovery. Appl. Therm. Eng. 2017, 112, 190–200. [Google Scholar] [CrossRef]
  95. El-Dessouky, H.T.; Ettouney, H.M. Fundamentals of Salt Water Desalination; Elsevier: Amsterdam, The Netherlands, 2002. [Google Scholar]
  96. Chang, Z.; Zheng, H.; Hou, J.; Wu, G.; Mao, J. Study on the performance of two-stage multi effect solar humidification and dehumidification brackish water desalination device. Trans. Beijing Inst. Technol. 2015, 35, 27–33. [Google Scholar] [CrossRef]
  97. Li, M. Research on MPPT algorithm and control of photovoltaic power generation. In Proceedings of the Anhui University of Science and Technology, 2020 The International Conference on Power Engineering (ICPE 2020), Energy Reports. Guangzhou, China, 19–21 December 2020. [Google Scholar]
  98. Singer, S.; Rozenshtein, B.; Surazi, S. Characterization of PV array output using a small number of measured parameters. Sol. Energy 1984, 32, 603–607. [Google Scholar] [CrossRef]
  99. Zhao, B.; Xue, M.; Ge, X.; Xu, W. Research on calculation method of output power of photovoltaic power generation system. Power Syst. Clean Energy 2010, 26, 19–24. [Google Scholar]
  100. AI, Y.; Wang, X.; Li, B.; Duan, J. Comparative analysis of power generation calculated in different statistical periods of photovoltaic power stations. Power Syst. Clean Energy 2012, 28, 85–89. [Google Scholar]
  101. Ma, T.; Yang, H.; Lu, L. Solar photovoltaic system modeling and performance prediction. Renew. Sustain. Energy Rev. 2014, 36, 304–315. [Google Scholar] [CrossRef]
  102. Meral, M.E.; Dinçer, F. A review of the factors affecting operation and efficiency of photovoltaic based electricity generation systems. Renew. Sustain. Energy Rev. 2011, 15, 2176–2184. [Google Scholar] [CrossRef]
  103. Pradhan, A.; Panda, B. Experimental Analysis of Factors Affecting the Power Output of the PV Module. Int. J. Electr. Comput. Eng. (IJECE) 2017, 7, 3190–3197. [Google Scholar] [CrossRef] [Green Version]
  104. Su, J.; Yu, S.; Zhao, W.; Wu, M.; Shen, Y.; He, H. Mathematical model for silicon solar cell engineering. Acta Energ. Sol. Sin. 2001, 22, 409–412. [Google Scholar]
  105. Zhang, X.; Cao, R. Solar Photovoltaic Grid Connected Power Generation and Its Inverter Control; China Machine Press: Beijing, China, 2011. [Google Scholar]
  106. He, W.; Tan, P. Simulation of Simplified Model of Photovoltaic Cell Based on Matlab. Commun. Power Sources Technol. 2019, 36, 31–34. [Google Scholar]
  107. Piegari, L.; Rizzo, R. Adaptive perturb and observe algorithm for photovoltaic maximum power point tracking. IET Renew. Power Gener 2010, 4, 317–328. [Google Scholar] [CrossRef]
  108. Abddelsalam, A.K.; Massoud, A.M.; Ahmed, S.; Enjeti, P.N. High-performance adaptive perturb and observe MPPT technique for photovoltaic-based microgrids. IEEE Trans. Power Electron. 2011, 26, 1010–1021. [Google Scholar] [CrossRef]
  109. Jiang, Y.; Qahouq, J.A.A.; Haskew, T.A. Adaptive step size with adaptive-perturbation-frequency digital MPPT controller for a singlesensor photovoltaic solar system. IEEE Trans. Power Electron. 2013, 28, 3195–3205. [Google Scholar] [CrossRef]
  110. Killi, M.; Samanta, S. Modified perturb and observe MPPT algorithm for drift avoidance in photovoltaic systems. IEEE Trans. Ind. Electron. 2015, 62, 5549–5559. [Google Scholar] [CrossRef]
  111. Ahmed, J.; Salam, Z. A modified P & O maximum power point tracking with reduced steady-state oscillation and improved tracking efficiency. IEEE Trans. Sust. Energy 2016, 7, 1506–1515. [Google Scholar]
  112. Rong, D. Improved Interference Observation Method for Photovoltaic Maximum Power Tracking. J. Electr. Power Syst. Autom. Chem. 2017, 29, 104–109. [Google Scholar]
  113. Li, X.; Xu, J. Maximum Power Point Tracking Control for Grid-Connected Power Supply of Photovoltaic Power Generation System. Comput. Simul. 2019, 36, 117–120. [Google Scholar]
  114. Alamir, M.; Pannocchia, G. A New Formulation of Economic Model Predictive Control without Terminal Constraint. Automatica 2021, 125, 189–197. [Google Scholar] [CrossRef]
  115. Zhang, W.; Wang, Y.; Ni, H.; Liang, Y. Study on Dual Fuzzy Adaptive Disturbance Observation Method for Photovoltaic System. Power Supply Technol. 2019, 43, 1520–1524. [Google Scholar]
  116. Li, S.; Li, K.; Chen, Y.; Yang, R.; Gao, X. Composite MPPT Algorithm Based on Improved Particle Swarm Optimization and Variable Step Size Perturbation. J. Chongqing Univ. Technol. Nat. Sci. 2019, 33, 207–213. [Google Scholar]
  117. Wang, S.; Zheng, J.; Zhang, G.; Zhang, L. Research on MPPT of Photovoltaic System Based on Improved Variable Step Size Perturbation Observation Method. J. Guangxi Univ. Nat. Sci. Ed. 2018, 4, 1032–1043. [Google Scholar]
  118. Yan, Y.T.; Yang, Y.; Yang, J.Q.; Zhang, B.W. Modeling and Simulation of MPPT Algorithm for PV Grid-Connected System. Adv. Mater. Res. 2014, 945, 3227. [Google Scholar] [CrossRef]
  119. Wang, J. Research on MPPT Control Technology of Solar Power Generation System; Harbin University of Technology: Harbin, China, 2017. [Google Scholar]
Figure 1. Characteristic curves of constant temperature and change of irradiance.
Jmse 11 00222 g001
Figure 2. Characteristic curves of constant irradiance and change of temperature.
Jmse 11 00222 g002
Figure 3. Schematic diagram of a two-stage HDH seawater desalination device.
Jmse 11 00222 g003
Figure 4. System block diagram of the desalination device and the heat collection cycle device: 1. Temperature Sensor; 2. Water pump; 3. Water valve; 4. Liquid level sensor; 5. Fans.
Jmse 11 00222 g004
Figure 5. The freshwater yield over time.
Jmse 11 00222 g005
Figure 6. Structural diagram of photovoltaic power generation system.
Jmse 11 00222 g006
Figure 7. Irradiance and PV power generation changing curve over time.
Jmse 11 00222 g007
Figure 8. Equivalent circuit diagram of photovoltaic cell.
Jmse 11 00222 g008
Figure 9. MPPT Control block diagram.
Jmse 11 00222 g009
Figure 10. The flowchart of the P&O MPPT algorithm.
Jmse 11 00222 g010
Figure 11. Analysis diagram of oscillation phenomenon.
Jmse 11 00222 g011
Figure 12. Analysis diagram of misjudgment phenomenon.
Jmse 11 00222 g012
Figure 13. Boost transform circuit.
Jmse 11 00222 g013
Figure 14. Flowchart of the improved P&O MPPT.
Jmse 11 00222 g014
Figure 15. MATLAB/Simulink model of the solar PV module with P&O MPPT method.
Jmse 11 00222 g015
Figure 16. Performance of P&O MPPT (small step size).
Jmse 11 00222 g016
Figure 17. Performance of P&O MPPT (large step size).
Jmse 11 00222 g017
Figure 18. Power generation of P&O MPPT and improved P&O MPPT.
Jmse 11 00222 g018
Figure 19. Duty cycle of P&O MPPT and improved P&O MPPT.
Jmse 11 00222 g019
Figure 20. Freshwater output at different temperatures of the water tank.
Jmse 11 00222 g020
Figure 21. The control flowchart.
Jmse 11 00222 g021
Figure 22. Part of the experimental devices.
Jmse 11 00222 g022
Figure 23. Relationship between daily irradiation, water production, and power generation in July 2021.
Jmse 11 00222 g023
Figure 24. The temperature difference between the feed seawater and the water tank with the water production rate over time.
Jmse 11 00222 g024
Table 1. Main parameters of PV panel.
Maximum Power/WShort Circuit Current   ( I s c ) / A Open Circuit Voltage   ( U o c ) / V Maximum Power Point Current   ( I m ) / A Maximum Power Point
Voltage   ( U m ) / V
Number of PV Panels   ( N ) /PCS
2709.0637.28.6531.26
Standard Test Conditions Temperature T S T C = 25 °C, Irradiance S S T C = 1000 W/m2.
Table 2. Main parameters of DC–DC boost converter.
Input Voltage   ( V i ) / V Resistive Load   ( R ) Inductor   ( L ) /µH Capacitor   ( C ) /mF Switching Frequency
  ( f ) /KHz
31.23023100
Disclaimer/Publisher’s Note: The statements, opinions and data contained in all publications are solely those of the individual author(s) and contributor(s) and not of MDPI and/or the editor(s). MDPI and/or the editor(s) disclaim responsibility for any injury to people or property resulting from any ideas, methods, instructions or products referred to in the content.

