1. Introduction
The partial safety factor method is a design approach by which a target safety level is achieved and ensured by applying load and resistance factors to characteristic values of the governing variables. These governing variables consist of load effects and the resistance of the structure by virtue of its strength. The characteristic values of loads and resistance variables are selected as specific quantiles of their probability distributions. The provision of partial safety factors reflects the uncertainty in load effects and resistance and the target safety class. Structural reliability analysis methods are used in probabilistic design to evaluate or calibrate partial safety factors for a given design case.
The set of partial safety factors is an important element for the design and safer operation of pipelines for a prescribed time. Thus, the safety factor estimation of oil and gas corroded pipelines needs high-fidelity models and appropriate design methods. During operations, pipelines might face several uncertainties relative to degradation, which influence the calculation of safety factors. This implies that an appropriate partial safety factor is a key measure to ensure sufficient strength reserve from early design to the operational scenario. The partial safety factors account for pipe defects and other uncertainties; moreover, they also relate the maximum allowable pressure to the hydrostatic test pressure. The design standards-based assessment procedures are easy to apply, yet they may introduce large safety margins.
The design codes and standards lack a dedicated partial safety factor estimation method, although some supplementary explanations are provided [
1,
2]. On the other hand, investment costs and the safety of the pipeline’s infrastructure are greatly influenced by partial safety factors. For example, design and maintenance requirements are inflated with high values of safety factors. On the other hand, low safety factors could underrate the actual risks of pipeline failure. Therefore, a successful pipeline project requires meticulous estimation of partial safety factors. A sophisticated reliability analysis is admissible not only to determine the most practical partial safety factor but also to reflect the intrinsic uncertainties of the design and operational variables.
The design, construction, operation and maintenance of pipelines is regulated through pipeline integrity management approaches [
3,
4,
5,
6]. Through well-established management systems and operational procedures, such approaches vastly cover the issues related to pipeline defect identification, assessments of defect growth based on inline inspection and theoretical methods, and developing risk-based maintenance and repair strategies [
1,
2].
Time-dependent degradation processes such as corrosion are generally neglected in the probabilistic design of new structures. Conversely, corrosion degradation has a detrimental effect on pipeline integrity. Corrosion is an intricate phenomenon that has random characteristics and, consequently, it has attracted significant attention. Some significant studies in this context have been presented by Teixeira et al. [
7,
8,
9].
The pipelines are susceptible to burst failure when undergoing corrosion and are internally pressurised. For the safety of corroded pipelines, accurate burst pressure prediction is the key factor and thereupon, strength prediction models have been proposed by using numerical, theoretical and experimental techniques [
10]. In the past decade, several burst strength models have been developed for new generations of pipelines; however, they have not been specifically assessed for different steel grades [
11].
Efficient pipeline systems with modified geometric and material properties have been used to provide a solution to the challenges posed by the oil and gas industries. As per the API 5L definition, Grade B, X42, X46, X52, X56, X60, X65, X70, X80, and X100 have been developed for oil and gas transmission at onshore, offshore and sour services [
11,
12].
Recent developments have intensified the fact that a corroded pipe’s burst behaviour changes with the steel grade [
12,
13,
14,
15,
16,
17]. Previous studies [
11,
18] have implemented a comparative study on burst strength models and have provided recommendations for model selection. Burst pressure prediction models must provide an adequate safety margin for corroded pipelines in all steel grades [
19]. Although the DNV code is the most extensively used recommended practice for corroded pipelines, the quality of other burst strength models cannot be neglected. More importantly, the adoption of a model concerning the pipe material grade is important and has been assessed in earlier studies. A recent study has provided an approach for structural reliability assessment involving calibrated strength models [
20]. This approach has illustrated a framework to reduce the uncertainties associated with the strength model’s selection. However, uncertainties in estimating partial safety factors have not been addressed.
Previous reliability studies [
7,
18,
21,
22,
23,
24,
25,
26] have incorporated the topic of pipe safety with the derivation of the reliability index (probability of failure), but the partial safety factor estimation for defective pipelines has not been paid much attention [
27]. The DNV recommended practice [
2] specifies safety factors to accomplish yearly reliability levels that are attuned to capture uncertainties associated with pipe design variables. However, the impact of pipe corrosion defects and uncertainties in calculating partial safety factors are not explicitly described.
Partial safety factors for structures undergoing corrosion are not frequently estimated and the literature is limited in this regard [
28,
29]. One recent study has proposed a safety factor estimation scheme based on risk factors for corroded pipelines and their range [
29]. A standard known as HPI FFS has been developed by the high-pressure institute of Japan that includes the effect of metal loss in the safety factor estimation of pressure vessels [
30]. Machida et al. [
31] have evaluated partial safety factors for circumferential flawed pipes used in fitness-for-service assessments.
The probability of failure is a function of defects and other conditions; thus, it is necessary to estimate partial safety factors to clarify the relation between the probability of failure and defect impact. The adopted strength model is an important aspect that impacts the estimation of safety factors.
Following from the above discussion, the present study aims to calculate partial safety factors and assess prediction uncertainty for pressurised corroded pipelines using probabilistic concepts. A combination of Monte Carlo simulation and the First Order Reliability Method (FORM) is used in this paper. The primary objective of this paper is to assess the variability (or prediction uncertainty) in partial safety factors due to models adopted in each material category.
The remaining paper is arranged in the following way. The methodology is explained stepwise in
Section 2. Using an appropriate case study,
Section 3 discusses the obtained results. In particular, important findings in terms of partial safety factors are described in
Section 3. A brief discussion is then provided. Finally, the conclusions of the conducted study are provided. The ultimate objective of the present study is to evaluate the variability in partial safety factors in the most practical sense within the context of time-varying corrosion in pipelines. The results may help to achieve suitable safety levels of corroded pipelines of different steel grades and consequently, improve design formats and optimise maintenance policies.
2. Methodology
The proposed methodology for the uncertainty assessment of the partial safety factors of corroded pipelines for burst failure is presented in this section. The burst capacity is the maximum pressure sustained by the pipeline before the plastic collapse. Burst capacity depends on the dimension, material of the pipe and corrosion defect parameters. The burst pressure prediction models adopted in this paper are presented in
Appendix A.
Several studies have endorsed the idea of the classification of burst models with pipe material (grades). For example, Cosham et al. [
32] and Amaya-Gómez et al. [
33] have advocated for three material classes as low, medium and high grades. A similar three-material classification has been adopted in some recent studies pertaining to pipe reliability [
34] and the uncertainty quantification of burst strength prediction [
11]. This study also assumes the above-mentioned classification scheme.
The top 10 models are suggested in each category and model uncertainty factors are derived and characterised in order to acknowledge mathematical and methodological uncertainty [
20].
Table 1 presents the top 10 models and statistical moments for the model uncertainty factors adopted from the previous study [
20]. For any random variable, specifying the probability distribution bears a large importance. It has been revealed by statistical testing that the Frechet probability distribution provides the best fitting to the data [
20].
Table 1 also shows the parameters of the Frechet distributions used in the analysis hereafter.
First, the groups of random samples from basic variables related to burst strength are generated using stochastic models. From this generated set of samples, an output array of burst strength can be obtained. Further, the distribution type and corresponding parameters of burst strength can be obtained using appropriate statistical techniques.
Each model prediction (
) can be calibrated by multiplying a model uncertainty factor (
) with the basic model prediction, as shown below
where
is the model prediction using the mathematical form given in
Appendix A.
A limit state function is required to assess the structural reliability of a corroded pipeline. The limit state function defined in this paper is based on the bursting of the pipe, which happens when the internal operating pressure exceeds the pipe capacity. A generalised form of the limit state function
can be formed using the corrected model prediction with the operating pressure as
where
X is the vector of the basic random variables of the limit state function associated with the uncertainties. If
is less than or equal to zero, then the pipeline is assumed to have failed. Conversely, the pipe is safe in a region where
is greater than 0. Now, the failure probability can be described using a joint probability density function
of vector
X as
Evaluating
Pf using Equation (3) is computationally arduous, as a multidimensional integration is required. Thus, approximation or simulation methods are employed to solve such problems. This paper utilises the First-Order Reliability Method (FORM) that assumes a linear approximation of the limit state function. This technique can efficiently estimate reliability with non-normally distributed random basic variables. FORM first transforms the original space of the variable into a normal Gaussian space and calculates the shortest distance from its origin point to the failure surface. The corresponding point in the failure surface is known as the design point (
u∗) and the shortest distance is the reliability index.
The pipe failure probability (
Pf) can be estimated from the reliability index (
β) [
35] by
where
is the standard normal distribution function.
The design method uses safety factors as a margin of safety to compensate for any uncertainty in the load bearing capacity of the structure. The pipe design follows the load and safety factor design (LRFD) method, which involves partial safety factors, as seen below:
where
γL and
γR are the partial safety factors for the load (
L = ) and resistance (
R =
), respectively. Generally, the load and resistance factors are relative to the type of load and resistance. A higher uncertainty in the load variables corresponds to higher load factors; conversely, a higher uncertainty in the resistance implies a lower resistance strength factor. In the present context, Equation (6) can be expressed for pipe failure criteria as:
Pipe resistance (
P) must be characterised for the estimation of partial safety factors. The stochastic modelling of
has already been discussed and presented in
Table 1 [
20]. Uncertainties can never be absolutely eliminated when estimating structural resistance and loading. The uncertainties in the prediction of resistance and load effects are accounted for via partial safety factors. The direct applicability of reliability algorithms in estimating the safety factors is dubious, given the number of models and several defect parameters. Thus, Monte Carlo simulations are used to characterise the burst strength of the pipeline.
When the probabilistic models for the load and resistance terms are known, it is easy to calculate partial safety factors using the following equation:
where
variable* is the value at the design point calculated using the FORM approach and
variablec is the specified characteristic values. The characteristic value can be obtained from the specified fractiles of the corresponding probability distribution function.
The integrity of operational offshore pipelines is assured by identifying hazards and adopting adequate inspection methods. For example, DNV-RP-F116 suggests some inspection methods for marine pipelines [
36]. A reliability analysis is particularly vital when inspection results confirm the corrosion defect. Design codes specify the year until no defects are evidenced, known as year 0. However, this year is not the time from the first year of installation of the pipeline. Thus,
To is the time of the latest inspection when a corrosion defect is reported.
This paper assumes linear corrosion growth with time and identifies partial safety factors as a function of time. Let
dr and
lr be the corrosion rate and
T is the given time instance; the steady-state corrosion depth can be defined as
where
is the corrosion depth at
To. Similarly, the steady-state corrosion length can be defined as
where
is the corrosion length at
To. Using Equations (9) and (10) in the models’ expression (
Appendix A), the partial safety factors of a corroded pipe can be predicted for a future time.
3. Results
This section is dedicated to the implementation of the above-mentioned methodology to access uncertainty in the safety factors of corroded pipes for a given time. The detailed results are shown stepwise in the following discussion. Case studies of low-, medium- and high-grade pipelines are adopted. To perform a reliability analysis, it is necessary to account for the variability in random variables by providing probabilistic models.
Table 2 presents the pipe geometry and material as well as the defect parameters for three grades of pipes. The values for corrosion growth rates (
dr and
lr) are based on the previous study [
24,
37] with minor modifications. Notably, the real corrosion rate depends on various factors and is highly case-specific. Factors such as transporting fluid, electrolyte, environment, pipe material composition and operating conditions are the primary drivers for corrosion growth. Furthermore, the probabilistic models for the above-stated parameters are also shown in
Table 2. A normal distribution is assumed for geometric variables, while the coefficient of variation (
COV) is adopted from Teixeira et al. [
7].
For intact pipelines, design codes prescribe a characteristic value of maximum operating pressure to be 72% of the burst capacity. The same assumption is applied to corroded pipelines. Material properties (yield and tensile strength) are assumed to be log-normally distributed with parameters estimated from their characteristic values [
38]. For the loading parameter (operating pressure),the Gumbel distribution and COV are assumed from Teixeira et al. [
7]. For the corrosion depth and length at
To, Weibull and a log-normal distribution are adopted following Teixeira et al. [
9]. The corrosion growth rates (
dr and
lr) are adopted to be normally distributed. The above-stated assumptions are considered in this paper to demonstrate the case under study.
3.1. Modelling of Resistance
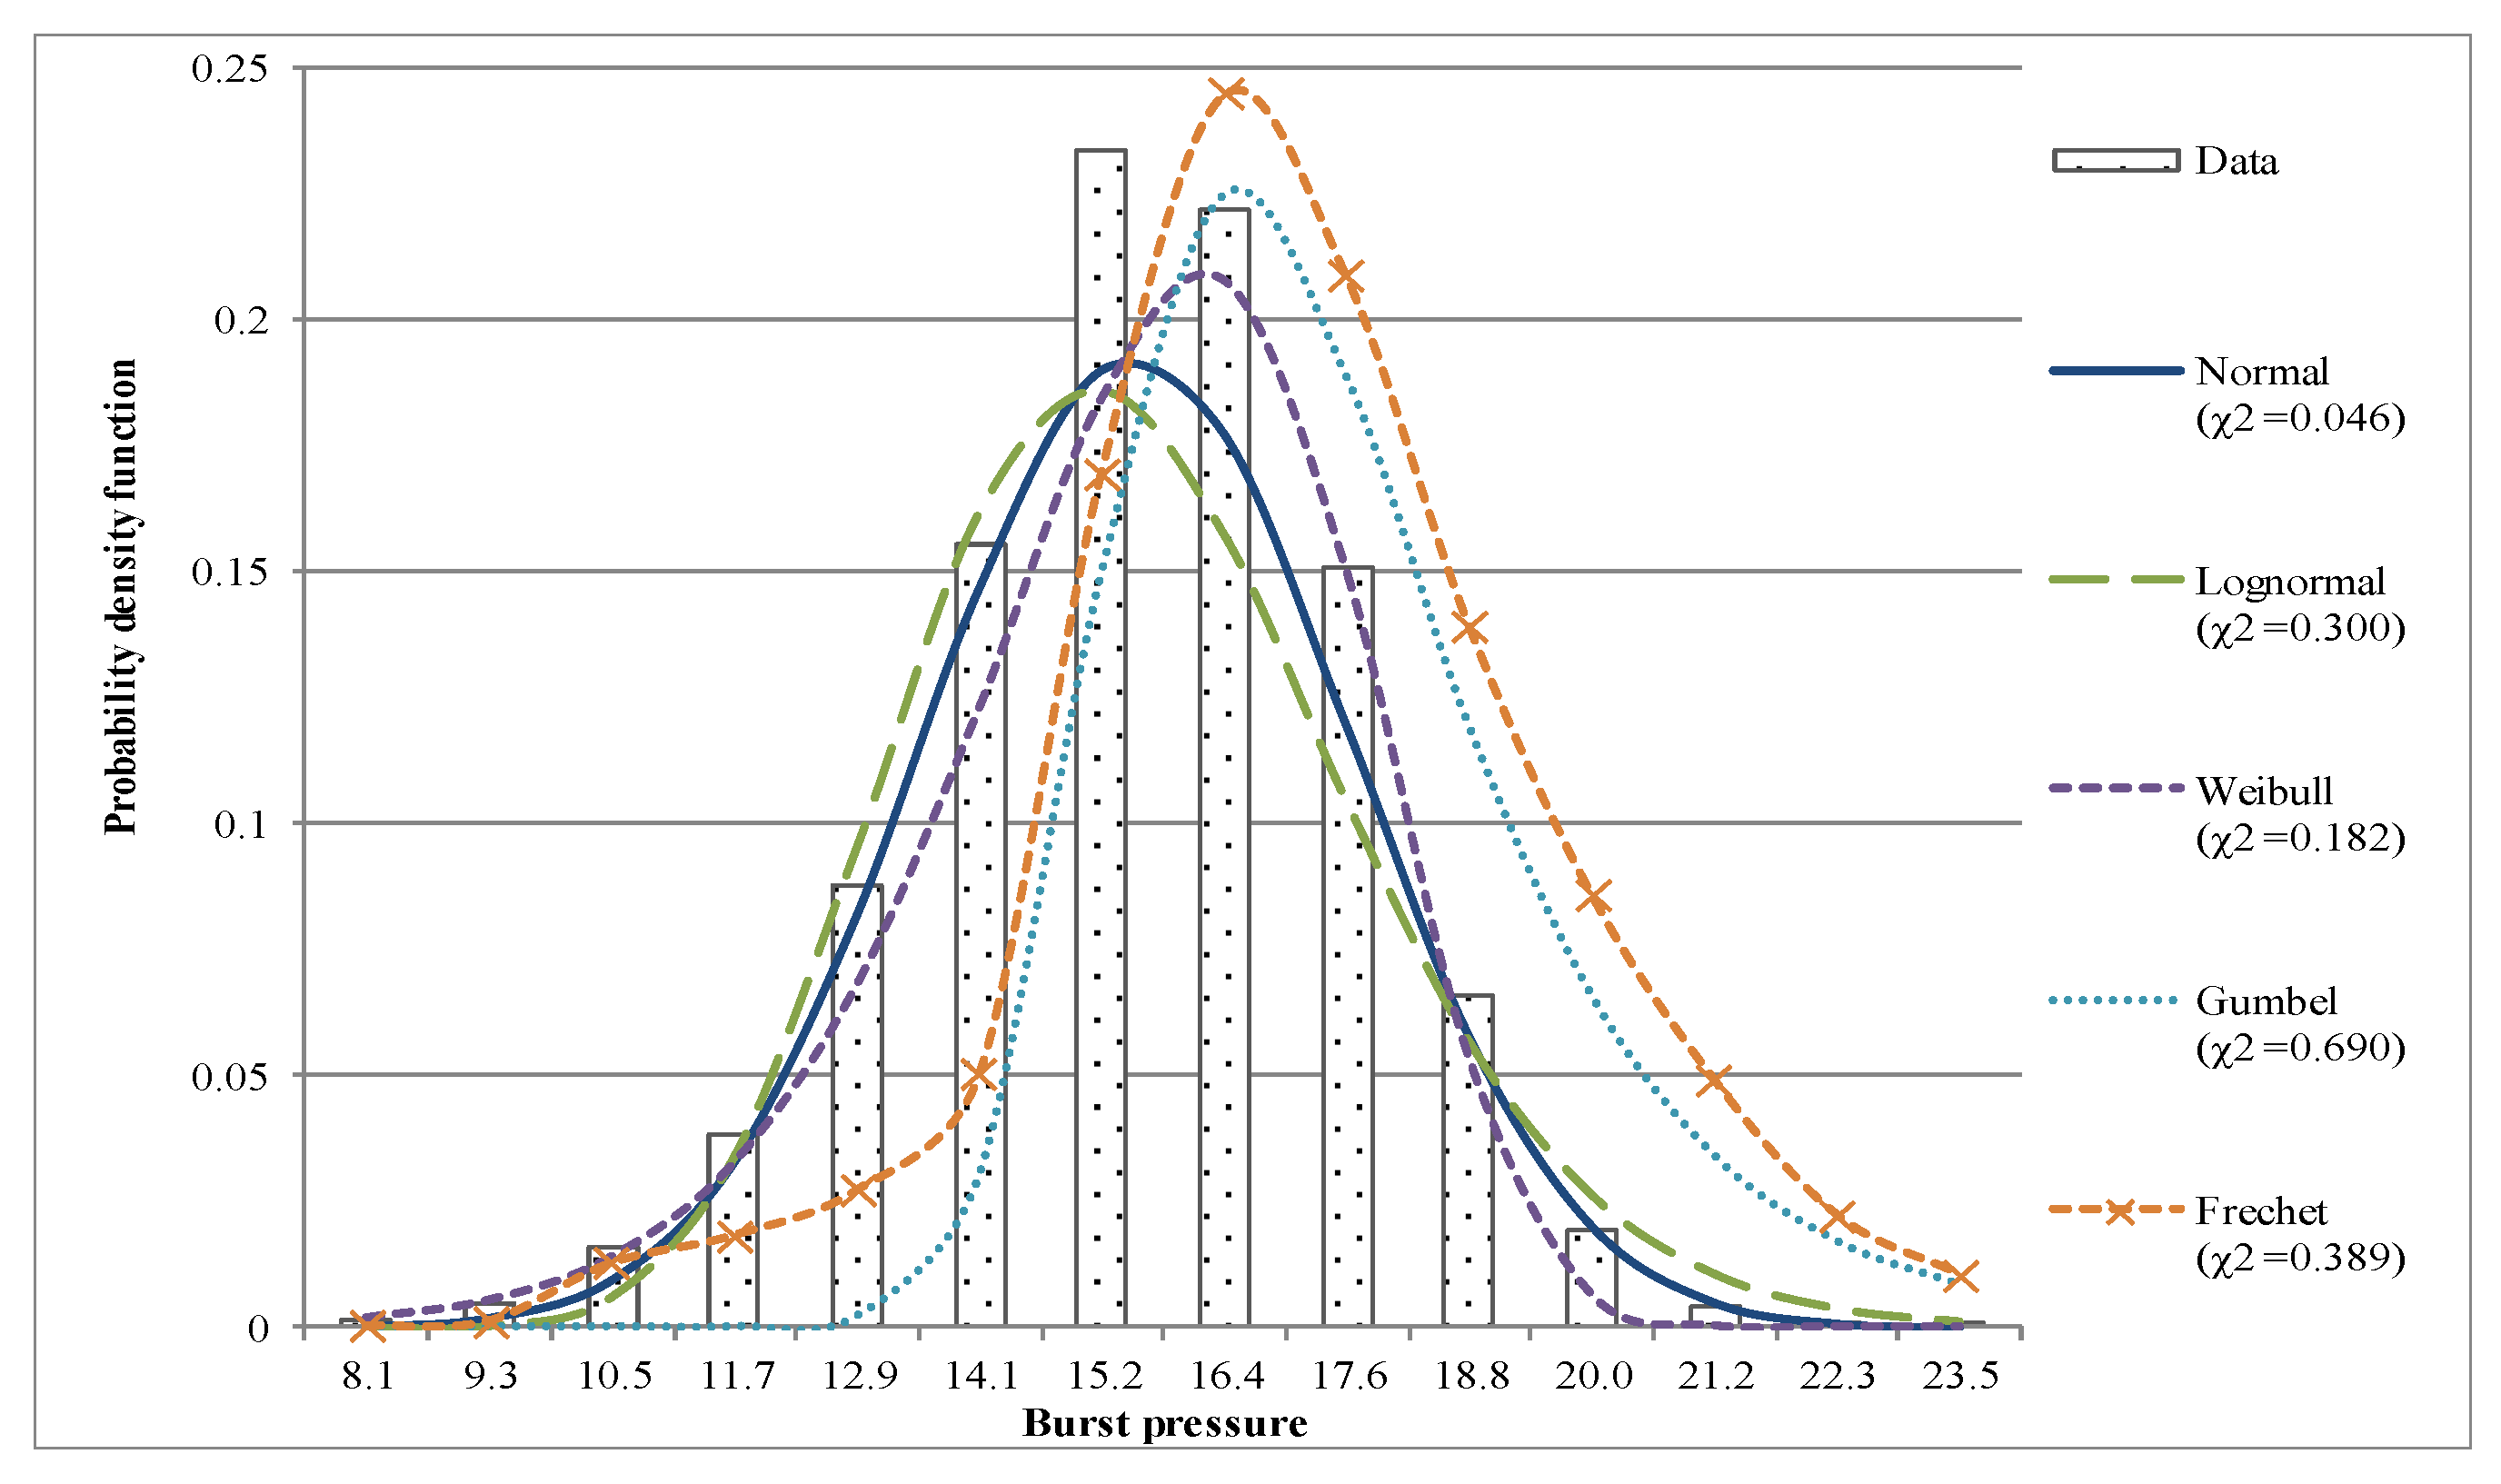
By using Monte Carlo simulation and substituting generated samples (10,000) of random variables for the models, the corresponding series of burst pressures are obtained for them. The Chi-squared testing approach is adopted here, with the results suggesting that a normal distribution is well suited for defining the distribution of burst pressure. A sample result is presented in
Figure 1 with the fitting of distribution and Chi-squared test results [
39]. For the sake of brevity, the statistical properties of the burst pressures for different models and different corrosion levels are not listed here. It should be noted that for the entire operational life and all models, the normal distribution is found to be suitable for describing the probabilistic distribution of
P.
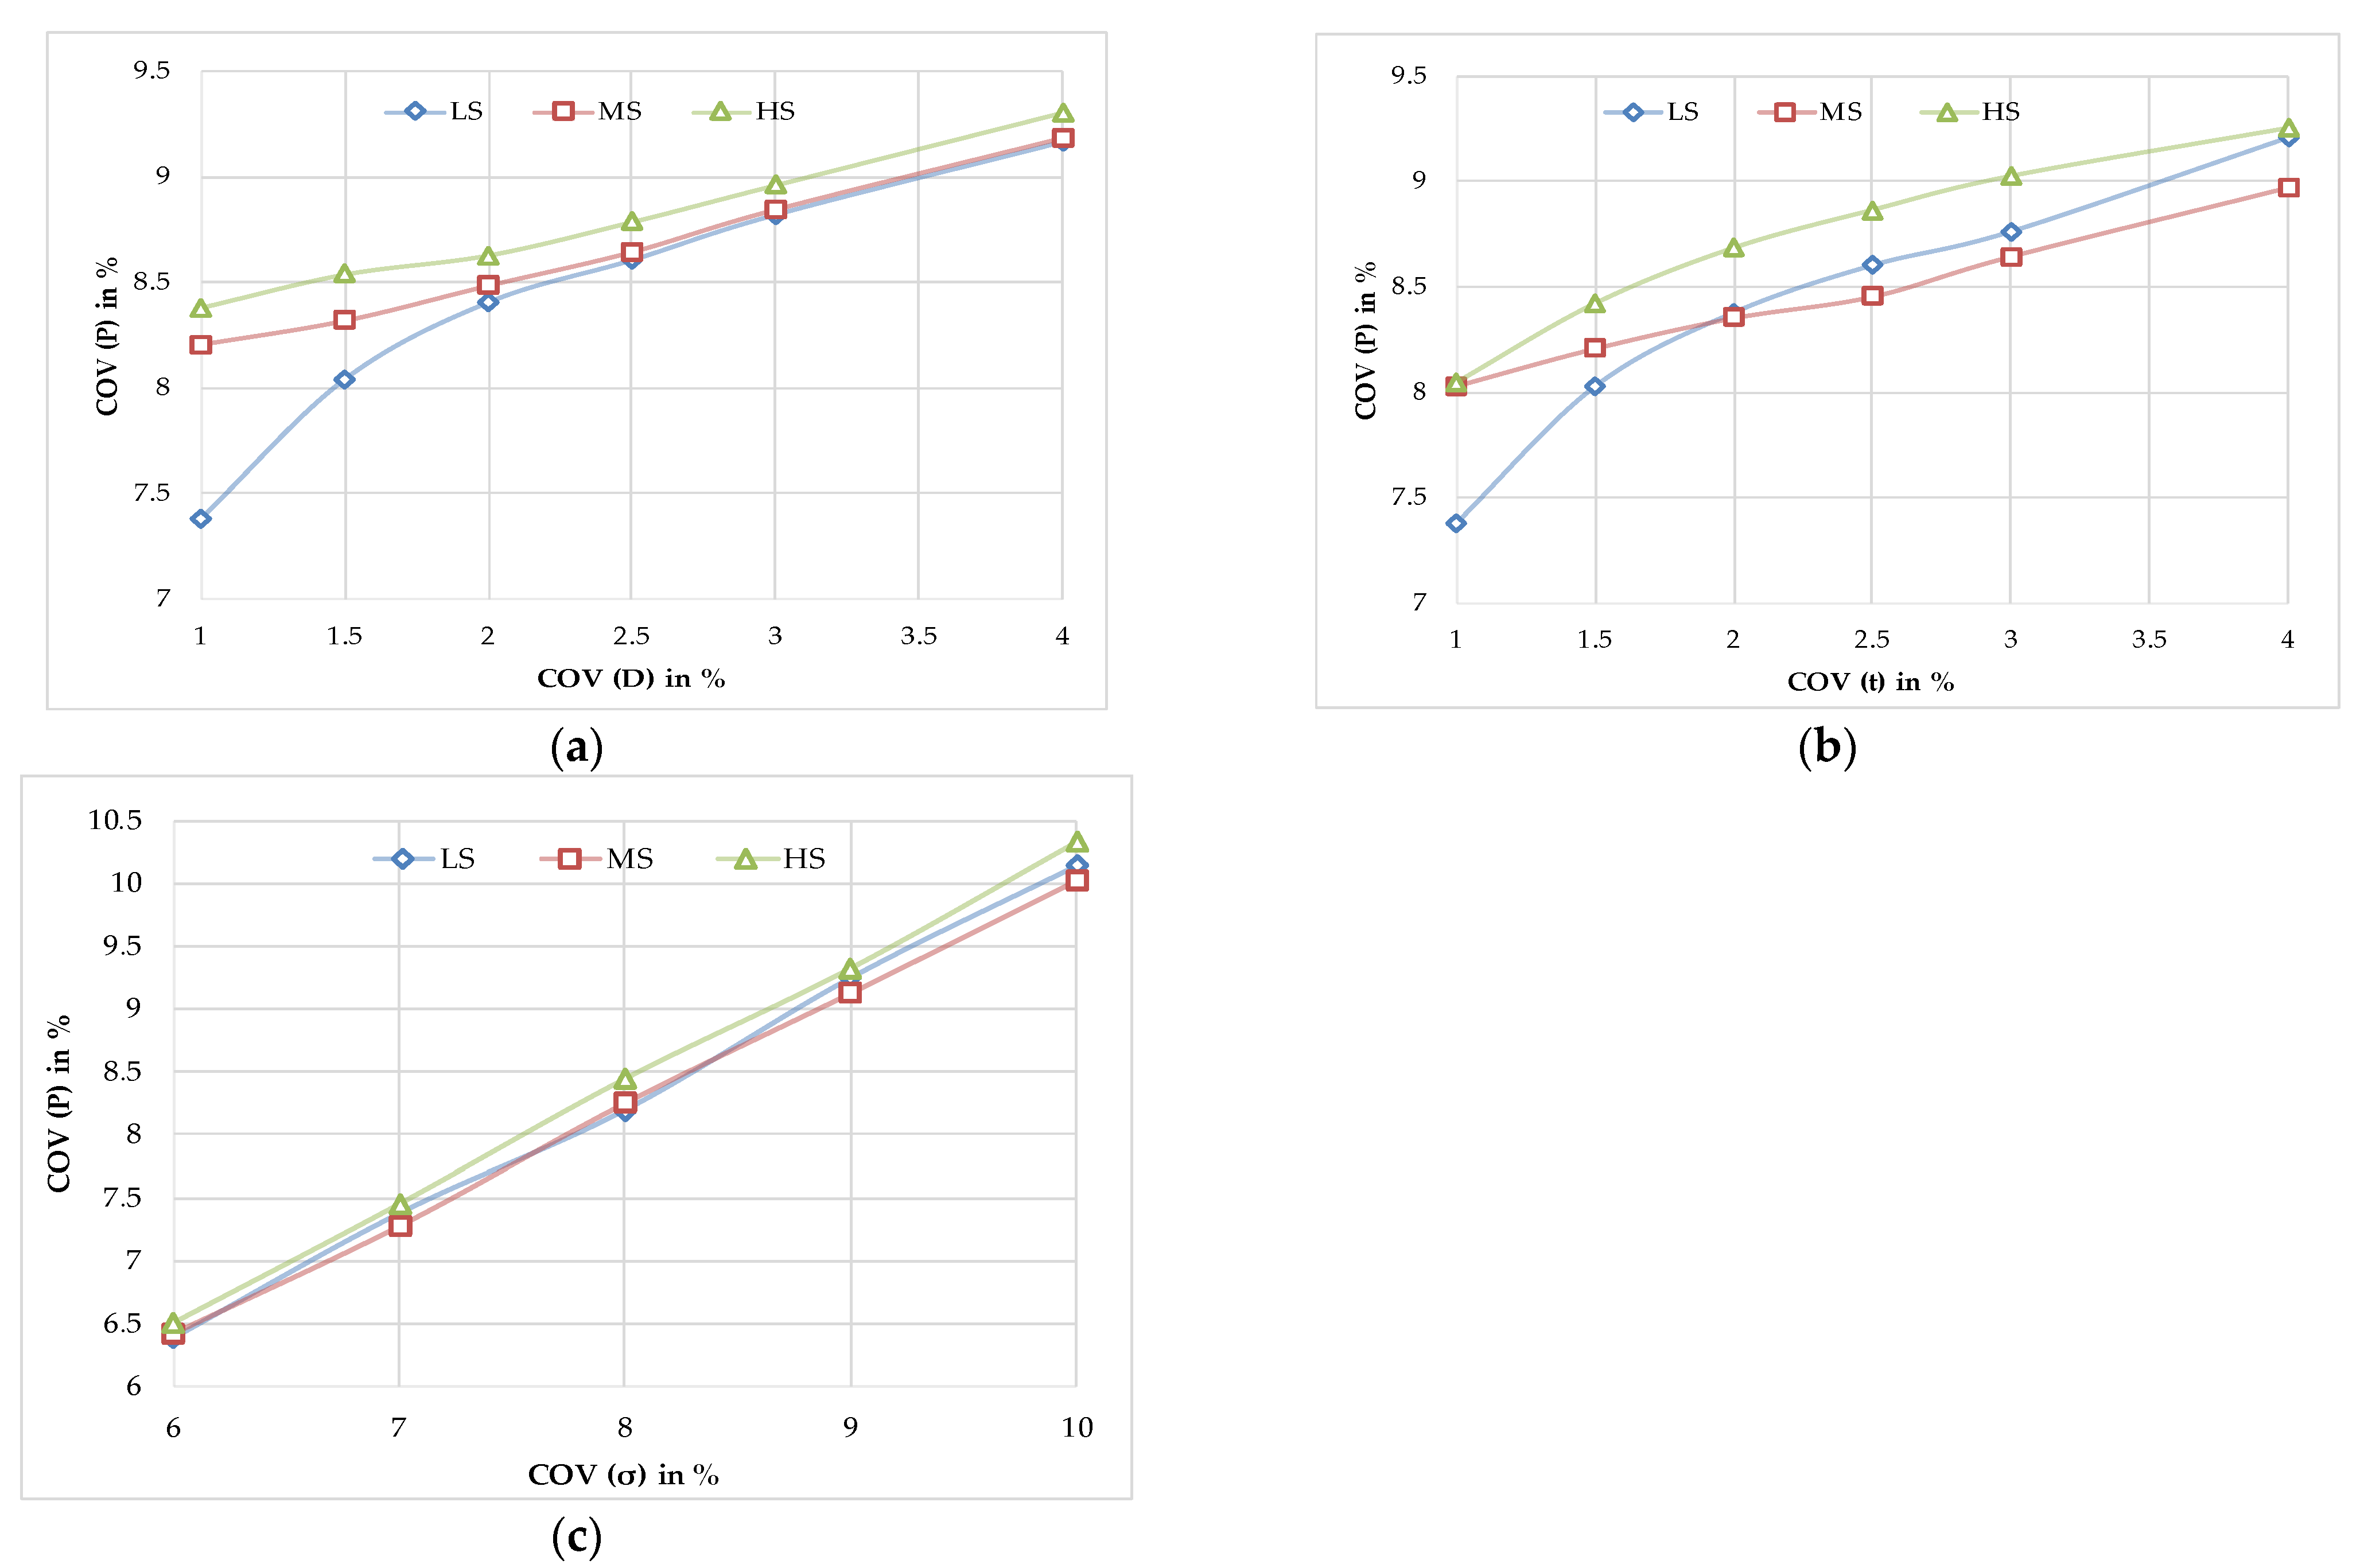
Further, this study investigates the effect of changing the
COV of the random variables that constitute pipe burst resistance. As presented in
Figure 2, the influence of uncertainty associated with geometric parameters such as diameter (a), thickness (b) and material parameters such as strength(c) on uncertainty in burst strength is considered separately. When changing the
COV of diameter from 1 to 4, the maximum change in
P’s uncertainty remains 1.79, 0.98 and 0.92 for low, medium and high grades. Changes of 1.83 (for LS), 0.94 (for MS) and 1.21 (for HS) in the
COV of
P are observed while changing the
COV of thickness from 1 to 4. Strength (yield or tensile) is a key parameter that significantly impacts the resistance, and variations in its
COV (6 to 10) exhibit a linearly increasing trend in the
COV of burst strength for low, medium and high steel grades with 3.75, 3.59 and 3.82 variation in the
COV, respectively.
3.2. Development of Model Correction Factors for the Model to Attain Target Reliability
The models’ predictions and inherent uncertainty vary at every instance of time. Using FORM, the reliability indices are calculated for the 10 models in three categories at
To (intact pipe). As evident in
Table 3, the reliability indices are subjective with respect to the models in each category and show appreciable scatter.
This study assumes a target reliability level to be achieved by each model at this instance of time. To obtain a pragmatic value of the target reliability index, the
β sample presented in
Table 3 is gathered irrespective of material class. The normal distribution is fitted to the
β dataset, and the 95-percentile value is selected (
βtarget = 2.47) as the target safety level.
To correct each model in such a way that each model predicts the same target reliability level, an additional strength factor is introduced. The model strength factor (
) for the reliability adjustment is introduced in the LSF as
Several iterations of reliability analysis are conducted with varying
values in the above equation.
Table 4 presents the values of the factors (
) for the 10 models in three categories at
To that provide the target reliability of 2.47 (=
βtarget). The values are slightly higher than 1 for most cases, with the highest correction factor being required for DNV F101 in low-grade, Petrobras in medium-grade, and NG-18 in high-grade steel. Only a few models have shown
less than 1.
This study further investigates
overtime by similarly targeting new reliability indices as identified above. However, the results are very close to those obtained in
Table 4.
3.3. Development of Partial Safety Factors
Structural reliability methods, particularly FORM, have been extensively used for code calibration, i.e., for the evaluation of partial safety factors (PSFs) to achieve a uniform structural safety level. The calculation of PSFs is very much dependent on the prediction models specified in industrial practices. The PSFs are to be used with characteristic values to account for uncertainty and maintain a specific level of safety as described by the code. This paper focuses on reducing the subjectivity of design models from the perspective of PSFs and thus, the formal calibration of a PSF for a given target reliability is out of scope. The focus is rather on their uncertainty with respect to different steel grades of corroded pipes.
First, this study calculates PSFs for intact pipes of low, medium and high steel grades with the results shown in
Table 5. FORM is employed for the design equation expressed in Equation (6), and the burst pressure adopts a normal distribution, as explained in
Section 3.1, for all the models. The design points evaluated by FORM, together with the design variables’ characteristic values, allow assessing the PSFs using Equation (8). Generally, a lower fractile is used for resistance and a higher fractile for the load term. In the present study, a 5% fractile for resistance and 95% fractile for load are used as characteristic values.
The factors
γL and
γR are calculated and shown in
Table 5, using 10 models in low-, medium- and high-grade steel. The variation in
γL values is negligible and remains around 0.909, whereas
γR appreciably varies with the models. The most suitable
γR may still be reckoned from the mean of 1.315. Similarly, for medium-grade steel (
Table 5), the
γL should be taken as 0.891, while 1.409 is the optimum value for
γR. The models, however, offer higher uncertainties in the prediction of
γR. The highest load safety factors are observed for high-strength pipes with a value of 0.928 (
Table 5). With minimum uncertainty among the model’s prediction of
γR, a value of 1.189 can be prescribed for the high-grade pipe. In addition, the mean and uncertainty (COV) are given in
Table 6. The uncertainty in
γL is negligible for all three categories. The uncertainty in
γR for medium-grade steel is the highest.
This study assesses the effect of corrosion degradation on partial safety factors. The same approach as described above in this section (intact pipes) is adopted to estimate partial safety factors for time-dependent corrosion degradation. The partial safety factors are derived in each steel grade for the top 10 models. The results also provide limits of partial safety factors corresponding to the elapsed life of the pipeline after the first detection of corrosion.
3.3.1. Low-Grade Steel Pipes
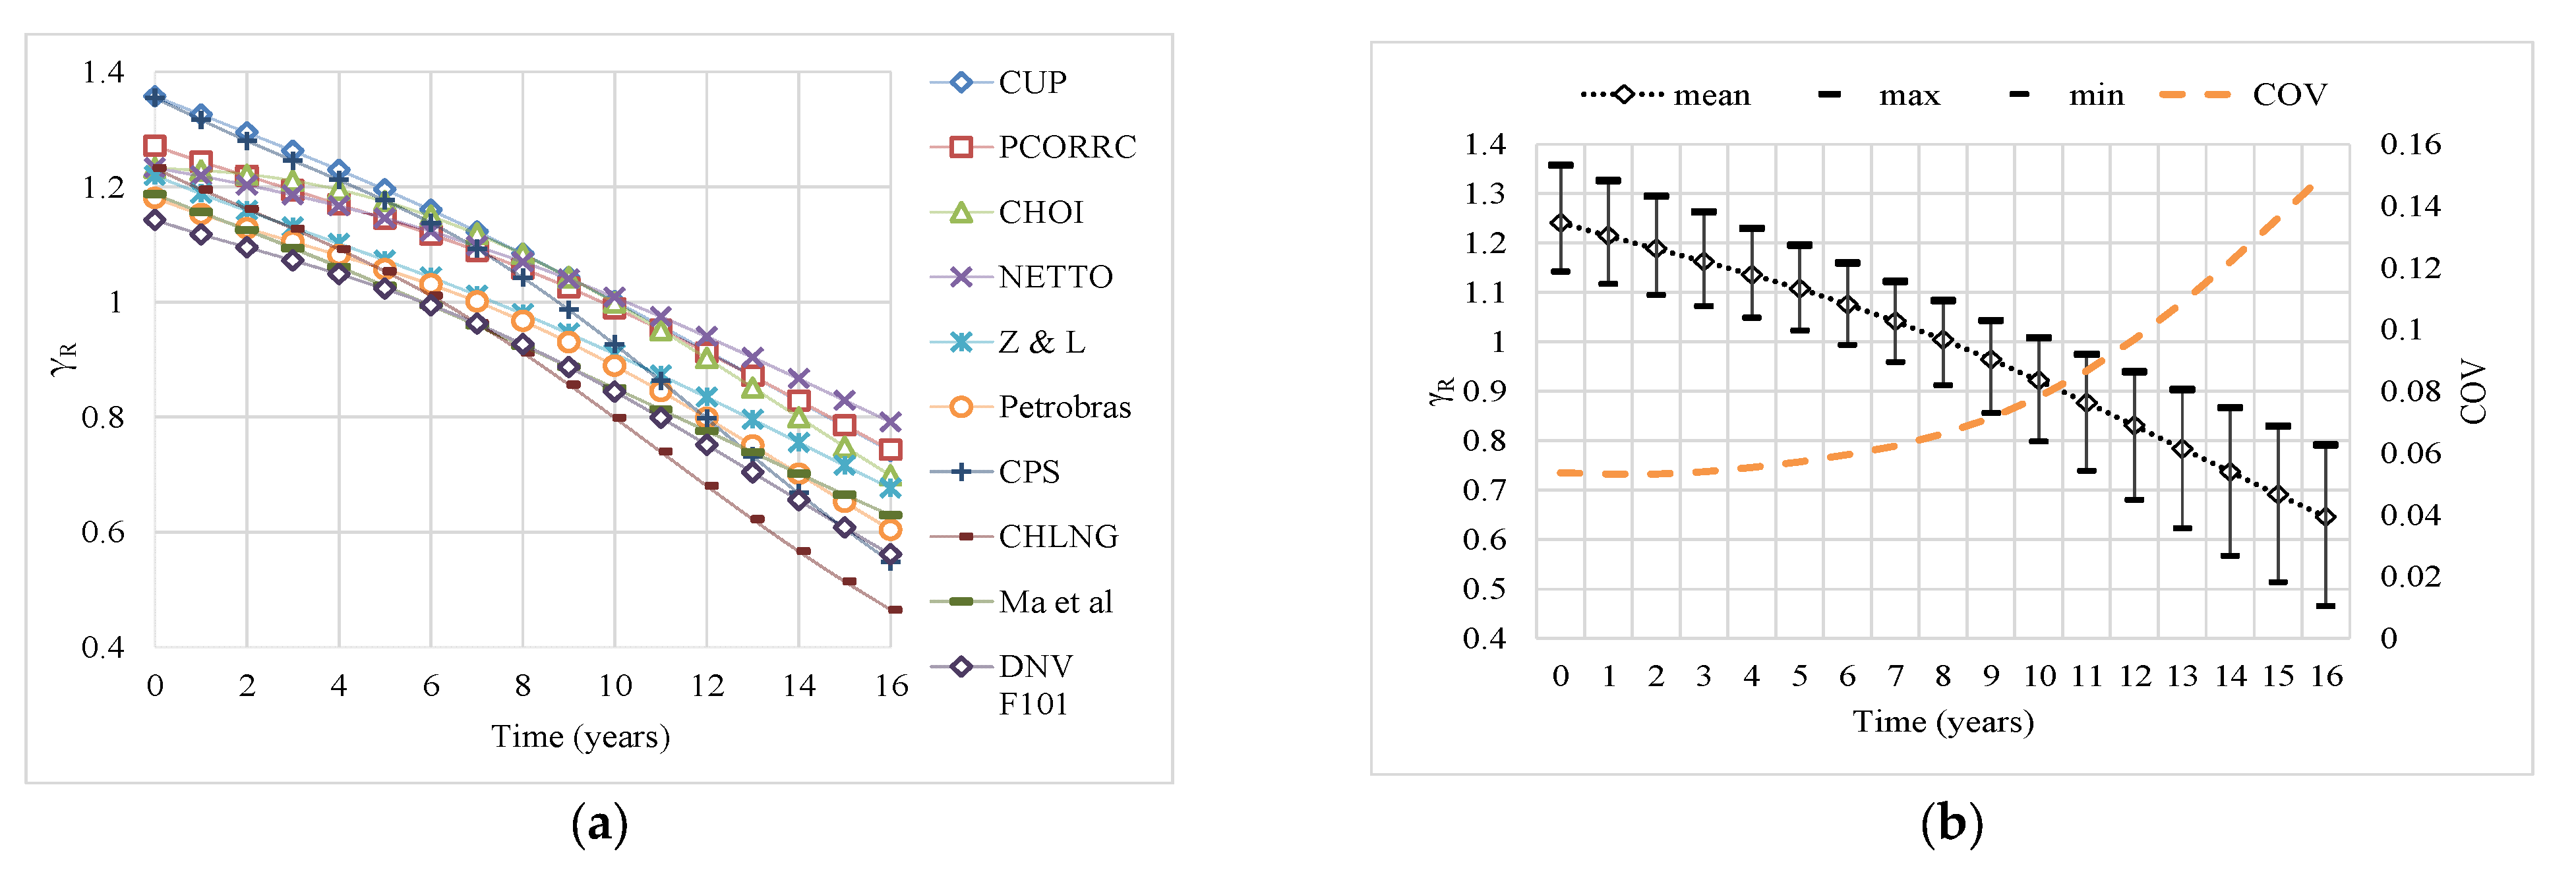
As described above, the
γR shows greater variation with models, so it is only presented first in the present set of analyses. Comparative plots are constructed in
Figure 3a to study the influence of corrosion evolution on the
γR for the low-grade category. Commonly, a higher corrosion level corresponds to a lower partial safety factor of resistance. CUP and NETTO models are responsible for the upper bound of safety factors, while CHLNG and DNV F101 models dictate the lower bound. Z & L, Petrobras and Ma et al. [
13]. provide a closer prediction of
γR with elapsed time.
The results are further presented in three sets: mean, upper and lower limits in
Figure 3b with uncertainty in PSF predictions. The mean
γR varies from 1.24 to 0.646 over 16 years. The most conservative and non-conservative estimates of safety factors are also shown. The uncertainties (COV) become appreciable after the 8th year.
3.3.2. Medium-Grade Steel Pipes
Here the analyses are conducted using medium-grade steel models and the results (
γR vs. time) are plotted in
Figure 4. In particular, the models’ evaluation of
γR is presented in
Figure 4a and their cumulative results, such as mean and
COV, are shown in
Figure 4b. In this material class, PCORRC followed by CUP always realises the non-conservative calculation of safety factors while CHLNG shows the most discrete behaviour, calculating the minimum
γR over the operational life. ORYNYAK, CSA and Fitnet FFS have similar estimations as characterised by NETTO, Z & L and Petrobras with the same pattern of variations.
Figure 4b shows a similar behaviour as described above for low-strength models in
Figure 3b. This figure is focused on the uncertainty caused due to different models; the uncertainty observes a rising trend while passing year 9. It is also revealed that the
γR varies from 1.37 to 0.71 over 16 years.
3.3.3. High-Grade Steel Pipes
Figure 5 shows the partial safety factors calculated for high-grade steel models. As revealed in
Figure 5a, the trends of all the models can be recognised as linear variations. The Z & L followed by the W & Z models specify higher values of
γR for the elapsed life of corroded pipes. The
γR obtained by the traditional model, NG-18, represents the most conservative results. The dispersion among the models’ predictions is significant and as time elapses, tends to disperse slightly more. The same is better reflected and depicted in
Figure 5b. The prediction uncertainties are high and tend to increase with time, whereas the mean
γR varies from 1.02 to 0.83.
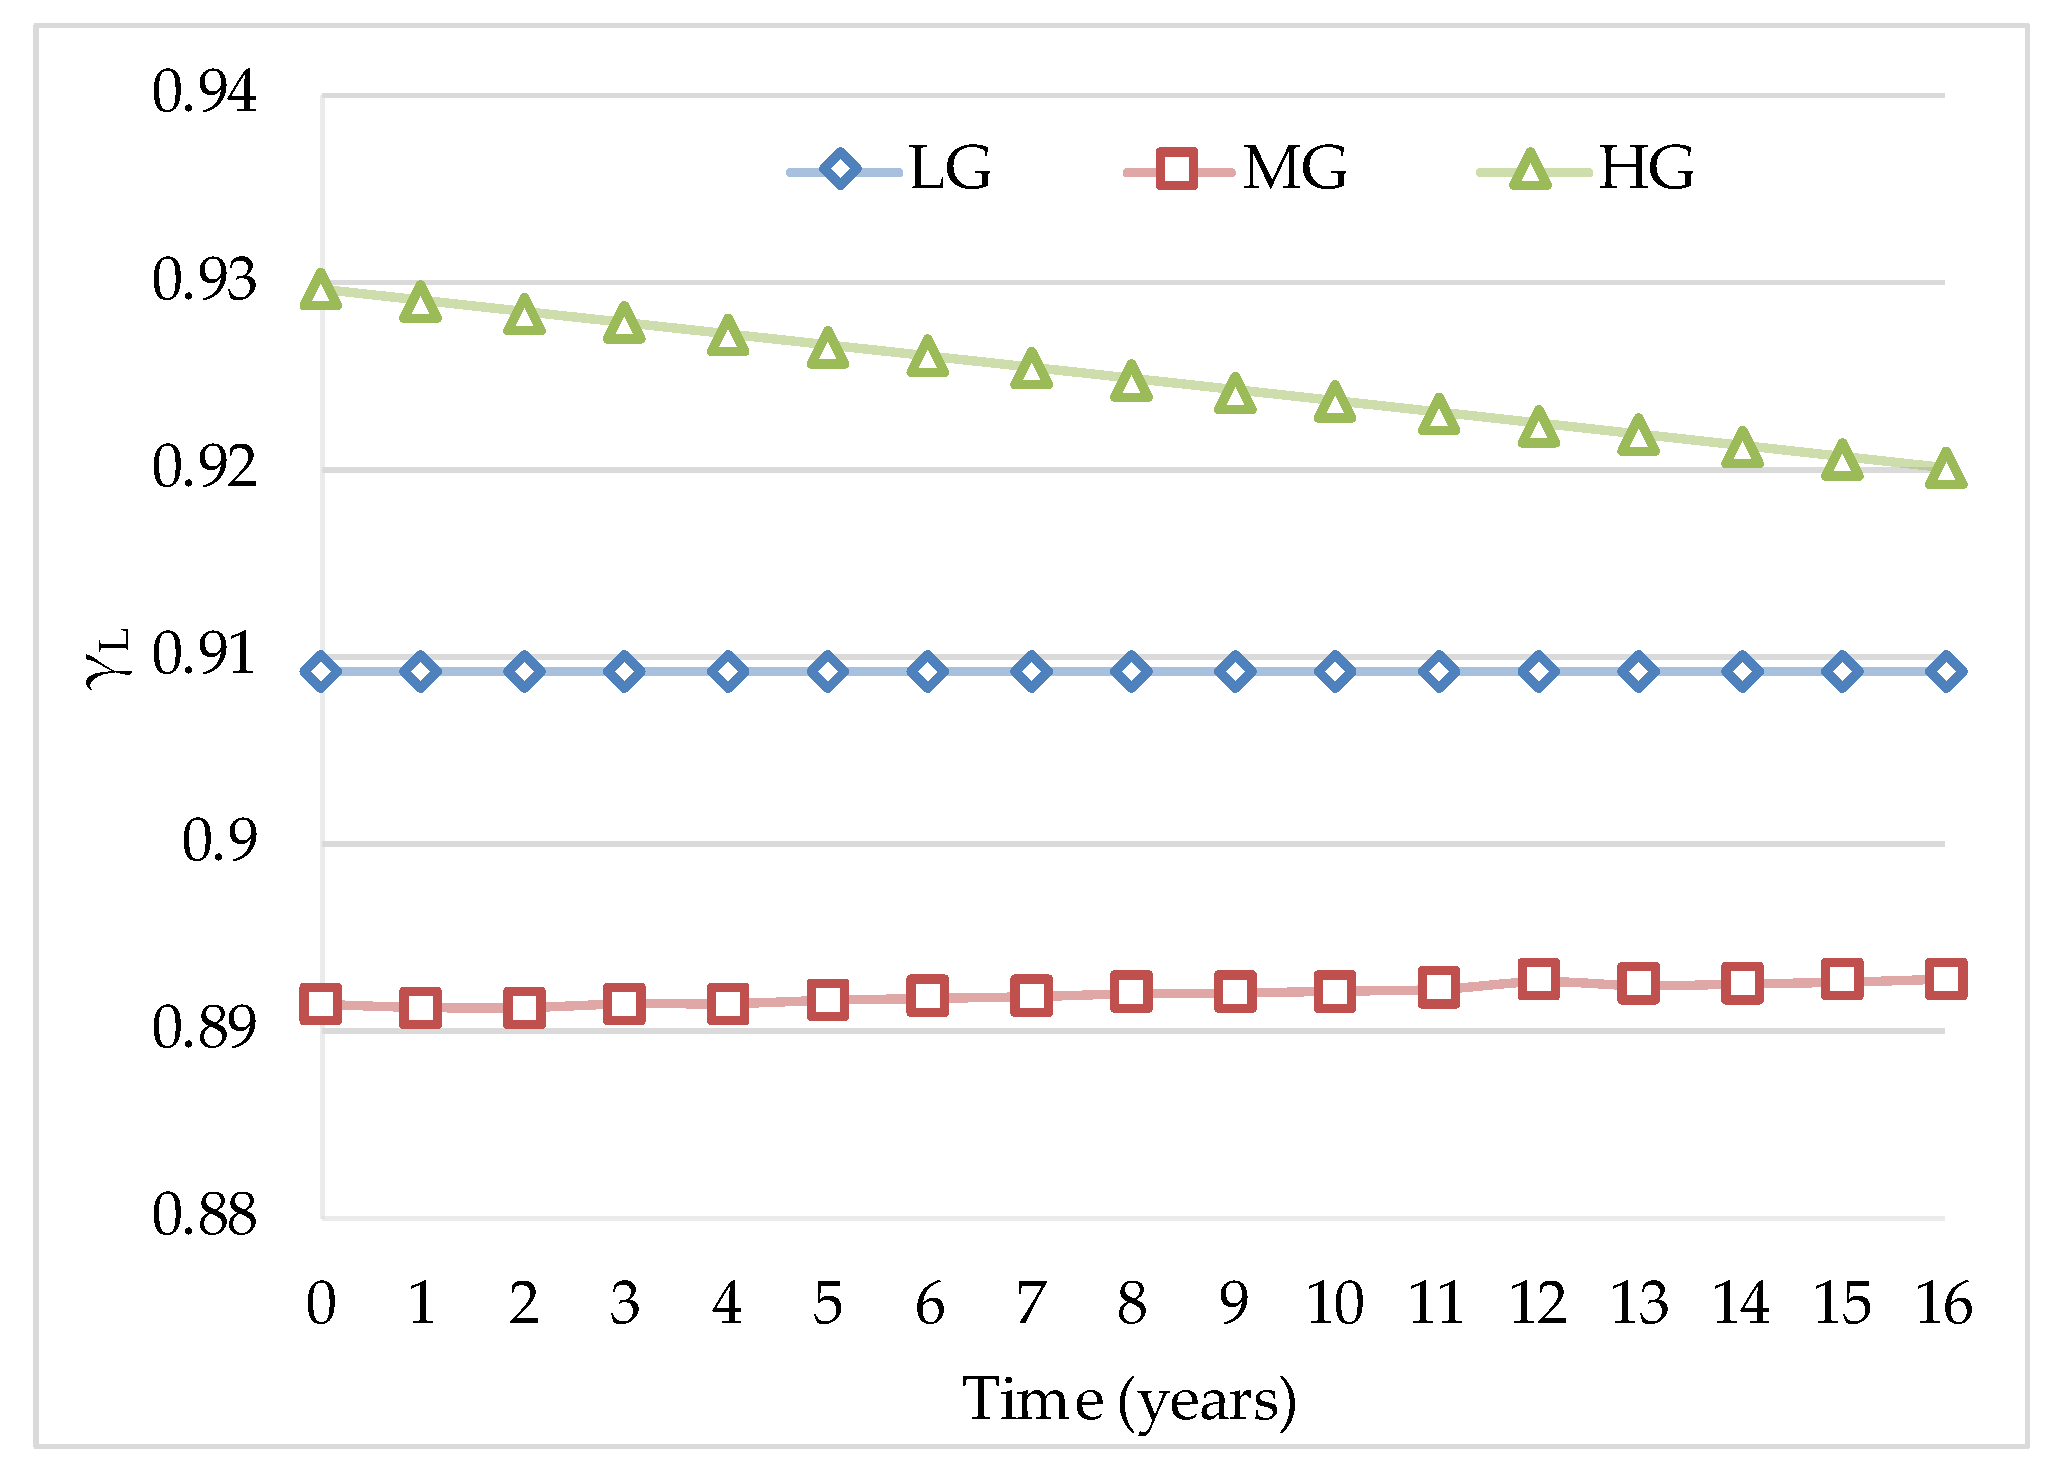
This study further estimates the load safety factors (
γL) using the top 10 models in each category in a similar manner as conducted above. It is found that the uncertainty in the prediction of
γL is negligible and remains around 0.001 (
COV) in all three categories. Therefore, the
γL values predicted by different models are not shown here.
Figure 6 presents the
γL as a function of time in three material categories. Despite
γL being a vital variable, it can be understood from the figure that it is nearly constant with time for low- and medium-grade models. However, for high-grade pipe models, a little drop in
γL is evident.
3.4. Effect of Corrosion Growth Models
Corrosion is the primary threat to oil and gas pipelines and understanding its behaviour over time is vital for their design and adequate maintenance. Earlier in the study, the corrosion is assumed to grow linearly as presented mathematically in Equations (9) and (10). However, there are other models [
40] and approaches [
22] that suggest non-linear corrosion growth in pipes. The linear corrosion model is regarded as CM1 in this section; two more corrosion models are adopted to understand their effect on the estimation of partial safety factors. A non-linear trend has been proposed by Guedes Soares and Garbatov [
41] that characterises corrosion as growing exponentially with time, given as:
where
is the total time for which anti-corrosion protection lasts,
is the transition time of the corrosion phenomenon, which is expressed as a time from the beginning up to 63% of the maximum thickness (
). This study refers to this model as CM2. The length of corrosion is also followed to assume the same growth model.
In actual situations, the corrosion growth rate may vary significantly. For instance, corrosion growth rates are very high compared to common corrosion and, thus, are responsible for especially localised deep holes in pipe surfaces. Romanoff [
42] has provided a model that depicts the corrosion process following a power law with time to consider pitting corrosion growth; the same is referred to as CM3 in the present study given by
where
k is the pitting proportionality constant and
m is the exponent factor; both are material constants.
To compare CM1, CM2 and CM3, some assumptions are required. The parameters are adjusted in the corrosion models so that they deliver an equal reduction in thickness over 16 years.
Table 7 presents the values of these parameters. However, some additional assumptions are made, such as no corrosion thickness allowance and zero initial depth at
To.
Figure 7 presents the adopted corrosion growth models CM1, CM2 and CM3, depicting equal reduction over 16 years for a low-grade corroded pipe sample case. The trends by the three models differ significantly until 16 years. Other cases also show the same level of reduction. Moreover, the length of corrosion for all the cases shows similar corrosion growth.
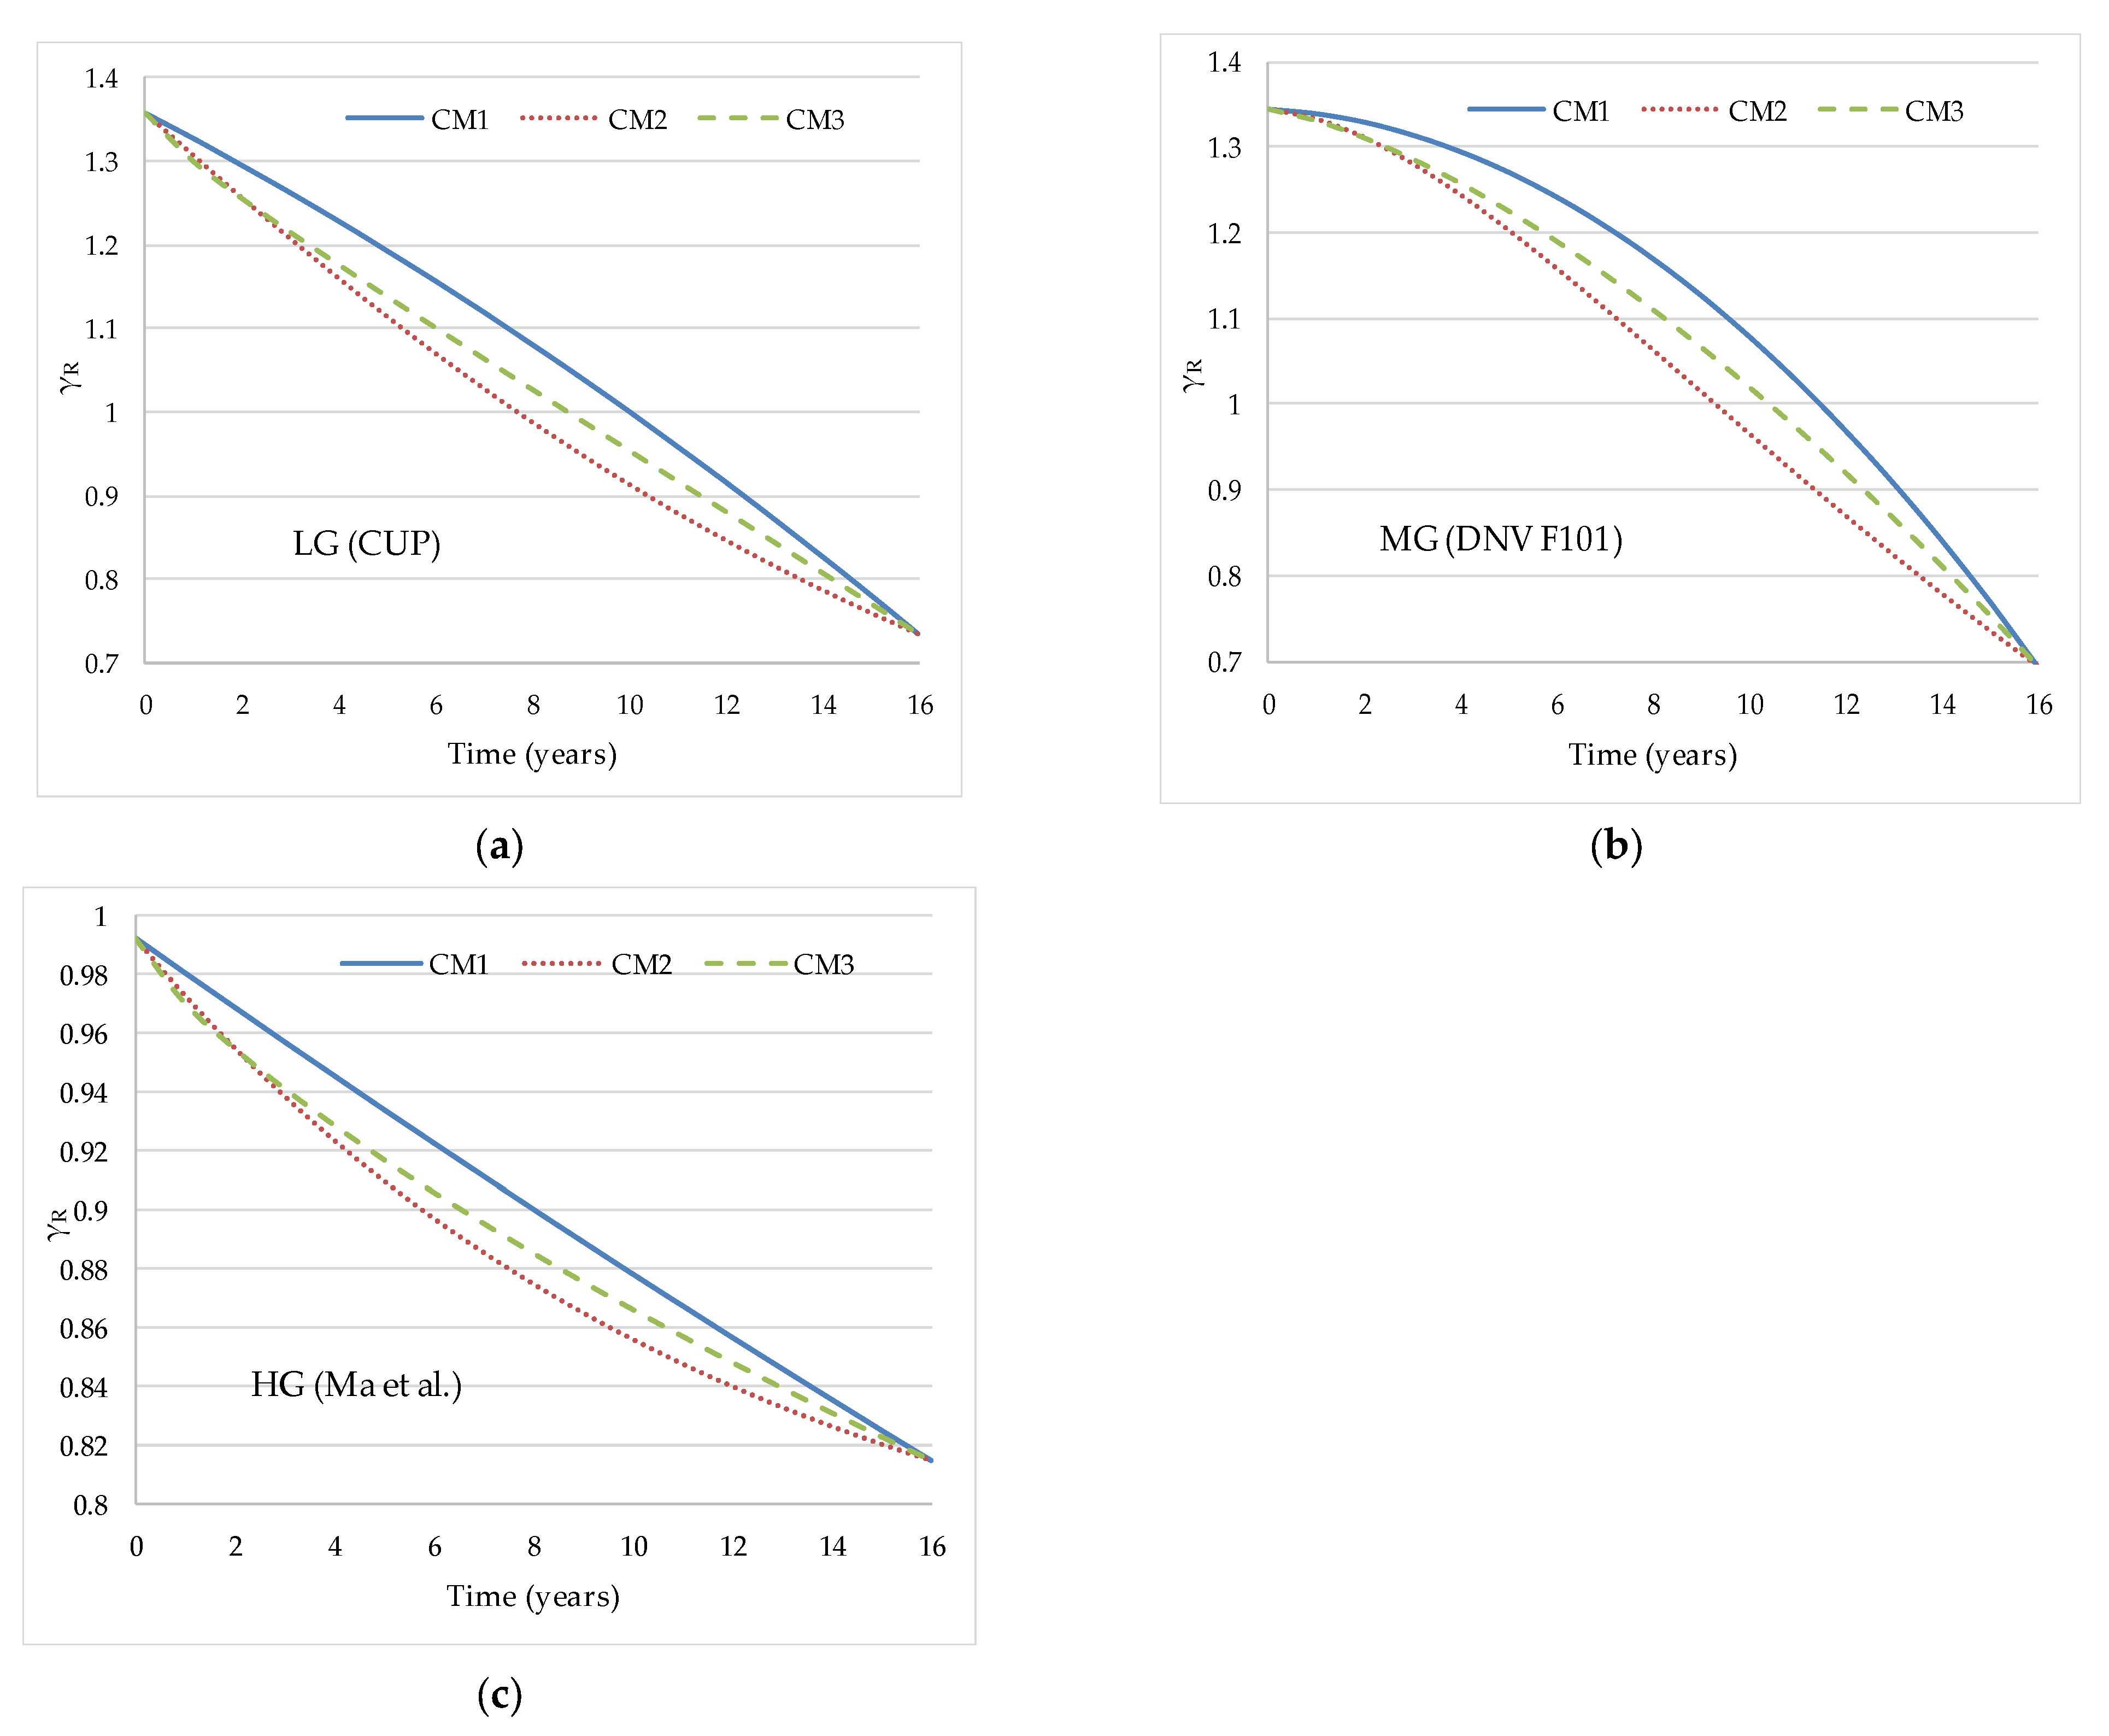
Next, partial safety factors are estimated using the above-stated corrosion models with the parameter values given in
Table 7. The best model from each category is used and the influence of corrosion over time is shown in
Figure 8 (years). The safety factors of resistance show a distinct pattern corresponding to CM1, CM2 and CM3. In all the categories, CM1 always estimates higher values of safety factors, followed by CM3 and CM2.
4. Discussion
Pipeline integrity management relies on proper design and code formulations for an adequate decision-making process. This requires adequate strength models that are deterministically calibrated with test data and code formats and probabilistically calibrated to account for uncertainty in the design variables in order to achieve uniform levels of structural safety. The safety factor calculations are probabilistic in nature, subjective to the choice of strength models, and thus associated with uncertainties. The pipelines, once installed, remain in service for many decades and are exposed to natural degradation processes such as corrosion. Therefore, this paper seeks the assessment of uncertainty in safety factor estimation for such pipelines using an appropriate case study. It is demonstrated how strength models and corrosion growth influence the calculation of partial safety factors and their uncertainty. This study adopts a uniform corrosion growth model (CM1) for depth and length. However, the overall corrosion growth will not be linear. Similarly, the overall corrosion growth for other models (CM2 and CM3) may not follow the same idealisation of growth as adopted for a single parameter.
The partial safety factors are estimated in three classes of steel grades; however, they are associated with the case study adopted. Therefore, the obtained results are a function of geometrical parameters, defect parameters and model uncertainty factors. A systematic approach covering a wide range of design cases is still necessary to properly assess partial safety factors regarding the burst strength design of corroded pipelines of different steel grades.
5. Conclusions
The accurate estimation of partial safety factors is of the utmost importance in mitigating the risk of pipeline burst failure and making any pipeline project successful. The present method is mainly useful to increase the confidence in safety and decision regarding the maintenance investment of different steel-grade pipes.
First, a stepwise approach is proposed to properly account for the uncertainties involved in the partial safety factor prediction of corroded pipelines in three steel grades. From the literature, the top 10 calibrated burst models are adopted in low, medium and high steel grades of pipes. Moreover, model uncertainty factors for burst models are adopted with their statistical moments. Limit state function and load and resistance factor design equations are formulated using model-uncertainty-factor-calibrated burst strength models and operating pressures. Case studies for corroded pipelines of three steel grades are developed with stochastic properties based on the literature.
The probabilistic characteristics of the burst strength of all the models are described using Monte Carlo simulation and the normal distribution is selected based on Chi-squared test results. Corrosion is assumed to grow linearly with time and its effect on the estimation of partial safety factors is assessed. The First-Order Reliability Method is employed to estimate the partial safety factors for the intact and corroded pipes using the top 10 models in each steel grade. Model strength factors are derived at a time instance for all the selected models to attain the same target reliability.
Moreover, the approach is refined by showing their mean, range and uncertainty. Nevertheless, the grade of intact pipe partial safety factors of a load assumes identical values with respect to the model, and 0.909, 0.891 and 0.928 for low, medium and high grades, respectively. Conversely, the resistance partial safety factors constitute high uncertainty regarding the models used, with means of 1.315, 1.409 and 1.189 for low, medium and high steel grades, respectively. For corroded pipelines, resistance safety factors are presented as a function of the time since the inspection. The mean and coefficient of variation of resistance factors in three categories are shown. The mean varies from 1.24 to 0.65 for low, 1.37 to 0.7 for medium and 1.02 to 0.83 for high grades for a 16-year operational period.
The effect of linear, exponential and power law corrosion growth models on the variation of partial safety factors is assessed with time. Some obvious differences in partial safety factors are evidenced corresponding to the corrosion growth model. Particularly, higher values of safety factors are obtained using the linear corrosion growth model.


