1. Introduction
In recent years, the planet’s energy crisis has prompted mankind to seek new sources of energy. The development of renewable energy sources has become key to combating the phenomenon of global warming. Among the various technological advances in the field of renewable energy sources, wind energy is already cost-effective (land-based utility-scale wind is one of the lowest-priced energy sources available today) and guarantees a clean and environmentally friendly energy source, which makes it one of the best alternatives at present [
1].
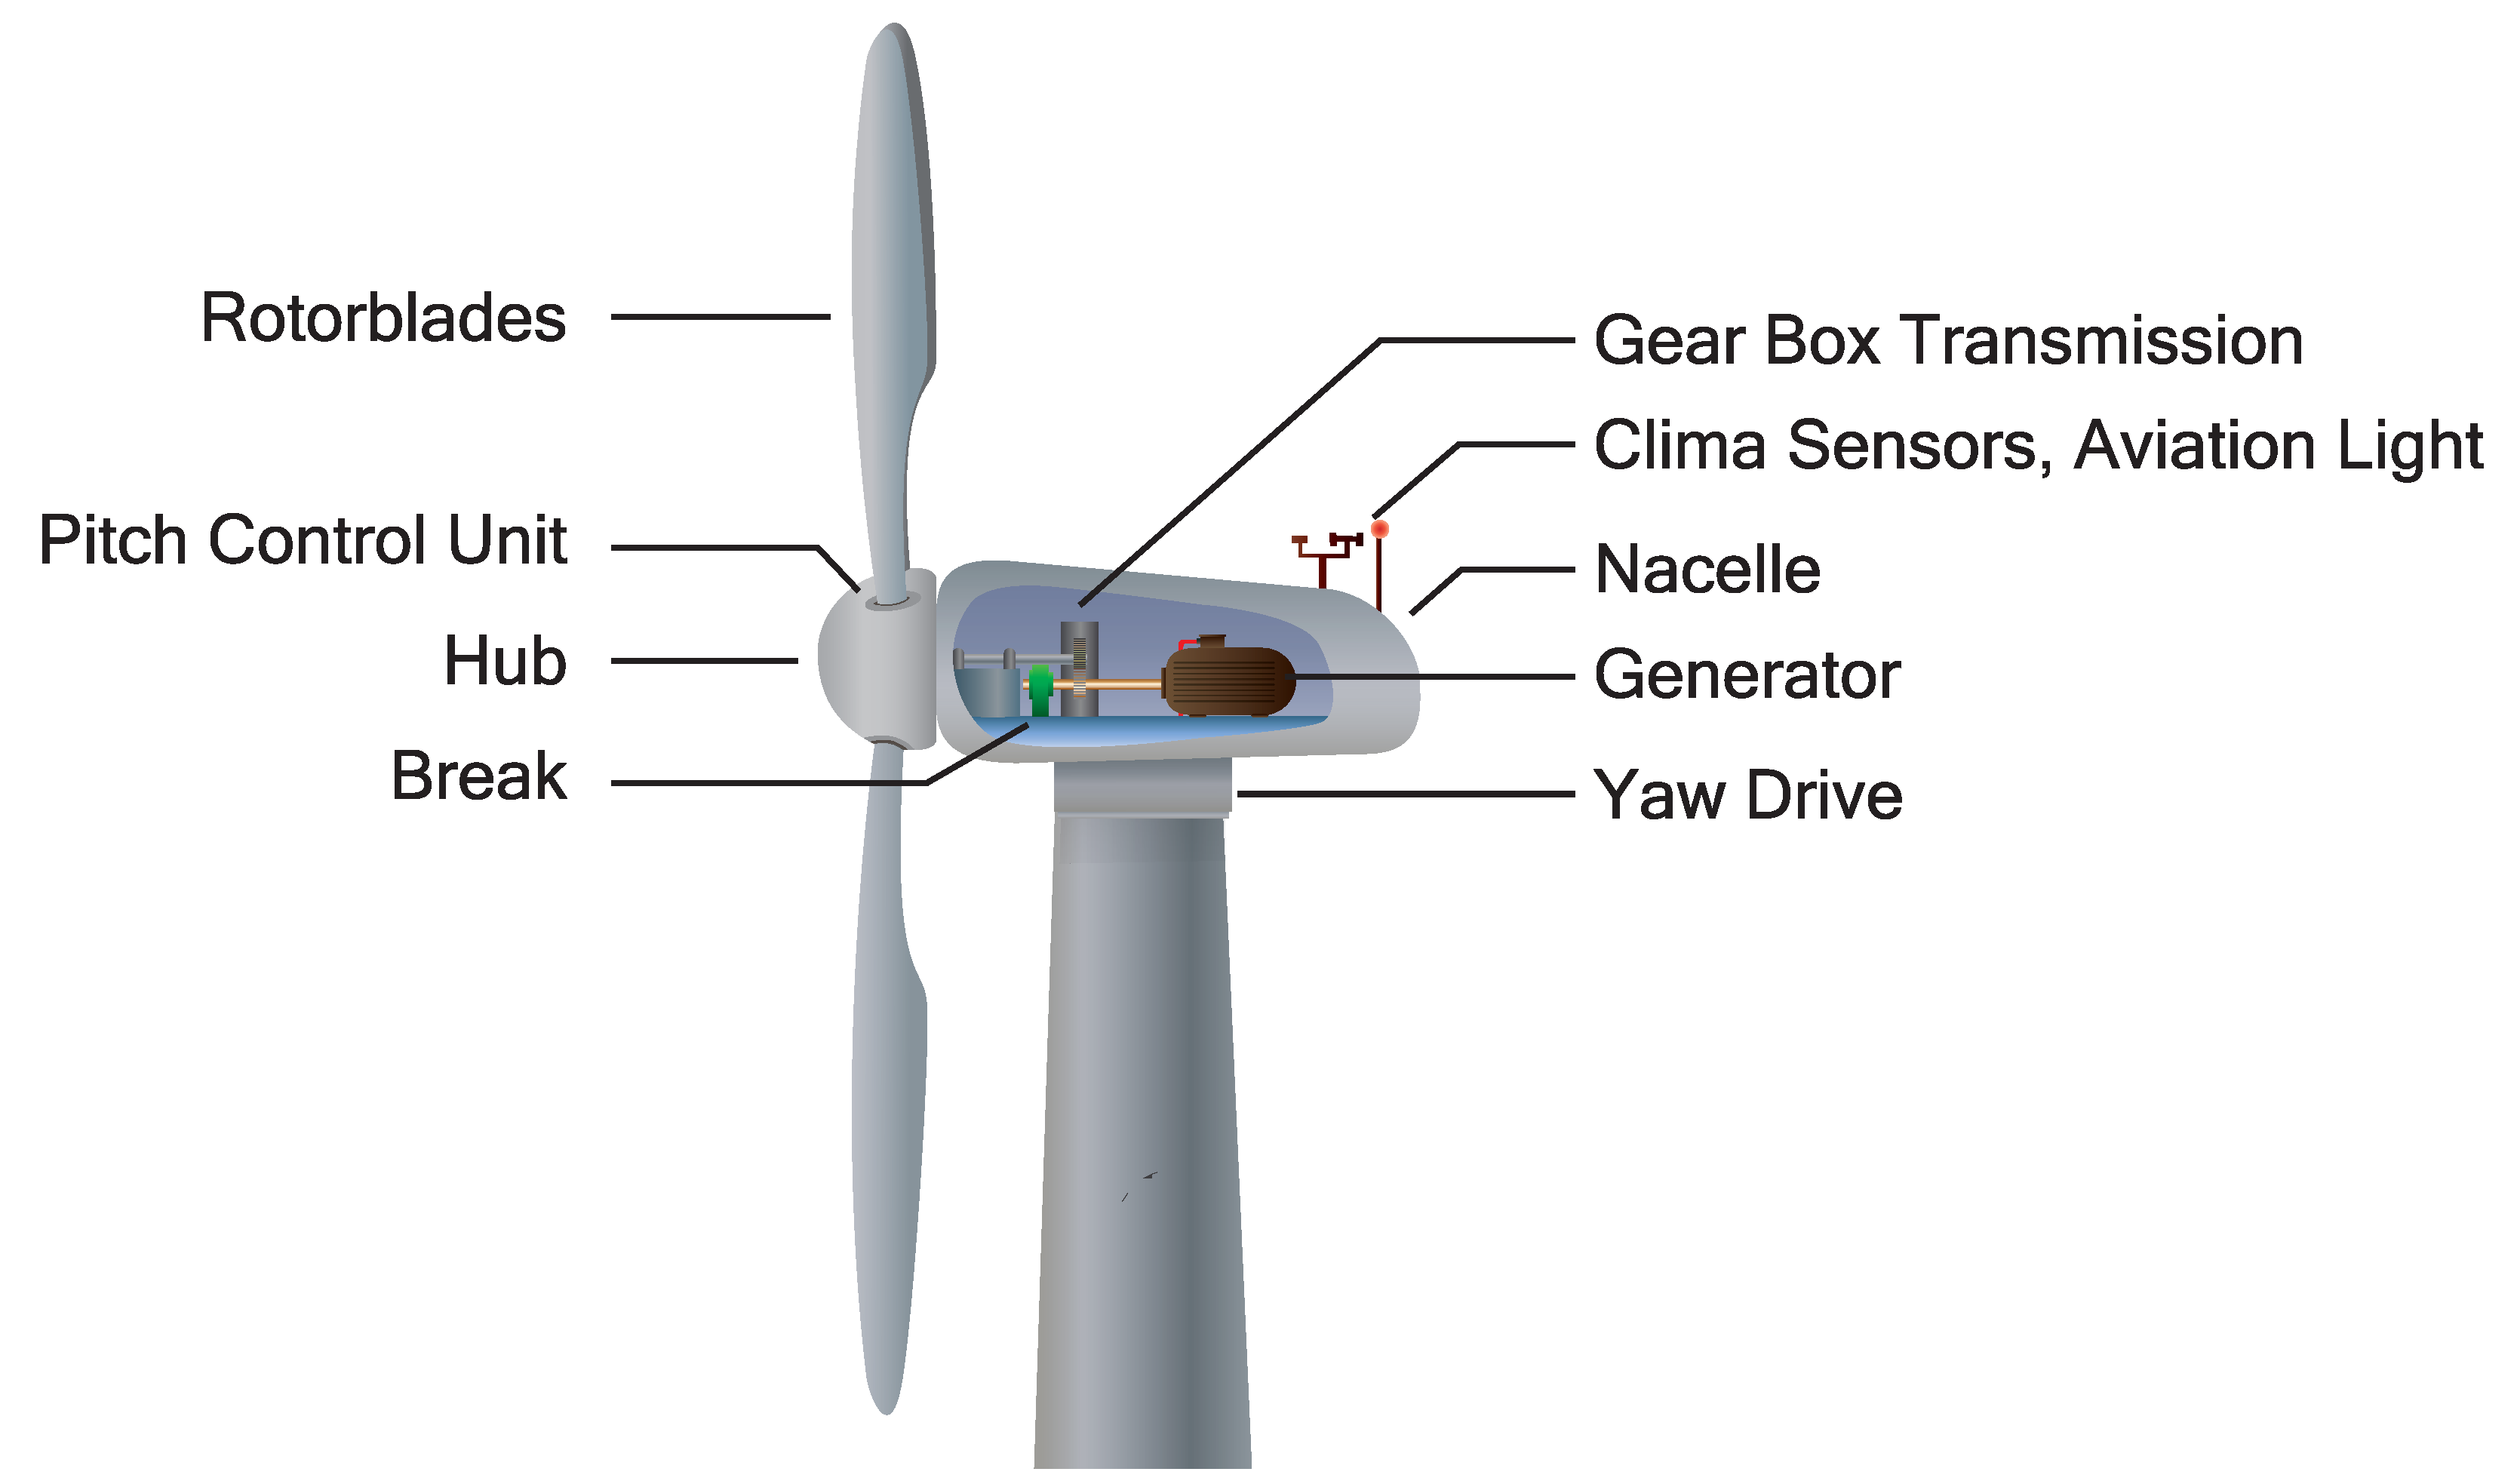
Figure 1 shows a typical configuration of a wind turbine (WT). Moreover, the size of WTs has been increasing as a consequence of the desire to generate more energy and be more efficient in the process.
Besides size, the installation environment has also been one of the factors changing over time. In the past, all WTs were placed onshore, but more recently, they have migrated to offshore environments as well. However, this strategy has both advantages and disadvantages, as new engineering challenges are hindering the process. The frequent inspection and maintenance of this type of offshore installation pose a great risk, considering the height and dimensions of the WTs and the fact that they are located on open waters. The durability of the material with which the structures are built also changes since the marine conditions are different [
1]. Another major challenge is energy transport produced from the sea to the land. It is therefore necessary to improve safety conditions, minimize downtime, reduce logistics and maintenance costs, and avoid sudden or unexpected damages. To achieve it, WTs must be constantly monitored to ensure that they are in good operating condition and capable of anticipating future damages or breakdowns.
Of the many existing monitoring systems, structural health monitoring (SHM) is of vital importance since structural damage can lead to a catastrophic failure that puts the entire system at risk. The information that can be collected from an SHM system can be used to provide maintenance to WTs, without the need to be on site [
2]. Through an SHM system, the unnecessary inspection times of components and time lost in change or replacement of parts can be significantly reduced. Moreover, such a system provides confidence since it is being monitored constantly. SHM systems are designed so that during the life of a particular structure, the health of the constituent materials, parts, and the overall assembly is diagnosed consistently. Structure health must remain within the specified ranges to ensure its proper functioning. Here it is noteworthy that these ranges change according to the age of the structure, environmental conditions, operating conditions, etc.
Monitoring facilitates saving or storing of the information collected as a kind of database or archive. Moreover, it provides a prognosis in terms of the evolution of a damage, the residual lifespan, the recovery process of a component, etc.
In fact, several works have been developed over the last years, where data (such as supervisory control and data acquisition or SCADA) are exploited to develop strategies based on machine learning for fault detection in WTs. For instance, Encalada-Dávila et al. [
3] worked on a methodology based on ANNs (artificial neural networks) that uses SCADA data from a real wind farm to detect main bearing faults in WTs early on. Another work is that from Velandia-Cárdenas et al. [
4], where a strategy for WT fault detection (related to the temperature of main gearbox) is proposed by using highly imbalanced real SCADA data. On the other hand, WT SCADA data that come from software simulation can also be employed to develop predictive maintenance strategies, such as the work done by Vidal et al. [
5]. Their methodology aims to propose a data-driven multi-fault detection and classification system based on different types of faults on actuators and sensors.
SHM systems involve the integration of sensors, actuators, data transmission, processing, and so on, thus achieving their first level, which is sensing. These systems are conceived as a new way of nondestructive testing (NDT) [
6].
Performing SHM tests’ strategies on real WTs means incurring high logistic and operational costs, risk or difficulty, downtime, etc. In addition, several tests may be conceived as destructive since they directly affect the system. Therefore, there is a need for lab-scale test systems to evaluate the structures with different methods. In this case, this would imply using vibrational response, for instance. These systems must guarantee accuracy and realism during the simulations to obtain reliable results for analysing and processing later. Each testing workbench is designed according to the aims of the study; thus, several types of systems have been developed to study different topics, e.g., vibrational response [
7,
8], sensor quality [
9], and WT foundation-type-based [
10,
11].
Now, regarding both wavemaker channels and down-scale WT foundation assessment, there are also several works to highlight. For instance, Aktaş [
12] worked on a methodology to assess the wavemaker theory by using first-order and second-order wavemaker solutions. The wavemaker was piston-type within a 40 m × 1 m × 1.4 m channel (medium scale) and the structure under study was a spar-type floating WT. On the other hand, Hu et al. [
13] studied the dynamic response of offshore monopile-type WT towers under wind, wave and current during installing stage, by placing a sensor network (accelerometers) on the structure’s key locations. Moreover, for wave simulations, the wavemaker channel employed was 8 m × 3 m × 1.6 m and can provide a maximum current velocity of 3.0 m/s, waves height of 0.1 m, and sea wind velocity of 30 m/s. Following the same baseline, Song et al. [
14] studied the dynamic response under several environmental conditions of TLP-type (tension leg platform) floating offshore WT systems. By getting support from Froude scaling, a 1:200 scale model was designed to carry out experiments in a lab-scale wave channel by means of a piston-type wavemaker. Furthermore, due to wave reflections, a wave absorber was placed on the other side of the channel to appropriately dissipate wave energy. In respect to WT foundations’ scale, the structures under study can be several times larger. For instance, Zhang et al. [
15] worked on a hydrodynamic model test of a NREL 5 MW monopile-type offshore WT (1:80 scale). Some tests were performed under the action of shallow water breaking waves and experimental data were collected to be further processed and analysed.
Thus, in this work, a design of a laboratory down-scaled vibration test bench for offshore jacket-type foundations is proposed. The design comprises a scaled wave generator channel, a desktop application (WTtest) to control the channel simulations, and a data acquisition system (DAQ) to collect the information from the sensors connected to the structure. Note that various equipment such as accelerometers, an electrodynamic shaker, and a DAQ device are selected as per the design methodology. Regarding the mechanical part, each component of the channel is designed like the wave absorber, the mechanical multiplier, the piston-type wavemaker, and the wave generator channel. For this purpose, the finite element method is used in static and fatigue analysis to evaluate the stresses and deformations. Finally, to simulate different wind loads, a vibration shaker is installed on the top beam that simulates the nacelle. Thus, in summary, this testing workbench addresses several key-points that add novelty and value:
The vibration test system appropriately fits to medium/small scale laboratory environments (e.g., covering an area not greater than 5 m ) where a test bench for lab-scale structures like the proposed one (WT jacket-type foundation) is required;
Linear wave theory is employed as the design basis for the WGC, considering that this theory is greatly accurate for small ratios of wave height to water depth (i.e., shallow water), and wave height to wave length (deep water), which is according to these project’s conditions;
The proposed design methodology can be used as a useful guide to perform other designs based on different conditions or scales according to the engineering needs. This way, the methodology is scalable and reproducible.
The rest of the manuscript is divided into the following sections:
Section 2 explains the base of the project, i.e., the lab-scale offshore WT jacket foundation;
Section 3 comprehensively describes the methodology employed to carry out the phases of this work;
Section 4 presents the results, and the discussion about them is drawn;
Section 5 sums up the key points of the work and the scope for future ideas and research.
2. Lab-Scale Offshore Wind Turbine Jacket Foundation
An already existing and validated down-scaled WT offshore jacked-type foundation structure serves as the basis for the conceptual design of this work. In fact, on this down-scaled WT jacket-type foundation model, several studies have been developed to study damage detection and classification on collected vibration-response data.
For example, Vidal et al. [
16] designed a methodology to classify several damages due to fatigue cracks localized at different levels (structure depth). Through the use of machine learning algorithms and vibrational response data, the methodology was well-applied and with accurate results. On the other hand, Feijóo et al. [
17] worked on a novel strategy based on only healthy vibration-response data and by using an auto-encoder neural network to learn the normal vibrational behaviour of the structure and then to detect and localize cracks in it. Likewise, following the same study pipeline, Puruncajas et al. [
18] proposed a method where CNNs (convolutional neural networks) are used to detect different sorts of structure damages by transforming vibration-response-only data into images and getting those as inputs for the algorithm. Finally, both Zugasti et al. [
19] and Gómez González et al. [
20] performed a similar comparative assessment of some damage detection methods on the laboratory tower (damages simulated by loosening some bolts of the different joints) by using collected vibration response data.
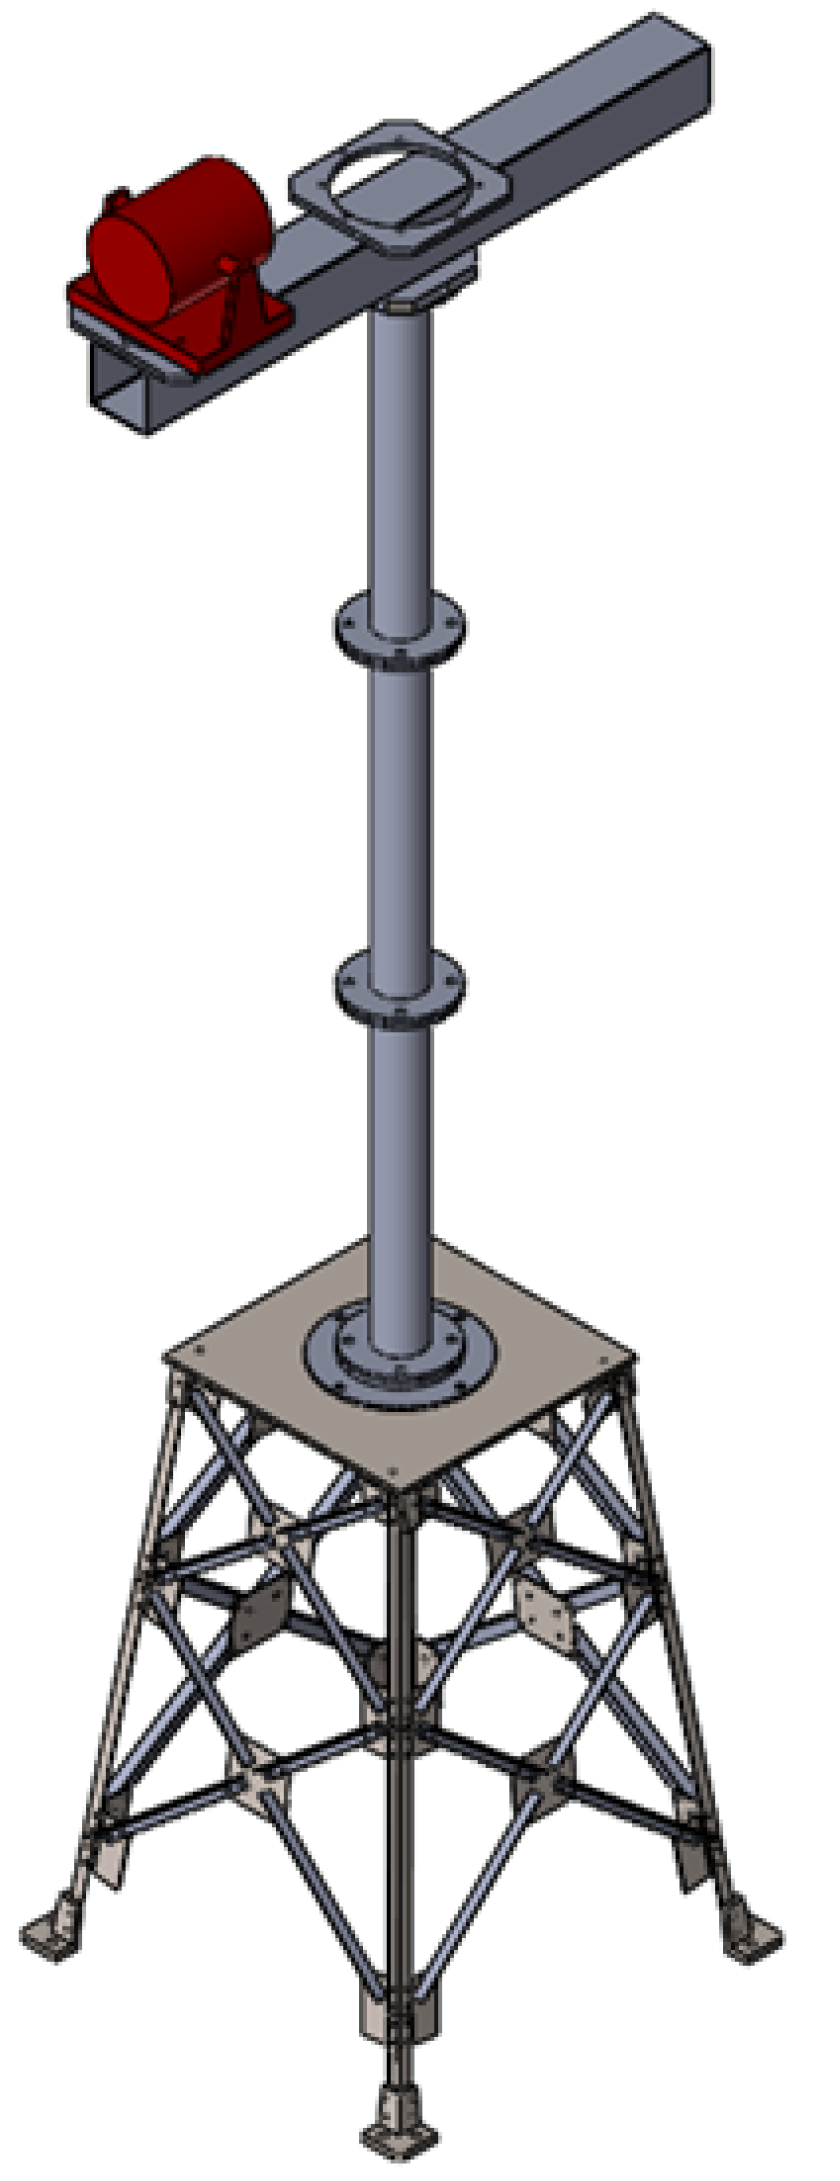
Figure 2 shows the structure with a 67 cm squared base on its side and roughly 108.72 kg in weight. This structure was designed for an offshore environment, as its foundation will work inside the wave generator channel (WGC).
Thus, the design of the vibration test system (VTS) does not start from zero but from an existing real down-scale model of the WT structure. The structure is 2.7 m tall and comprises the following parts:
A top beam of 1 × 0.6 m with an attached modal shaker (GW-IV47 from Data Physics), which is used to simulate the nacelle mass and mainly the effects of wind excitation. By applying an electrical signal to the shaker (white noise), the vibration that is needed to excite the structure is created. The simulation of different wind speeds is also simulated with this vibration shaker, by changing the amplitude of the input electrical signal. To simulate the nacelle orientation changes, the top part of the structure can spin 0º, 30º, and 90º;
A tower comprising three tubular sections, which are connected through bolts;
A jacket foundation, which is based on a pyramidal structure made up of 32 steel bars (AISI 316) with different lengths, steel sheets (DC01 LFR), and a set of bolts and nuts.
Thus, using this lab-scale offshore WT jacket model as the basis, the design of the VTS is developed in the next sections.
3. Methodology
3.1. Design Methodology
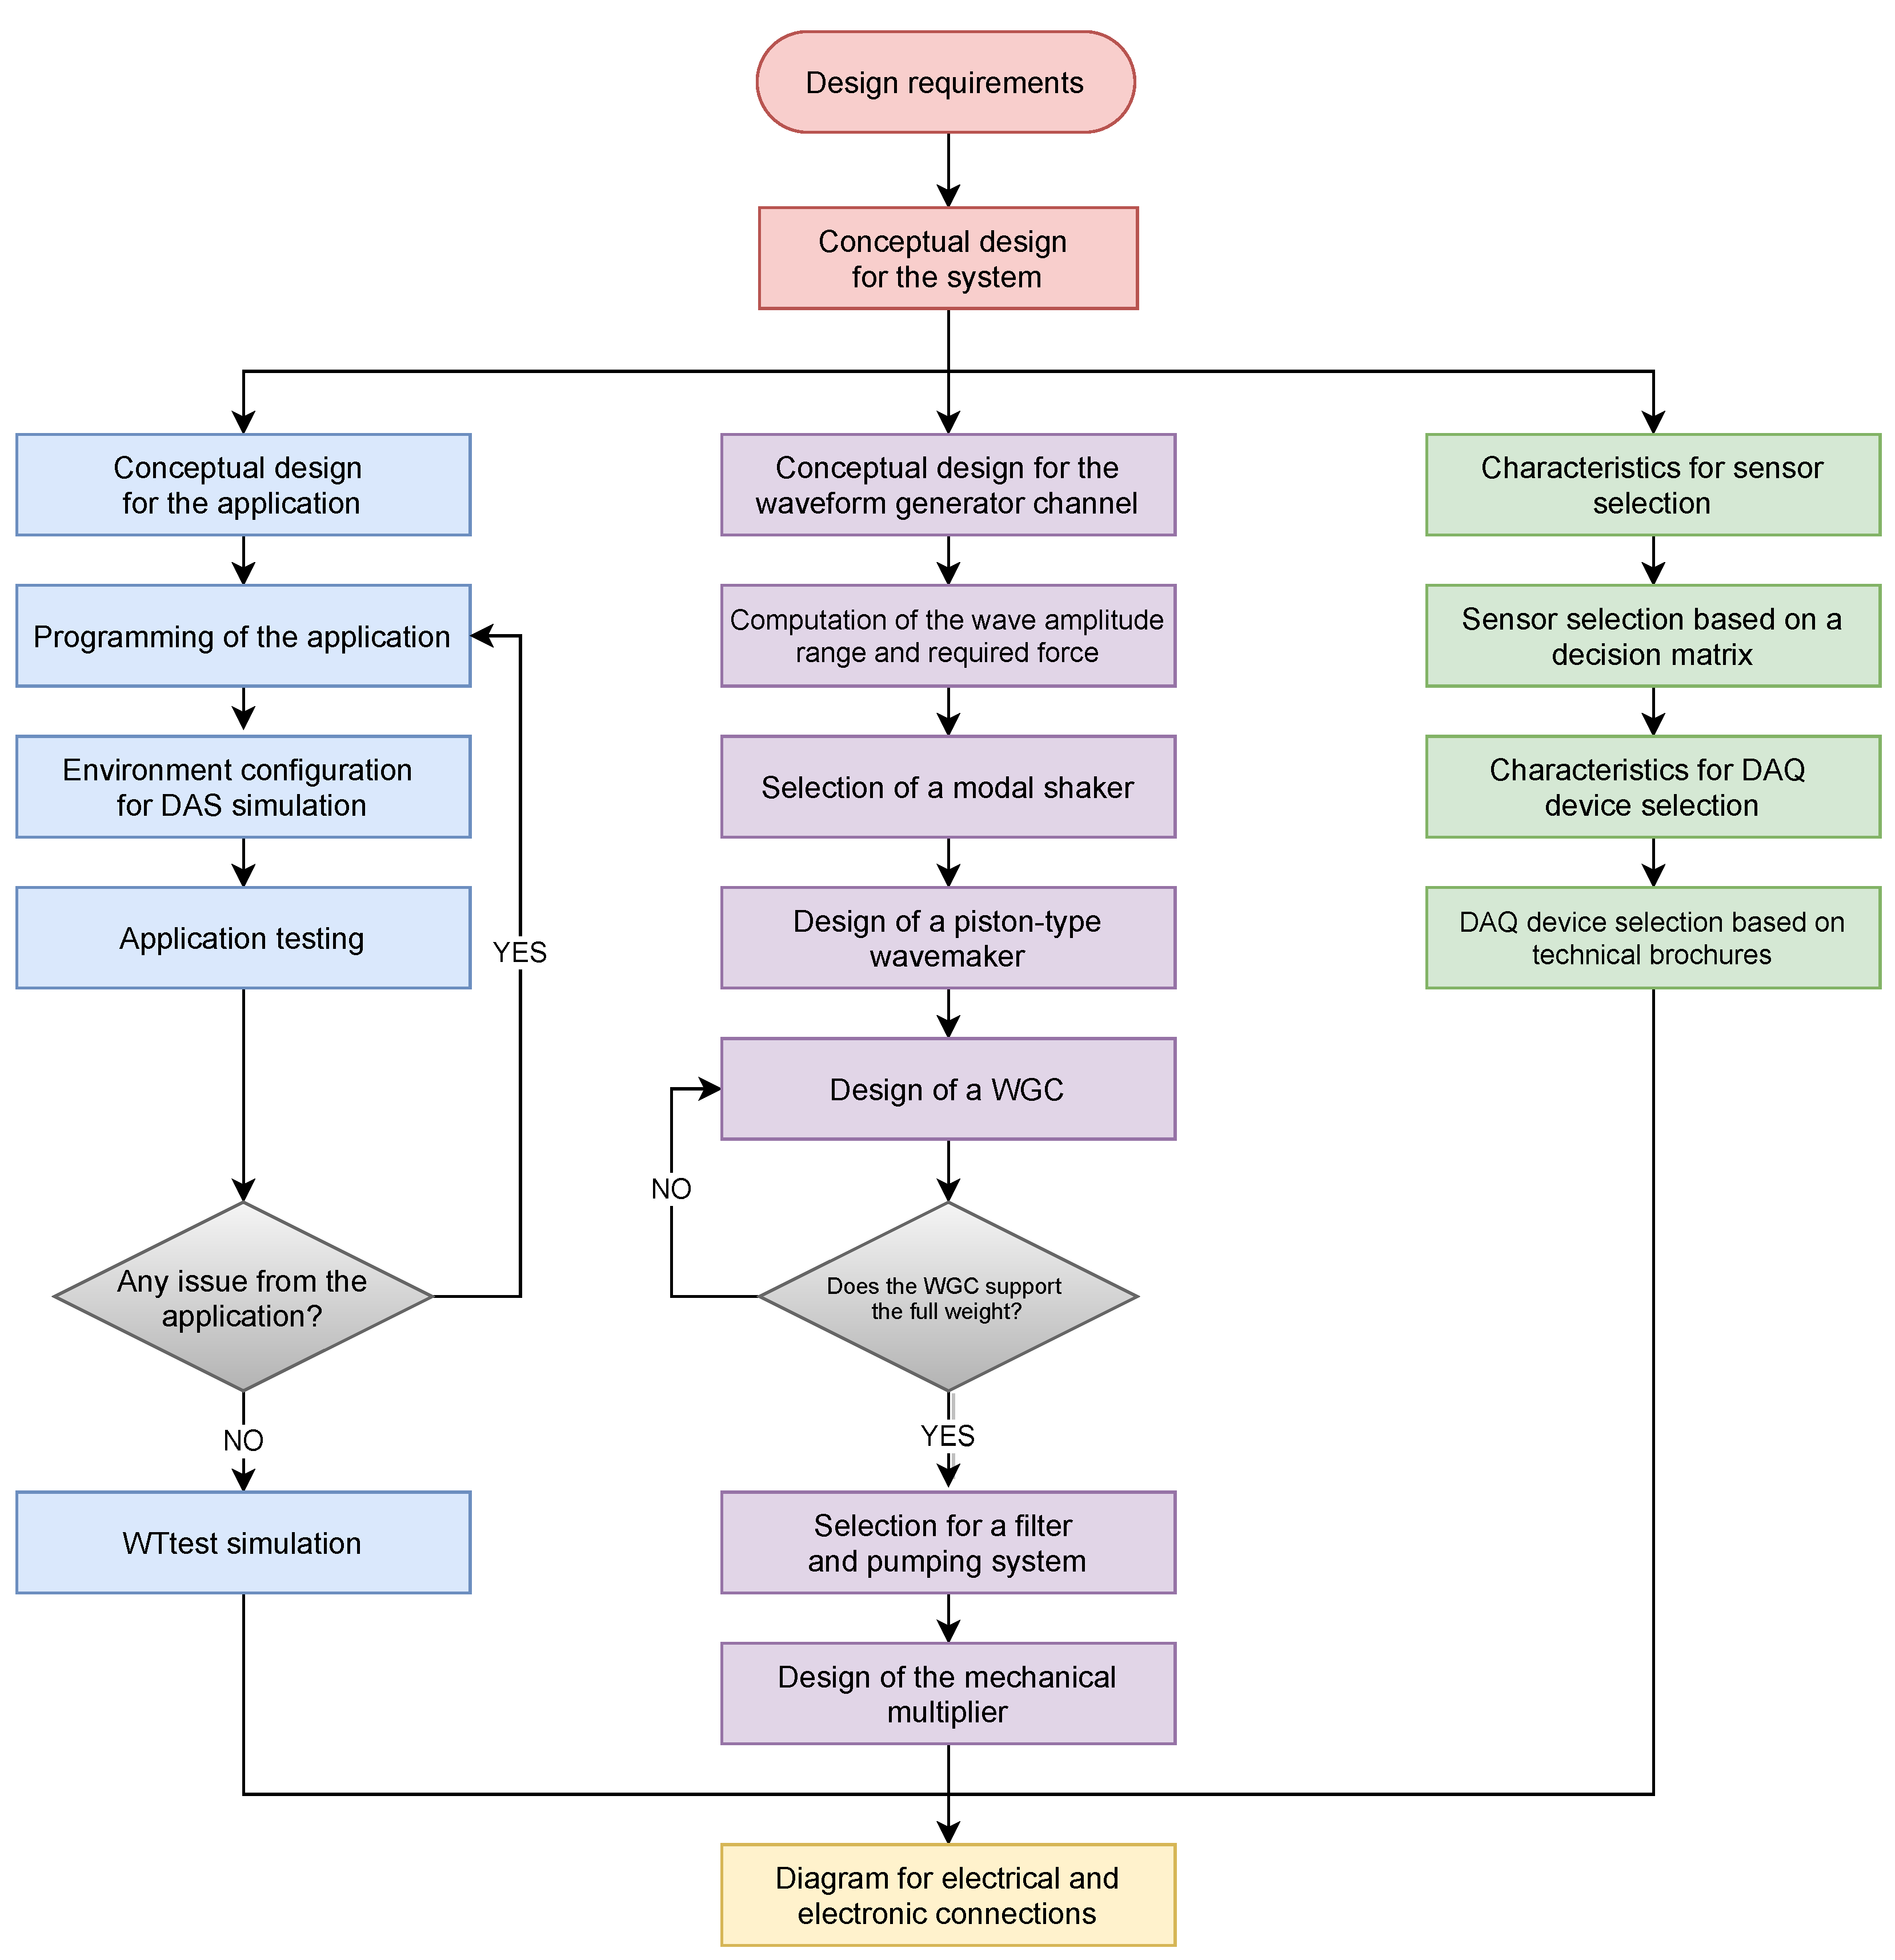
To design the VTS, this work is divided into five phases:
Establish all the requirements of the design and then formulate a conceptual solution;
Select sensors (accelerometers) and a DAQ device to constitute the data acquisition system (DAS);
Design an application called WTtest for data collection and visualization;
Design a WGC and all its mechanical components, including an appropriate filter and pumping system;
Design the electrical and electronic connections for the whole system.
Figure 3 comprehensively explains the above-mentioned phases of the work plan. As shown, the phases are not necessarily executed sequentially but parallelized.
According to the first phase, the requirements for the project are described in
Table 1. These requirements are based on the lab-scale offshore WT jacket foundation and the needs for testing at laboratory.
3.2. System Conceptual Design
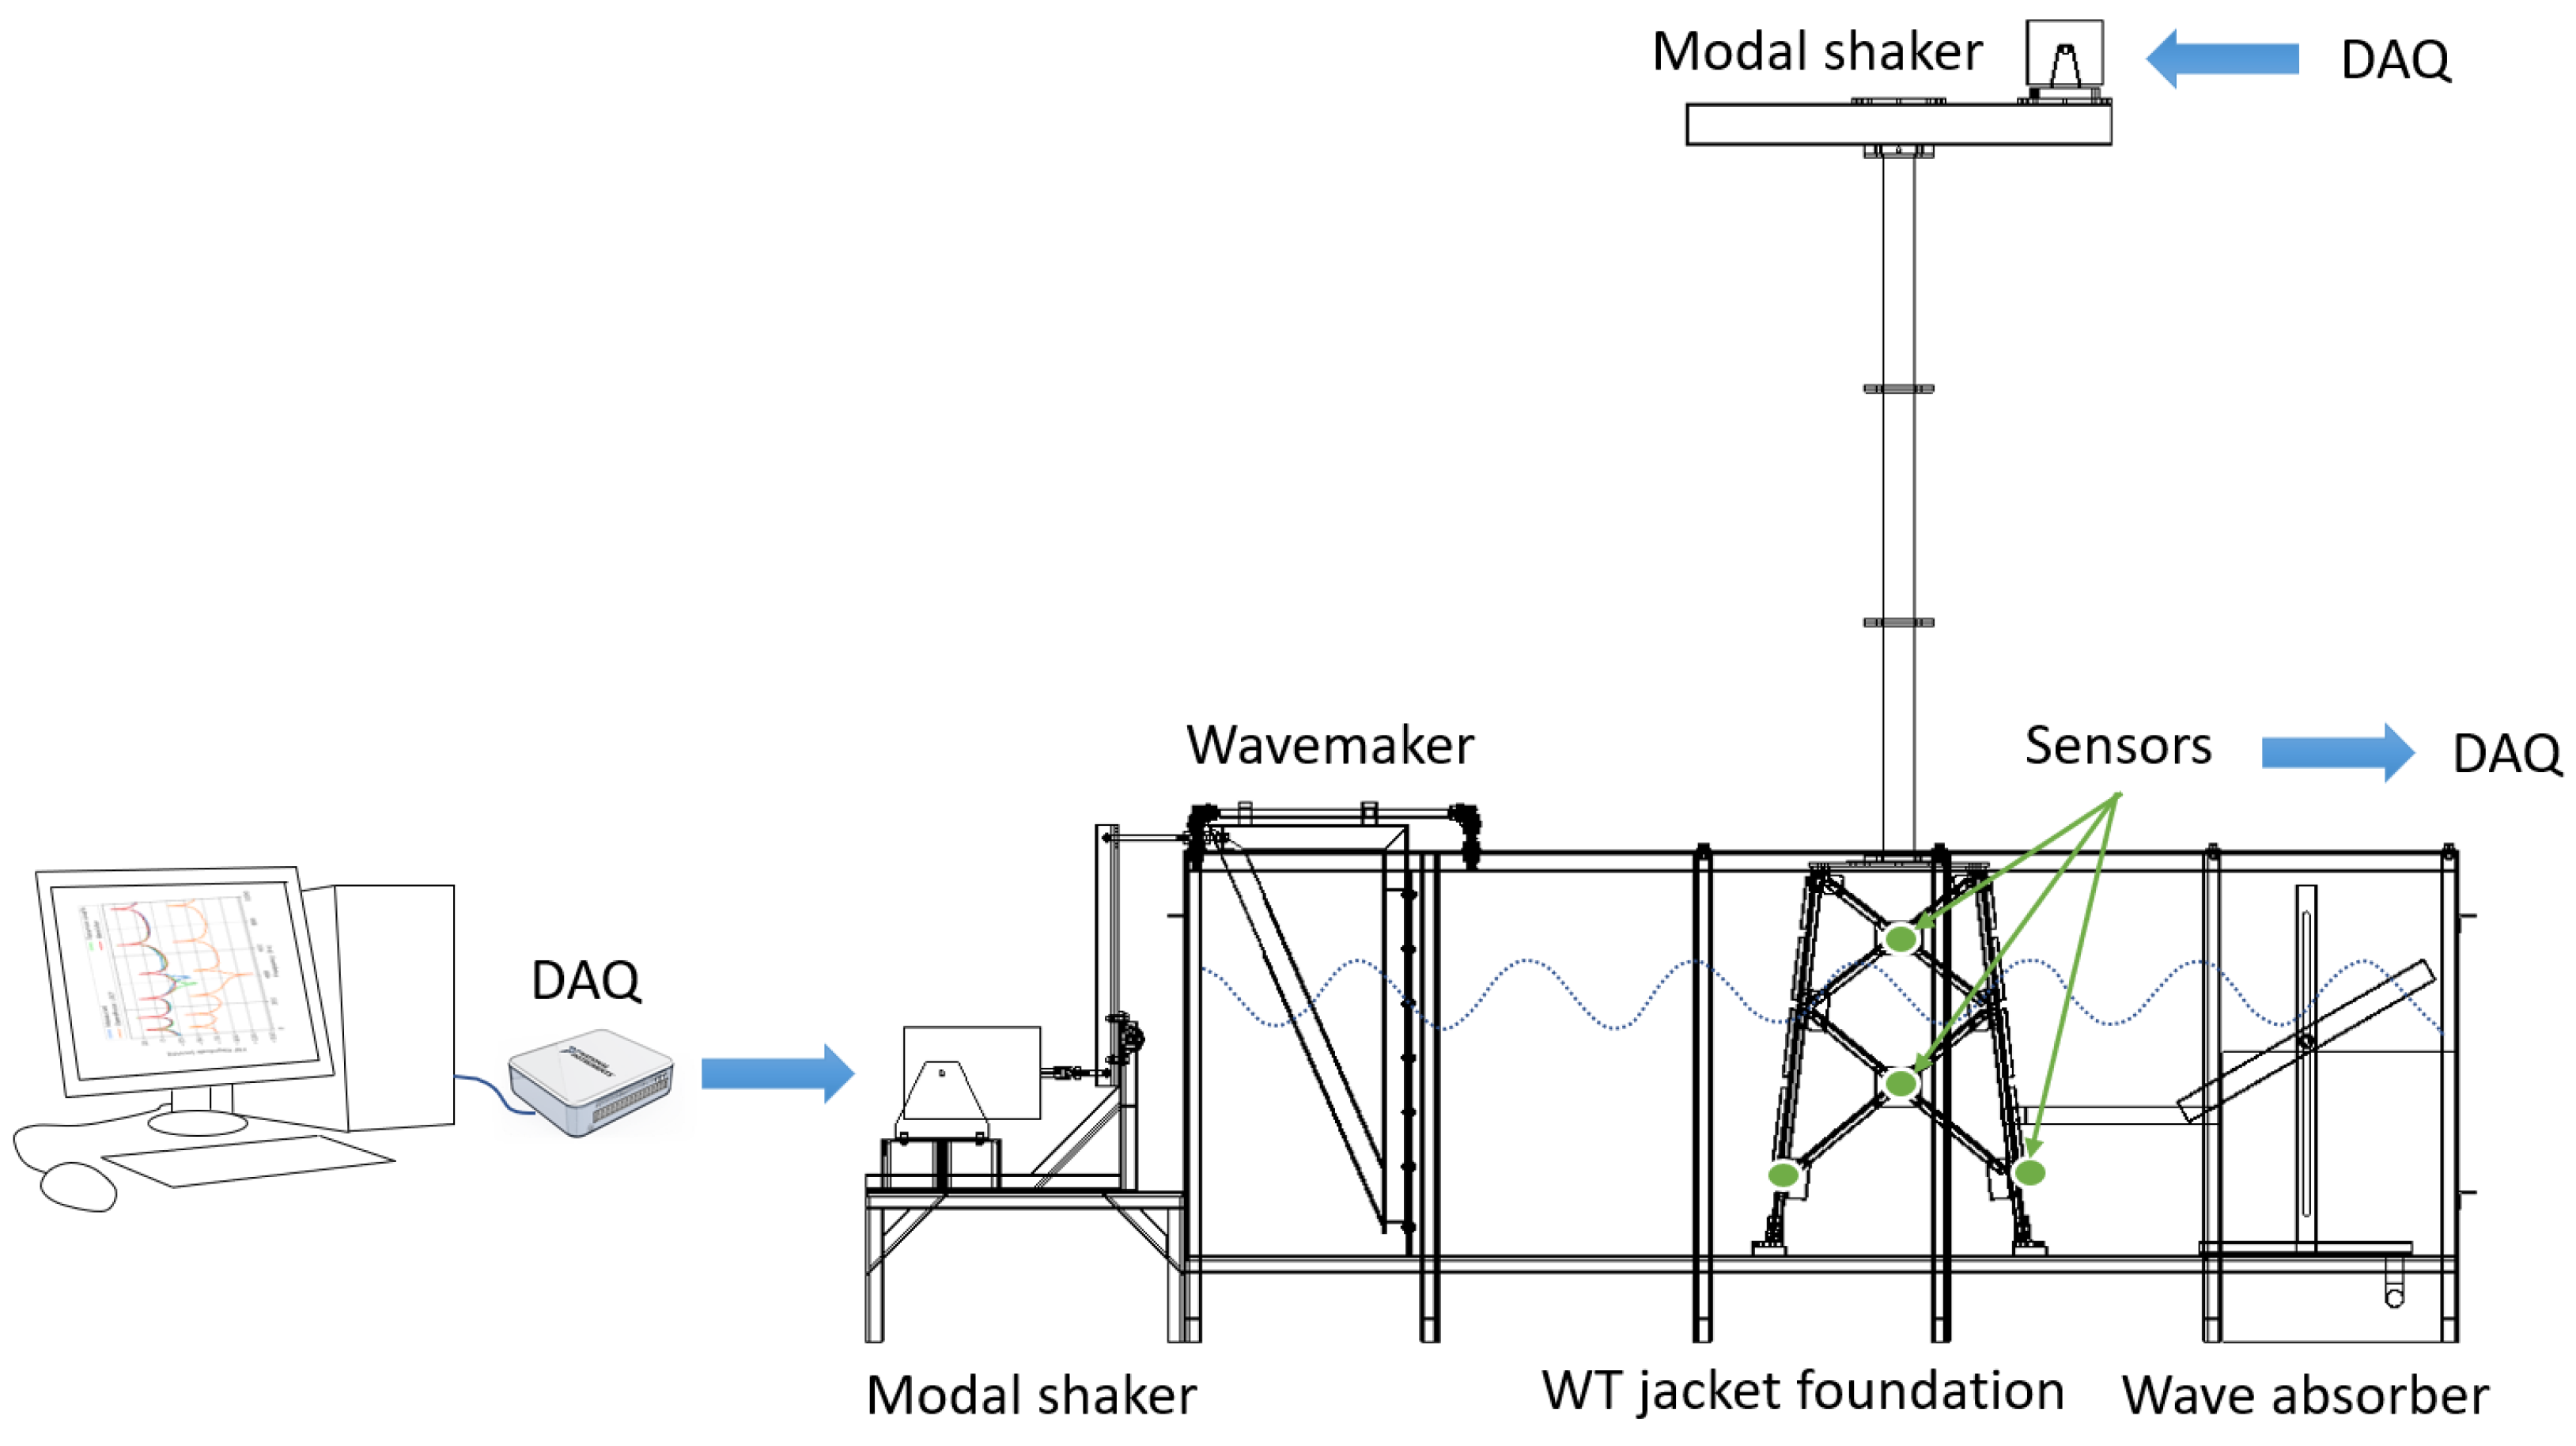
The VTS design integrates a WGC that simulates the impact of waves on the WT foundation anchored inside the channel. In this regard, a set of sensors is distributed on the WT foundation for collecting data through the DAS during the tests (
Figure 4 illustrates the conceptual design for the VTS). Moreover, the WTtest application configures the modal shakers and the parameters for wave generation. Further, the data collection and visualization are facilitated through the application as well.
Thus, the first part of design is the WGC, which is composed of two main parts: the complete metallic structure and the mechanism for generation of waves. Details about the first part are displayed in the subsequent sections.
3.3. Wave Amplitude Range and Required Forces Calculation
Reproducing waves under specific conditions in a controlled environment is a key requirement for the experimental study of offshore structures, especially offshore WTs. To generate sine waves, it is necessary to know parameters such as wave height and length as well as the maximum depth of the channel (see
Section 3.3.1).
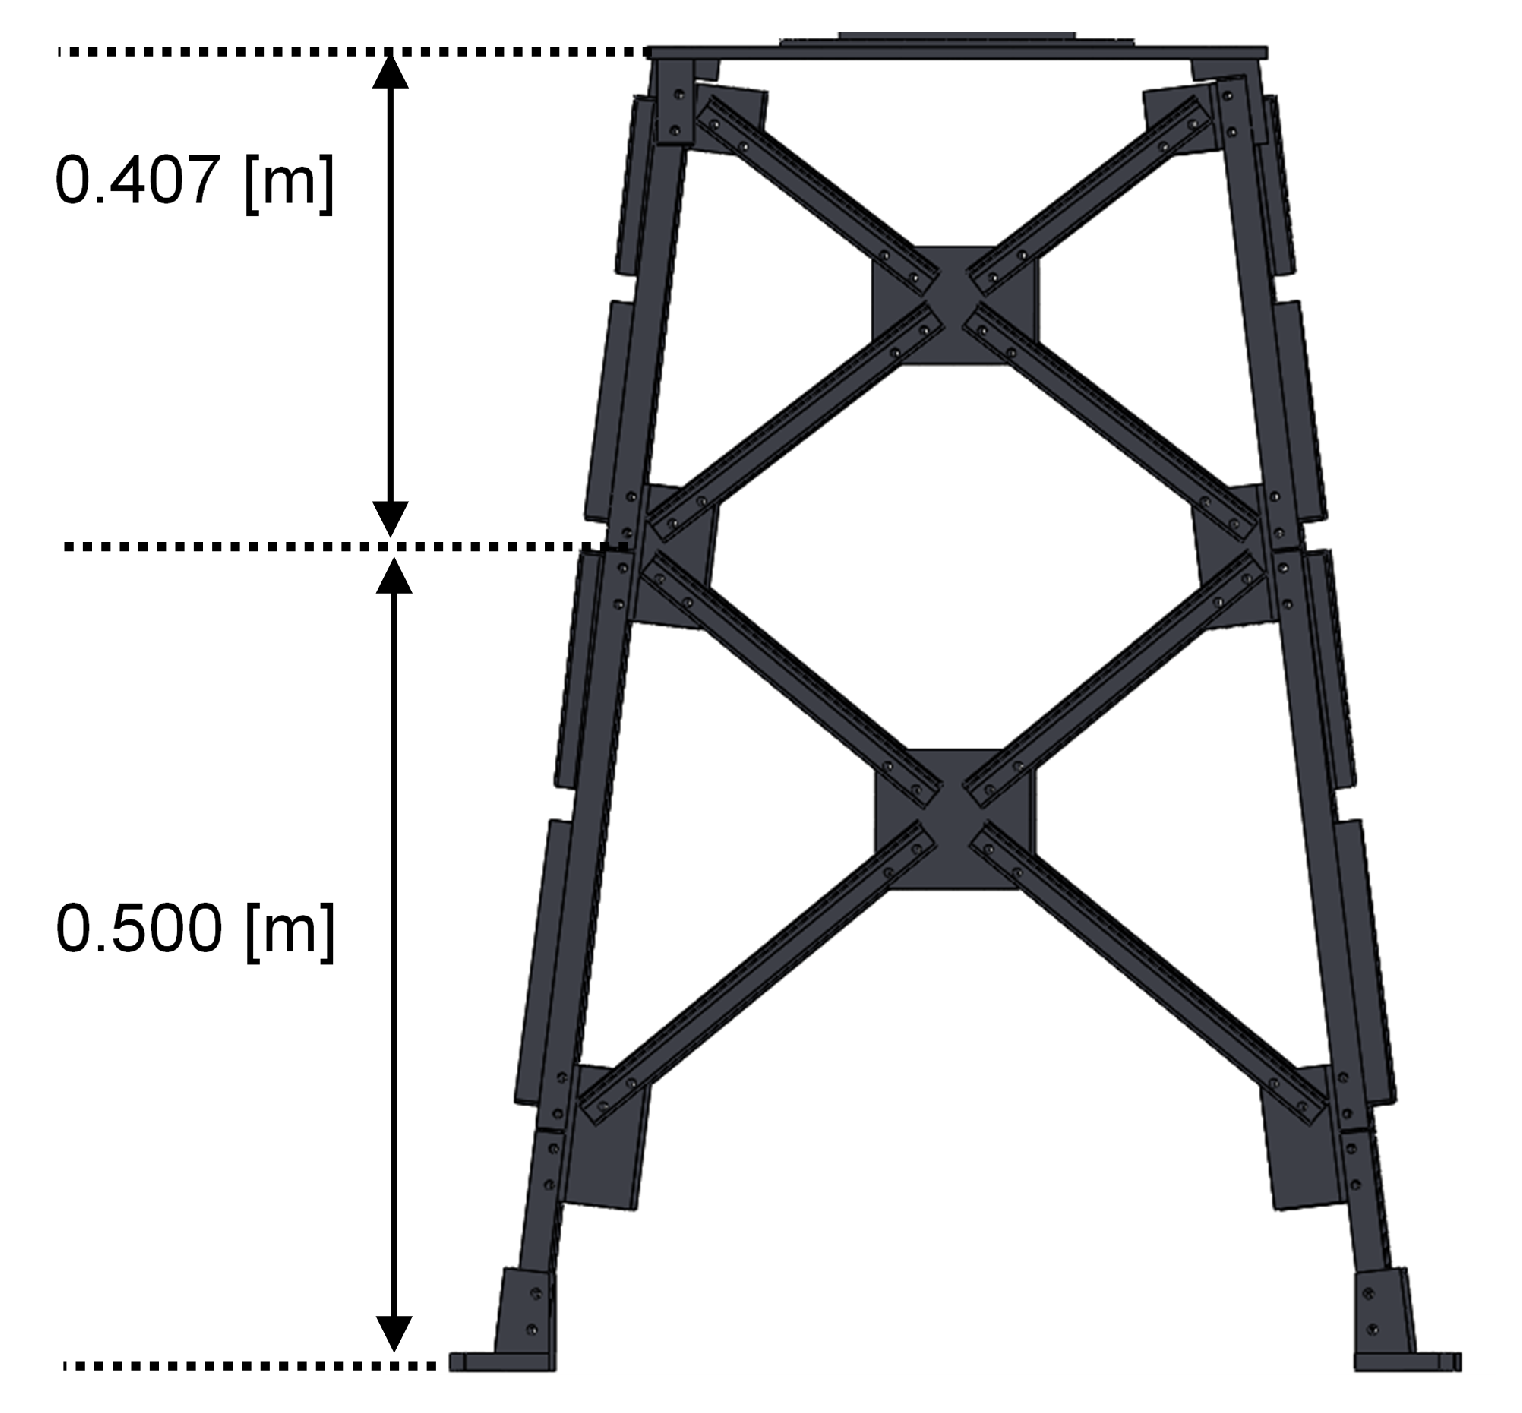
In this work, the wave shape requirements are based on the geometry of the WT jacket foundation, as shown in
Figure 5.
At the height of 50 cm, measured from the base, the level above which the wave height would be measured is delimited. From this level, there is a distance of 40.7 cm to reach the top of the jacket. With this distance, it is justified that the maximum wave height should be 25 cm, i.e., 12.5 cm of amplitude. In this manner, the jacket would not be completely underwater; there would be an uncovered part called the splash zone. Regarding the wave length, a typical range of lengths over which scale wave tests are carried out is selected [
21], i.e., from 40 to 150 cm. Thus, the three parameters evaluated above are part of the requirements for the WGC design.
3.3.1. Wave Generation Theory
Frequency, generator displacement, and water depth in the channel are the three parameters on which the wave generation depends [
22].
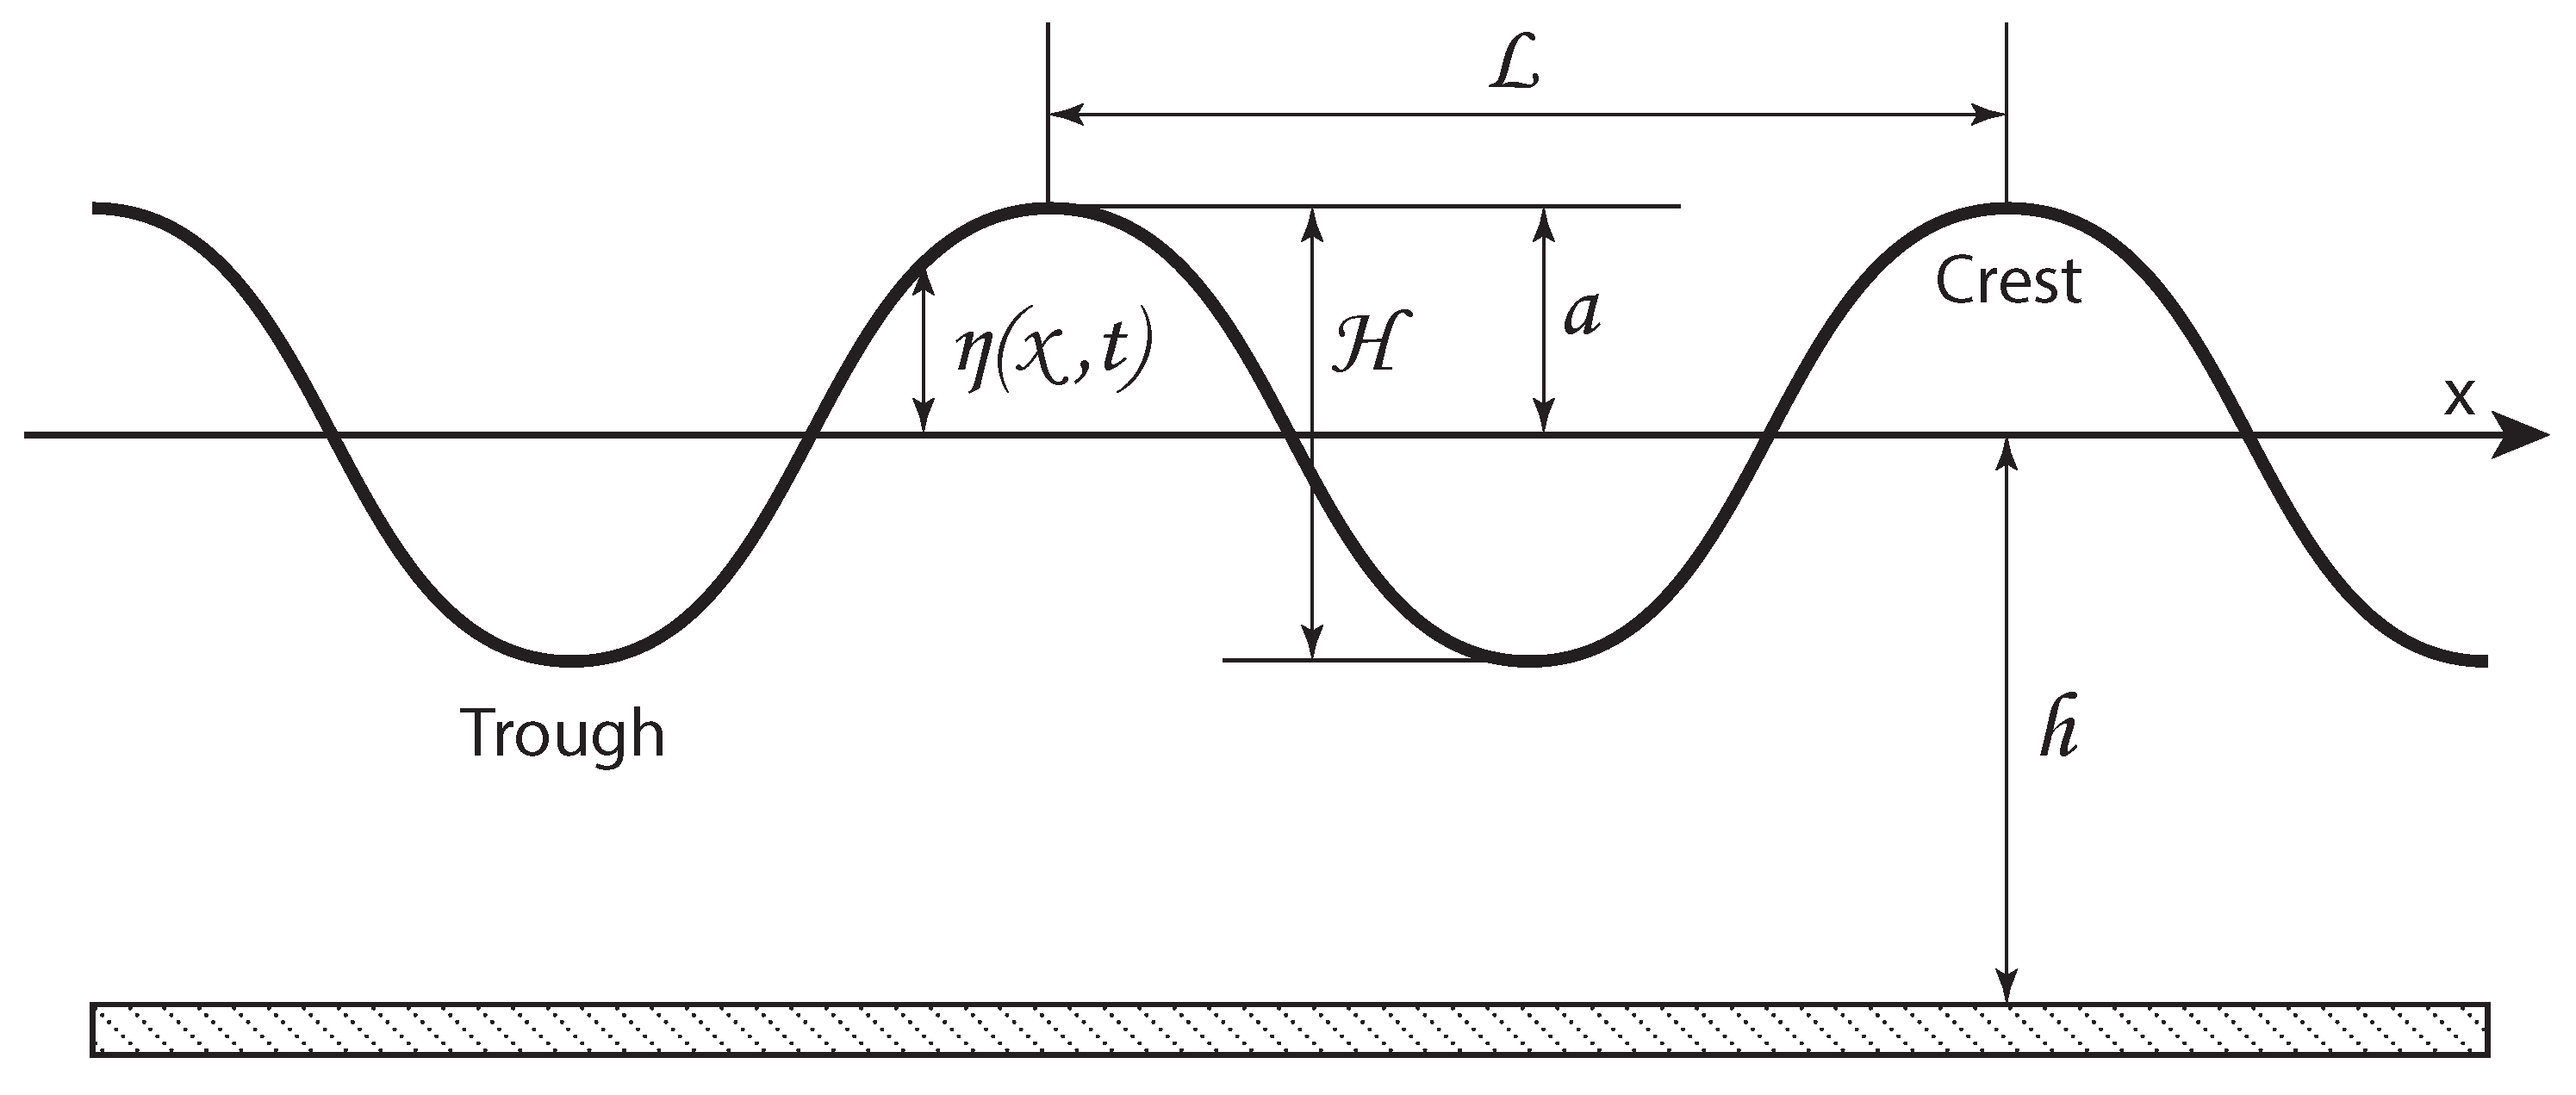
Figure 6 shows in detail the other characteristics of a wave, such as:
: the wave length;
H: the wave height, i.e., twice the value of the amplitude a;
h: the channel depth;
: the profile of the generated wave;
: the wave period.
The force required to move the wave generator and the induced wave motion are variables that can be determined using linear wave theory.
In fact, in Ref. [
22] there is a complete chapter (sixth) intended to explain wavemaker theory and which can be consulted to deeply understand some basis. The main reasoning in this theory is that the water displaced by the wavemaker should be equal to the crest volume of the propagating wave form. For instance, a piston-type wavemaker with a stroke
S into a channel with depth
h supposes a displaced volume
(directly related to
H and
k), and from that a quite interesting ratio rises, called the height-to-stroke ratio, which is finally expressed as Equation (
1) indicates,
In the “Ratio of wave height relative to stroke” section in Ref. [
23], the curve of the height-to-stroke ratio versus relative channel depths is shown, where a threshold value of 2 is observed for relative depth values greater than 4. Furthermore, it is vital to clarify whether a piston-type is the appropriate wavemaker for this work.
Through successive approximations and based on geometrical design constraints, a 15 cm stroke for the piston-type wavemaker was selected. Thus,
Figure 7 (computed through Equation (
1)) shows the range of wave heights that could be achieved according to the selected stroke value and the above-mentioned requirements. Finally, it is possible to validate the possibility of generating 26 cm height waves with a 150 cm wave length.
3.3.2. Force Exerted by the Piston-Type Wavemaker
According to Dean and Dalrymple [
22], one way to estimate the power required (
P) to generate waves can be easily obtained by determining the energy flux away from the wavemaker as it is described in Equation (
2),
where
is the speed at which the energy is transmitted (this velocity is called the group velocity
), and
E is the average total energy per unit cross-sectional length of the channel, measured in kg/s
2 and calculated as shown in Equation (
3).
where
is the density of water in kg/m
3, and
g is the gravity acceleration (9.81 m/s
2).
The parameter
C from Equation (
2) is the wave velocity, measured in m/s, which for shallow water is calculated as follows in Equation (
4),
On the other hand, the parameter
n from Equation (
2) is a fraction relating the phase celerity
C to the group velocity
. For shallow water, the energy and the wave profile travel with the same velocity. However, in deep water, the wave profile travels at twice the velocity of the energy, and it is calculated as follows (Equation (
5)),
where
k is the wave number (the inverse of the wave length), and
h is the depth of the test channel, measured in m.
In mechanics, the transmitted power is related to force and velocity. In this regard, applying and relating this relationship with Equation (
2), the force exerted by the piston-type wavemaker is expressed as follows (Equation (
6)):
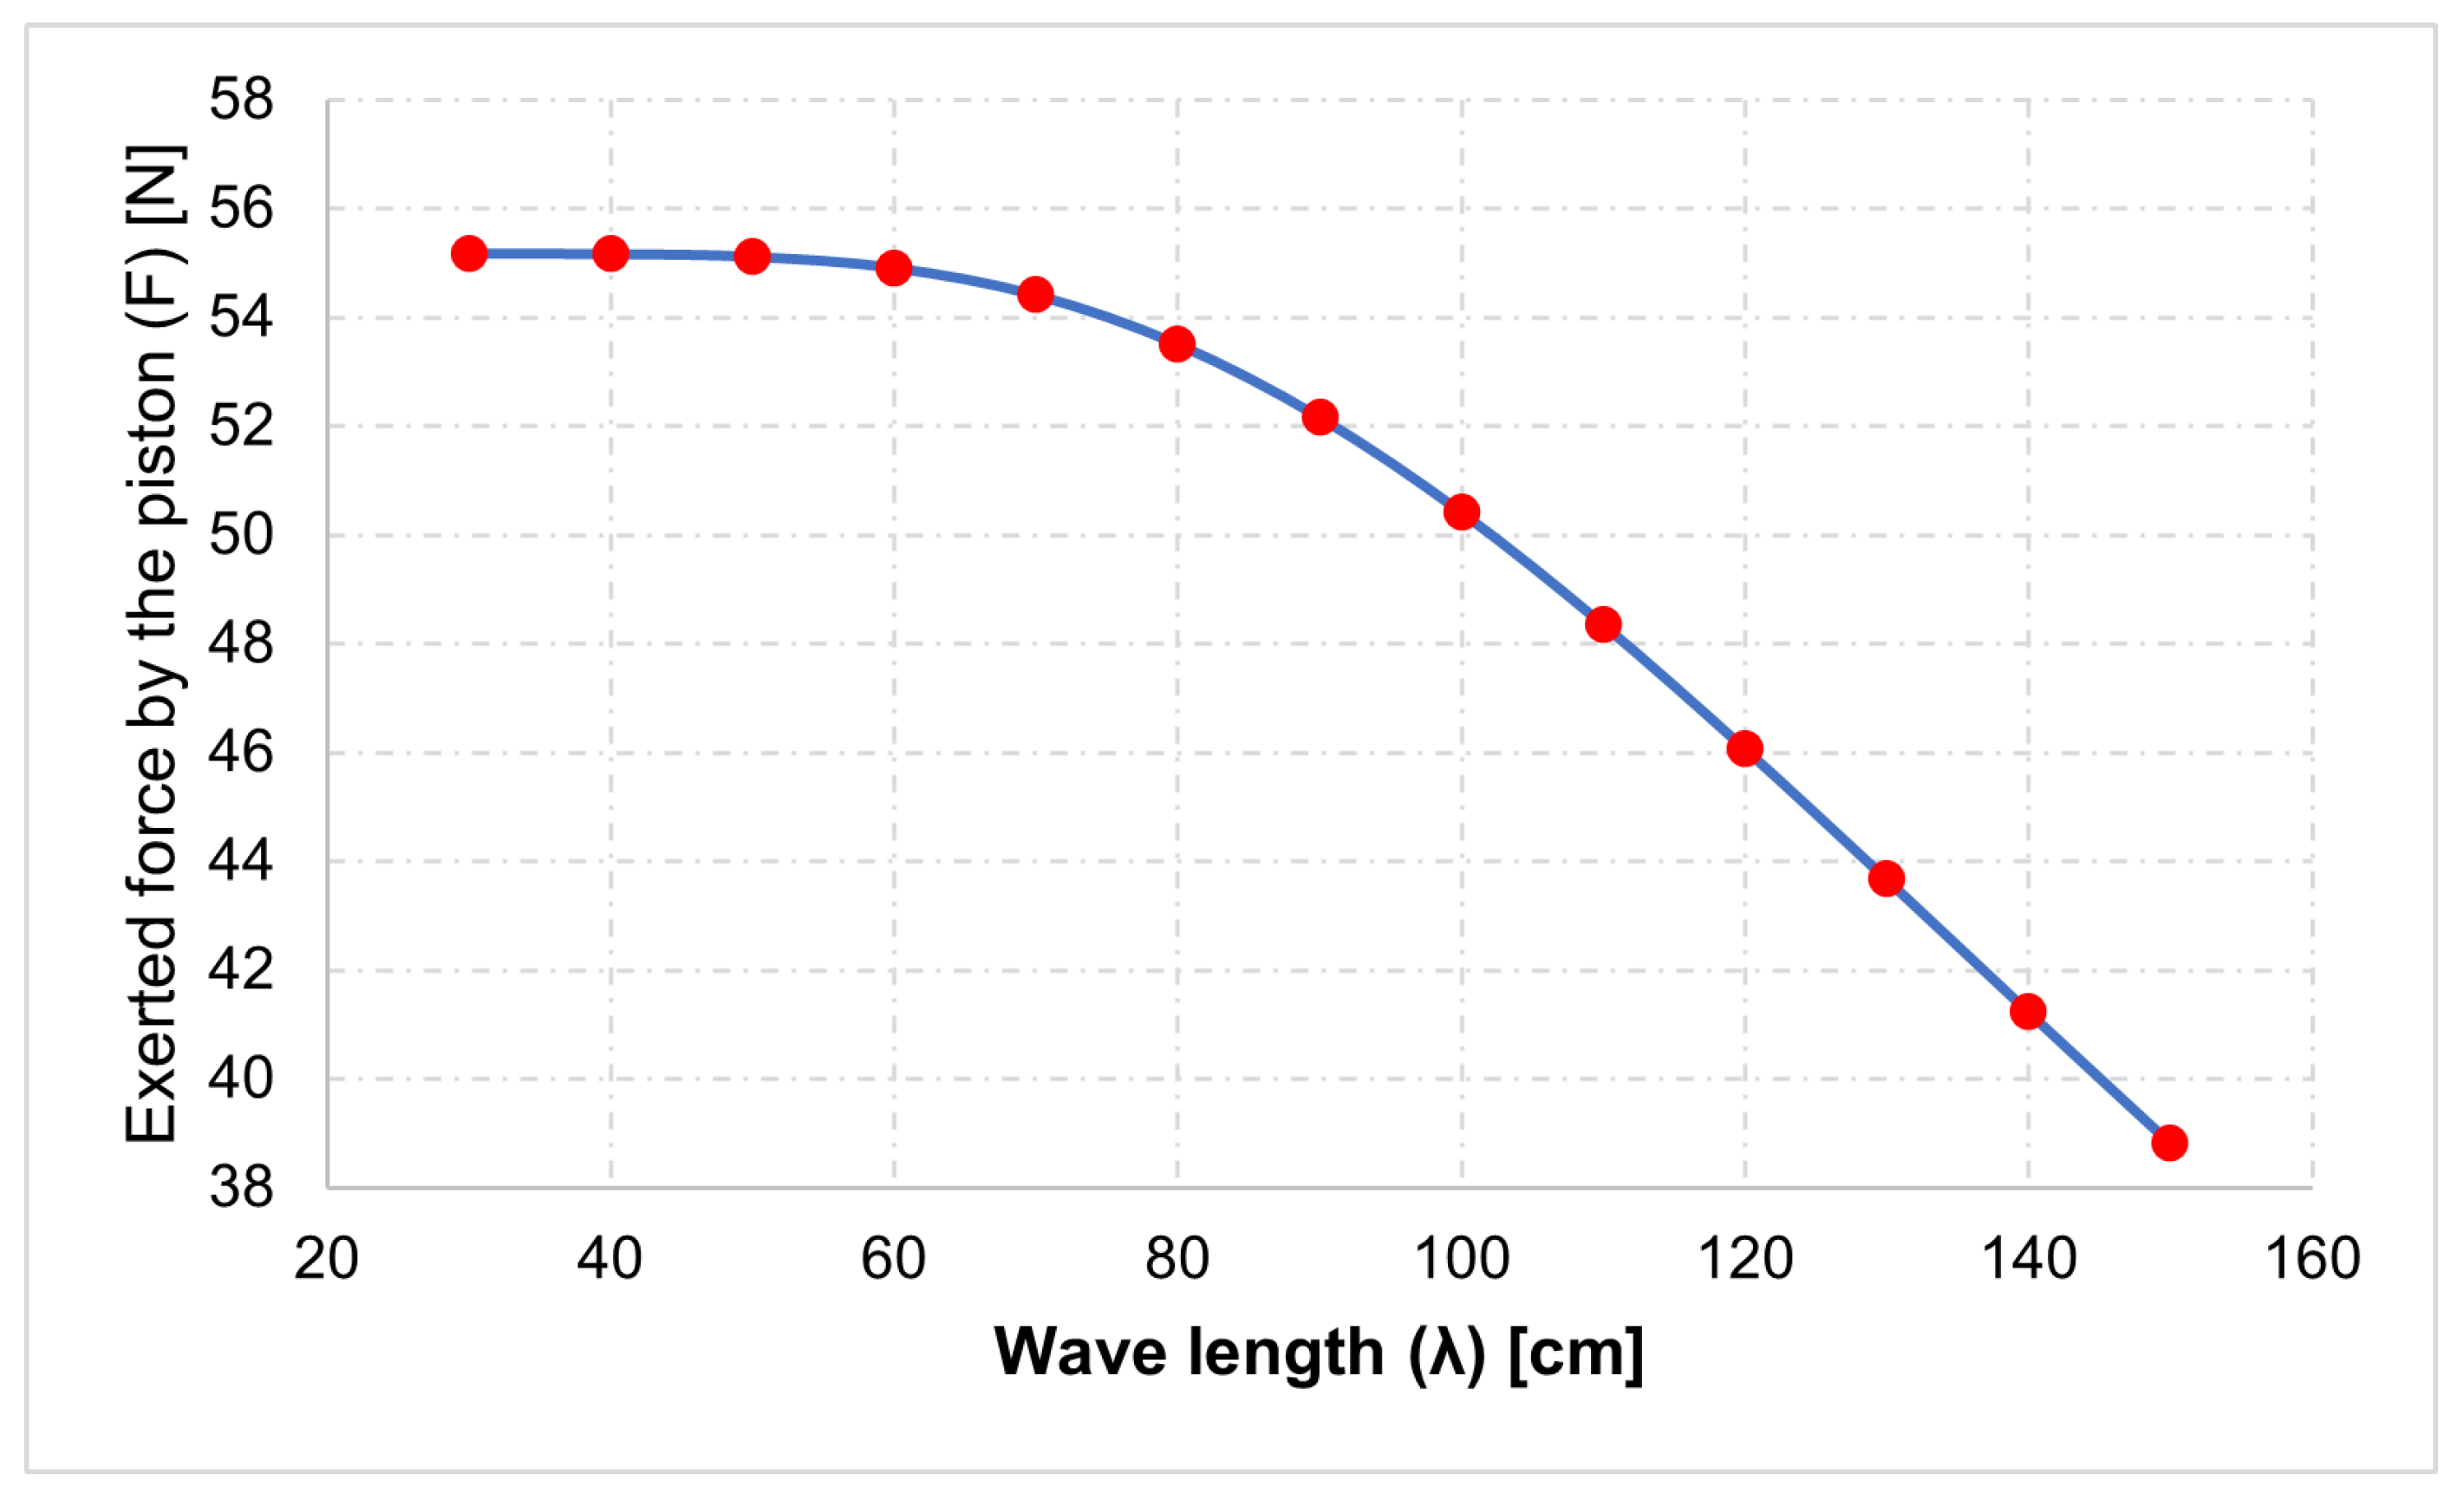
Figure 8 shows the force that the piston-type wavemaker would have to exert for different values of wave amplitude, calculated by using Equation (
6). In this case, for a length of wave of 150 cm, the required force is 46.08 N.
3.4. Shaker Selection
The structure has an inertial shaker at the top part—the beam that represents the nacelle—which simulates the vibrations created by the wind loads on the rotor. As it can be seen in
Figure 2, the shaker produces a movement along the main axis of its cylindrical body. It supposes that the force movement is also aligned with the axis of the beam (nacelle). Moreover, it must be considered that the beam can rotate like yaw rotation, so it lets modal shaker produce vibrations in any directions according the initial setting. Thus, based on the force requirement for the piston-type wavemaker—computed in the above subsection—it is within the operating range of the GW-M50 exciter, which is of DataPhysics brand.
The shaker needs an electrical amplification equipment that can enhance the signal, otherwise known as an amplified signal. In this regard, the selected amplifier is the model PA300E from DataPhysics brand, as it meets this requirement.
3.5. Piston-Type Wavemaker Design
This piston-type wavemaker is responsible for displacing the volume of water horizontally at a certain frequency, an action that generates the waves. In general, the mechanism comprises a triangular frame composed of alloyed aluminium C-profiles with an acrylic panel at the front acting as a piston-type wavemaker head. On the rear side is the connection with the vibration exciter, which facilitates the oscillatory movement of the piston-type wavemaker.
Of the basis of mechanical design, both static and fatigue analysis are quite needed. Thus, a static analysis (Von Misses stress) using the finite element method (through SolidWorks software) was performed to evaluate the behaviour of the mechanism parts against the main external force, i.e., the reaction of the displaced water volume, assuming that it directly impacts the acrylic panel. Likewise, it was important to apply a fatigue analysis, since the mechanical components are under the impact of cyclic loads while moving along water. Therefore, it is important to measure the stresses and analyse the lifespan of the components.
3.5.1. Piston-Type Wavemaker Frame Design
This structure is designed to overcome the pressure exerted by the volume of water displaced in the horizontal movement developed by the mechanism.
It consists of 50.8 × 25.4 × 3.18 mm aluminium C-profiles, forming a triangular structure that supports the acrylic panel and distributes the reaction force exerted by the volume of water, avoiding the acrylic’s deformation.
The acrylic panel is fastened by HX-SHCS 0.25 hex bolts to the aluminium frame. The acrylic panel has a thickness of 9 mm, while the sides contain small clearances that allow the piston-type wavemaker to move without causing high friction on the sides of the channel.
3.5.2. Guide and Alignment System Design
The guiding system is aligned from two sides with 20 mm diameter steel shafts, which are supported by four NTN linear ball bearings (model KH2030). The bearings, being cylindrical, had to be embedded in aluminium blocks, which serve as the headers to be anchored in the aluminium frame.
The frame and the guidance alignment system, in turn, are supported by steel angles placed at the front and rear end. This enables the piston-type wavemaker to be flexible and moved vertically in case it has to be raised or lowered a few millimetres with respect to the surge channel.
3.6. Wave Generator Channel Design
The generator channel is designed to reproduce scaled marine waves using a piston-type wavemaker. It is designed using 8 mm tempered glass as side panels; this glass provides the necessary strength to support the volume of water contained inside the flume, according to a stress and strain analysis performed.
Considering that the channel is 3 m long, 70 cm wide, and 95 cm high, it is important to design a reinforced structure to provide stability and resistance in all the sections and joints. Finally, the tank structure is basically composed of 40 × 40 × 3 mm steel angles, arranged in main sections and with reinforcing angles, which are placed to distribute the forces and avoid stress concentration.
This structure supports many of the external loads of the different components of the WGC, such as the weight of water volume, the weight of the wave absorber, the weight of the WT jacket-type foundation, and the weight of the piston-type wavemaker. Only the weight associated with the WT structure is one of the largest loads for the WGC. Its weight is approximately 108.72 kg, which represents a force of 1.07 kN. As the structure has a square base, there are four support points over which this load is distributed.
With all the loads applied to the structure, Von Misses stresses and deformations were computed through a simulation on SolidWorks software. It was observed that the lateral walls experienced stresses that tend to displace them to the sides. Similar to the previous case, the critical zones are the lower part and the sidewalls of the channel. The maximum value of deformation reached is close to 0.5 mm. Therefore, it can be assured that the channel behaves in an expected way, resisting the stresses caused by the different applied loads.
3.7. Filtering and Pumping System Design
A filtering and pumping system is essential in environments where fluids, in this case water, are stored for long periods of time, as it allows for proper maintenance and cleaning. In this case, it is necessary to select a water pump with the appropriate filtration system.
For this project, it is desirable that this process is carried out within approximately 1 h. Based on the dimensions of the channel (width and length) and a height of 50 cm, the volume of water stored inside is calculated to be 1.38 m3.
3.8. Mechanical Multiplier Design
This component connects the vibration exciter to the piston-type wavemaker and is responsible for amplifying the exciter’s peak-to-peak horizontal travel (2.54 cm) enough to reach the piston-type wavemaker stroke (15 cm). As this component is a beam rotating around an axis, by law, the moment applied at both ends of the beam must be conserved. In other words, at the point of connection with the vibration exciter, the force will be six times greater than at the other extreme. In this regard, the mechanical multiplier has been designed in a 6:1 ratio.
The finite element method was also applied to this mechanism to determine the stresses and deformations that could compromise the system. It was observed that the deformations of the beam are more relevant in the upper part, since the displacement obtained is 7.7 mm. This value does not represent any type of failure since for the static analysis, it is considered that the beam is in a vertical position. Furthermore, the fatigue study is particularly significant since it gives long-term information on a component’s behaviour under cyclic pressures. It was seen that with 12 cycles, the areas near the bearing would experience stress concentration, which in turn could cause an internal structural damage (physical damage). On the other hand, the areas farther away have a longer life cycle. Thus, in conclusion, the mechanical multiplier performs satisfactorily and within the expected operating limits.
3.9. DAQ Devices and Sensors Selection
The function of the accelerometers is to quantify the acceleration of the structure under test loads; the following characteristics are taken into account for their selection:
Operating environment: Accelerometers must be capable of operating when submerged in water;
Bandwidth: For vibration tests, an important characteristic is the bandwidth of the sensor and its resonance frequency. In a previous analysis of the lab-scale WT jacket foundation, it was found that the type of structure to be tested presented vibrations below 100 Hz [
1], due to which it was chosen as the lowest frequency measured by the sensors;
Measurement axes: Accelerometers with three measurement axes are chosen;
Type of accelerometer: This indicates the physical principle used for the transduction of acceleration to an electrical signal. Piezoelectric and piezo-resistive (IEPE) types are identified as the most common for modal analysis, while fibre optic types are seen as high-precision technology that is reliable and efficient.
The other characteristics considered are the measurement range, sensitivity, and susceptibility to noise, which are all related to the overall quality of the sensor.
3.10. Application of Conceptual Design
Software design and implementation require models to guide the development process in a manner analogous to architectural blueprints. To create these models, visual languages such as the Unified Modelling Language (UML) are used, which promote standardization and provide a framework within the project.
UML specifies and delimits the parts of a software system through structure and behavioural diagrams; structural diagrams describe the static components, such as objects, classes, operations, relationships, and attributes, while behavioural diagrams emphasize the dynamic part that shows the state changes of the objects or the collaborations between them.
The DAQ interface application is designed by considering the following UML diagrams:
Class diagram: Classes group the different types of objects (representations of real objects or conceptual abstractions) used in solving a problem;
Use case diagram: It illustrates the different ways in which a user interacts with the system; each use case approximates a functionality from the point of view of an actor, which may be a person or another software system;
Activity diagram: It shows the flow of actions to be followed in an application usage scenario.
3.11. Application Development
Commonly, the interfaces used for data acquisition are ad hoc solutions that are implemented in licensed platforms such as MATLAB™ or LabVIEW™. Python, being widely used in data science, is a widely accepted option in open-source modal analysis projects.
The application code is written in Python 3.6 and the NumPy, Pandas, and NI-DAQmx libraries due to their open-source nature and maturity in the data science field. This also helps abundant documentation to be located.
To facilitate the task of data acquisition through the application, a graphical interface is required to display in real time the input and output signals of the sensors and actuators, in addition to providing the user with a simple and intuitive means of control. This function is performed by a graphical interface comprising a set of widgets (elements that allow access to frequent functions), organized based on a layout (arrangement of elements) and styled using CSS (cascading style sheets). The graphical user interface (GUI) design is developed using the PyQt5 library and the Qt Designer tool, which creates windows by interactively positioning and adjusting widgets.
DAQ Environment Configuration
The software development process is iterative in nature and requires the use of testing and debugging tools. In the application, data acquisition simulation is used through the creation of virtual DAQ devices that are configured in the NI-DAQmx driver. Through these virtual devices, it is possible to avail all the necessary features for the operation of the system without having to deploy real hardware, speeding up the error detection and correction process.
4. Results and Discussion
4.1. Wave Generator Channel
The system for wave generation comprises several components whose mechanical design process has been explained in
Section 3. Among these are the surge channel, the wave absorber, the wavemaker, and the mechanical multiplier.
For instance, to design the wave absorber, it is configured at an inclination of 30
with horizontal axis [
21]. This is an optimum angle at which a higher wave absorption capacity can be obtained. Regarding the piston-type mechanism, some steel angles support the channel, the parallel axes where the wavemaker runs, and the aluminum frame with an acrylic panel.
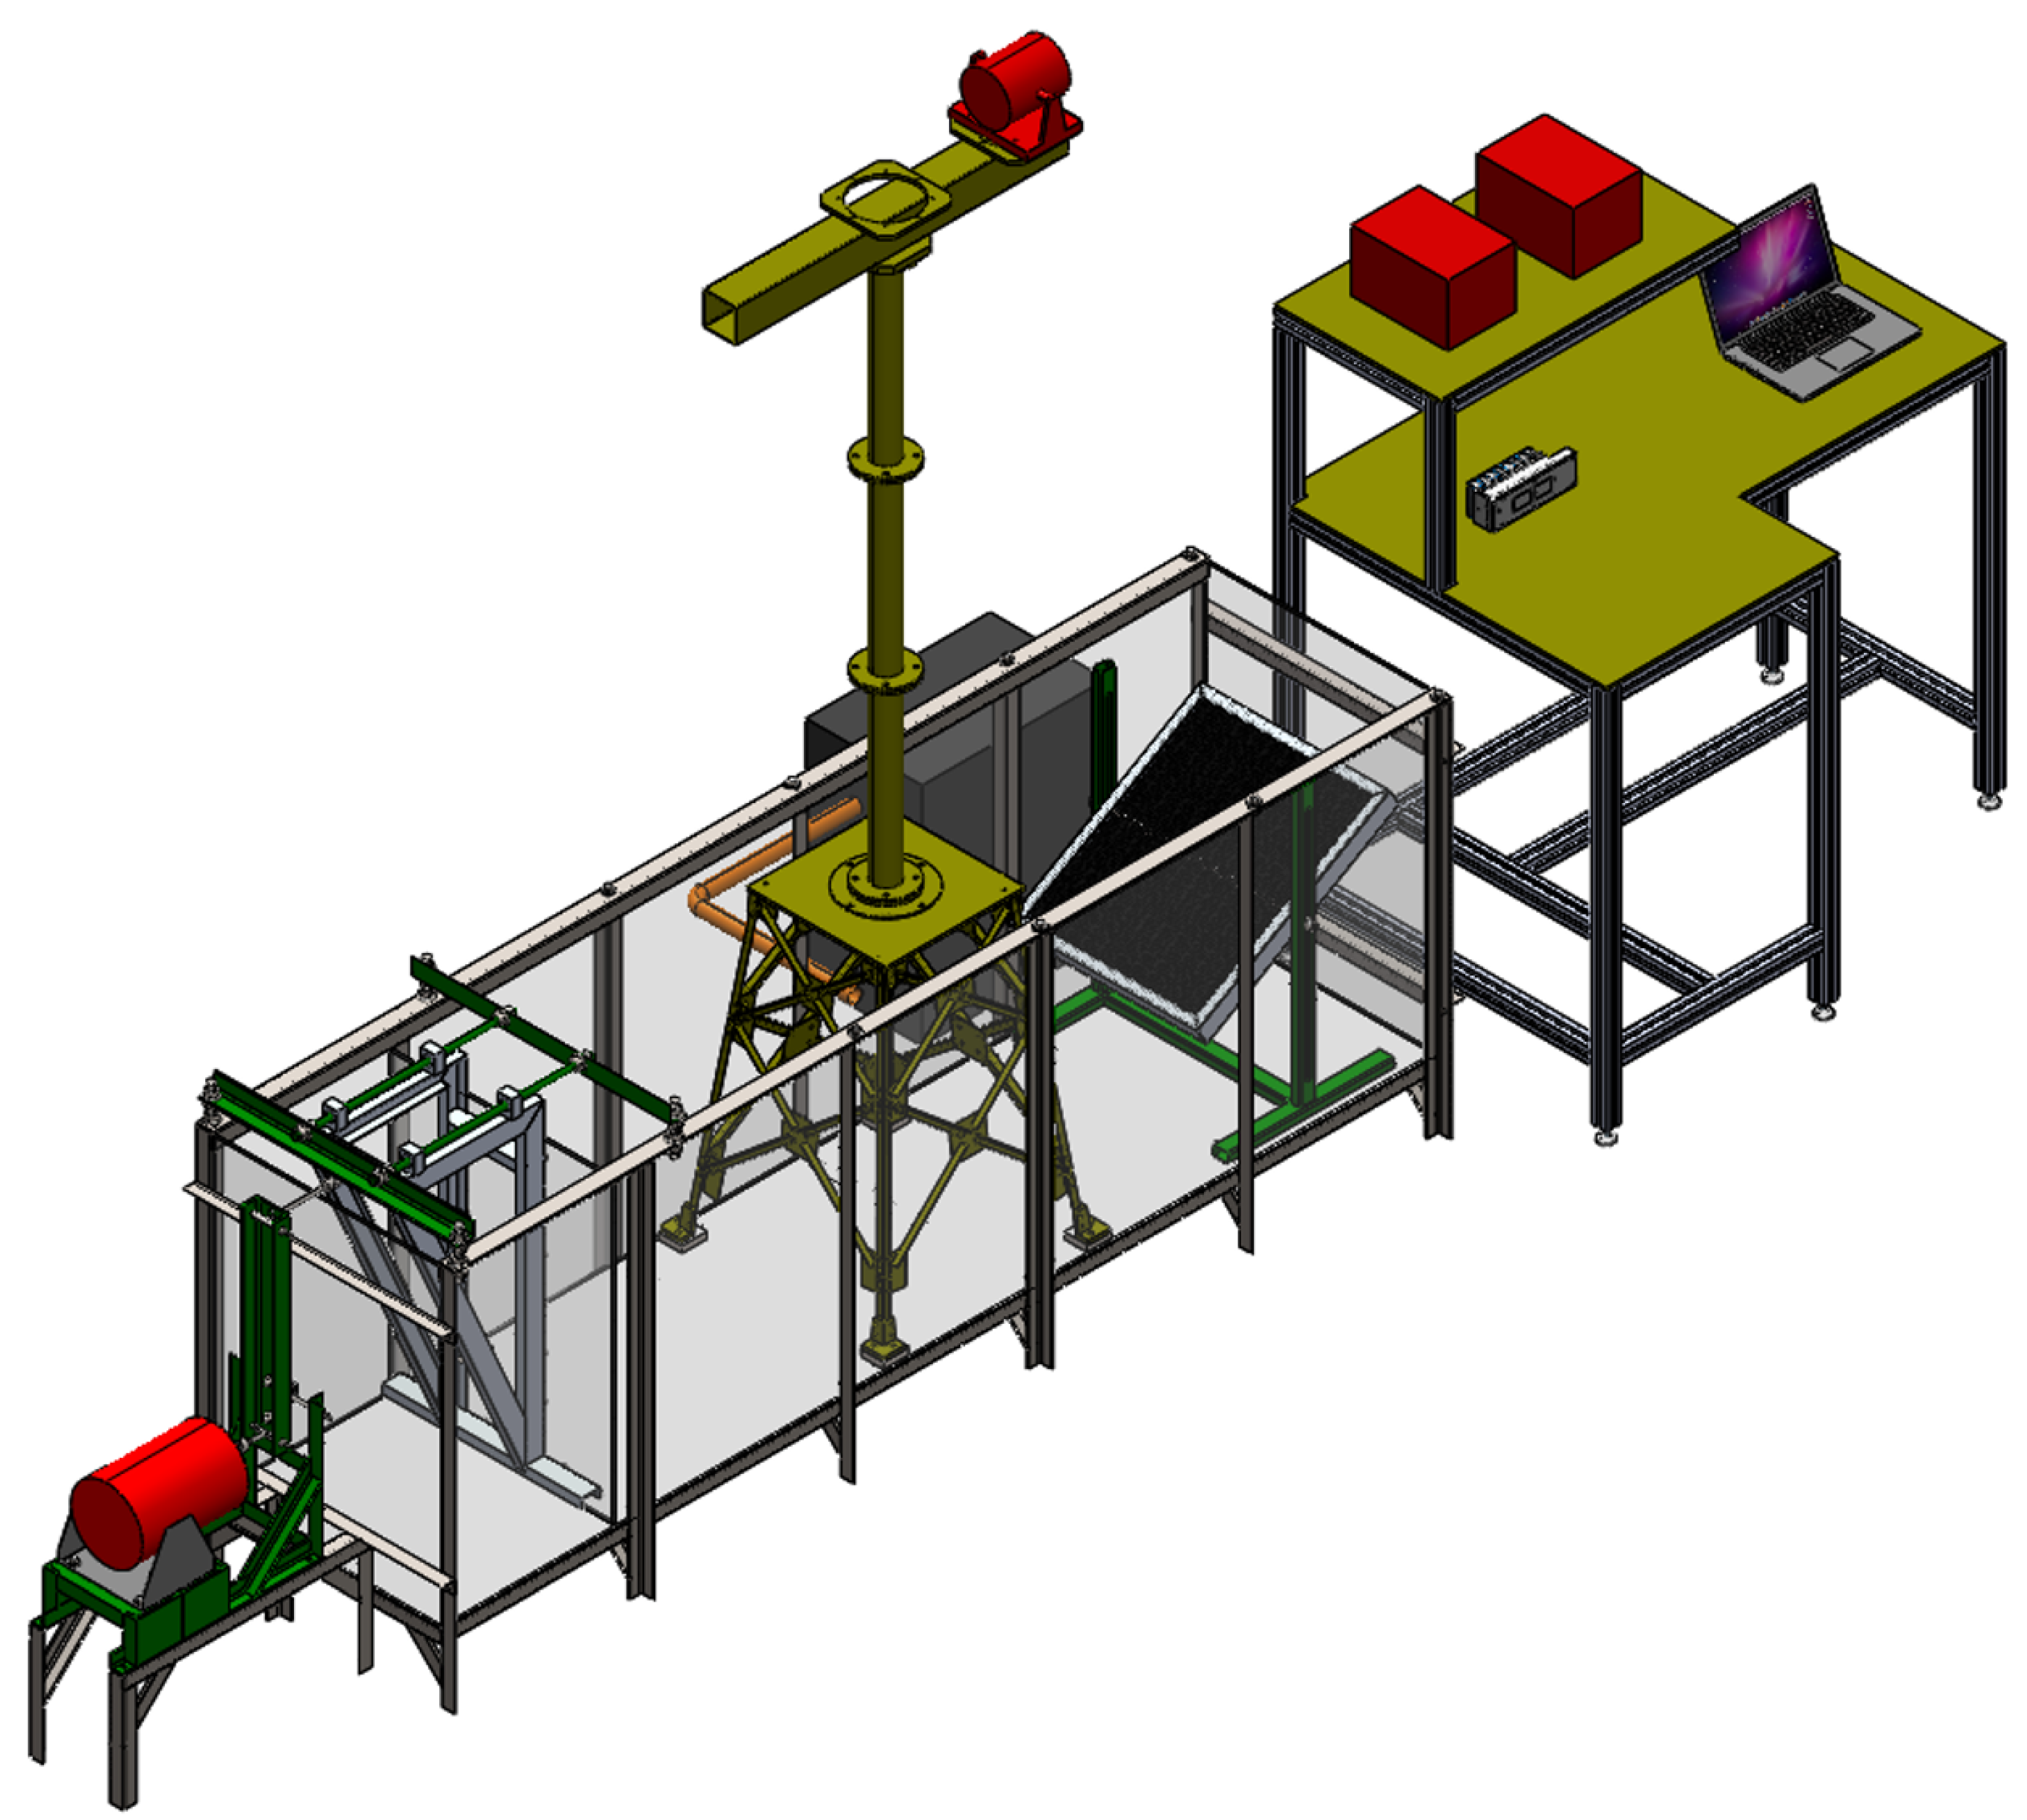
Finally,
Figure 9 shows the total assembly of the wave generator, including other elements such as the control table, the pumping and filtration system, and the installed WT support.
4.2. Accelerometer and DAQ Devices Selected
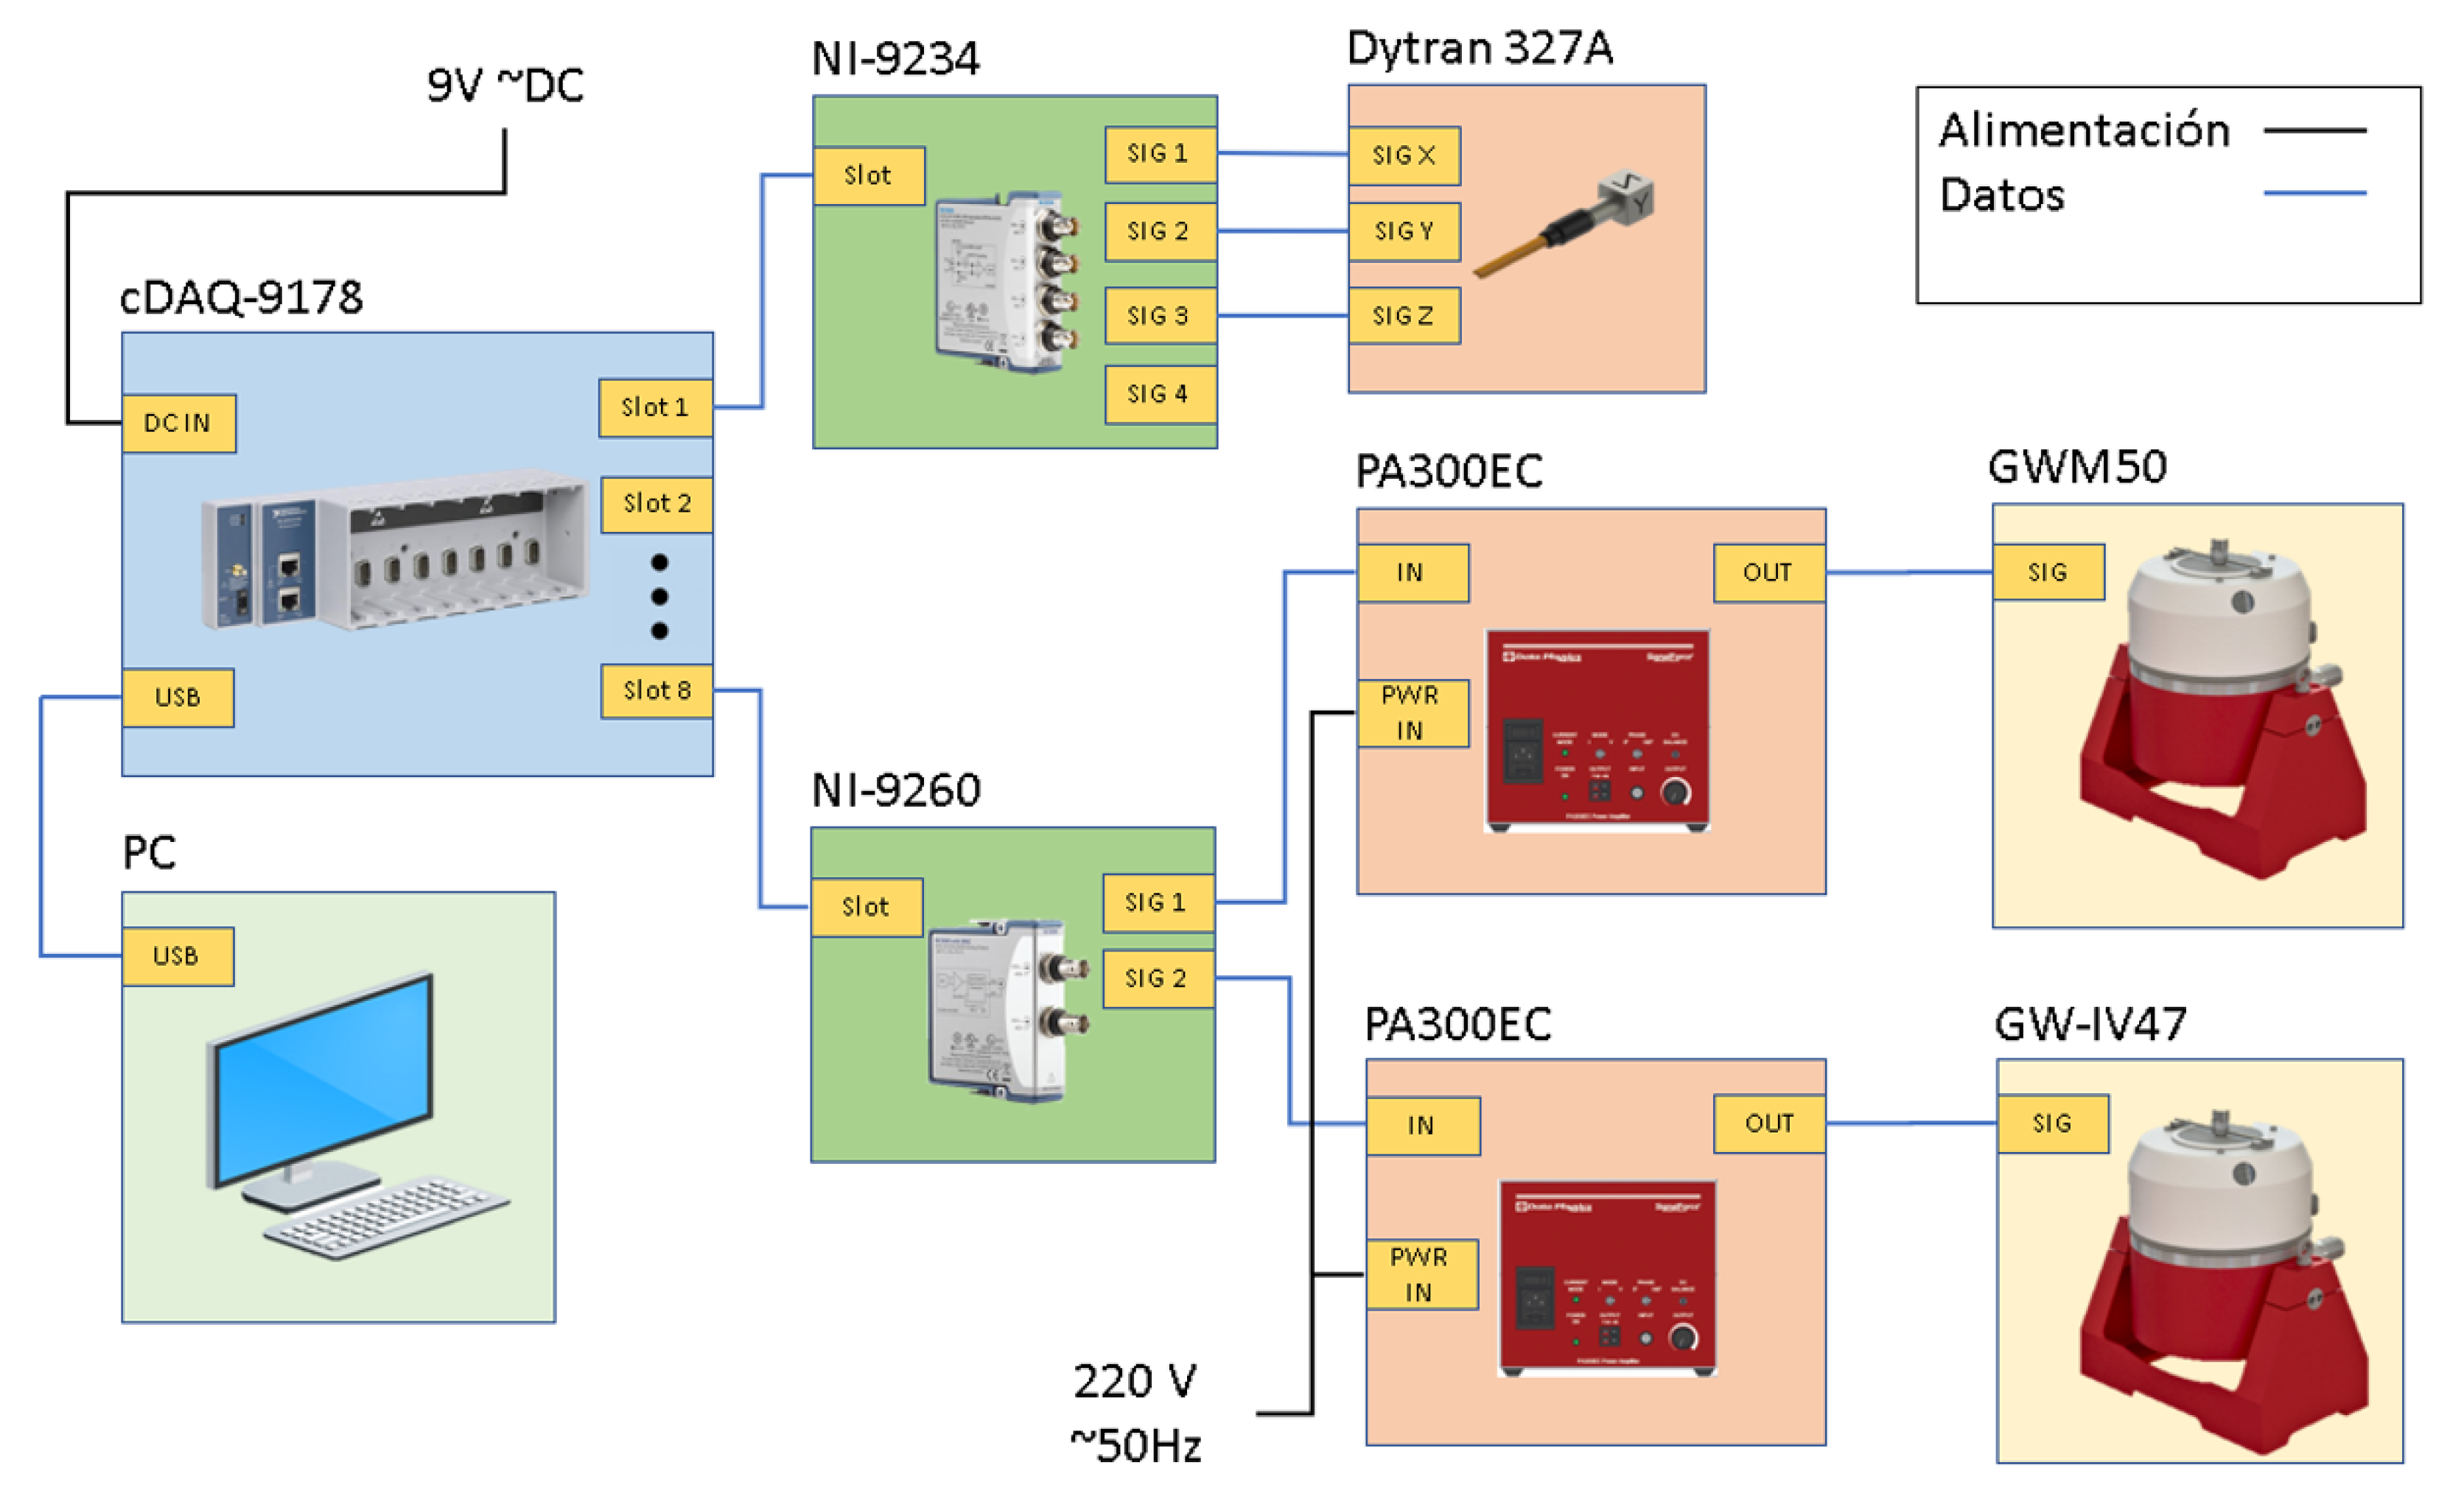
The accelerometer model selected is Dytran 3217A, with titanium alloy casing and polyurethane protection for immersion at depths up to 100 m. Here, each one has three voltage outputs with a BNC-type connector.
For the DAQ device, a solution consisting of a National Instruments compactDAQ™ 9178 chassis with eight slots for equipping input or output expansion modules and USB data connection is selected, allowing the sensor and actuator signals to be processed from the same interface. The connection of the sensors to the chassis is made through six NI-9234 vibration and sound modules with four independent analogue inputs, each one giving the maximum capacity for eight triaxial accelerometers.
The power amplifiers feeding the wave and wind vibration exciters received the control signal through a NI-9260 analogue voltage two-output module.
4.3. Data Acquisition and Control Application
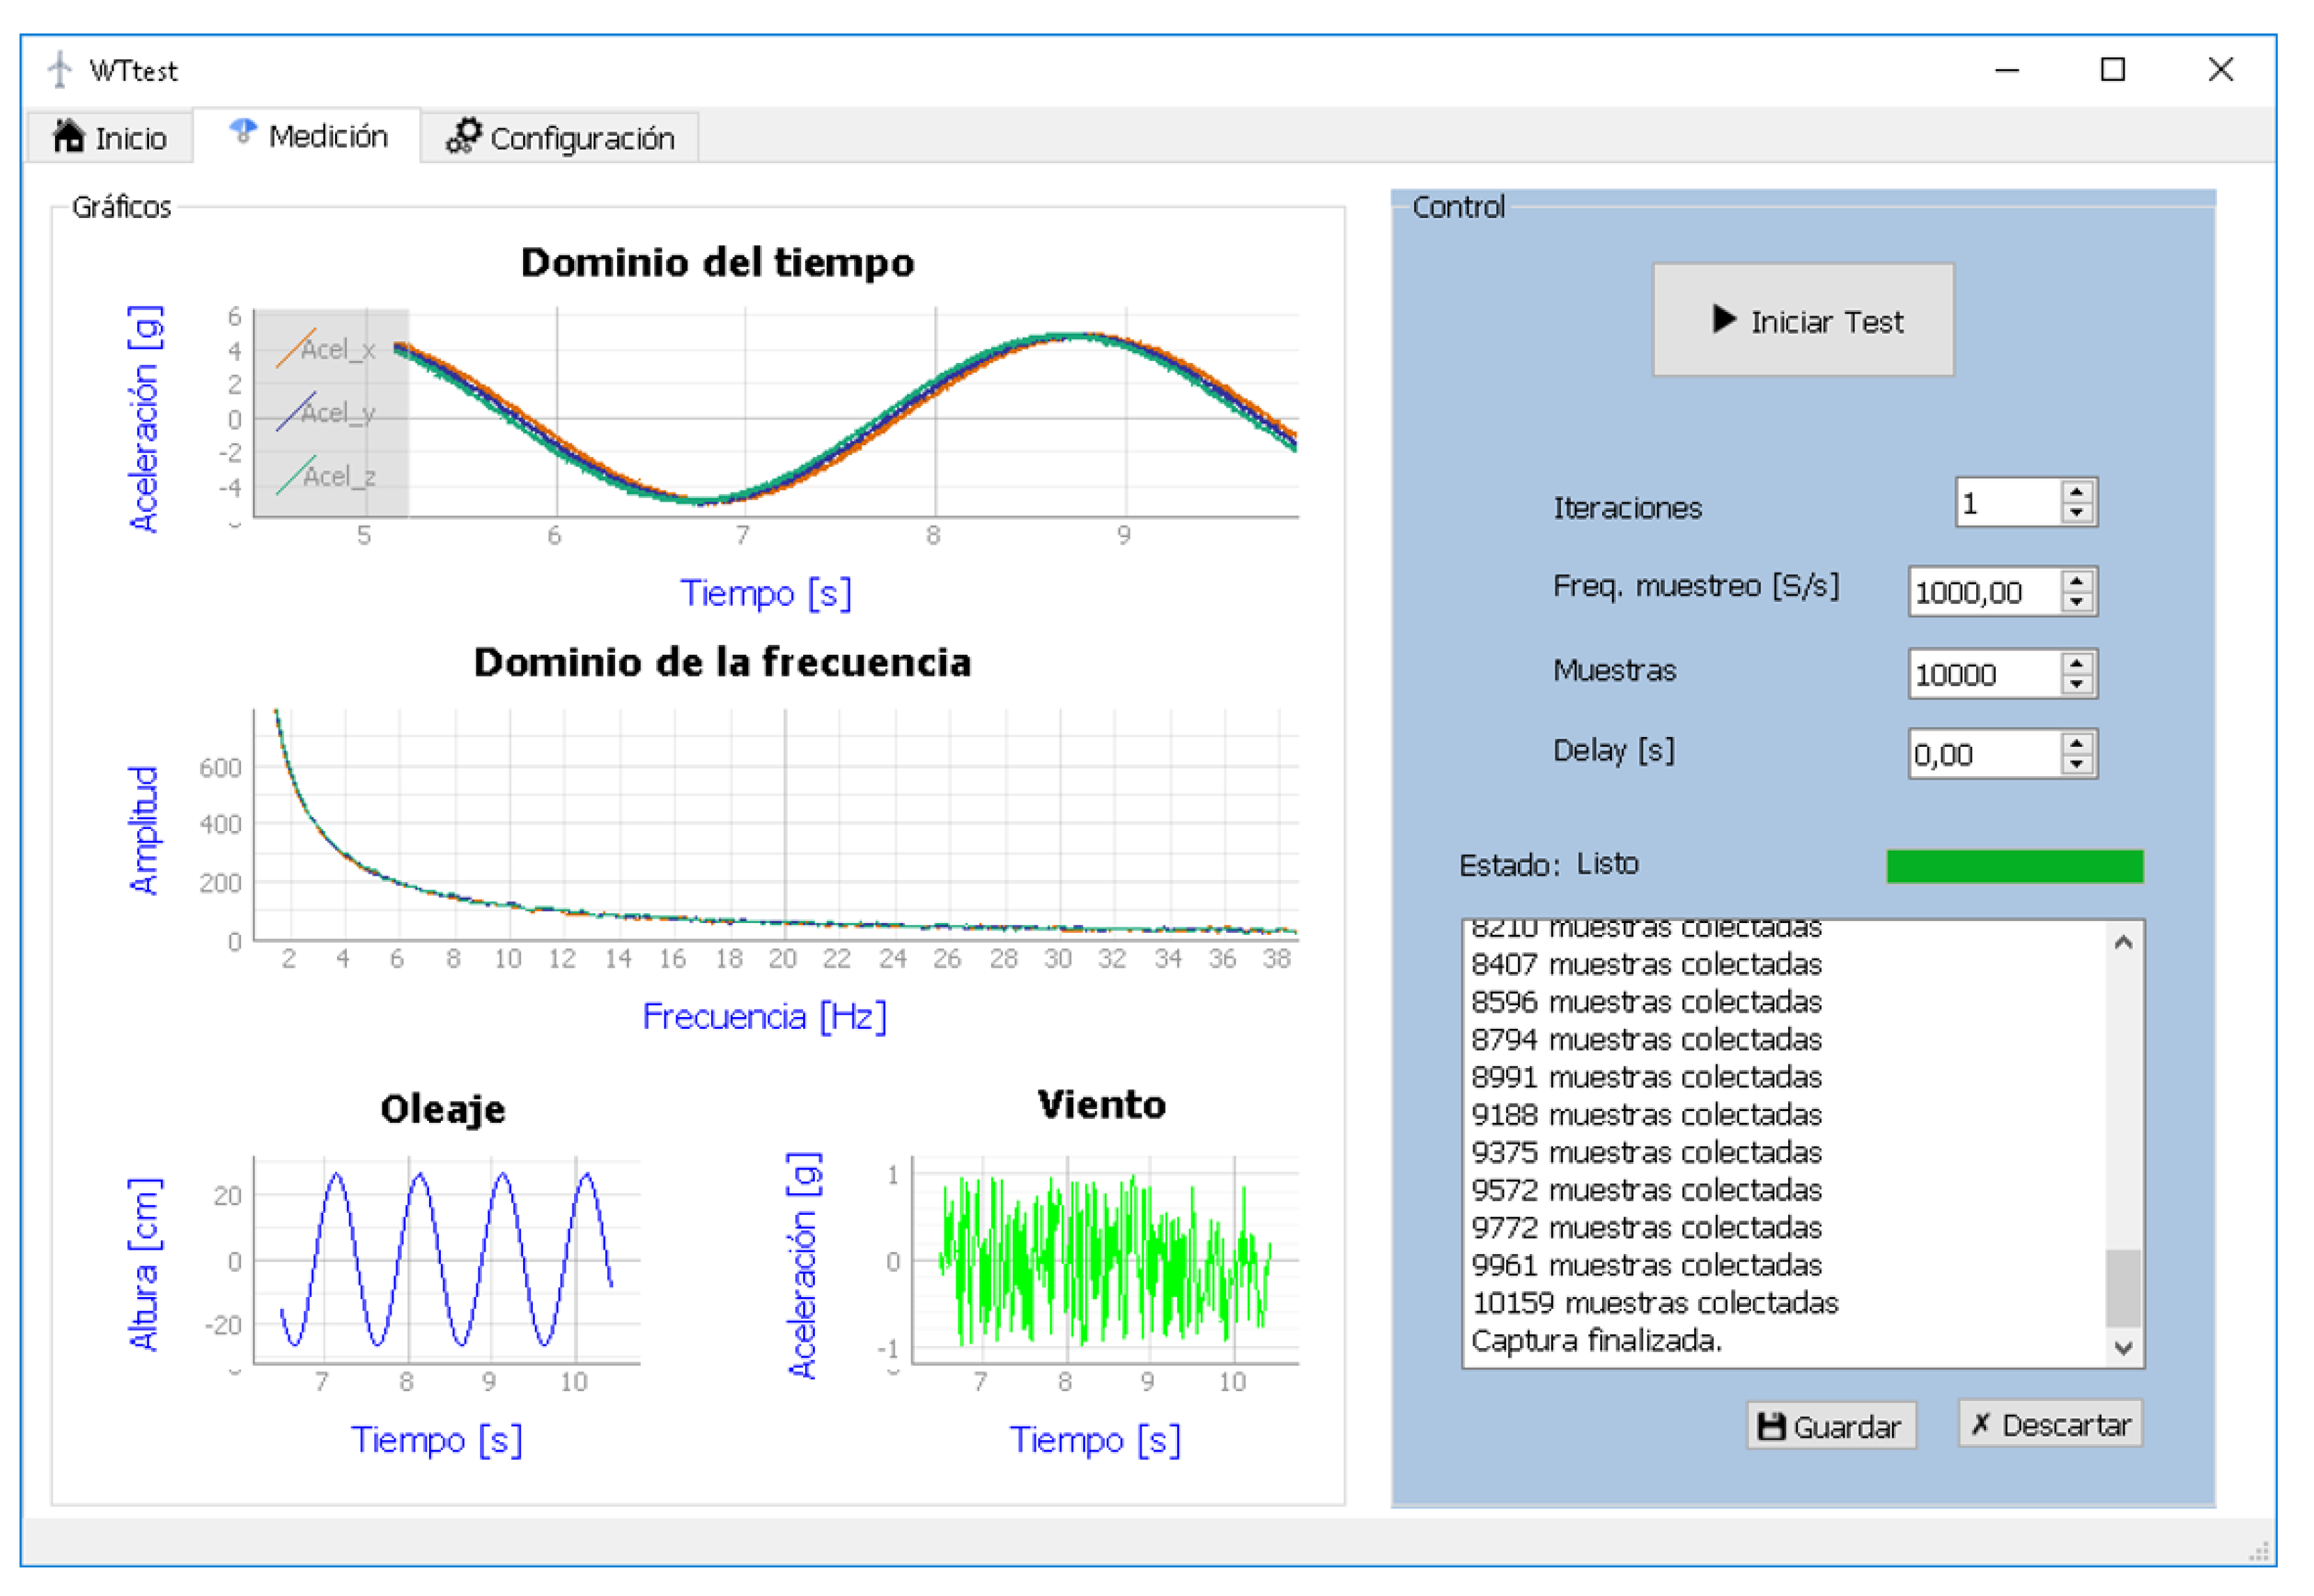
The application is divided into two main windows that are accessible through tabs at the top; by default, the measurement tab containing the graphs of the signals and parameters for the test control is displayed. The four windows in the graphics area correspond to the sensors and actuators and are updated in real time as the signals get read or written by the configured DAQ device.
The time-domain response plot shows the measured acceleration in gravitational units (g) versus time in seconds (s) and is placed next to the frequency domain response plot to give a more complete view of the signals acquired by the accelerometers. To show the performance of the actuators simulating wave and wind, two more plots are placed at the bottom; the wave is represented as the height of the generated wave in centimetres and as a function of time in seconds. The wind is shown as an acceleration signal over time.
In the control area, the following options are added:
Iteration: It indicates the number of times the data capture is repeated;
Sampling frequency: It sets the number of samples per second that are read from the DAQ device;
Sample: It represents the total data read from each channel configured in the DAQ device;
Delay: It introduces a delay between each iteration for the actuators to reach a steady state or perform a variation in the test conditions.
A status bar indicating the progress (in percentage) of the capture and a log panel with important event information are also displayed. In addition, a pair of buttons to save (in comma-separated values [CSV] format) or discard the captured data are enabled at the end of the test.
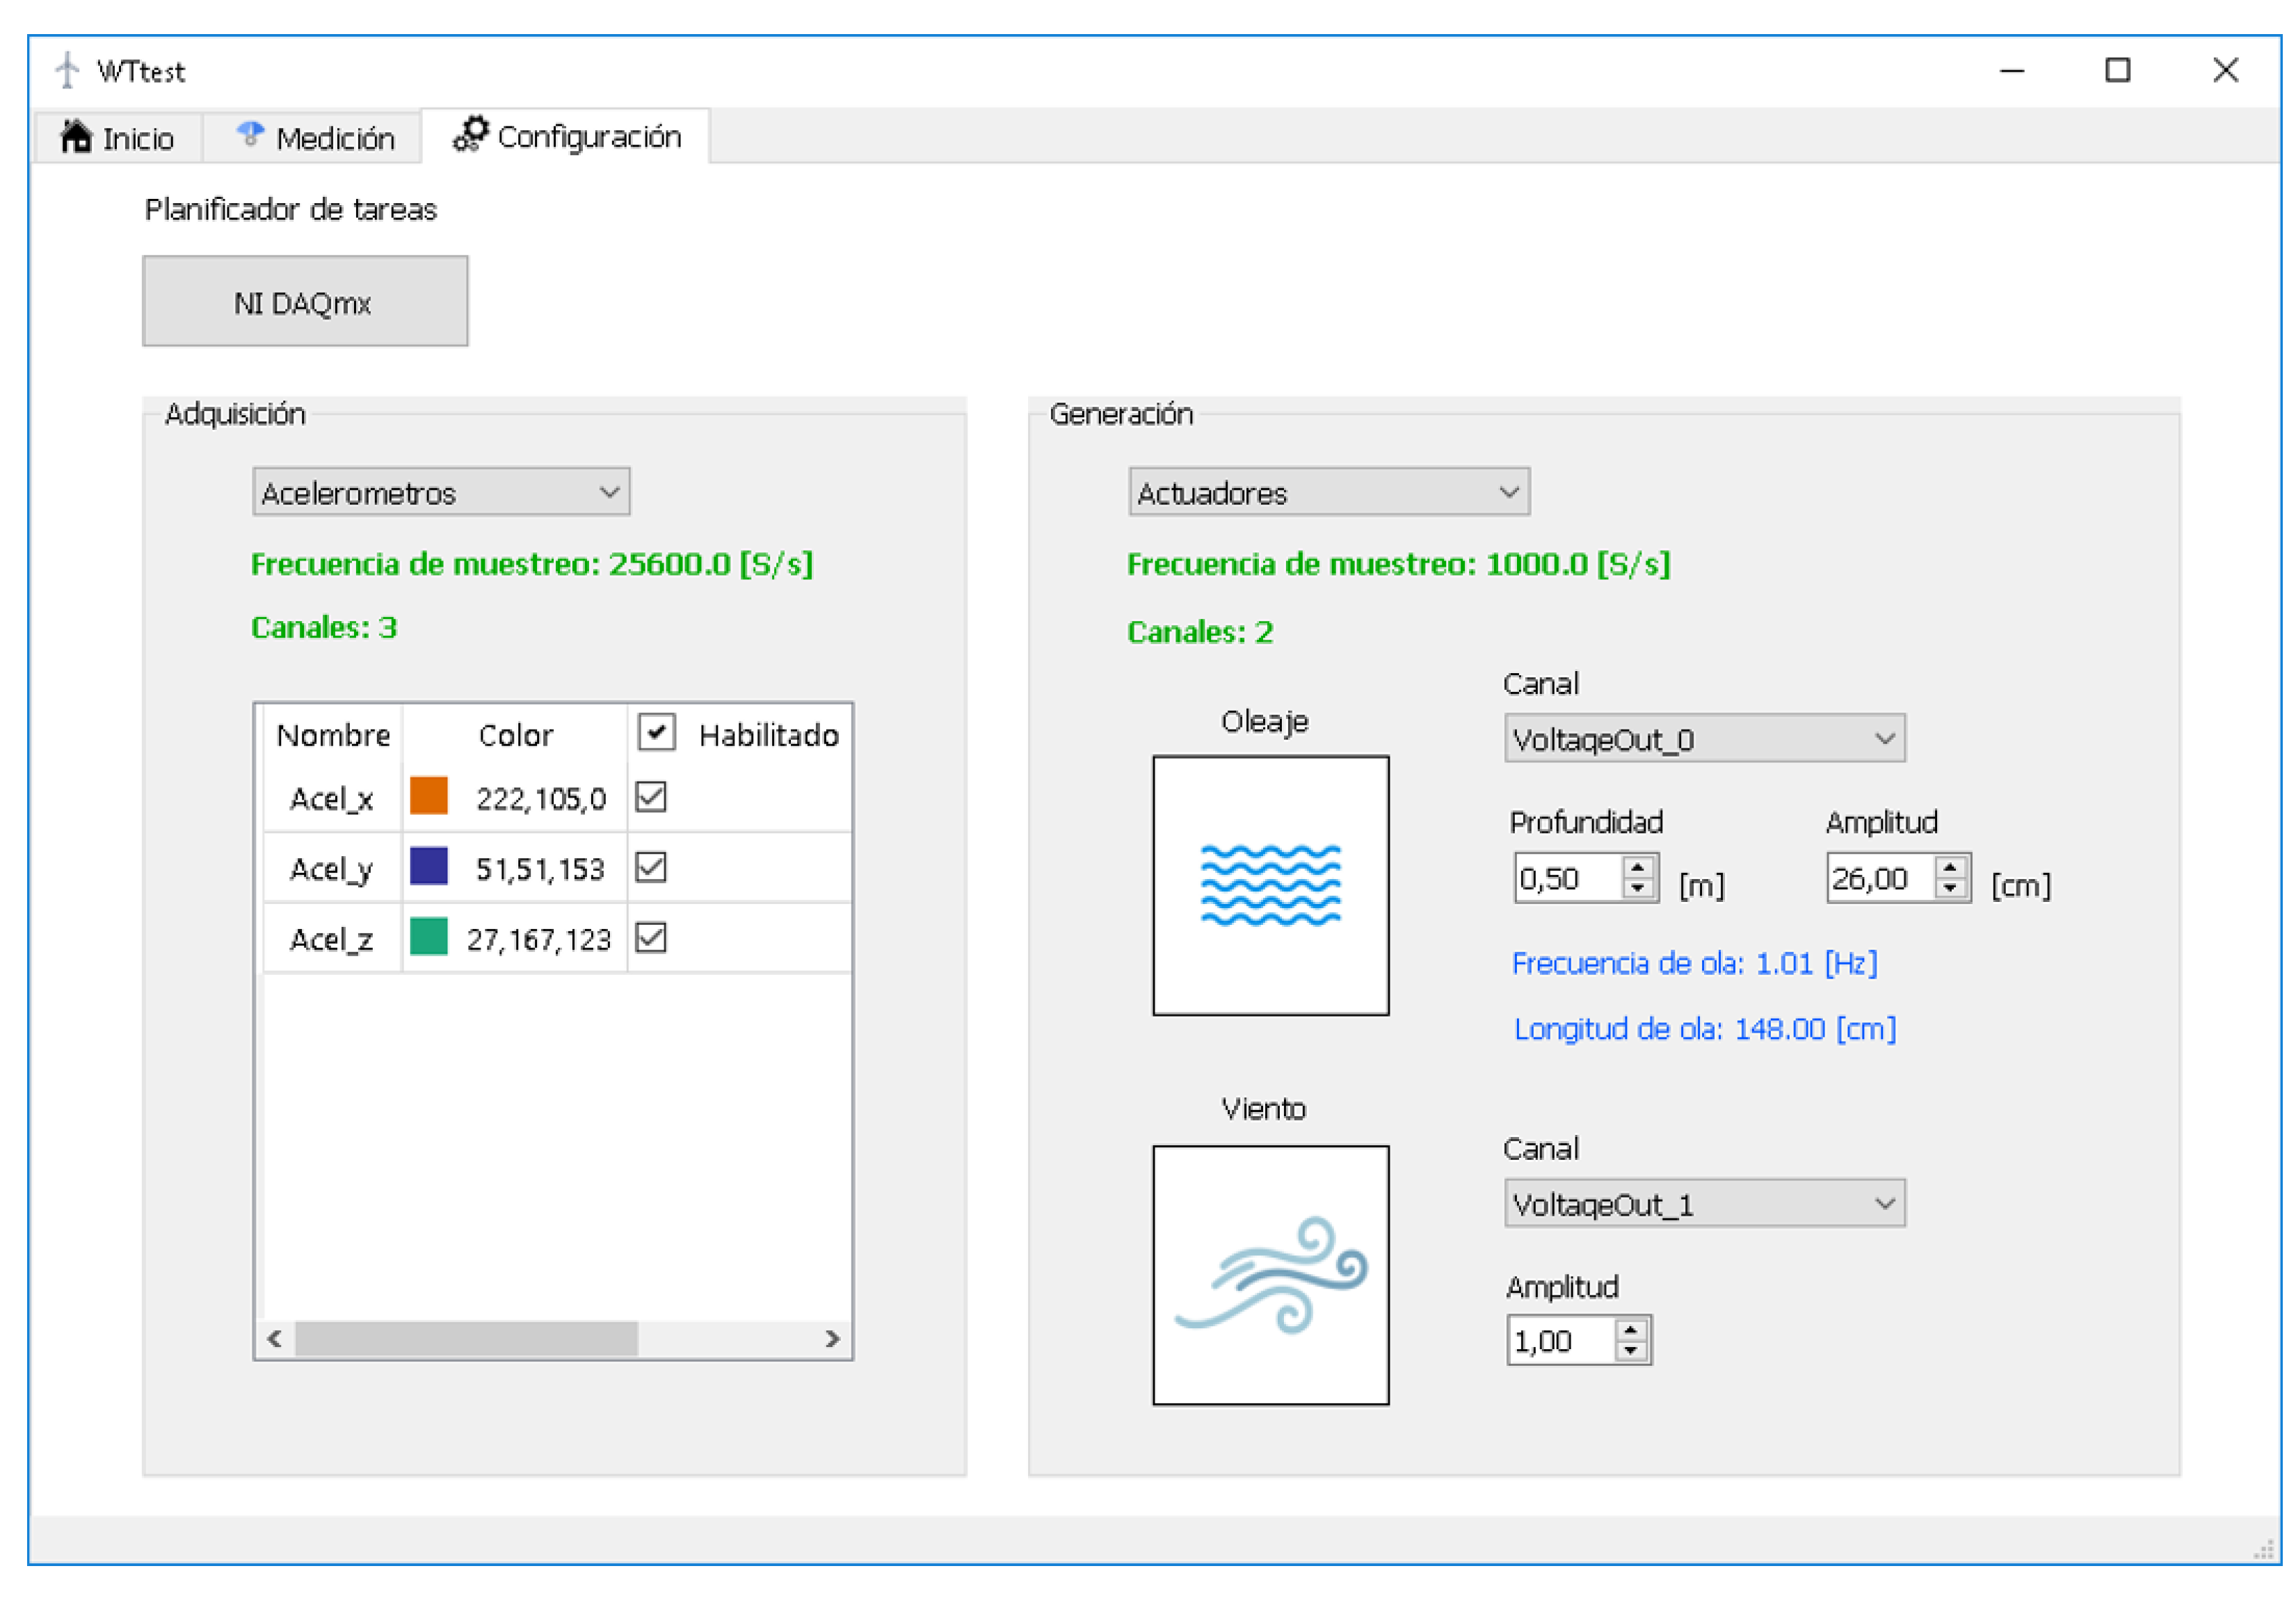
In the configuration tab, the acquisition and generation options are included to choose the tasks and channels associated with the data capture. A button is also added at the top to access the task scheduler through the measurement and automation explorer of the NI-DAQmx driver (see
Figure 10).
The acquisition option allows the selection of the signals and colours that represent them in the graphs, while indicating the number of channels available to read and the sampling rate in samples per second (S/s).
In the generation part, the channel selection option is added for each actuator. For the wave, the channel depth and wave height are defined as input variables; the frequency and wave length are calculated and displayed from these data.
For wind generation, only one amplitude option is included for the white Gaussian noise signal; in the acquisition part, the number of available channels and the sampling frequency are highlighted in green.
4.4. Simulation for the Application Operation
The data acquisition simulation for the application tests is executed in a Python environment using Anaconda 3 and the virtual DAQ devices configured using the NI-DAQmx driver. On the other hand, the simulated accelerations are of the sinusoidal type with a frequency of 0.25 Hz and a 5 phase shift between them.
The parameters used for the experiment are left by default at 10,000 samples with a frequency of 1000 S/s. For the actuators, a channel depth of 0.5 m and a wave height of 26 cm are set, while the amplitude of the wind generator is set to 1 (see
Figure 11).
4.5. Electrical and Electronic Connection Diagram
The DAQ system components are connected by following the hierarchy outlined in
Figure 4 of the conceptual design. The data flow starts from the computer running the test application and the sensors/actuators and proceeds through the signal conditioning layer. This comprises the DAQ device and the power amplifiers that receive direct power. The rest of the components are indirectly powered by them (see
Figure 12).
5. Conclusions
The static and fatigue analysis of the various mechanically designed components has validated that stresses and deformations are within the permissible range, indicating that the components will work safely.
The WGC has a standard depth of 50 cm and handles a range of wave amplitudes that will be a function of the wave length, which works in the range of 30 to 150 cm.
The wave flume has a filter and pumping system that allows it to recirculate the stored water to the interior of the flume and provides it with the proper maintenance. It is worth noting that all this is done in less than an hour.
The WTtest application meets the design requirements; this means, it has a good degree of usability and allows the simulation control to be executed with the WGC.
The user interface during the simulation displays the signals acquired by the accelerometers in real time and saves the captured data as datasets in CSV format.
The cDAQ-9178 device has eight serial ports, six of which are configured as inputs for the accelerometers, while one functions as an output for the exciters. This leaves one serial port that can be used as an input or output, depending on the need.
In a nutshell, if the designed system is implemented it would be capable of producing waves and vibrations that allow the testing of WT foundations in a lab-scale environment by gathering data that would allow further analysis for failure prevention. After, this methodology can be scaled in order to be applied in real environments once all the pre-testing has been done under controlled lab-conditions.


 ,
, 


