Article

Dynamic Behavior of the Net of a Pile–Net-Gapped Enclosure Aquaculture Facility

1
National Engineering Research Center for Marine Aquaculture, Zhejiang Ocean University, Zhoushan 316022, China
2
Ningbo Institute of Dalian University of Technology, Ningbo 315016, China
*
Author to whom correspondence should be addressed.
This authors contributed equally to this work.
J. Mar. Sci. Eng. 2022, 10(9), 1166; https://doi.org/10.3390/jmse10091166
Submission received: 8 July 2022 / Revised: 8 August 2022 / Accepted: 16 August 2022 / Published: 23 August 2022
(This article belongs to the Special Issue Wave Interactions with Coastal Structures II)

Abstract

:
A pile–net enclosure aquaculture facility, deployed in inshore waters, is a sustainable and ecological aquaculture pattern for rearing fish and other aquatic animals of economic value in China. It is essential to study the maximum force on and deformation of the net system of a pile–net enclosure facility to prevent its failure, since successful aquaculture is highly dependent on the longevity of the net system. In this study, a pile-net enclosure aquaculture facility with a gapped pile-net configuration was numerically investigated based on the lumped mass model. A Newton’s second-law-based motion equation was solved using Euler’s method. Finally, MATLAB was used to visualize the results. The results highlight that the force of a net system significantly increases with ocean loads, and the load of the entire net is mainly from the top half of the net. Moreover, the maximum force of the vertical rope occurs at the connection of the top channel steel. The maximum force of the horizontal rope and net twine occur in the rope near the still-water level and at the connection of the top channel steel, respectively. Thus, the net at those positions should be reinforced to prevent its failure.

1. Introduction

Net enclosure aquaculture originated in Japan around the 1920s [1]. Initially, gravel was used to build dams at the bayou of a river to farm shrimp, and this developed into the use of nets and fences to cultivate commercial fish in these waters [2]. Around the 1950s, the enclosure mode of aquaculture was introduced into China, and then it gradually expanded to nearby coastal areas [3]. With this developmental trend of switching from inland waters to the ocean, net enclosure aquaculture facilities, such as the floating–rope and pile–net types (shown in Figure 1), gradually began to advance further outwards into deep sea waters, which feature with good water quality but harsh loads. Although the long-term use of net enclosure facilities may have a certain impact on the benthic environment of the sea area, the net enclosure aquaculture facility (especially pile–net type) has become a rapidly developing ecological aquaculture model in China over the past few years. This is because of the advantages of: (1) its larger space and (2) natural-like environment, where fish can have access to the seafloor or even areas along the coastline. In addition, the vast aquaculture space allows for a sufficient range of activities for the farmed fish, and the quality of the farmed fish is significantly improved over other traditional farming modes, such as net cages, which are only enclosed water columns with no substances of the seafloor. The development of pile–net enclosure facilities is still in the early stages, and research on the extreme ocean load resistance of aquaculture facilities is insufficient. In particular, there is no such structural design theory or standard specifications for pile–net enclosure design and installation, and there are relatively few research reports on its safety assessment. As displayed in Figure 2, the existing practical pile–net enclosure facilities have different levels of structural damages (breakage of pile–net joint points, nets, and piles). Therefore, safety performance evaluations of pile–net enclosure aqua-culture facilities have become a crucial area of research.
Regarding the safety of pile–net enclosure facilities, piles and nets are the two most important components that must be considered during the stages of design and installation. For piles, the “Code for Pile Foundation of Harbor Engineering” or the “Technical code for building pile foundation” [4,5] can be referred for pile design. In this study, we primarily focused on the hydrodynamic characteristics of nets.
In recent years, great progress has been made in research on the hydrodynamic characteristics of net cages, and the relevant research results have provided a good foundation for research on the hydrodynamic characteristics of pile–net enclosure facilities. Scholars have carried out plenty of studies on the deformation of nets and the distribution of the flow field around nets and the environmental force through model experiments, sea field tests, and numerical simulations. Fredriksson et al. [6,7] used both a model experiment and a numerical model, and the results of the physical test clearly showed mooring rope tilt resonance, while the numerical model also predicted mooring rope tension. Tsukrov et al. [8] proposed a numerical simulation of finite element analysis to model the hydrodynamic response of net panels to environmental loading, and this new modeling technique has been applied to evaluate the performance of tension leg fish cages in open ocean environments. Moe et al. [9] used a numerical simulation method to show that the results can be applied to estimate deformations and loads acting on a net. Lee et al. [10] used the mass-spring model to describe the behavior of a fish cage system, and simulations can be used to evaluate the safety of large-scale, moored cage structures exposed to diverse environmental forces. Zhao et al. [11] conducted a numerical simulation of a gravity cage to investigate force, movement, and the damage to the net, floating frame, counterweight, and anchor structure under the action of waves and currents. Dong et al. [12] measured the drag force, cage deformation, and flow field inside and around a scaled net cage model, and the study can be used for optimal net cage designs. Qu et al. [13] used model experiments to study the performance of fish cages with different netting materials, mesh types, and cage depths in a uniform flow. Liu et al. [14] used the numerical simulation method to calculate the net cage mooring force under waves and current conditions. Their results can be used in the study of the connection of mooring ropes, stress concentration of collars, and fatigue analysis of the mooring material. In addition to this, physical experiments and numerical simulations have been conducted to study the fluid–structure interactions of the net structures [15]. Related studies on the flow field and hydrodynamic properties around net cages in recent years can also be found in [16,17,18]. In previous studies, research on net systems and the mooring ropes of net cages mainly adopted the lumped mass method, under the assumption of spring elements for calculation [19,20,21].
The pile–net enclosure facility is a newly-developed farming mode in China, and the related research is not systematic. Gui et al. [22] and Chen et al. [23] used the lumped mass method to study the force and displacement of the nets in pile–net structures under different wave heights and directions. Martin et al. [24,25] proposed a new coupling model based on a Lagrangian–Eulerian model and developed a new model for the simulation of large motions of porous tensile structures and their interaction with the surrounding fluid. Both are generally efficient and broadly applicable for calculating aquaculture net hydrodynamics. Yang et al. [26] proposed a one-way fluid–structure coupling model to demonstrate the influence of structural forms, flow incidence angles, and different pile–net distances on the flow-field characteristics of pile–net systems and the drag coefficient of the piles. Zhao et al. [27] used numerical simulation method to analyze the hydrodynamic loads of a trestle-netting enclosure aquaculture facility that integrates an offshore steel trestle with netting.
According to the literature, it can be found that the hydrodynamic behaviors and dynamic responses of net cages have been well investigated. However, the design of the pile–net enclosure facility relies more on the experience of local fishermen and lacks reliable theoretical techniques and valuable supporting data. Thus, seeking theoretical techniques and valuable supporting data is the primary task of this paper. Research on net cages can only provide technical support for pile–net enclosures. In this work, the net system of a pile–net enclosure aquaculture facility in use was comprehensively investigated through numerical simulations. The force distribution and deformation of the net system of the pile–net enclosure was analyzed and studied in detail, which can provide theoretical basis for the design, installation, and reinforcement of such kind of aquaculture facilities.
The remainder of this study is organized as follows. Section 2 outlines a brief overview of the numerical model and the numerical framework of this study. The mathematical formulations and numerical implementations are also included. Section 3 provides the results of the force of the net system. The water particle velocity at different depths and a comparison of the results of three conditions and net material and biofouling are discussed in Section 4. The influences of waves, pure currents, and combined waves and currents on the hydrodynamic forces are specifically analyzed. Finally, the concluding remarks are summarized in Section 5.

2. Methodology

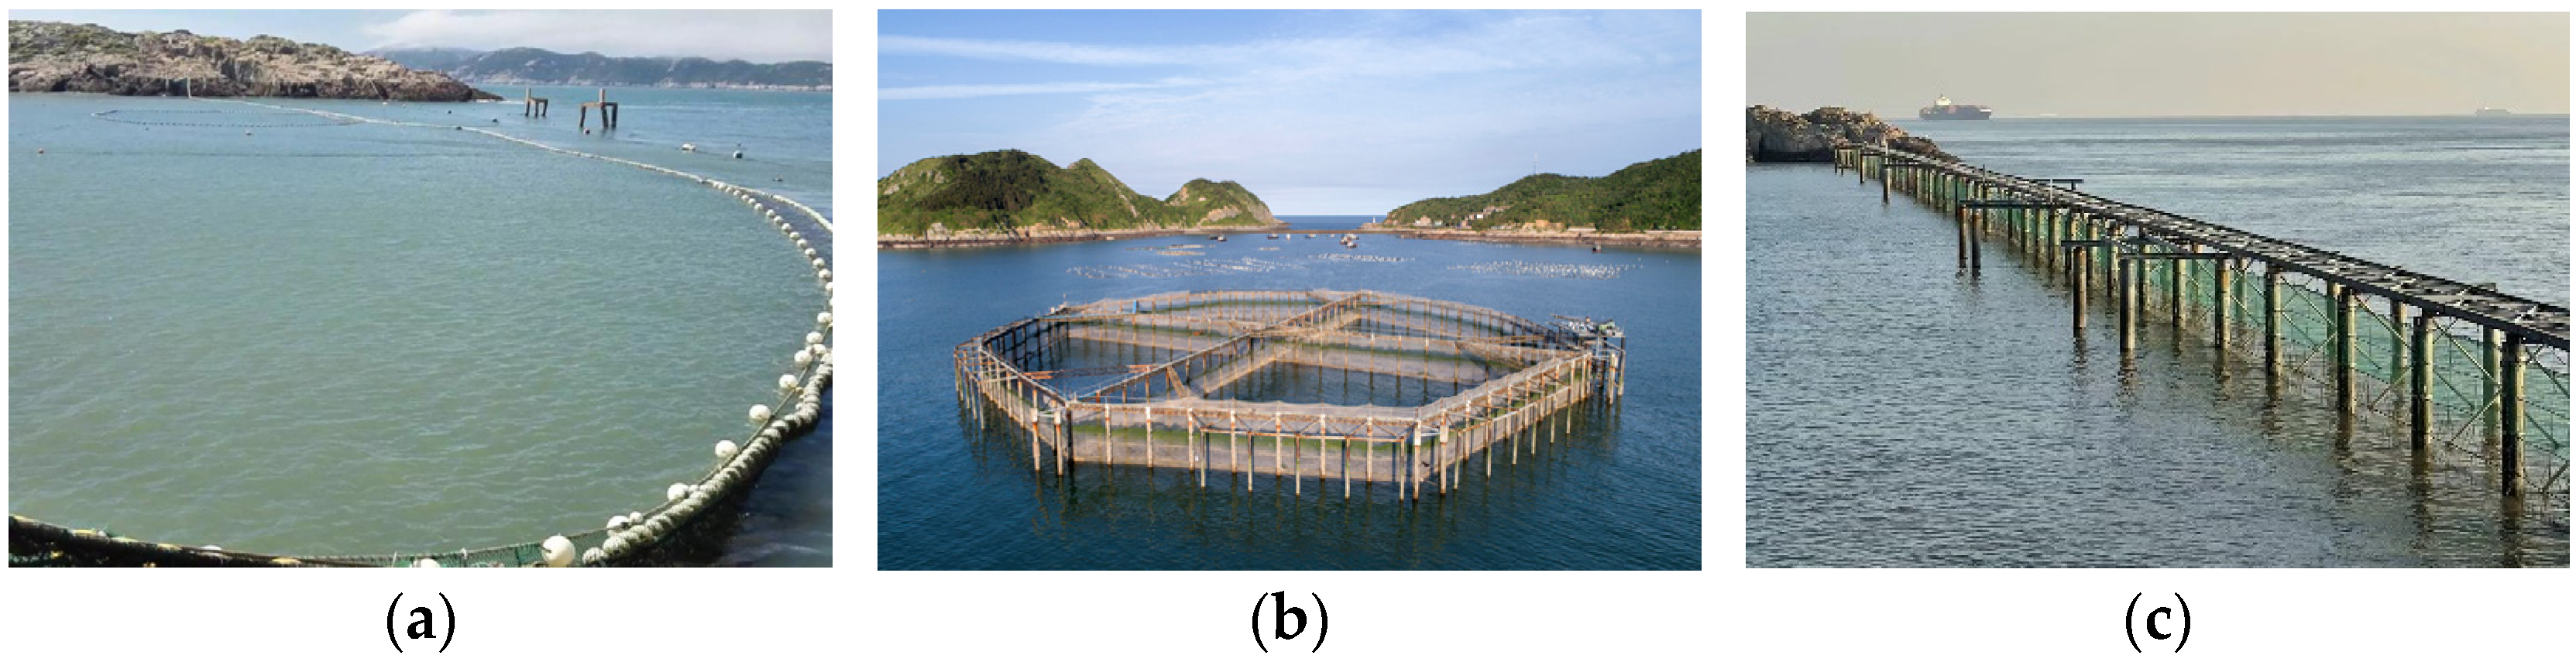
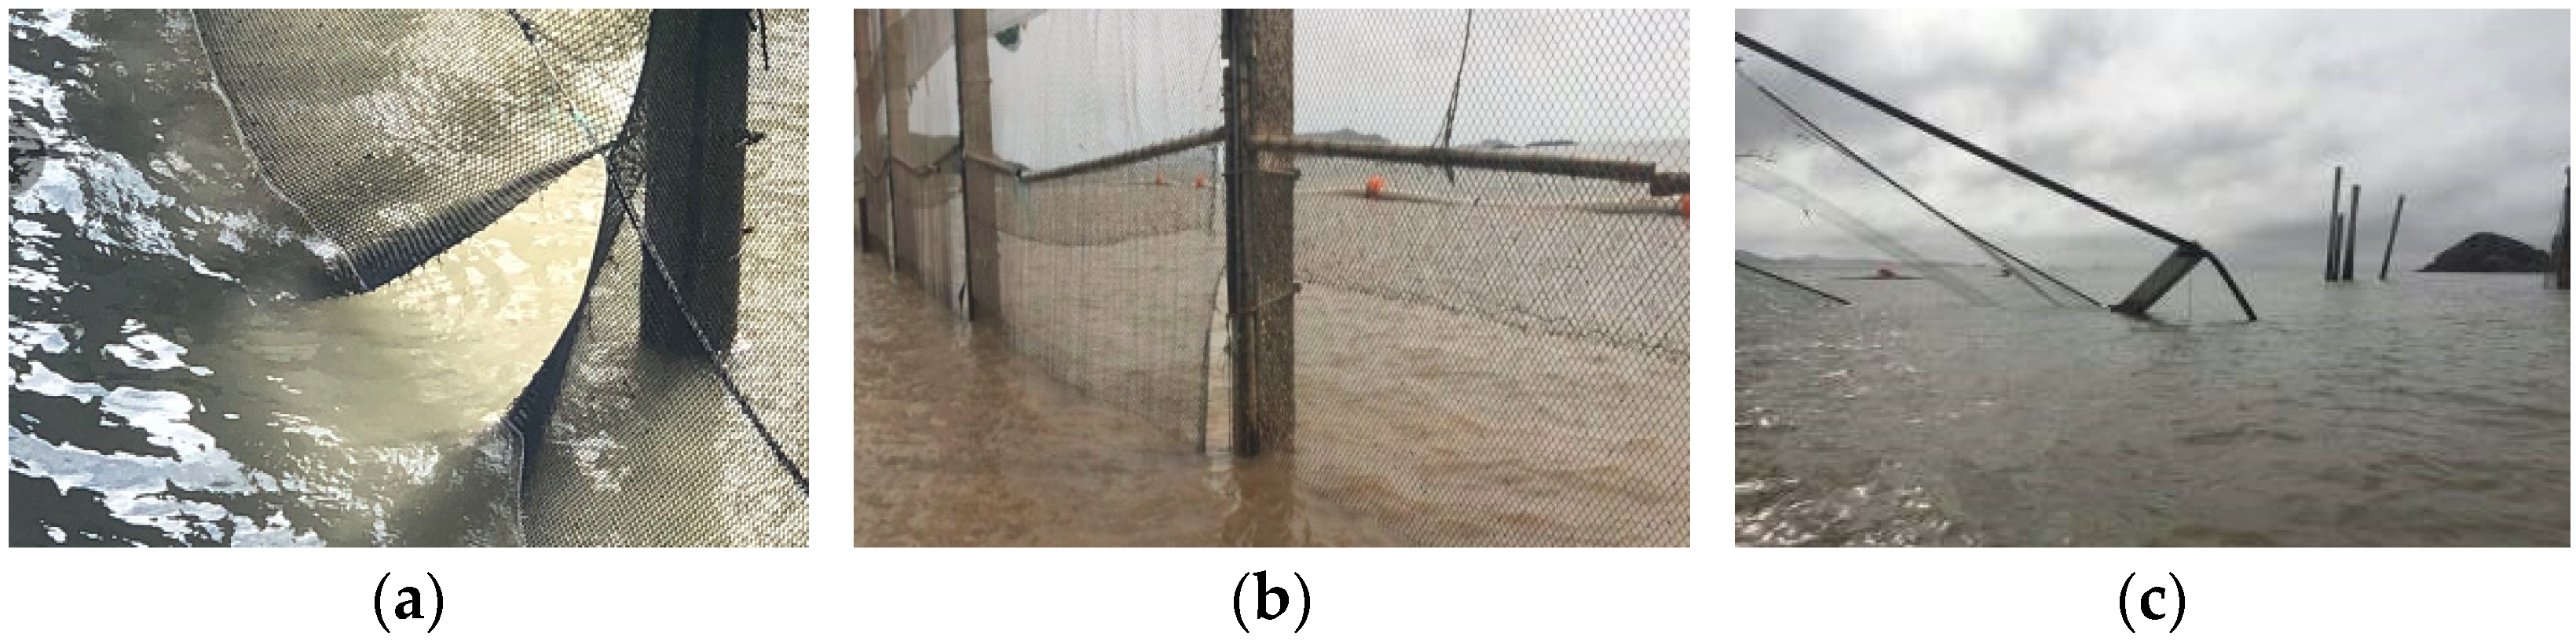
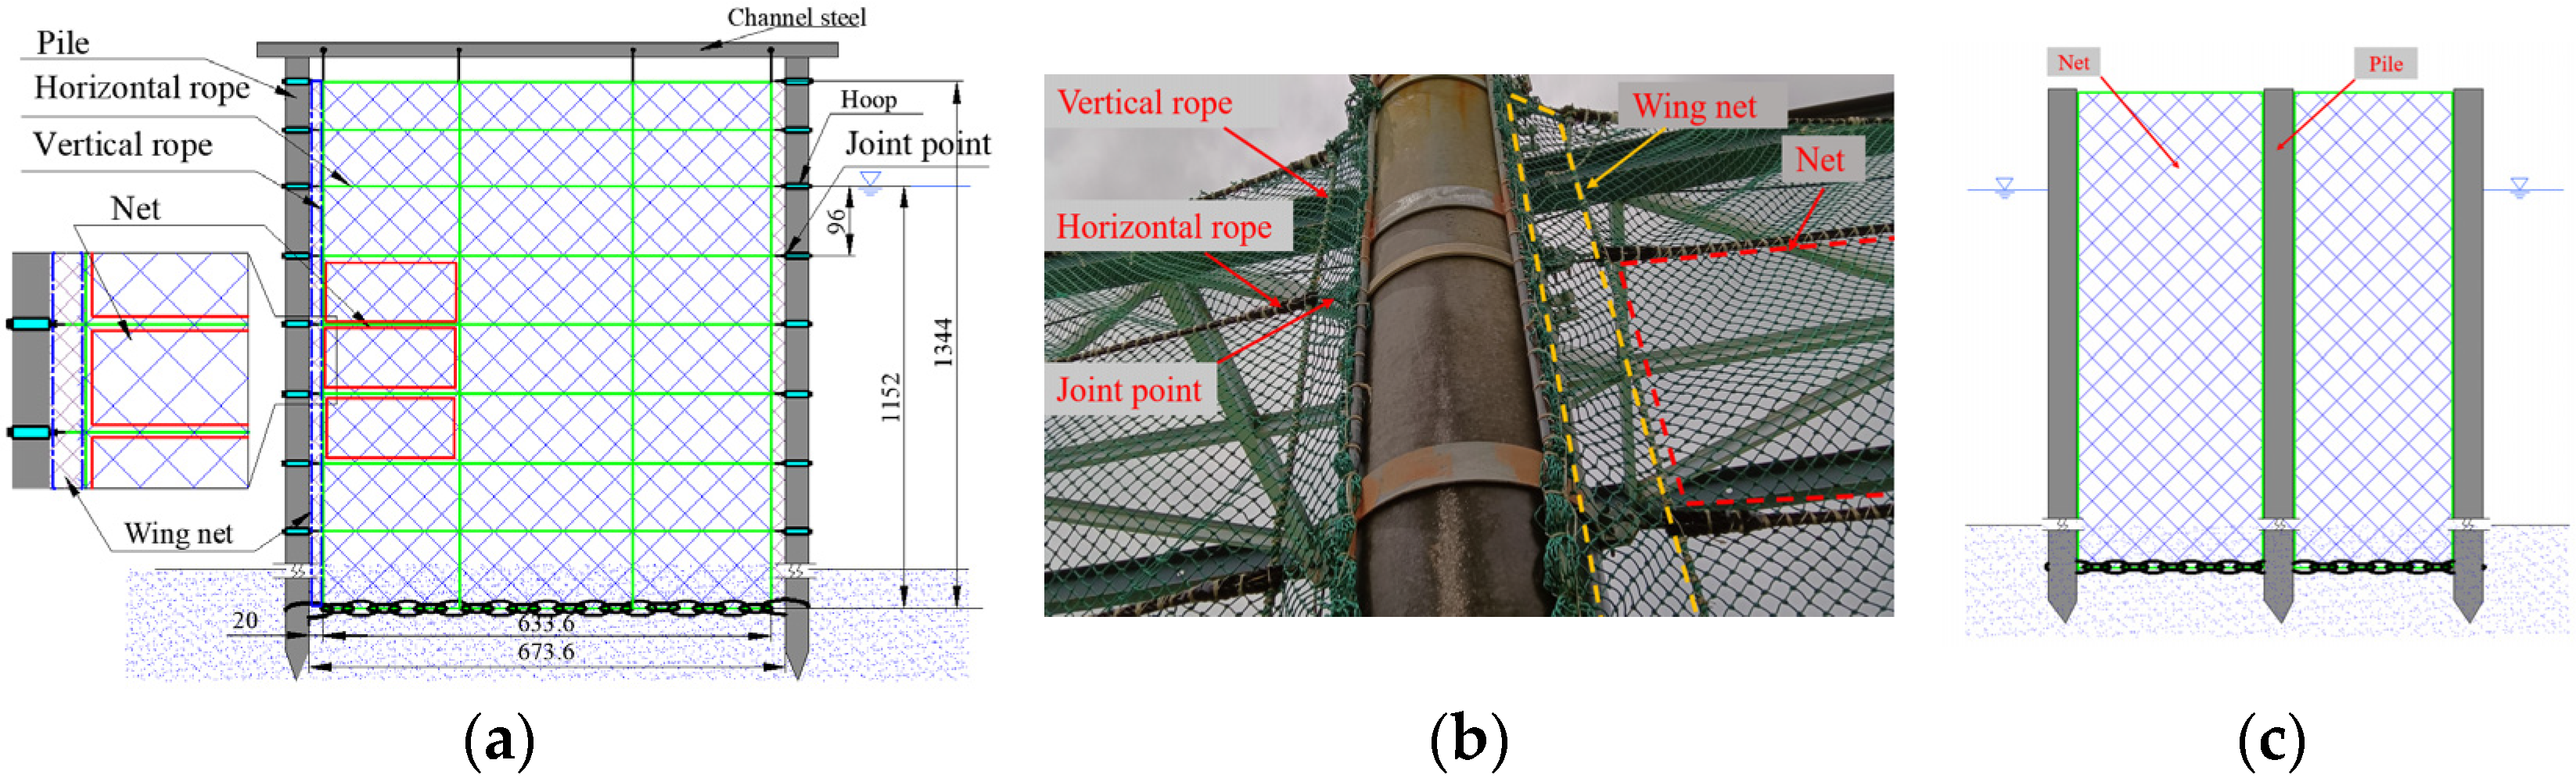
2.1. Pile–Net-Gapped Enclosure Aquaculture Facility

A schematic diagram and photo of the pile–net-gapped enclosure facility studied in this paper are shown in Figure 3a,b. It can be seen that the left and right edges of the net were not directly tied to the piles but were connected to the piles through a horizontal rope, which is called a pile–net-gapped enclosure facility. A direct pile–net configuration means that the nets are directly fixed to the piles (Figure 3c), which has been studied by Chen et al. [23] and Yang et al. [26]. This connection method has issues, such as damage to the net twine. Thus, in this paper, the net was not directly connected to the pile; this assembly has initially been shown to be superior to the direct pile–net configuration. It is a new mode of pile–net connection that aims to prevent the net twine from breaking and to protect the net by making full use of the buffer of the vertical ropes at the vertical edges of the net. In practice, the left and right edges of the net are usually 0.2 m away from the corresponding piles. A wing net is installed to prevent fish from escaping through the gap between the net and the pile. Moreover, to avoid the farmed fish from escaping at the bottom of the net, an iron chain is attached to the bottom rope and anchored to the seabed. The distance between the adjacent horizontal ropes and that of the vertical ropes were 1.0 and 2.1 m, respectively.

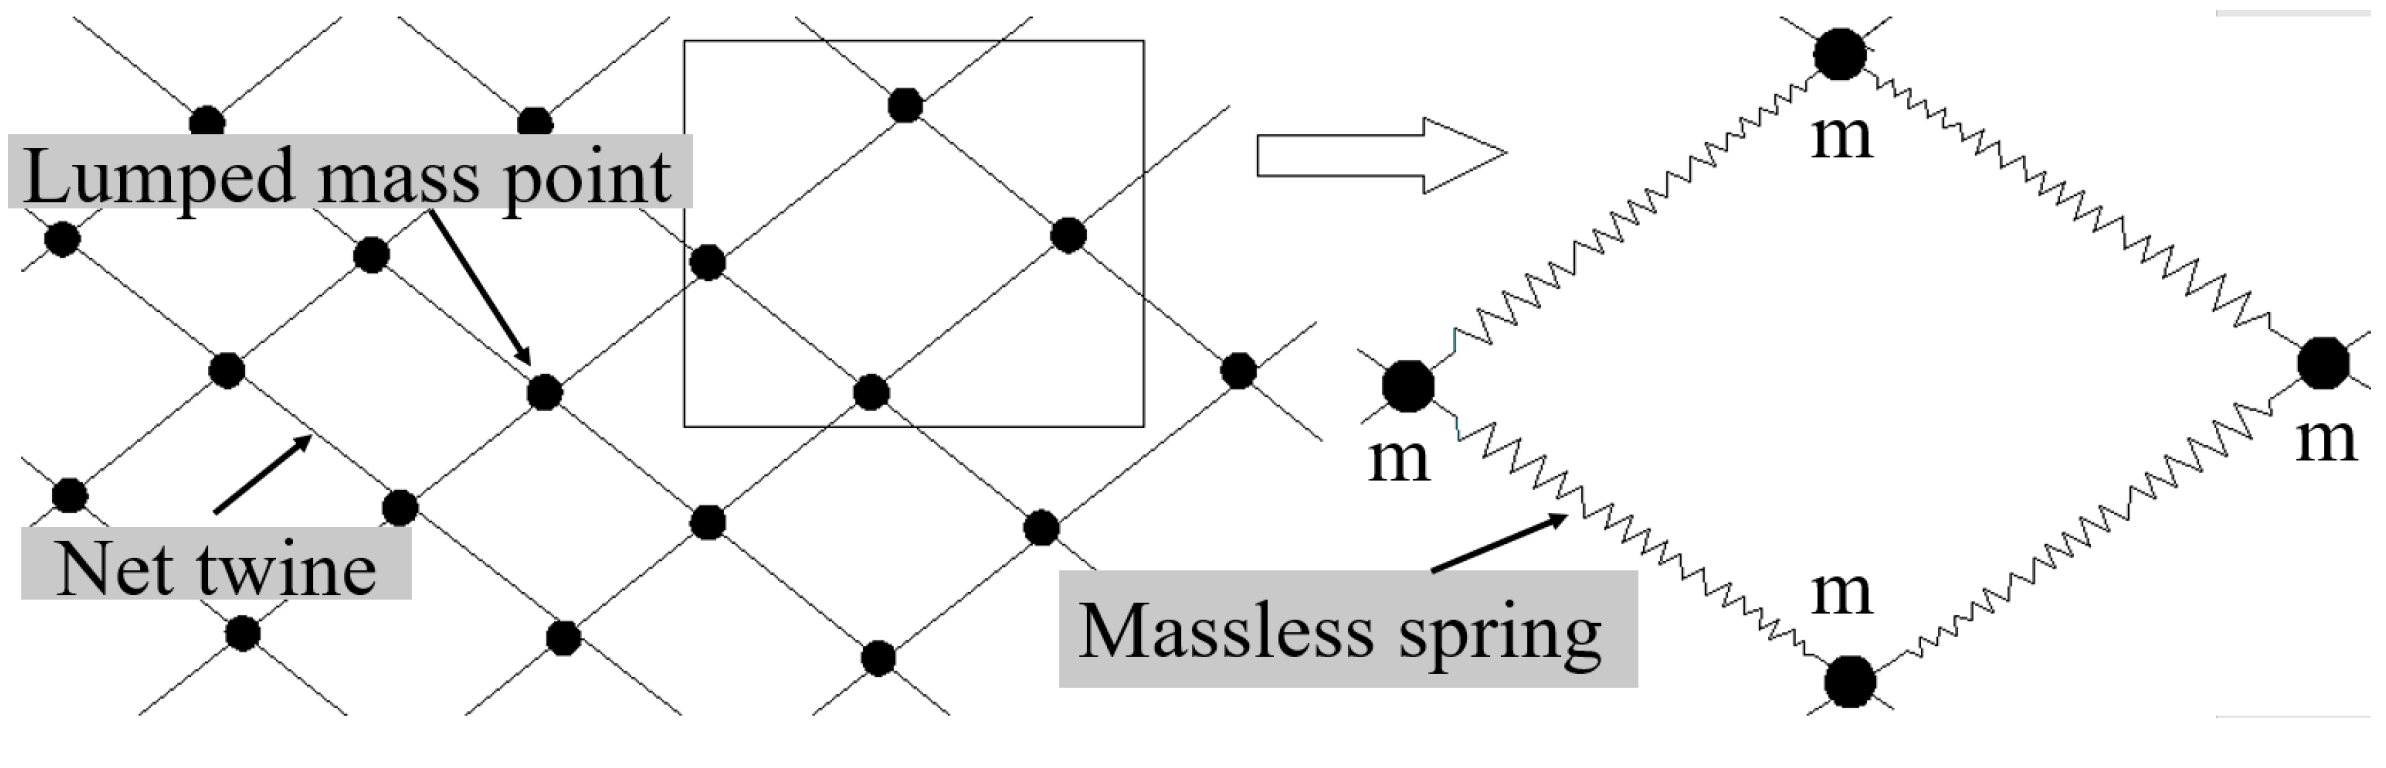
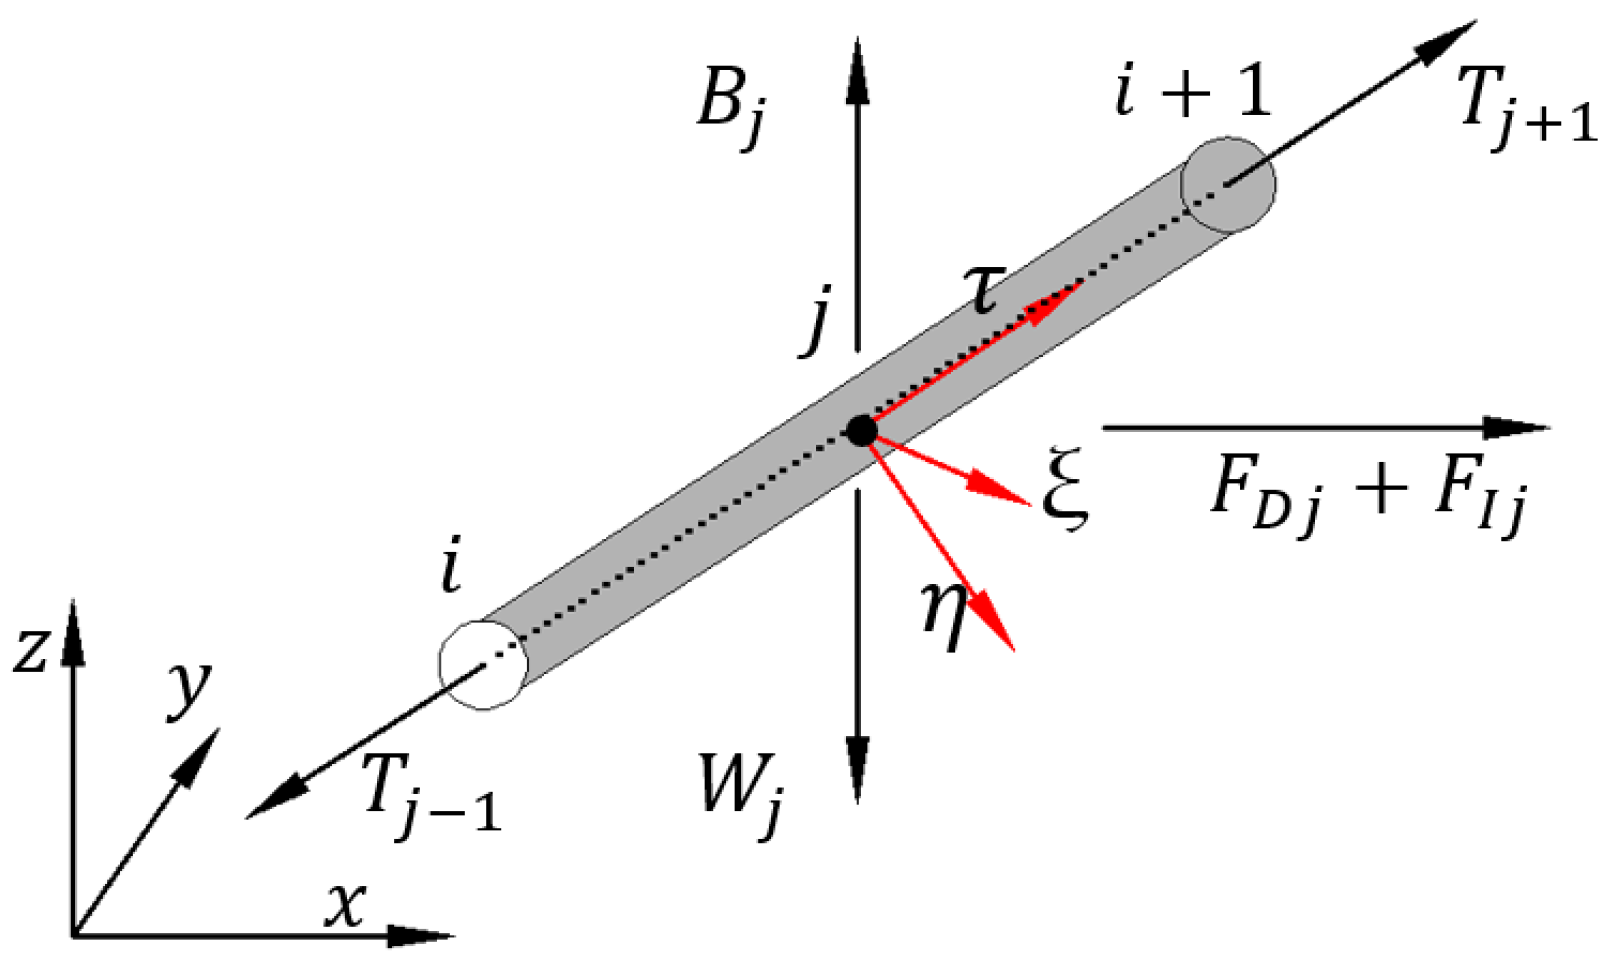
2.2. Numerical Method

The rope and net twine are flexible structures, and their movements show small-scale, multiple degrees of freedom. This flexibility makes the net have a large deformation. The lumped mass model can be used to obtain the force and movement of the flexible net under ocean loads. The lumped mass points of the model are located at the ends of each net twine, and each lump mass contains one node and two net twines [11]. The net can be modeled as a series of lumped mass points that are interconnected with massless springs, as shown in Figure 4. The shape of the net is determined by calculating the displacement of these lumped mass points under waves or currents.
The forces on the lumped mass points of a net mainly include gravity, buoyancy, the tension of the net twine, and drag and inertial forces. Since the net twine of a net is a small-scale structure compared to wave lengths, the wave force acting on it can be calculated based on the Morison equation [28]. According to the structural characteristics of the net, it was assumed that the net knots at both ends of the net twine were spherical. Since the projected area of the sphere in all directions was equal, the hydrodynamic coefficient took a constant value in the direction of its motion when calculating the wave force. The twine was regarded as a cylindrical rod. During the movement of the rods, the projections in all directions are different. Therefore, when calculating the wave force, the relationship between the wave incident direction and the angle of the net twine were considered. A local coordinate system (i.e., ξ, η, and τ) was established at each net twine: the direction of τ was along the direction of the net twine; the ξ axis was perpendicular to τ in the plane composed of τ and the relative velocity of the water quality; and the η axis was in the plane composed of ξ and the water quality point, perpendicular to each other [29,30], as illustrated in Figure 5.
In the global coordinate system, the force of the nodes and the twine contained in each lumped mass point were accumulated and distributed to the lumped mass points. The motion equation of the lumped mass can be expressed by:
( M + Δ M ) 2 R t 2 = F D + F I + W + B + T
Δ M = ρ w C m
T = d 2 C 1 ε C 2 , ε = l l 0 l 0
F D = 1 2 ρ w C D A V R | V R | 2
F I = ρ W C M V t
W = ρ g
where M and Δ M represent the mass and added mass of the point, respectively; W is the gravity vector; B is the buoyancy vector; R is the trajectory of the mass point; T is the tension vector; F D and F I are the velocity force and inertiall force vectors, respectively; ρ w is the water density; ρ is the density of the mass point; C m is the added mass coefficient; C M is the inertial force coefficient; is the volume of the point; d is the diameter of net twine; C 1 and C 2 are the elastic coefficients, respectively; l 0 is the length of each side of the net twine; l is the length after deformation; C D is the drag coefficient; A is the projected area of the net panel; C M is the added mass coefficient; V R is the relative velocity between the water particle and the mass point; and V is the velocity vector of the water particle.
In this study, polyethylene material [31] was used. The study mainly focused on the pile–net-gapped enclosure site at Taohua Island, Zhoushan City, Zhejiang Province, China. Therefore, the relevant parameters were taken from the site. In order to improve the calculation efficiency, the net model for the numerical simulation in this study was simplified by the “8 × 8 mesh grouping” method. The parameters used in the numerical calculation are given in Table 1. Parameters in the numerical calculation. For the PE material, C1 = 345.3 × 10⁶ and C2 = 1.0121. The hanging angle of the net was 48°. For the hydrodynamic coefficient part, Cd was set at 1.45. According to a study by Bessonneau et al. [32], the added mass coefficient was set as a constant for each knot and net twine; in this paper, C m was set to 1.45, accordingly. For the inertial force coefficient, C M   = 1 +   C m .
The wave and current conditions are listed in Table 2, and a total of 16 groups of loads are investigated. The wave height and periods of the waves varied from 3 to 6 m and 4.72–7.27 s, respectively. The variation range of the current was 0.8–1.5 m/s. The wave steepness under all loads was 1/12. According to Mehaute et al. [33], the sea conditions in this research are all suitable for the scope of Stokes 3rd-order wave theory (i.e., 0.0086 H g T 2   0.0196 and 0.01 d g T 2   0.4). Thus, Stokes 3rd-order wave theory was used to calculate the water particle velocity and acceleration.
This study uses Fortran software for programming calculations, and the motion equation was solved using Euler’s method. The displacement, velocity, and acceleration of particle motion were analyzed, and the corresponding results were visualized using MATLAB.
The movement of the net was three-dimensional, and the direction of the movement was in the y–z plane. Furthermore, the incident direction of the wave was perpendicular to the net. Due to the addition of iron chains at the bottom of the net, the bottom of the net was embedded in the seabed soil, and almost no displacement occurred. Thus, the lower end was fixed during the simulation process. The wing nets had a wider distance than the gaps, with smaller gaps relative to the overall net that were stitched and fastened to the rope and pile, creating less force on the overall net at the edges. Therefore, the wing net was not involved in the calculation during the simulation process.

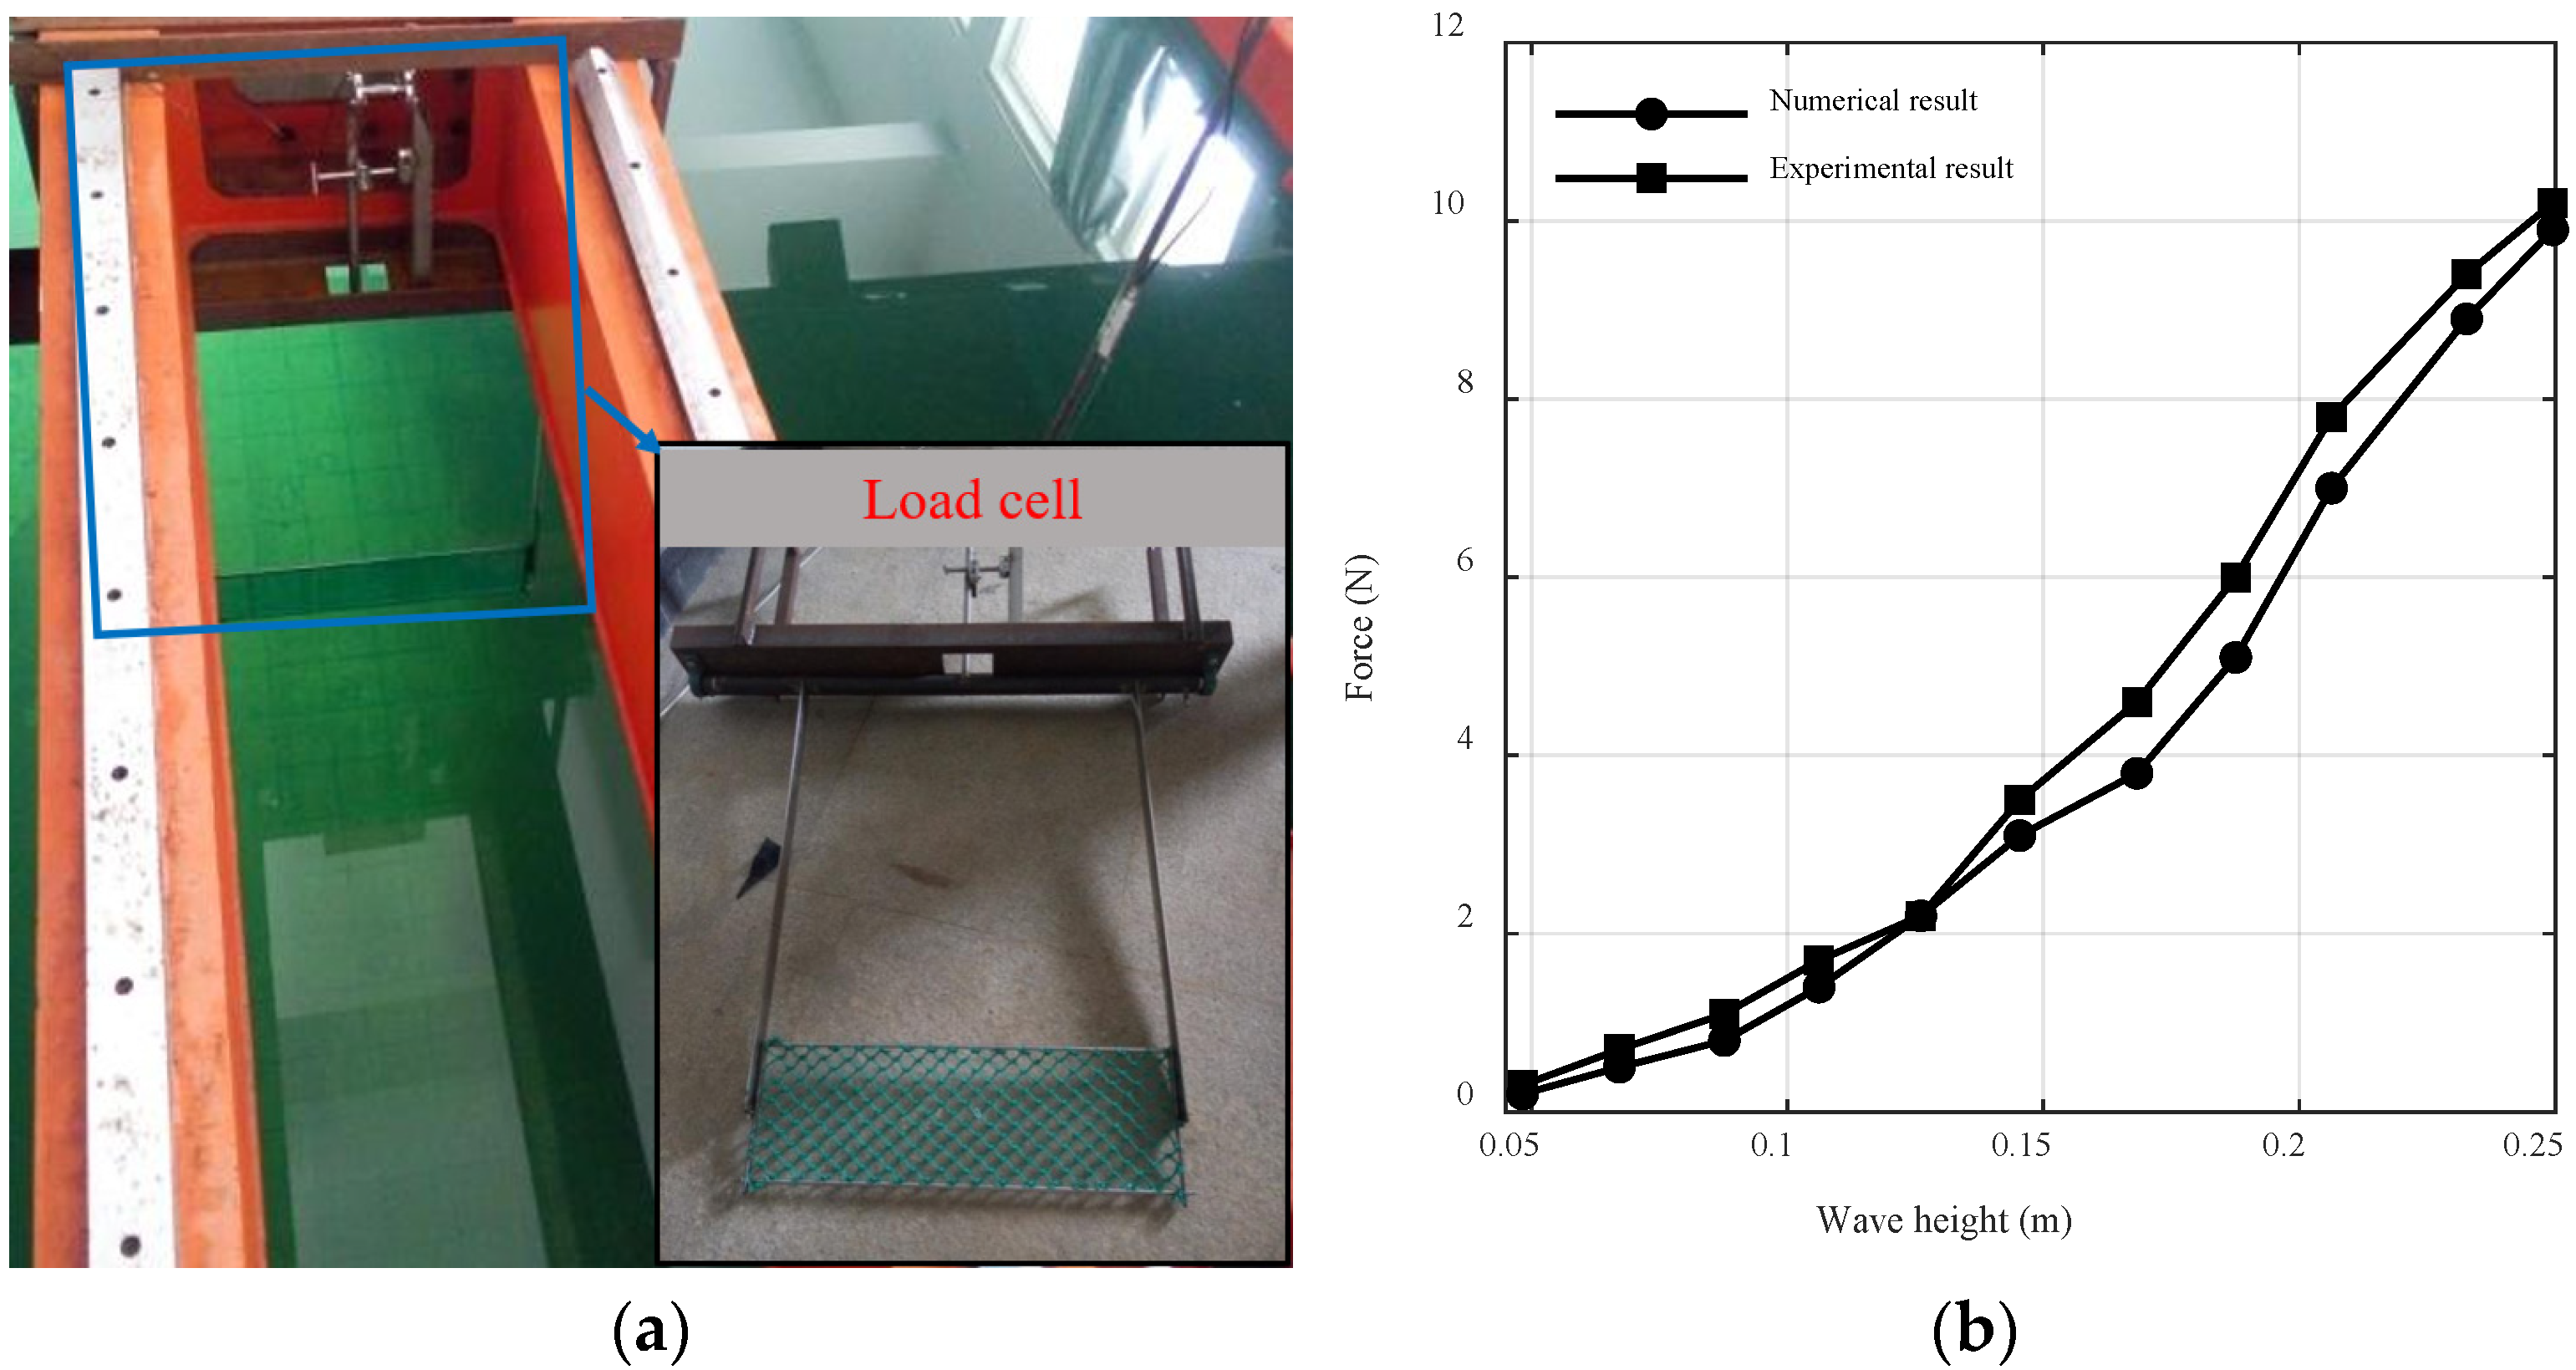
2.3. Model Validation

This study adopted the lumped mass method, which is consistent with the numerical simulation method developed by Gui et al. [22], Zhao et al. [11], and Chen et al. [23]. In order to verify the feasibility and validity of the numerical model, the physical model experiment was carried out in the towing tank at Zhejiang Ocean University, Zhoushan, China. The towing tank had a length of 130 m, a width of 6 m, and a depth of 3.44 m. The size of the PE net used in this study was 0.64 × 0.20 m. The experimental water depth was 0.7 m. The wave height and period were 0.050–0.250 m and 1.6 s, respectively. The experiment gave the calculation results of the maximum force of the net under wave conditions, as shown in Figure 6. The maximum relative deviation was 4.9%, which was less than ± 10%, indicating that the present numerical results matched well with the experimental measurements.

3. Results

The pile–net-gapped enclosure aquaculture facility deployed in inshore waters was affected by ocean loads. The force distribution and deformation of the net system were the two contributing key factors considered regarding its longevity in the study. We address three issues in this section: (1) how waves influence the net system; (2) how currents influence the net system; and (3) how the combined action of waves and currents influence the net system.

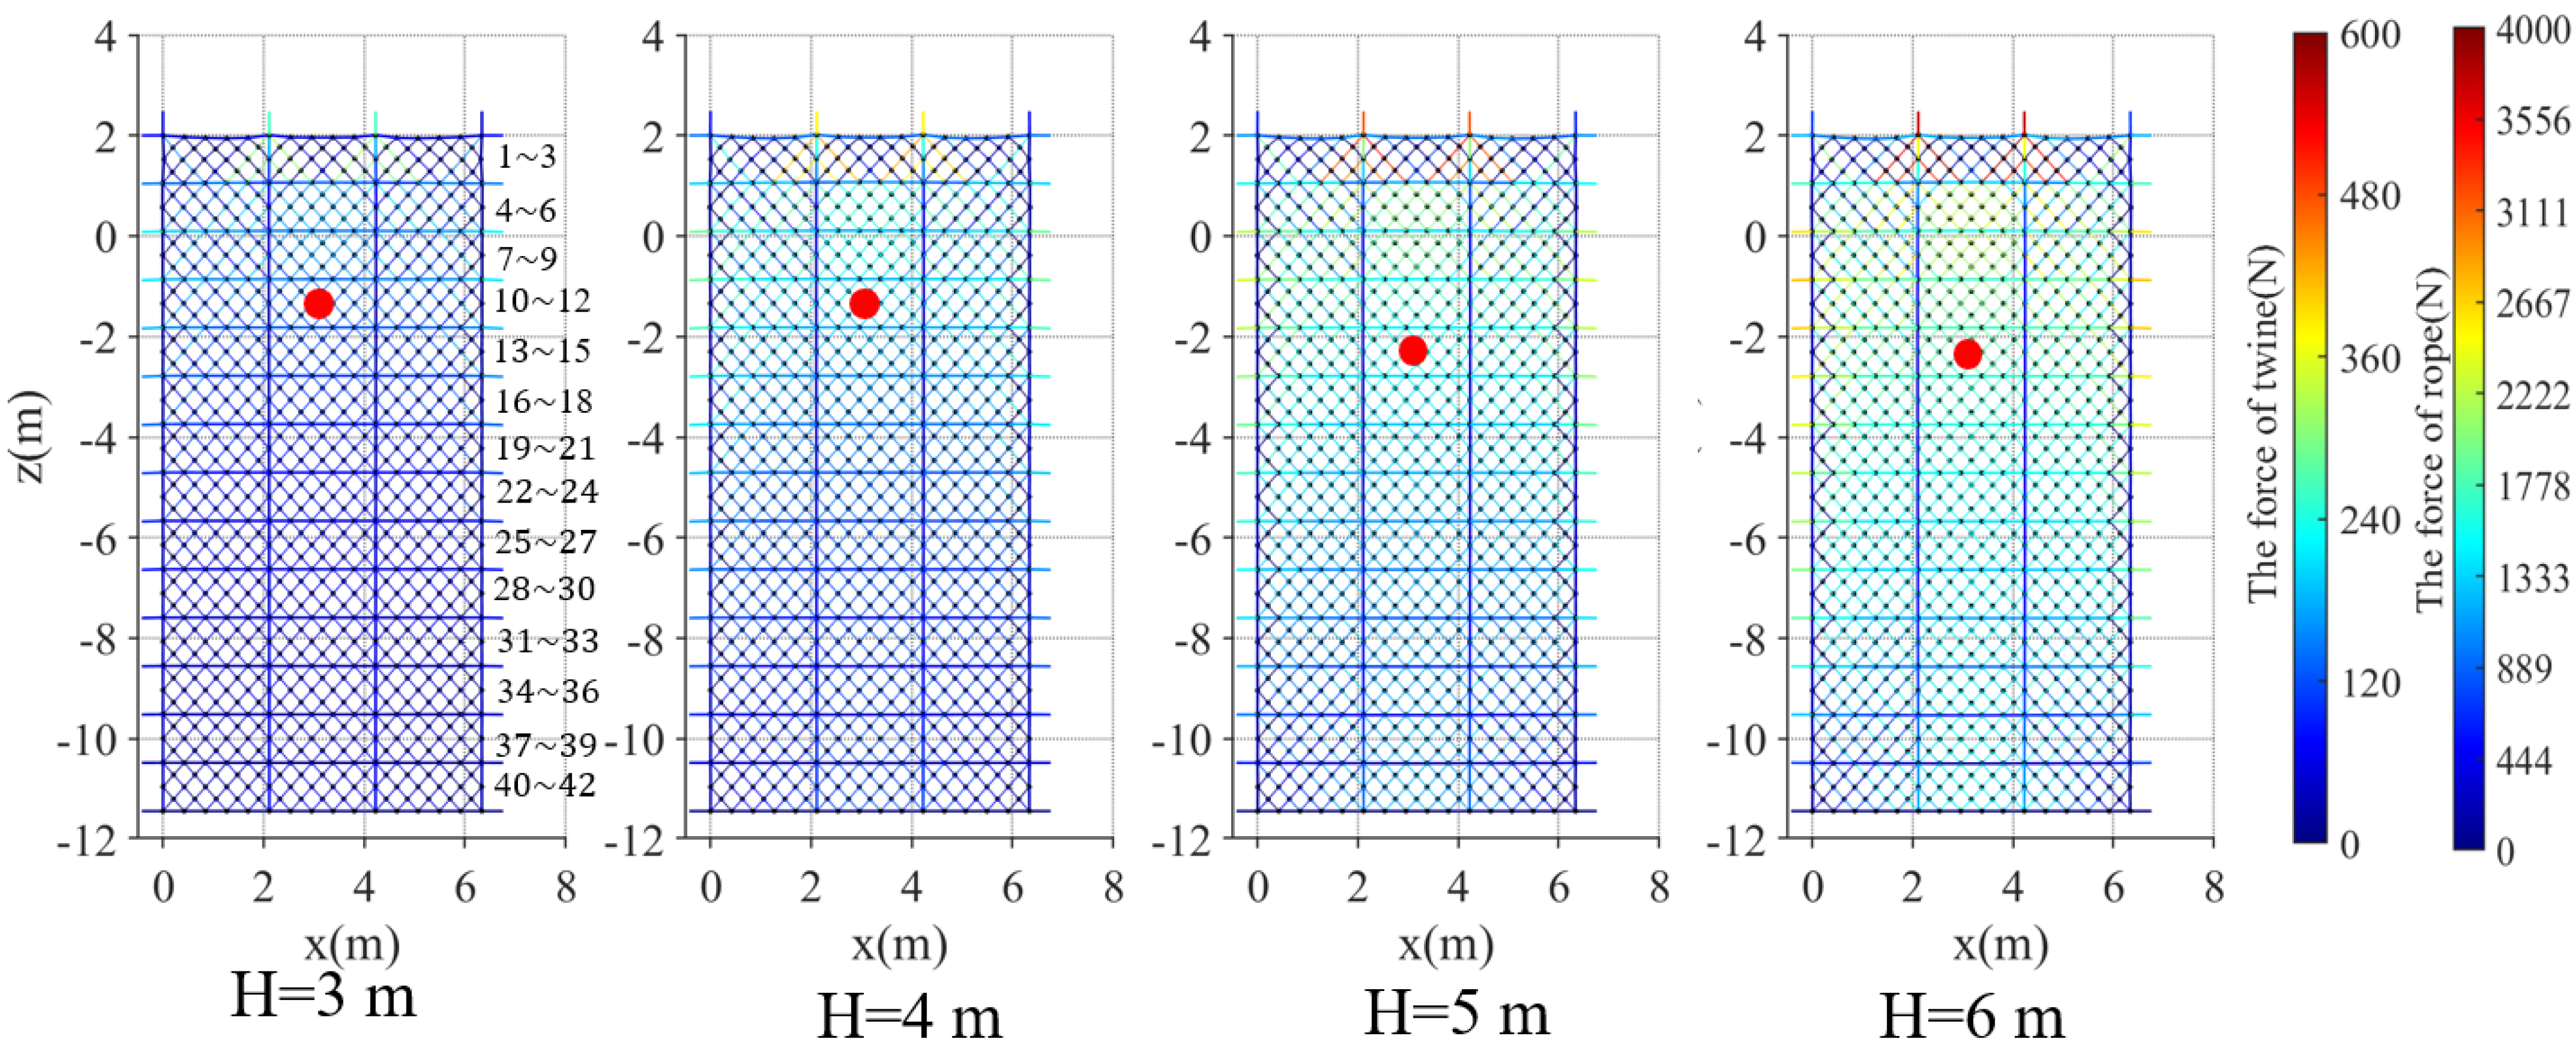
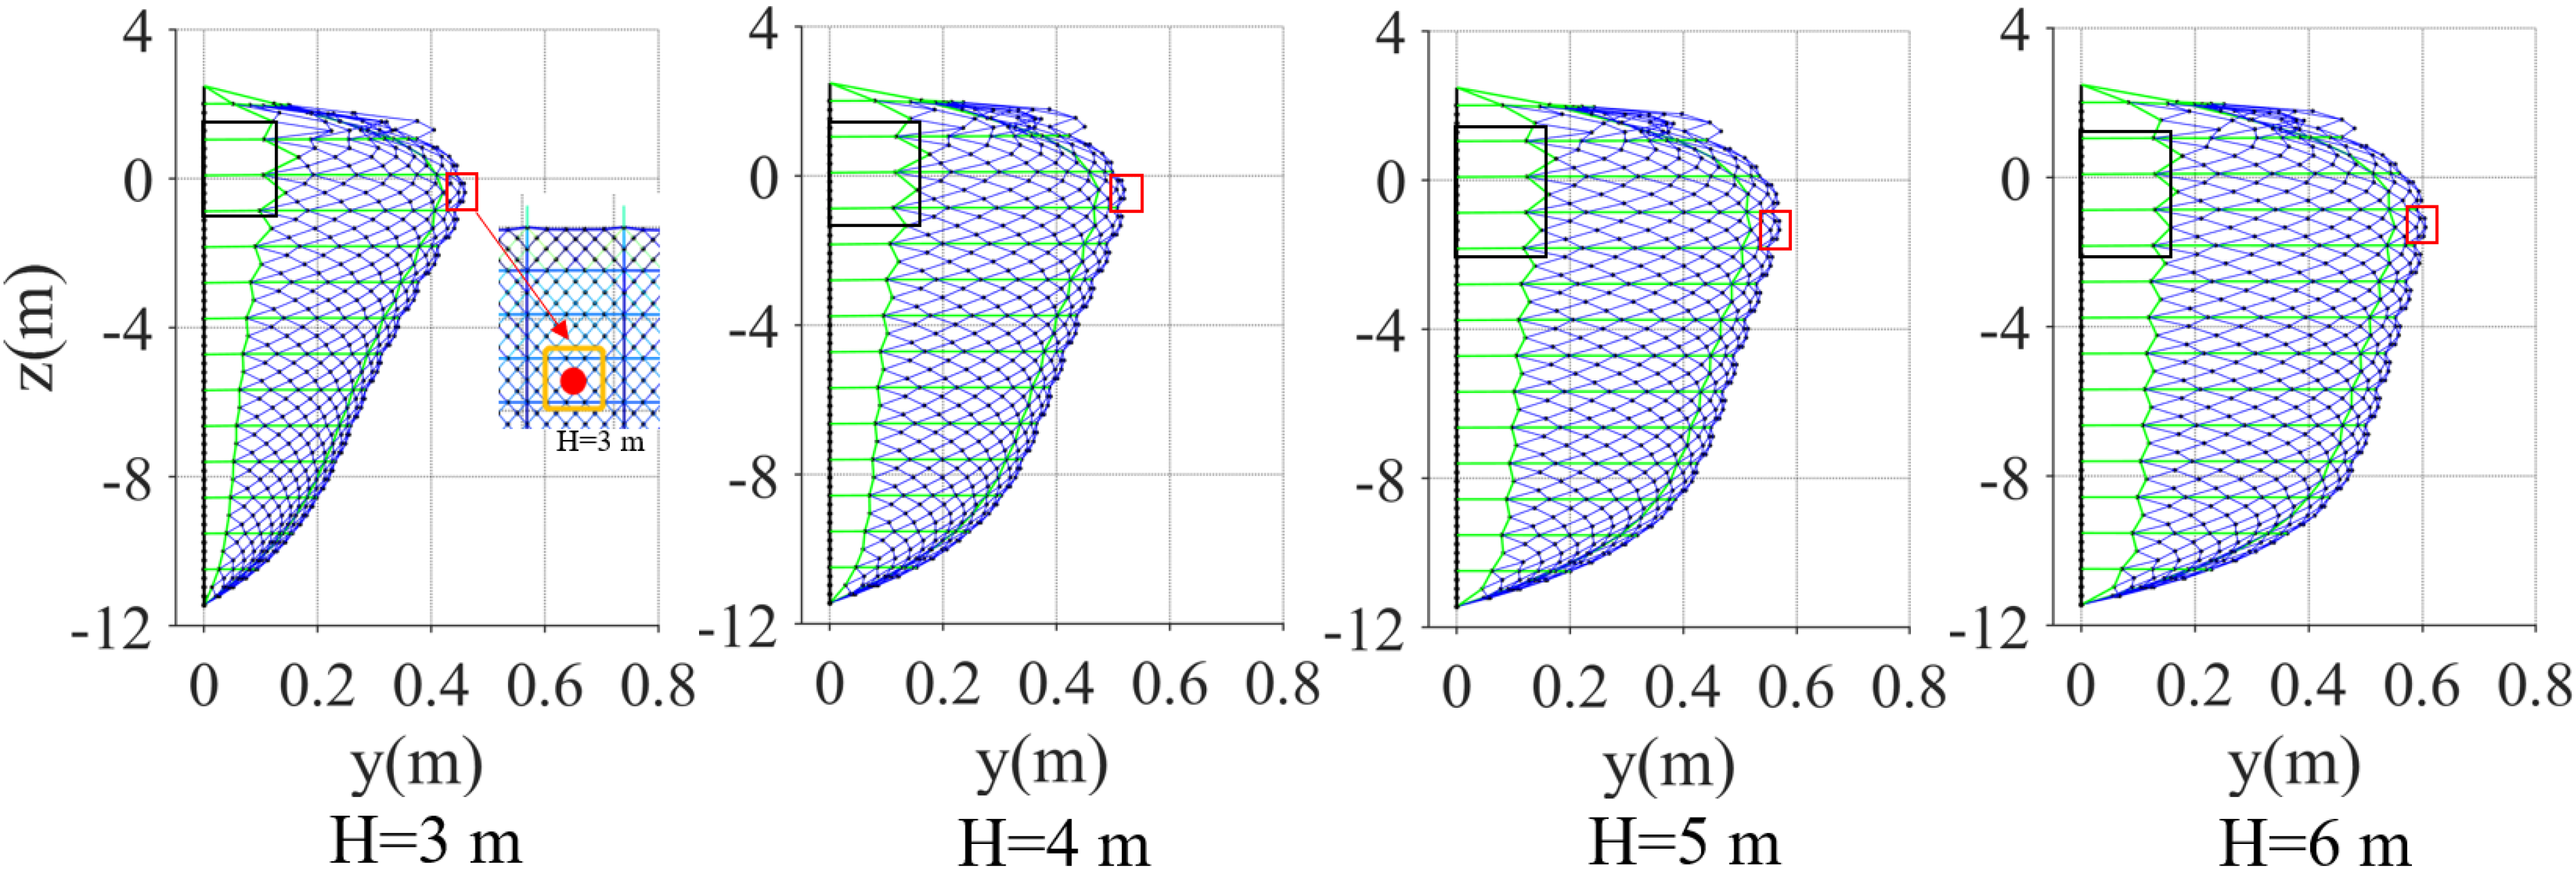
3.1. Influence of Waves on the Net System of a Pile–Net-Gapped Enclosure Aquaculture Facility

Figure 7 exhibits the force distribution of rope and net twine of the net in a pile–net-gapped enclosure aquaculture facility under wave loads. The results of the force distribution were obtained by numerical simulations. Since the force of the rope was much greater than that of the net twine, the force of the whole net system with the same color system could not easily be displayed. In order to make it easier to distinguish, we finally used the same colormap to represent the force of the rope and net twine. From Figure 7, we can see that the maximum force of the horizontal rope decreased with the increase in the distance from the water surface. The maximum force of the horizontal rope and vertical rope occurred near the still-water level and at the connection of the top channel steel, respectively. In addition, because most of the displacement of the net was restrained by the two vertical ropes at the connection of the top channel steel, the force was much greater than those in other positions of the ropes. However, since net twines here were pulled by these two vertical ropes, the maximum force of the net twine also occurred here. Even under the different wave loads, the maximum force positions did not change with wave loads. Thus, the net at those positions should be strengthened to prevent its failure.
It can be seen that the force distribution of the net is different under the action of waves. In order to investigate the force distribution of net, the net was divided into 42 rectangles by the ropes (see Figure 7), which were labeled as regions 1–42 from left to right and from top to bottom. The wave loads from H = 3 m to H = 4 m, force regions, and distribution showed apparent differences. The comparison between H = 3 m and H = 4 m showed a greater force position of the net changes from regions 1–regions 1–15. In addition, the greater force positions of the net under different wave loads of H = 5 and H = 6 m were distributed in regions 1–18 and regions 1–21, respectively. Regions 1–2 m above the still-water level. The corresponding distances from the water surface of regions 7–21 and 22–42 were 0–(−5) and (−5)–(−12) m, respectively. Regions 1–6 accounted for more than 27% of the force of the entire net under wave loads. From the view of the entire net, regions 1–12 were the positions with a greater force, and these regions accounted for more than 60% of the force under wave loads. The number of labeled regions changed with the increase in wave loads, but the greater force positions of the net were key factors for monitoring the failure of the net. Wave energy was attenuated with the change in the distance from the water surface under wave loads, resulting in a smaller force change in regions 22–42, which accounted for 19% of the force of the entire net.
The deformation of the net under the action of waves is shown in Figure 8. The distance to the initial plane after the maximum net deformation is defined as the maximum displacement. The maximum displacement of the bottom net increased, and the shape changed from the original approximate triangle to an ellipse. The position of the nets above the still-water level had a larger displacement. This was caused by the movement of waves from the trough to the crest, and the distance between the first and second horizontal ropes decreased. In addition, the velocity at the crest of the wave was large, and the wave force was large. Thus, the net will rush through the ropes under the action of waves. In general, near the still-water level, the elongation of the horizontal rope was longer (indicated by the black boxes in Figure 8). For vertical ropes, the maximum stretched length occurred at the top connecting channel. Since the net in these positions undertook more force and, therefore, had greater movement and deformation, these positions were also the most vulnerable areas of the net. When H = 3 and 4 m, the maximum displacement occurred in region 9 (represented by the solid, red circles in Figure 7). When H = 5 and 6 m, the maximum displacement position of the net changed from region 9 to region 14. It can be found that the region of the maximum displacement of the net moved downward as the wave increased.
When H = 3, 4, 5, and 6 m, the corresponding maximum displacements of the net were 0.45, 0.51, 0.56, and 0.60 m, respectively. Compared to H = 3 m, the maximum net displacements of H = 4, 5, and 6 m increased by 11.76%, 19.64%, and 25.00%, respectively. The displacement of the net increased with the increase in wave loads.
The maximum force magnitude of the rope and net twine under the action of waves is depicted in Figure 9. It can be seen from the figure that the maximum force of the ropes and net twine increased with the increase in wave loads. The maximum force of the ropes under the different wave heights of H = 3, 4, 5, and 6 m were 1786.22, 2671.44, 3279.75, and 3666.60 N, respectively. In addition, the maximum force of net twine under the different wave heights of H = 3, 4, 5, and 6 m were 315.81, 448.81, 528.03, and 587.80 N, respectively. In general, the maximum force of the rope was usually 6–7 times larger than that of the net twine under the same wave conditions.
The point in the pile where the net twines and ropes are fixed is called the joint point. The sum of the vector force of the ropes and the net twines acting on this point is called the force of the joint point. The distribution of the maximum force of the joint point with the distance from the water surface under the wave loads is illustrated in Figure 10. Above the still-water level, it gradually decreased with the increase in height. The maximum force of the joint point occurred at the still-water level. The maximum force of the joint point near the still-water level rapidly changed with the increase in wave loads, while the change to a deeper distance from the water surface had little influence with the increase in wave loads.
In summary, with increasing distance from the water surface, the velocity and acceleration of water particles were attenuated, and the wave force acting on the net system decreases accordingly, resulting in a decrease in the load of the whole system and a decrease in the deformation of the net system. The horizontal ropes and net twines were subjected to a greater force near the still-water level. Thus, the net at this position should be reinforced to prevent failure of the net system. Most of the force on the ropes were caused by the net twines, which was mainly transmitted by the nodules. The fixed points of the ropes were connected to the piles or the top channel steel and did not move with the movement of the wave loads. The net twines connected here will move with the action of the waves, thereby causing net twines and ropes to separate so that the force of the net twines becomes larger at the positions of the joint points. The maximum force of the joint point was found to be 0–1 m below the horizontal surface, indicating that the force of the ropes and net twines near the still-water level were greater than other positions. Thus, rope and net twine with a break load several times larger than the abovementioned force magnitude were recommended to reduce the fatigue probability during harsher ocean environments. From the view of displacement, the result reminds us that the net should avoid obstacles during practical engineering; otherwise, it will cause the net to be worn. From the view of the entire net, regions 1–12 were the positions with a greater force.
Based on the results presented above, it is evident that the positions of the maximum force of the net system occurred at the top half of the net under the wave loads. If we design and install the top half of the net with special materials or replace it frequently, and once the positions of the maximum force of the rope and net twine are reinforced, the failure of the net system will be greatly reduced.

3.2. Influence of Currents on the Net System of the Pile–Net-Gapped Enclosure Aquaculture Facility

Figure 11 presents the force distribution of the rope and net twine of the net of a pile–net-gapped enclosure aquaculture facility under current loads. It can be seen from the figure that the maximum force of the vertical rope at the connection of the top channel steel was greater than those in other positions of the ropes. Compared with the wave loads, the force of the net twines was relatively uniform under the still-water level. The force did not decrease with the change in the distance from the water surface, and it was subjected to significant force below the still-water level. In general, the force of the rope and net twine increased with the increase in current loads. However, the maximum force positions of the rope and net twine did not change with the increase in the current loads. Regions 7–42 are positions where the force was the same, and these regions account for more than 89% of the force of the entire net under current loads.
As shown in Figure 12, the deformation of the net under the action of currents was studied. The deformation from below the still-water level was relatively uniform. Compared with the wave loads, the deformation showed a great difference. In general, the deformation of the net was shown as a semi-ellipse. For the horizontal ropes, the maximum force corresponding to the maximum stretch length occurred at the position of (−1)–(−10) m under the still-water level (represented by the black boxes in Figure 12). The maximum stretched length of the vertical ropes was the same as the wave loads. Due to the uniform force, the positions of the maximum displacement occurred in regions 17, 20, 23, 26, 29, and 32, respectively. The positions of the maximum displacement did not change with the increase in the current loads. When v = 0.8, 1.0, 1.2, and 1.5 m/s, the corresponding maximum displacements were 0.38, 0.43, 0.49, and 0.56 m, respectively. Compared with v = 0.8 m/s, the maximum net displacement of v = 1.0, 1.2, and 1.5 m/s increases by 11.62%, 22.44%, and 33.22%, respectively.
The maximum force magnitude of the rope and net twine under the action of currents is shown in Figure 13. It can be seen that the rates of increase in the maximum force of the rope and the net twine were the same with the increase in the current loads. When v = 0.8, 1.0, 1.2, and 1.5 m/s, the corresponding maximum force of the ropes were 943.40, 1279.60, 1639.70, and 2225.42 N, respectively. For the net twines, the corresponding maximum forces were 121.66, 170.44, 222.59, and 306.34 N, respectively.
The maximum force of the joint point varied with the distance from the water surface under different currents, as illustrated in Figure 14. Above the still-water level, it gradually decreased with the increase in height. The maximum force of the joint point was almost the same at a distance from the water surface of (−2)–(−10) m below the still-water level, and only the joint points close to the seabed were less forced due to the fixed bottom.
Compared with the wave loads, the deformation and maximum force of the net system were different. Under the still-water level, the hydrodynamic properties of rope and net twine were the same. This was because the energy did not decrease with the increase in the distance from the water surface, and the force of the net was uniform. In this study, the maximum displacement of the net and the joint point increased with the increase in current loads.
In summary, under the current loads, the maximum deformation and force of the net system occurred below the still-water level, and the net will move to a certain position to maintain an equilibrium state. In practical engineering, if there is a sea condition where the current is the dominant ocean load (e.g., tide current), we only need to measure the maximum current and select the materials with a break load several times larger than the abovementioned force to avoid the failure of the net system.

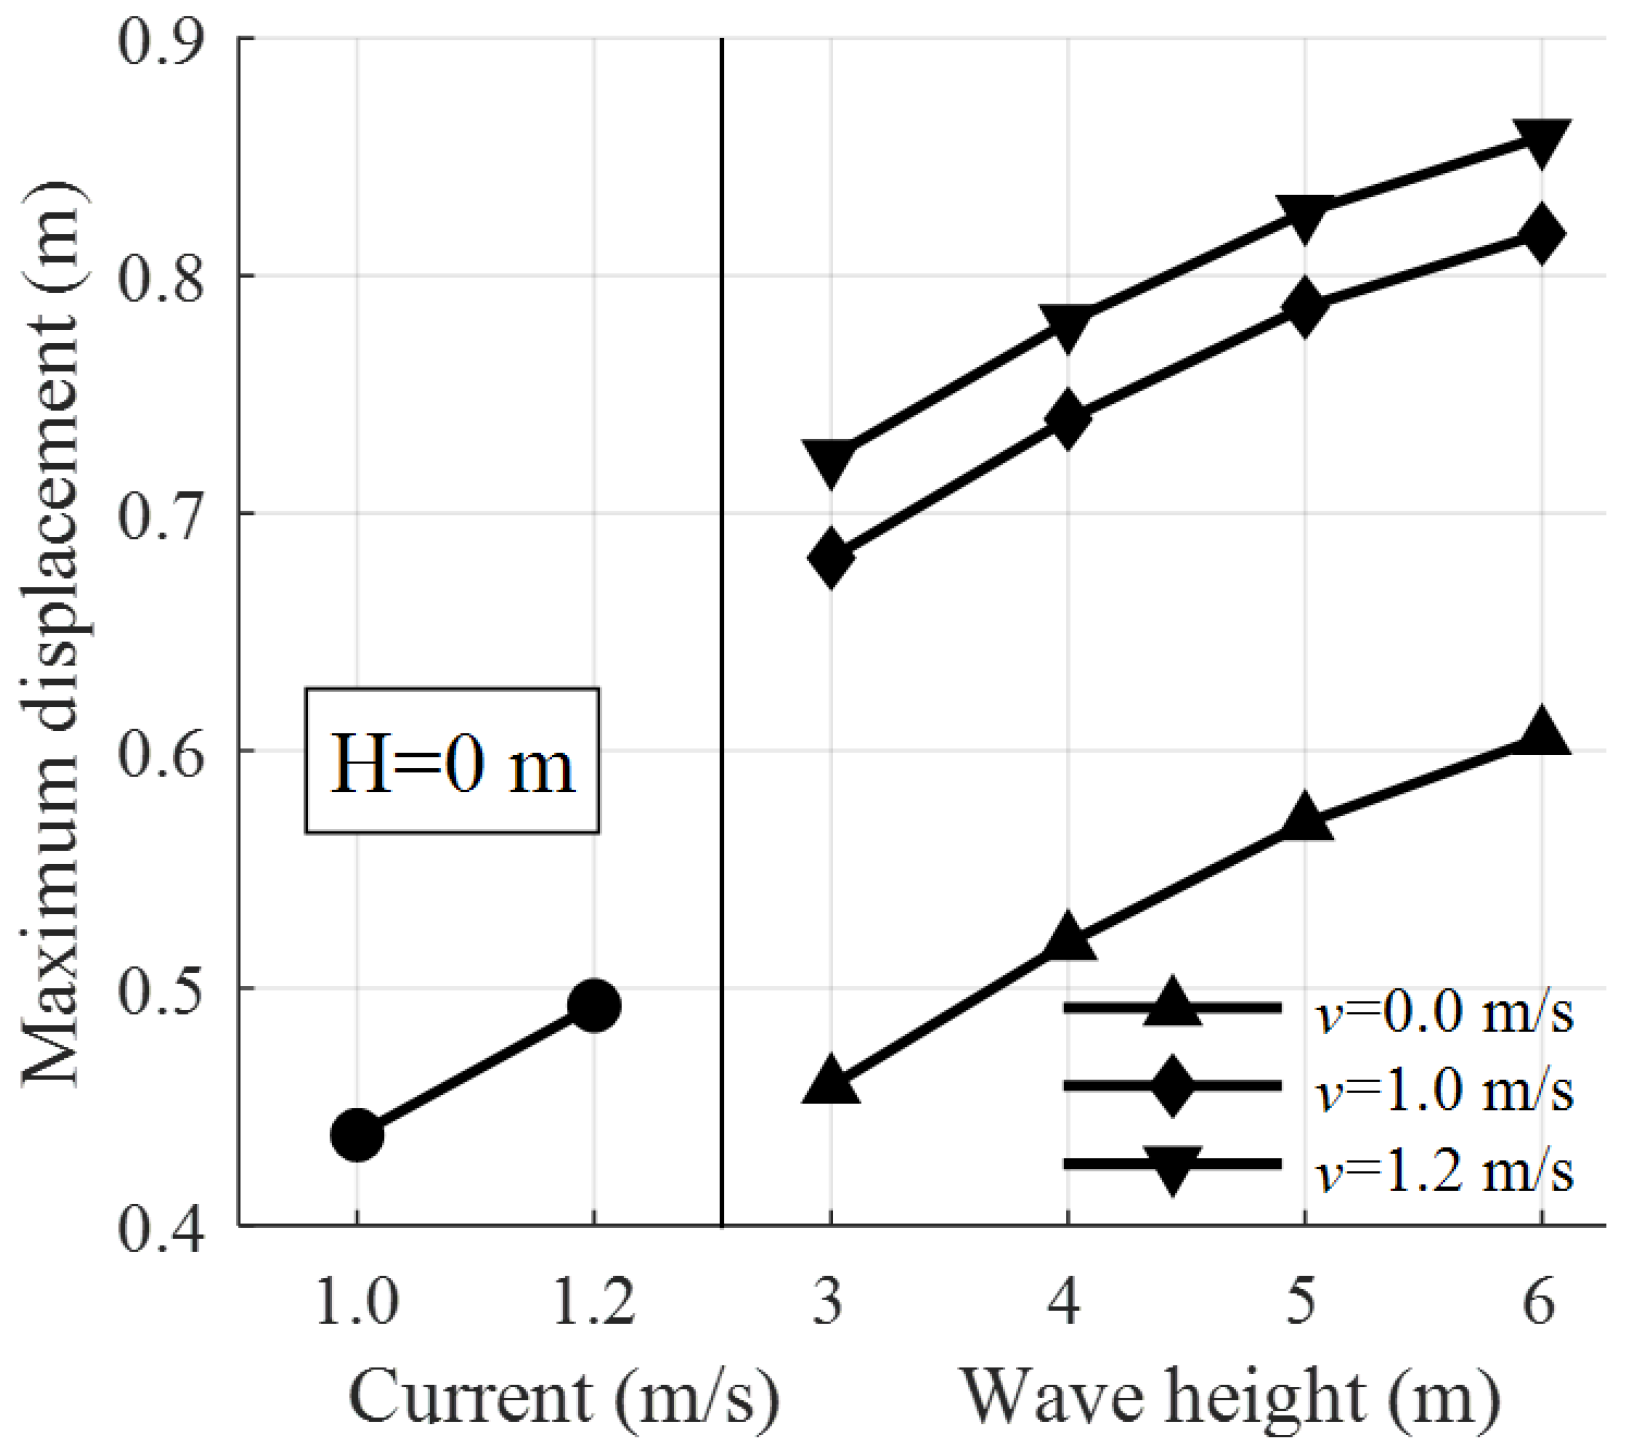
3.3. Influence of Combined Action of Waves and Currents on the Net System of Pile–Net-Gapped Enclosure Aquaculture Facility

In the open sea, waves generally co-exist with currents, which is called the combined action of waves and currents. Figure 15 depicts the force distribution of the rope and net twine of the net of the pile–net-gapped enclosure aquaculture facility under the combined action of waves and currents. It was found that the positions of the maximum force of the rope and net twine were similar to pure wave loads. The maximum force of the horizontal rope occurred near the still-water level, and the maximum force of the vertical rope occurred at the connection of the top channel steel. The maximum force of the net twine above the still-water level occurred at the connection of the top channel steel, and the maximum force of the net twine below the still-water level occurred near an elevation of (−0.5)–(−2) m. These results suggest that reinforcement of the rope and net twine at these positions should be given a lot of attention.
Comparing pure wave and combined wave and current loads, the positional difference of the force region was small, because the latter increased the current loads. When the current of the different wave loads (H = 3, 4, 5, and 6 m) was v = 1.0 m/s, the corresponding maximum force regions were 1–15, 1–18, 1–21, and 1–24, respectively. Compared with the pure wave load (H = 3 m), the position where the net was subjected to the greater force changed from regions 1–12 to 1–15 under the combined action of the waves and current (H = 3 m, v = 1.0 m/s). Regions 1–6 accounted for more than 25% of the force of the entire net under the combined action of the wave and current loads. In addition, regions 1–15 are the positions where the force is relatively large, and these regions account for more than 64% of the force of the entire net. Regions 22–42 account for more than 26% of the force of the entire net due to the increased current load. Combined with the above analysis, the maximum force and force regions of the net are increased under the action combined of waves and currents.
As illustrated in Figure 16, the deformation of the net under the combined action of waves and currents are studied. The main positions for the maximum displacement of the net are region 11 and 14. The deformation of the net increases with the increase of wave loads when the current is 1.0 m/s or 1.2 m/s, respectively. It can be found that for the horizontal ropes, the maximum stretched length occurs near the still-water level. When v = 1.0 m/s, the maximum number of horizontal rope forces is changed from the original 3 to 5 ropes with the increase of wave loads (indicated by a black box in Figure 16). In addition, when H = 5 and 6 m, the maximum number of horizontal ropes shifts from near the still-water level to below the water level. Compared to v = 1.2 m/s, the corresponding maximum number of horizontal ropes is changed from 5 to 6 ropes.
The change of the maximum force magnitude of the rope and net twine under the combined action of the waves and currents is displayed in Figure 17. When the current (v = 1.2 m/s) was coupled with different wave heights (i.e., H = 3, 4, 5, and 6 m), the corresponding maximum force of the ropes was 4993.20, 6259.60, 6975.60, and 7440.90 N, resulting in an increase of 11.91%, 10.39%, 9.55%, and 9.09% compared with that of v = 1.0 m/s; similarly, the corresponding maximum force of the net twines was 728.88, 896.28, 990.84, and 1059.70 N, resulting in an increase of 11.15%, 9.96%, 9.20%, and 8.77% under the abovementioned same conditions. Compared with pure wave loads (H = 3, 4, 5, and 6 m), the maximum force of the ropes increases by 59.39%, 52.37%, 48.10%, and 45.80%, and that of the net twines increases by 56.67%, 49.92%, 46.71%, and 44.53%, respectively. The slope of the increase in the force on the rope is greater than that on the net twines. The study revealed that with the increase in wave loads, the increased rate of the maximum force of the net twine gradually slowed down, indicating that the net of the pile–net-gapped enclosure aquaculture facility had a better ability to protect the net twine in extreme ocean loads.
The variations in the maximum force of the joint points related to the distance from the water surface under the combined action of waves and currents is illustrated in Figure 18. Above the still-water level, the maximum force of the joint points gradually decreased with the increase in height. Under the still-water level, the maximum force of the joint points gradually decreased with the increase in the distance from the water surface. The maximum force of the joint points occurs at about 0–2 m below the still-water level. When the current (v = 1.2 m/s) is coupled with different distances from the water surface (depth = 0, −1, and −2 m), the corresponding maximum force of the joint points was 3487.52, 3746.56, and 3666.48 N, resulting in an increase of 10.57%, 11.45%, and 12.29% compared with that of v = 1.0 m/s. Compared with pure wave loads (i.e., H = 3, 4, 5, and 6 m), the maximum force of the joint points increased by 57.4%, 62.34%, and 66.35%, respectively. Compared with Figure 10, it can be seen that the shape of the maximum force was consistent with the shape of the pure wave loads.
In summary, compared with the action of pure waves and currents, the combined action of waves and currents had a great influence on the force of the net. The position of the maximum force of the rope and net twine need to be strengthened in practical engineering. The results show that with the increase in wave loads, the increase rate of the maximum force of the net twine gradually slows down. Thus, it can be found that the pile–net-gapped enclosure aquaculture facility showed better performance in extreme ocean loads. Affected by the combined action of waves and currents, the maximum force of the joint points shifted to below the still-water level compared with the pure wave loads and occurred at an elevation of approximately –2 m. In addition, regions 1–15 were the positions where the force was relatively large.
Similarly, the positions of the maximum force of the net occurred at the top half of the net under the combined action of waves and currents. To prevent occurrences of the net system’s failure, the careful selection of materials, or replacement or reinforcement of them, should be considered. Based on the results presented above, the present study provides insights into understanding the hydrodynamic behavior of pile–net-gapped enclosure aquaculture facilities in practical engineering, which is more beneficial to ensure the safety of the pile–net-gapped enclosure aquaculture facility.

4. Discussion

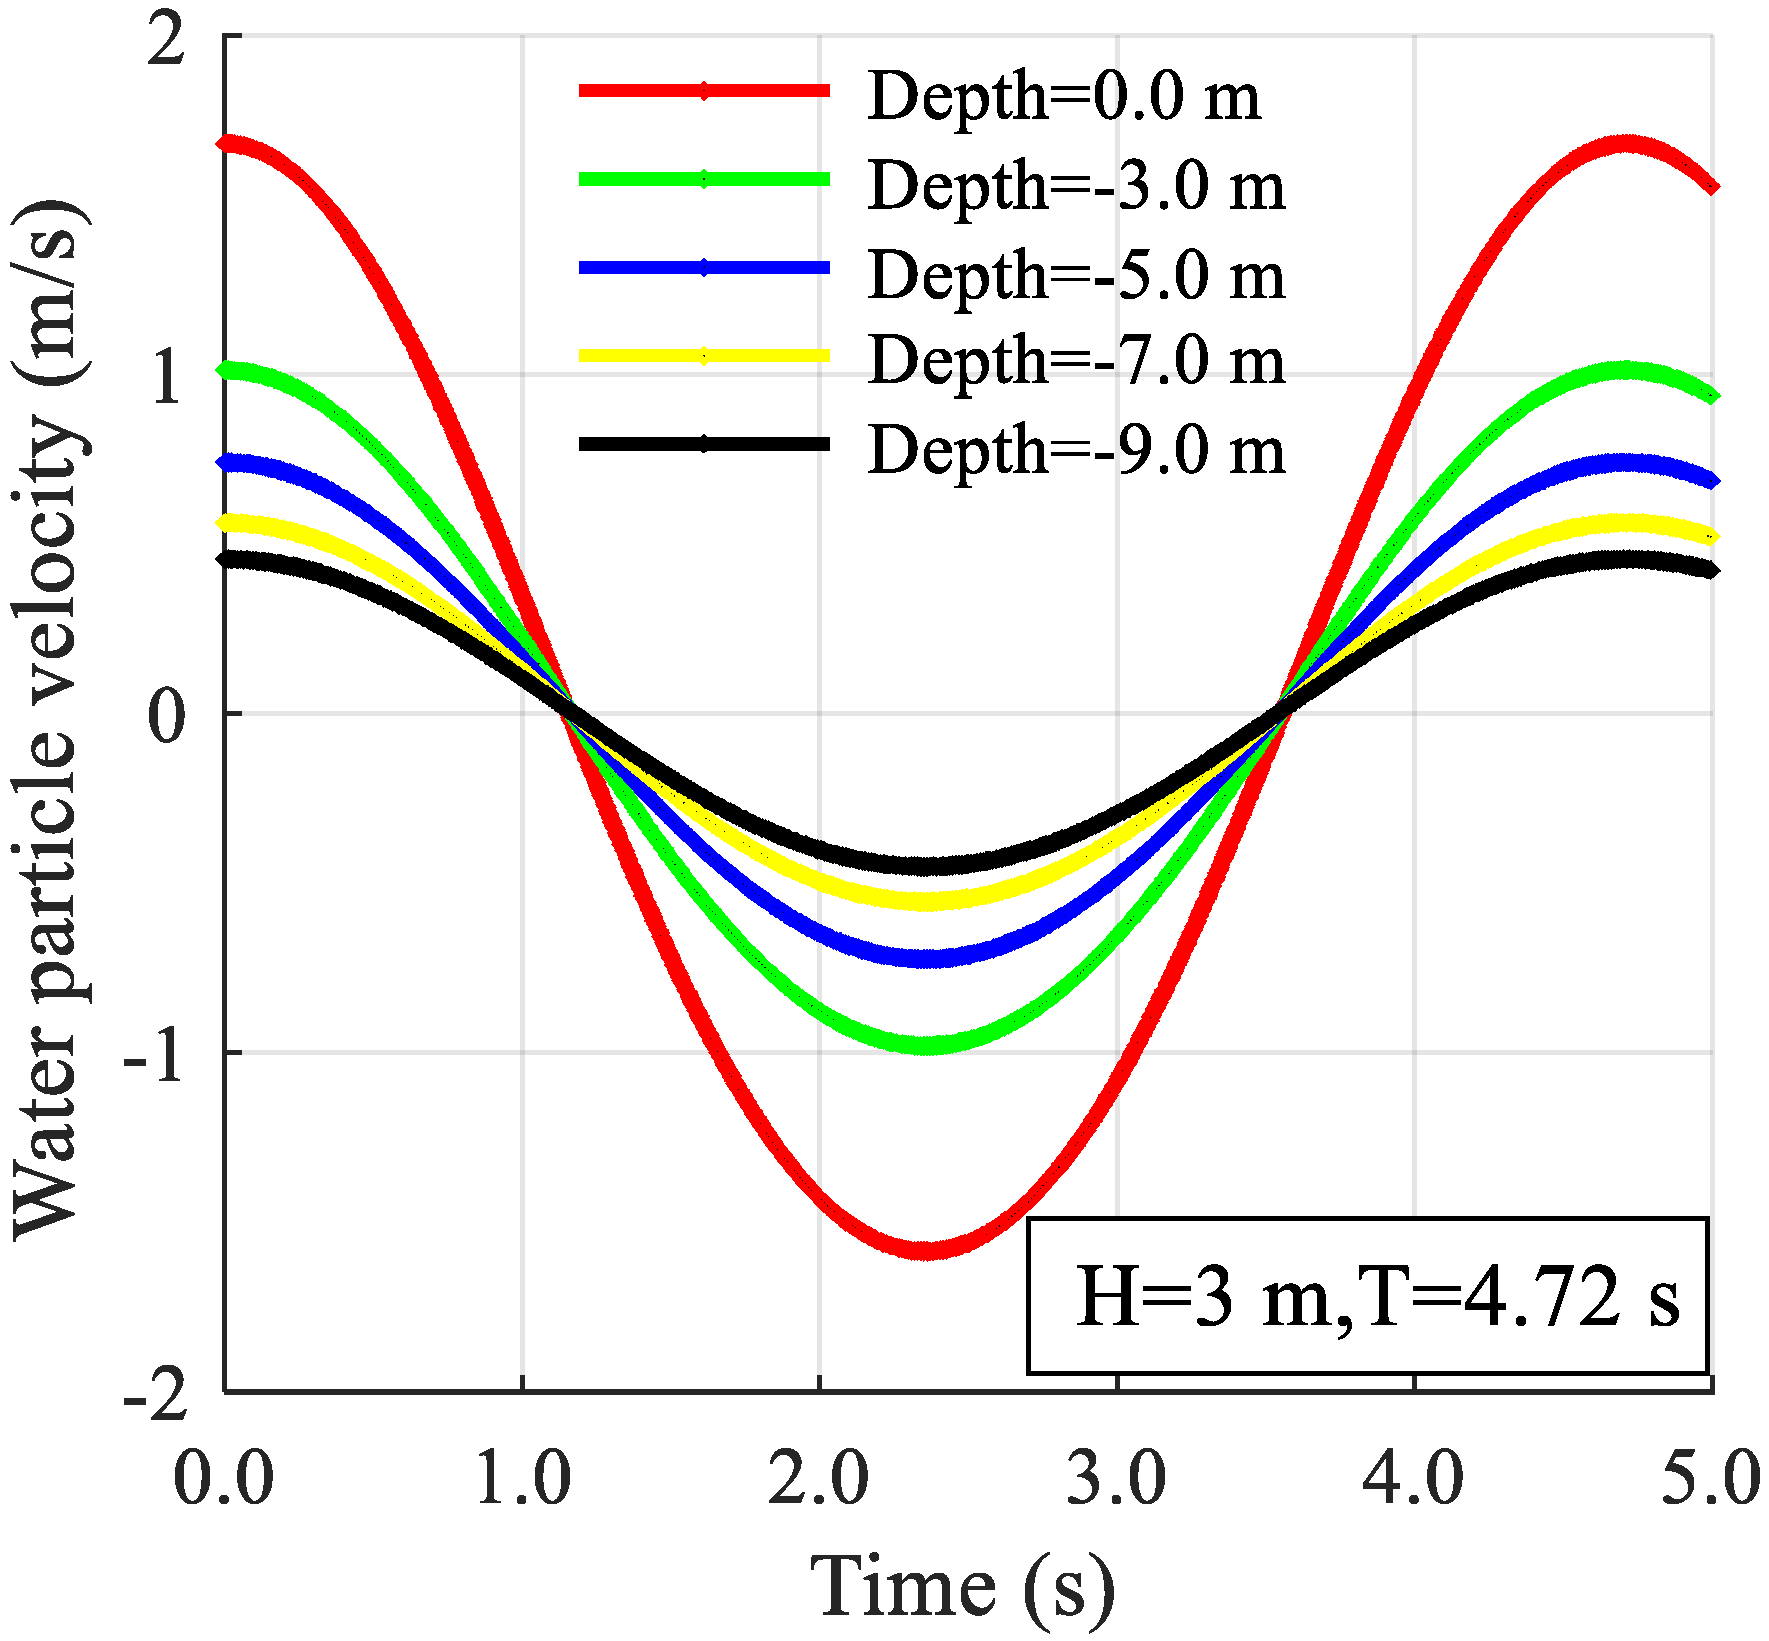
4.1. Effect of Water Particle Velocity at Different Depths on the Dynamics of the Net System of a Pile–Net-Gapped Enclosure Aquaculture Facility

In this study, the hydrodynamic characteristics of the net system of a pile–net-gapped enclosure aquaculture facility under three typical conditions were examined. In order to show the force distribution of the net and to avoid data repetition, we provided five groups of water particle velocities at different depths (Figure 19). From Figure 19, we can see that the water particle velocity decreased with the increase in the distance from the water surface, and it changed periodically. According to hydrodynamics, the velocity force ( F D ) and inertiall force ( F I ) increase when the water particle velocity ( V ) increases, which will cause the net to deform more at this position. It is easy to understand that the force of the horizontal ropes and net twines decreased with the increase in the distance from the water surface.

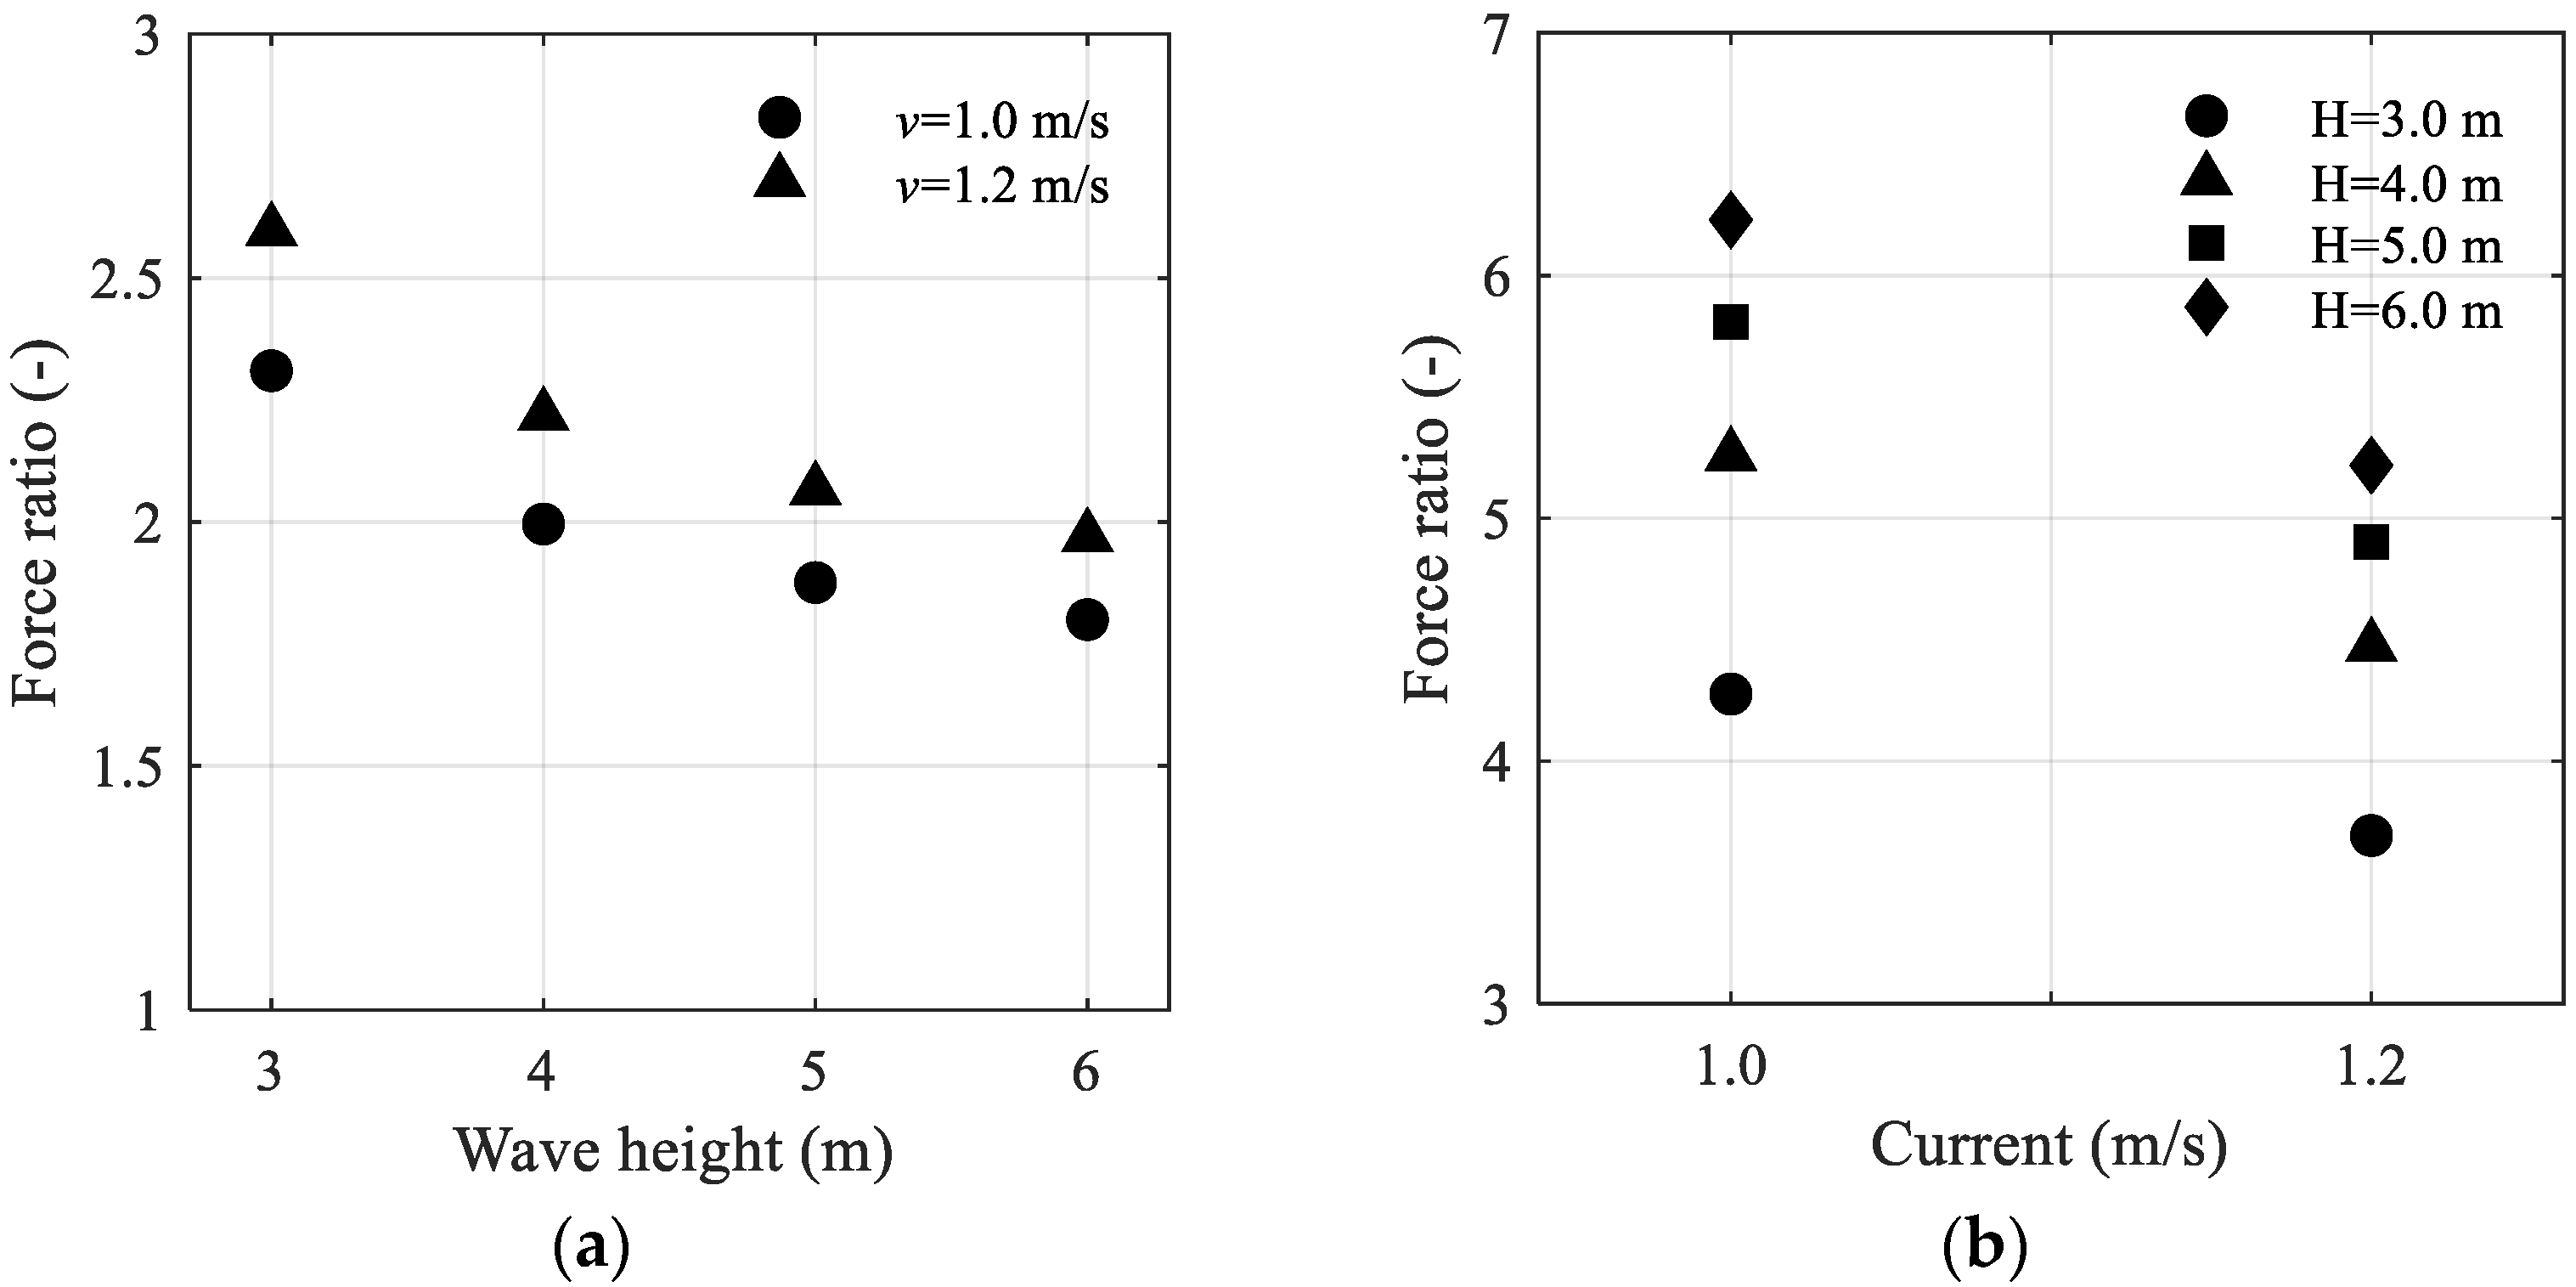
4.2. Comparison of the Results of the Pure Waves, Pure Currents, and Combined Action of Waves and Currents

In order to analyze the contribution of the load factors, pure waves, pure currents, and the combined action of wave and current conditions were considered for the net system. Figure 20 shows: (a) the ratio of the maximum force of the net twine in the combined action of waves and currents and the pure waves; and (b) the ratio of the maximum force of the net twine in the combined action of waves and currents and the pure currents. From Figure 20a, we can see that the force ratio decreased with the increase in wave loads when the current was 1.0 or 1.2 m/s. When the current (v = 1.2 m/s) was coupled with the wave height (H = 3 m), the maximum force ratio of the net twine was 820.37 N/315.81 N = 2.60 (with a pure wave load of H = 3 m, the maximum force of the net twine was 315.81 N). As can be seen from Figure 20b, the force ratio of the net twine increased with the increase in wave loads when the current was the same, and the minimum ratio of the net twine was 820.37 N/222.59 N = 3.68 (H = 3 m, v = 1.2 m/s), which was quite significant compared with the maximum force ratio magnitude in the combined action of waves and currents and the pure waves (as shown in Figure 20a). The results indicate that the maximum force of the net system was most significantly affected by the combined action of the waves and currents, and the contribution of the pure waves was larger than the pure currents.
In order to analyze the contribution of the load factor to the displacement, Figure 21 illustrates the change in the maximum displacement values of the net with pure waves, pure currents, and the combined wave and current conditions. When the current (v = 1.0 m/s) was coupled with different wave heights (i.e., H = 3, 4, 5, and 6 m), the corresponding maximum displacements of the net were 0.6812, 0.7396, 0.7868, and 0.8178 m, respectively. Compared with the pure wave heights (i.e., H = 3, 4, 5, and 6 m), the maximum displacement increased by 32.64%, 29.81%, 27.62%, and 25.96%, respectively. In general, at the same wave heights, the maximum displacement of the net increased with the increase in current loads. Compared with the pure wave and pure current loads, the displacement of the net under the combined influence of waves and currents was the largest. The results show that the combined action of waves and currents also had the greatest influence on the displacement of the net.

4.3. Future Prospects

There are many commonly-used materials for pile–net-gapped enclosure nets, mainly PE nets, chain-link wire nets [34], and copper alloy nets [35], etc. Copper alloy nets have the characteristics of high self-cleaning and the potential benefits associated with reduced biofouling. Due to the fact of its smooth surface, it also exhibits significantly lower resistance to currents, which corresponds to lower values of drag coefficient [36]. Figure 22 shows the practical application of a copper alloy net in pile–net-gapped enclosure engineering, which can be found at Dachen Island, China. Similar to the copper alloy net, the PE net had larger C D values than that of the chain-link wire net [34]. In China, pile–net-gapped enclosures mainly use PE materials, which is attributed to its low price and better fatigue resistance. The research in this paper mainly focused on PE materials; the results of other materials will be further explored in the future.
For PE materials, with the increase in the use time, the biofouling phenomenon will become increasingly serious. Due to the presence of biological fouling, the effective flow area of the mesh will reduce or even become blocked, resulting in a larger hydrodynamic load on the pile–net-gapped enclosure. According to a study by Swift et al. [37], they presented that drag of biofouling nets may be over three times that of clean nets. In a recent study, Nobakht-Kolur et al. [38] compared one clean cage and two fouled cages of different fouling lengths, and the results showed that the surge force amplitude increased the fouling by up to 72%, but the sway force amplitude decreased by up to 26%. In general, the influence of the hydrodynamic performance induced by marine biofouling attachment has a non-negligible effect on the force of nets. In addition, here, our study only discussed PE nets, which is also important for external conditions such as the impact of sediment (silt) movement on aquaculture facilities. These are all studies that need to be examined in the future.

5. Conclusions

In this paper, the hydrodynamic characteristics of the net of a pile–net-gapped enclosure aquaculture facility were studied numerically using the lumped mass method. The main conclusions are as follows:
(i)
The force of the net increased rapidly with the increase in wave loads, while the changes in the force regions were quite different: with an increase in wave loads, the greater the force positions of the net changed from regions 1–12 (H = 3 m) to regions 1–21 (H = 6 m). Regions 1–12 were the positions where the force was the greatest, and these regions accounted for more than 60% of the force of the entire net under wave loads;
(ii)
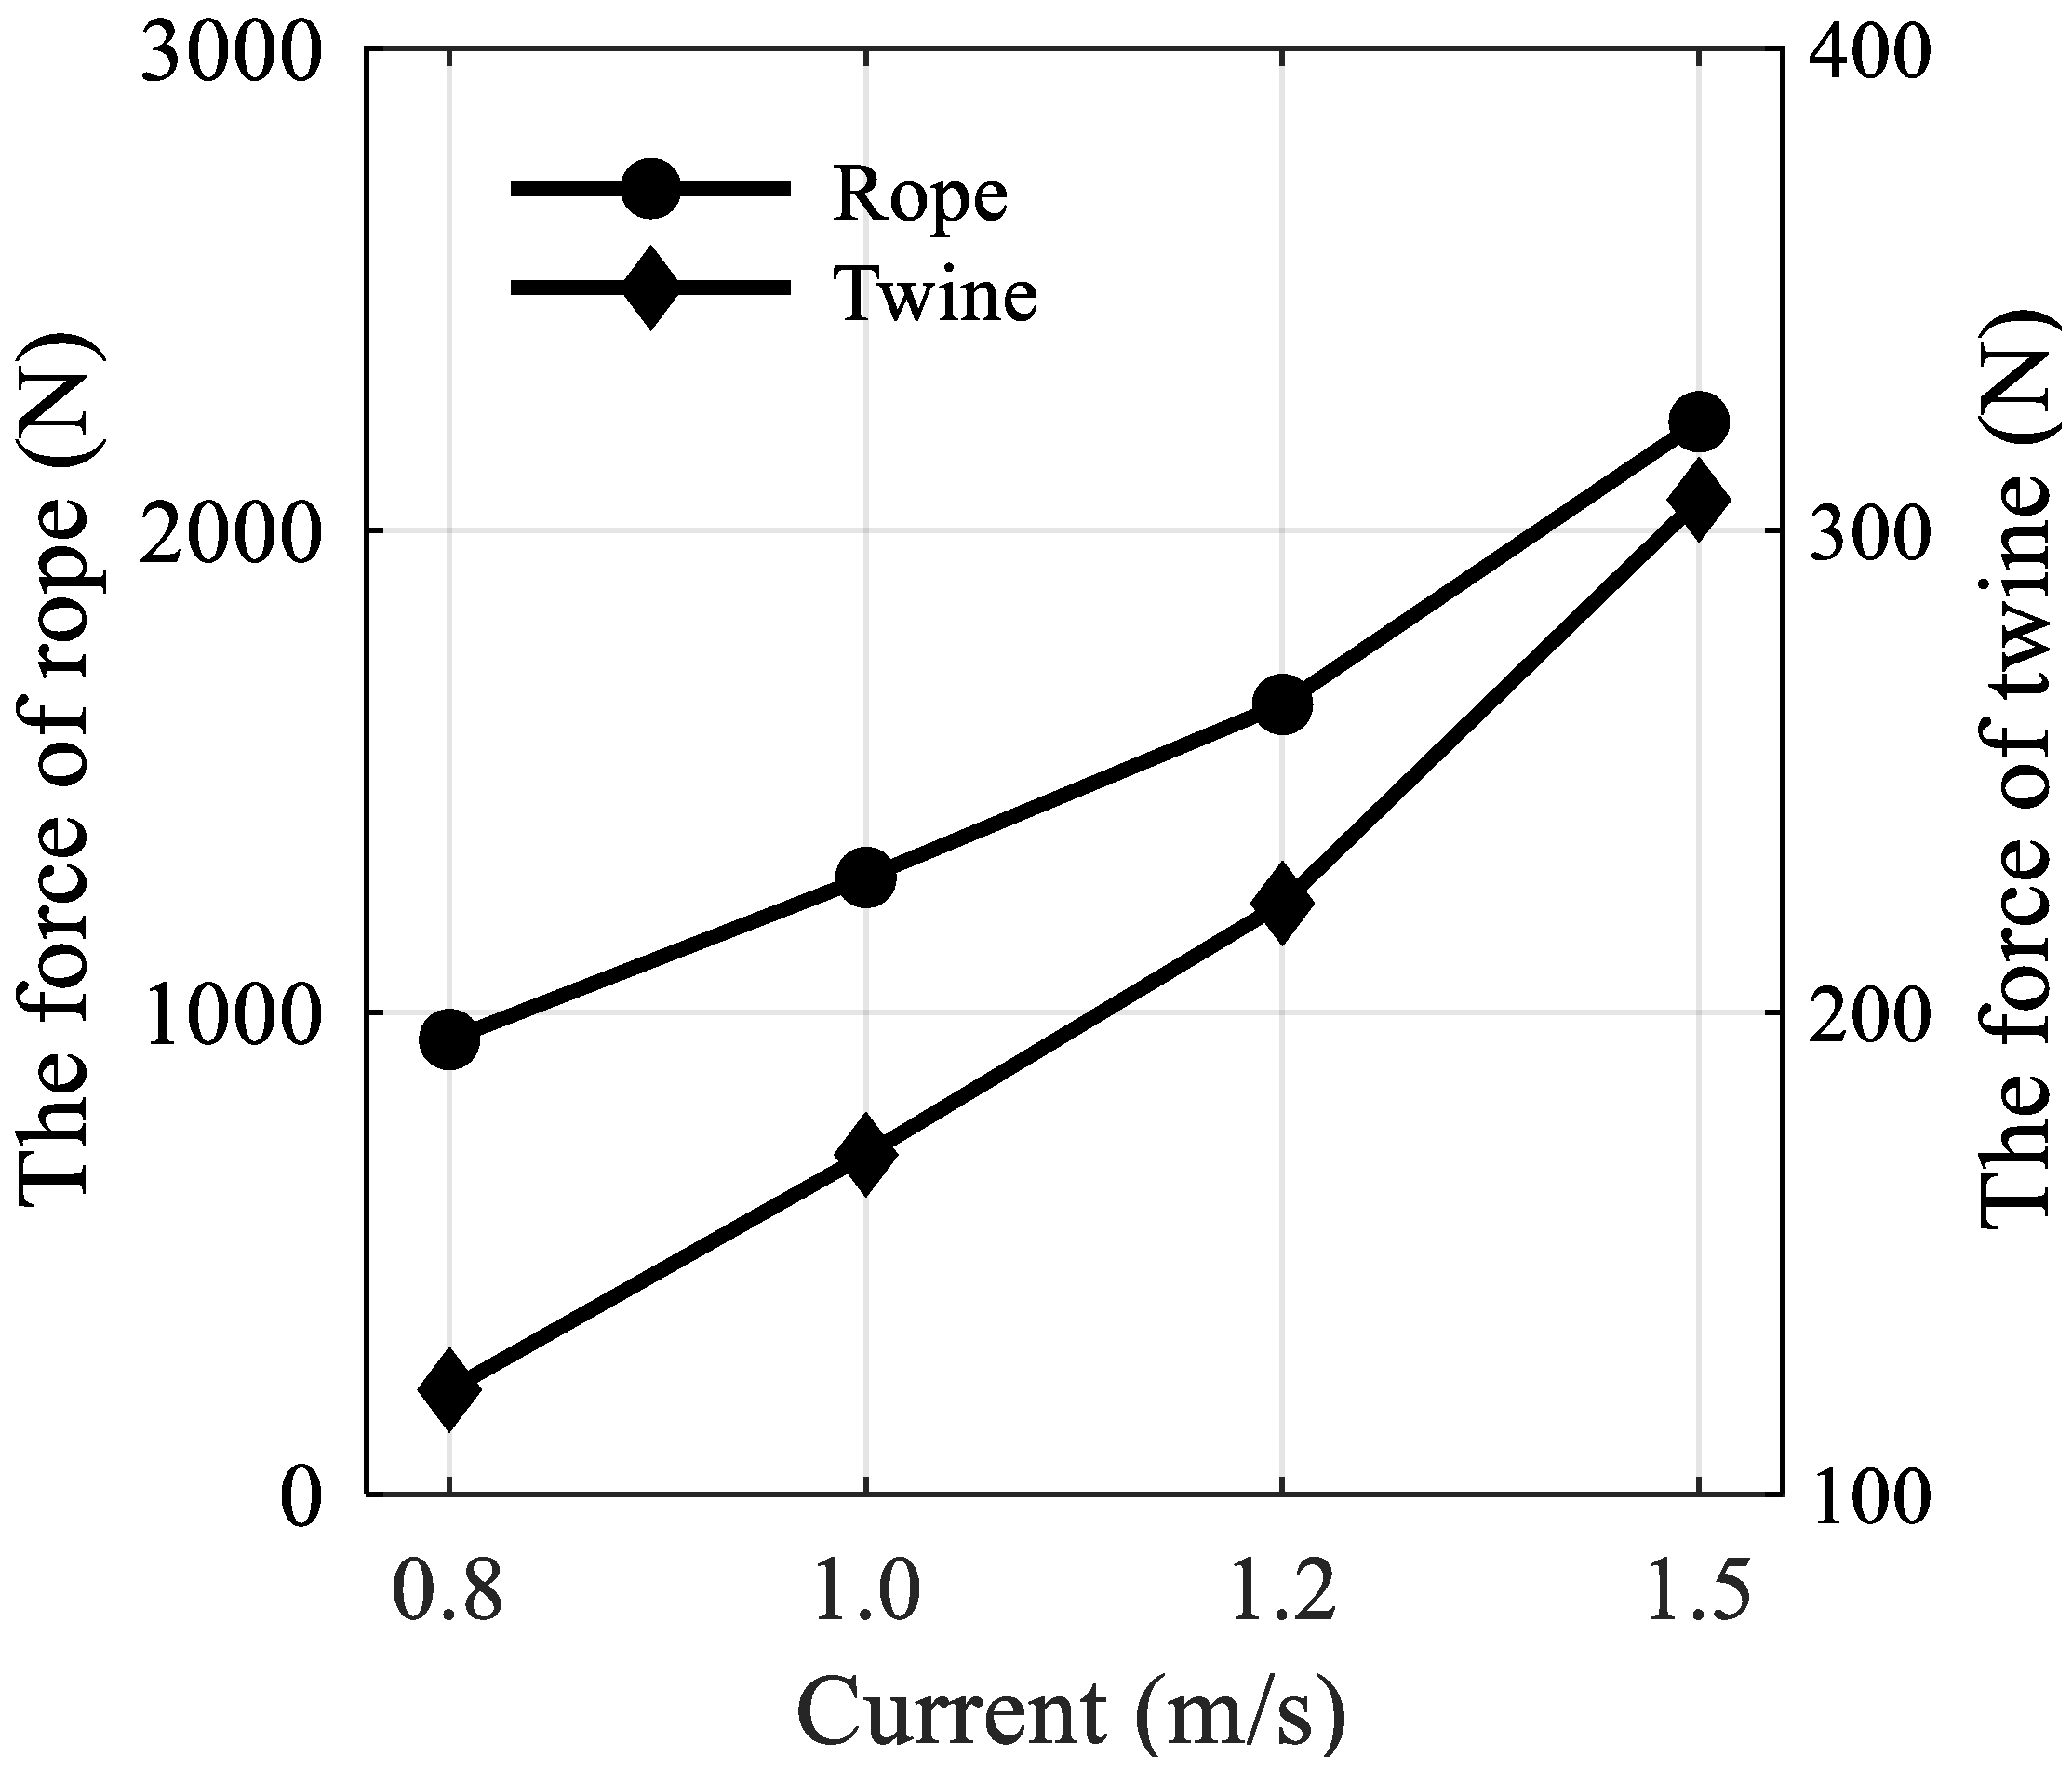
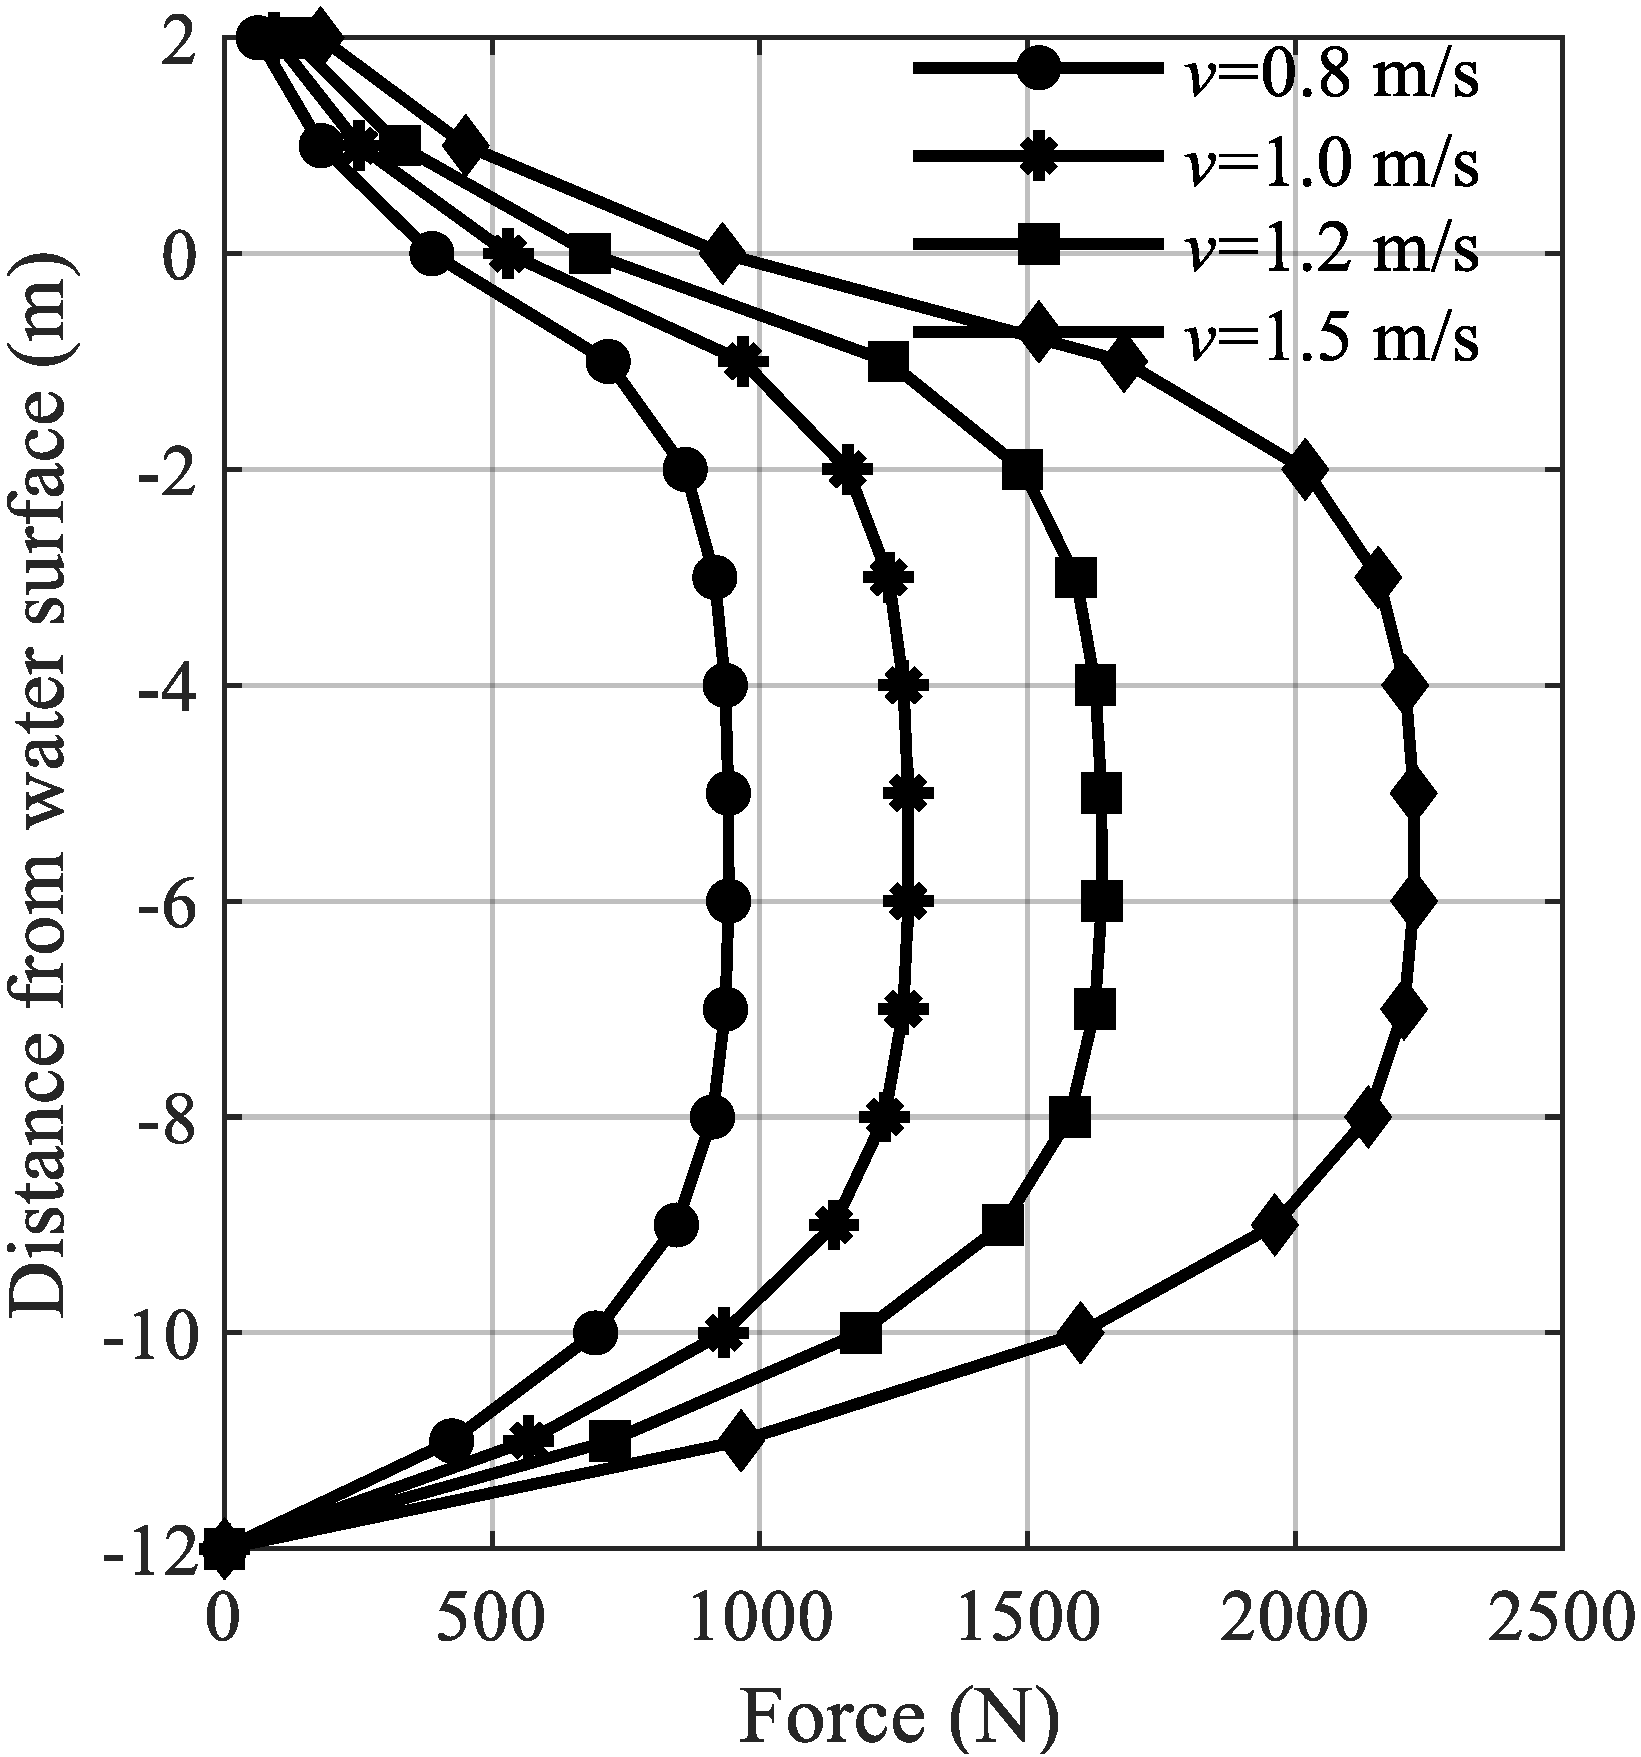
For pure current loads, the force of the net was uniform, since the energy did not decrease with the increase in water depth. The rope and net twine showed the same mechanical properties below the still-water level. The force and displacement of the net increased at the same rate under the currents that increased uniformly;
(iii)
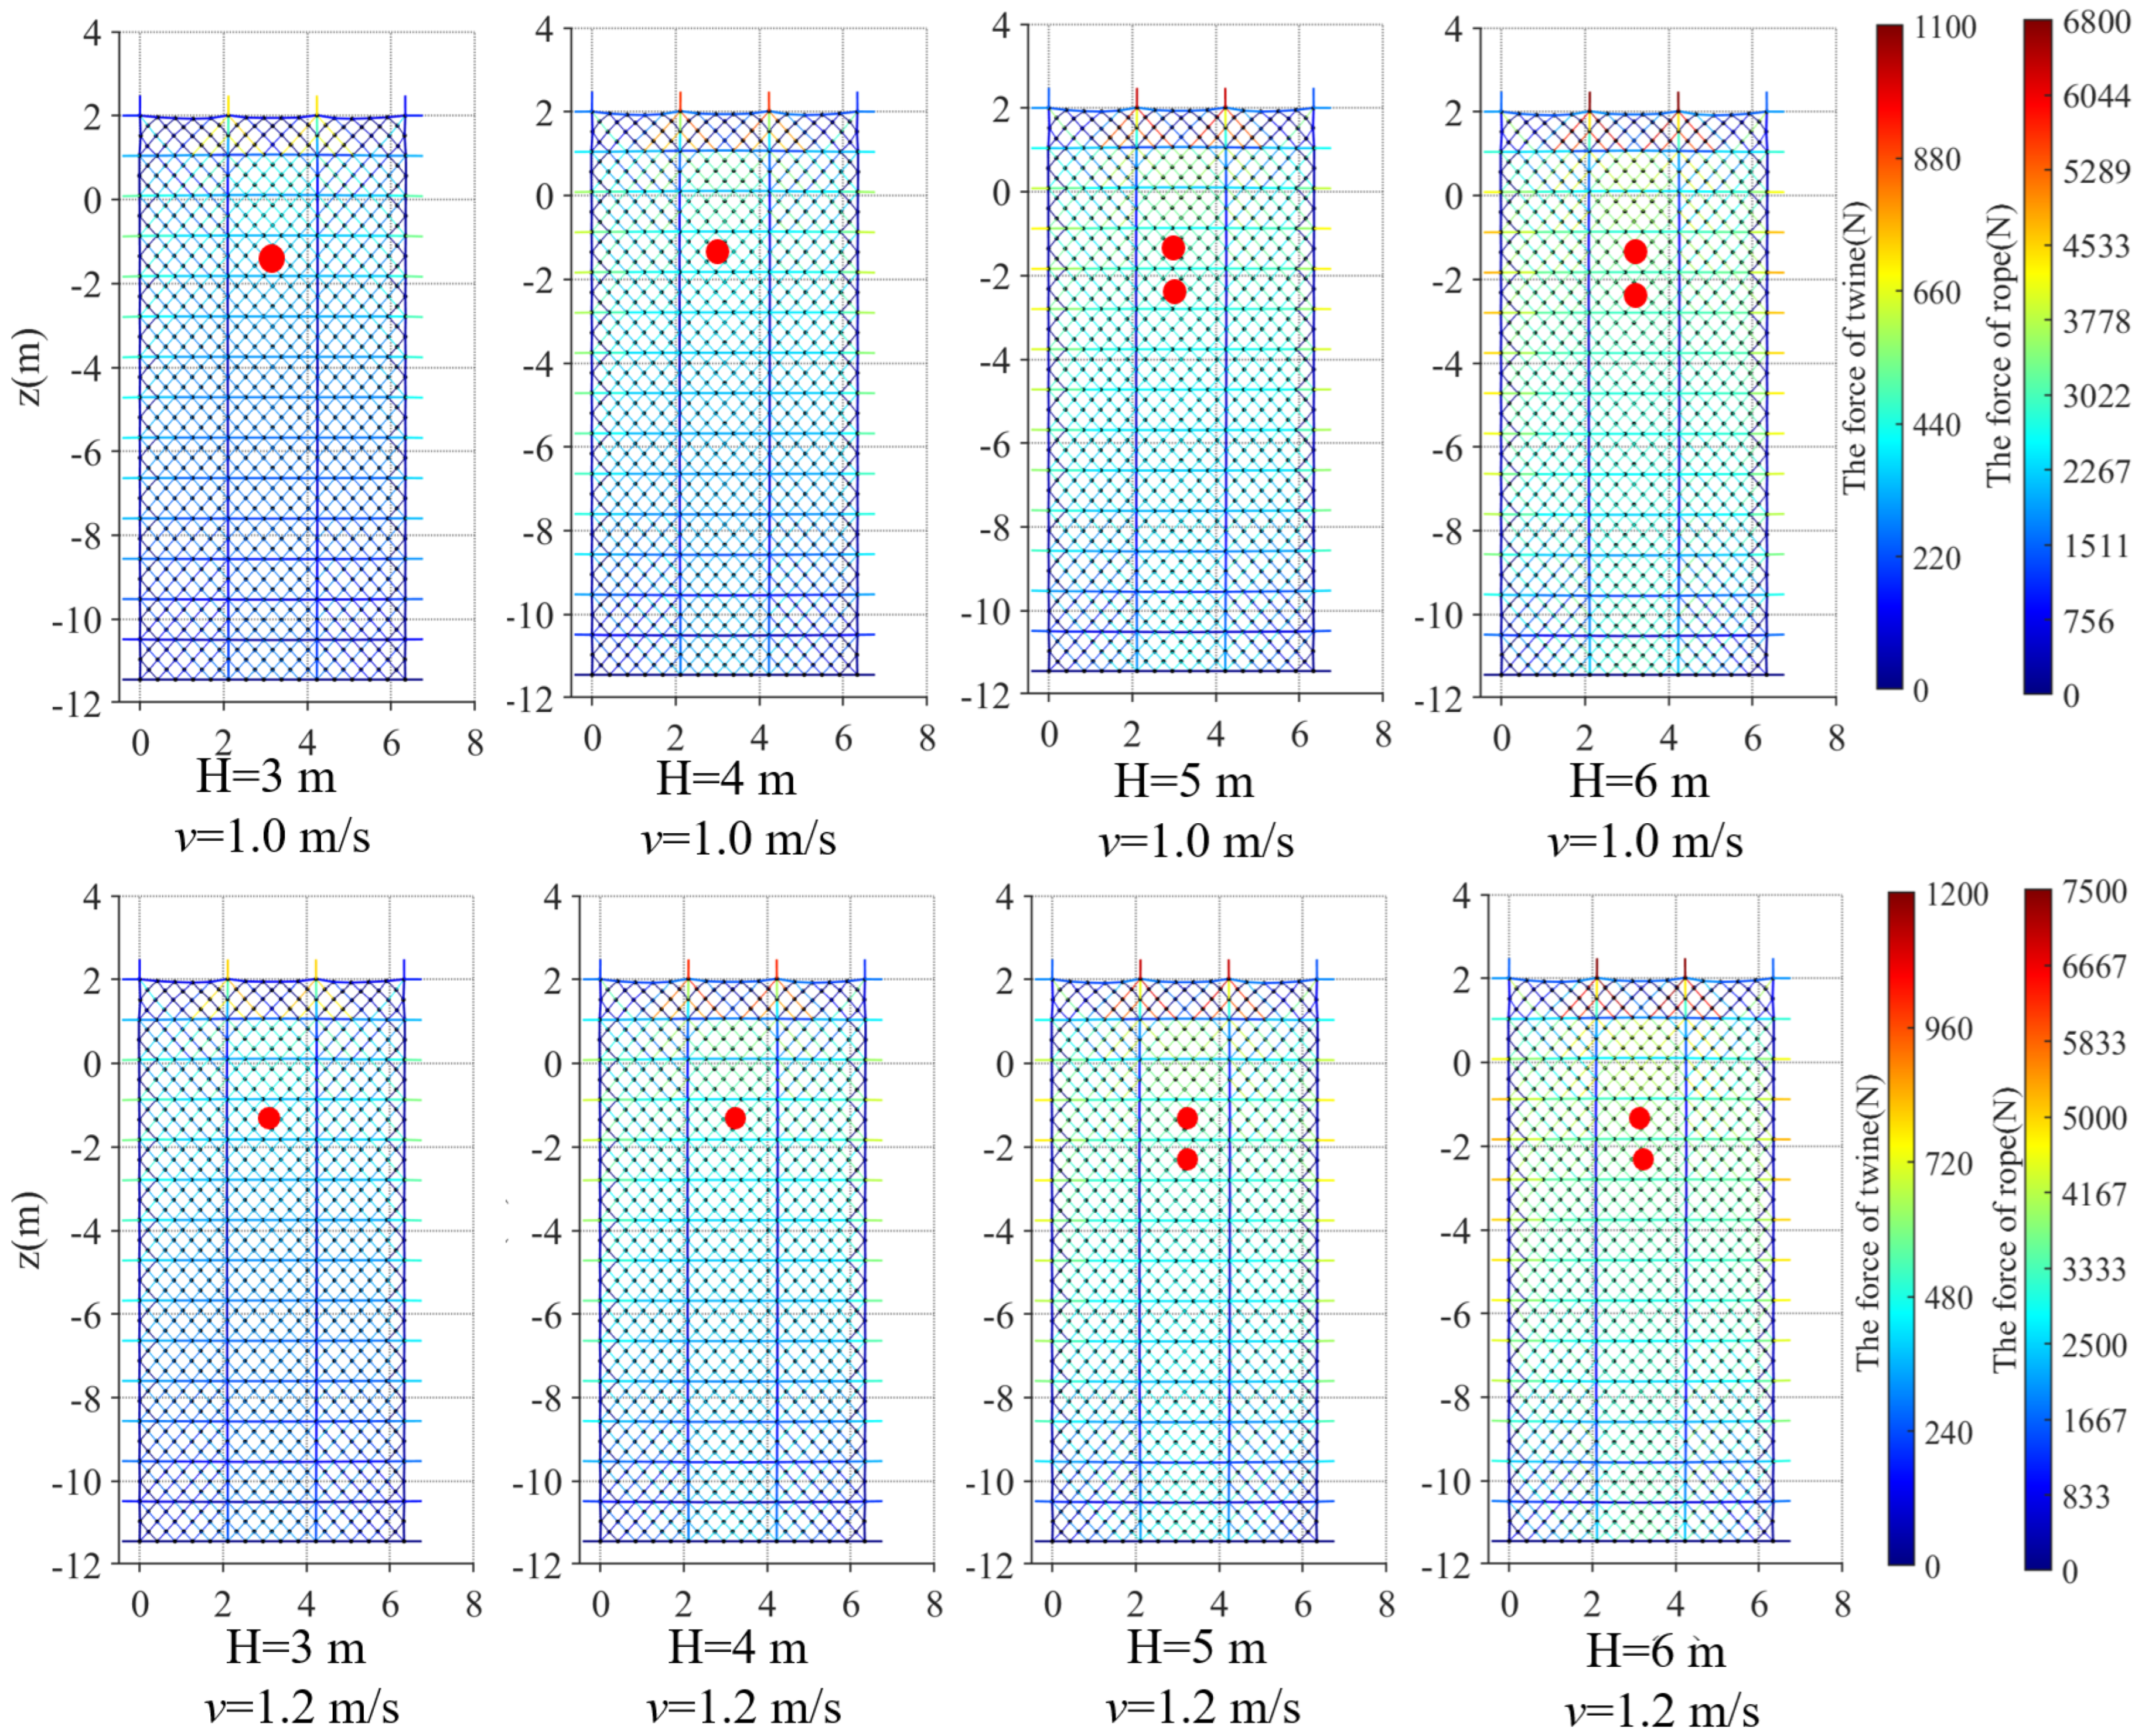
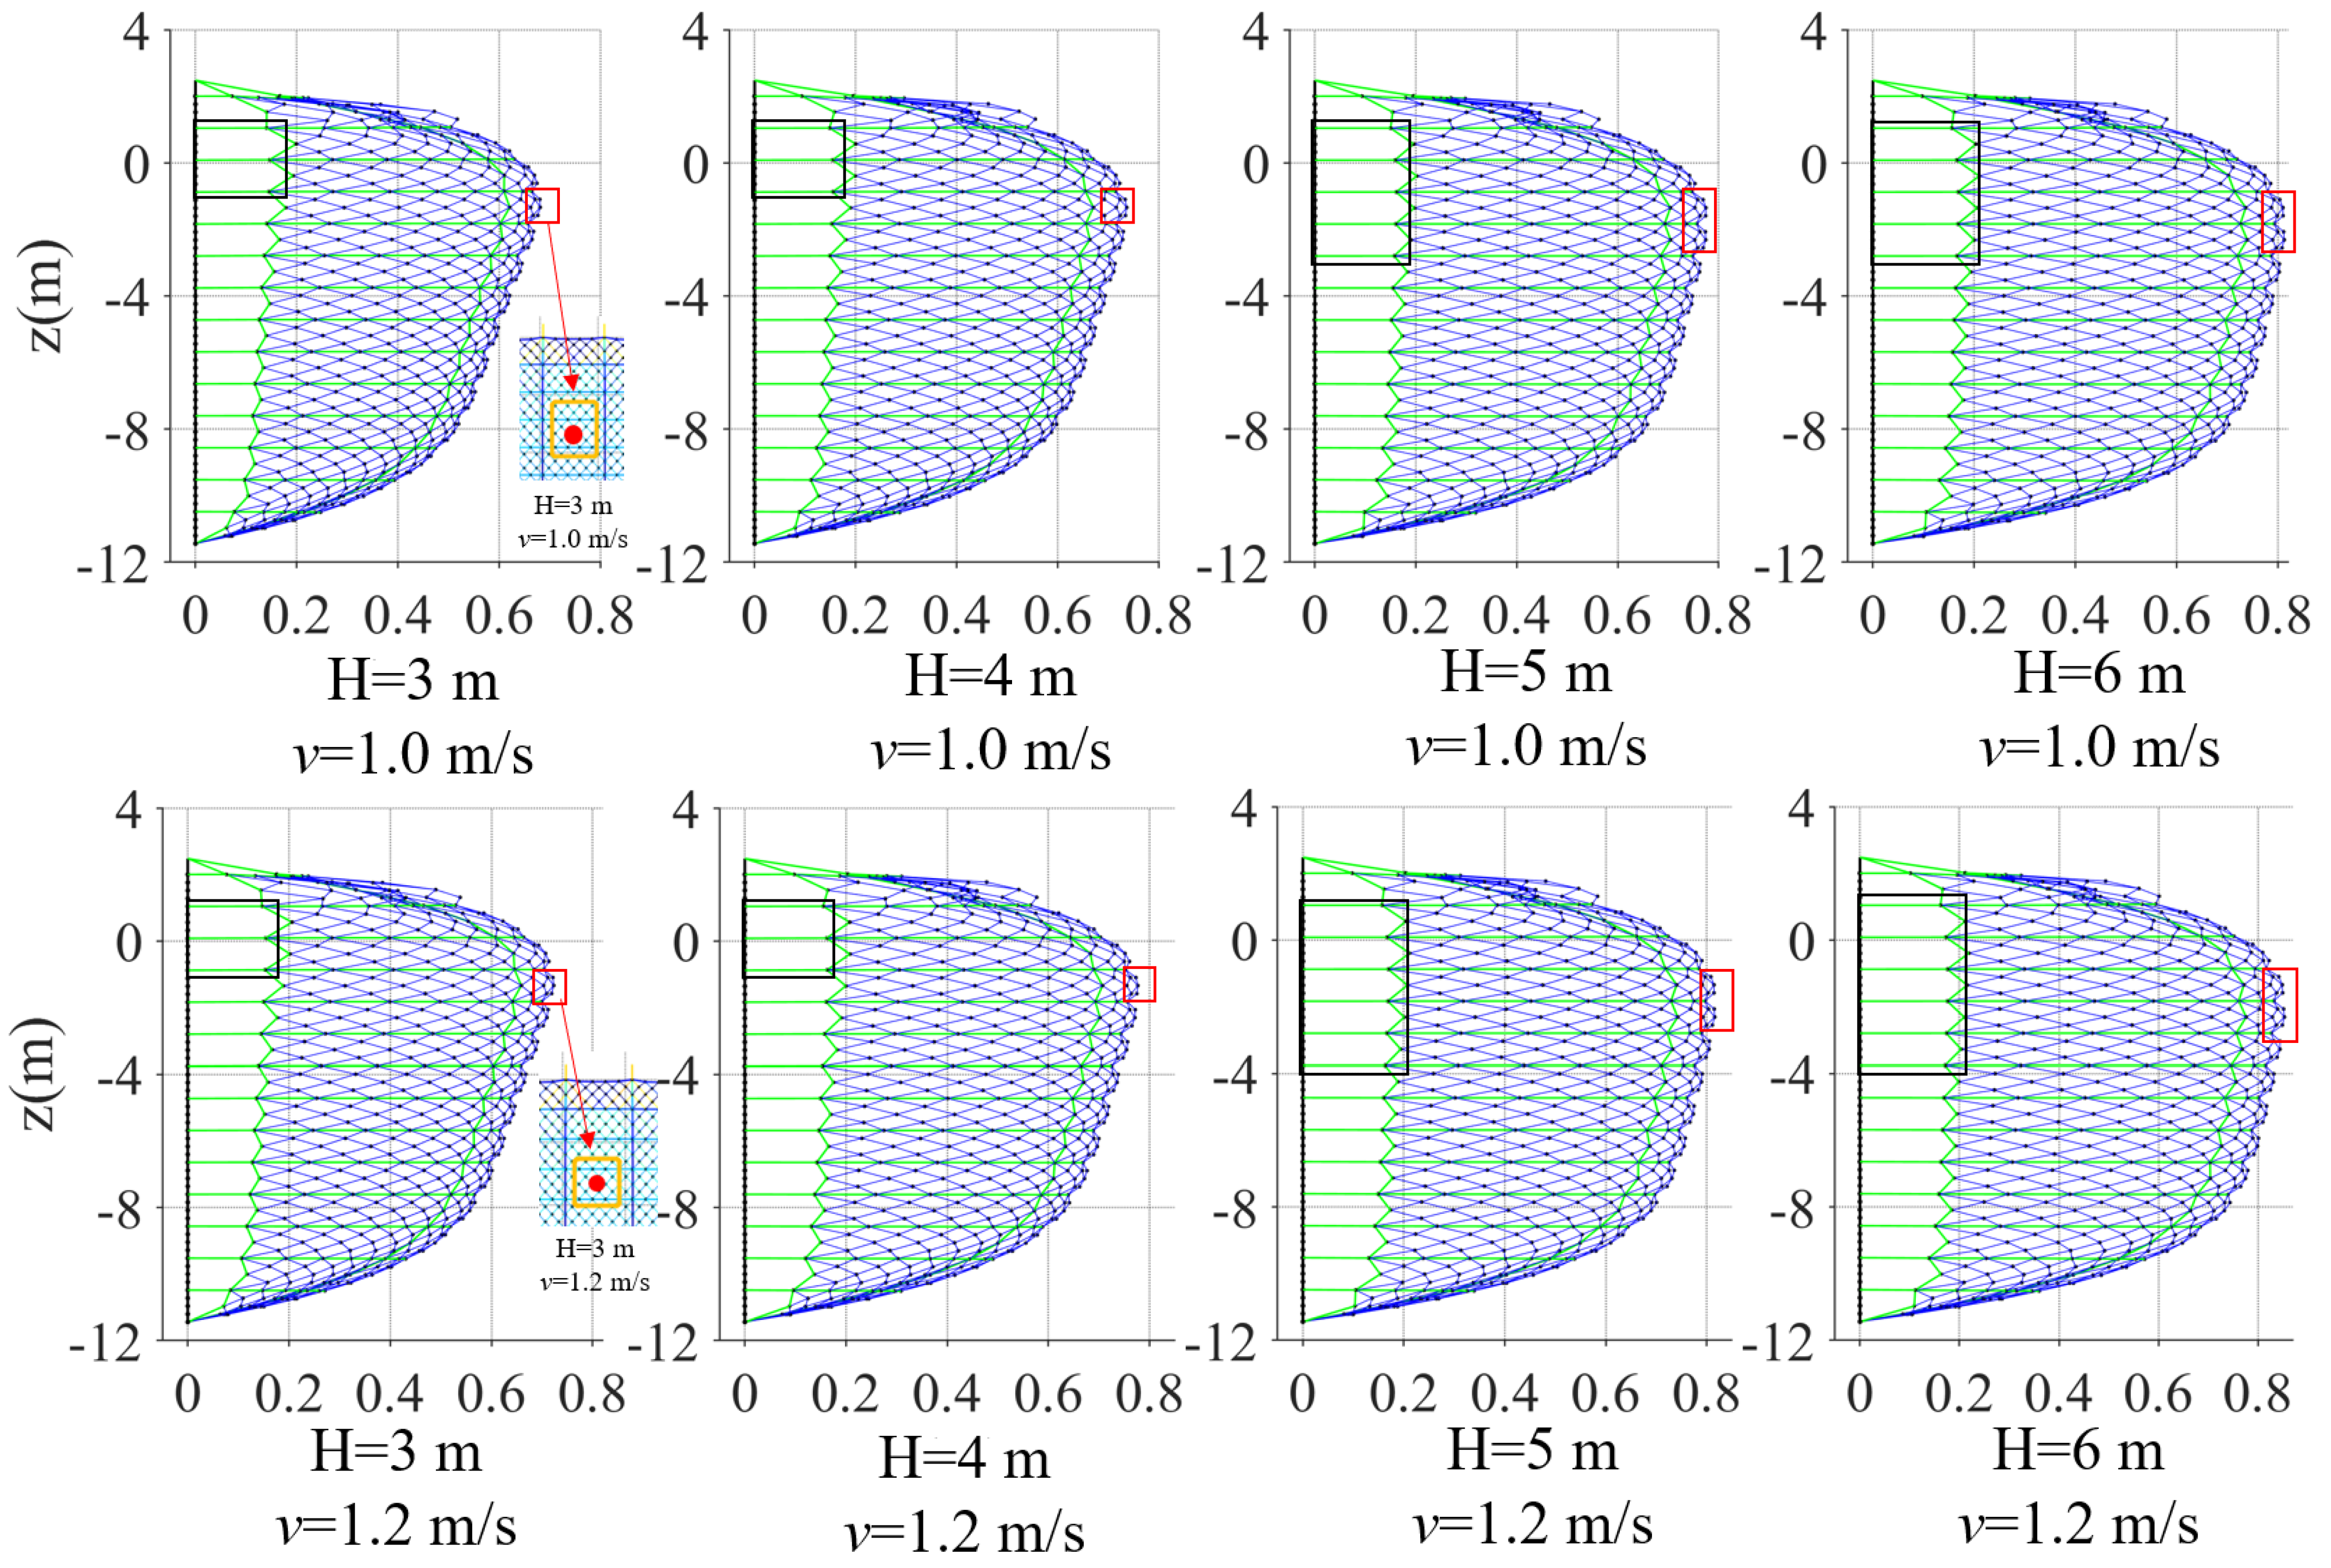
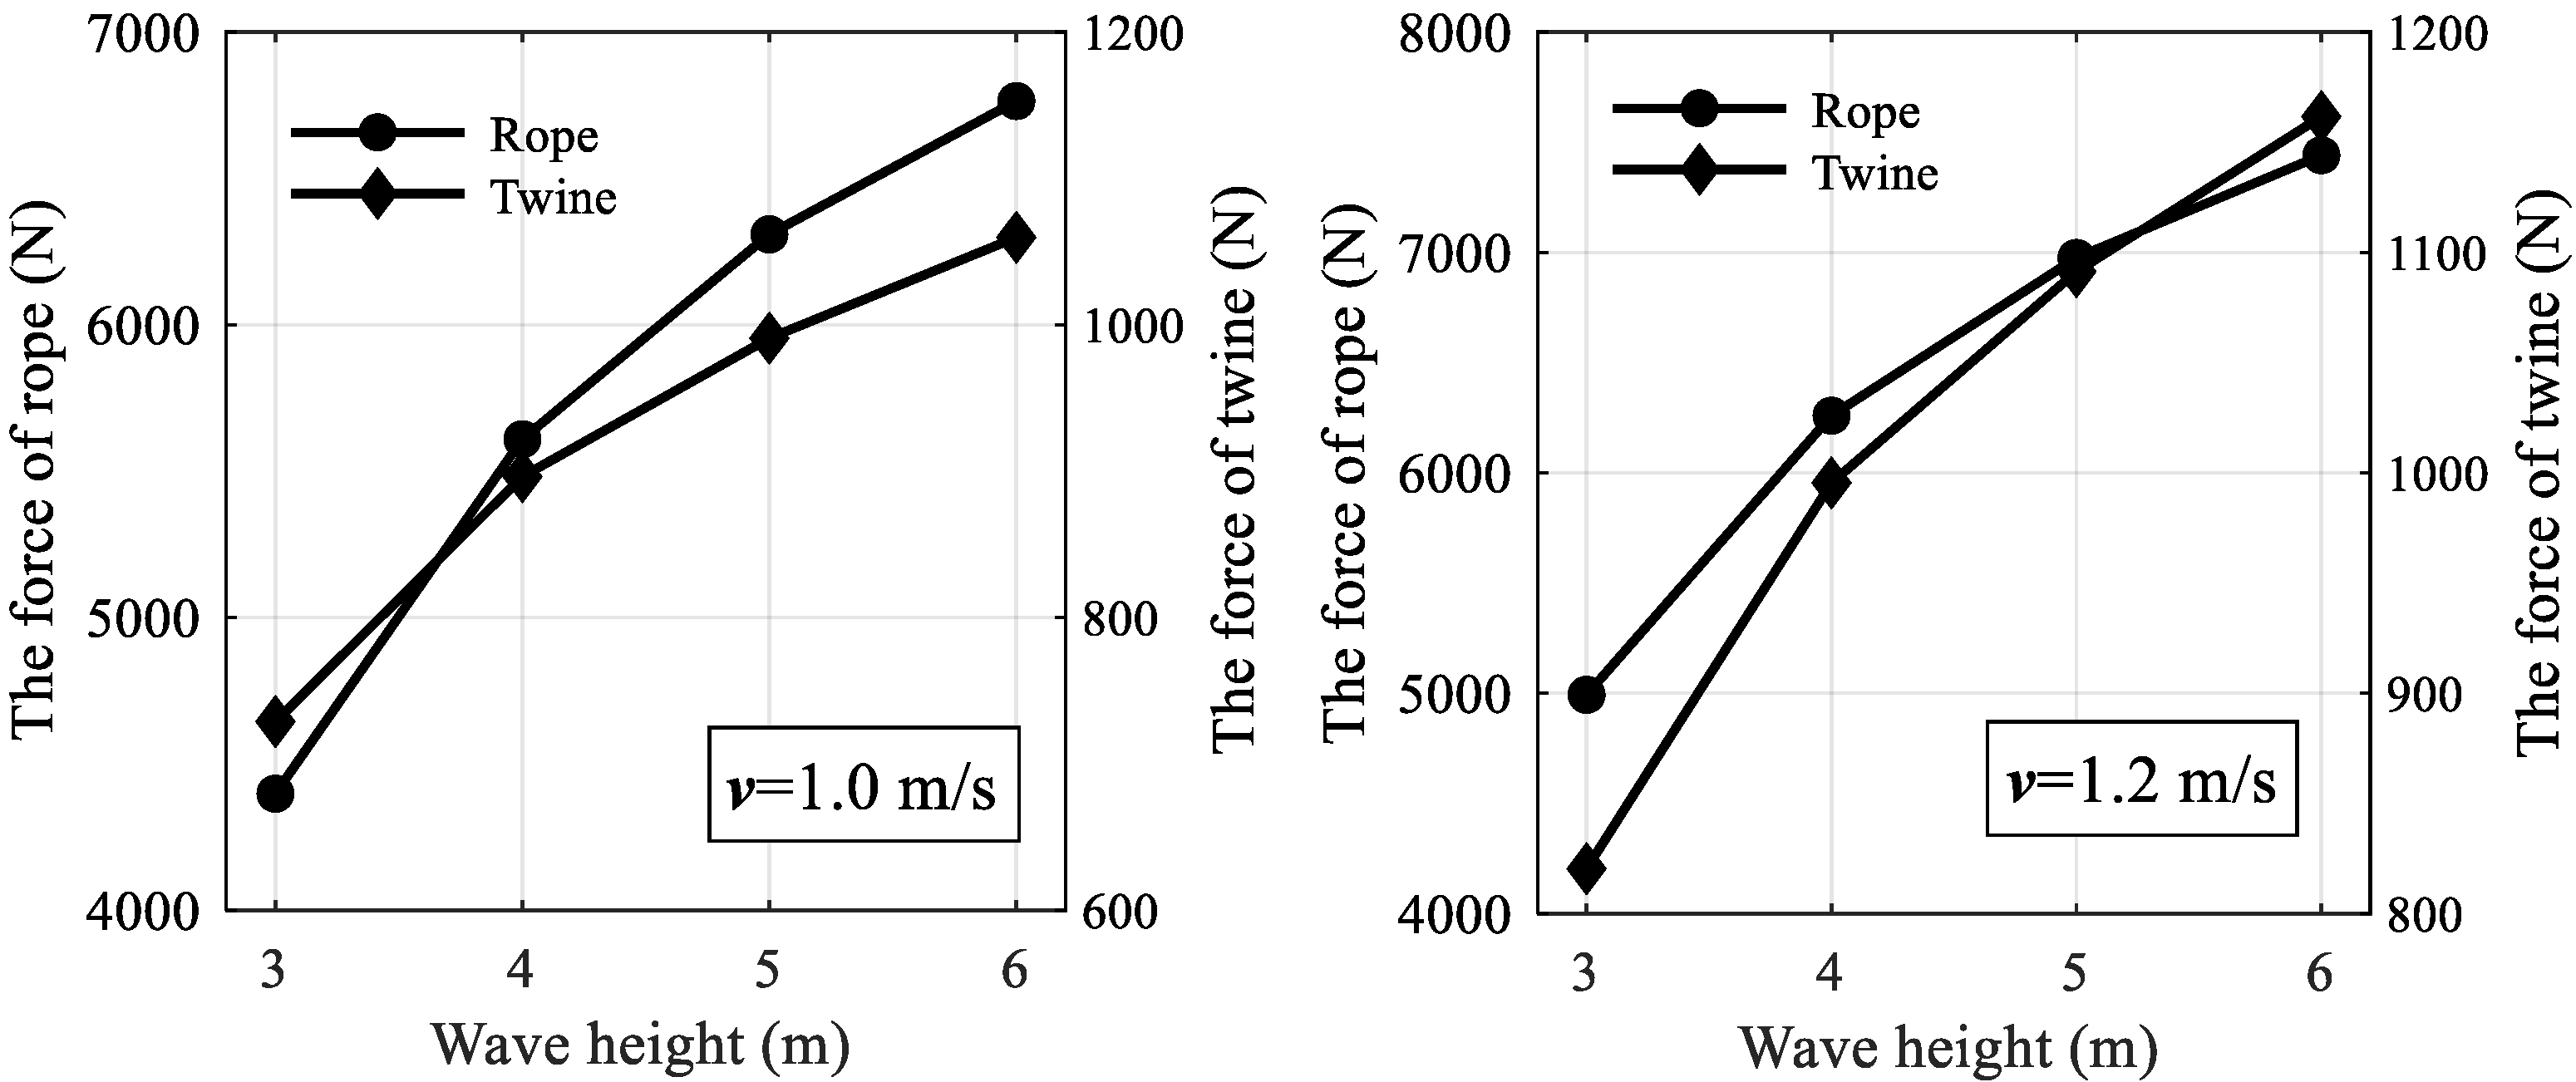
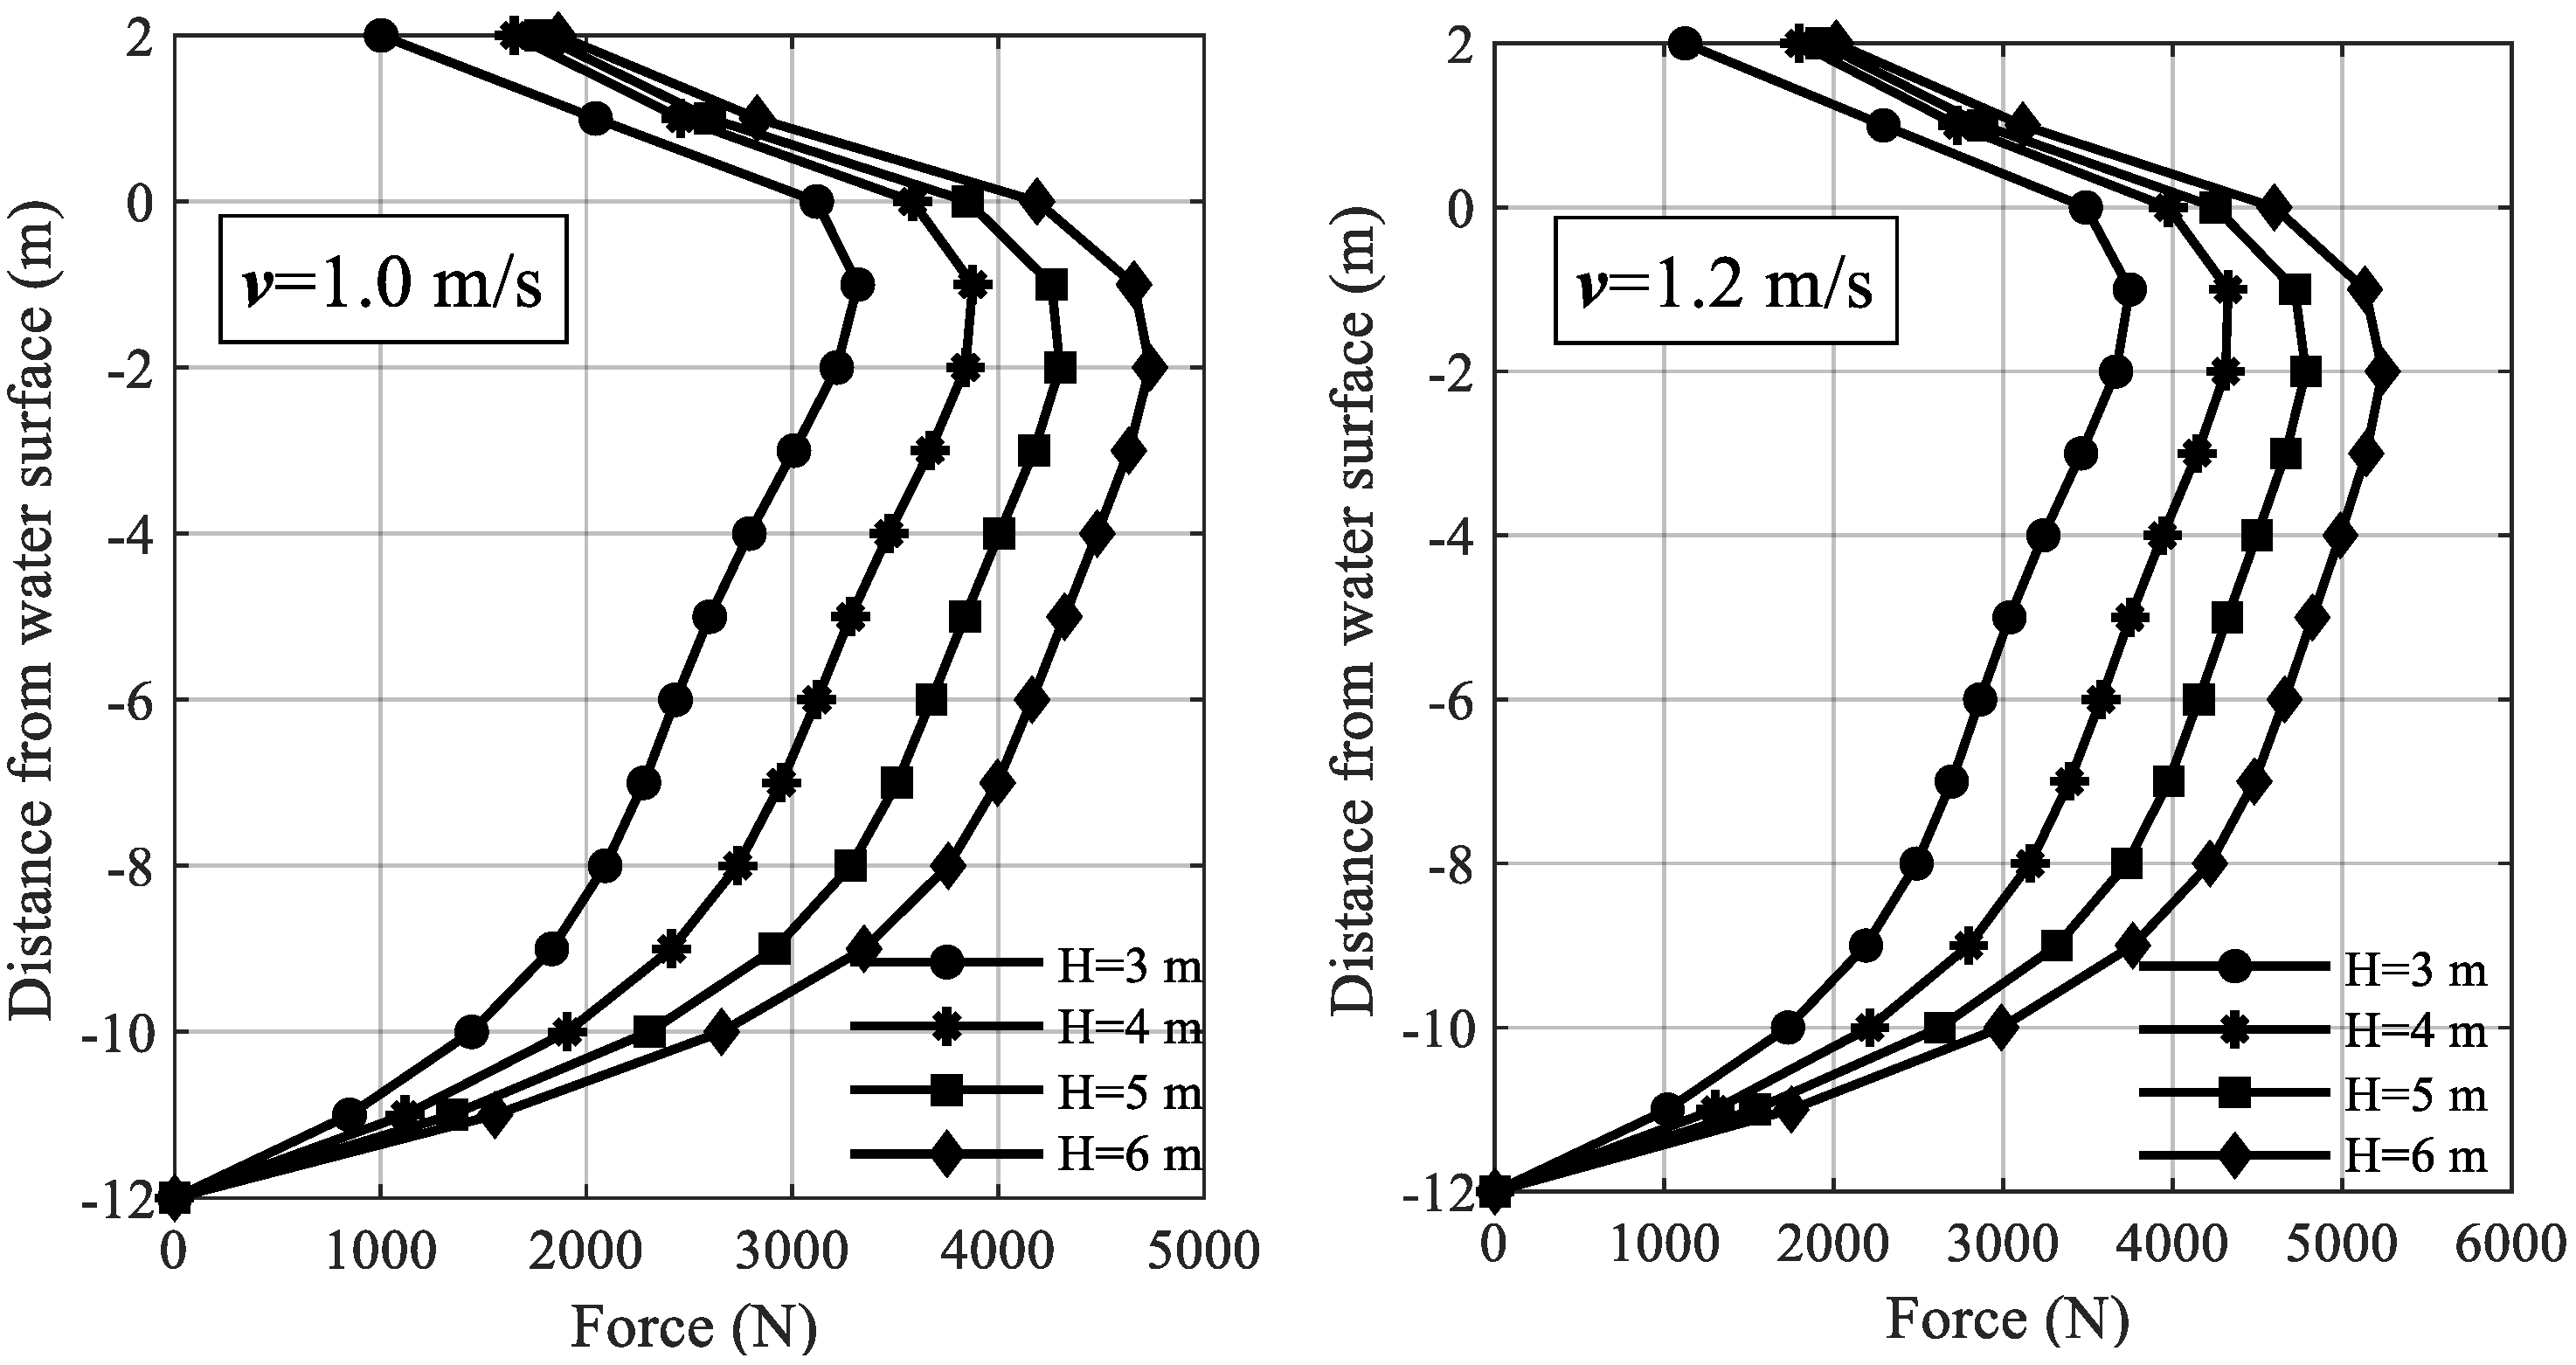
The combined action of waves and currents had a great influence on the force of the net. Regions 1–15 were the positions where the force was the greatest, and these regions accounted for more than 64% of the force of the entire net. Compared with a pure wave load (H = 3 m), the maximum force of the rope and net twine increased by 59.39% and 56.67% (H = 3 m, v = 1.0 m/s), respectively. This study reveals that with the strengthening of the wave loads, the increased rate of the maximum force of the net twine gradually slows down and that pile–net-gapped enclosure aquaculture facilities show better performance in extreme ocean loads;
(iv)
In practical engineering, the vertical rope and horizontal rope need to be reinforced at the connection of the top channel steel and near the still-water level, respectively. The net twine needs to be reinforced at the connection of the top channel steel and near an elevation of (−0.5)–(−2) m.

Author Contributions

Conceptualization, F.G., Z.X. and D.F.; methodology, S.W. and F.G.; validation, F.G., Z.X. and D.F.; formal analysis, S.W.; investigation, F.G.; writing—original draft preparation, S.W.; modification of the manuscript, S.W., Z.X. and D.F.; visualization, D.F.; supervision, F.G., Z.X. and D.F.; project administration, F.G. and D.F.; funding acquisition, F.G. and D.F. All authors have read and agreed to the published version of the manuscript.

Funding

This work was funded by the National Key R&D Plan Program of China (No. 2019YFD0900902) and the National Natural Science Foundation of China (No. 32002441).

Institutional Review Board Statement

Not applicable.

Informed Consent Statement

Informed consent was obtained from all subjects involved in the study.

Data Availability Statement

Not applicable.

Acknowledgments

The authors would like to thank the editors and anonymous reviewers for their careful work and thoughtful suggestions that have helped improve this paper substantially.

Conflicts of Interest

The authors declare no conflict of interest.

References

  1. Pen Culture (Enclosure Culture) as an Aquaculture System. Available online: https://www.fao.org/3/ac181e/AC181E03.htm (accessed on 5 August 2022).
  2. Miyashita, S. The history of marine aquaculture facilities and the net-cage culture system. Fish. Tech. 2008, 1, 13–19. [Google Scholar]
  3. Jiang, G.-Q. A Study on Enclosure Culture Techniques for Large Yellow Croaker, Larimichthys crocea (Richardson)in Epeiric Sea. Mod. Fish. Inf. 2011, 26, 21. [Google Scholar]
  4. JGJ 94-2008; Code for Pile Foundation of Harbor Engineering. Ministry of Construction of the People’s Republic of China: Beijing, China, 2008.
  5. JTS 167-4-2012; Technical Code for Building Pile Foundation. Ministry of Communications of the People’s Republic of China: Beijing, China, 2012.
  6. Fredriksson, D.W.; Swift, M.; Irish, J.D.; Tsukrov, I.; Celikkol, B. Fish cage and mooring system dynamics using physical and numerical models with field measurements. Aquac. Eng. 2003, 27, 117–146. [Google Scholar] [CrossRef]
  7. Fredriksson, D.W.; DeCew, J.C.; Tsukrov, I. Development of structural modeling techniques for evaluating HDPE plastic net pens used in marine aquaculture. Ocean Eng. 2007, 34, 2124–2137. [Google Scholar] [CrossRef]
  8. Tsukrov, I.; Eroshkin, O.; Fredriksson, D.; Swift, M.; Celikkol, B. Finite element modeling of net panels using a consistent net element. Ocean Eng. 2003, 30, 251–270. [Google Scholar] [CrossRef]
  9. Moe, H.; Fredheim, A.; Hopperstad, O. Structural analysis of aquaculture net cages in current. J. Fluids Struct. 2010, 26, 503–516. [Google Scholar] [CrossRef]
  10. Lee, C.-W.; Kim, Y.-B.; Lee, G.-H.; Choe, M.-Y.; Lee, M.-K.; Koo, K.-Y. Dynamic simulation of a fish cage system subjected to currents and waves. Ocean Eng. 2008, 35, 1521–1532. [Google Scholar] [CrossRef]
  11. Zhao, Y.-P. Numerical Investigation on Hydrodynamic Behavior of Deep-Water Gravity Cage. Ph.D. Thesis, Dalian University of Technology, Dalian, China, 2007. [Google Scholar]
  12. Dong, S.; You, X.; Hu, F. Experimental investigation on the fluid–structure interaction of a flexible net cage used to farm Pacific bluefin tuna (Thunnus orientalis). Ocean Eng. 2021, 226, 108872. [Google Scholar] [CrossRef]
  13. Qu, X.-Y.; Hu, F.; Kumazawa, T.; Takeuchi, Y.; Dong, S.; Shiode, D.; Tokai, T. Deformation and drag force of model square fish cages in a uniform flow. Ocean Eng. 2019, 171, 619–624. [Google Scholar] [CrossRef]
  14. Liu, Z.; Wang, S.; Guedes Soares, C. Numerical Study on the Mooring Force in an Offshore Fish Cage Array. J. Mar. Sci. Eng. 2022, 10, 331. [Google Scholar] [CrossRef]
  15. Xu, Z.; Qin, H. Fluid-structure interactions of cage based aquaculture: From structures to organisms. Ocean Eng. 2020, 217, 107961. [Google Scholar] [CrossRef]
  16. Bi, C.-W.; Zhao, Y.-P.; Dong, G.-H. Experimental study on the effects of farmed fish on the hydrodynamic characteristics of the net cage. Aquaculture 2020, 524, 735239. [Google Scholar] [CrossRef]
  17. Bai, X.; Yang, C.; Luo, H. Hydrodynamic performance of the floating fish cage under extreme waves. Ocean Eng. 2021, 231, 109082. [Google Scholar] [CrossRef]
  18. Nobakht-Kolur, F.; Zeinoddini, M.; Ghalebi, A. Hydrodynamic forces in marine-fouled floating aquaculture cages: Physical modelling under irregular waves. J. Fluids Struct. 2021, 105, 103331. [Google Scholar] [CrossRef]
  19. Zhao, Y.-P.; Li, Y.-C.; Gui, F.-K.; Dong, G. Numerical Simulation of the Effects of Weight System on the Hydrodynamic Behavior of 3-D Net of Gravity Cage in Current. J. Hydrodyn. 2007, 19, 442–452. [Google Scholar] [CrossRef]
  20. Liu, Z.; Mohapatra, S.; Soares, C. Finite Element Analysis of the Effect of Currents on the Dynamics of a Moored Flexible Cylindrical Net Cage. J. Mar. Sci. Eng. 2021, 9, 159. [Google Scholar] [CrossRef]
  21. Liu, Z.; Garbatov, Y.; Soares, C.G. Numerical Modelling of Full-Scale Aquaculture Cages under Uniform Flow. In Developments in Maritime Technology and Engineering; Guedes Soares, C., Santos, T.A., Eds.; Taylor and Francis: London, UK, 2021; Volume 2, pp. 705–712. [Google Scholar] [CrossRef]
  22. Gui, F.-K.; Chen, T.-H.; Zhao, Y.-P.; Dong, G.-H. Study of effect on wave mechanical properties for net panel of pile-column type net enclosure by fixations. J. Dalian Univ. Technol. 2017, 57, 285–292. [Google Scholar]
  23. Chen, T.-H.; Meng, A.; Gui, F.-K. Effect of wave height and direction on the hydraulic characteristics of the pile-column type net enclosure aquaculture system. Trans. Chin. Soc. Agric. Eng. 2017, 33, 245–251. [Google Scholar]
  24. Martin, T.; Kamath, A.; Bihs, H. A Lagrangian approach for the coupled simulation of fixed net structures in a Eulerian fluid model. J. Fluids Struct. 2020, 94, 102962. [Google Scholar] [CrossRef]
  25. Martin, T.; Bihs, H. A non-linear implicit approach for modelling the dynamics of porous tensile structures interacting with fluids. J. Fluids Struct. 2021, 100, 103168. [Google Scholar] [CrossRef]
  26. Yang, H.; Xu, Z.; Bi, C.-W.; Zhao, Y.-P. Numerical modeling of interaction between steady flow and pile-net structures using a one-way coupling model. Ocean. Eng. 2022, 254, 111362. [Google Scholar] [CrossRef]
  27. Zhao, Y.-P.; Chen, Q.-P.; Bi, C.-W. Numerical investigation of nonlinear wave loads on a trestle-netting enclosure aquaculture facility. Ocean Eng. 2022, 257, 111610. [Google Scholar] [CrossRef]
  28. Brebbia, C.; Walker, S. Dynamic Analysis of Offshore Structures. Forces Slender Members 1979, 109–144. [Google Scholar] [CrossRef]
  29. Li, Y.; Gui, F.; Teng, B. Hydrodynamic behavior of a straight floating pipe under wave conditions. Ocean Eng. 2007, 34, 552–559. [Google Scholar] [CrossRef]
  30. Li, Y.-C.; Zhao, Y.-P.; Gui, F.-K.; Teng, B. Numerical simulation of the hydrodynamic behaviour of submerged plane nets in current. Ocean Eng. 2006, 33, 2352–2368. [Google Scholar] [CrossRef]
  31. Deval, M.C.; Bök, T.; Ates, C.; Özbilgin, H. Selectivity of PE and PA material coding for rose shrimp (Parapenaus longirostris) in Turkish twin rigged beam trawl fishery. Fish. Res. 2006, 81, 72–79. [Google Scholar] [CrossRef]
  32. Bessonneau, J.S.; Marichal, D. Study of the dynamics of submerged supple nets (applications totrawls). Ocean. Eng. 1998, 25, 563–583. [Google Scholar] [CrossRef]
  33. Mehaute, B.L. An Introduction to Hydrodynamics and Water Waves. In Water Wave Theories; US Department of Commerce, ESSA: Washington, DC, USA, 1976; pp. 195–205. [Google Scholar]
  34. Dong, S.; You, X.; Hu, F. Effects of wave forces on knotless polyethylene and chain-link wire netting panels for marine aquaculture cages. Ocean Eng. 2020, 207, 107368. [Google Scholar] [CrossRef]
  35. Cha, B.J.; Kim, H.Y.; Bae, J.H.; Yang, Y.S.; Kim, D.H. Analysis of the hydrodynamic characteristics of chain-link woven copper alloy nets for fish cages. Aquac. Eng. 2013, 56, 79–85. [Google Scholar] [CrossRef]
  36. Tsukrov, I.; Drach, A.; DeCew, J.; Swift, M.R.; Celikkol, B. Characterization of geometry and normal drag coefficients of copper nets. Ocean Eng. 2011, 38, 1979–1988. [Google Scholar] [CrossRef]
  37. Swift, M.R.; Fredriksson, D.W.; Unrein, A.; Fullerton, B.; Patursson, O.; Baldwin, K. Drag force acting on biofouled net panels. Aquac. Eng. 2006, 35, 292–299. [Google Scholar] [CrossRef]
  38. Nobakht-Kolur, F.; Zeinoddini, M.; Harandi, M.A.; Abi, F.; Jadidi, P. Effects of soft marine fouling on wave-induced forces in floating aquaculture cages: Physical model testing under regular waves. Ocean Eng. 2021, 238, 109759. [Google Scholar] [CrossRef]
Figure 1. Photos of different net enclosure facilities: (a) floating–rope enclosure linked to the shore; (b) pile–net enclosure away from the shore; (c) pile–net enclosure linked to the shore.
Jmse 10 01166 g001
Figure 2. Photos of damaged pile–net enclosure facilities: (a) net breakage; (b) breakage of joint points; and (c) pile breakage.
Jmse 10 01166 g002
Figure 3. (a) Schematic diagram of a pile–net-gapped enclosure aquaculture facility (cm); (b) photo showing the details of a pile–net-gapped enclosure aquaculture facility; (c) schematic diagram of a directed pile–net configuration.
Jmse 10 01166 g003
Figure 4. Schematic diagram of the lumped mass model.
Jmse 10 01166 g004
Figure 5. The local coordinate system (i.e., ξ, η, and τ) used for calculating the force of net twine bars.
Jmse 10 01166 g005
Figure 6. (a) Photo of the wave tank experiment; (b) comparison of the maximum force of the net between the numerical results and experimental results under different wave heights.
Jmse 10 01166 g006
Figure 7. The maximum force distribution of the net system under the action of waves (the solid, red circles indicate the maximum displacement of the net system).
Jmse 10 01166 g007
Figure 8. The maximum deformation of the net system under the action of waves (the black boxes indicate the longer length of horizontal ropes and the red boxes indicate the maximum displacement of the net system).
Jmse 10 01166 g008
Figure 9. The maximum force of the rope and net twine under the action of waves.
Jmse 10 01166 g009
Figure 10. The maximum force of the joint point under the action of waves.
Jmse 10 01166 g010
Figure 11. The maximum force distribution of the net system under the action of currents (the solid, red circles indicate the maximum displacement of the net system).
Jmse 10 01166 g011
Figure 12. The maximum deformation of the net system under the action of currents (the black boxes indicate the longer length of the horizontal ropes and the red boxes indicate the maximum displacement of the net system).
Jmse 10 01166 g012
Figure 13. The maximum force of the rope and net twine under the action of currents.
Jmse 10 01166 g013
Figure 14. The maximum force of the joint points under the action of currents.
Jmse 10 01166 g014
Figure 15. The maximum force distribution of the net system under the combined action of waves and currents (the solid, red circles indicate the maximum displacement of the net system).
Jmse 10 01166 g015
Figure 16. The maximum deformation of the net system under the combined action of waves and currents (the black boxes indicate the longer length of the horizontal ropes and the red boxes indicate the maximum displacement of the net system).
Jmse 10 01166 g016
Figure 17. The maximum force of the rope and net twine under the combined action of waves and currents.
Jmse 10 01166 g017
Figure 18. The maximum force of the joint points under the combined action of waves and currents.
Jmse 10 01166 g018
Figure 19. Variations in the water particle velocity at different distances from the water surface.
Jmse 10 01166 g019
Figure 20. (a) Force ratio of the net twine at the same wave heights with different current loads; (b) force ratio of the net twine at the same currents with different wave loads.
Jmse 10 01166 g020
Figure 21. Maximum displacement values of the net system under the pure waves, pure currents, and the combined wave and current conditions.
Jmse 10 01166 g021
Figure 22. Photos of a copper alloy net used in pile–net enclosure facility.
Jmse 10 01166 g022
Table 1. Parameters in the numerical calculation.
ComponentParameterValue
RopeMaterialPolyethylene
Diameter18 mm
NetMaterialPolyethylene
Diameter3.5 mm
Twine length80 mm
Shrinkage coefficient (horizontal)0.66
Shrinkage coefficient (vertical)0.75
Net height13.44 m
Net width6.736 m
NoduleMaterialPolyethylene
Diameter10.99 mm
Table 2. The wave and current conditions.
CaseWave Height
H (m)
Current
v (m/s)
Wave Period
T (s)
Note
1304.72Pure wave
2405.58
3506.43
4607.27
500.80Pure current
601.00
701.20
801.50
931.04.72Wave + current
1045.58
1156.43
1267.27
1331.24.72Wave + current
1445.58
1556.43
1667.27
Publisher’s Note: MDPI stays neutral with regard to jurisdictional claims in published maps and institutional affiliations.

