1. Introduction
Since 1997, the Korean government has introduced the Terminal Operating Company (hereinafter, TOC) system to convert the national piers from a state-owned system to a state-owned private system. This is a system that allows private TOCs to lease railway station, berths, aprons, yards, warehouses, and loading/unloading facilities for a certain period of time by unit pier [
1,
2]. The TOC system contributes to improving the efficiency and productivity of the port, as well as to increase the service level for port users by proposing an advanced port operation method of private sectors [
3]. However, in the trends of economic globalization, transfer of property or operating rights from the public to the private sector has a number of consequences from the way in which key functions in ports are performed, such as rent [
4].
The Port Rail Station Operating Company (hereinafter, PRSOC) leases and operates the port railway station of the PA as the same manner as the TOC contract. PRSOCs in some ports can also provide intermodal transportation by rail and earn revenue from that activity, and they can also manage inland terminals and earn revenue from handling the same containers that they use to cover negative outcomes, among others, at the beginning of handling at a particular terminal. The loaded containers are transported by rail transport to the inland container depot. The port railway station is located in or near the container terminal and is a facility for loading and unloading containers on wagons.
In Korea, annual rent fees paid by the PRSOC to Port Authority (hereinafter, PA) account for about 66% of PA‘s total sales as of 2015, and are the most important source of income for PA [
5]. Controversially, the calculation of the proper rent fees for the port railway station has been continuously raised between the PA and the PRSOC. The PA wants to receive a rent fee with the goal of recovering the investment cost, while the PRSOC wants to pay rent to the extent that it can generate an appropriate profit. From the perspective of PRSOC, the annual capacity of the port railway station and its demand are a major factor in determining the rent because PRSOC’s loss is due to overestimation of demand. In order to reasonably estimate the rent fee, this study attempted a method of estimating the capacity-based demand of the rail station. Rail station capacity encounters a bottleneck when measuring railroad track and rail mounted gantry crane (hereinafter, RMGC) capacity. In other words, arbitrary demand estimation leads to operating losses for PRSOC and may also cause losses to investors because investment costs cannot be recovered.
This study is a case study on the calculation of the proper rent fee based on the lawsuit case between PA and PRSOC at the southern port railway station in the Busan new port. The port railway station in the Busan new port has been in operation since 2013. The PRSOC asserts that a continuous loss has occurred in the operation of the port railway station owing to the overestimated rent fee determined by the PA. This study provides a systematic method for determining the proper rent fee of a port railway station with a litigation case study of Busan port container terminal using the discounted cash flow (hereinafter, DCF) method. The rent fee calculation method by DCF allows the lessor to determine the level of rent at which investment costs can be recovered and the rent fee level at which the appropriate return on investment can be achieved from the lessee’s point of view. Therefore, this study expects to derive an objective and reasonable rent fee acceptable to the lessor and lessee by applying a standardized rent fee calculation system.
2. Literature Review
There are few studies on the calculation of rent fee for the port railway station. This is because the government or PA, the leasing entity of the port railway station, has conventionally calculated and applied the rent fee [
6]. In Korea research, Kim (2002) argues that the rent for the port railway station operated by PRSOC should be calculated based on profitability [
7]. However, there is a problem that the future cash flow and time value of money are not considered when calculating the rent based on the profitability of the port railway station in the previous year. Lee and Lim (2000) presented the concept of recovering the investment cost by repaying the principal and interest equally every year on the construction cost and annual investment cost recovery of container ports [
8].
The port rent calculation system is largely classified into a flat or fixed rate system, a mini-max rate system, and a share revenue system [
9]. A flat or fixed rate system is a method in which the lessor charges the lessee a fixed amount of rent per area or per berth for a specific period of time [
10]. As the rent is fixed in this system, the lessor and lessee can estimate the loss due to the lease in advance, and it is desirable to use it when the expected volume of goods can be accurately predicted. However, there is a disadvantage that a large loss may occur to one of the contracting parties if the calculated amount of rent is different from the actual amount to be processed [
11]. In addition, the fixed rent method focuses on stably recovering the investment cost of PA. In the case of countries other than developed countries, as ports are built on cheap sites, calculating the rent fee of the fixed rent method of recovering investment costs is not a reasonable method.
A mini-max rate system is a method in which the minimum (basic) rent fee and the maximum rent fee (based on amount or quantity) are set, and the rent is charged according to the performance within the range [
12]. If the lessee earns less than the minimum rent, the lessee incurs a loss, whereas if the lessee earns more than the maximum rent, the lessee earns a profit. In applying the mini-max rate system, the lessor guarantees the minimum rent fee and can receive the maximum rent fee depending on the cargo volume. From the perspective of the lessee, it is possible to secure the operating profitability of the lessee by setting the minimum and maximum rent fee based on the income and expenses of the lessee. This method protects the lessor (PA) from reduced cargo throughput and provides incentives for the lessees (PRSOCs) to increase cargo throughput. Thus, this can potentially lead to a win–win situation between the lessor and the lessee because this reduces the risk of leasing the port railway stations for the lessor (PA) and provides incentives to the lessees (PRSOCs) to attract more cargo volume. However, the mini-max rate system has the disadvantage of relying heavily on the forecast of cargo volume.
A share revenue system is a contract method to avoid fixed rent fees [
13]. This is a method in which the lessor and lessee divide and share the income from the amount to be processed in excess of the basic amount set at the time of calculating the basic rent and calculating the basic rent. Under a share revenue system, rental losses due to inaccurate volume forecasting and unexpected losses of lessees can be reduced or avoided to a large extent. In order to adopt a share revenue system, it is very important to set the size of the basic volume, the section of the excess volume, and the revenue sharing ratio.
Most of the world’s major ports, including Japan, Taiwan, the Netherlands, Germany, and the United States, have introduced a fixed-rate system and are regularly raising rent fees to reflect the inflation rate [
14]. Roy Van Den Berg et. al. (2017) assert that the ecosystem perspective is central to the understanding of pricing decisions of port authorities and that various pricing issues deserve more attention. Long-term profit maximization of seven pricing principles implemented by PA is central subject of this study [
15].
In summary, a standardized rent fee calculation system is required to achieve the improvement in port productivity and service quality while adequately recovering the PA’s investment cost. Therefore, it is necessary to standardize the calculation method of the rent fee using the DCF method and establish a principle for determining an appropriate level of rent by comparing the rent fee level from the perspective of PA’s investment cost recovery and the perspective of maintaining the operating balance of PRSOC.
3. Methodology
The increasing role of private companies in the port industry causes conflict between PA and PRSOCs owing to the rent fee of infrastructure. The PRSOC has become interested in financing port equipment and parts of the superstructure, like office buildings, and also the construction of the entire rail station, including the railway, land reclamation, yard, and access road. This project needs different project financing schemes such as BOT (build-operate-transfer), BOO (built-own-operate), and BOOT (build-own-operate-transfer). Each is designed to mobilize private capital while balancing public and private interests [
16].
The relevant issues concerning concessions in port railway stations include the following: the process of granting concessions, the criteria used to grant concessions, the duration of concessions, and the capabilities required to acquire concessions [
17]. Among these criteria, capacity, guaranteeing minimum throughput per year, and duration are the main topics of discussion. Capacity calculations have to demonstrate that the terminal layout will have the necessary capacity to accommodate the projected throughput. The Port Authority frequently have to guarantee a certain minimum throughput per year. If this minimum is not met, the operator may have to pay a penalty, or a part of the terminal may even be withdrawn from the concession [
18].
However, in the case of PRSOC, its capacity and minimum guaranteed volume are not linked. In this case, it is necessary to calculate the appropriate rent using a method different from the existing method. In this study, data such as investment cost, operating cost, and sales required for the construction of the rail station were collected. Based on these data, the proper rent fee is proposed by analyzing the cash flow on the premise of operation for the next 30 years. This study premises that the PRSOC efficiently operates the port railway station in order to calculate the proper rent for the port railway station. Efficient operation means increasing port competitiveness and minimizing total costs [
19]. The revenue of the port railway station is calculated using the port railway station’s cargo capacity, the port capacity of the surrounding terminals, and the expected throughput ratio considering the port railway station. The loading/unloading cost of the port railway station is calculated by referring to the loading/unloading cost of the existing PRSOC. From the point of view of the PA as a lessor or investor, the proper rent fee is calculated as the total investment cost that can be recovered during the rental period. From PRSOC’s point of view, PRSOC calculates the level of rent fee at which the operator can secure the proper rate of return. The proper rent fee for the railway station is calculated using the DCF method, which is the most commonly used method in evaluating the firm value, and is calculated as an amount equal to the present value of net cash flows and the present value of rent fee during the rental period. All data used in this study are directly provided by PA and PRSOC, and there is no problem with reliability and fairness as all data are used in actual litigation.
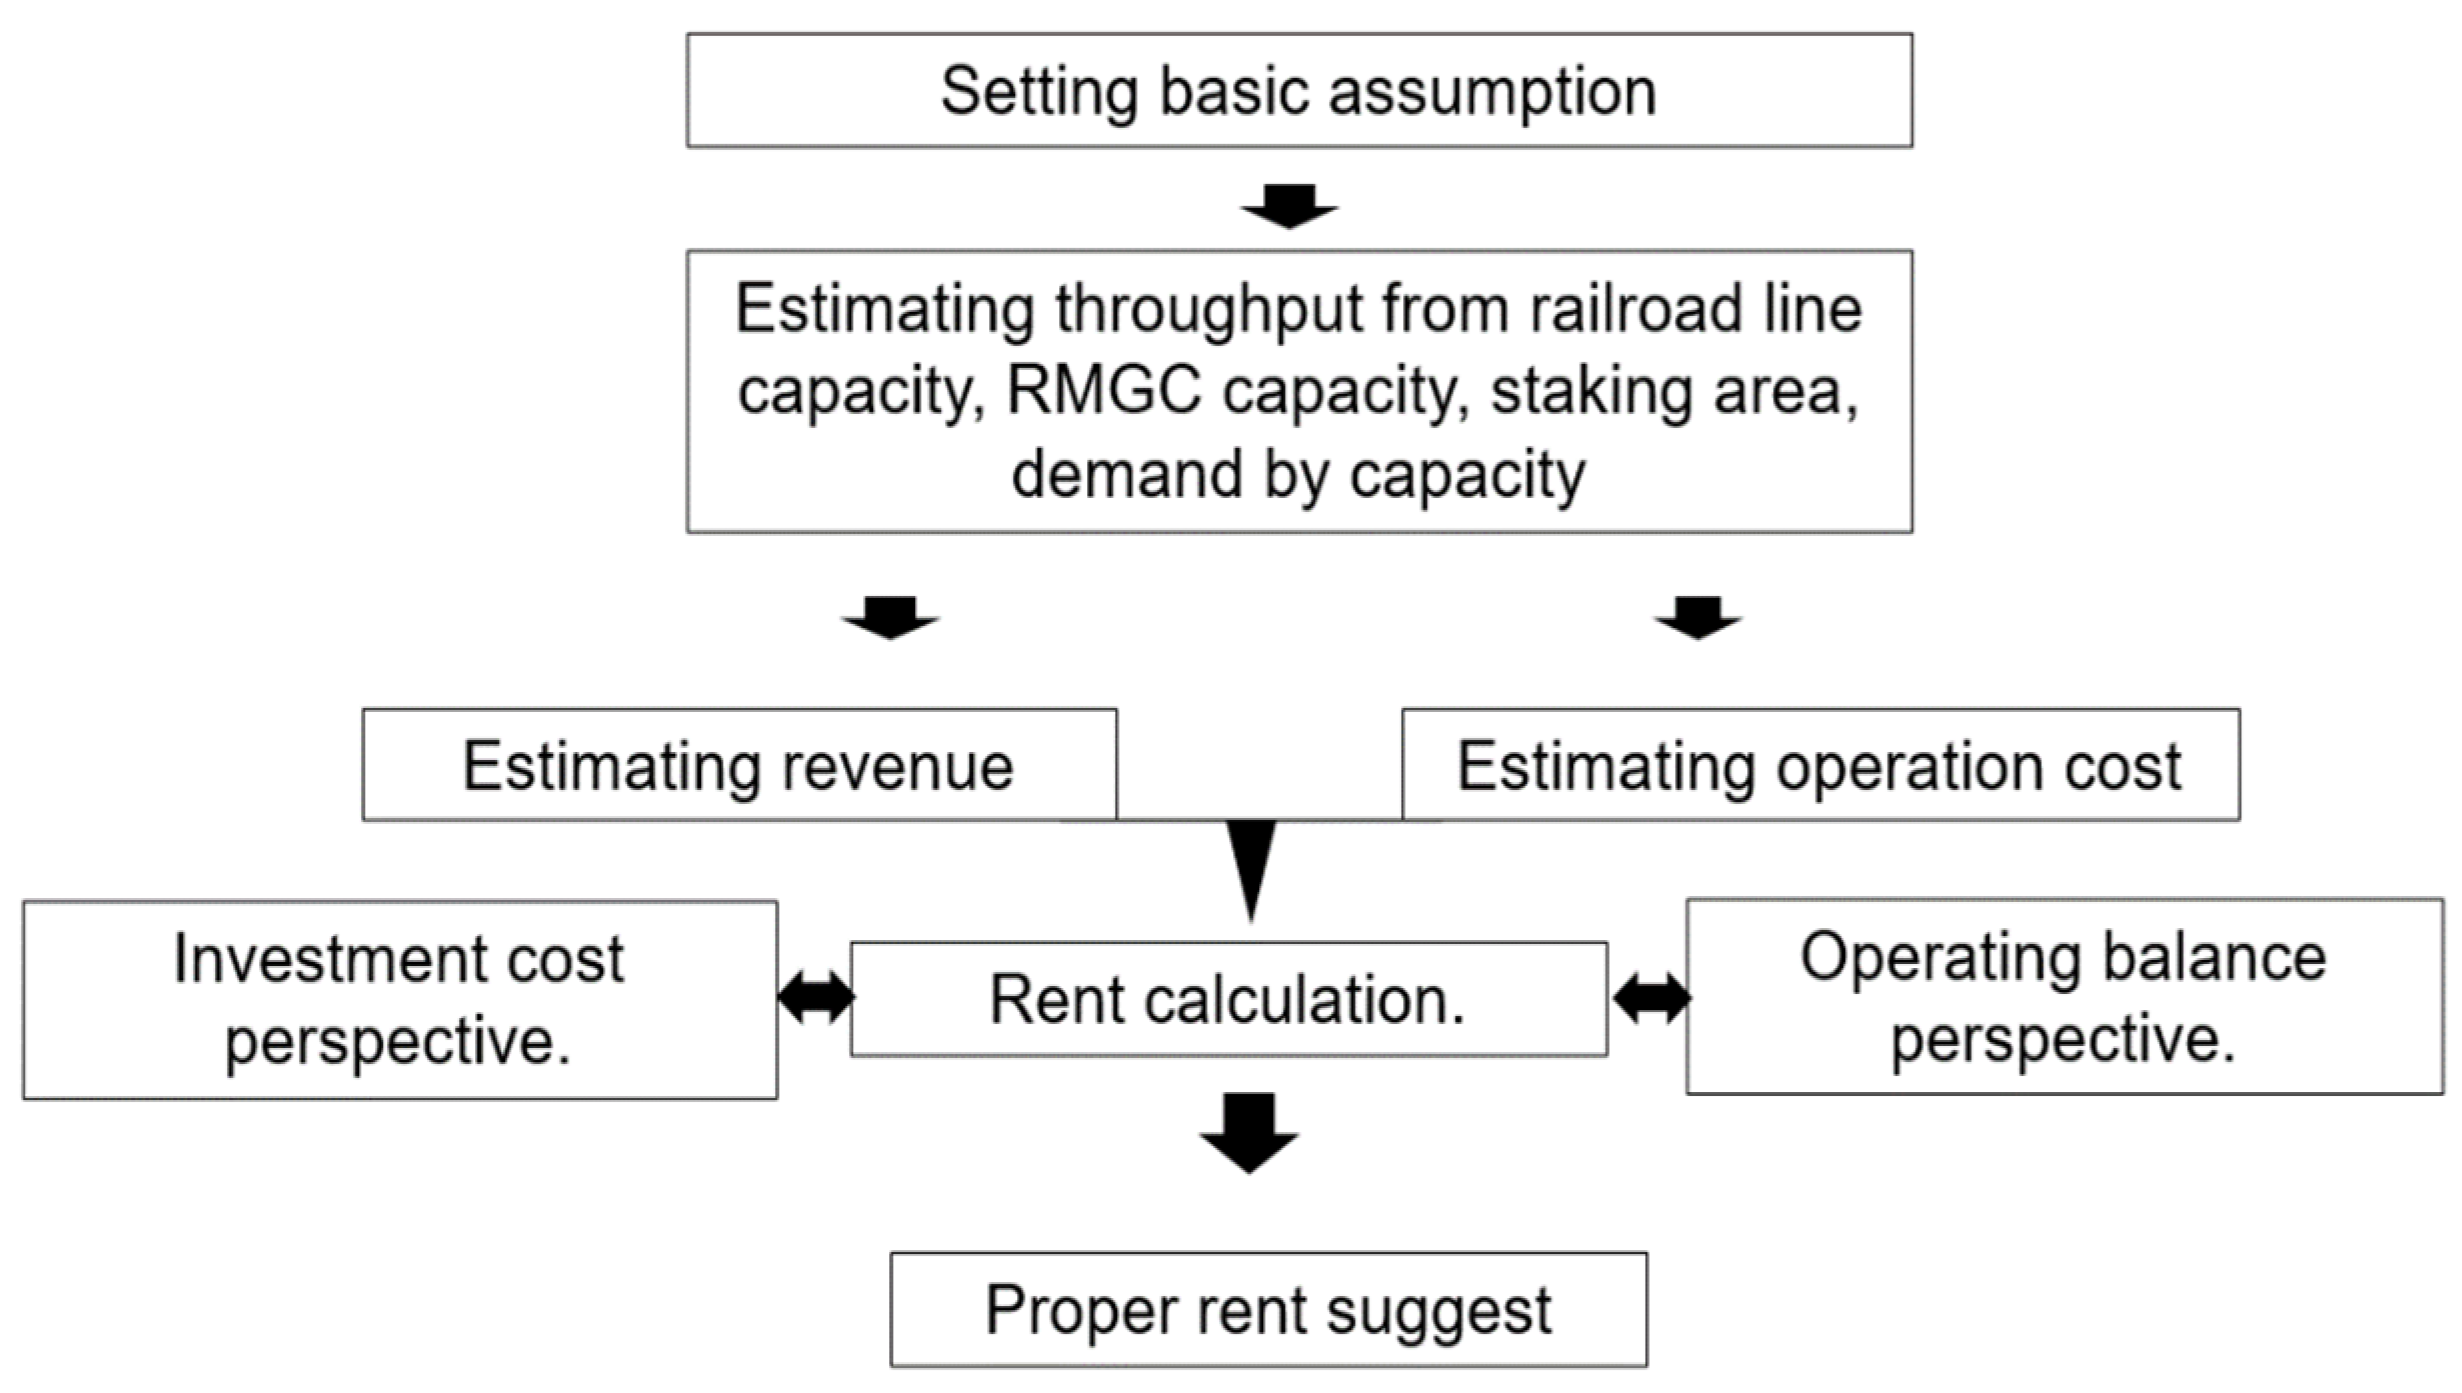
In conclusion, the appropriate level of the port rent fee is finally determined by the agreement between the lessor and the lessee. In this case, the most important criterion for the upper limit of the rent is the level that guarantees a reasonable profit for the lessee according to the operation of the port (rent from the perspective of maintenance of the operating balance). On the other hand, the lower limit of the rent will be the level at which the lessor can recover the investment cost (rent from the point of view of investment cost recovery) [
20]. The structure of this research is presented in
Figure 1 below.
4. Background and Material
4.1. Background of Litigation
This study is based on the litigation case between PA and PRSOC in Korea to calculate the proper rent fee of the port railway station. The port railway station operating on the southern pier of the new port of Busan is owned by PA and was leased to PRSOC for 30 years at 1 January 2013.
The expected cargo volume at the time of lease was 320,000 TEU per year, but as a result of operation, the actual container handling volume was 186,000 TEU per year. This was only 58% of the amount offered by PA; therefore, PRSOC recorded a loss for 5 years. The PRSOC asserts that a continuous loss has occurred in the operation of the port railway station owing to the overestimated rent fee determined by the PA. An issue in the litigation between PA and PRSOC is the reliability of the estimate of demand for volume. The difference between the estimated and actual processing volume is due to overestimation of port railway station capacity or overestimation of port railway station demand.
In 15 November 2017, PRSOC (Plaintiff) filed a lawsuit against PA (Defendant) based on five reasons for overestimating the capabilities of the port railway station. First, the equipment handling capacity has a direct effect on the port railway station’s handling volume, but, in reality, 80% of the estimates are handled because of equipment maintenance, the imbalanced volume of round-trip trains, and non-loading cargo. Second, the maximum amount of transport for one train is 66 TEU, but, because of the train operation method of the Korea Railroad Corporation (hereinafter, KORAIL) and imbalanced volume of round-trip trains of transport companies, 47 TEU per train is actually transported. Third, trains can be accommodated in up to three lines of the southern port railway station, but in reality, trains enter and exit at the same time. Thus, there is no choice but to use two lines at all times. Fourth, it was not possible to increase the number of input equipment owing to insufficient infrastructure such as ground subsidence. Finally, because of the change in the operation policy of the KORAIL, the volume of import and export goods increased by road transport rather than by rail.
In conclusion, the main issue of the lawsuit is that the overestimation of the capacity leads to a high rental price, and as a result, PRSOC’s deficit has continued for five years. In order to solve this problem, this study intends to derive a proper rental rate from the perspective of the investor (PA) and the operator (PRSOC) based on the estimation of the capacity and derived demand in a scientific way.
4.2. Rent Fee Calculation System for Case Study
The lease contract of the port railway station between PRSOC (Plaintiff) and PA (Defendant) started in 2013, and the year of litigation was 2017. Therefore, the proper rent fee at issue in this lawsuit is calculated as of 31 December 2017. In the case study, the railroad track is 4.3 km from the last point of the Busan New Port entrance railroad to the inside of the southern container pier, and the total site area is 54,950 m2, including one delivery yard (17,380 m2), a container yard (6800 m2), and an operating building (288 m2). It consists of a sub-main line (600 m ∗ 2 line) and a working line (604 m ∗ 2 line).
The rent fee calculation of this case study applies the average USD/KRW exchange rate of 1132 KRW from 2018 to 2021, following a recent similar Korean case study [
21,
22].
In the past, the rent fee calculation system for the port railway station was based on the profit-sharing system. However, a problem appeared in the rent calculation system under the profit-sharing system. Under the profit-sharing system, the basic rent fee is calculated according to the port rental system for TOC or the State-Owned Property Act, so there are frequent cases in which the return on investment is insufficient. In particular, the performance of the port railway station is only about 60% of the expected volume, and the balance of the TOC has deteriorated significantly, revealing the limitations of the profit-sharing system. Accordingly, from 2009, some of the port railway stations in Busan Port and Gwangyang Port were converted to a fixed rental system. Therefore, even in this study case, the proper rent fee will be calculated by the fixed rent system.
4.3. Capacity Calculation of the Port Railway Sation
For the estimation of annual port railway station capacity, the number of workable tracks are to be determined. In the port railway station of this case study, four lines, which consist of the opportunity line, main line, work line 1, and work line 2, are installed, but only three lines are available, because the line of opportunity has to be passed by the locomotive.
The logic of the process of estimating the capability of the port railway station is as follows.
In the Formula (1), daily working hours per train is obtained by total working hours of lines dividing by number of lines. The case study applies 20 h as daily working hours per train (
Table 1).
Working hours per train is obtained by Formula (2).
In the case study, the number of handling containers per train (62 VANs) was derived from doubling train transportation capacity (31 VANs) in considering unloading and loading. RMGC handling capacity per hour (25 VANs) is dependent on equipment specification. The utilization rate is 80% and the number of RMGCs is 2 based on operational data. The waiting time for freight on the train is 25% of the pure working time.
The train waiting time on line reflects that it is impossible to work on two tracks other than the work track owing to the characteristics of the equipment. In this study, the train waiting time on line is double the train work time (3.8 h) based on operational data.
The study applies three lines, 25 days per month, 12 months per year, and 1.5 TEU conversion factor as parameters in the Formula (1). The annual handling capacity of railway station is derived as 288,000 TEU by Formulas (1) and (2).
6. The Perspective of PRSOC for Rent Fee Calculation
6.1. Basic Assumption
Five basic assumptions are applied to calculate the proper rent from the perspective of the operating balance of the PRSOC. First, we calculate the rent fee on the premise that the PRSOC efficiently operates the port railway station by handling the volume of the appropriate capacity, applying an appropriate unloading/loading fee, possessing appropriate equipment, and possessing the appropriate number of personnel. In addition, if necessary, data from other PRSOCs were reflected on and analyzed. Second, the rent calculation period is 30 years (2013–2042) from 2013, the year of operation commencement. Third, as the base data for estimating revenue/cost, the actual volume and financial data of the PRSOC were used because the port railway station at the southern container pier of Busan New Port has been in operation since 1 April 2013. Fourth, the rent increase rate and the inflation rate applied at the time of reinvestment are related to the operation of the port railway station, and are the simple arithmetic average of 0.11% for the remaining five years, excluding the highest (6.71% in 2011) and lowest (−4.01%) producer price increases applied for the last 7 years. Fifth, PRSOC’s rate of return to be applied as a discount rate is 5.36%, which reflects the inflation rate of 0.11% to the real rate of return of 5.25% after tax based on “Busan New Port Phase 2–4 Container Terminal Private Investment Project Concession Agreement (27 August 2013)” [
23].
6.2. Estimation of Unloading/Loading Income
First, the cargo volume of port railway station applies the ‘transport volume of the southern container pier as of 2017 year-end. Second, the cargo handling unit price is estimated as the total handling fee from the time of operation start (1 April 2013) to 30 June 2017 divided by the total cargo volume (TEU). Considering past experiences such as the cargo handling unit price increase in 2013, it is estimated that the price rises by about 5% every 5 years.
The unit unloading/loading price of cargo handling by year is shown in
Table 4.
Based on the volume of port railway station and the estimated unloading/loading price per unit, the estimated unloading/loading income is calculated by multiplying the annual cargo volume and the unit unloading/loading price. The annual volume reflects the smaller of the individual estimated volume and the cargo unloading capacity (288,000 TEU). The estimated unloading/loading income of the port railway station is calculated using Equation (6), and the result is shown in
Table 5.
Railroad income is the income obtained from the shipper through rail transportation from the port railway station to a place outside the terminal desired by the shipper, or from a place outside the terminal to the port railway station.
6.3. Estimation of Equipment Investment and Reinvestment Costs
Two major costs should be considered for the port railway station to estimate the proper rent fee of PRSOC equipment investment costs and reinvestment and operating costs.
First, the investment amount includes only actual direct costs, but excludes interest on construction funds that are not directly covered. The equipment investment amount and reinvestment plan are estimated to USD 5,583,881, as shown in
Table 6.
In the case of useful life, 20 years is applied for RMGC equipment following the Korean government guideline [
24], and it is estimated that the residual value will be returned at the end of the operating period. It is assumed that the equipment (container box) is reinvested every 9 years, as proposed by the Korean government guideline [
25], but it is assumed that there is no residual value.
As for the reinvestment assumption, it is assumed that the RMGC and system facilities are maintained at the same scale, as the expected volume from the time of the lawsuit to the end of the estimation period is less than the maximum production capacity (360,000 TEU per year). RMGC and system facilities are reinvested by reflecting the inflation rate at the end of their useful life, but it is assumed that there is no additional investment related to system facilities that were initially invested.
6.4. Estimation of Operating Costs
The operating costs of the port railway station consist of the cost of sales and sales and general administrative (SG&A) expenses. In
Table 7, the composition of cost of sales proposed by the PRSOC increases every year from USD 1,550,045 in 2013, and it appears to reach USD 1,045,955 in 2017.
The transportation cost of PRSOC consists of rail usage fee paid to KORAIL and shuttle fee paid to each entities between container terminal and the port railway station. As the profit and loss through railroad are separately generated and the profit and loss through the shuttle are difficult to reasonably estimate, it is not appropriate to reflect it in the rental fee calculation.
Heavy equipment management costs (HEMCs) are an aggregate of RMGC equipment fuel costs (FUEL) and maintenance and repair-related management costs (MRMCs). As the amount of unloading/loading increases, the management cost of heavy equipment increases. When this cost is applied for the next 30 years, the ratio of the cargo volume to the total cost HEMC and FUEL incurred in the past is applied. The method of calculating utility costs is the same as the former.
Labor costs (LCs) consist of salaries including severance pay (SSP), part-time worker wages (PWWs), and welfare benefits (WBs). Retirement benefits were estimated to be 1/12 of the annual salary accrued, and welfare expenses were estimated in the future by calculating the ratio of past average salary accrued benefits.
The depreciation cost (DC) is calculated using the straight-line method for the useful life of the RMGC equipment.
The estimated cost of sales (actually incurred from 2013 to 2017) reflecting all of the above adjustments is as shown in
Table 8. The total estimated cost of sales for 30 years is USD 38,321,054.
Selling and general administrative (SG&A) expenses consist of variable and fixed costs. Variable costs (VCs) include vehicle maintenance costs (VMCs), repair costs (RCs), consumables costs (CCs), payment commissions (PCs), travel costs (TCs), transportation costs (TRCs), book printing costs (BPCs), education and training costs (ETCs), miscellaneous costs (MCs), and entertainment costs (ECs). As VCs are all related to the unloading volume, VCs are calculated by applying the unloading ratio per total TEU.
Fixed costs are the costs regardless of volume and consist of taxes and duties, insurance premiums, and telecommunication costs. The fixed cost is estimated by reflecting the producer price inflation rate in the average amount incurred for 2014~2016 calculated on an annual basis.
Estimated sales and administrative expenses (actually incurred from 2013 to 2017) reflecting all of the above adjustments for 30 years are USD 11,776,647, as shown in
Table 9.
6.5. Calculation of Proper Rent Fee from the Perspective of Operating Balance
From the point of view of PRSOC, the proper rent fee means the rent fee level at which the PRSOC can secure a proper rate of return. Therefore, the level at which the present value of the net cash flow calculated from the income and expenditure of the PRSOC coincides with the present value of the rent fee paid to the PA is calculated as the proper rent fee for the PRSOC. Equation (11) presents the proper rent fee from the perspective of the operating balance of the PRSOC.
The rent is calculated using the DCF method based on the income and expenses for the operation of the port railway station estimated above. Using Equation (11), the present value of the net cash flow for the operation of the port railway station and the present value of the rent for the port railway station coincide in 2017. The fair rent calculated from the PRSOC point of view was USD 355,751, and the cash flow and rent for the operation of the port railway station are presented in
Table 10.
A summary of the results of the proper rent fee lawsuit for the port railway station between PA and PRSOC is shown in
Table 11. As of the end of December 2017, at the time of the lawsuit, the proper rent fee from the PA point of view was USD 397,054, while the proper rent fee from the PRSOC point of view was USD 355,801.
Even if the rent level of the port railway station is adopted in this case from the viewpoint of maintenance of the operating balance, it is not expected that there will be a great deal of difficulty in securing reinvestment resources. In the case of the defendant (PA), as a public institution that develops and manages the port, the port railway station is a functional facility constituting the port facility, so the rent is calculated for efficient management of the entire port rather than securing revenue through the port railway station. It is considered preferable to do so. Therefore, it is reasonable to calculate the rent for the port railway station at the southern container pier of Busan New Port at USD 355,801, which is the rent from the viewpoint of maintenance of the operating balance suggested by the PRSOC.
7. Conclusions
It would be appropriate to determine the proper rent fee between the lower limit of rent from the viewpoint of preserving the operating profit of the lessor and the upper limit of rent from the viewpoint of recovering the investment cost of the lessee.
The rent fee of the port railway station is an important financial resource that is reinvested in additional port construction, accounting for most of the income from the PA’s (lessor) point of view. Thus, the PA must set the rent fee at a level at which the investment cost can be recovered under reasonable and objective standards. However, as the PA’s return on investment can be seen as a guideline rather than an absolute standard for rent fee determination, a proper level of rent fee should be determined in consideration of the PRSOC’s (lessee) operational balance preservation aspect, which is the absolute standard.
The PRSOC will sustain to operate the port railway station in a long-term and stable manner while setting the rent fee at a level that can secure an appropriate operating balance. From the perspective of PRSOC, the rent fee occupies the highest portion of the cost, thus it is an important factor in determining the operating balance. The final decision on the rent fee level will be made by negotiations between the lessor and the lessee, but in general, the upper limit (guideline) is a level at which the lessor can recover the investment cost and the lower limit (absolute standard) will be a level that guarantees a reasonable profit for the lessee. Therefore, it is very important to ensure the objectivity and consistency of rent fee calculation by introducing a standardized rent fee calculation system in order to balance the profits between the lessor and the lessee.
The DCF method allows objective and consistent comparison of rent fee levels from the PA and PRSOC perspectives. From the PA’s (lessor) point of view, the rent fee is determined at a level at which the present value of the investment for a certain period (recovery period) and the present value of the rent to be recovered coincide. Rent from the perspective of the PRSOC (lessee) means the rent fee at a level at which the PRSOC can achieve the operating balance under the appropriate return on investment (internal rate of return or discount rate). From the PRSOC’s point of view, the rent fee is determined as the rent for the year in which the present value of future net cash inflows based on cargo handling income, cargo handling costs, and reinvestment costs coincides with the present value of rent fee. Therefore, while standardizing the calculation method for the port railway station rental using the DCF method, it is reasonable to obtain the standard for determining the proper rent fee by calculating and comparing the rent fee level from the perspective of the PA’s investment cost recovery and PRSOC’s operating balance maintenance perspective. In addition, only standard and reasonable factors should be selected and applied to the rent fee calculation structure on the premise that normal volumes of the appropriate level of loading/unloading capacity are handled, excluding abnormal operating structures that handle excessive volumes among the current operating scale and operating conditions.
The purpose of this study is to calculate the proper rent fee for the port railway station in Busan New Port based on the case of litigation between PA and PRSOC. The method of calculating the proper rent fee for the port railway station is very different from the point of view between the PA and PRSOC. The PA calculates the rent fee with the goal of recovering the investment, while the PRSOC intends to pay the rent to the extent that it can preserve operating profit. This study investigates the proper rent fee from the perspective between PA and PRSOC by applying the DCF method. The base year for the analysis is 31 December 2017, the year the litigation occurred, and the target period for estimating proper rent fee period is set as 30 years from January 2013 to 31 December 2042. As a result, the proper rent fee from the perspective of the PA is USD 397,045, while the PRSOC’s proper rent fee is USD 355,801. Thus, it is reasonable to calculate the proper rent fee for the port railway station within the range of at least USD 355,801 and maximum of USD 397,045.
This study contributes in that it is a practical study on the standardization of the rent fee calculation system for the port railway station. In order to standardize the rent fee calculation system for the port railway station, the DCF method should be applied. Next, on the premise that PRSOC efficiently operates the port railway station, the rental period, discount rate, inflation rate, and rent fee increase rate should be reasonably estimated. In addition, it is necessary to standardize the unloading/loading volume (annual handling volume) for rent fee calculation, cost of sales per TEU, labor cost, investment costs, and heavy equipment maintenance costs.
However, there is a limit to calculating and applying a realistically proper rent fee because the rental value differs depending on the facility and operational capabilities of the railway station. The facility capacity of railway stations can be standardized based on the unloading capacity. On the other hand, it is difficult to apply a uniform standard for each port railway station because operating capacity is determined by the specifications and number of facilities, operation method, manpower structure, and sales capacity. Therefore, it is necessary to standardize the rent fee calculation system by reflecting the difference between the port railway station’s facility capacity and operational capacity. Moreover, this study focuses on the Korean domestic port, the Busan New Port, so there is a limitation to apply worldwide practices. In future research, it will be possible to calculate the rent fee based on more diverse perspectives or methodologies. Estimation of operating cost has a great effect in terms of cash outflow when calculating rent fee from the perspective of the operating balance for PRSOC. Therefore, accurate and detailed operating cost estimation must be made by introducing a cost function through statistical analysis techniques, among others. In addition, it is necessary to calculate the appropriate operating cost by applying the activity-based costing method that has been recently used in the accounting field. In order to properly set the amount of cargo required for rent fee calculation, more scientific and diverse techniques such as simulation should be introduced. Finally, a standardized rent calculation system for the facility capacity and processing performance of the port railway station should be introduced.


