Article

Structural Analysis and Experimental Study on the Spherical Seal of a Subsea Connector Based on a Non-Standard O-Ring Seal

1
College of Mechanical and Electrical Engineering, Harbin Engineering University, No. 145 Nantong Street, Nangang District, Harbin 150001, China
2
College of Intelligent Systems Science and Engineering, Harbin Engineering University, No. 145 Nantong Street, Nangang District, Harbin 150001, China
*
Author to whom correspondence should be addressed.
J. Mar. Sci. Eng. 2022, 10(3), 404; https://doi.org/10.3390/jmse10030404
Submission received: 19 February 2022 / Revised: 7 March 2022 / Accepted: 9 March 2022 / Published: 10 March 2022
(This article belongs to the Special Issue Frontiers in Deep-Sea Equipment and Technology)

Abstract

:
Underwater oil and gas pipelines are prone to alignment differences and angle offsets during docking, and the spherical flange connector can address this problem. Its main function is to enable compensation of the different angles of the pipeline during docking and to apply a non-standard spherical sealing structure using O-rings to the connection. In this paper, the study of a spherical sealing structure using O-rings was based on a spherical structural model of the connector. The Mooney–Rivlin constitutive equation and material parameters of the O-ring were determined according to nonlinear theory. The structure of the non-standard spherical sealing groove was designed and analysed with reference to the standard sealing groove, the calculation expression of the spherical groove specific size was deduced, and the width and depth of the groove were determined. A finite element analysis of the non-standard O-ring sealing structure was carried out using ANSYS Workbench software; the effects of different pressures and compression ratios on the O-ring sealing performance were analysed and studied in terms of von Mises stress, contact pressure and contact width of different contact surfaces so as to determine a more reasonable compression ratio in the sealing structure. Finally, the theoretical analysis of the non-standard spherical sealing structure using O-rings was validated by testing, and it was proven that it could maintain a good seal under high pressure.

1. Introduction

As a key part of offshore oil and gas engineering equipment, subsea connectors are mainly used for pipeline connection in subsea production systems [1,2]. The working environment of underwater connectors features high pressure and low temperature, and the influence of ocean currents [3]. In recent years, as a flexible structure that can realize multi angle transformation, a spherical structure is increasingly being used in the design of underwater connectors. In underwater pipeline construction, problems related to alignment differences of the parts being connected may occur due to installation error; the advantage that the spherical structure has is that it can achieve angle compensation, and so is a good solution to this problem.
Scholars have conducted some research on spherical structures. In 1976, Watkins et al. [4] designed a flexible support joint, which is composed and connected by ball structure and socket-like structure. The socket-like structure is fixed on the support, and the structure is movable and can be flexibly adjusted. If the connecting structure is damaged due to corrosion while in use, it is difficult to replace, and the maintenance cost is high. In 2003, Moog et al. [5] proposed a flexible joint for transporting oil or natural gas, which can achieve a certain angle of deflection. The sealing structure is made of rubber, however, the spherical structure, the rubber sealing structure and the shell structure of this device are one unit, and the repair cost is high if the rubber is damaged. In 2011, Moon, Il Yoon [6] applied a spherical seal in the low-temperature and high-pressure pipeline of a liquid fuel rocket engine, and a hermetic seal was realized inside it.
As for the spherical seal, YL Feng et al. [7] proposed a spherical connector for deep-sea mining systems, which adopted two metal spheres to closely fit together to form a metal seal. XG Song et al. [8] advocated the use of nitrile rubber as the sealing ring of the ball valve joint, and carried out a finite element simulation of its sealing structure, showing that it can meet the sealing requirements. Zhou XH [9] analysed the stern shaft spherical mechanical seal and developed a new mechanical sealing structure with a metal seal to achieve its function. Zhang Y [10] innovatively adopted the technology of a ceramic coating on a spherical seal, showing it can reduce the wear of the contact surface and improve the sealing performance of the seals. Yongjun Hou et al. [11] proposed a new type of spherical seal with silicone rubber and PTFE composites as the main materials. O-rings and PTFE elastic material are able to mitigate any lack of precision in the spherical joint manufacturing process, which reduces the processing accuracy requirements for the spherical surface. Based on this research, the sealing structure has two forms: a metal seal or a rubber seal. From the perspective of application and maintenance costs, the use of a rubber sealing ring on the spherical surface is more beneficial to the connector, nonetheless, most of the subsea connectors have a metal seal. However, the spherical structure studied here is difficult to adopt to the form of a metal seal because the inner and outer spherical surfaces need to be closely matched and rotated during installation. Therefore, whether its sealing structure can work properly under high pressure is the key to the design of the spherical structure. Rubber materials enjoy excellent elastic properties and resistance to compressive changes, which can effectively prevent the leakage of the pressure medium. The O-ring made of rubber has multiple advantages in sealing. It is widely used in marine, automotive, aerospace, traditional machinery and other fields, which provides direction and ideas for the design of a spherical sealing structure [12].
When the O-ring is used as a sealing element, there are many influencing factors to consider, such as the internal pressure of the sealing cavity, the pre-compression shrinkage of the sealing ring, the parameters of the sealing groove, and so on. An example of this is the study carried out by Ko, Jun bok [13], in which the O-ring seal at the head of a solid-propellant rocket motor was studied and analysed. The contact stress distribution on the O-ring’s sealing surface under high pressure was studied by numerical analysis, and it was found that the contact stress distribution and deformation behaviour of the O-ring were greatly influenced by the friction coefficient, squeeze gap and stress relaxation. Liang BL [14] analysed the effects of O-ring parameters and working conditions on the performance and reliability of the O-ring by tests, and found that material and geometric parameters have a greater impact on the reliability of rubber O-rings. Chen SH [15] studied the O-ring dynamic sealing structure of the swing hydraulic cylinder. The results showed that the factors affecting the O-ring sealing were not identical under the two working conditions, with and without a medium. There are relatively few studies on spherical, non-standard, O-ring seals. To fill this research gap, using an analysis of spherical O-ring sealing structures, this paper aimed to study and analyse the material parameters of the O-ring, and to determine the influence of a non-standard spherical sealing groove and pressure and compression ratios on sealing, to provide a reference for future scholars.
This paper is divided into four parts that describe the study on the spherical seal of the underwater connector. In the first section, the sealing structure model is discussed, and the parameters such as material, contact and friction coefficient are determined. The second section is about the design and calculation of the spherical sealing groove. By comparing the standard sealing groove and the spherical sealing groove, a more ideal design of a spherical sealing groove can be obtained. The third section is a finite element analysis of the spherical sealing mechanism. The effects of different pressures and different compression ratios on the sealing performance of the O-ring are analysed and studied from the aspects of von Mises stress, contact pressure, and contact width of different contact surfaces. The fourth section is the experimental verification of the sealing performance of the spherical sealing structure. In this study, an experimental device with the same sealing structure is designed, and the pressure test is carried out. The experimental results are in line with the theoretical expectation.

2. Model and Parameters of the Sealing Structure

The spherical sealing structure studied here is part of a spherical flange connector that has been designed. In this section, the working process of this structure and its sealing principle will be introduced, and the rubber constitutive model of the O-ring will be established.

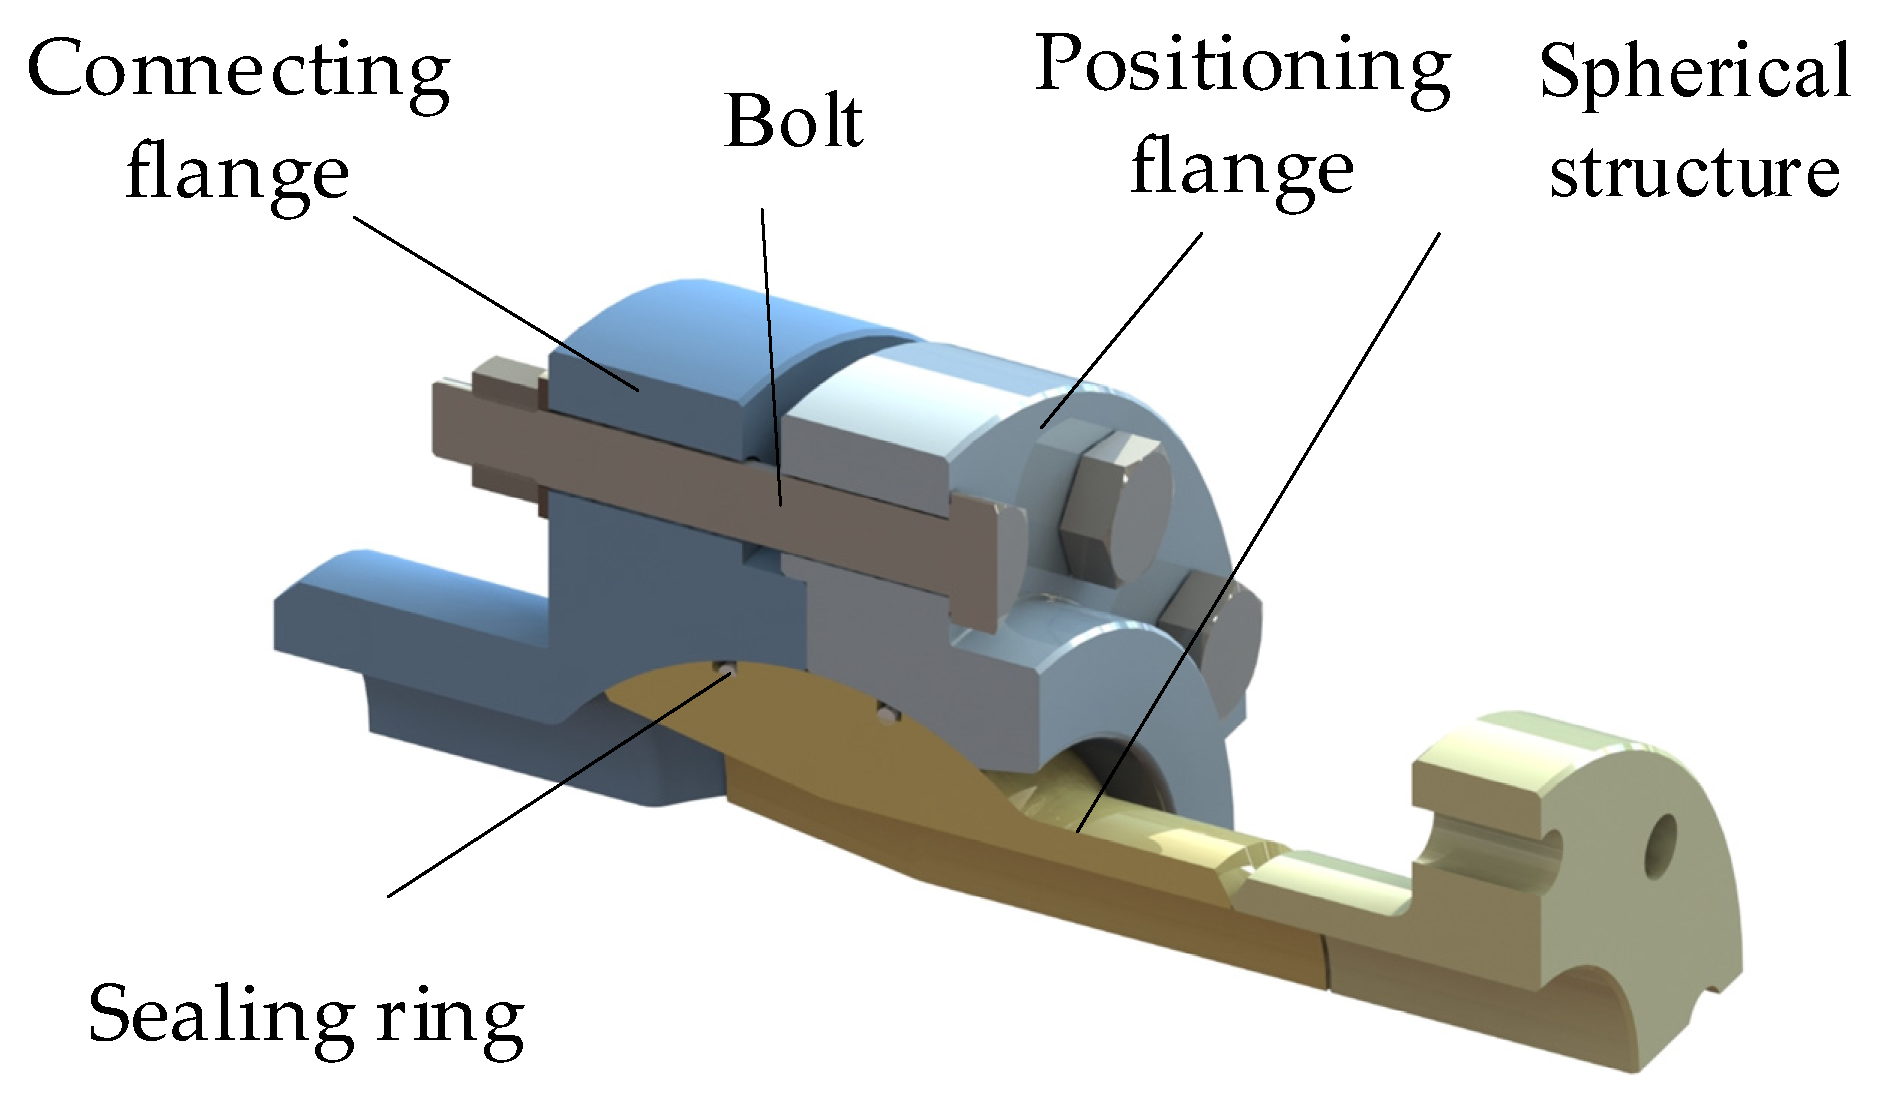
2.1. Structural Model of the Spherical Flange Connector

The spherical flange connector is mainly used for the butt joint of underwater pipelines, and the angle error of connecting pipeline can be compensated by the structure rotation. As shown in Figure 1, the spherical flange connector adopts the bolted flange connection method. It takes advantage of rubber’s property of easily achieving sealing after compression and deformation. Two O-rings are used as the main sealing structure in the spherical structure. The installation angle of the connector is adjusted by rotating the spherical structure. The connection flange, the positioning flange and the spherical structure are squeezed mutually by bolt connection to realize the locking of the entire structure. As shown in Figure 2, the connector can compensate the alignment error angle of the pipe by rotating the spherical structure, and its adjustable angle range θ is related to the overall structure of the connector.
The O-ring is physically squeezed to generate a certain amount of pre-compression and is fixed in position by the sealing groove. The contact surface between the sealing ring and the flange generates contact stress. After the inside of the connector is filled with medium, the fluid medium pressure will further squeeze the O-ring, and the contact pressure between the sealing ring and the flange will always be greater than the fluid medium pressure, thus achieving the spherical seal of the O-ring structure.

2.2. Mooney–Rivlin Constitutive Model of O-Ring

The spherical sealing structure studied here adopts the O-ring as the main sealing ring, its main failure mode is leakage. In this section, based on the strain energy density function consisting of invariants of the left Cauchy–Green deformation tensor and comparing the properties of different models of hyper-elastic materials [16], the Mooney–Rivlin [17,18] constitutive equation for the rubber is determined.
The material of the O-ring used in this study was nitrile rubber, which has a density of 1100 kg/m3 and an elastic modulus of 0.499. As a hyper-elastic material, the mechanical properties of rubber has the following three main characteristics [19]: incompressibility, the property of large deformation, and the property of being nonlinear. The latter property is reflected in three aspects [12]: geometric nonlinearity, material nonlinearity and boundary nonlinearity. The hyper-elastic properties of rubber should be considered during the rubber material construction on ANSYS Workbench finite element software(ANSYS, Inc., Pittsburgh, PA, USA). Based on the nonlinear theory, the Mooney–Rivlin strain energy density function was used to establish the rubber material model [17,20,21], and its constitutive relations are shown in Equations (1) and (2) [22,23]:
U = i + j = 1 N C i j ( I 1 ¯ 3 ) i ( I 2 ¯ 3 ) j + i = 1 N 1 D i ( J 1 ) 2 i
{ I 1 = λ 1 2 + λ 2 2 + λ 3 2 I 2 = λ 1 2 λ 2 2 + λ 2 2 λ 3 2 + λ 3 2 λ 1 2 I 3 = λ 1 2 λ 2 2 λ 3 2
where: U is the strain energy density; N is the order of function; Cij is the material constant, which is usually obtained by tests; I1, I2, I3 are the strain invariants; Di is the material constant, which is related to the compressibility of the material; J is the volume rate; λ1, λ2, λ3 are the principal elongation rates. For incompressible rubber materials, I 3 = λ 1 2 λ 2 2 λ 3 2 = 1 .
The Mooney–Rivlin two-parameter model was used, therefore, N is taken as 1, and the model constitutive relation is shown in Equation (3) [24]:
U = C 10 ( I 1 ¯ 3 ) + C 01 ( I 2 ¯ 3 ) + 1 D 1 ( J 1 ) 2
where: C10 and C01 are the material parameters obtained from tests; D1 is the material parameter, which is related to the compressibility of the material.

2.3. Form of Contact between the Rubber Material and a Rigid Rough Surface

In the surface contact between a rigid surface and the hyperelastomer, the friction mainly depends on the roughness of rigid surface. Therefore, it was assumed that the rigid surface is rough and the surface of rubber hyperelastomer is smooth, as shown in the Figure 3.
By use of the contact mechanics of a rough surface to calculate the deformation in the hyper-elastic body, there will be continuous “peaks” [25] on the contact surface of rigid rough surface. Our model was based on the assumption in Greenwood and Williamson model: all rough “peaks” (micro bulges) have the same radius of curvature, and the height of peaks is randomly distributed near the mean value. Using the square root l of the height distribution of each “peaks” and its radius of curvature R to describe the rough surface, the average contact area of a micro bulge is:
Δ A R l
Then the characteristic radius of a micro contact is equal to:
r Δ A R l
The time taken for the object to cross the distance with characteristic dimension r at speed v is:
t r v R l v
The order of magnitude of the characteristic frequency is:
ω ˜ 1 t v r
The average pressure of each “peaks” in micro contact is:
σ = F N A = κ 1 · E · z
where, E is the elastic modulus of rubber material; κ is a constant coefficient, here κ = 2 , FN is the load pressure between elastomer and rigid body; The square root of the surface gradient z [26] is expressed as:
z = z 2
where: z is the maximum height of “peaks”.
Here, the frequency dependent modulus is introduced to calculate the energy consumption per unit volume of micro contact:
P ¯ = 1 2 ω ˜ σ 2 G ( ω ˜ ) | G ( ω ˜ ) | 2
where, G ( ω ˜ ) is the loss modulus and G ( ω ˜ ) is negative shear modulus. The energy consumption P ¯ is multiplied by the characteristic radius r of the deformation volume to obtain the energy loss per unit area, and then divided by the normal stress to obtain the friction coefficient between the hyper-elastic surface and the rigid rough surface:
μ = ξ z G ( v / r ) | G ( v / r ) |
where, ξ is the dimensionless coefficient with the order of magnitude of 1. In this calculation, ξ = 1 .
In the middle of the frequency, for a hyperelastomer like rubber, G G , so we can get, G ( v / r ) | G ( v / r ) | 1 . Then the friction coefficient between the hyperelastic body and the rough surface of the rigid body is: μ z .
Therefore, a simple conclusion is obtained: the friction coefficient between elastic body and rigid body rough surface is equal to the square root of surface gradient.
According to the formula [26] in reference: z 2 = 2 · Δ , which can determine the value of the square root of the surface gradient. Where Δ is the root mean square of the changes in two spatial directions related to the constant coefficient κ . And when κ is taken as 2, Δ = 0.13 . Therefore, the friction coefficient between rubber material and rigid material can be obtained, μ = 0.2 .

2.4. Determination of Rubber Material Parameters C10, C01 and Its Hardness

Reference [27] analysed the relationship between the elastic modulus and the IRHD hardness of rubber material based on the elastic theory of rubber, and predicted the parameters of Mooney–Rivlin model. Under high contact pressure, the hardness needs to be appropriately increased (Shore hardness is used below). When the compression of the O-ring is certain, the greater the hardness of the rubber, the greater the contact stress generated, and the greater the pressure that the O-ring can seal. To eliminate the tendency of the O-ring to move and bounce in the sealing groove, the hardness of the material in a high pressure environment is usually selected to be above 80 HA [28]. The connector sealing structure studied herein is required to work underwater and to withstand the high pressure in the oil pipeline, therefore, the rubber O-ring with a hardness of 85~90 HA was selected. The cross-sectional size of the O-ring affects the sealing effect of the sealing ring. Under the same compression, the larger the cross-sectional dimension d0 of the O-ring, the better the sealing effect. Therefore, an O-ring with a diameter of 7 mm and a hardness of 85~90 HA was selected. The hardness of the material will be calculated below.
The relation between the elastic modulus E0 and the shear modulus G of the rubber material is as follows [29,30]:
G = E 0 2 ( 1 + μ )
The Poisson’s rate μ = 0.49 is determined by the incompressibility of rubber, therefore, E0 = 3 G.
The relation between G, E0 and C1, C2 is as follows:
E 0 = 6 C 10 ( 1 + C 01 C 10 )
The relation between the IRHD hardness Hr of the rubber material and the elastic modulus E0 of the rubber is as follows:
lg E 0 = 0.0198 H r 0.5432
It can be seen from Equations (13) and (14) that the values of material parameters C1 and C2 depend on the IRHD hardness and are numerically similar to the Shore hardness used in China.
The rubber material used for the O-ring in this study is nitrile rubber. Reference [31] studied the Mooney–Rivlin parameters of the O-ring, and determined the two parameters of the Mooney–Rivlin 2-constant model as follows:
C 1 0 = 1.9461 , C 01 = 0.4619
By calculating Equation (14), it can be obtained that the hardness of the rubber O-ring under this parameter is about 86 HA.

3. Study on Non-Standard O-ring Spherical Sealing Groove

For the spherical sealing groove of the O-ring, based on the principle that the volume of a standard groove is consistent with that of a spherical groove, this section designs and calculates the size of a non-standard O-ring spherical sealing groove on the premise of full football surface groove design criteria.

3.1. Design Criteria

Referring to the design method of standard O-ring sealing grooves [32], the design criteria for spherical grooves are given as follows.
  • A good sealing effect of an O-ring depends to a large extent on the correct matching of the O-ring size to the groove size.
  • The O-ring is required to have enough compression and there should be enough compensation space in the groove of the sealing ring.
  • The O-ring has a certain stretching rate, which can ensure that the O-ring can clamp the sealing groove.
The non-standard spherical sealing structure using O-rings examined in this study is difficult to model using regular geometry because the sealing groove is open over a spherical surface. Therefore, when designing the spherical sealing groove, two groove structures were designed. One was similar to the rectangular groove on the shaft structure. The sealing groove was set on the spherical structure. The bottom surface of the sealing groove was parallel to the pipe wall of the pipe, and the upper surface is cut out by the spherical surface. The advantage of this structure is that the sealing groove also rotates with the spherical structure of the connector when it rotates, the position of the seal will not be affected by the change of its structure. The disadvantage is that the existence of the groove may affect the stiffness of the pipeline itself. Another structure opens the groove on the inner cavity surface of the flange. The shape of the groove is a dovetail groove, on which the bottom surface is parallel to the spherical surface. This structure will not affect the stiffness of the pipeline itself because the groove is not opened onto the spherical structure, however, its manufacture is difficult. During the rotation of the spherical structure, the groove on the inner cavity surface of the flange will limit the rotation range of the spherical structure and affect its range. Considering the advantages of the two different structures, installation difficulty and processing cost, opening the sealing groove onto the spherical structure is more conducive to the realization of the function of the sphenecal mechanisam

3.2. Determination of the Position and Size of the Sealing Groove

As shown in Figure 4, the spherical structure adopts two O-ring sealing rings as the sealing structure, which are installed on the upper and lower sides of the spherical structure respectively and are symmetrically distributed along the x-axis. Due to geometrical limitations, the side walls of the O-ring sealing groove are uneven in depth, and the O-ring is installed against the upper side wall of the sealing groove during installation, therefore, the angle between the two sides of the sealing groove and the x-axis line can be calculated, as shown in Equations (15) and (16).
θ 1 = sin 1 L d 0 2 R
θ 2 = sin 1 L + b 2 d 0 2 R
where: L is the distance from the installation axis of the O-ring to the spherical axis; d0 is the size of the cross-sectional diameter of the O-ring; R is the spherical radius of the spherical structure; b2 is the groove width of the sealing groove; θ 1 , θ 2 are the angles between the two sides of the sealing groove and the x-axis.
The dimensions of the standard O-ring groove structure on the shaft structure are shown in Figure 5.
And the volume of the sealing groove V 1 is:
V 1 = r h 1 r 2 π b 1 x d x
where: b1 is the groove width; h1 is the groove depth; δ is the sealing gap; and r is the shaft radius of the shaft structure. The calculation expression of V1 can be obtained as follows.
V 1 = 2 b 1 π r h 1 b 1 π h 2 2
The volume of the O-ring groove on the sphere V 2 can be calculated with the parameters shown in Figure 6:
V 2 = 0 2 π b 2 d φ θ 2 θ 1 R cos θ ( R 2 L 2 h 2 ) d x
where: h2 is the depth of the groove, b2 is the width of the groove. The expression for the calculation of V2 can be obtained as follows.
V 2 = 2 π b 2 2 ( R 2 L 2 h 2 ) ( sin 1 L + b 2 d 0 2 R sin 1 L d 0 2 R )
V2 is the volume of non-standard spherical sealing groove.
The volume of the O-ring sealing ring V 0 can be obtained after determining its specific type.
V 0 = 0 2 π π d 0 2 4 r d x = π 2 d 0 2 2 R 2 L 2
Comparing the calculation formula of the standard sealing groove volume V1 on the shaft structure and the spherical sealing groove V2, let the radius of the shaft structure r be equal to the radial radius of the installation position of the spherical sealing O-ring r = R 2 L 2 , the depth of the O-ring sealing groove h affects the sealing pre-compression ratio of the O-ring, therefore, keep the shaft structure groove depth h1 equal to the spherical structure groove depth h2, and discuss the relationship between the sealing groove width b1 and b2. Let the volume V1 of the sealing groove on the shaft structure be equal to the volume V2 of the sealing groove on the spherical structure, the equation can be obtained as follows:
2 b 1 π R 2 L 2 h b 1 π h 2 = 2 π b 2 2 ( R 2 L 2 h ) ( sin 1 L + b 2 d 0 2 R sin 1 L d 0 2 R )
According to Equation (22), the relation between the groove widths b1 and b2 can be obtained, and b1 is determined according to the standard groove size, therefore, the groove width of the O-ring spherical sealing groove b2 can be determined. The spherical sealing groove studied here has a calculated design width of 9.5 mm. Therefore, it can be calculated that V2 = 37,822.73 mm3, V0 = 27,807.61 mm3.
The comparison between the volume of the spherical sealing groove V2 has been determined and the volume of the O-ring V0 is as follows.
V 2 V 0 V 2 = 37,822.73 27,807.61 37,822.73 × 100 % = 26 %
As shown in Equation (23), the sealing groove volume of the O-ring is 26% larger than that of the O-ring, which satisfies the design criteria for the O-ring sealing groove, and also leaves enough compensation space for the possible temperature rise expansion of the O-ring.
In summary, based on the structure of the standard O-ring sealing groove, the dimensional requirements of the O-ring spherical sealing groove are explored from the perspective of the volume equality of the groove dimensions, which provides ideas for the design of the spherical sealing groove and enriches the theoretical basis of connector design.

4. Finite Element Analysis of a Non-Standard spherical sealing structure using O-rings

The spherical flange connector is required to work underwater with complex working conditions. Table 1 shows the key technical specifications of its product prototype:
To study the sealing performance of the spherical sealing structure using O-rings, this section mainly explores the influence of pressure acting on the O-ring and the pre-compression of the O-ring on its sealing. Within the pressure range that the O-ring can withstand, the maximum pressure on the contact surface will always be greater than the pressure of the fluid medium, which also verifies the self-sealing principle of the O-ring.
At the same time, this section also explores the effects of different compression ratios on the sealing performance of the O-ring. The internal von Mises stress and the maximum contact surface pressure of the O-ring will increase with the increase of the compression ratio. However, if the compression ratio is too large, the equivalent stress inside the O-ring will be too large, especially under high pressure, the equivalent stress will exceed the allowable stress of the rubber material, thereby destroying the structure of the O-ring. Through the finite element calculation results, it can be found that when the compression ratio is 17.6%, the contact width of the main seal of the O-ring is the largest, which can reach an ideal sealing effect of the O-ring.

4.1. Establishment of ANSYS Finite Element Model

The spherical sealing structure of the underwater connector is modelled in three-dimensional software and imported into ANSYS Workbench. As the sealing structure is a rotating body structure, to reduce the number of grids, the imported model structure adopted a 2D axisymmetric model.
For the selection of the flange material and the spherical structure material, F22 alloy material was selected, which is widely used as the main material of underwater connector. The F22 material enjoys excellent corrosion resistance and tensile properties, and its performance parameters are shown in Table 2.
The most widely used nitrile rubber material was selected as the O-ring material, with a diameter specification of 7 mm and a hardness of 85 ha. According to the analysis of Mooney–Rivlin constitutive model in Section 2.3, the constants C10 and C01 are 1.9461 and 0.4619 respectively.
The connector sealing structure has two O-ring sealing rings and they are symmetrical. The flange and the sealing ring were divided by quadrilateral and triangular composite grids, and the grids of the O-ring sealing ring and contact flange surface were refined. The whole model was divided into 6965 elements and 21,950 nodes in total, as shown in Figure 7.
In the static analysis, the contact between the O-ring and the flange and the spherical structure was set to be frictional contact, and the friction coefficient was 0.2; the contact between the flange and the spherical structure was also a frictional contact, the friction coefficient was 0.15, the settings of the contact interface were to adjust the contact. Due to the large deformation and nonlinear characteristics of the rubber material, the analysis was set to enable Large Deflection, and the Newton–Raphson option in Nonlinear Controls was set to Unsymmetric. The axial constraint fixed support was applied to the lower surface of the flange to limit the movement of the simulation structure in the axial direction. To simulate the working environment, we set two load steps to apply the working load to the simulation model. The load was applied in two load steps, the first load step applies displacement to the flange so that the flange compresses the O-ring and reaches the pre-compression of the O-ring; the second load step exerts pressure on the contact part of the O-ring with the fluid medium, and further increases the contact stress between the O-ring and the flange pseal, making it greater than the medium pressure pw to meet the sealing requirements of the O-ring structure.

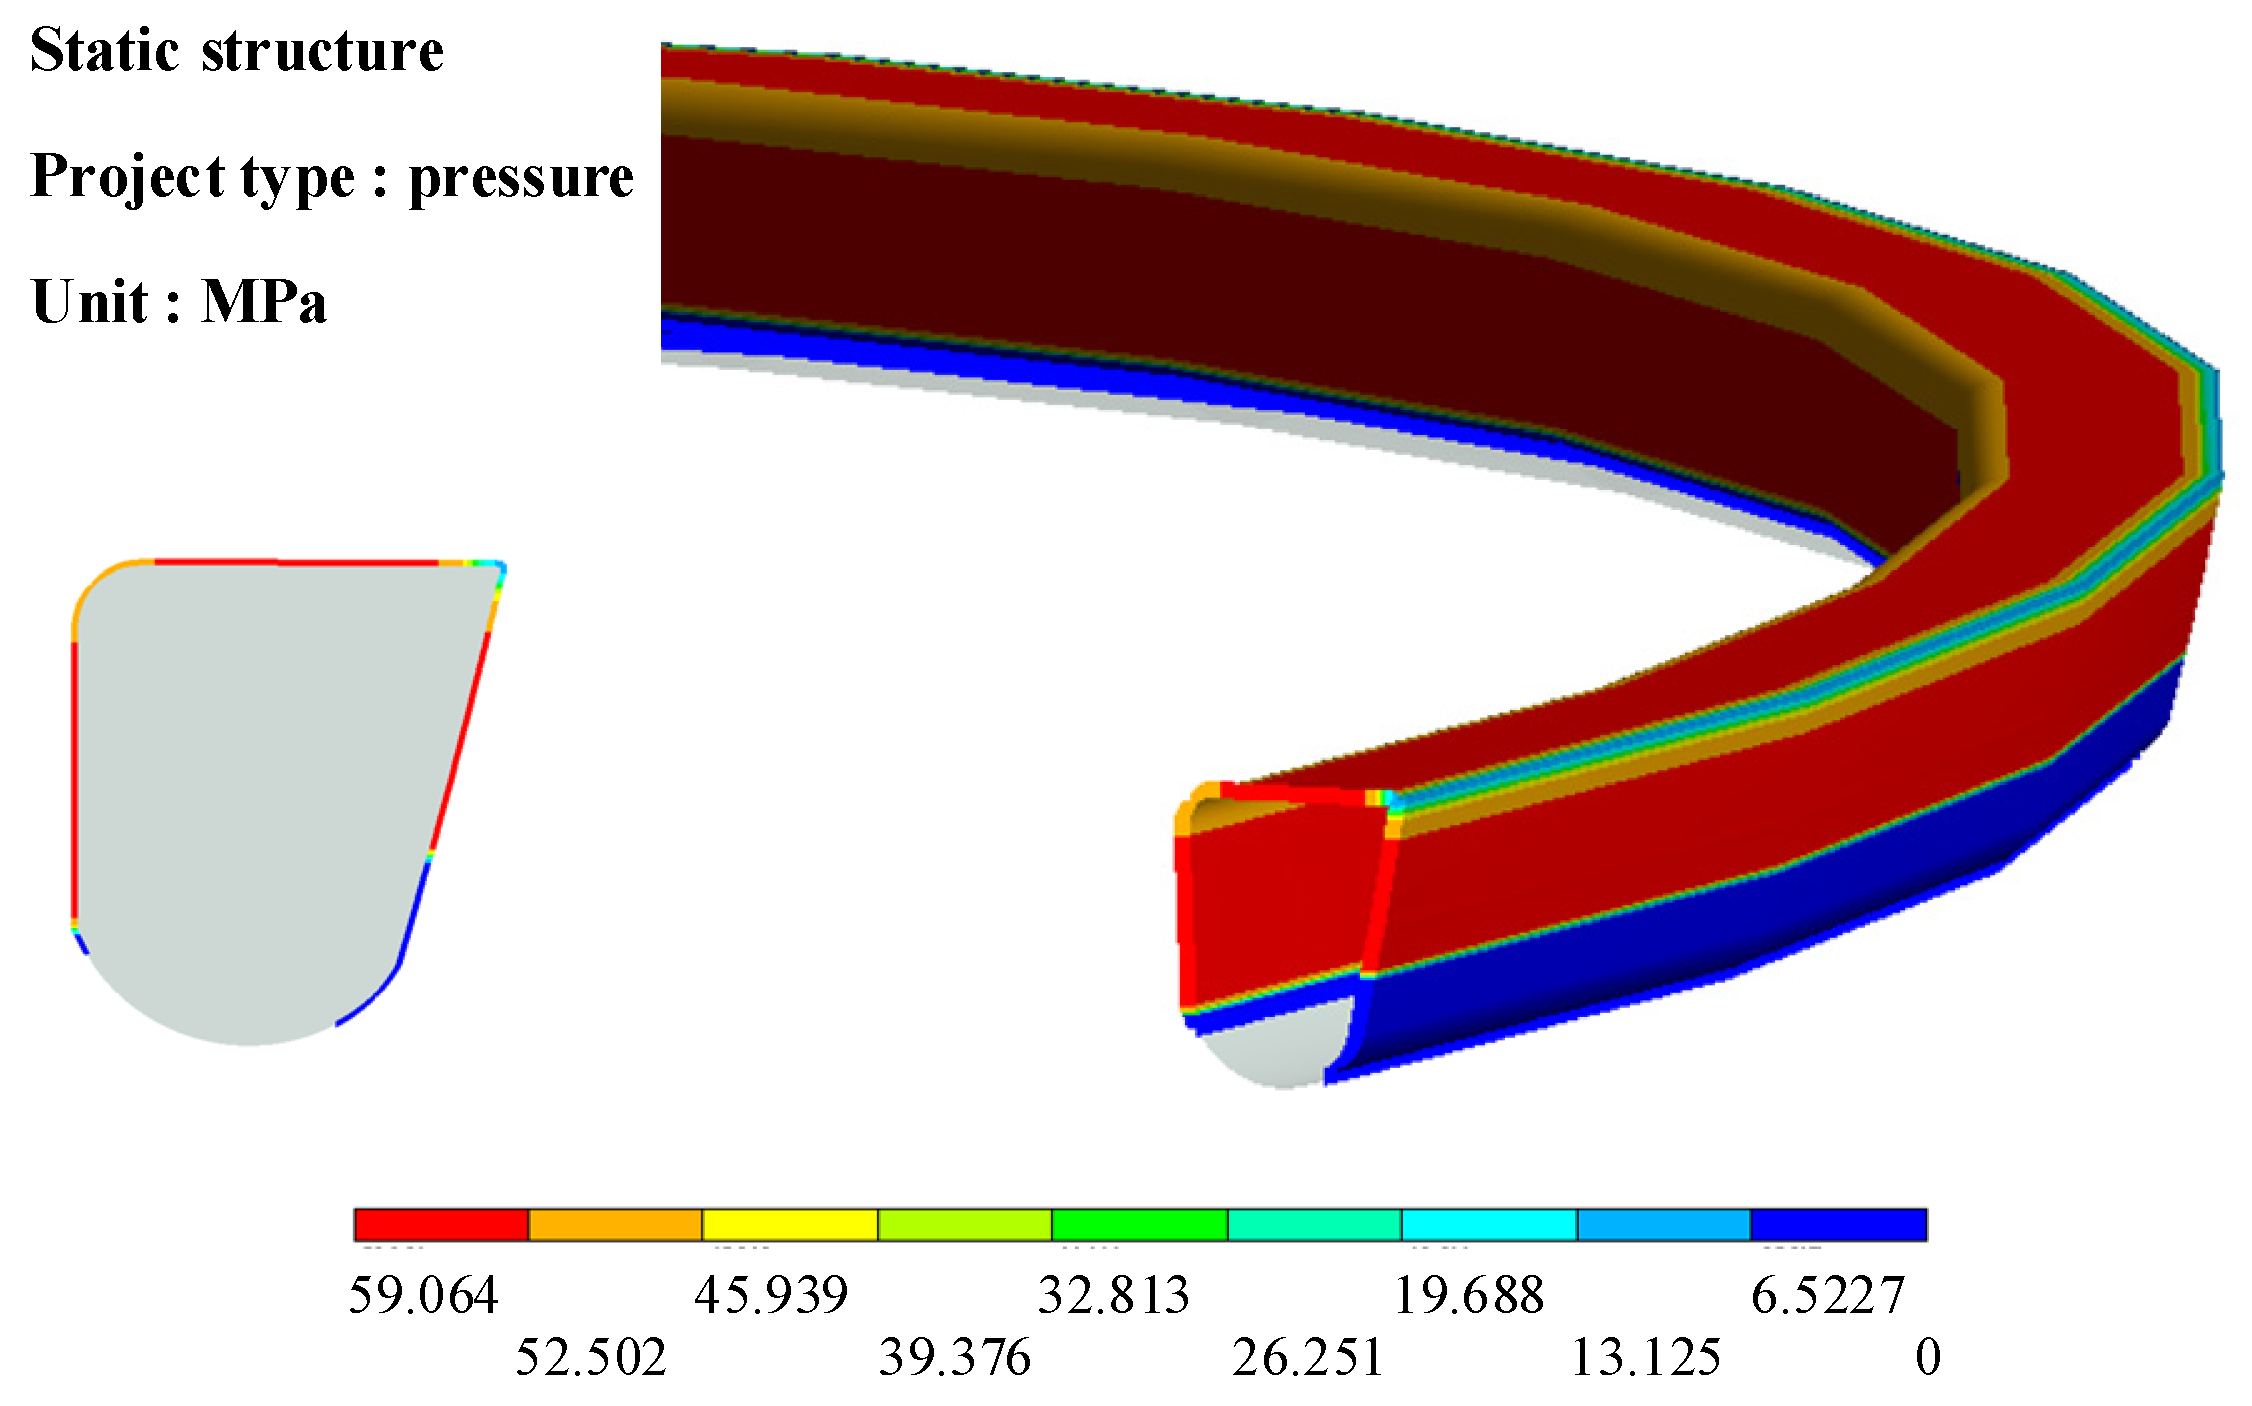
4.2. Influence of Medium Pressure on Sealing Performance

The O-ring sealing structure as an extruded self-sealing structure; only when the sealing ring has initial deformation and initial prestress pseal, and the fluid pressure pw > pseal, can the sealing structure not leak. The upper flange of the connector and the spherical body structure mutually squeeze the O-ring to deform it to generate a certain prestress. After the O-ring is physically squeezed, it generates internal prestress and contact pressure with the flange contact surface. We then apply pressure to the upper part of the O-ring to further compress the O-ring sealing ring, so that the contact pressure between the O-ring and the flange and spherical body is greater than the pressure of the liquid medium, the stress inside the O-ring increases, and the contact pressure pseal between the O-ring and flange as well as sealing groove > fluid pressure pw.
To explore the influence of the fluid medium pressure on the sealing performance of O-ring sealing structure on the spherical surface, a fluid pressure of different amounts was applied to one side of the O-ring after it has been pre-compressed, and the size of the maximum equivalent force inside the O-ring and the contact pressure with the compressed surface were compared to identify whether it met the sealing requirements.
Results of applying a displacement load to the flange, compressing the O-ring and not applying pressure, are shown in Figure 8 and Figure 9. Figure 8 shows the nephogram of the O-ring von Mises stress, from which the maximum internal stress of the O-ring at a pre-compression of 17.6% was obtained as 6.6443 MPa. Figure 9 shows the contact pressure distribution of the O-ring. When no pressure is applied to the model, the maximum pressure on the metal surface where the O-ring was in contact with it can reach 8.413 MPa.
After the O-ring produces the pre-compression, a working pressure of 52 MPa was applied to the contact surface of the O-ring and the medium, and the results shown in Figure 10 and Figure 11 were obtained. Figure 10 shows the nephogram of the O-ring von Mises stress, from which the maximum internal stress of the O-ring at the pre-compression of 17.6% was 13.262 MPa. Figure 11 shows the contact pressure distribution of the O-ring. When no pressure was applied to the model, the maximum pressure on the metal surface where the O-ring was in contact with it can reach 59.064 MPa.
The simulation results show that based on the sealing principle of the O-ring, the sealing performance of O-ring spherical sealing structure was reliable. To further analyse the influence of the medium pressure on the O-ring, a simulation analysis of the O-ring sealing structure under different pressures was carried out.
The data shown in Table 3 were obtained through simulation, and the relation between the O-ring equivalent force, the contact pressure and the fluid pressure acting on the O-ring was collated (Figure 12 and Figure 13), and the following conclusions obtained:
The internal equivalent stress of the O-ring is closely related to the initial pre-compression amount. As the fluid pressure increases, the internal equivalent stress of the O-ring begins to increase rapidly. The O-ring is deformed significantly under high-pressure medium, and the O-ring is further compressed, resulting in an increase in the internal equivalent force. When the internal equivalent stress increases to a certain extent, the deformation of the O-ring will become smaller and smaller, therefore, the internal equivalent stress will gradually stabilize.
The contact surface pressure between the O-ring, the flange and the spherical body will increase with the increase of the fluid pressure acting on the surface of the O-ring, and the two show a linear trend. Therefore, the contact pressure pseal will always be greater than the fluid pressure pw as far as the pressure allows. The O-ring requires sufficient sealing contact area (contact width) in terms of sealing requirements, that is, the O-ring is required to have sufficient compression, the smaller the compression, the smaller the contact pressure pseal, which is prone to lead to seal leakage; if the pressure is large, the pressure relaxation will also cause leakage.
Previous research on O-ring sealing focused on the overall von Mises stress distribution of the O-ring; the maximum contact pressure of the O-ring is also commonly used, as the sealing pressure of the O-ring structure on parameters such as the maximum contact pressure of the O-ring. Wang Jun [33] and other scholars had analysed the pressure and contact width of the O-ring with different primary and secondary contact surfaces; with the increase of fluid pressure, the maximum von Mises stress increased significantly, however, the increase of the pressure of different contact surfaces was inconsistent, and the change of contact width of two contact surfaces with the growth of pressure was not obvious. As shown in Figure 14, the O-ring used for spherical sealing has three surfaces in contact with the O-ring surface during sealing: the contact surface between the flange and the O-ring, the contact surface between the side surface of the sealing groove and the O-ring, and the contact surface between the bottom surface of the sealing groove and the O-ring, which are written in the following as: flange contact surface, groove side contact surface, and groove bottom contact surface.
As shown in Figure 15, the contact width of the O-ring increases as the pressure of the external fluid medium increases, however, the contact width of the three contact surfaces grows differently. The growth of the flange contact surface is the smallest, and the growth rate of the contact width in the interval from 0 to 5 MPa is significantly larger than that in the interval from 5 to 60 MPa. This is because the flange contact surface is the main sealing surface, and the contact width of the flange contact surface can be very large after the pre-compression of the flange on the O-ring. The contact surface on the side of the groove and the contact surface on the bottom of the groove are used as secondary sealing surfaces, and the contact width at the beginning is relatively small, however, with the increase of fluid medium pressure, the growth rate of the contact width of the two contact surfaces becomes larger, the growth rate is relatively small in the interval from 0 to 5 MPa, and the growth rate shows a smooth trend in the interval from 5 to 60 MPa. This is due to the large deformation of the compressed side of the O-ring under high pressure. This leads to a large contact pressure on the bottom and side contact surface of the groove, and with the increase in pressure, the increase of stress rate inside the O-ring will gradually level off and converge to the allowable stress value of the material. The width of the side and bottom contact surfaces of the groove are related to the internal stress of the O-ring.

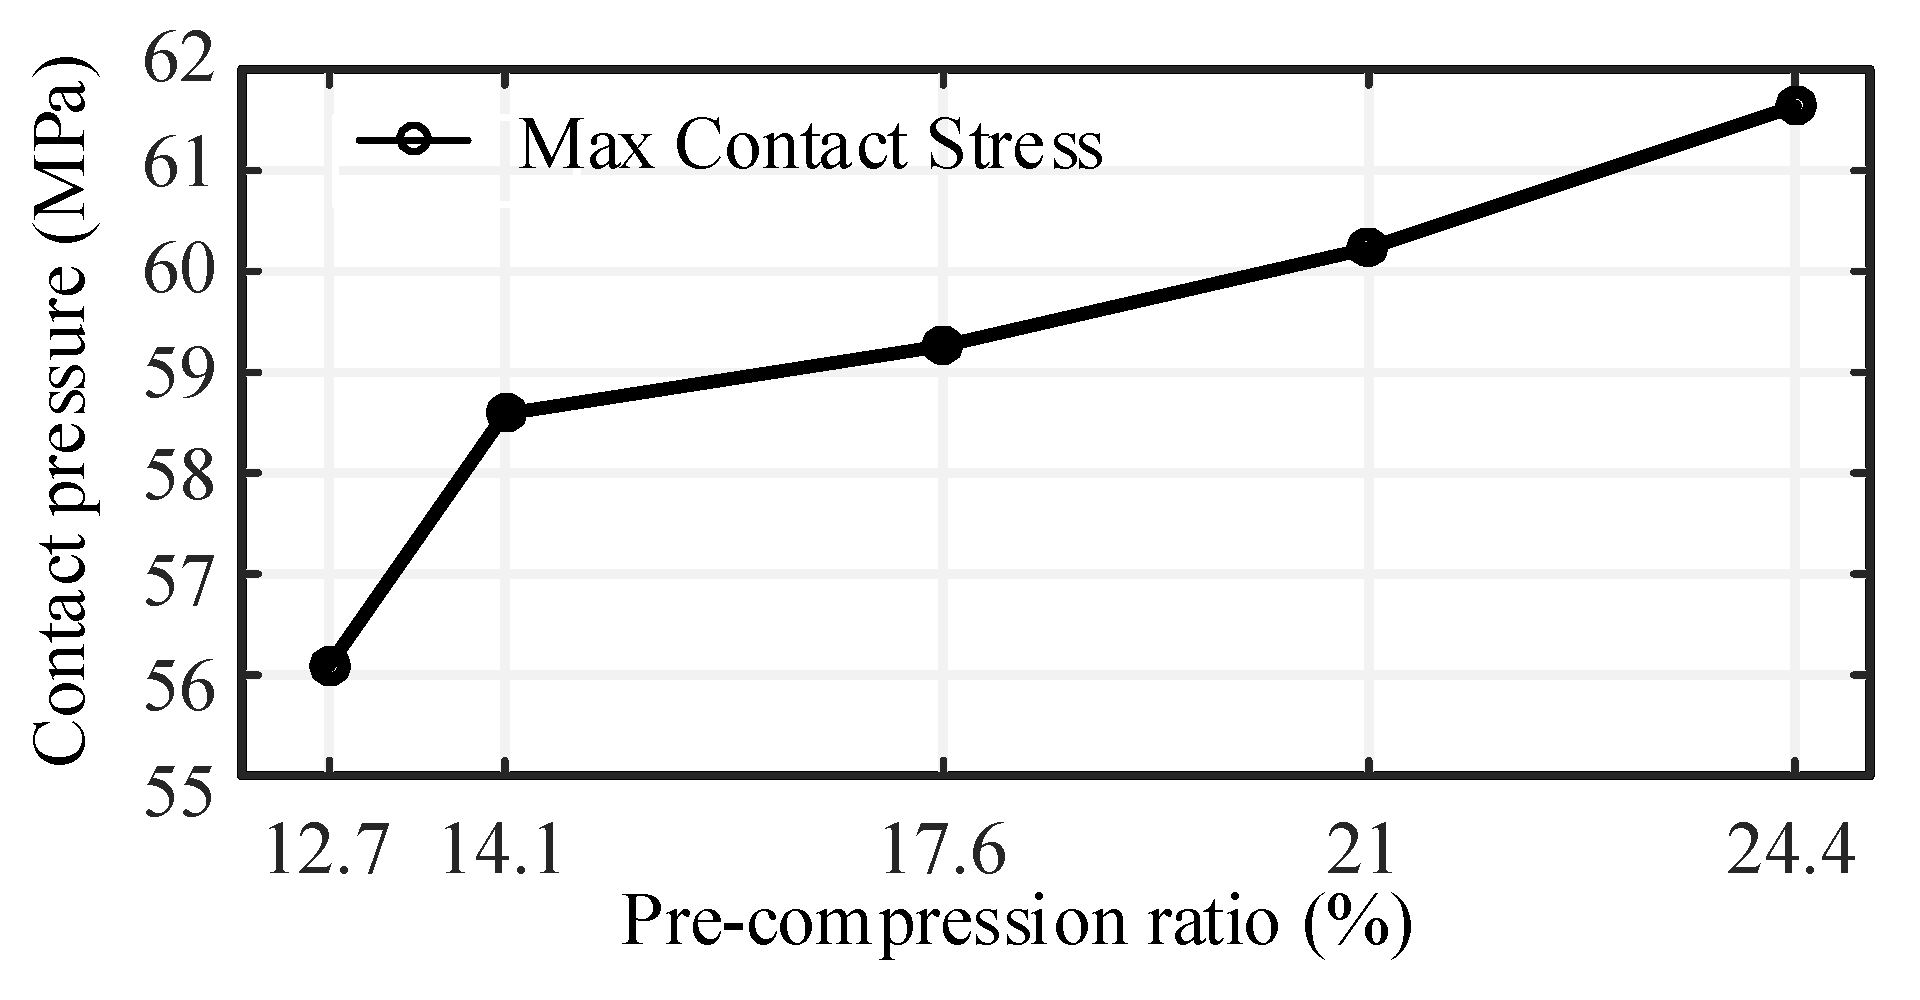
4.3. Influence of Compression Ratio of the Non-Standard Groove O-ring on Sealing Performance

The O-ring with an appropriate compression ratio can ensure a good sealing performance and low friction, and its initial compression ratio generally ranged from 10% to 20%. The O-ring sealing structure of the connector used here was a static sealing structure and it worked under high pressure, therefore, the selection range of O-ring compression was extended to 10~30%. The O-ring groove used for the sealing of this connector was standard, therefore, the O-ring compression ratio calculation Equation (24) was required to be simply modified, as shown in Figure 16.
E = Δ d d 0
where: E is the O-ring compression; Δ d is the height of the O-ring section after compression; d 0 is the free section diameter of the O-ring.
Figure 17 shows the local equivalent stresses under different compression ratios for a stretching rate of 0% and a fluid medium pressure of 52 MPa. In this study, the pre-compression of the O-ring was adjusted by changing the sealing groove depth h, and the compressions were calculated to be 12.7%, 14.1%, 17.6%, 21%, and 24.4%, respectively. It can be seen from the figure that as the compression ratio increased, the shape of the stress nephogram gradually changed, and the blue low-stress area above the O-ring gradually became smaller.
From the calculation results in Table 4, it was concluded that, under different compression ratios, the maximum contact pressure of the O-ring was greater than the fluid medium pressure of 52 MPa, which therefore meets the sealing conditions. Meanwhile, as shown in Figure 18 and Figure 19, as the compression ratio increased, the corresponding maximum contact pressure and maximum equivalent force both increased, and the increase in the maximum contact stress was greater than the maximum equivalent force.
As shown in Figure 20, different compression ratios affected the contact width of each contact surface. The contact width of the flange contact surface was increasing in the interval of compression ratios from 12.7% to 17.6%, however, the contact width was gradually decreasing in the interval of compression ratios from 17.6% to 24.4%. The width of the lateral contact surface of the groove was increasing in the interval from 12.7% to 14.1%, and decreasing in the subsequent interval with a relatively slow rate of decrease. With the increase of the compression ratio, the contact width of the groove bottom surface was increasing, however, it increased rapidly before a compression ratio of 14.1%. Combined with the image and taking the influence of the primary and secondary seals into consideration, the O-ring with a compression ratio of 17.6% can maximize the contact width of the primary seal, and the contact width of the two secondary seals was relatively large, therefore, in the O-ring spherical sealing design of the flexible connector, a structural design with a compression ratio of 17.6% should be selected.

5. Inner Cavity Sealing Test

To verify the sealing performance of the non-standard spherical sealing structure using O-rings, a test device for the spherical sealing mechanism was designed and processed, and the corresponding inner cavity pressure test was carried out.

5.1. Model of the Test Device

As shown in Figure 21, the test device of the spherical sealing structure using O-rings mainly consisted of flange, spherical structure and O-ring, and its sealing principle was the same as the working principle in Section 2.1.

5.2. Test Procedure

The sealing of the spherical structure was tested by the test device as shown in Figure 22, and the specific process was as follows:
  • Install the adapter of the hydraulic pump pipe and connect it to the upper flange interface, and put the assembled test device on the press test bench;
  • Press the moving end of the press against the upper flange of the device and apply pressure to compress and deform the internal O-ring to reach the pre-compression amount, and also restrain the upper and lower flanges from moving up and down after the pressure was applied;
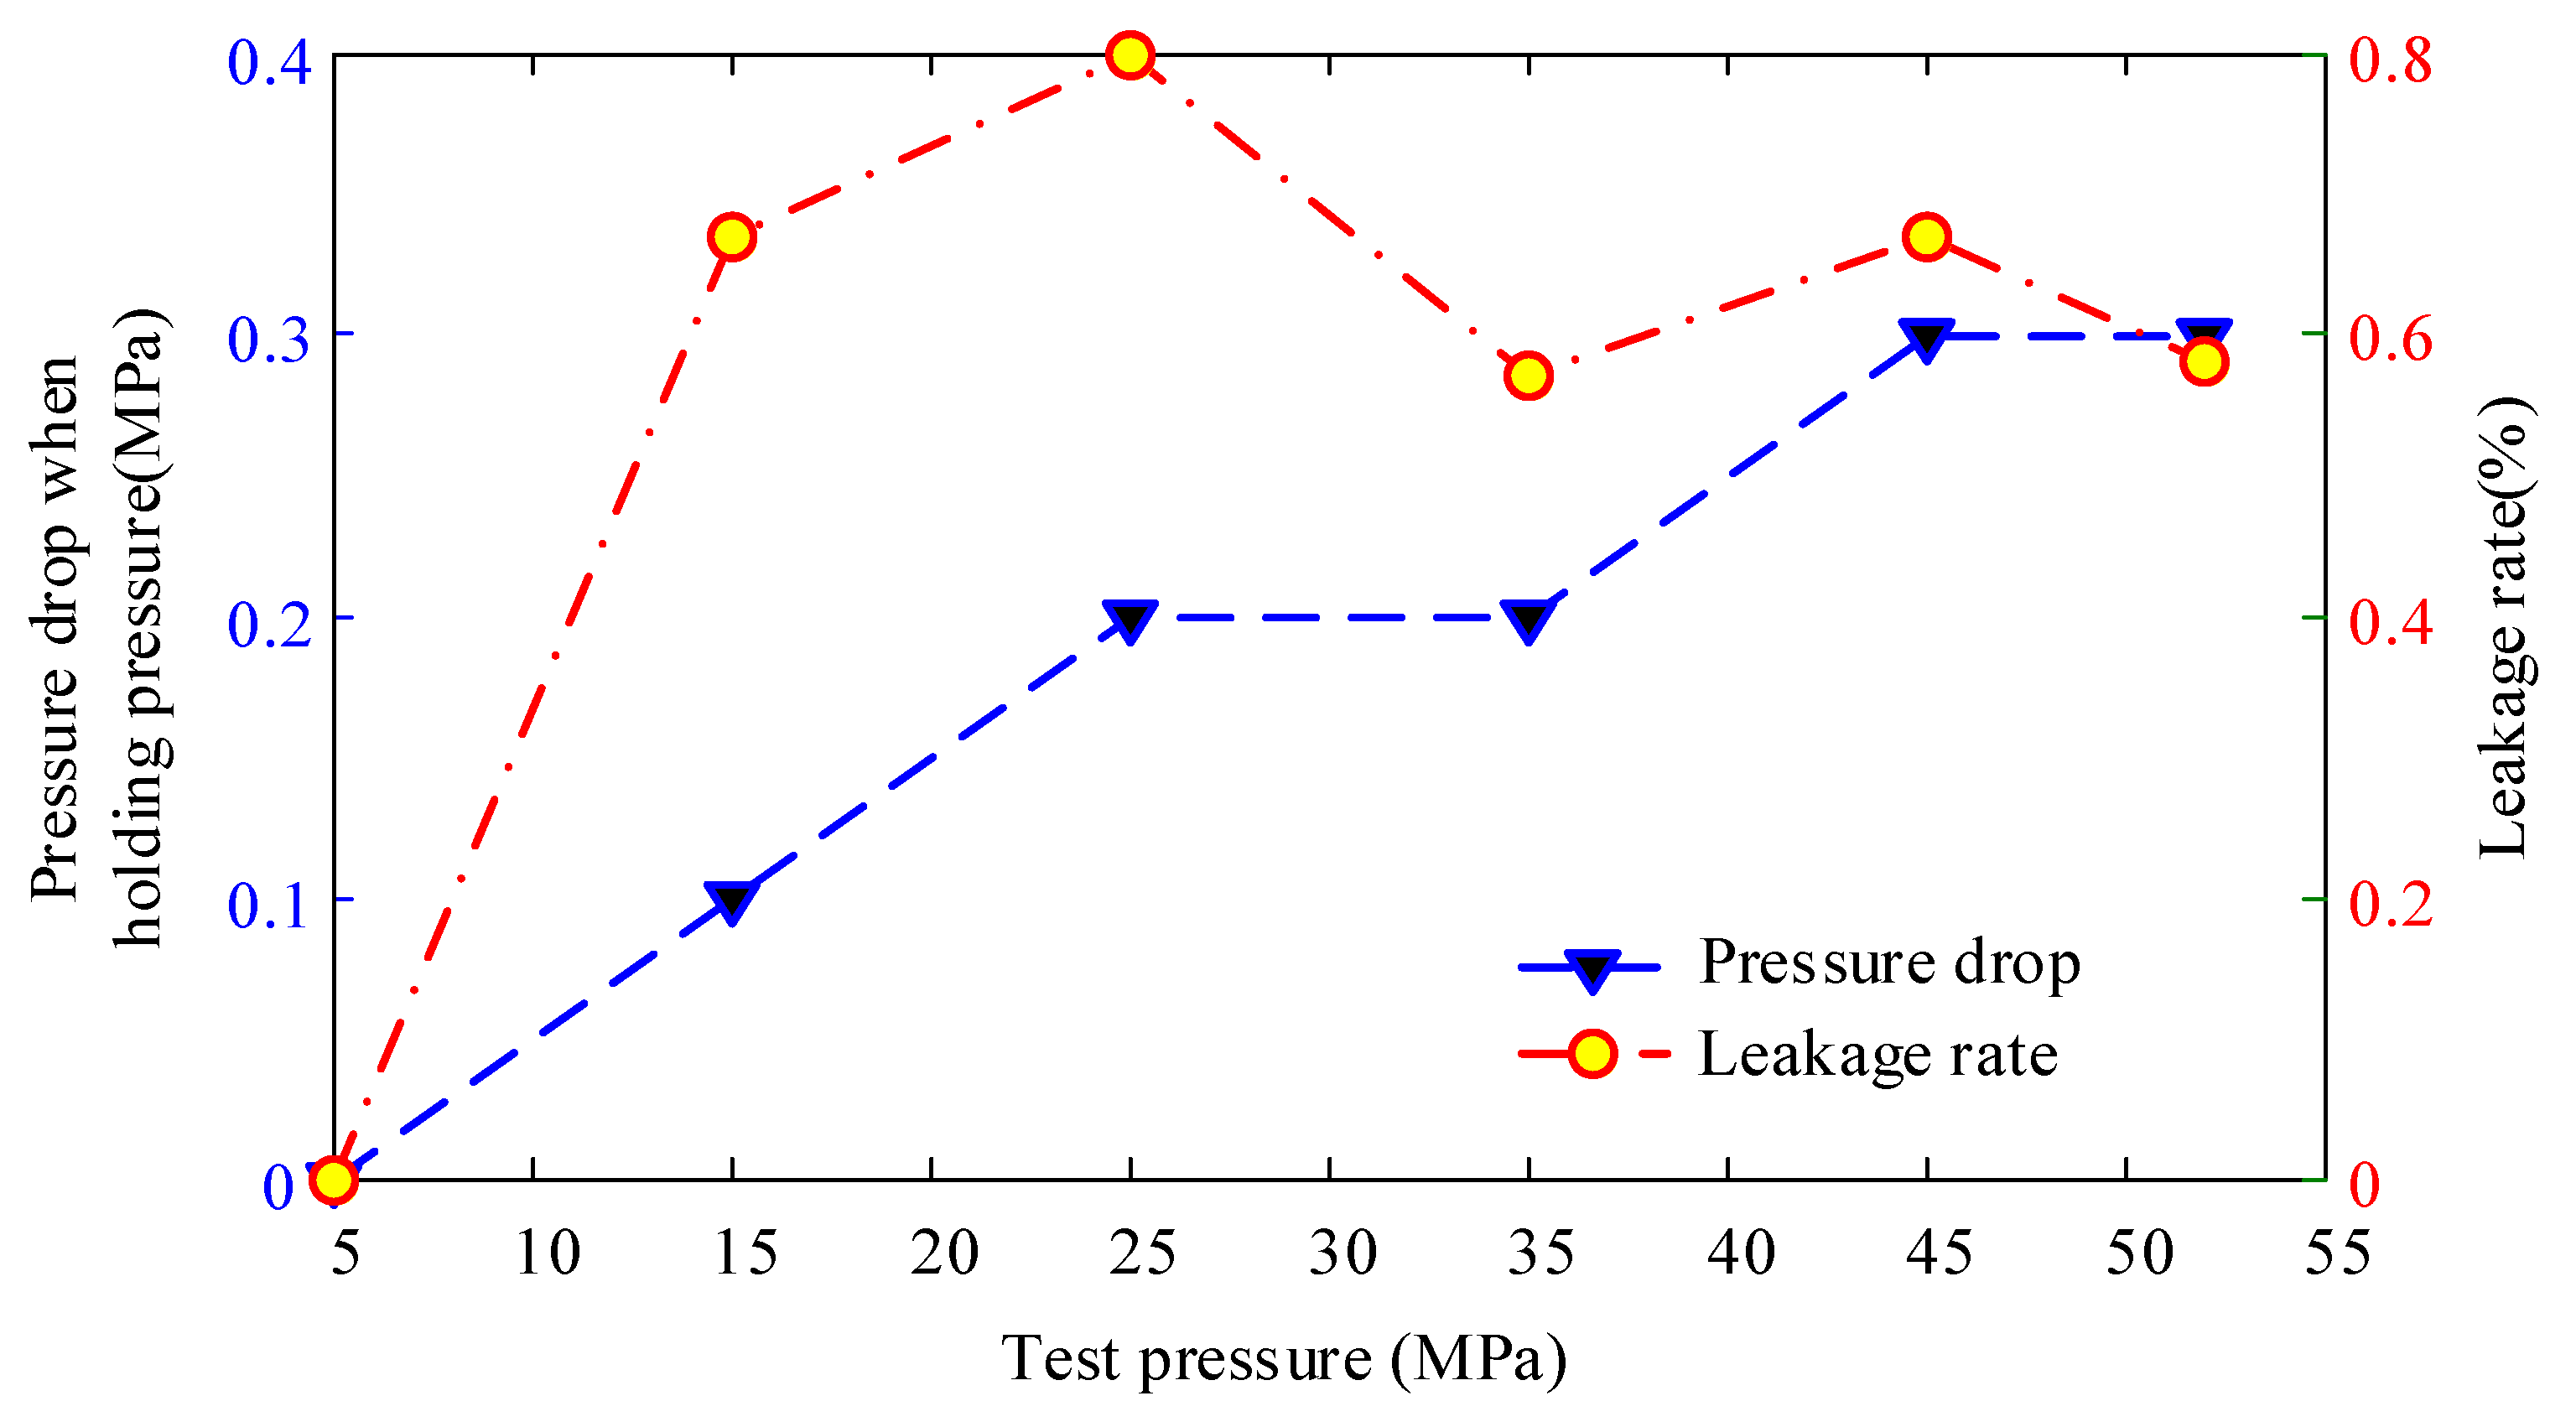
  • Open the hydraulic pump valve and slowly apply pressure to the inner cavity of the test device, reaching 5 MPa, 15 MPa, 25 MPa, 35 MPa, 45 MPa, and 52 MPa respectively, and hold the pressure for 15 min at each pressure stage, then record the data.
According to the requirements of the standard API 17D for the pressure-holding period, the acceptance criteria are as follows: no visible leakage during the specified test pressure-holding period shall be accepted. The pressure change observed on the pressure measuring device during the pressure-holding period shall be less than 5% of the test pressure.
The pressure gauge is shown in Figure 23, and the test data is shown in Table 5.

5.3. Analysis of Test Results

The test results showed that the spherical sealing structure can still ensure good sealing performance whether it works under low pressure, or pressure as high as 52 MPa. As shown in Figure 24, the maximum internal pressure attenuation of the experimental device in an hour was only 0.4 MPa, and the pressure drop increased with the increase of the test pressure, the increase was small.
During the whole pressure maintaining period, the leakage rate of the experimental device reached a maximum when the internal pressure reached 25 MPa. Below 25 MPa, the leakage rate always increased with the increase of internal pressure. After reaching 25 MPa, the fluctuation of the leakage rate of the experimental device decreased, and its value fluctuated between 0.57% and 0.67%. This was because the working load of the press was 150 tons under the pressure below 25 MPa, while the working load of the press reached 200 tons under the pressure of 25~52 Mpa. When the internal pressure was 25 MPa, the axial force of 150 t may not completely and effectively seal the experimental device, and when the pressure of the press reached 200 t, the leakage rate of the experimental device tended to be stable. Therefore, it was considered that if the experimental device wanted to reach the sealing pressure, the working pressure applied to the axial direction of the experimental device needed to reach 200 tons.
The maximum seal leakage rate of the test device was only 0.8%, which is much lower than the leakage rate required by the API 17D standard for subsea connector equipment.

6. Conclusions

This paper analysed and studied the structure and sealing performance of the spherical sealing structure using O-rings, and the following conclusions were drawn:
  • Based on nonlinear theory, the constant parameters of Mooney–Rivlin constitutive model of the O-ring material were determined, C10 and C01 were 1.9461 and 0.4619 respectively, and its Shore hardness was about 86 HA. The surface contact relationship between the elastomer and the rigid body was analysed, and the friction coefficient between them was determined to be 0.2.
  • The dimensions of the O-ring spherical sealing groove are required to ensure the compression ratio of the O-ring. Referring to the dimensional design of a standard shaft structure groove, the dimensional design of the spherical groove was developed from the perspective of groove volume and O-ring volume, and the width and depth of the spherical groove were determined to be 9.5 mm and 5.85 mm, respectively, and the installation position of the O-ring was determined.
  • The influence on the spherical sealing structure using O-rings was explored from two aspects, including pressure and compression ratio. The results revealed that the internal von Mises stress and the maximum contact surface pressure of the O-ring increase with the increase of pressure or compression ratio. Through the finite element calculation results, it was found that the main sealing contact width of the O-ring was maximum when the compression ratio was 17.6%, which made the sealing effect of the O-ring reach a more ideal state.
  • The pressure test and pressure-holding of the spherical sealing structure was performed, the results of the pressure test of the test device confirmed that the leakage rate of the spherical sealing structure using O-rings was very small, and the sealing effect was good. In this study, a non-standard spherical sealing structure using O-rings was analysed and verified, and it was identified that the structure can be directly used in the design and manufacture of subsea connectors and subsea valve products, the results emerged from this study may be of assistance to provide a reference for the sealing design of the spherical structure.

Author Contributions

Conceptualization, F.Y., X.H. and X.X.; methodology, F.Y. and X.W.; validation, D.L., X.H. and W.L.; formal analysis, X.X., K.J. and L.W.; investigation, D.L., P.J. and Z.Y.; resources, Z.Y., P.J. and L.W.; data curation, D.L., X.W. and W.L.; writing—original draft preparation, F.Y. and D.L.; writing—review and editing, D.L., F.Y. and K.J.; funding acquisition, L.W. and F.Y. All authors have read and agreed to the published version of the manuscript.

Funding

This research was funded by the National Natural Science Foundation of China, grant number 52001089; China Postdoctoral Science Foundation, grant number 2020M670889; Heilongjiang Provincial Natural Science Foundation of China, grant number LH2021E046; Fundamental Research Funds for the Central Universities, grant number 3072021CFT0701.

Institutional Review Board Statement

Not applicable.

Informed Consent Statement

Not applicable.

Data Availability Statement

Not applicable.

Conflicts of Interest

The authors declare no conflict of interest.

References

  1. Bai, Y.; Bai, Q. Subsea Pipelines and Risers; Elsevier: Oxford, UK, 2005. [Google Scholar] [CrossRef]
  2. Yun, F.H.; Wang, L.Q.; Liu, J.; Liu, T. Optimization analysis and experimental research on seal of subsea collet connector. J. Huazhong Univ. Sci. Technol. 2017, 45, 23–28+56. [Google Scholar] [CrossRef]
  3. Yun, F.; Wang, G.; Yan, Z.; Jia, P.; Xu, X.; Wang, L.; Sun, H.; Liu, W. Analysis of Sealing and Leakage Performance of the Subsea Collet Connector with Lens-Type Sealing Structure. J. Mar. Sci. Eng. 2020, 8, 444. [Google Scholar] [CrossRef]
  4. Watkins, B.J.; Regan, A.M.; Slota, W.P. Flexible Supportive Joint for Sub-Sea Riser Flotation Means. US05/546710, 3 February 1975. [Google Scholar]
  5. Moog, O. Simple Flexible Joint for High Pressure and High Temperature. U.S. Patent, US20030019625A1, 30 January 2003. [Google Scholar]
  6. Moon, I.Y.; Moon, I.S.; Yoo, J.H.; Lee, S.Y. Development of the Spherical Flange Used in a Cryogenic High Pressure Pipe. J. Korean Soc. Propuls. Eng. 2011, 15, 283–288. [Google Scholar]
  7. Feng, Y.L.; Zhang, W.M.; Feng, F.Z. Design and Strength Analysis of A Spherical Connector for Lifting Subsystem in Deep Sea Mining System. China Ocean Eng. 2006, 20, 605–613. [Google Scholar] [CrossRef]
  8. Song, X.-G.; Wang, L.; Park, Y.-C. Analysis and optimization of nitrile butadiene rubber sealing mechanism of ball valve. Trans. Nonferrous Met. Soc. China 2009, 19, s220–s224. [Google Scholar] [CrossRef]
  9. Zhou, X.; Liu, Z.; Meng, X.; Liu, J. The Simulation Analysis of Spherical Mechanical Seal of Stern Shaft. In Proceedings of the 2015 International Industrial Informatics and Computer Engineering Conference, Xi’an, China, 10–11 January 2015; Atlantis Press: Amsterdam, The Netherlands, 2015. [Google Scholar]
  10. Yong, Z.; Bo, Q.; Xinxin, S. The application of ceramic technology in spherical pipe joints. Proc. Inst. Mech. Eng. Part J J. Eng. Tribol. 2017, 231, 1078–1088. [Google Scholar] [CrossRef]
  11. Hou, Y.; Tang, Q.; Wu, Z.; Liu, X. Structural Design and Performance Analysis of a Deep-Water Ball Joint Seal. J. Mar. Sci. Appl. 2018, 17, 224–232. [Google Scholar] [CrossRef]
  12. Zhang, J.; Xie, J.X. Investigation of Static and Dynamic Seal Performances of a Rubber O-Ring. J. Tribol. 2018, 140, 042202. [Google Scholar] [CrossRef]
  13. Ko, J.B.; Kim, S.S.; Park, Y.S.; Yi, S.D.; Baek, K.B.; Suh, S.H. A Study on the Mechanical Characteristic of Elastomeric O-ring Compressed and Highly Pressurized. J. Korean Soc. Precis. Eng. 2019, 36, 721–728. [Google Scholar] [CrossRef]
  14. Liang, B.; Yang, X.; Wang, Z.; Su, X.; Liao, B.; Ren, Y.; Sun, B. Influence of Randomness in Rubber Materials Parameters on the Reliability of Rubber O-Ring Seal. Materials 2019, 12, 1566. [Google Scholar] [CrossRef] [Green Version]
  15. Chen, S.H.; Jiang, G.Z.; Li, G.F.; Xie, L.X.; Qian, W.Q. Nonlinear Analysis of Rotary Sealing Performance of Rubber O-Ring. Appl. Mech. Mater. 2013, 470, 371–375. [Google Scholar] [CrossRef]
  16. Kim, B.; Lee, S.B.; Lee, J.; Cho, S.; Park, H.; Yeom, S.; Park, S.H. A comparison among Neo-Hookean model, Mooney-Rivlin model, and Ogden model for chloroprene rubber. Int. J. Precis. Eng. Manuf. 2012, 13, 759–764. [Google Scholar] [CrossRef]
  17. Mooney, M. A Theory of Large Elastic Deformation. J. Appl. Phys. 1940, 11, 582–592. [Google Scholar] [CrossRef]
  18. Zhao, G.; Ma, Y.; Li, Y.; Luo, J.; Du, C. Development of a modified Mooney-Rivlin constitutive model for rubber to investigate the effects of aging and marine corrosion on seismic isolated bearings. Earthq. Eng. Eng. Vib. 2017, 16, 815–826. [Google Scholar] [CrossRef]
  19. Laiarinandrasana, L.; Piques, R.; Robisson, A. Visco-hyperelastic model with internal state variable coupled with discontinuous damage concept under total Lagrangian formulation. Int. J. Plast. 2003, 19, 977–1000. [Google Scholar] [CrossRef]
  20. Batra, R.; Ching, H. Energy release rates in a constrained epoxy disc with Hookean and Mooney–Rivlin materials. Theor. Appl. Fract. Mech. 2002, 38, 165–175. [Google Scholar] [CrossRef] [Green Version]
  21. Jaunich, M.; Stark, W.; Wolff, D. A new method to evaluate the low temperature function of rubber sealing materials. Polym. Test. 2010, 29, 815–823. [Google Scholar] [CrossRef]
  22. Liu, I.-S. A note on the Mooney–Rivlin material model. Contin. Mech. Thermodyn. 2012, 24, 583–590. [Google Scholar] [CrossRef]
  23. Mangan, R.; Destrade, M.; Saccomandi, G. Strain energy function for isotropic non-linear elastic incompressible solids with linear finite strain response in shear and torsion. Extreme Mech. Lett. 2016, 9, 204–206. [Google Scholar] [CrossRef] [Green Version]
  24. Zhang, C.; Zhang, S.M.; Geng, D.; Zheng, J.M.; Bin Fan, W. FEM Analysis of Plug Packer Based on the Model of Mooney-Rivlin. Adv. Mater. Res. 2011, 201–203, 326–331. [Google Scholar] [CrossRef]
  25. Popov, V.L. Contact Mechanics and Friction; Springer: Berlin, Germany, 2010. [Google Scholar] [CrossRef]
  26. Hyun, S.; Pei, L.; Molinari, J.-F.; Robbins, M.O. Finite-element analysis of contact between elastic self-affine surfaces. Phys. Rev. E 2004, 70, 026117. [Google Scholar] [CrossRef] [PubMed] [Green Version]
  27. Kim, N.-W.; Kim, K.-W. Prediction of Strain Energy Function for Butyl Rubbers. Trans. Korean Soc. Mech. Eng. A 2006, 30, 1227–1234. [Google Scholar] [CrossRef]
  28. Sukumar, T.; Bapu, B.R.; Prasad, B.D. Determination of sealing pressure in hyperelastic O-ring with different hardness using numerical method. J. Elastomers Plast. 2018, 51, 684–697. [Google Scholar] [CrossRef]
  29. Ma, J.Z. Mooney Rivlin parameter fitting and application of conductive rubber based on workbench. Radio Eng. China 2017, 47, 79–82. [Google Scholar]
  30. Braden, M.; Latham, D.; Patel, M. Observations on the swelling of cross-linked poly(dimethylsiloxane) networks by solvents. Eur. Polym. J. 2005, 41, 3069–3071. [Google Scholar] [CrossRef]
  31. Hu, Q. Experimental Study and Finite Element Analysis of O-Ring Seal of Hydraulic Servo Actuator. Master’s Thesis, Harbin Institute of Technology, Harbin, China, 2011. [Google Scholar]
  32. Fu, P.; Chang, D.G. Seal Design Manual; Chemical Industry Press: Beijing, China, 2009. [Google Scholar]
  33. Wang, J.; Li, R.Z.; Li, Y.K.; Lian, Z.S.; Liao, Y.Y. Study on sealing characteristics of O-shaped composite ring based on penetration boundary. Mach. Tool Hydraul. 2020, 48, 1–6+29. [Google Scholar]
Figure 1. Diagram of the spherical structure.
Jmse 10 00404 g001
Figure 2. Diagram of the adjustable angle of the connector.
Jmse 10 00404 g002
Figure 3. Contact Micrograph.
Jmse 10 00404 g003
Figure 4. Diagram of O-ring sealing position structure.
Jmse 10 00404 g004
Figure 5. Diagram of standard O-ring groove structure.
Jmse 10 00404 g005
Figure 6. Diagram of O-ring sealing groove structure.
Jmse 10 00404 g006
Figure 7. Diagram of O-ring sealing structure grids.
Jmse 10 00404 g007
Figure 8. Nephogram of O-ring von Mises stress under no pressure.
Jmse 10 00404 g008
Figure 9. Contact pressure distribution of O-ring under no pressure.
Jmse 10 00404 g009
Figure 10. Nephogram of O-ring von Mises stress under working pressure.
Jmse 10 00404 g010
Figure 11. Contact pressure distribution of O-ring under working pressure.
Jmse 10 00404 g011
Figure 12. Equivalent stress of O-ring affected by fluid pressure.
Jmse 10 00404 g012
Figure 13. Contact pressure affected by fluid pressure.
Jmse 10 00404 g013
Figure 14. Schematic diagram of contact surface.
Jmse 10 00404 g014
Figure 15. Contact width affected by medium pressure.
Jmse 10 00404 g015
Figure 16. Schematic diagram of compression ratio calculation.
Jmse 10 00404 g016
Figure 17. Diagrams of equivalent stresses under different compression ratios.
Jmse 10 00404 g017
Figure 18. Equivalent stress affected by compression ratio.
Jmse 10 00404 g018
Figure 19. Contact pressure affected by compression ratio.
Jmse 10 00404 g019
Figure 20. Contact width affected by pre-compression ratio.
Jmse 10 00404 g020
Figure 21. Model of the test device.
Jmse 10 00404 g021
Figure 22. Object pictures of the test device. (a) 200 t press; (b) Spherical structure, flange structure; (c) Test device; (d) Hydraulic pump.
Jmse 10 00404 g022
Figure 23. Data recorded by the pressure gauge.
Jmse 10 00404 g023
Figure 24. Pressure drop and leakage rate for the experimental device.
Jmse 10 00404 g024
Table 1. Connector key technical indicators.
Applicable Water DepthDesign TemperatureDesign PressureDevice Specification
100 m−18 °C~121 °C5000 psiSuitable for 6-inch pipe connection
Table 2. F22 alloy material parameters.
Level CodeTensile Strength,
≥ksi (MPa)
Yield Strength,
≥ksi (MPa)
2 in (50 mm)
Elongation, ≥, %
Reduction of Area, ≥, %Brinell Hardness
F22 class 160 (415)30 (205)20.035.0≤170
F22 class 375 (515)45 (310)20.030.0156~207
Table 3. Maximum equivalent stress and maximum contact pressure under different medium pressure.
Fluid Pressure/MPa05152535455260
Maximum Equivalent Stress/MPa6.39658.194110.31510.59810.87710.97810.99910.989
Maximum Contact Pressure/MPa7.941412.03421.81631.85941.84152.1859.26167.444
Table 4. Maximum equivalent stress and maximum contact pressure for different compression ratios.
Compression Ratio of the
O-Ring/%
12.714.117.621.024.4
Maximum Equivalent Stress/MPa10.15410.66910.99911.55312.302
Maximum Contact Pressure/MPa56.10158.58959.26160.23261.64
Table 5. Records of inner cavity pressure test.
Test Pressure (MPa)Pressure of the Press(T)Pressure Records(MPa)Pressure Drop (MPa)
0 min10 min20 min30 min40 min50 min60 min
51505.25.25.25.25.25.25.20
1515015.315.315.215.215.215.215.20.1
2515025.525.425.425.325.325.325.30.2
3520035.535.535.335.435.435.335.30.2
4520045.745.745.545.545.545.445.40.3
5220053.153.053.052.852.852.852.80.3
Publisher’s Note: MDPI stays neutral with regard to jurisdictional claims in published maps and institutional affiliations.

