
Floating Behavior of a Composite Bucket Foundation under the Combined Action of Wind and Waves

Abstract
:1. Introduction
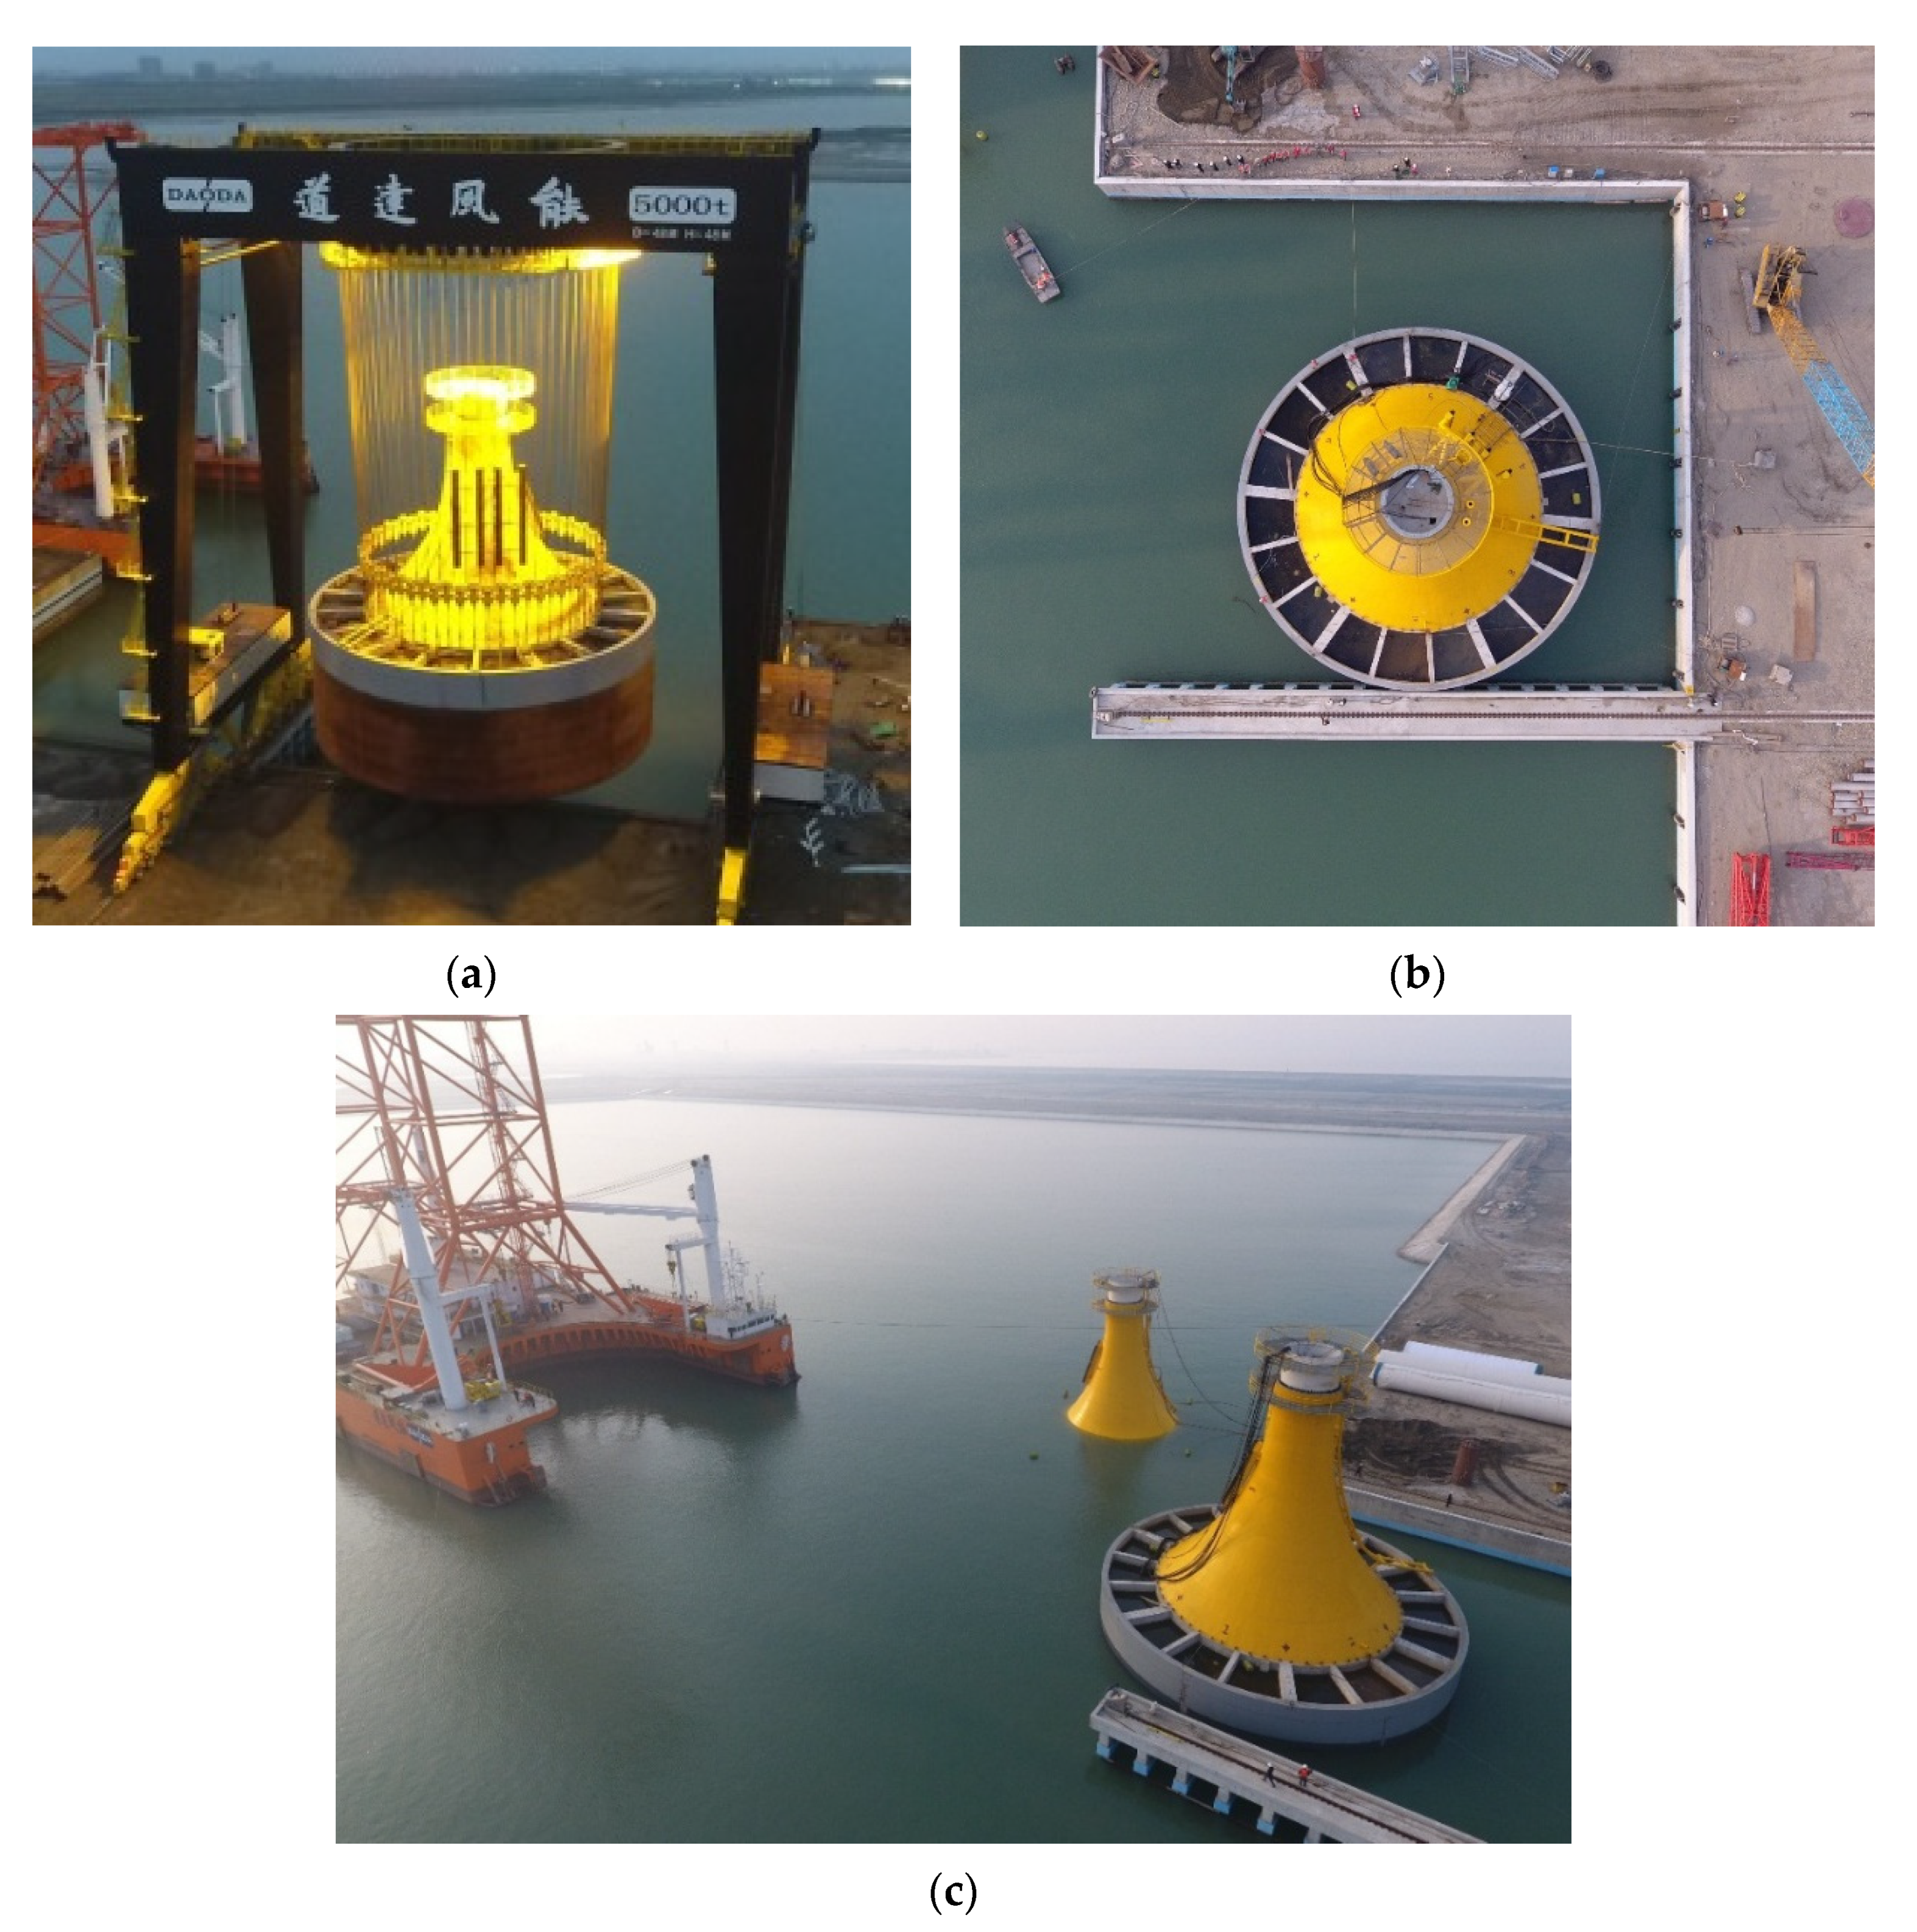
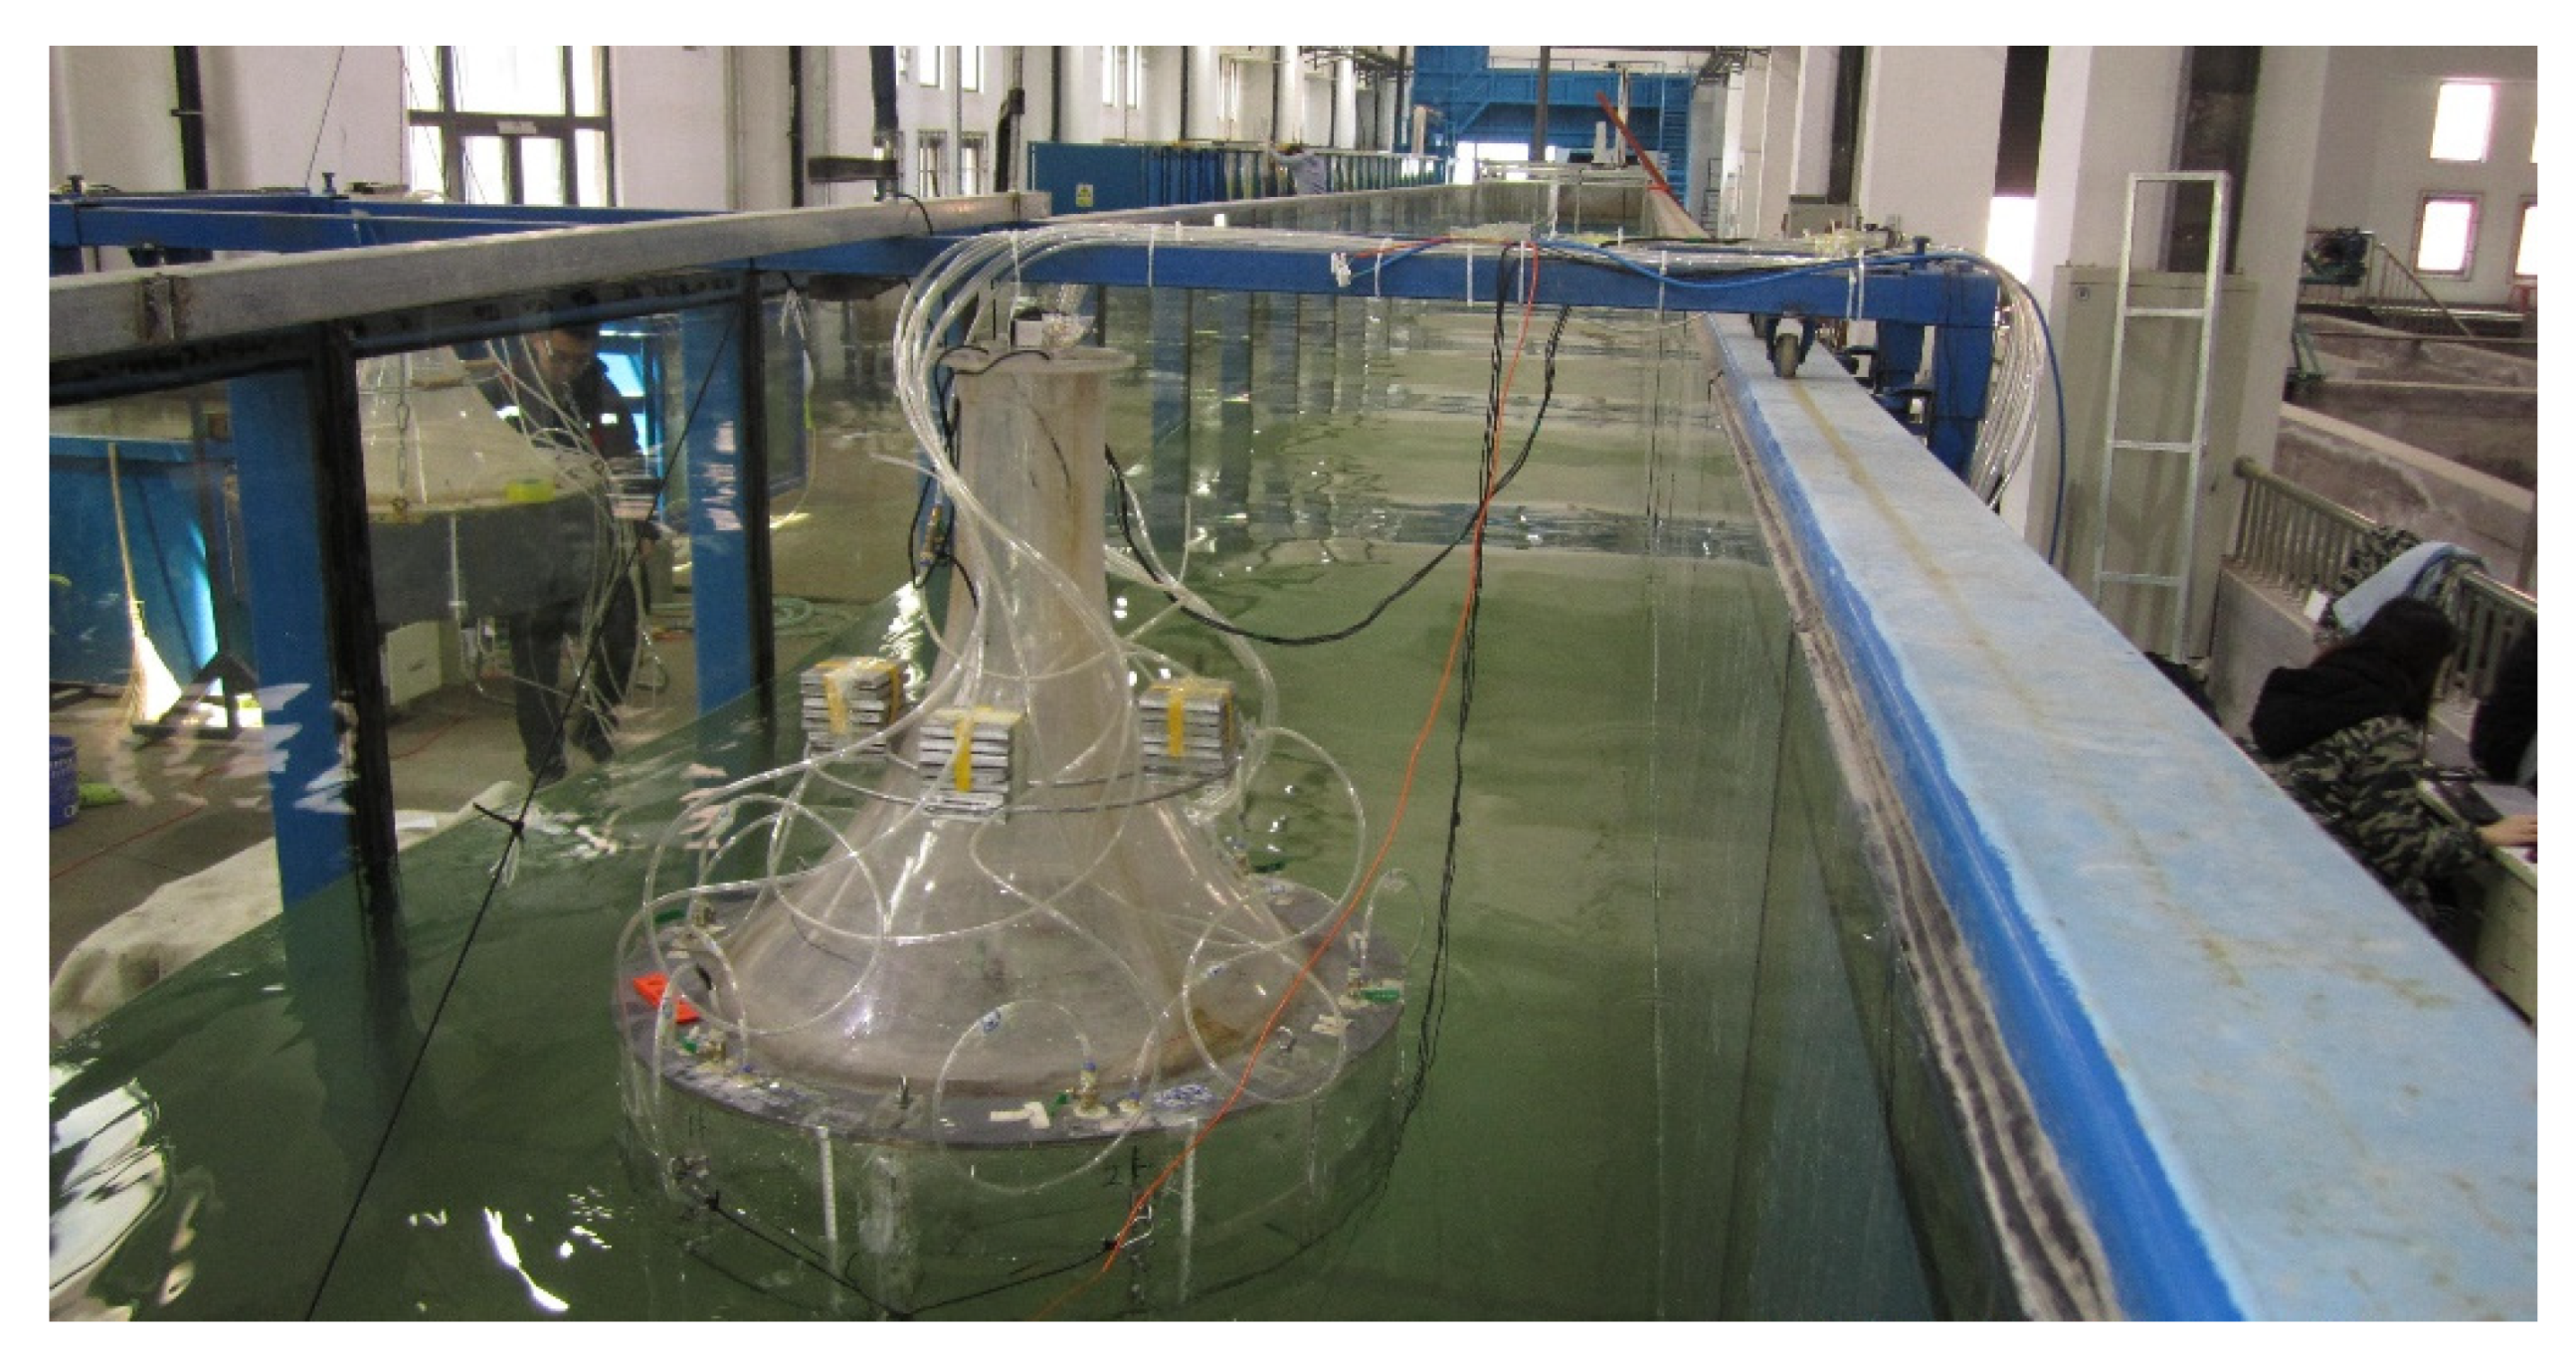
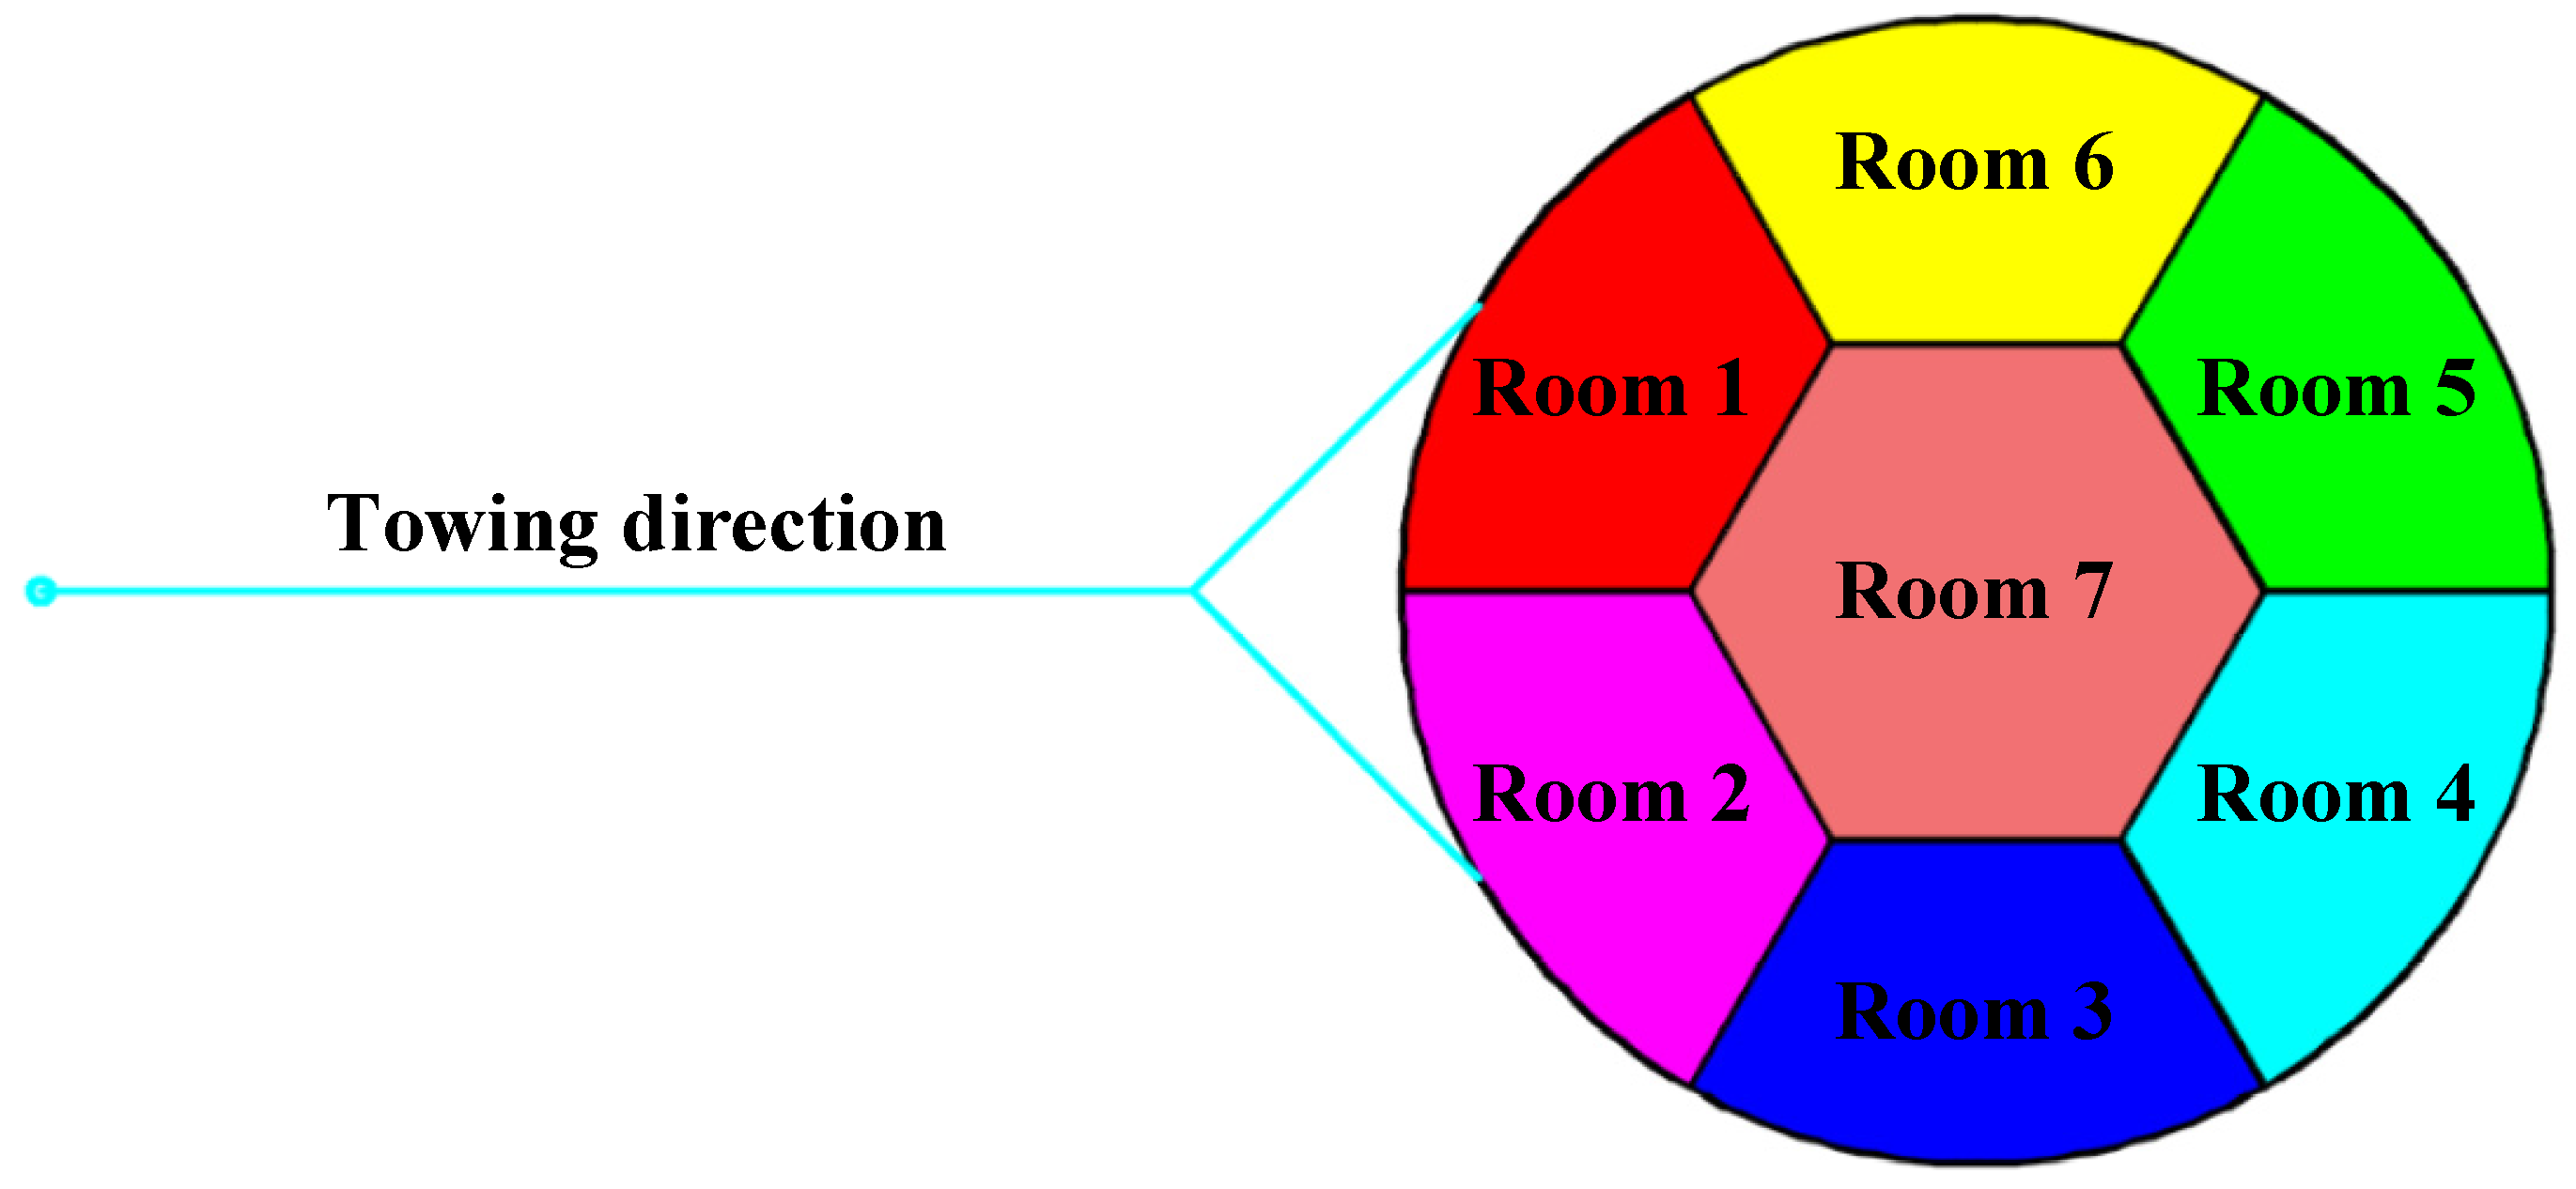
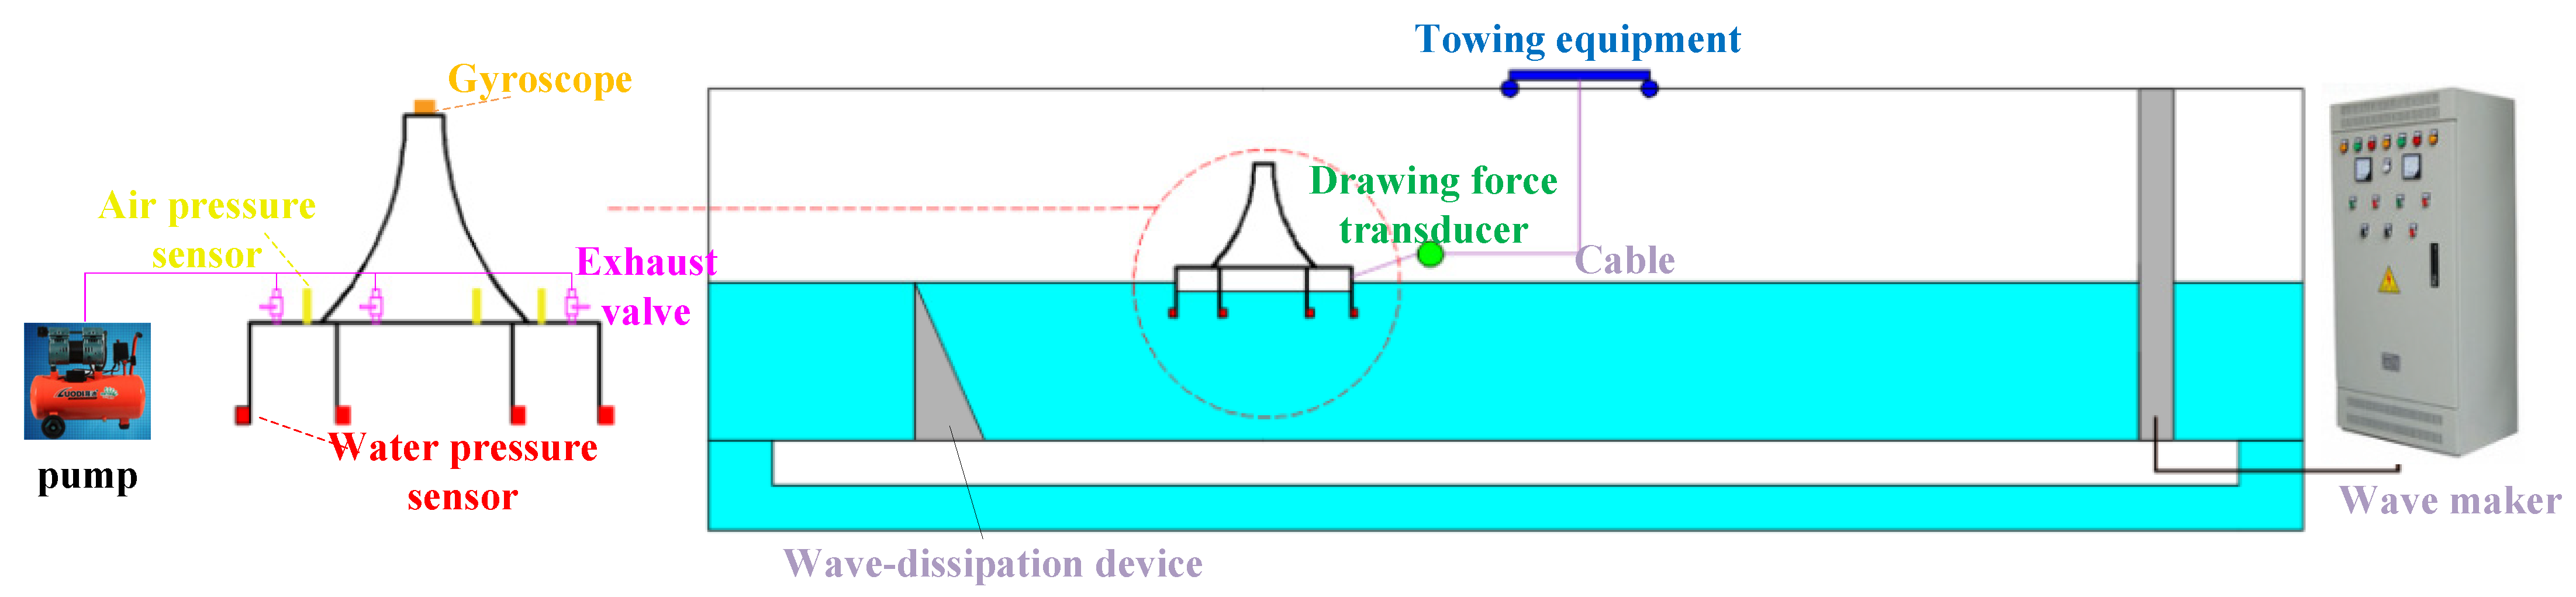
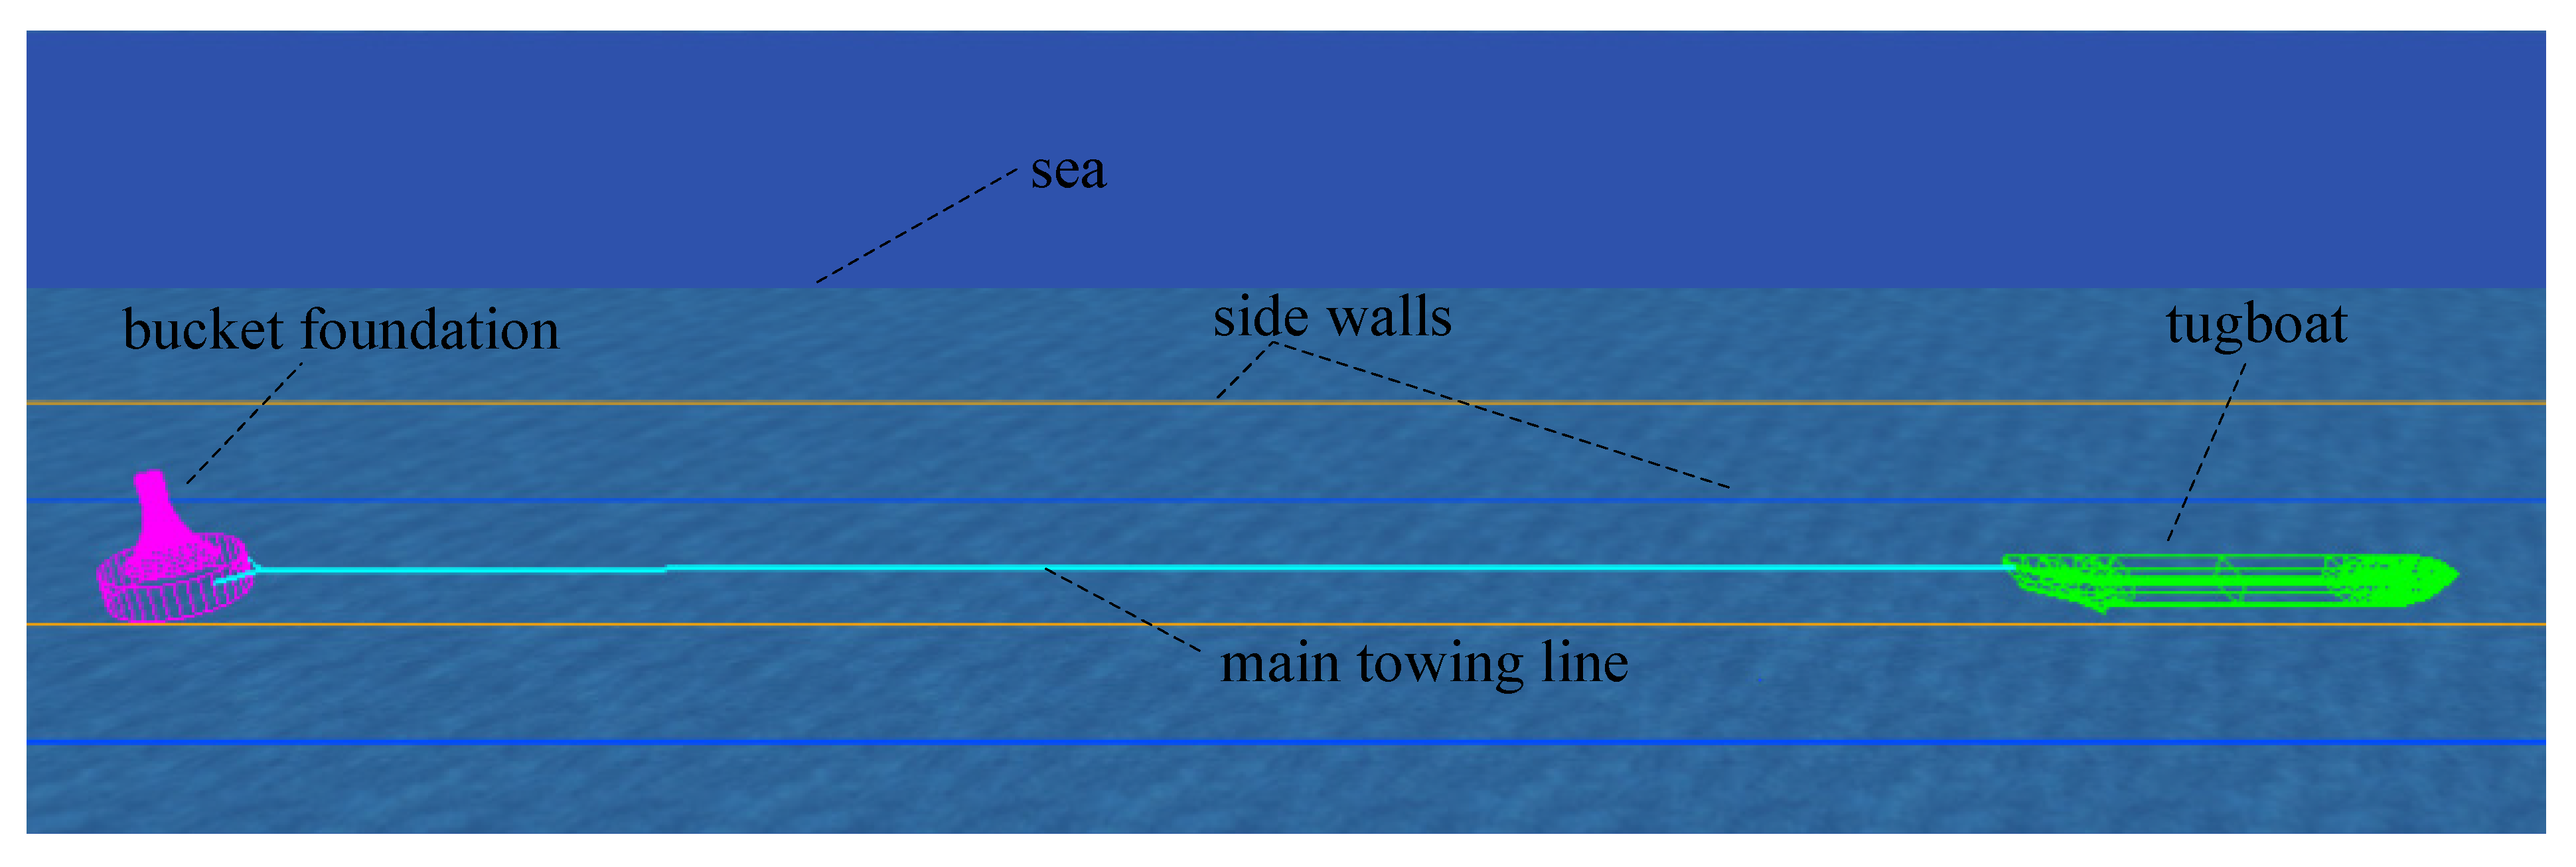
2. Test Model
3. Numerical Simulation Settings
3.1. Theory
3.2. Wave Spectrum
3.3. Current Load and Wind Load
3.4. Numerical Simulation Conditions
3.5. Static Stability Verification
4. Analysis
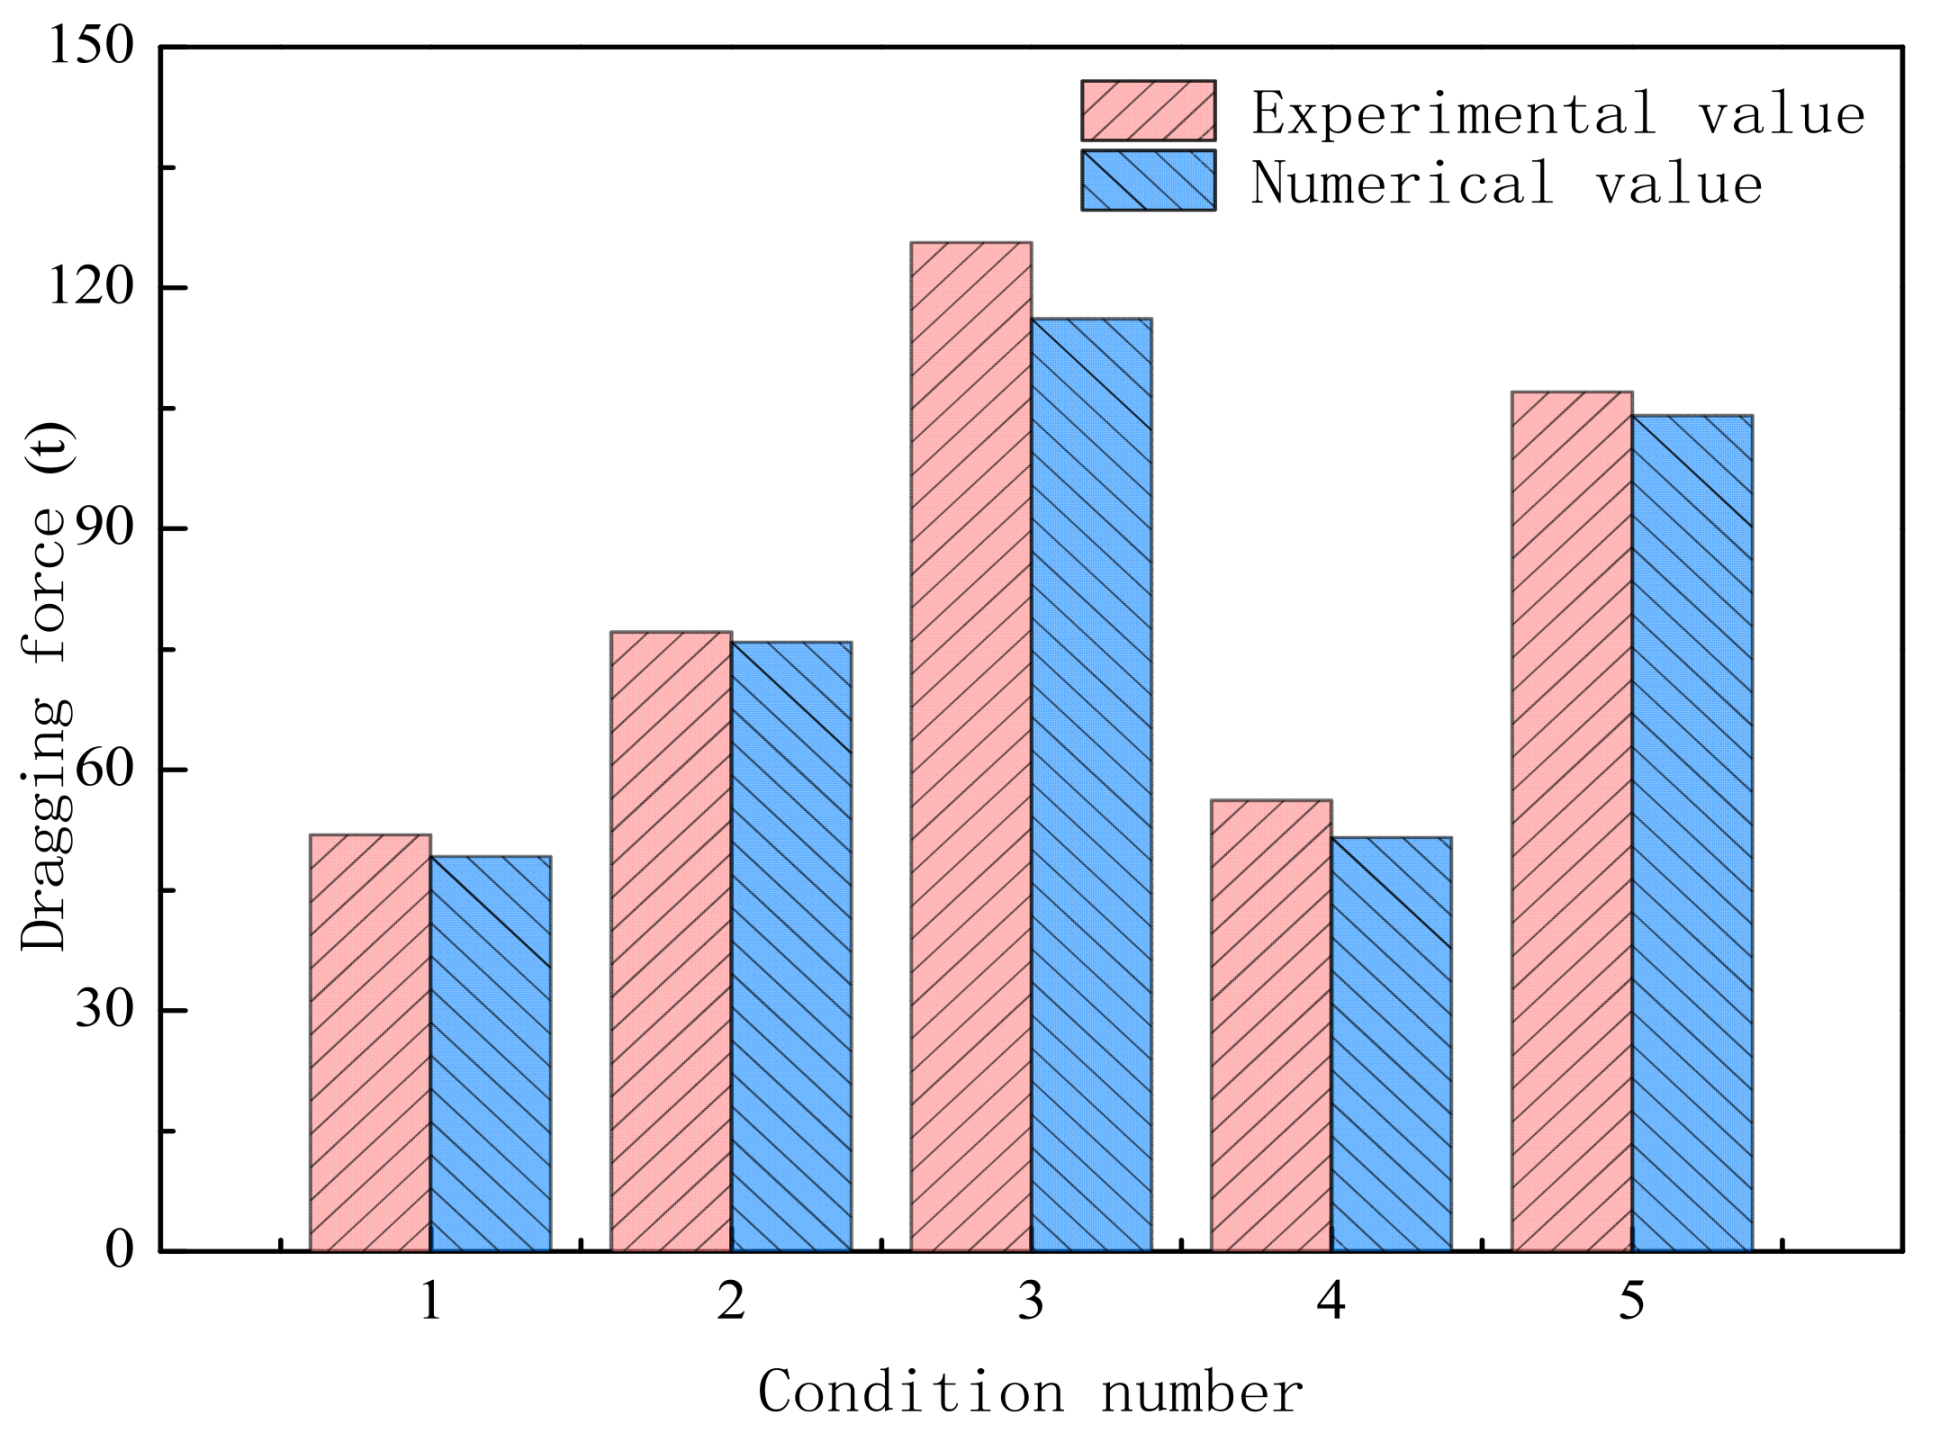
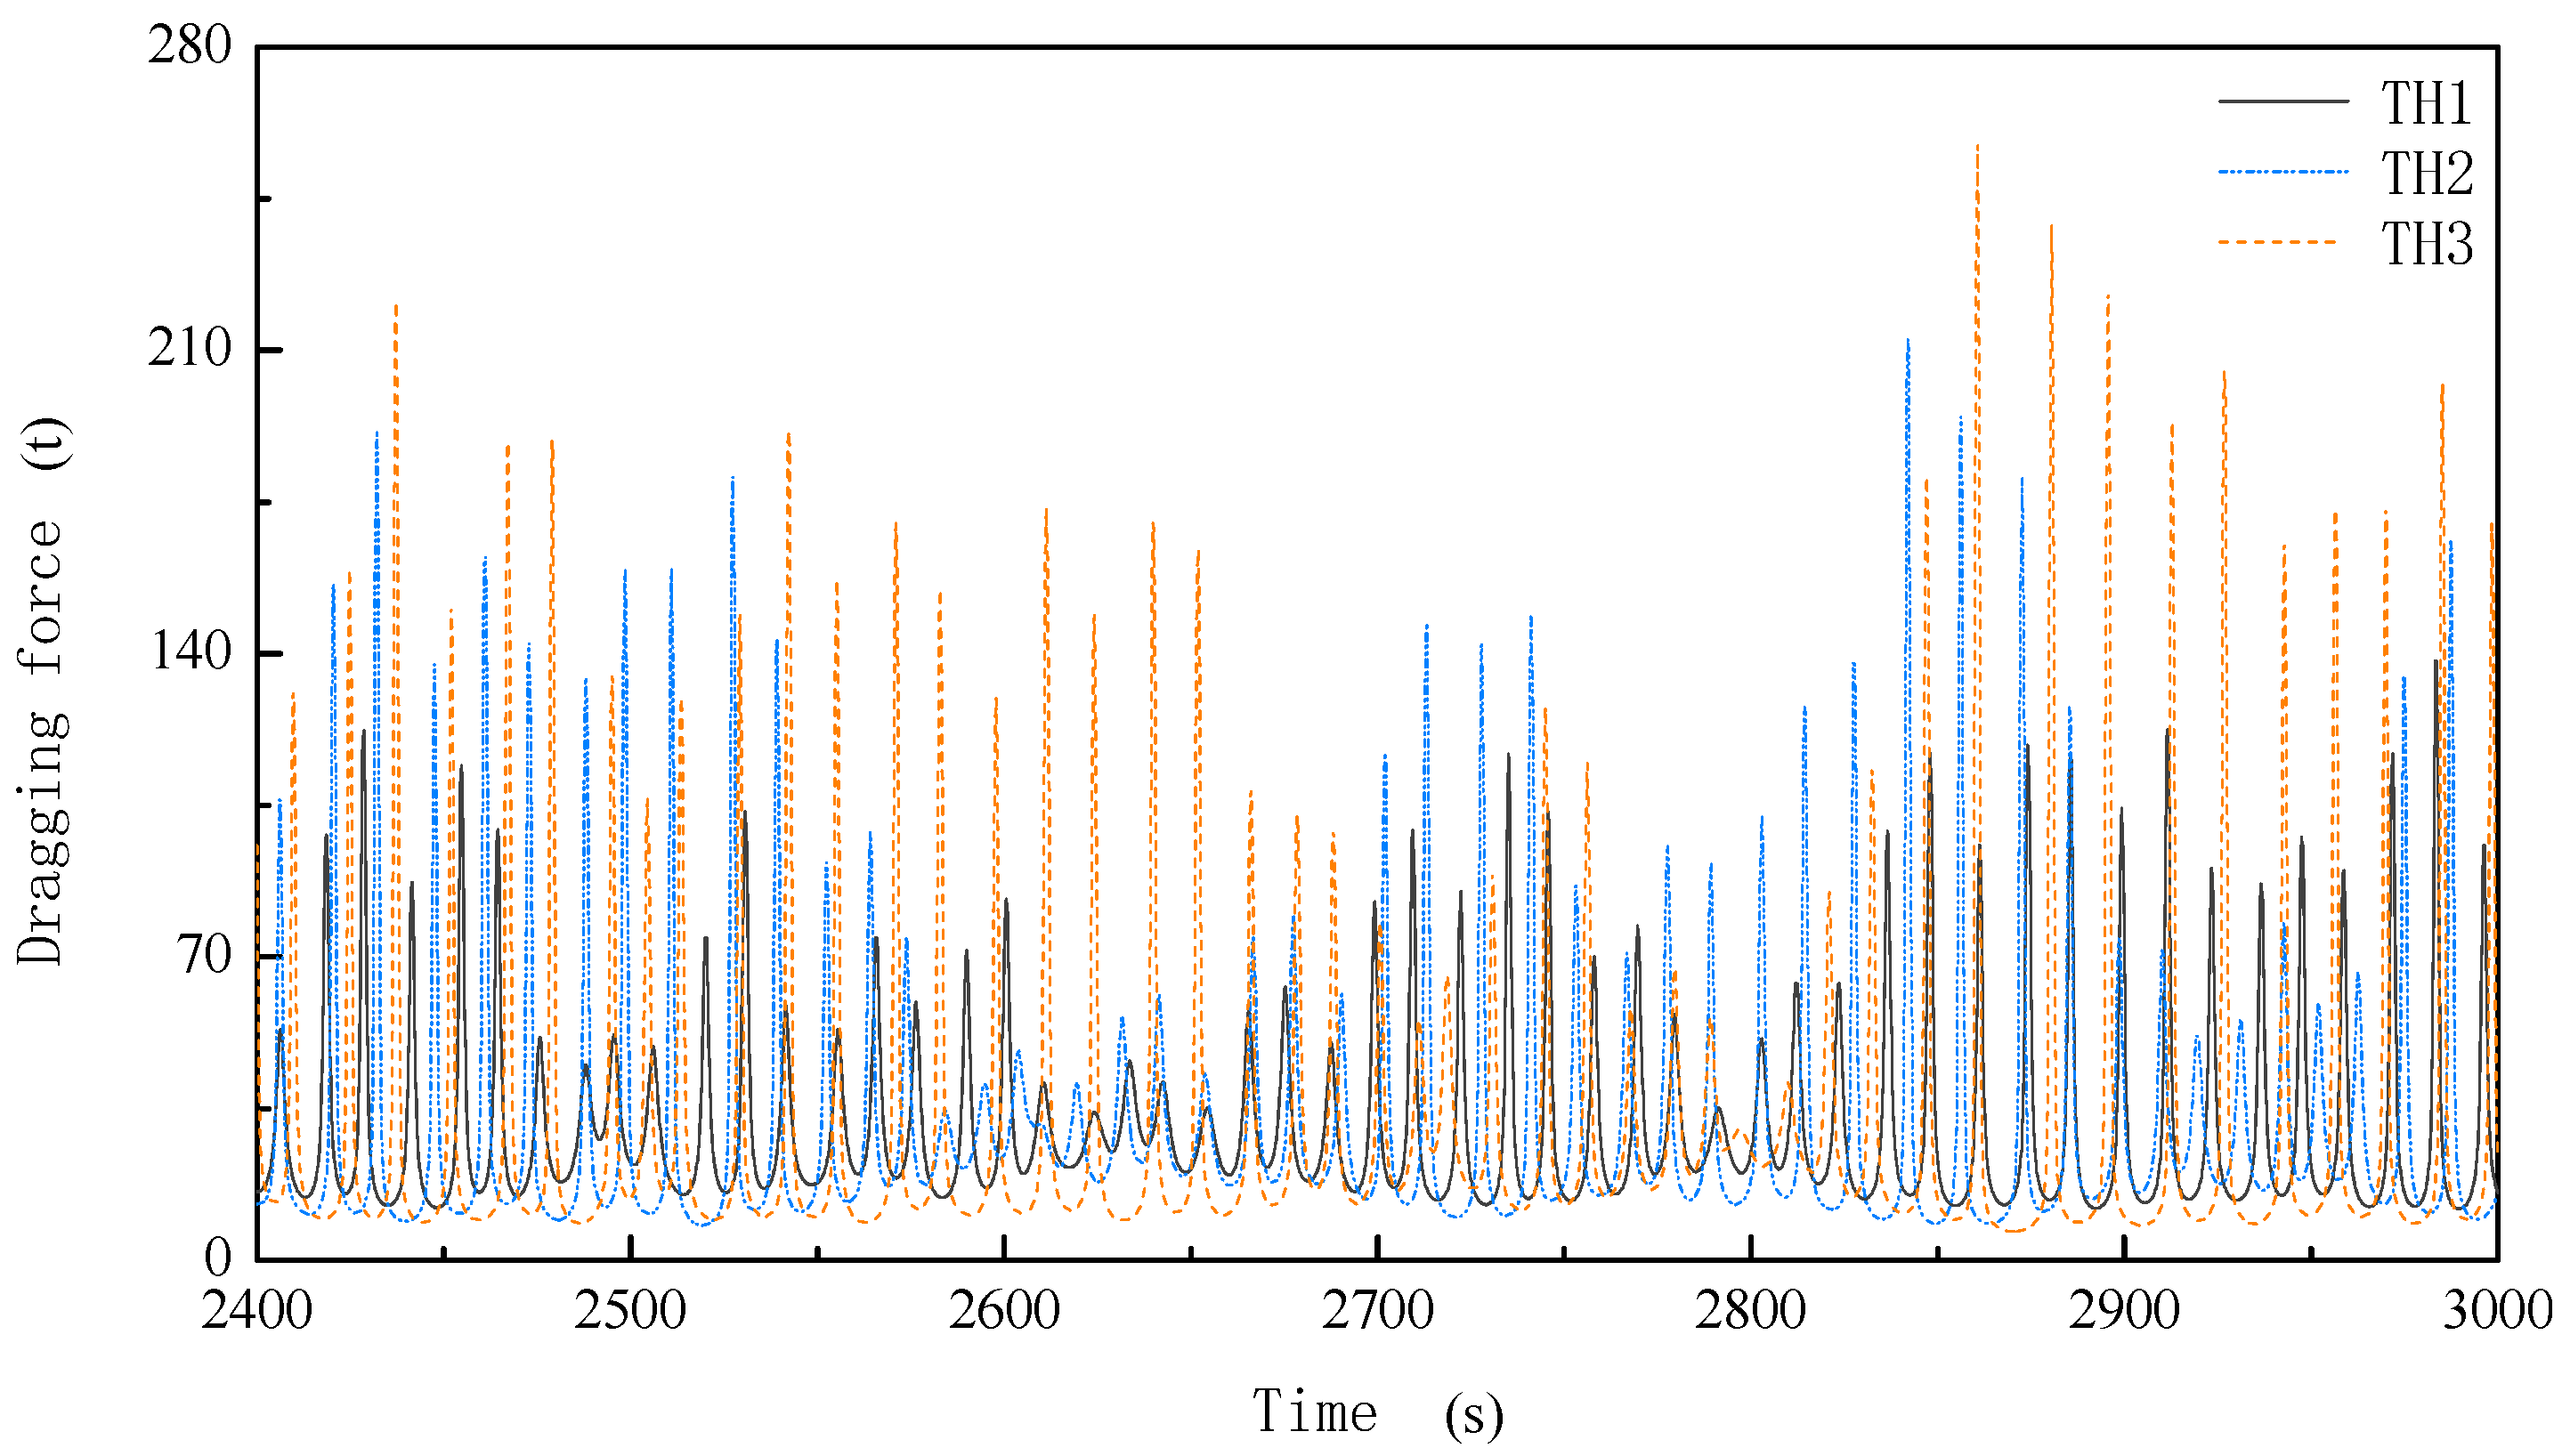
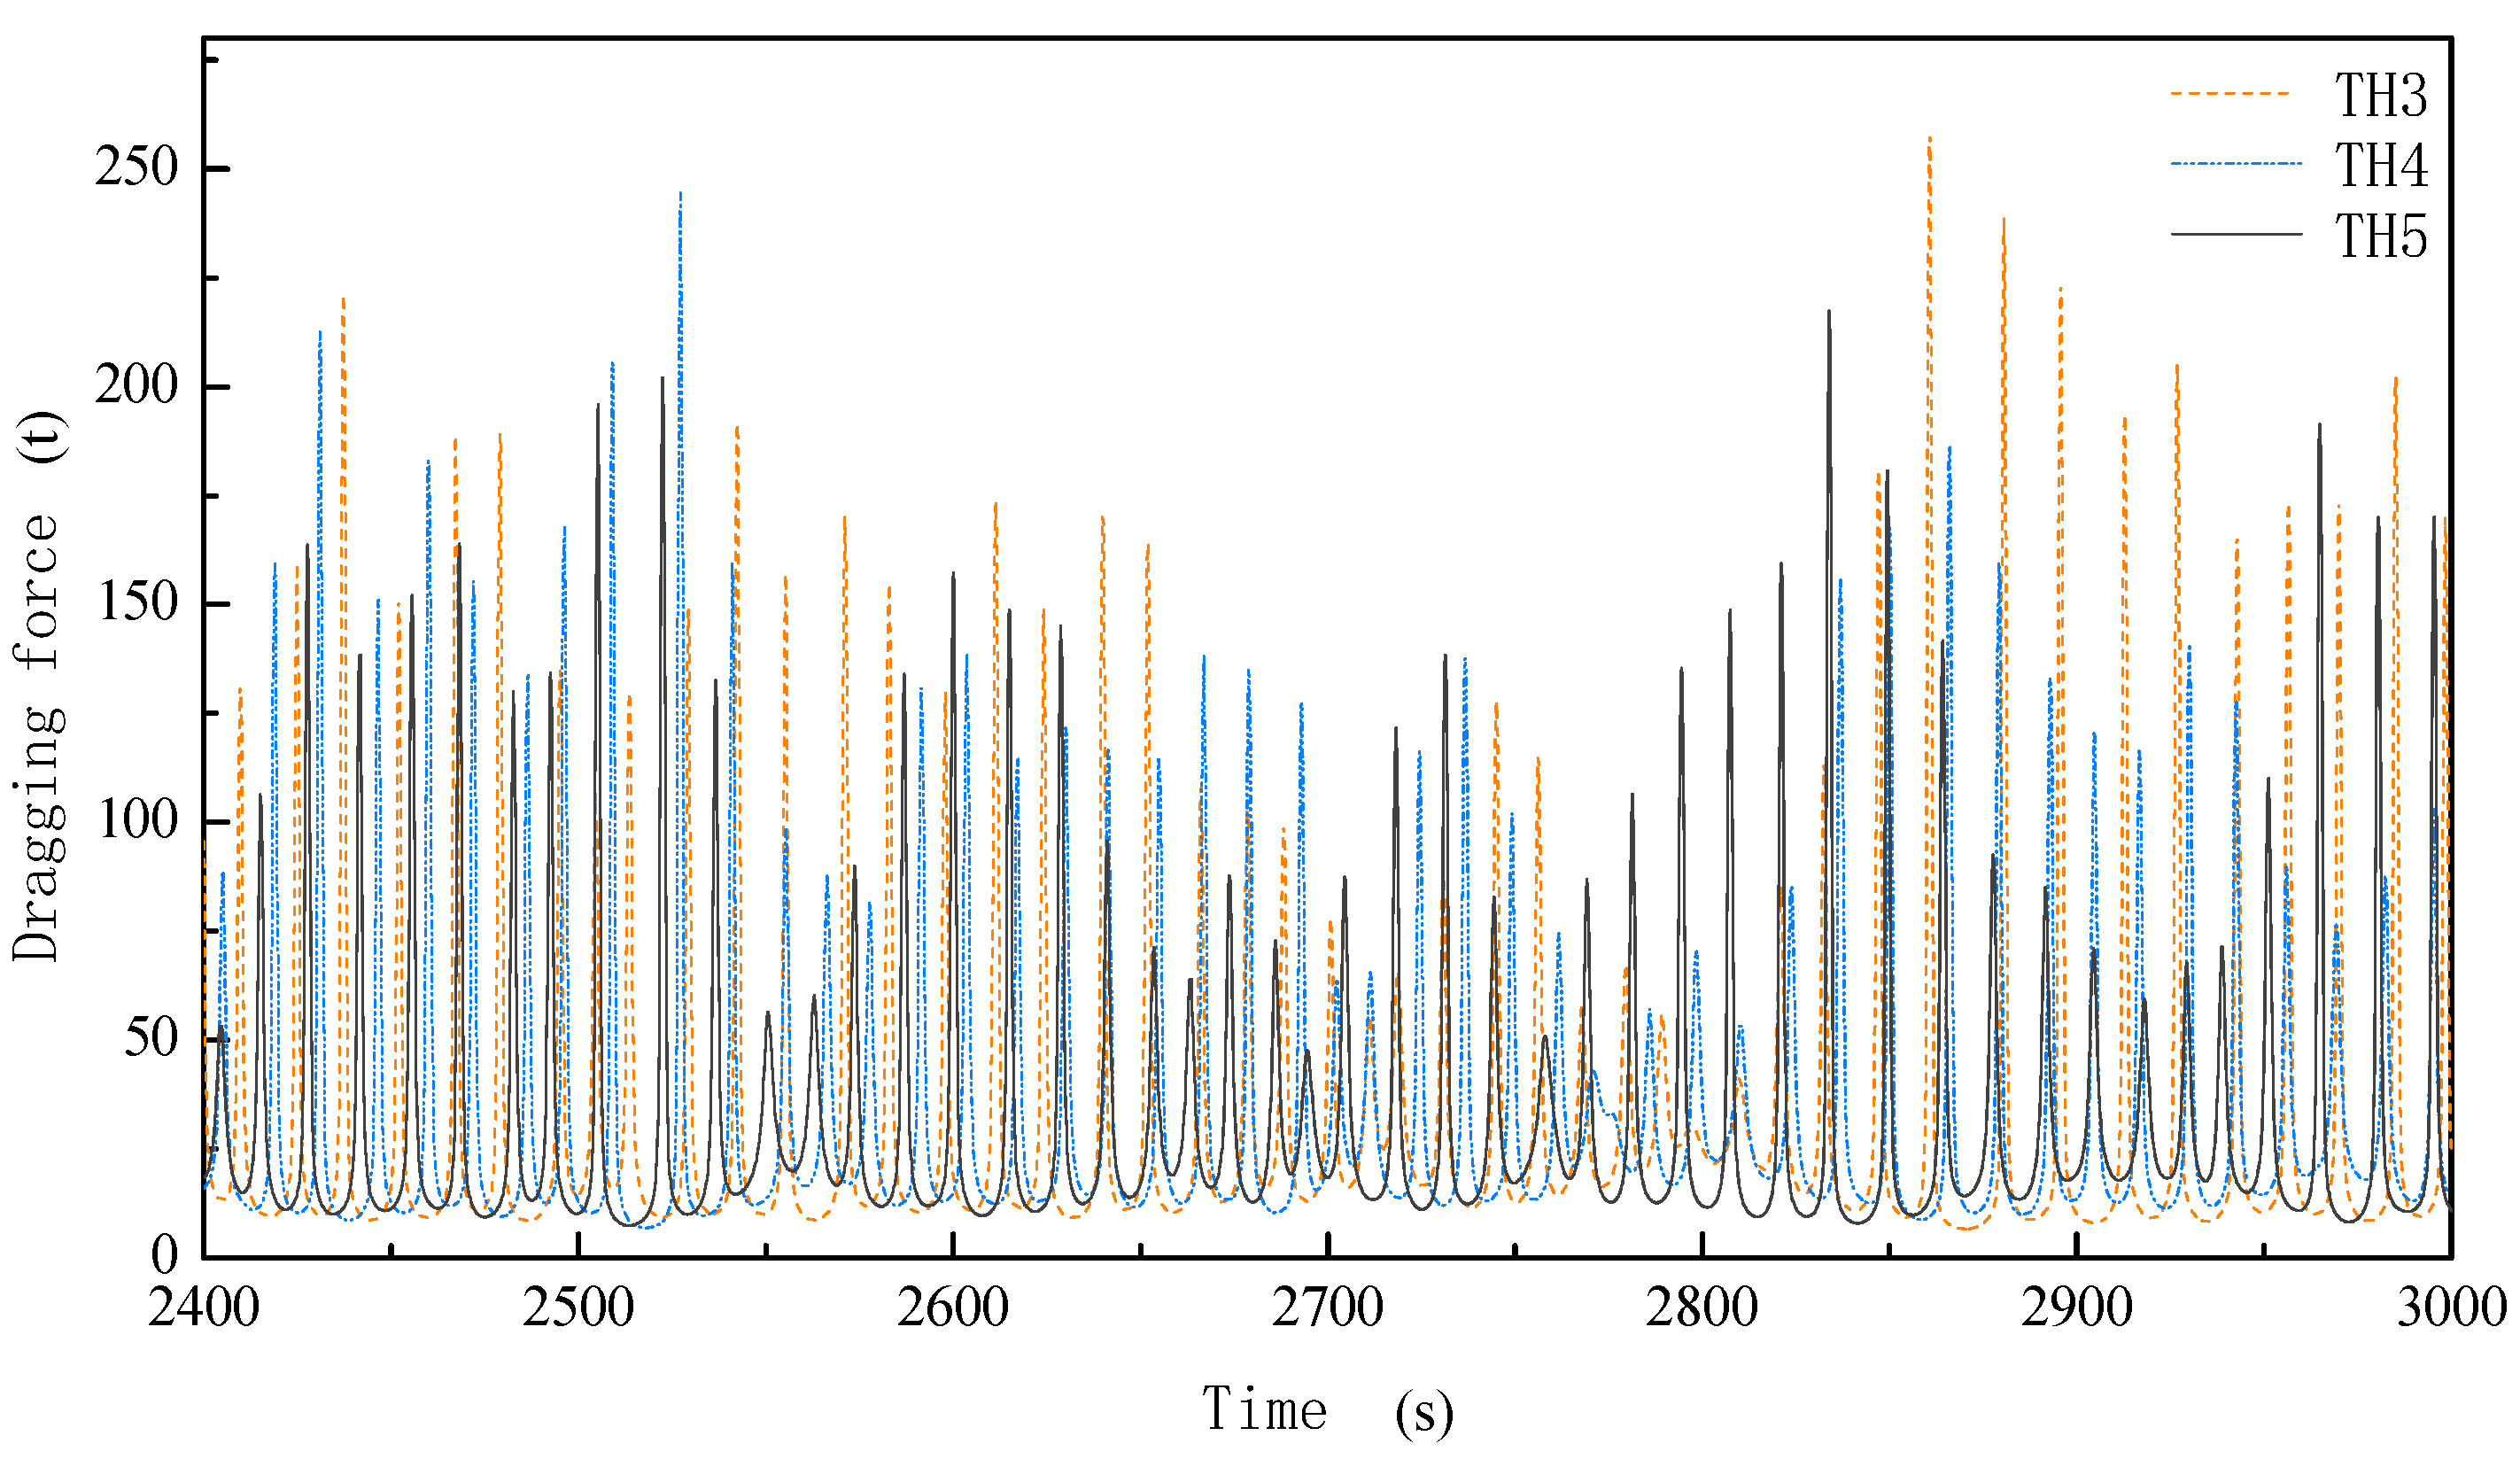
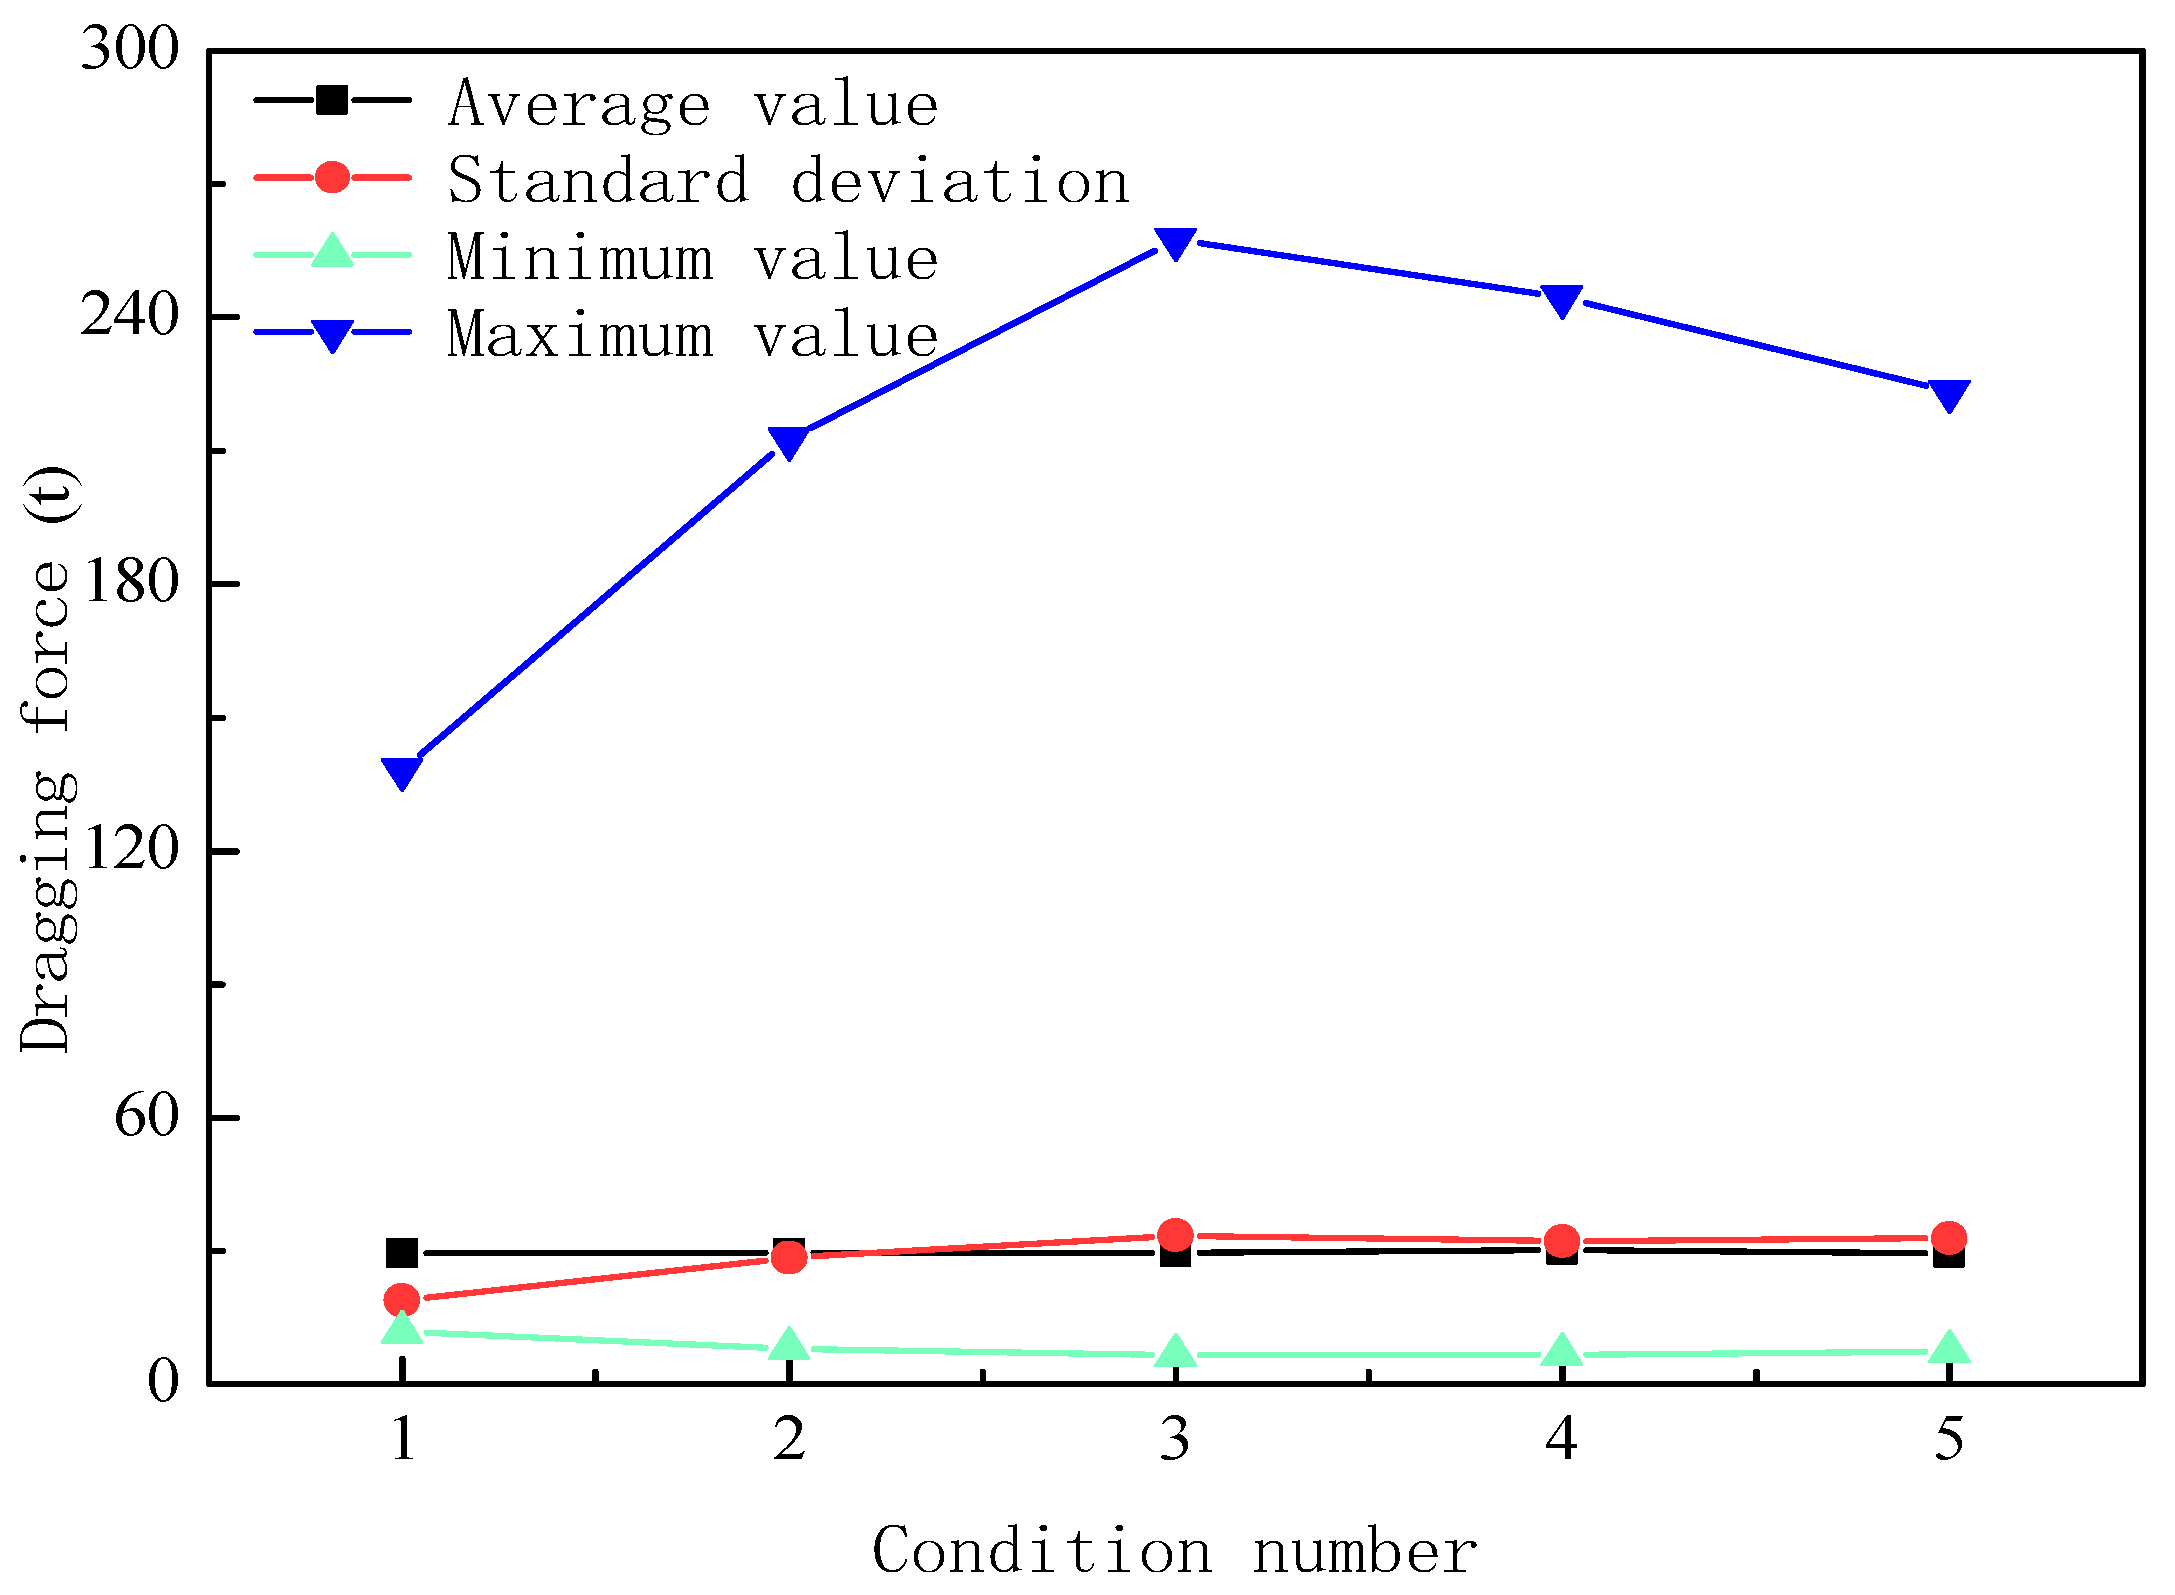
4.1. Cable Dragging Forces
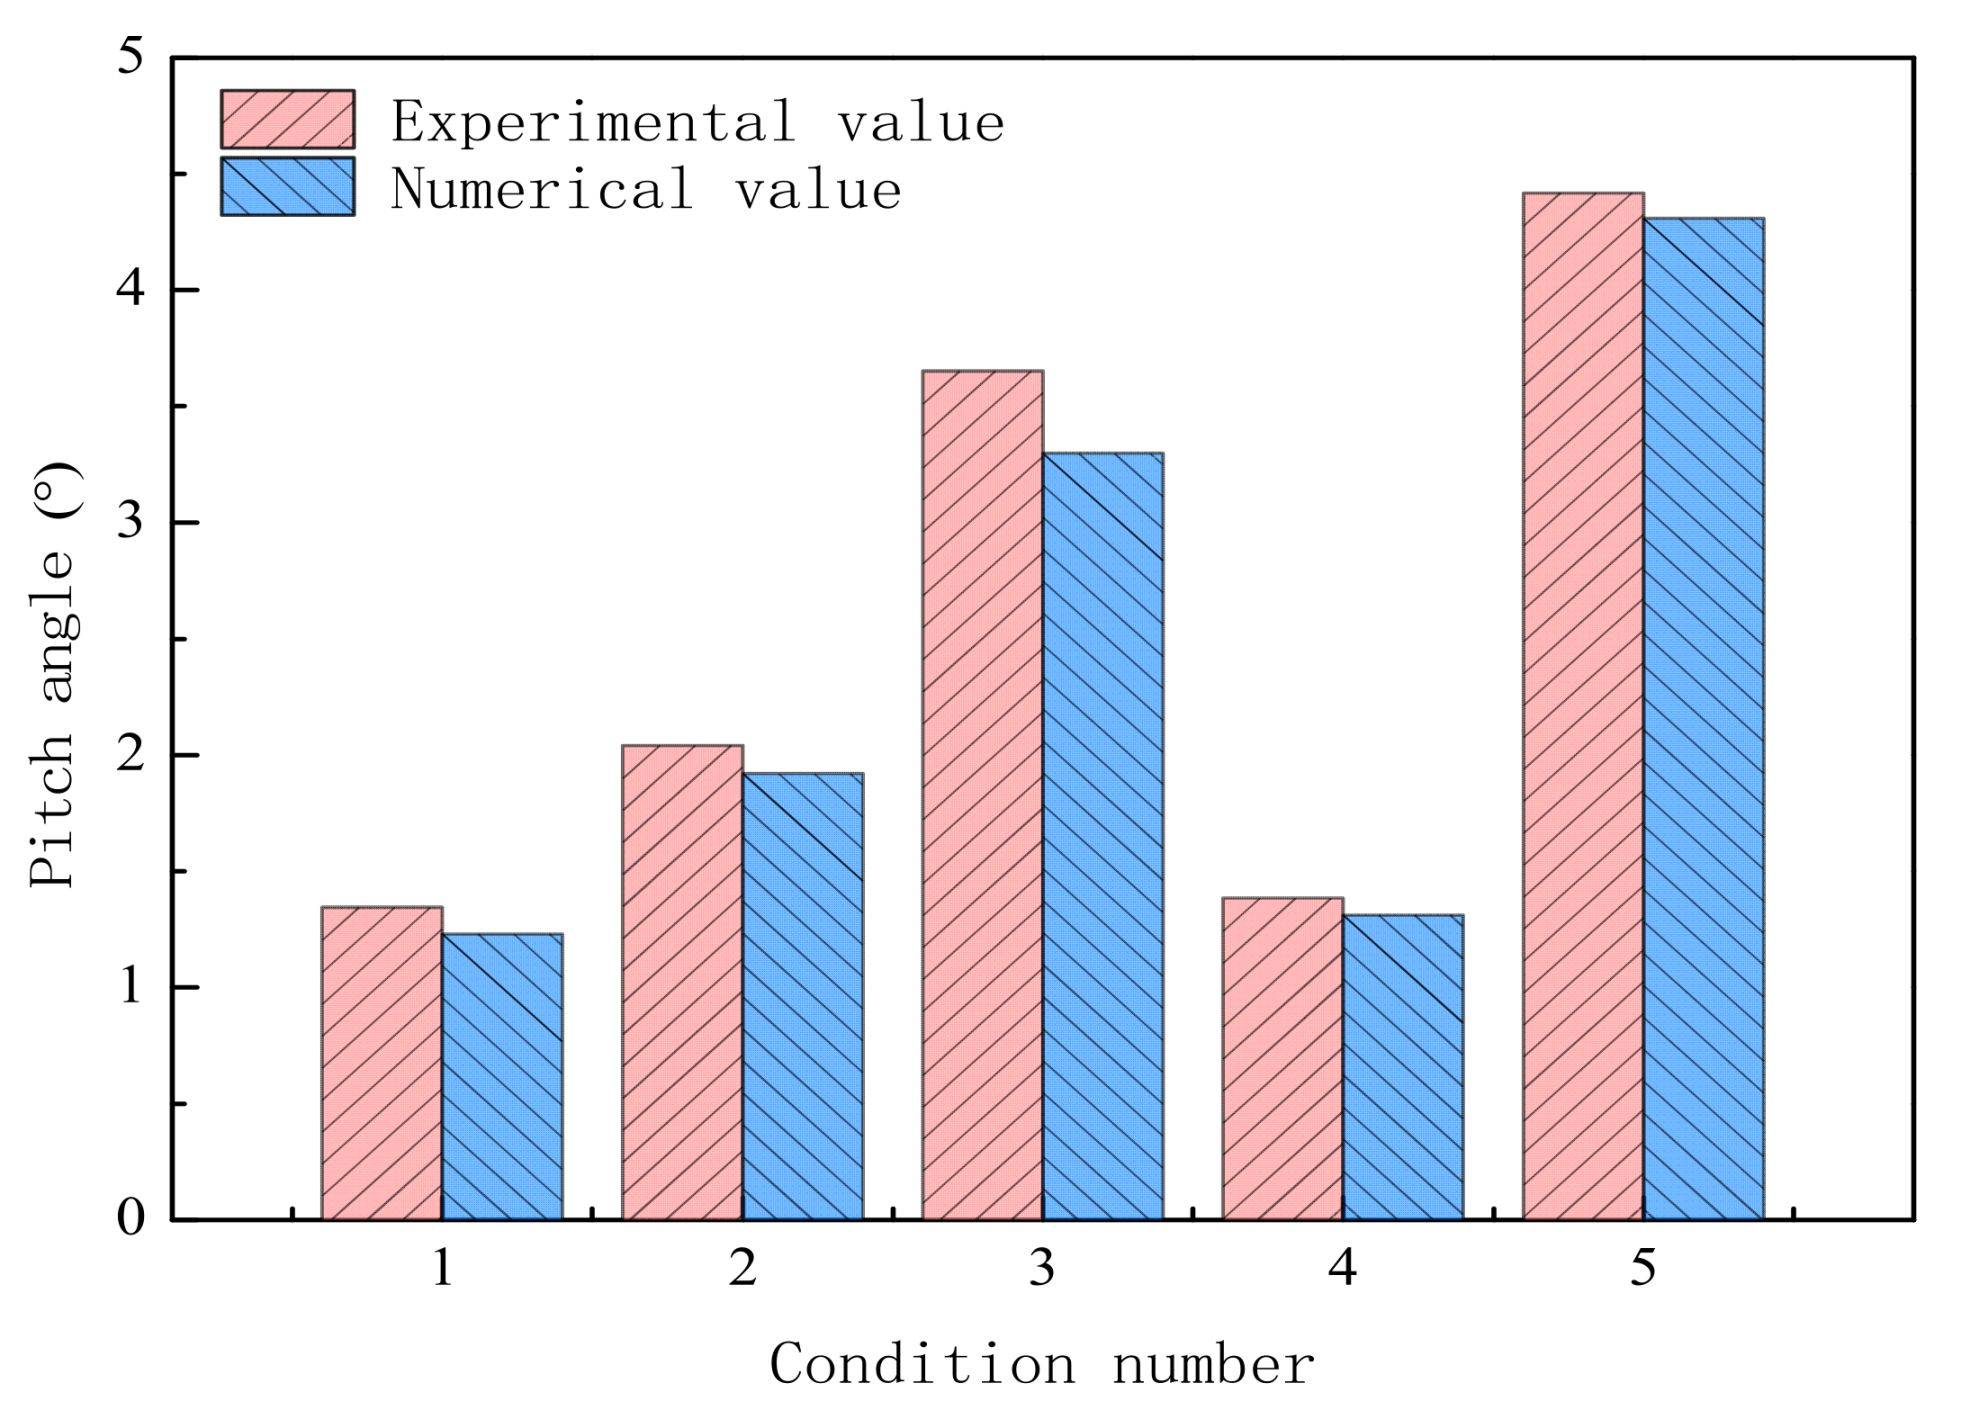
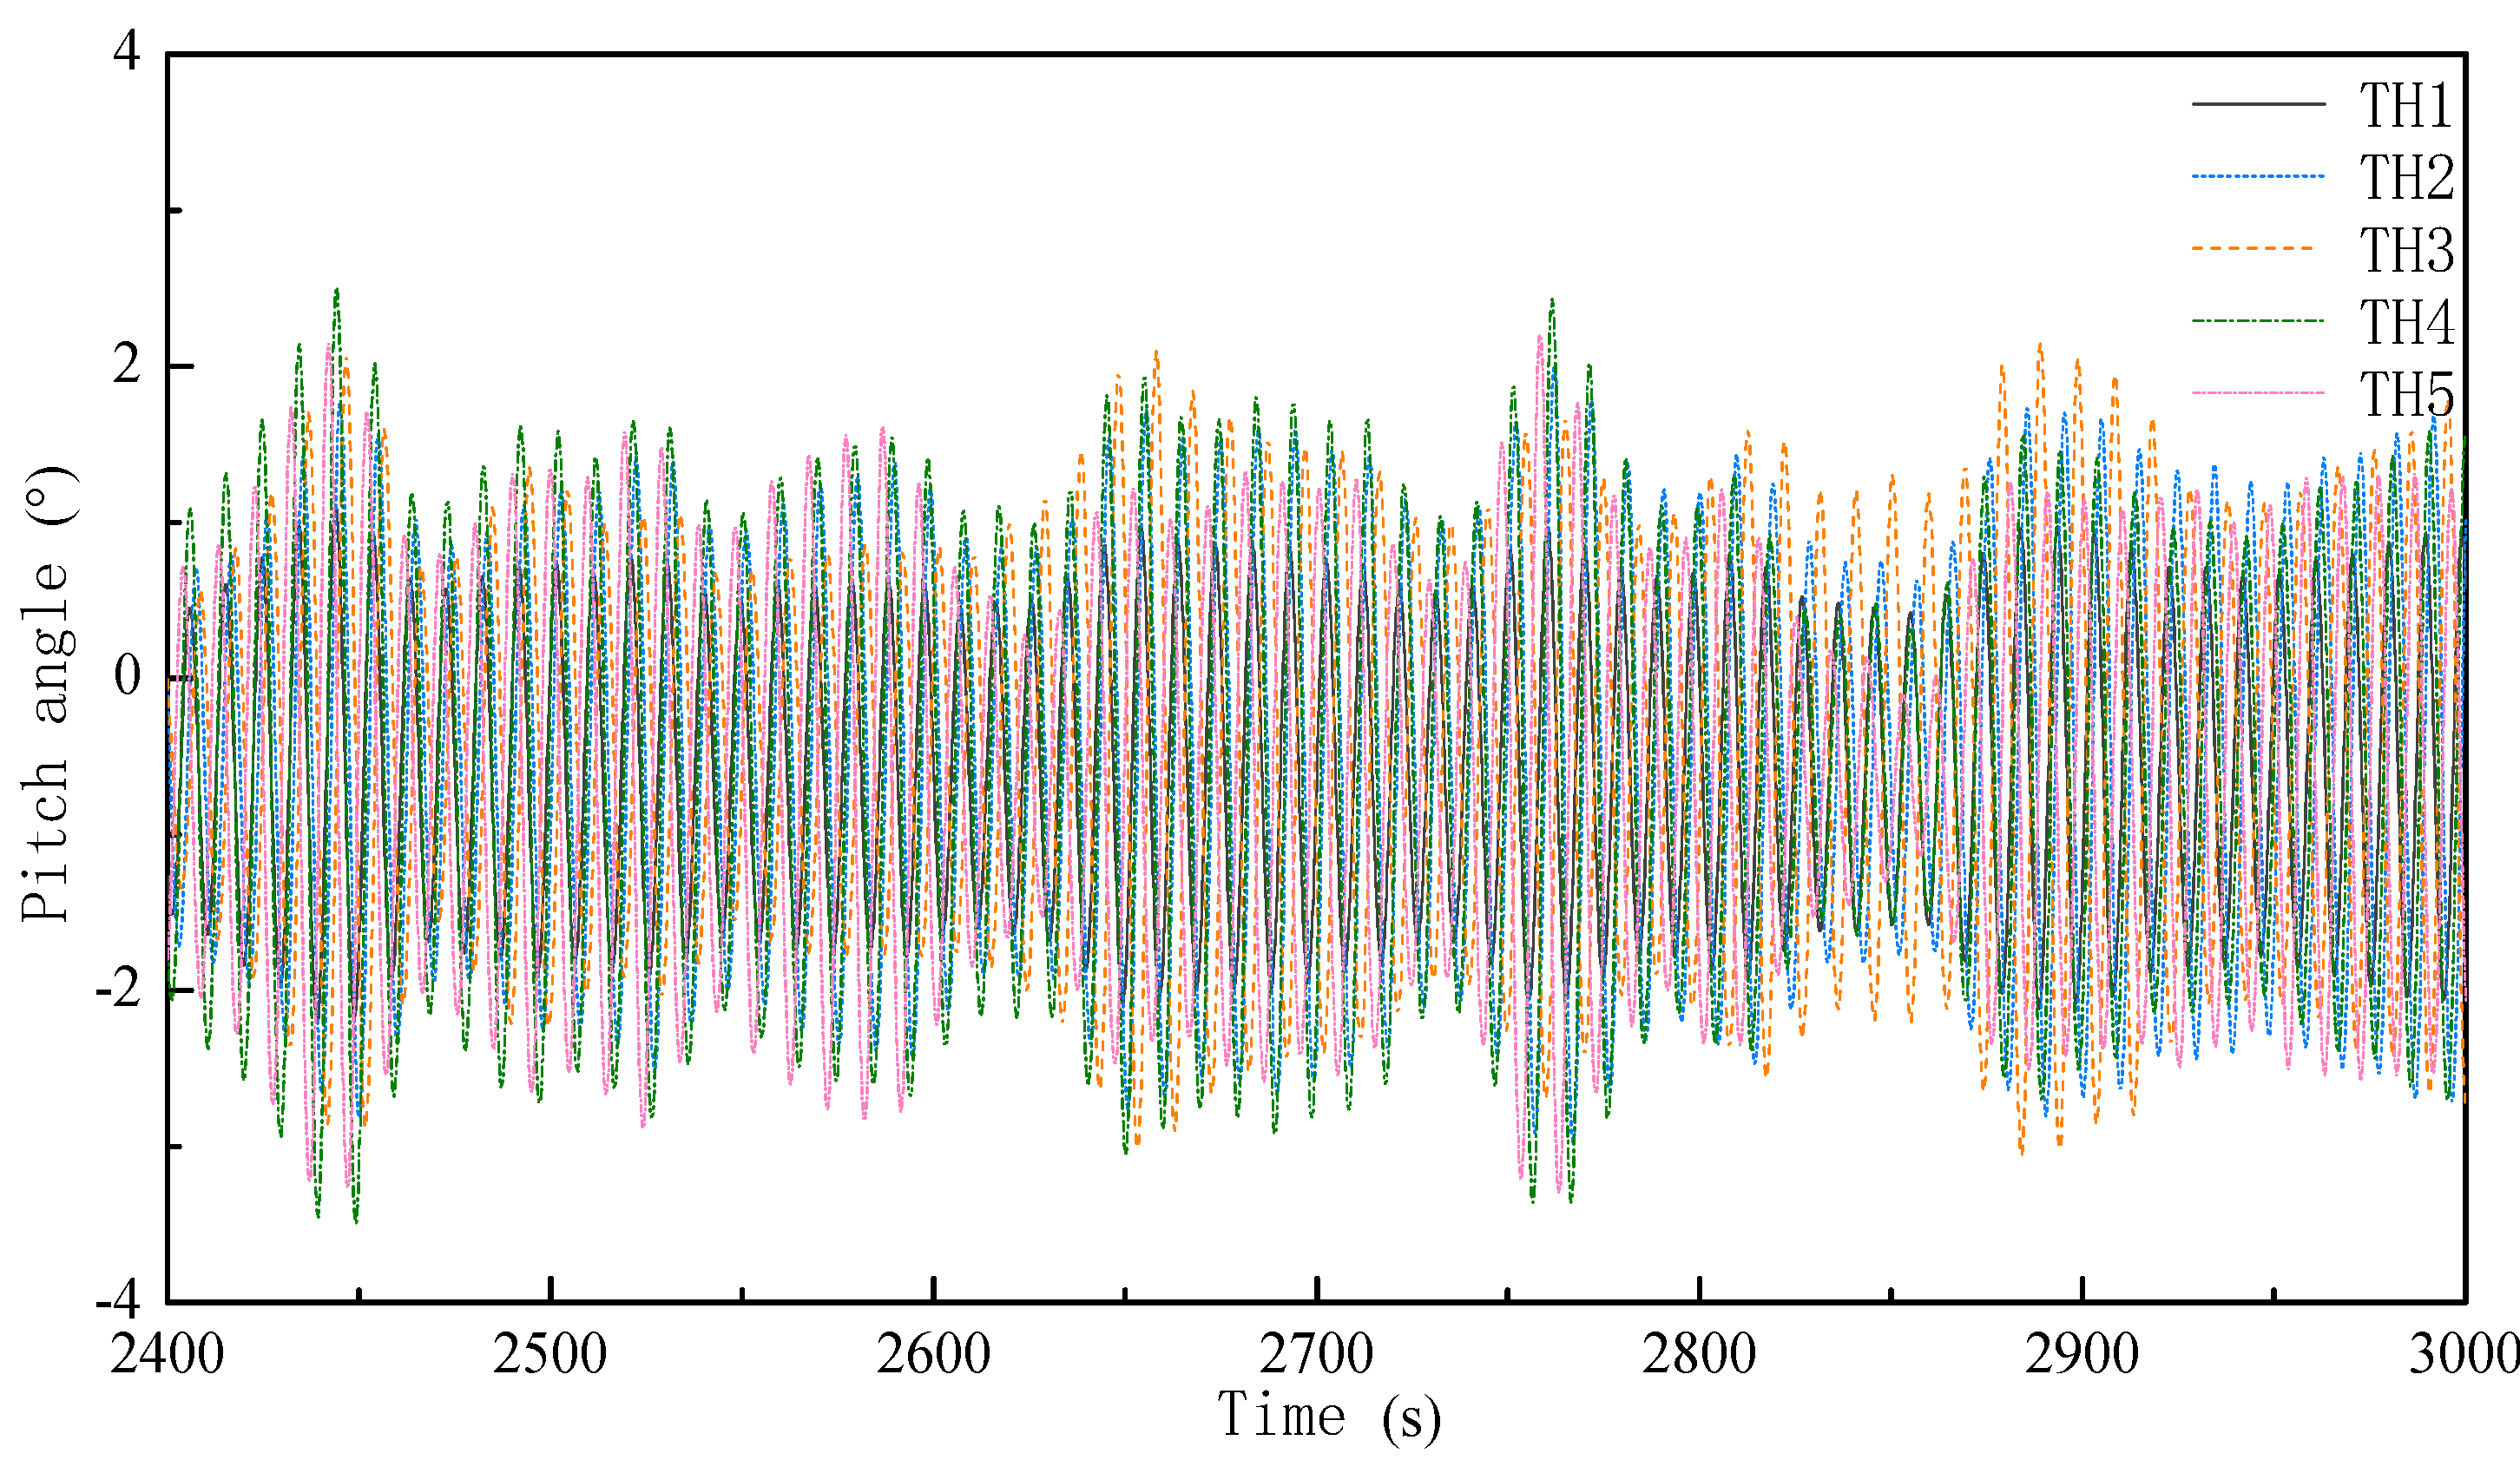
4.2. Pitch Angles
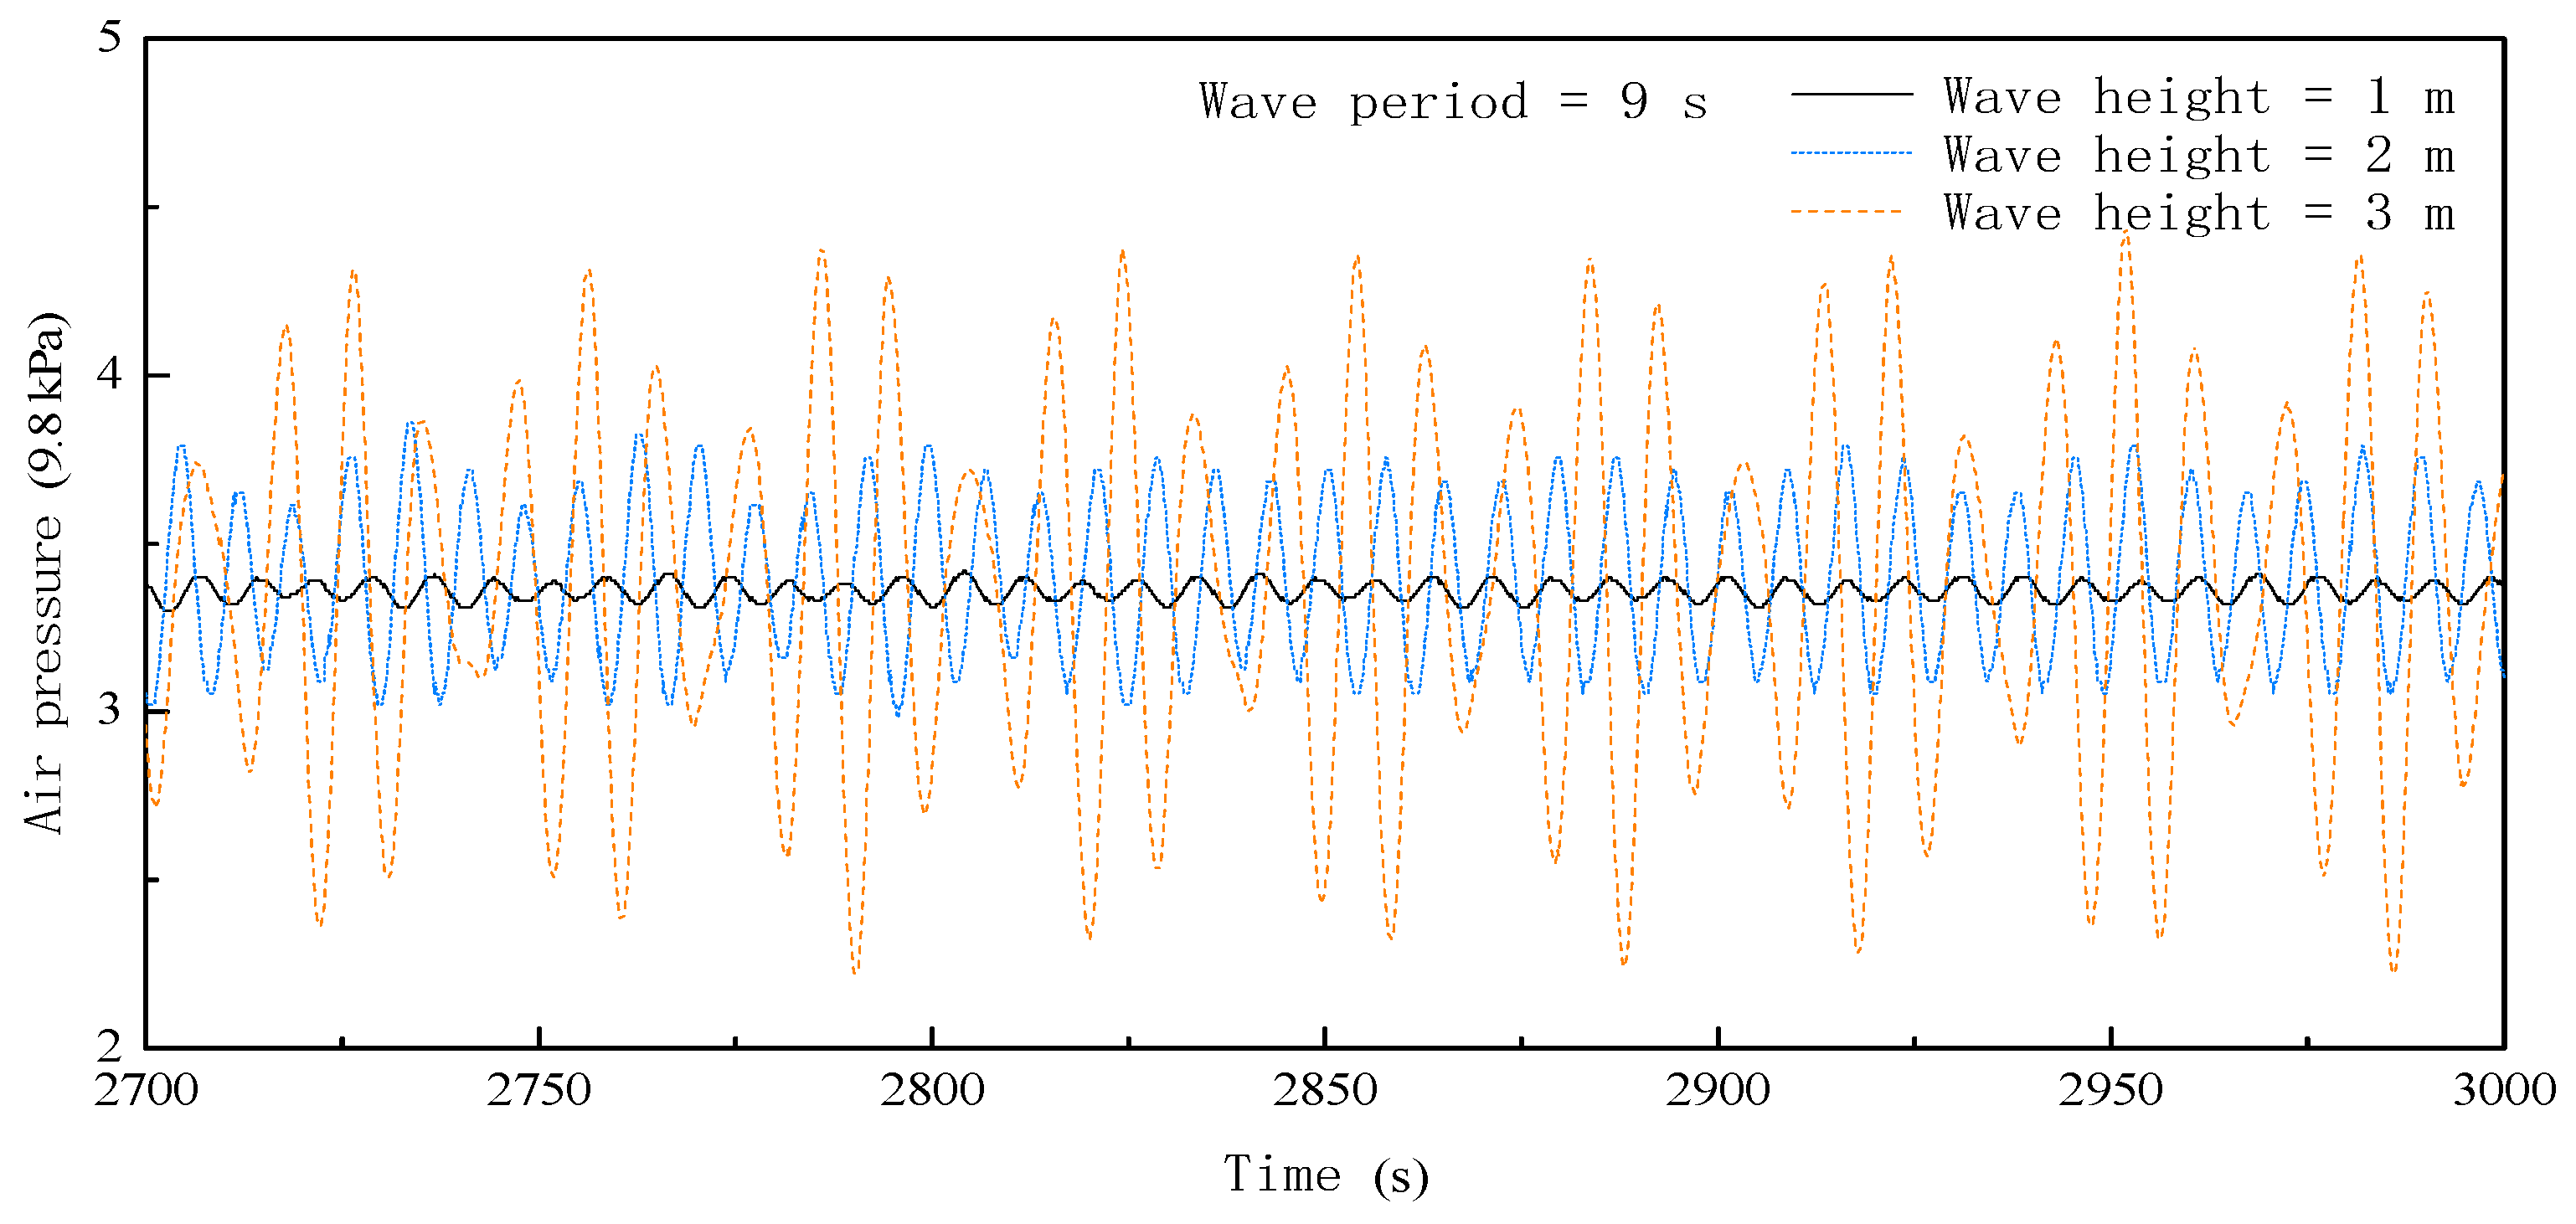
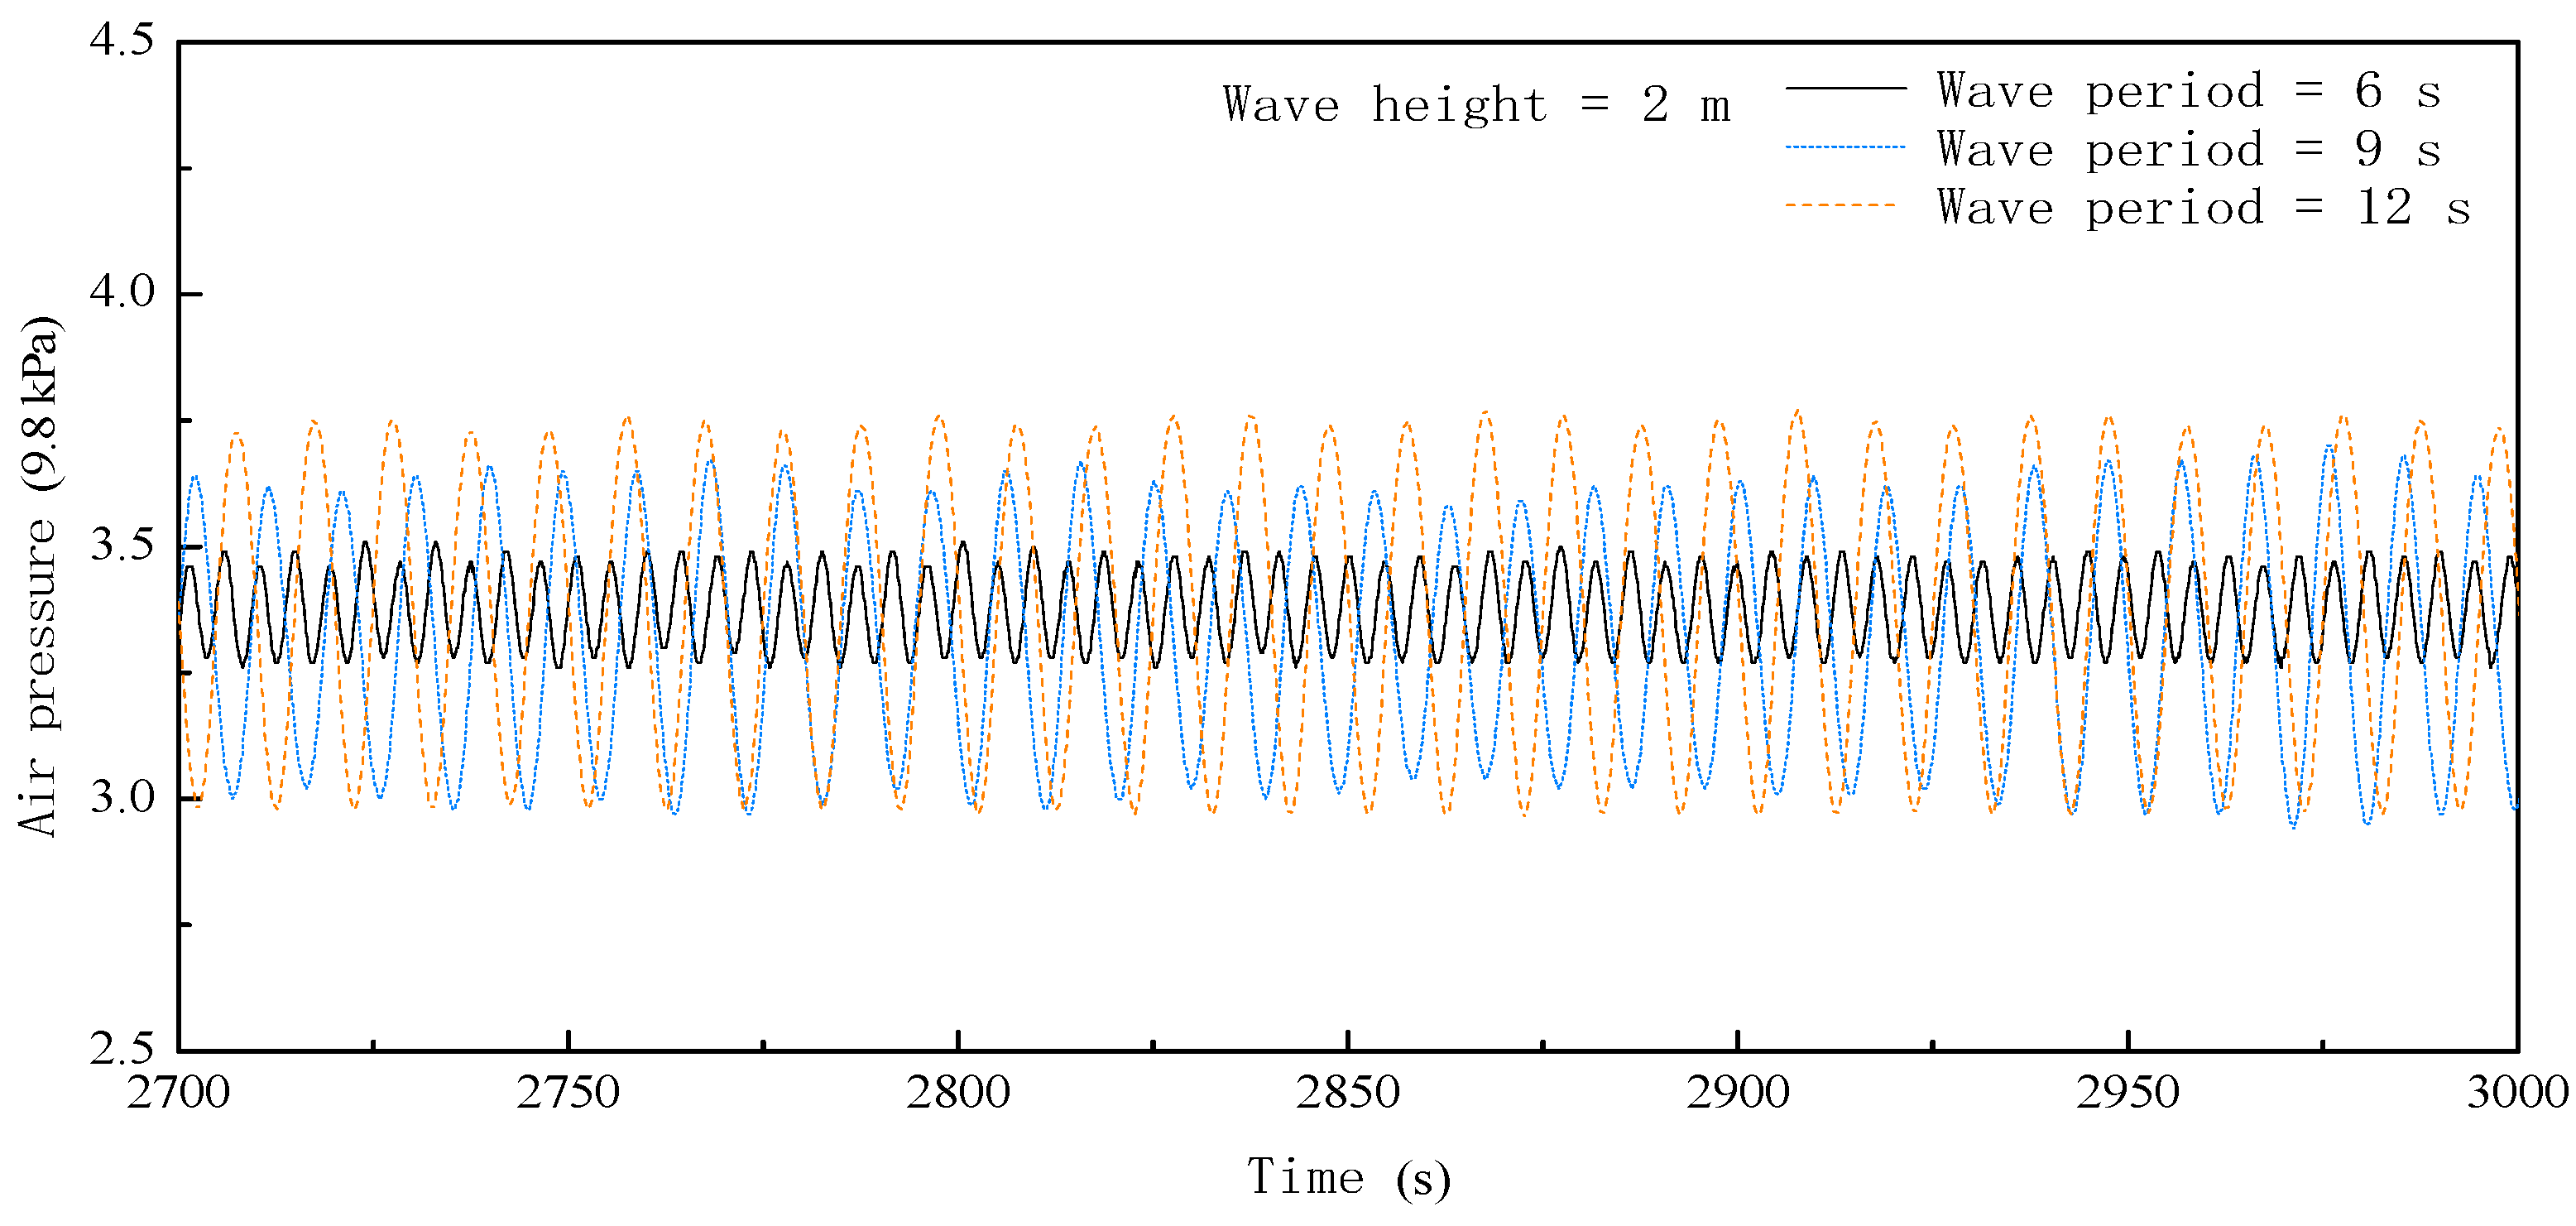
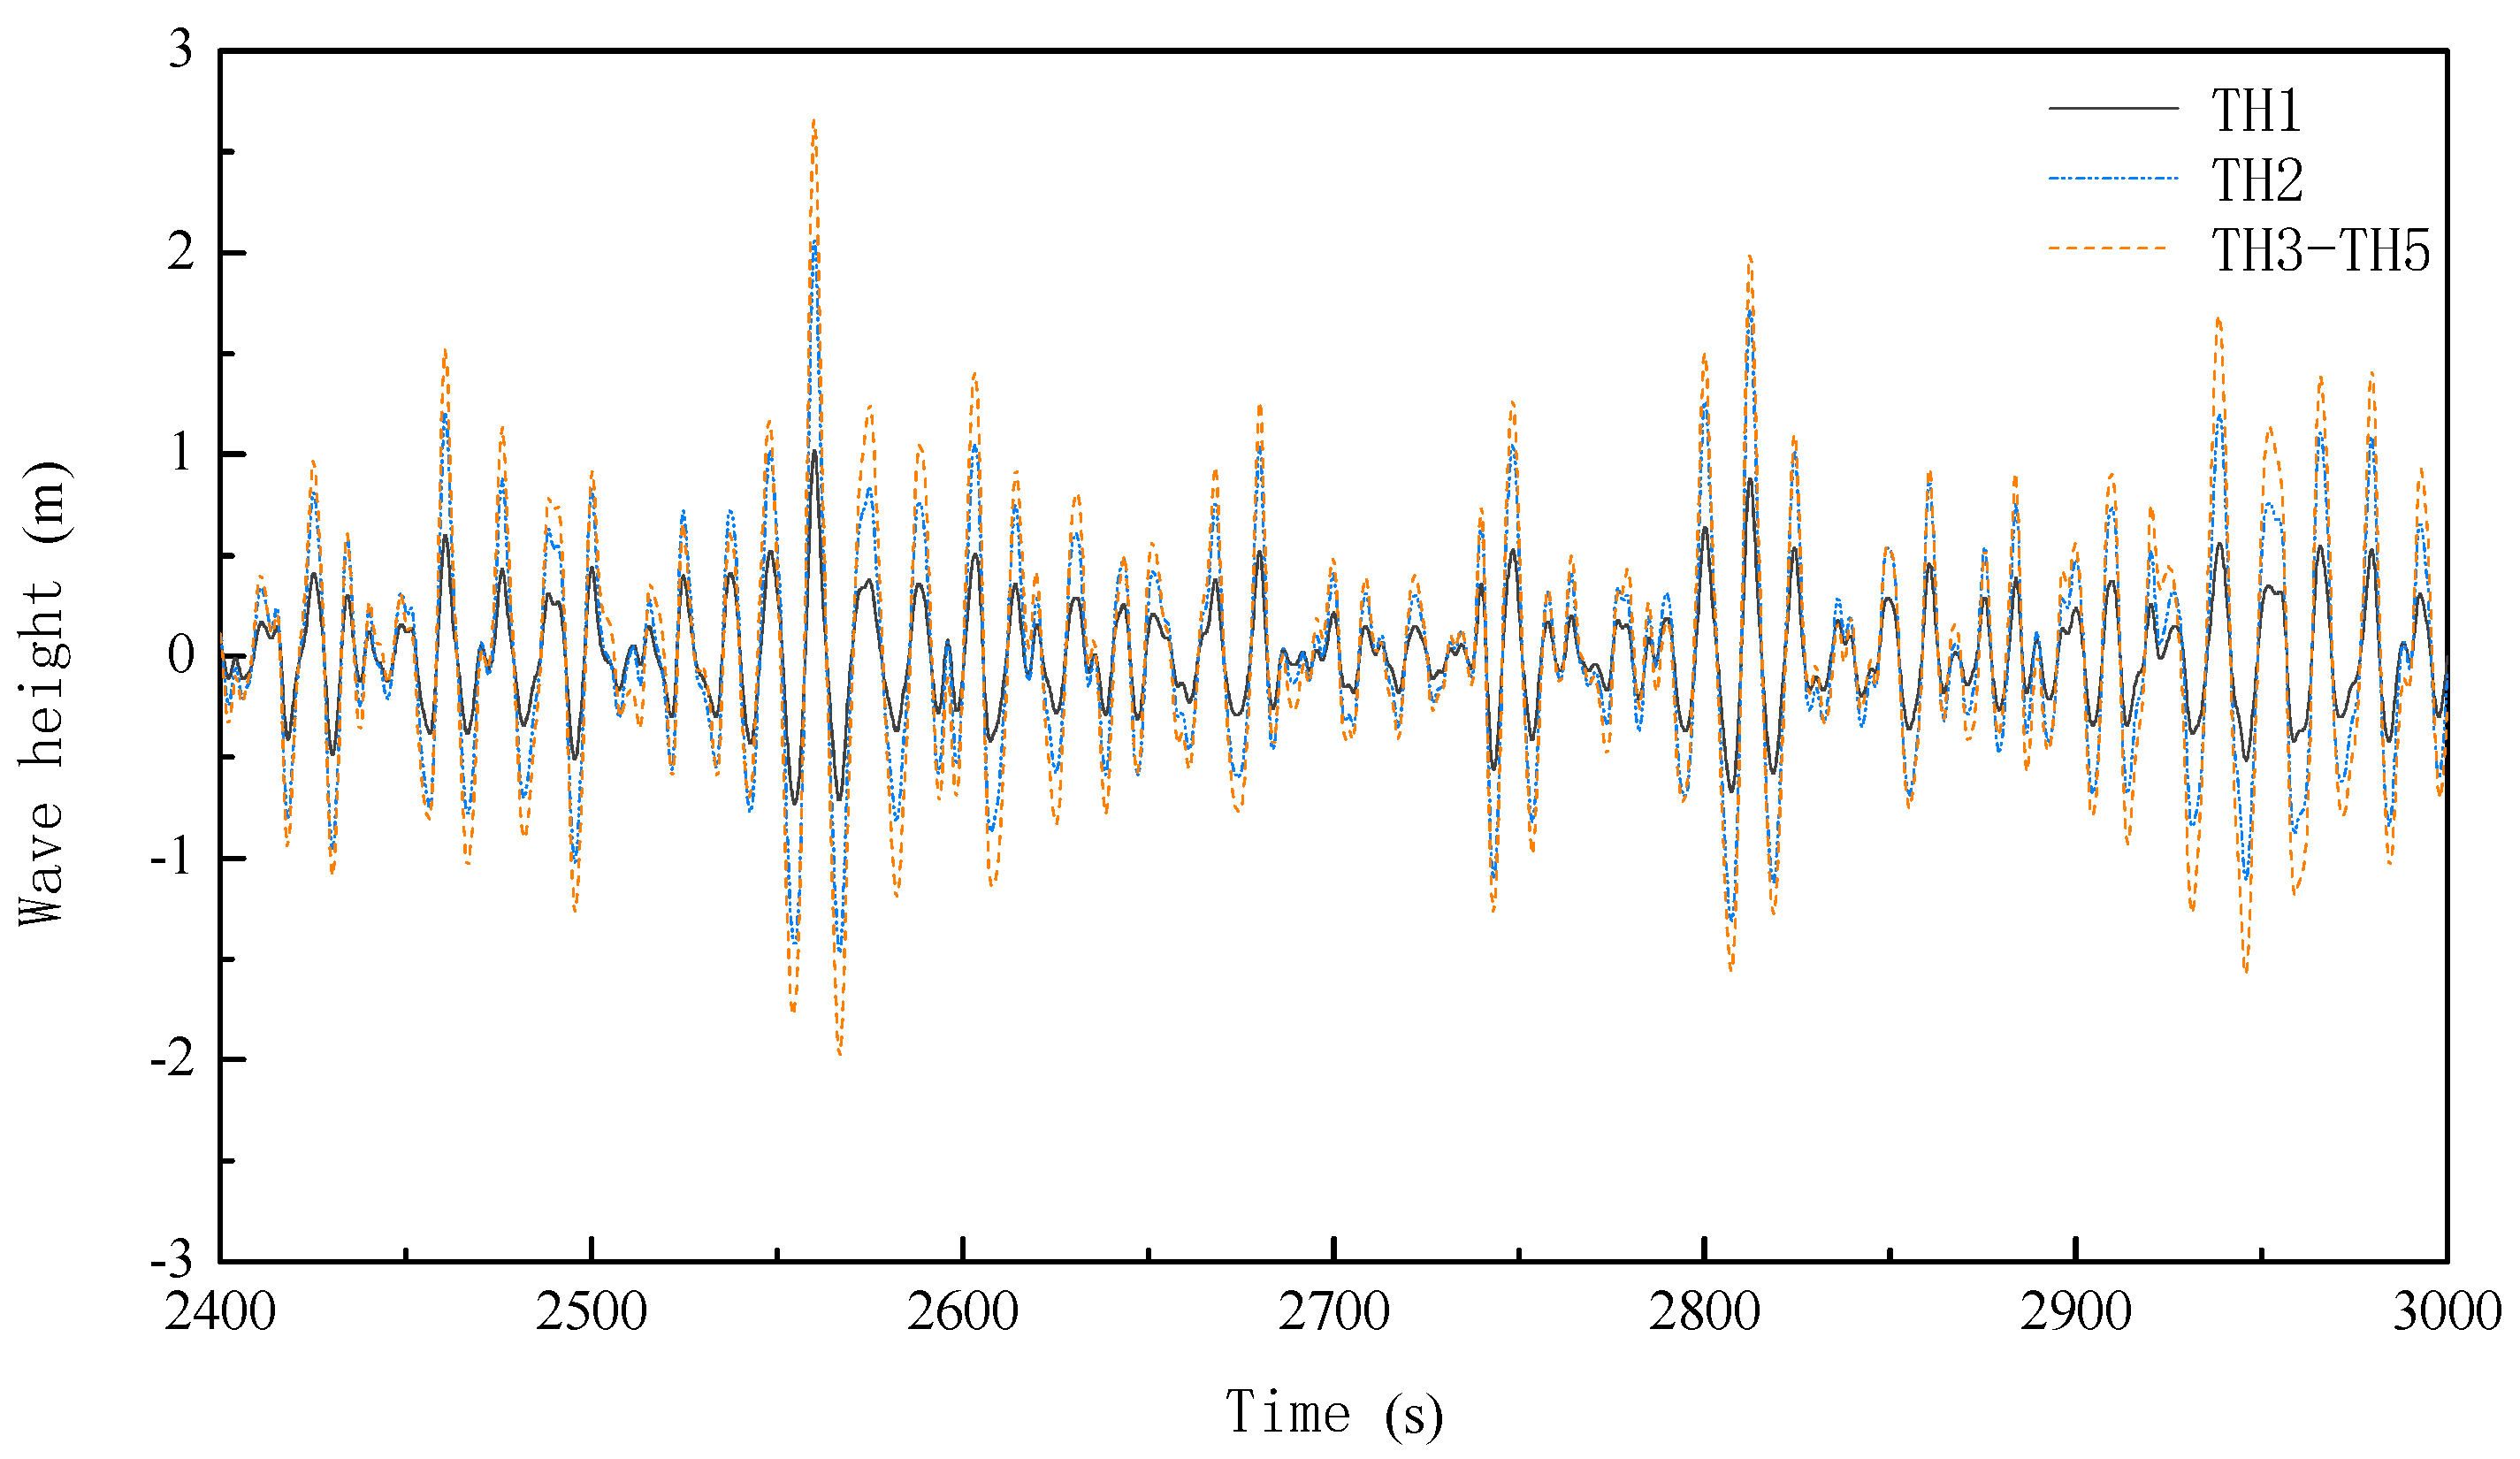
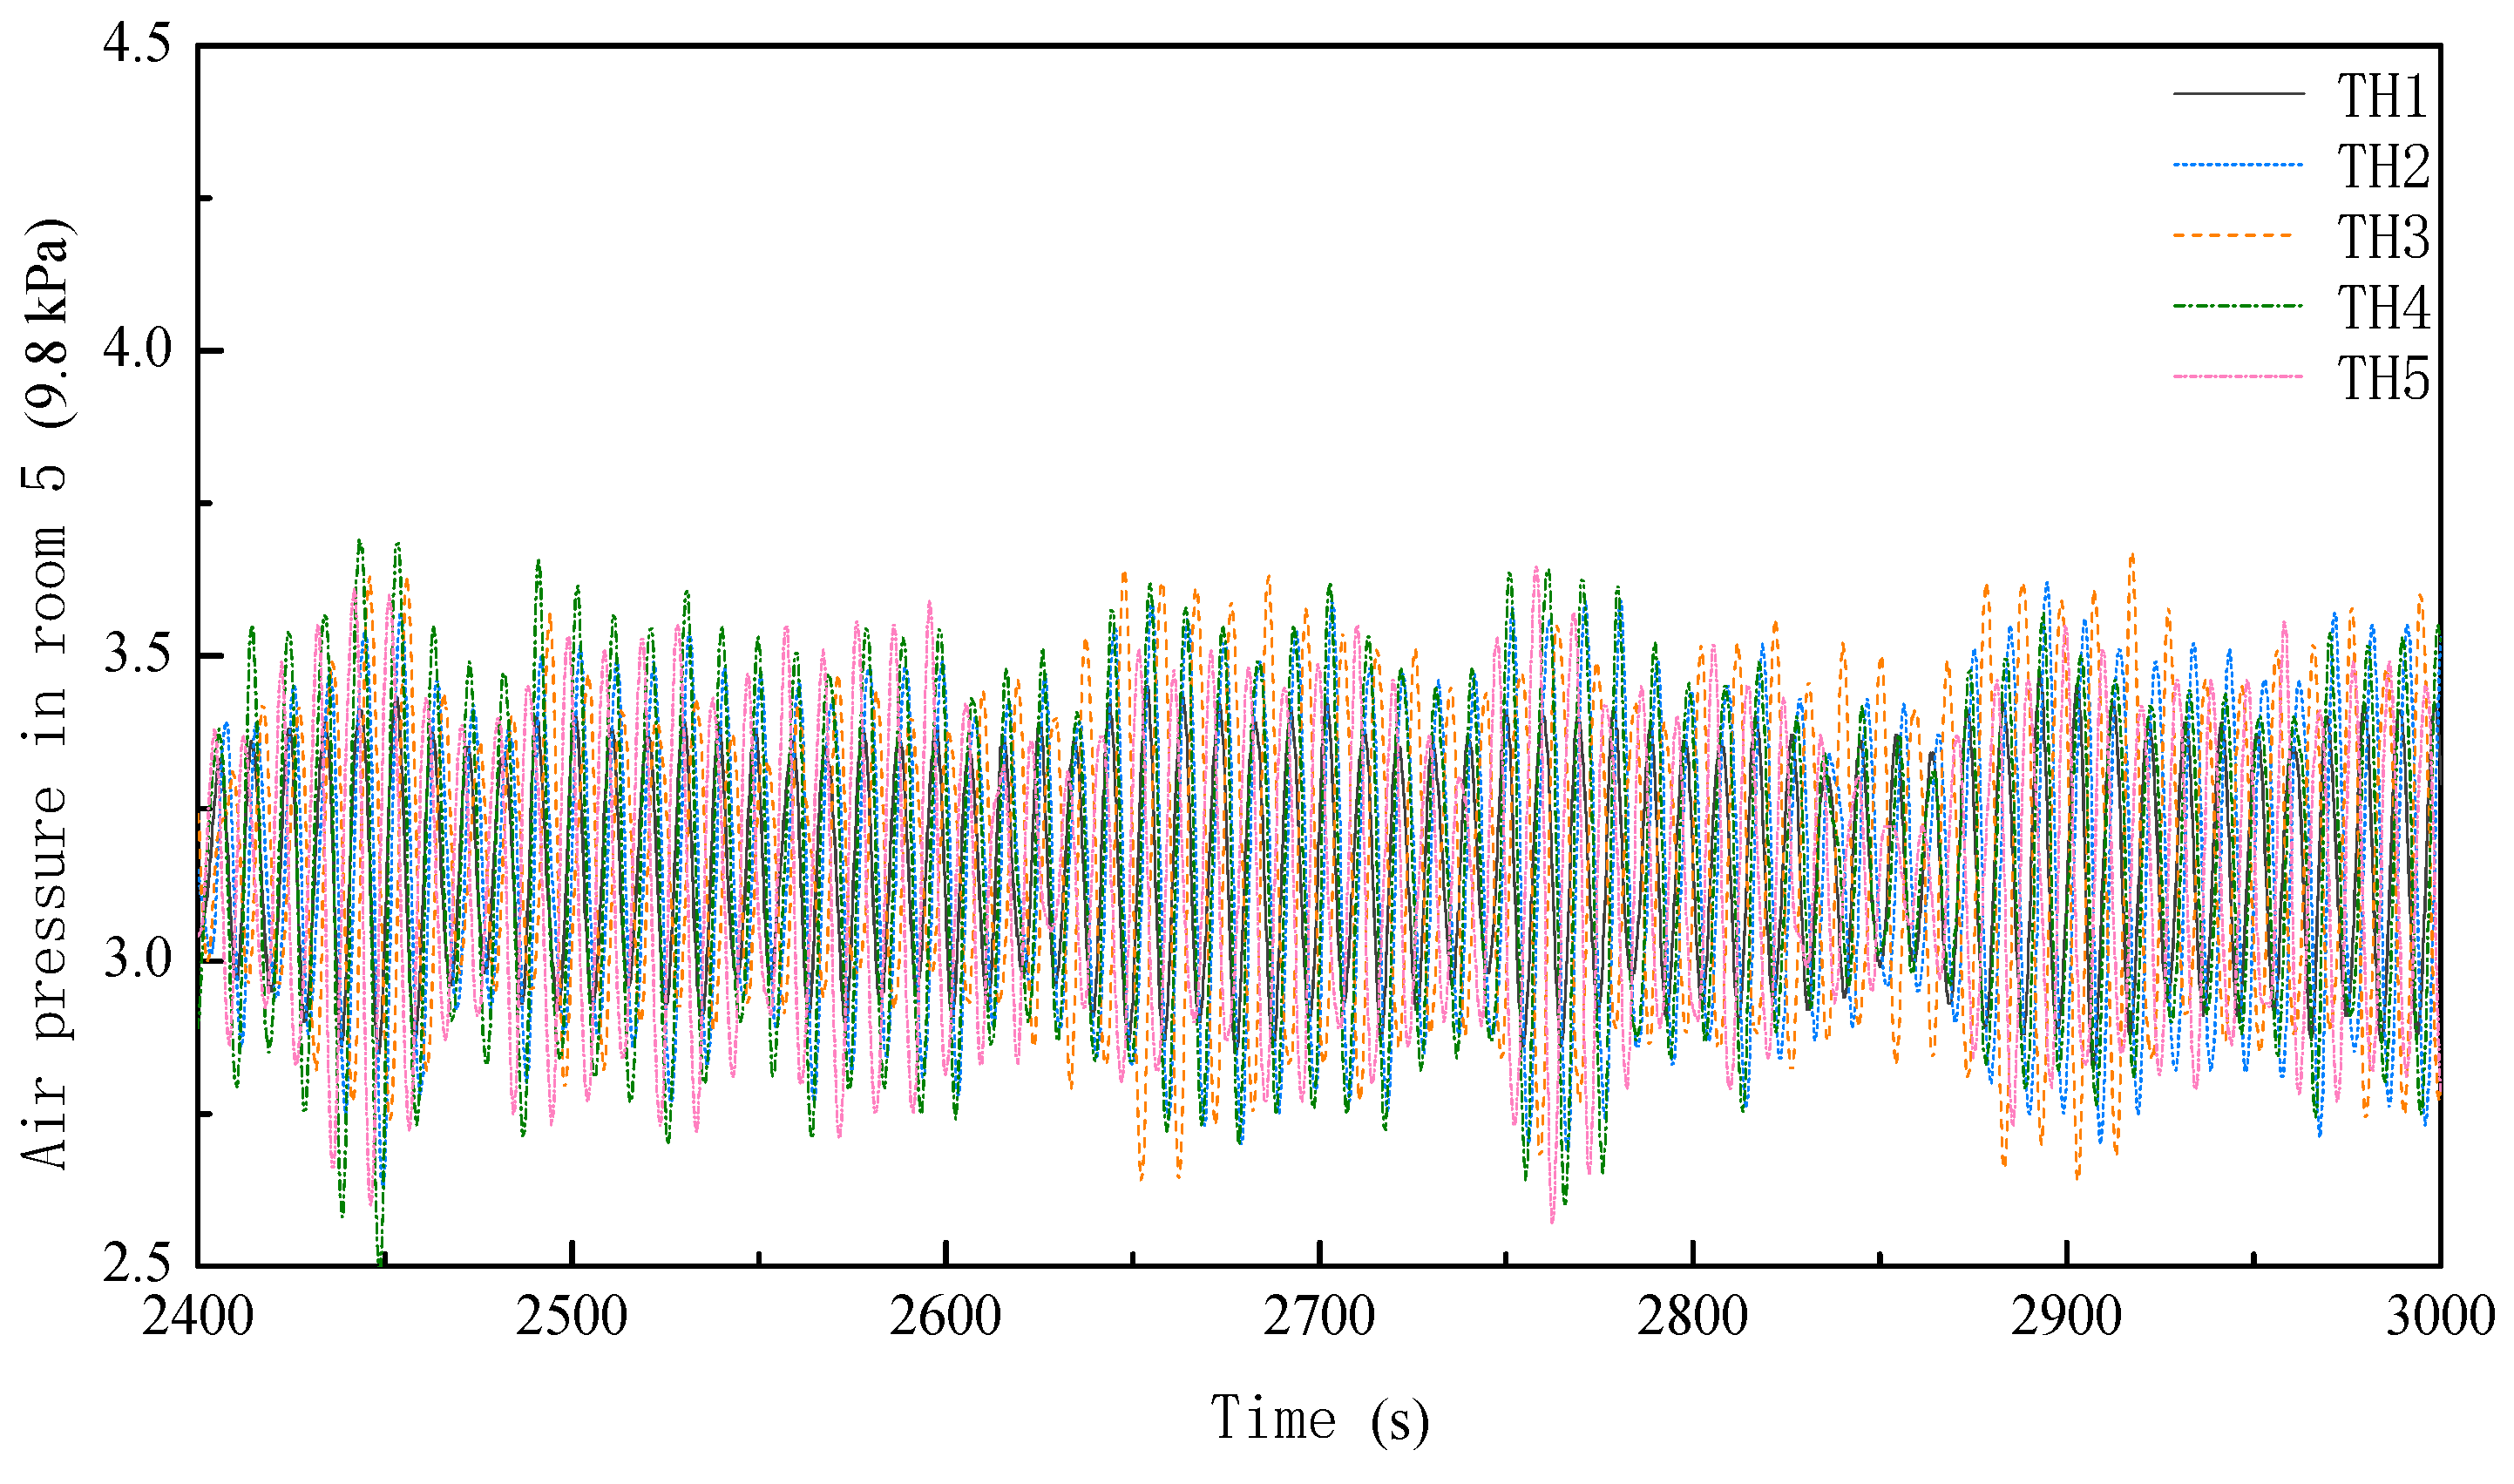
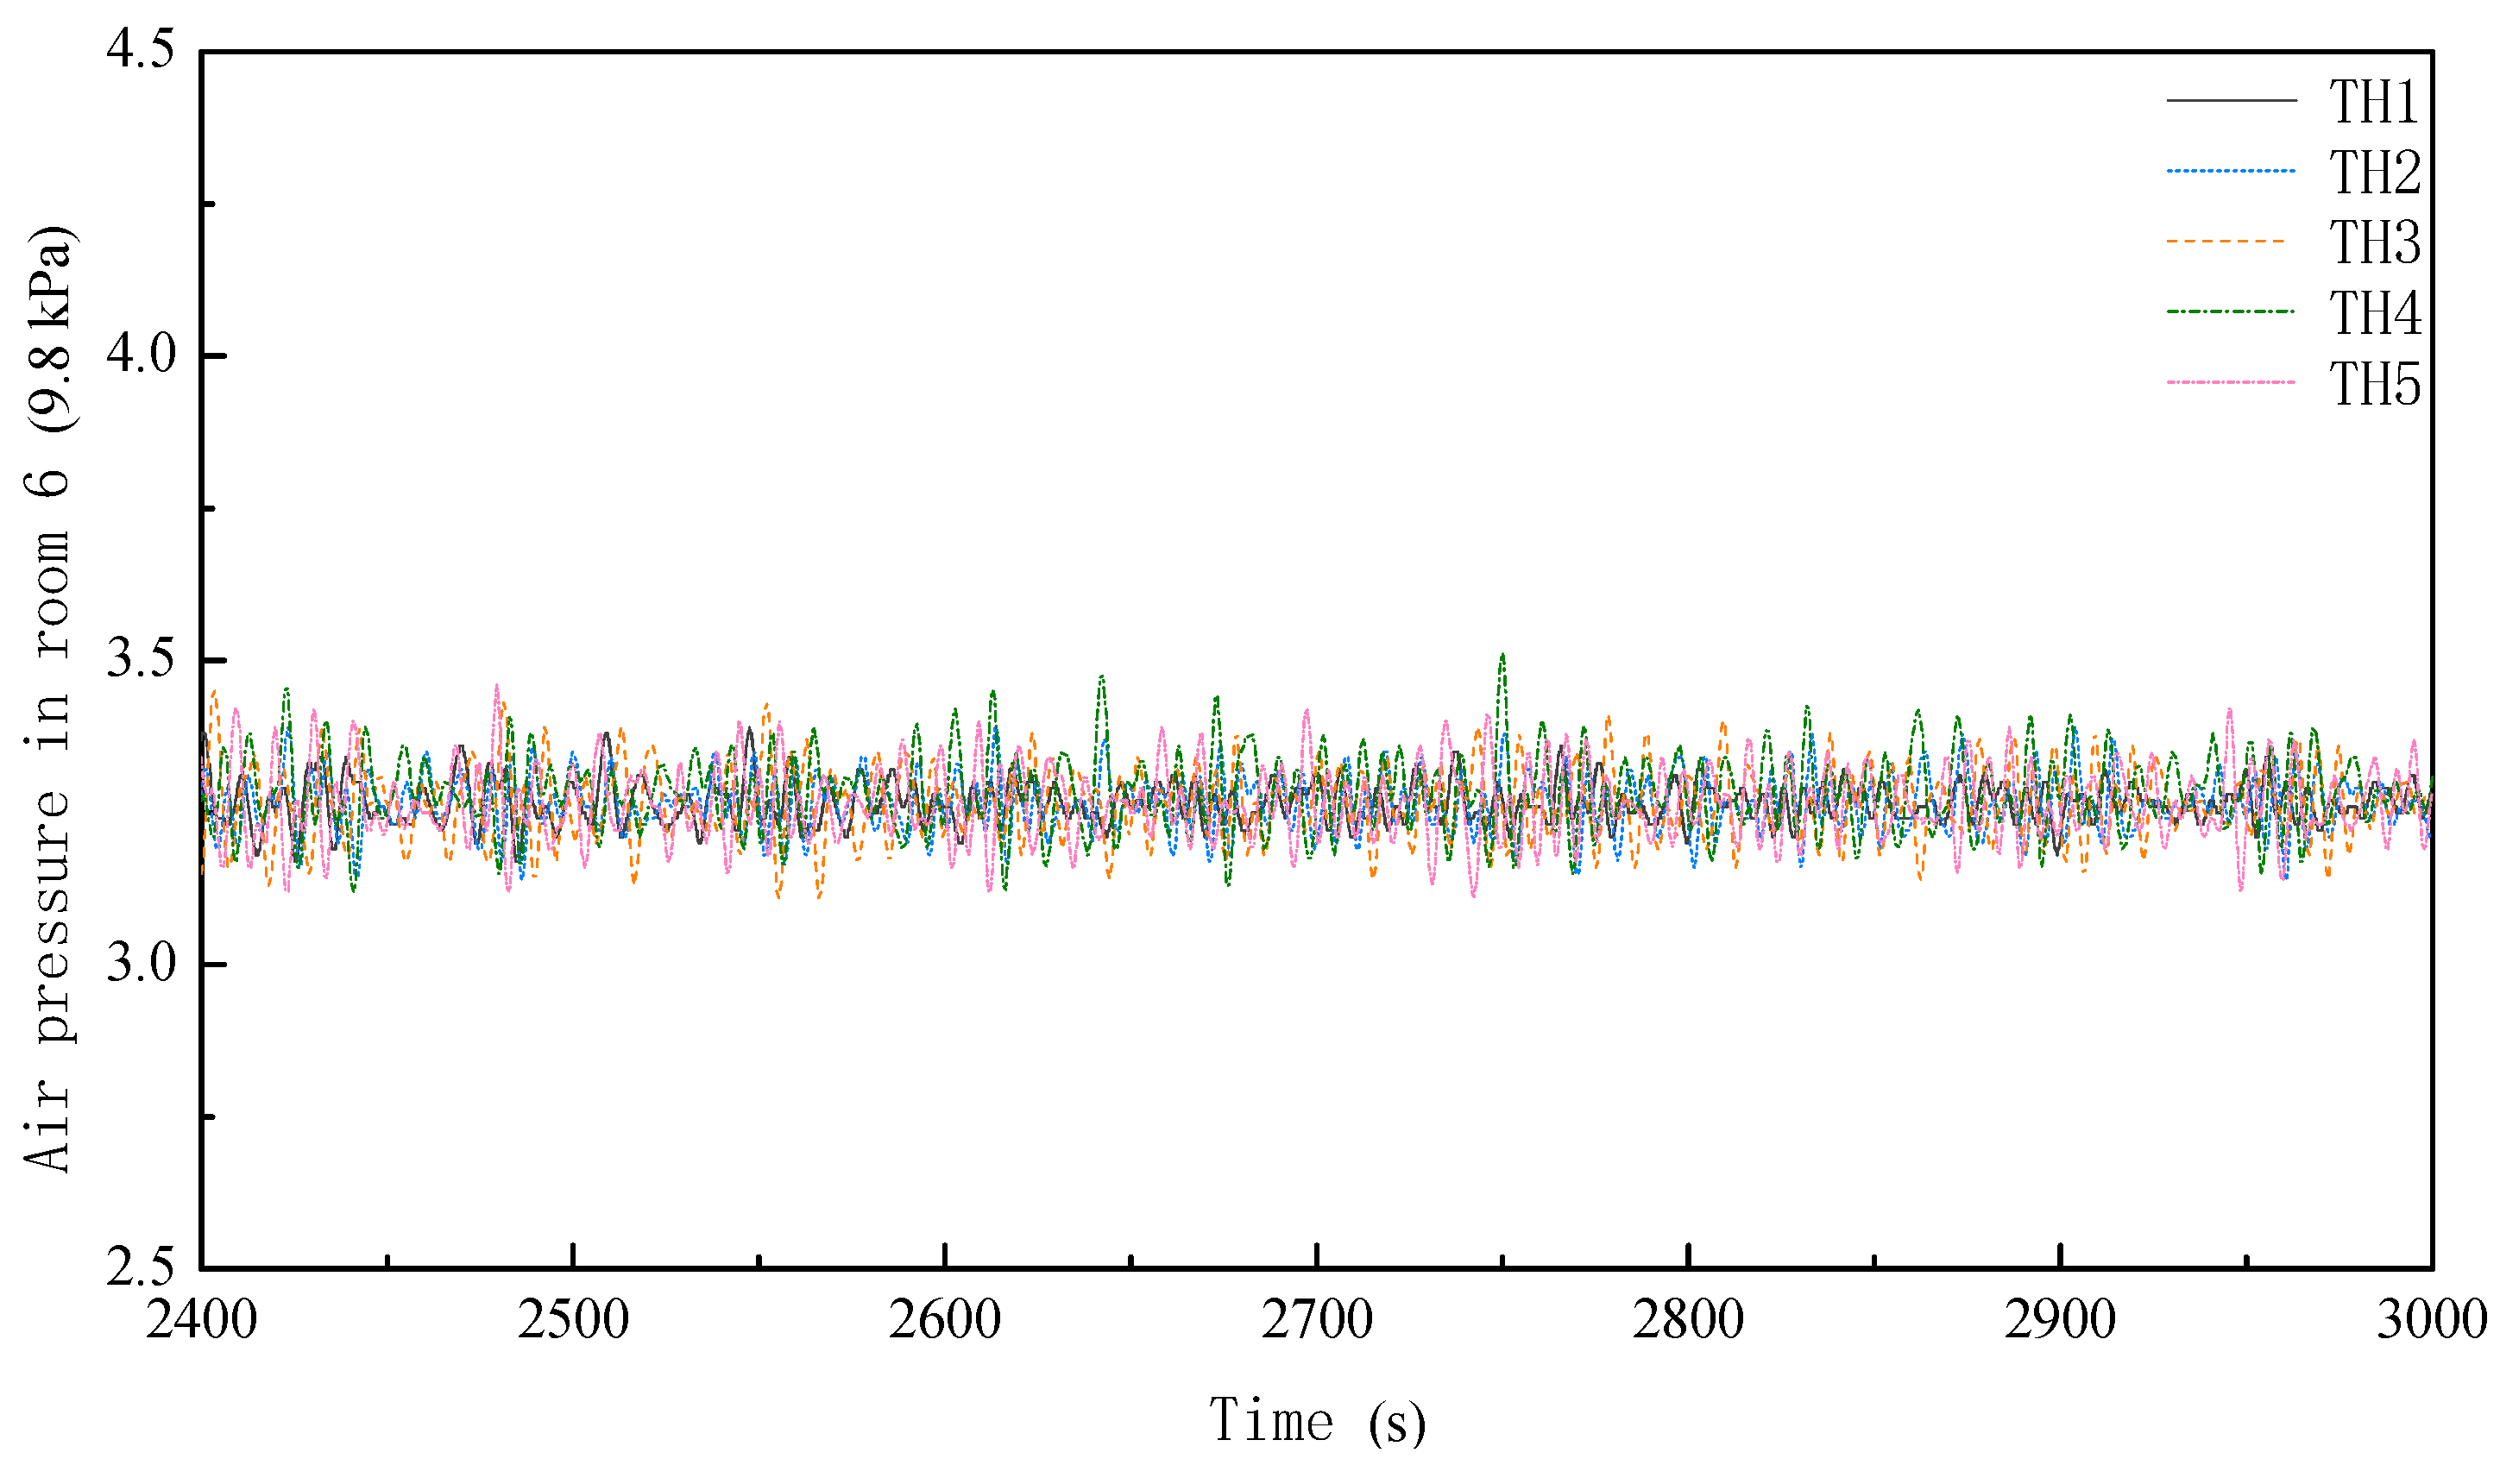
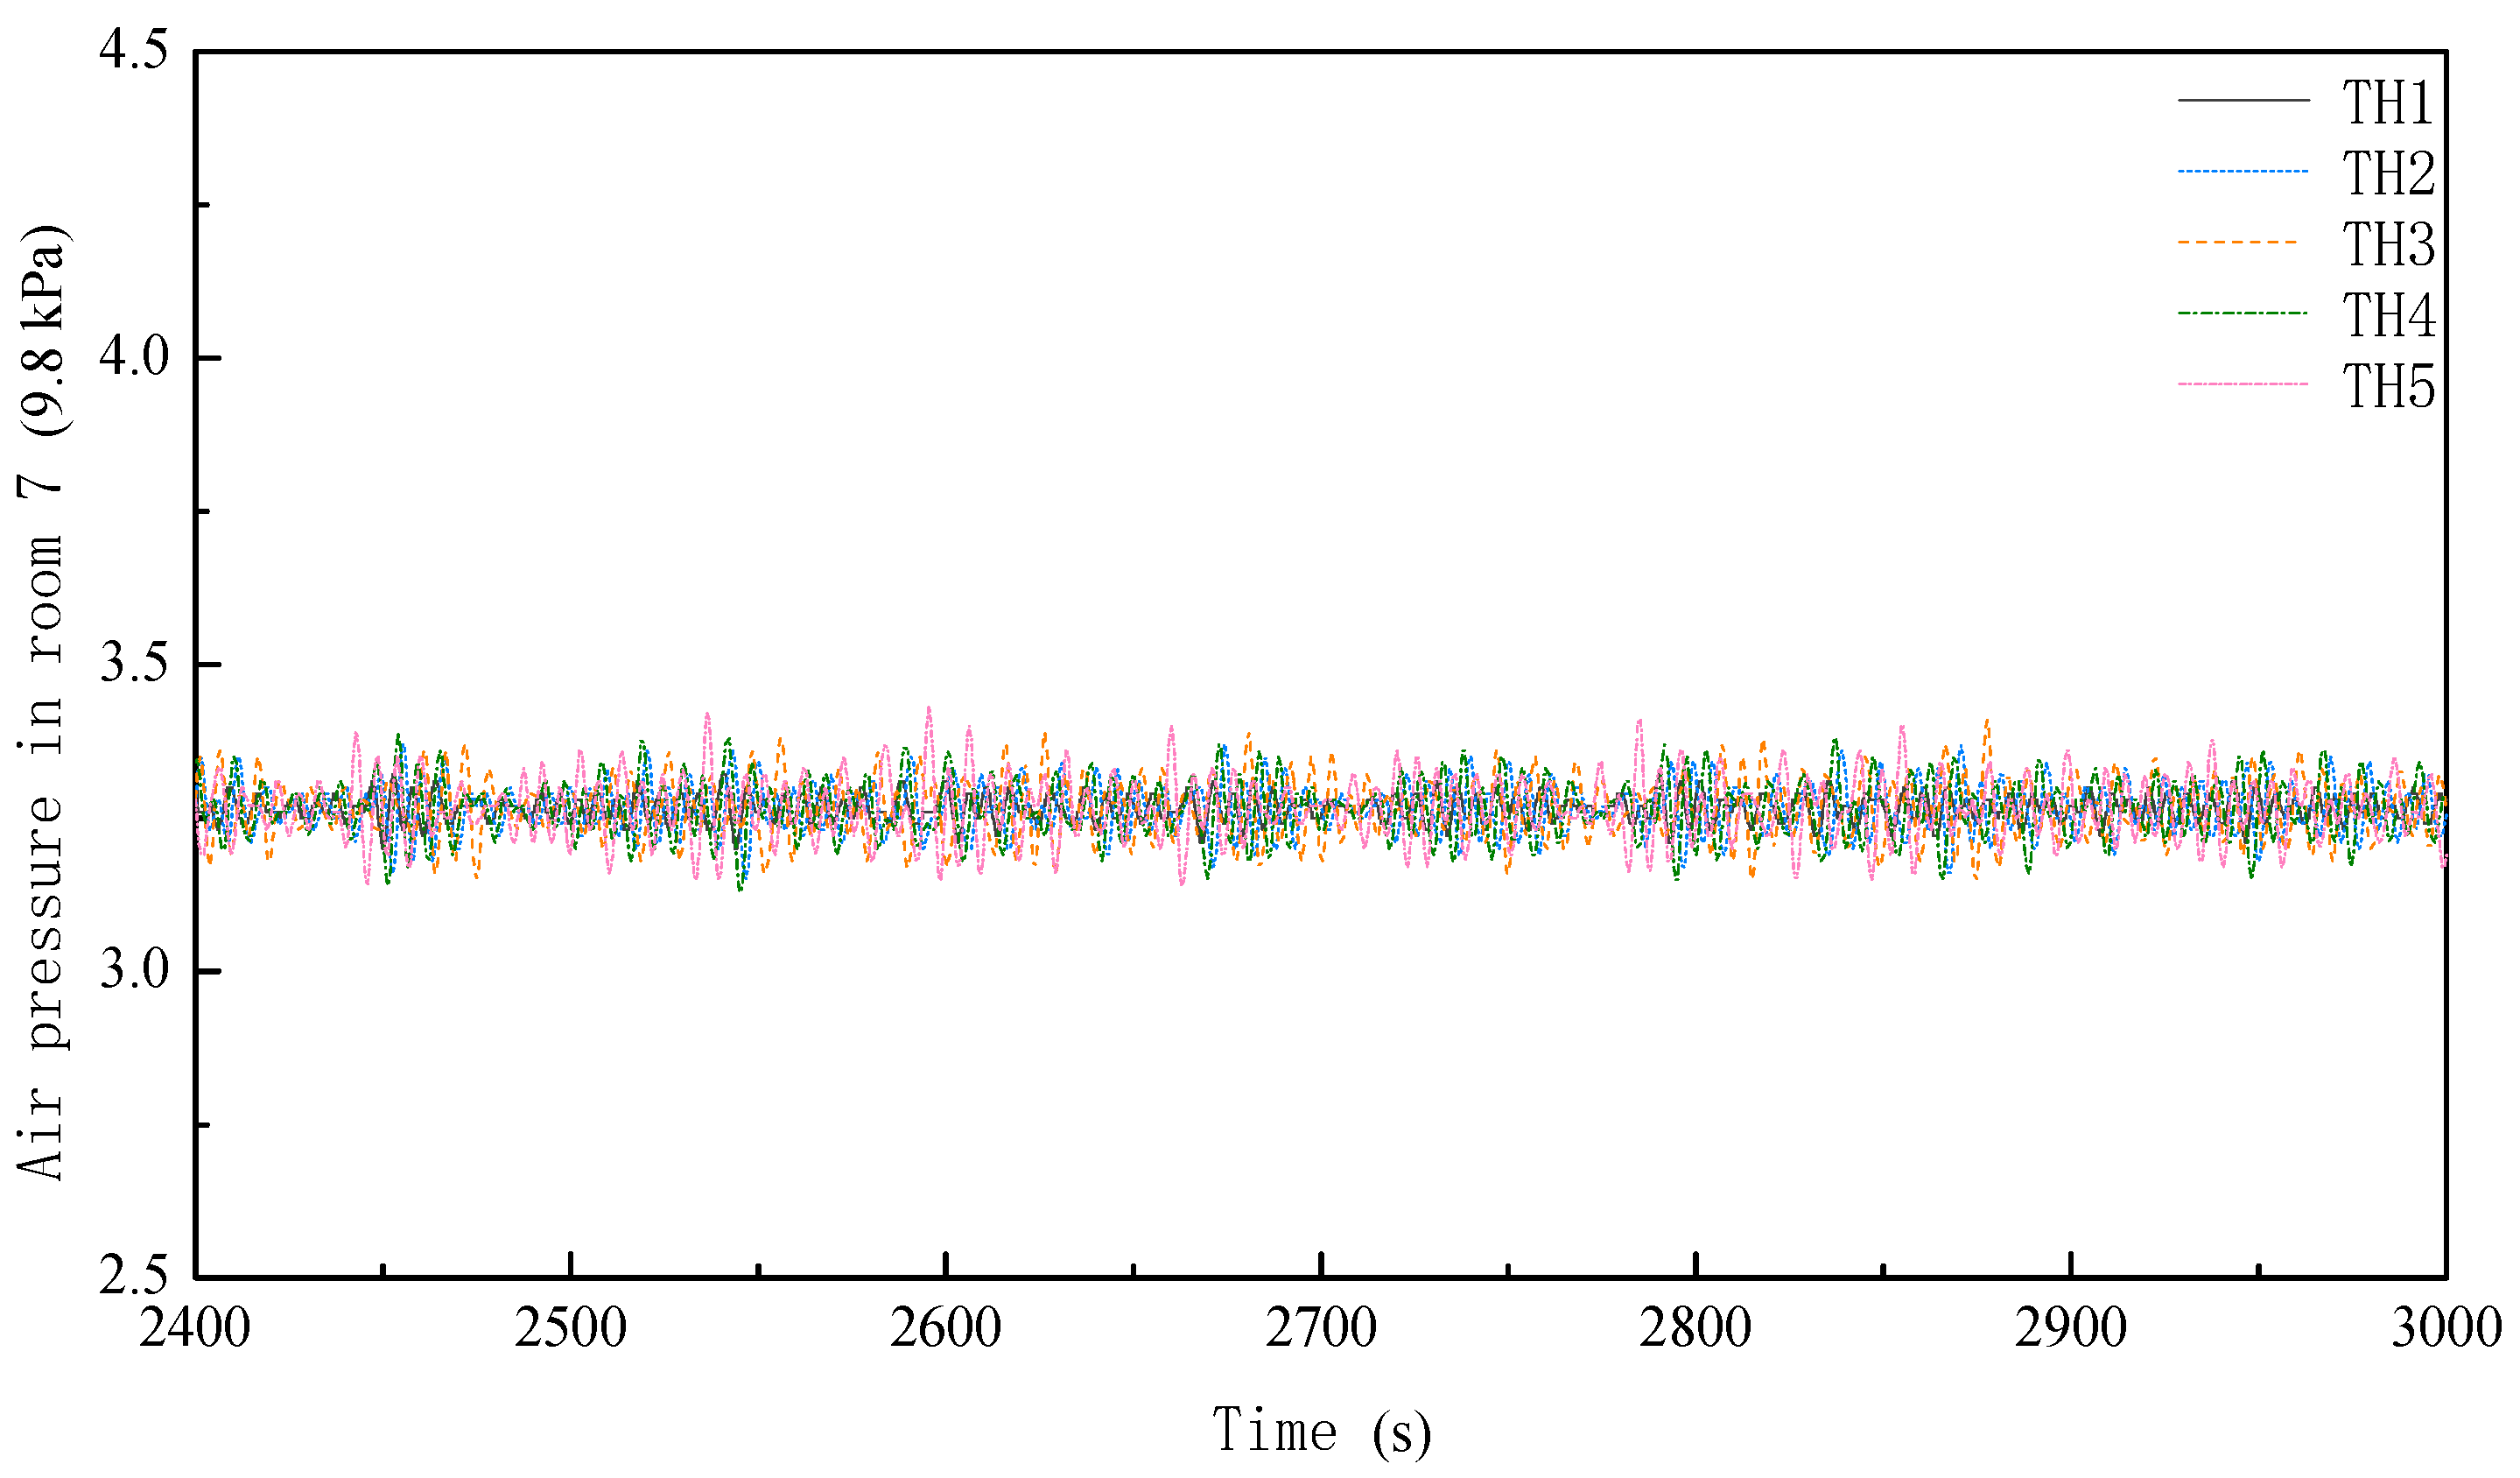
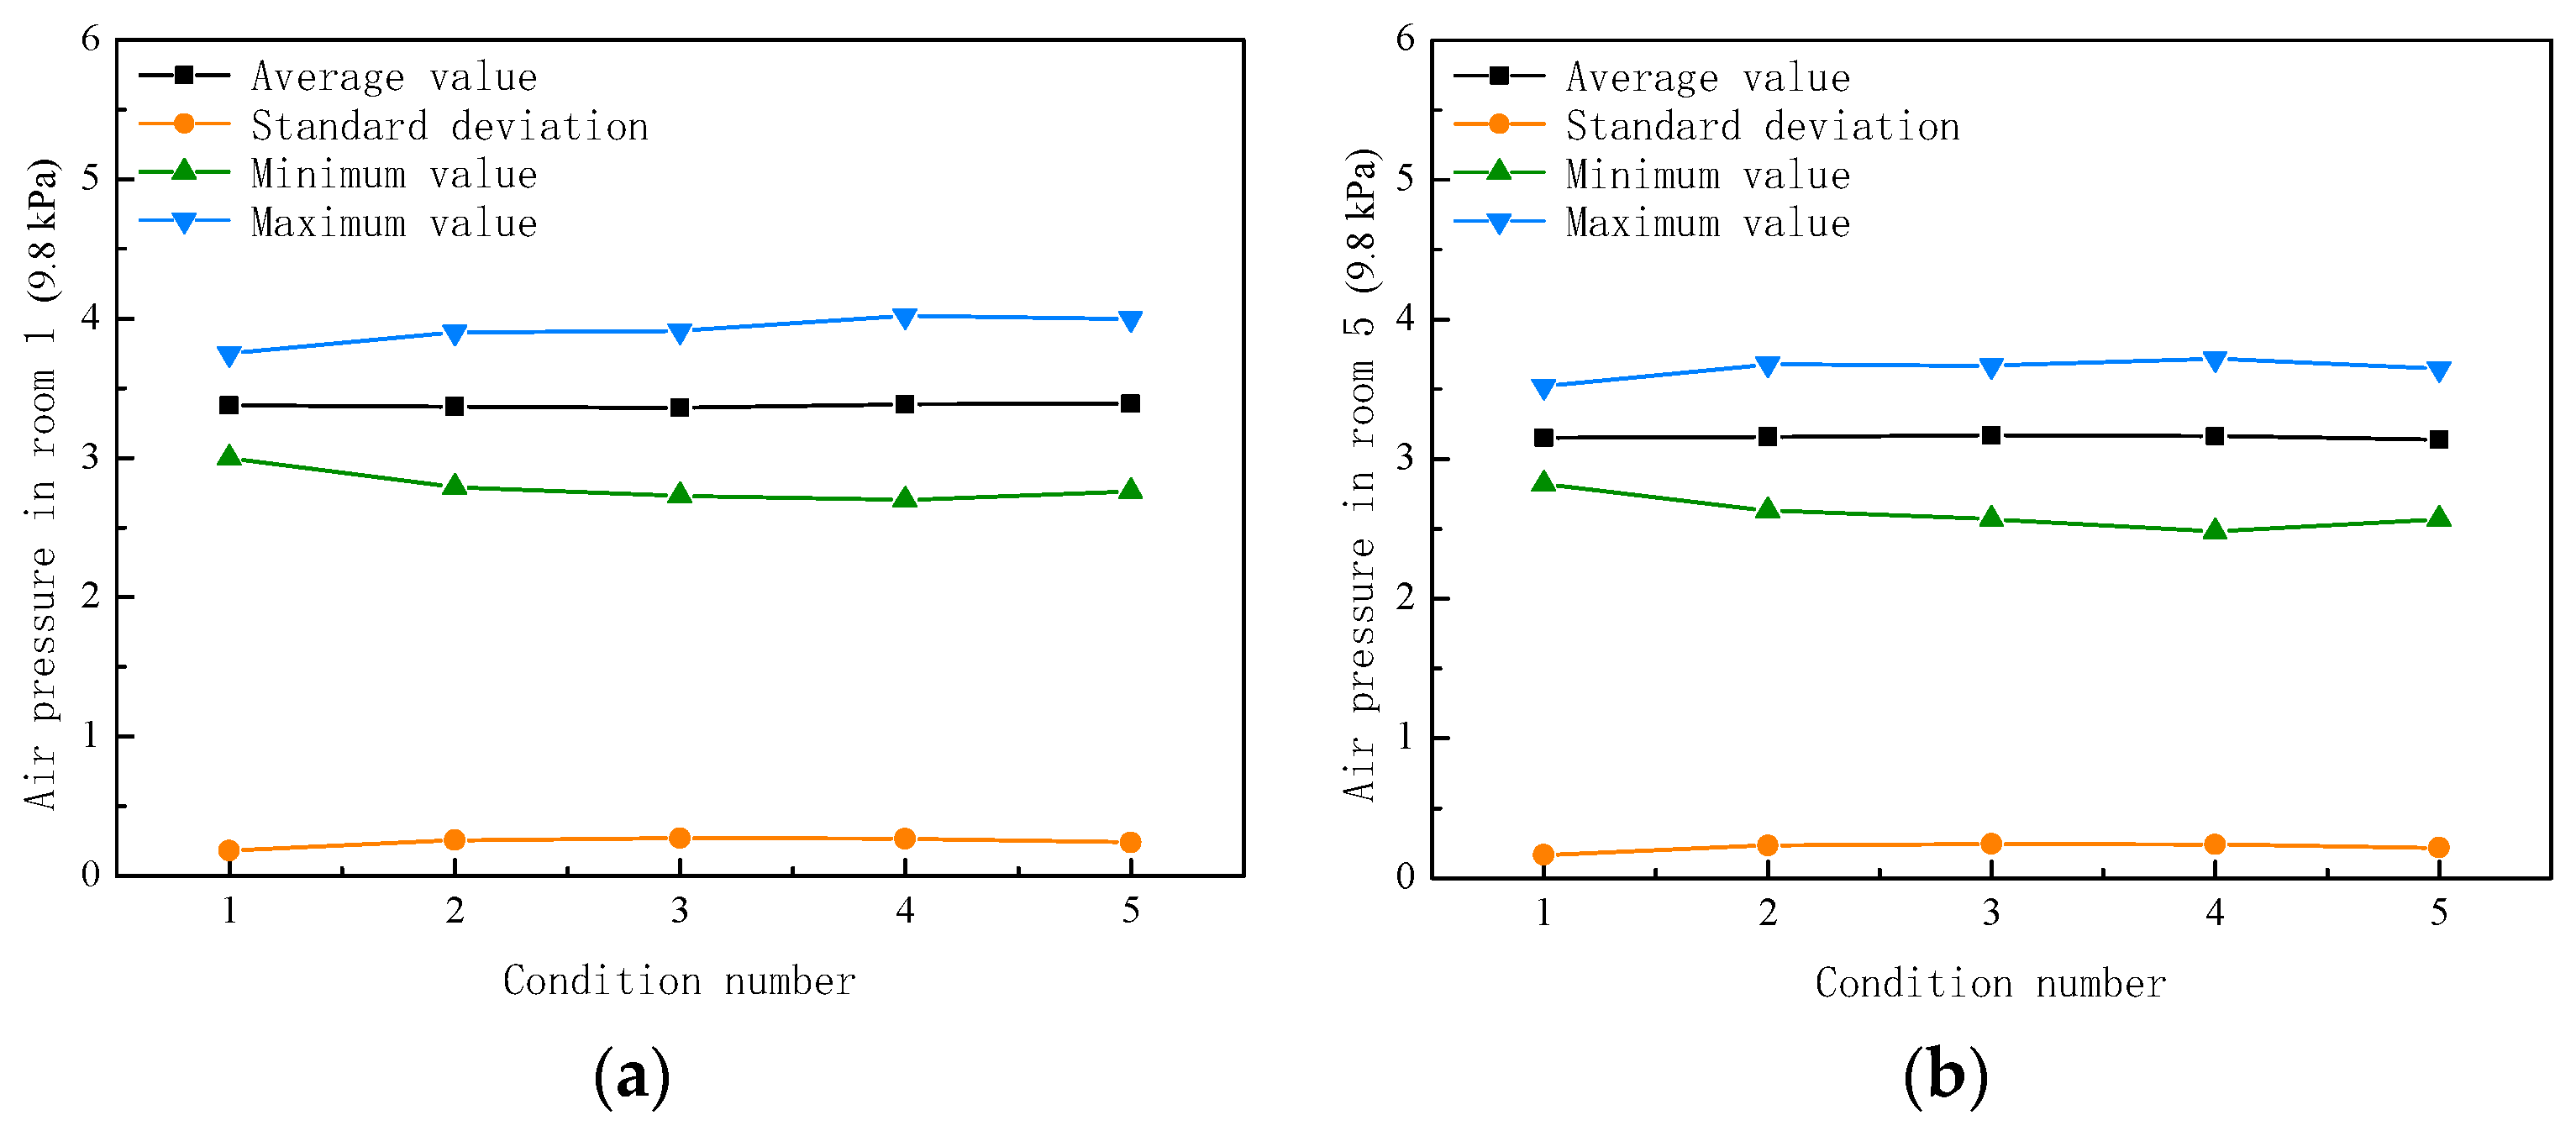
4.3. Air Pressures
4.4. Floating Behavior under the Combined Action of Wind and Waves
5. Conclusions
- (1)
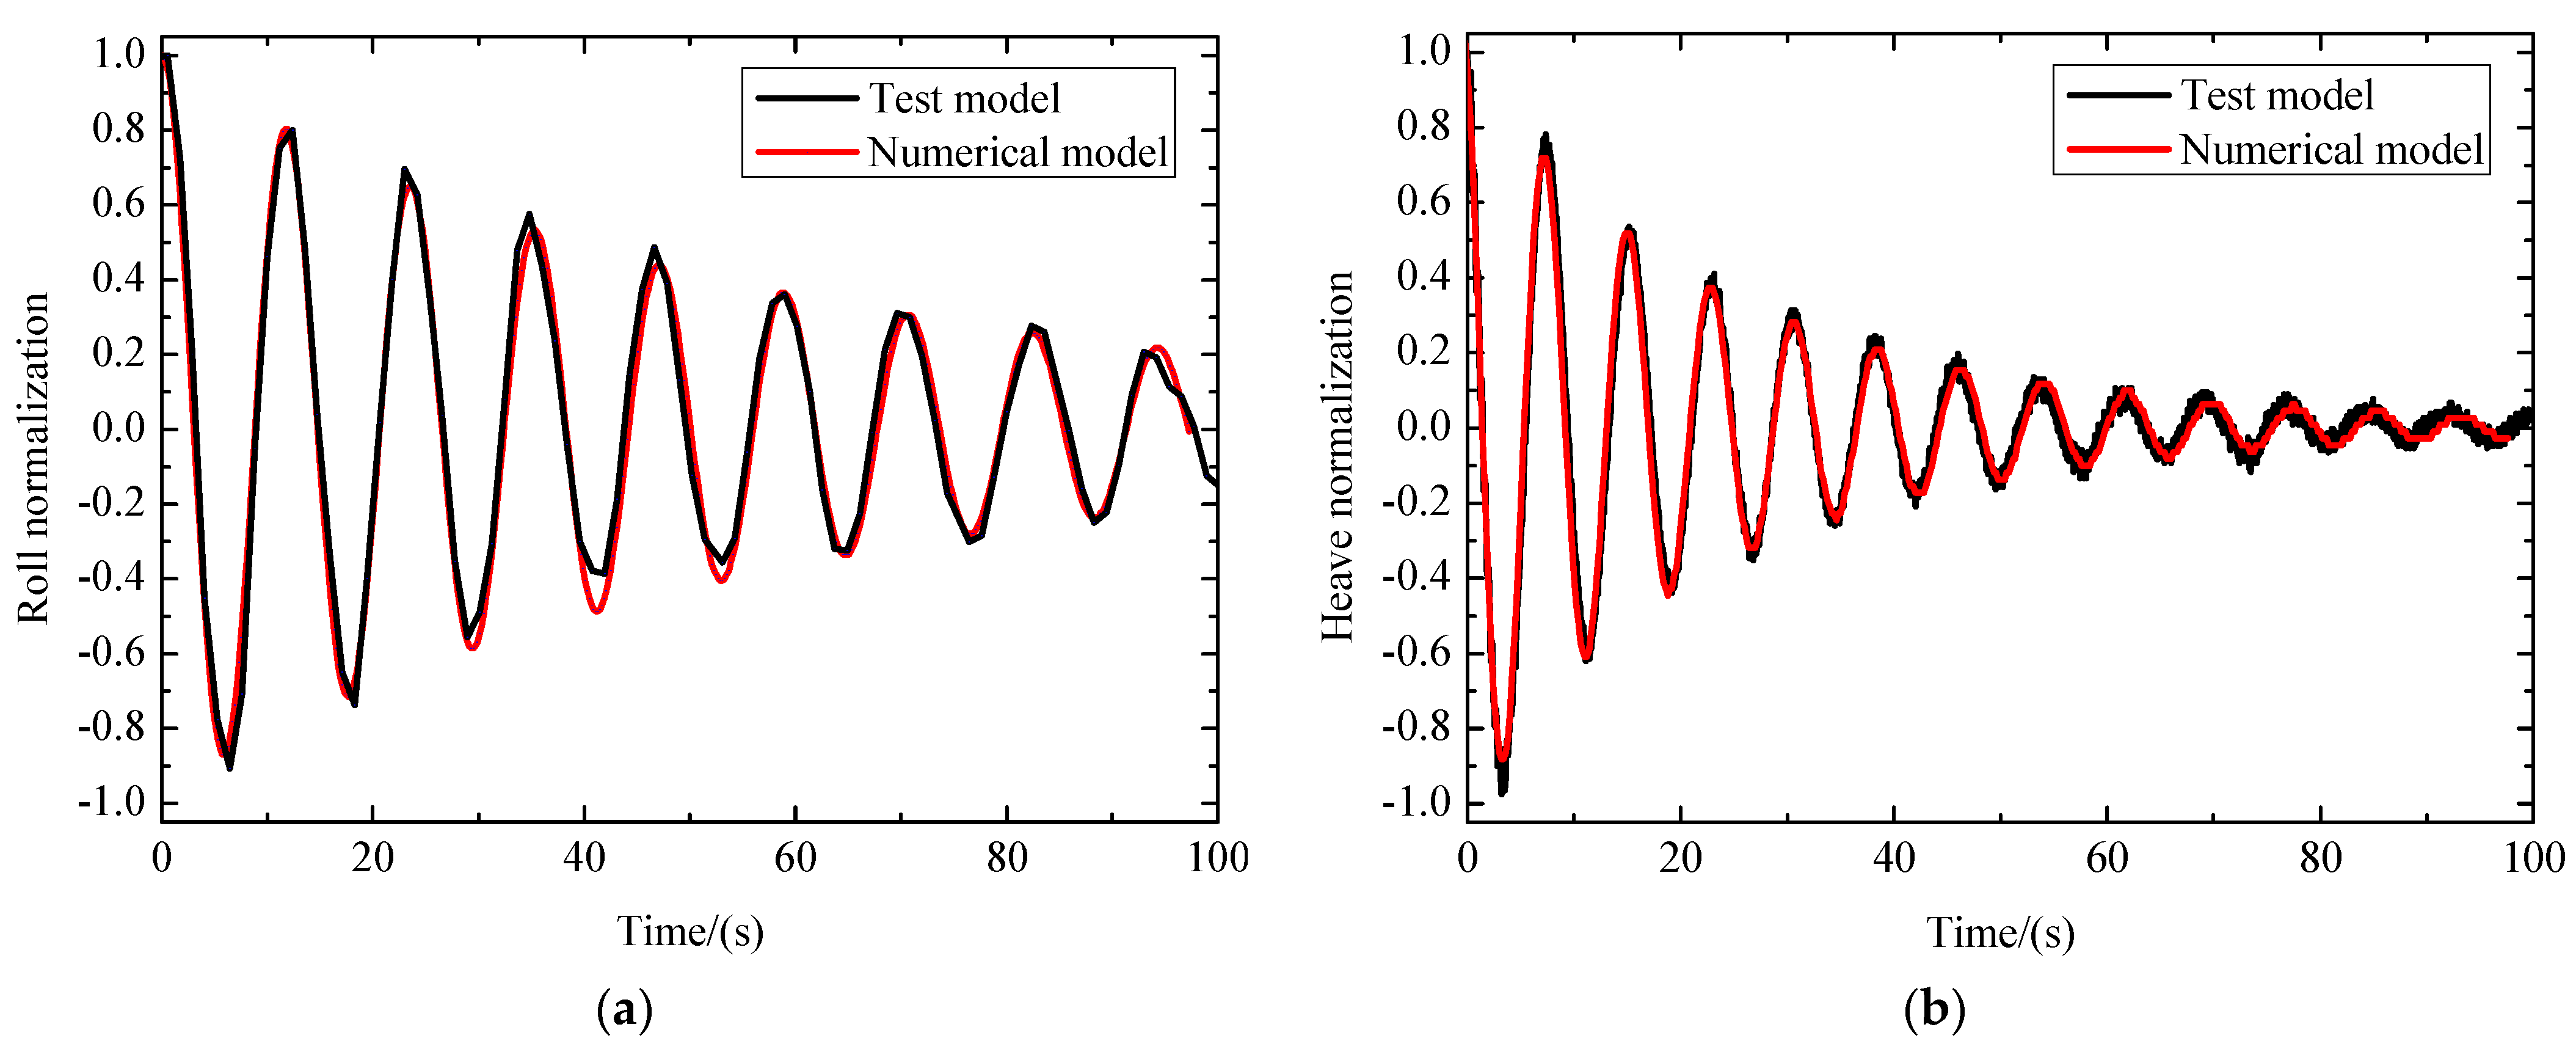
- The towing test model and MOSES numerical model of bucket foundation are established. Through the free decay test, it is obtained that the roll and heave decay obtained by numerical calculation are basically consistent with the results of model test. When the draft is 7 m, the natural periods of roll and heave of bucket foundation are 11.8 s and 7.9 s, respectively.
- (2)
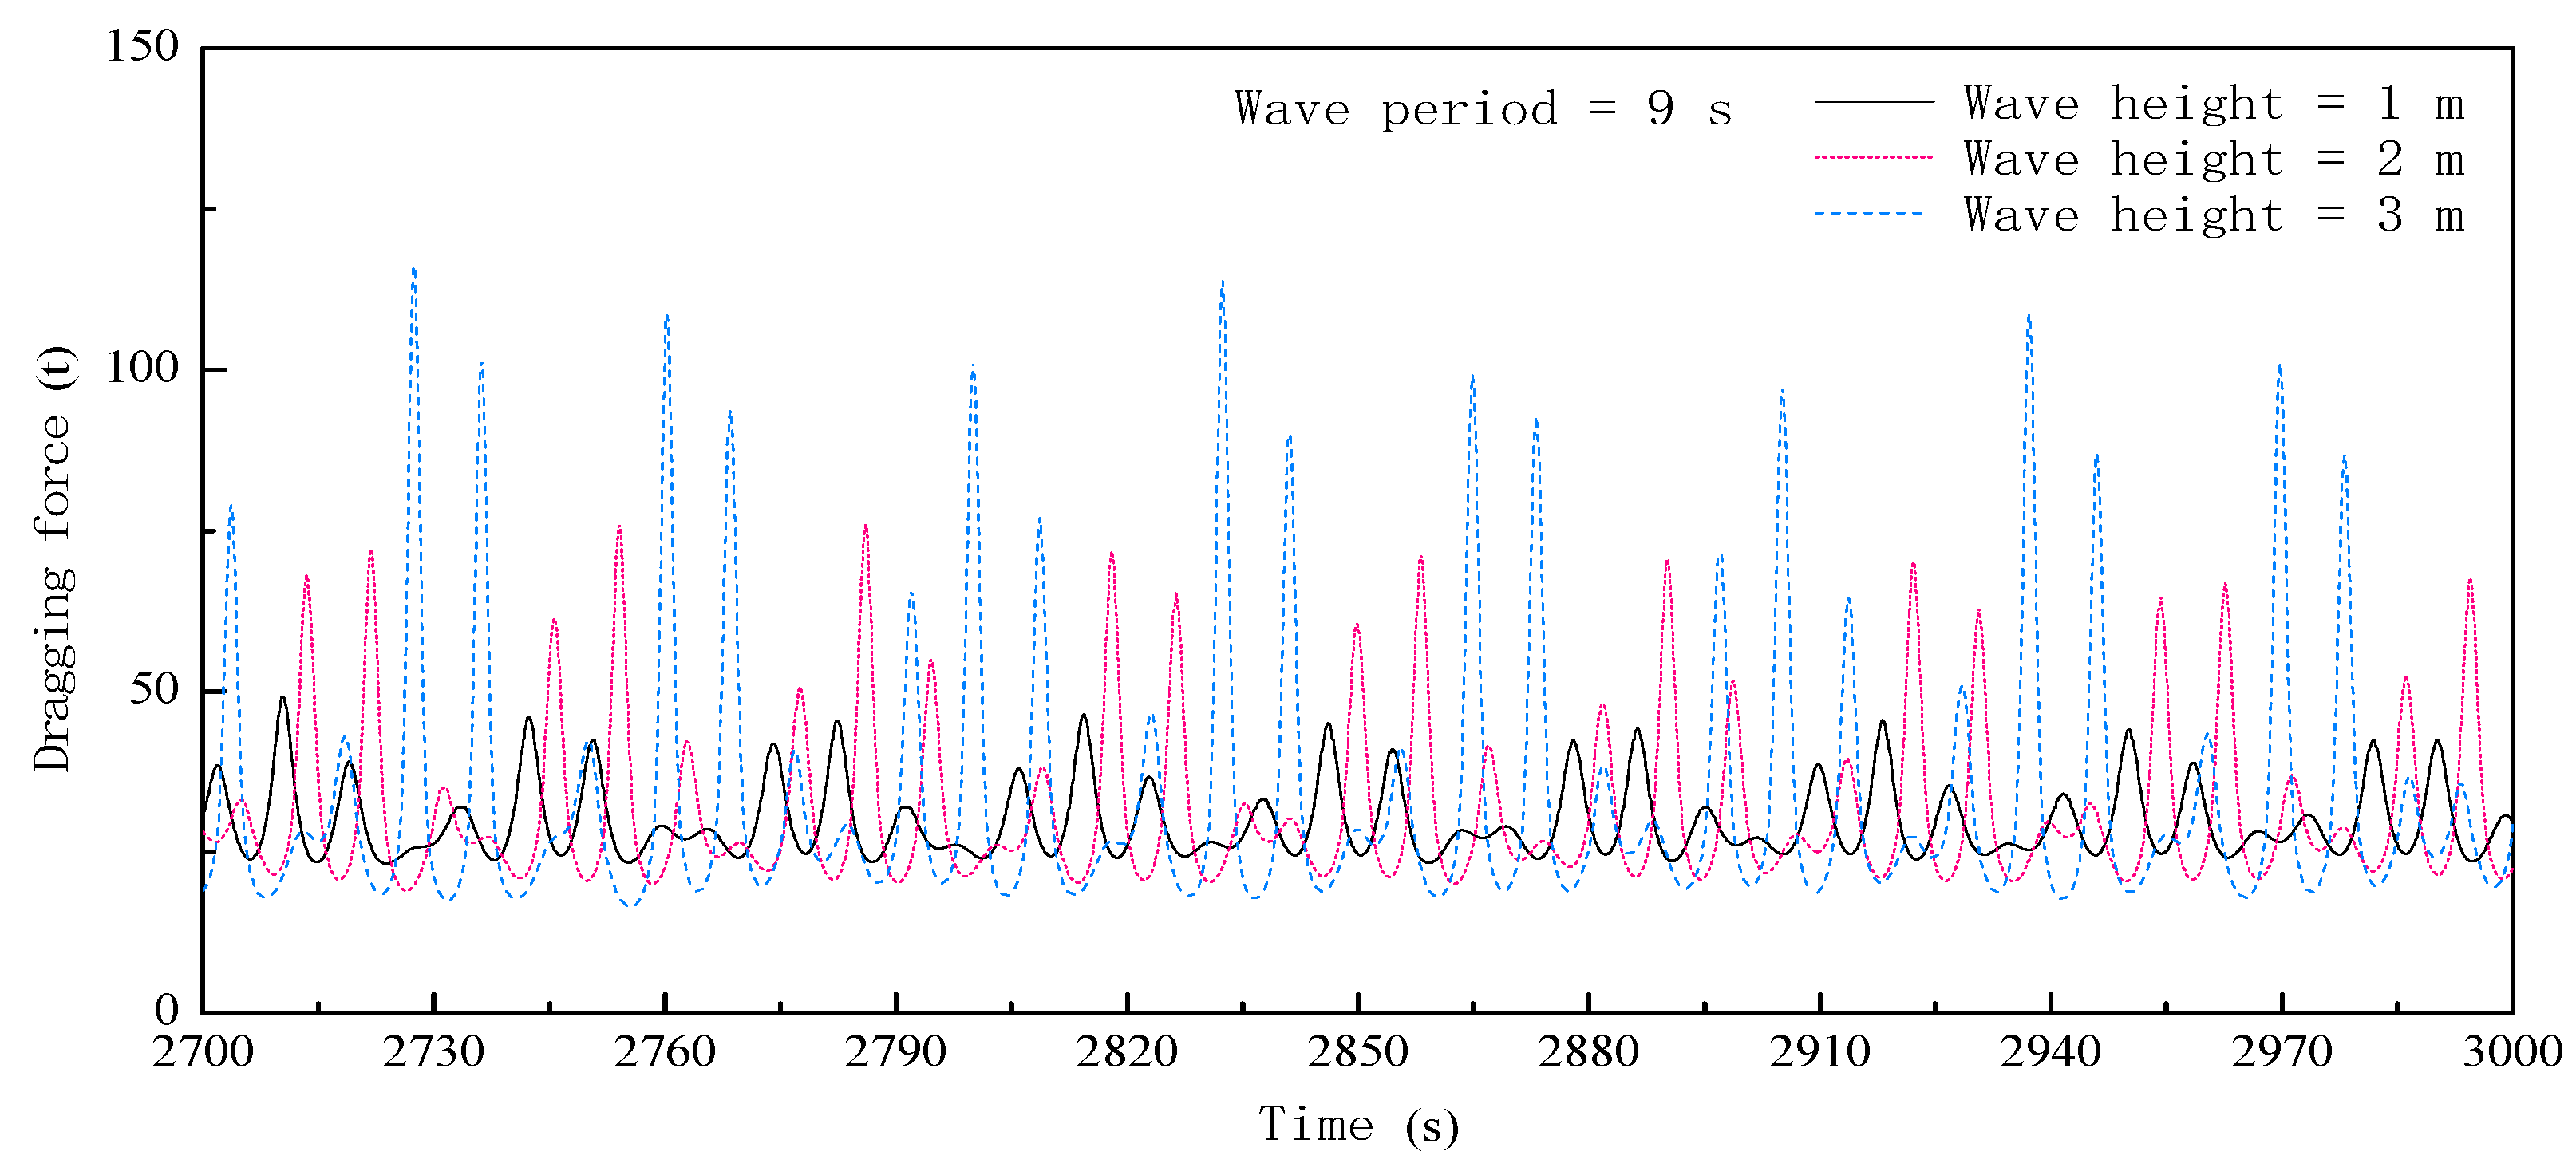
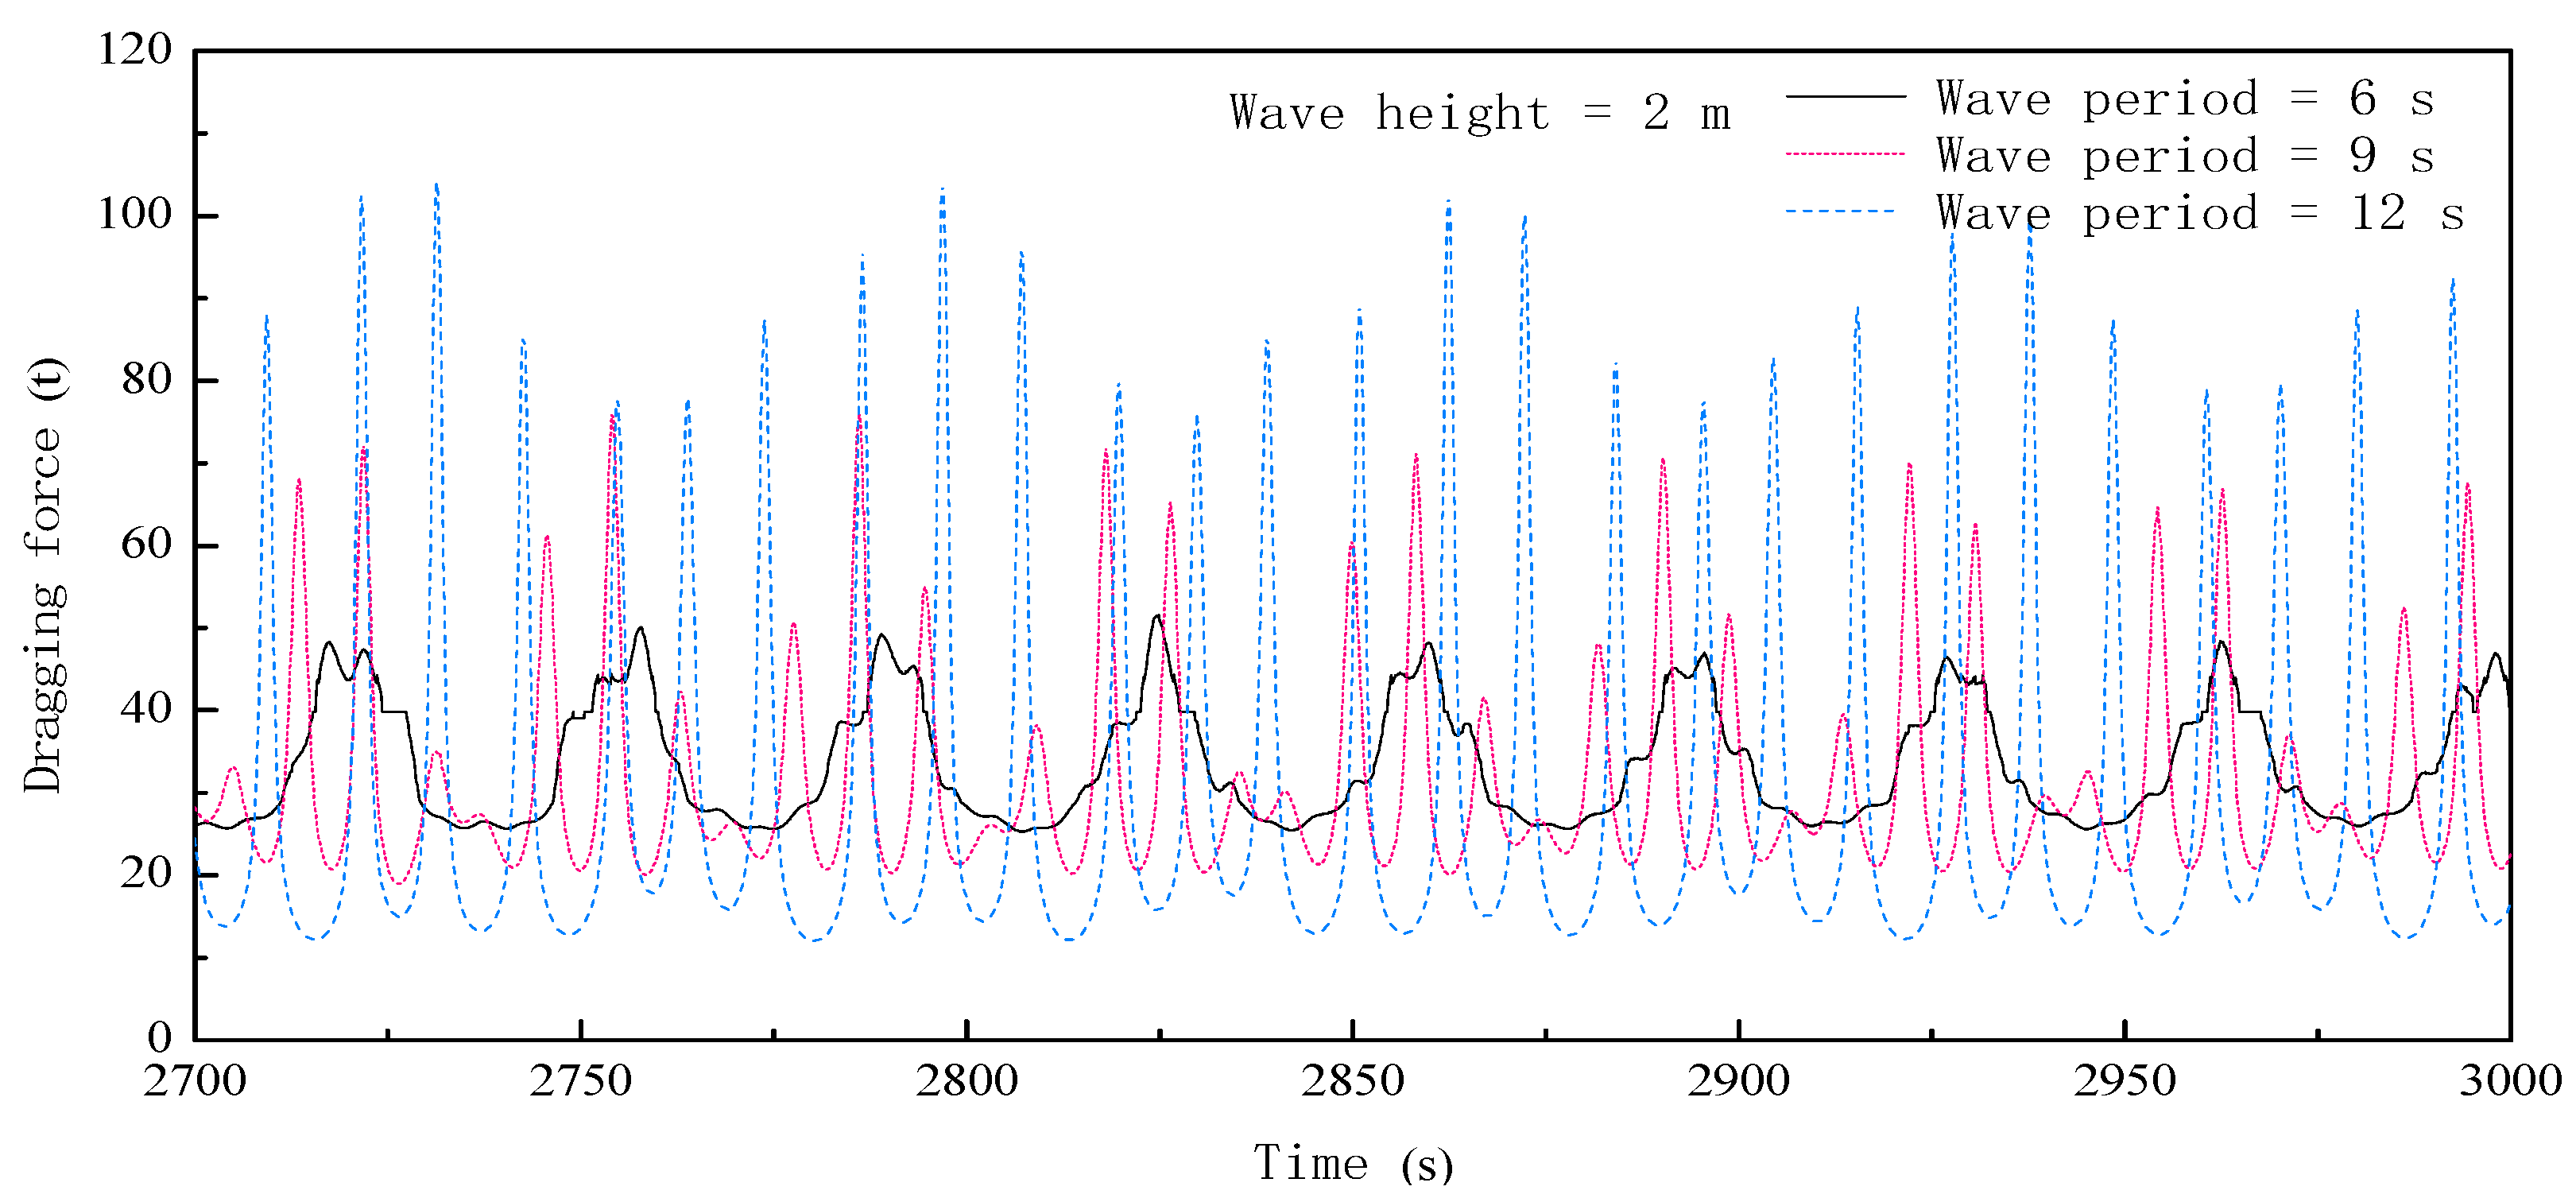
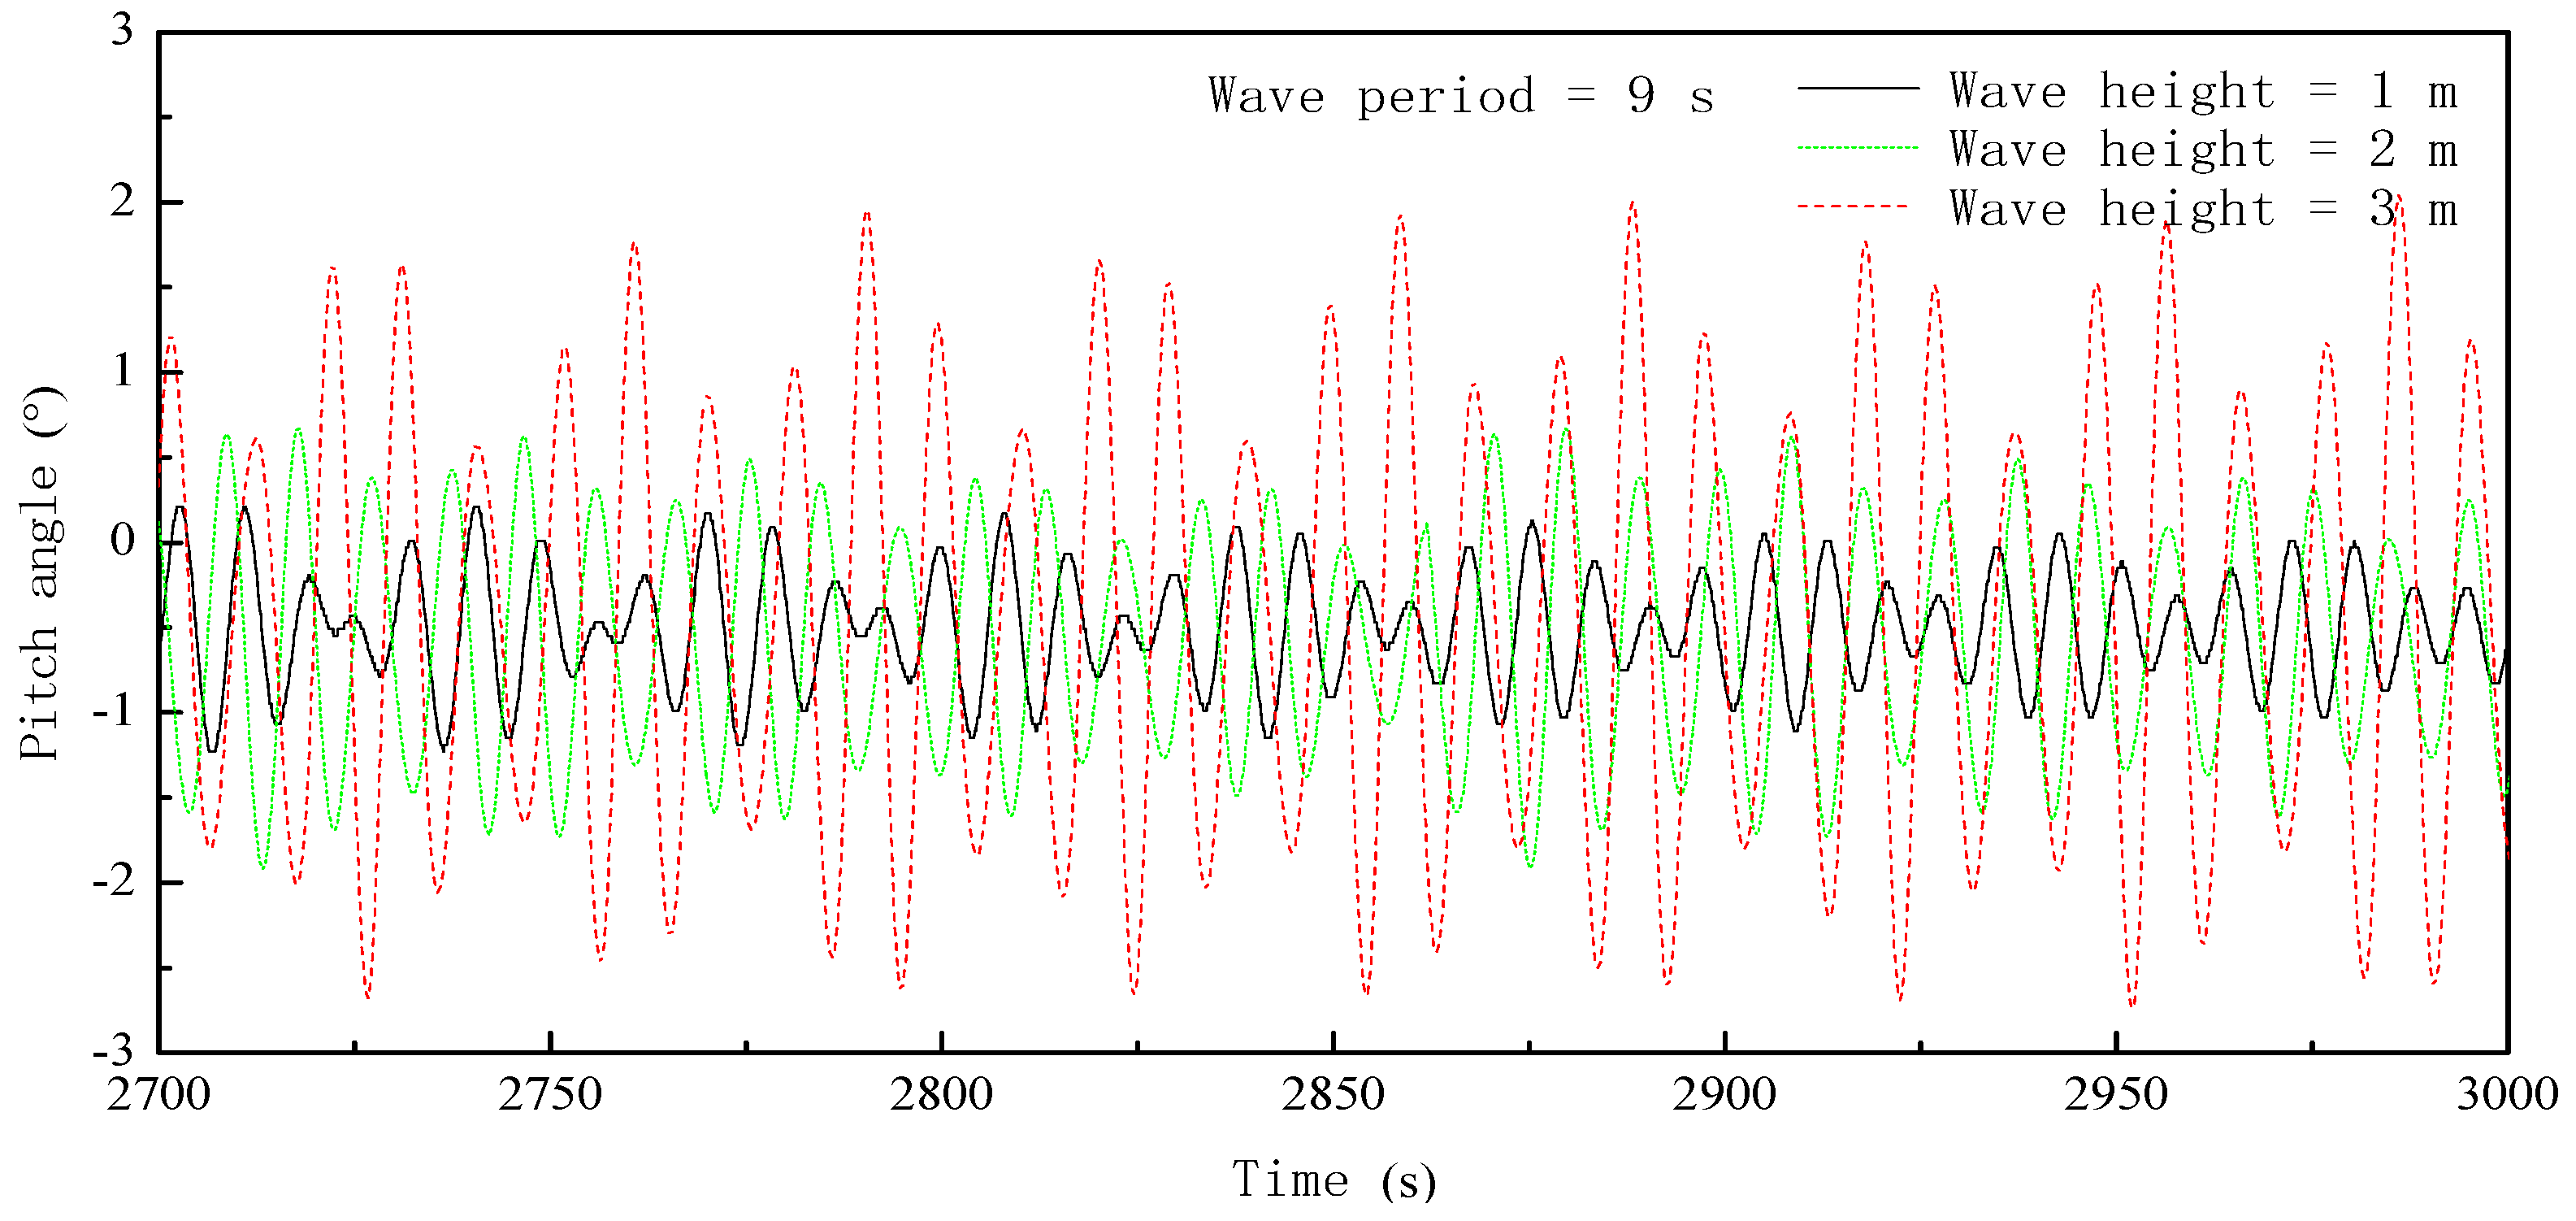
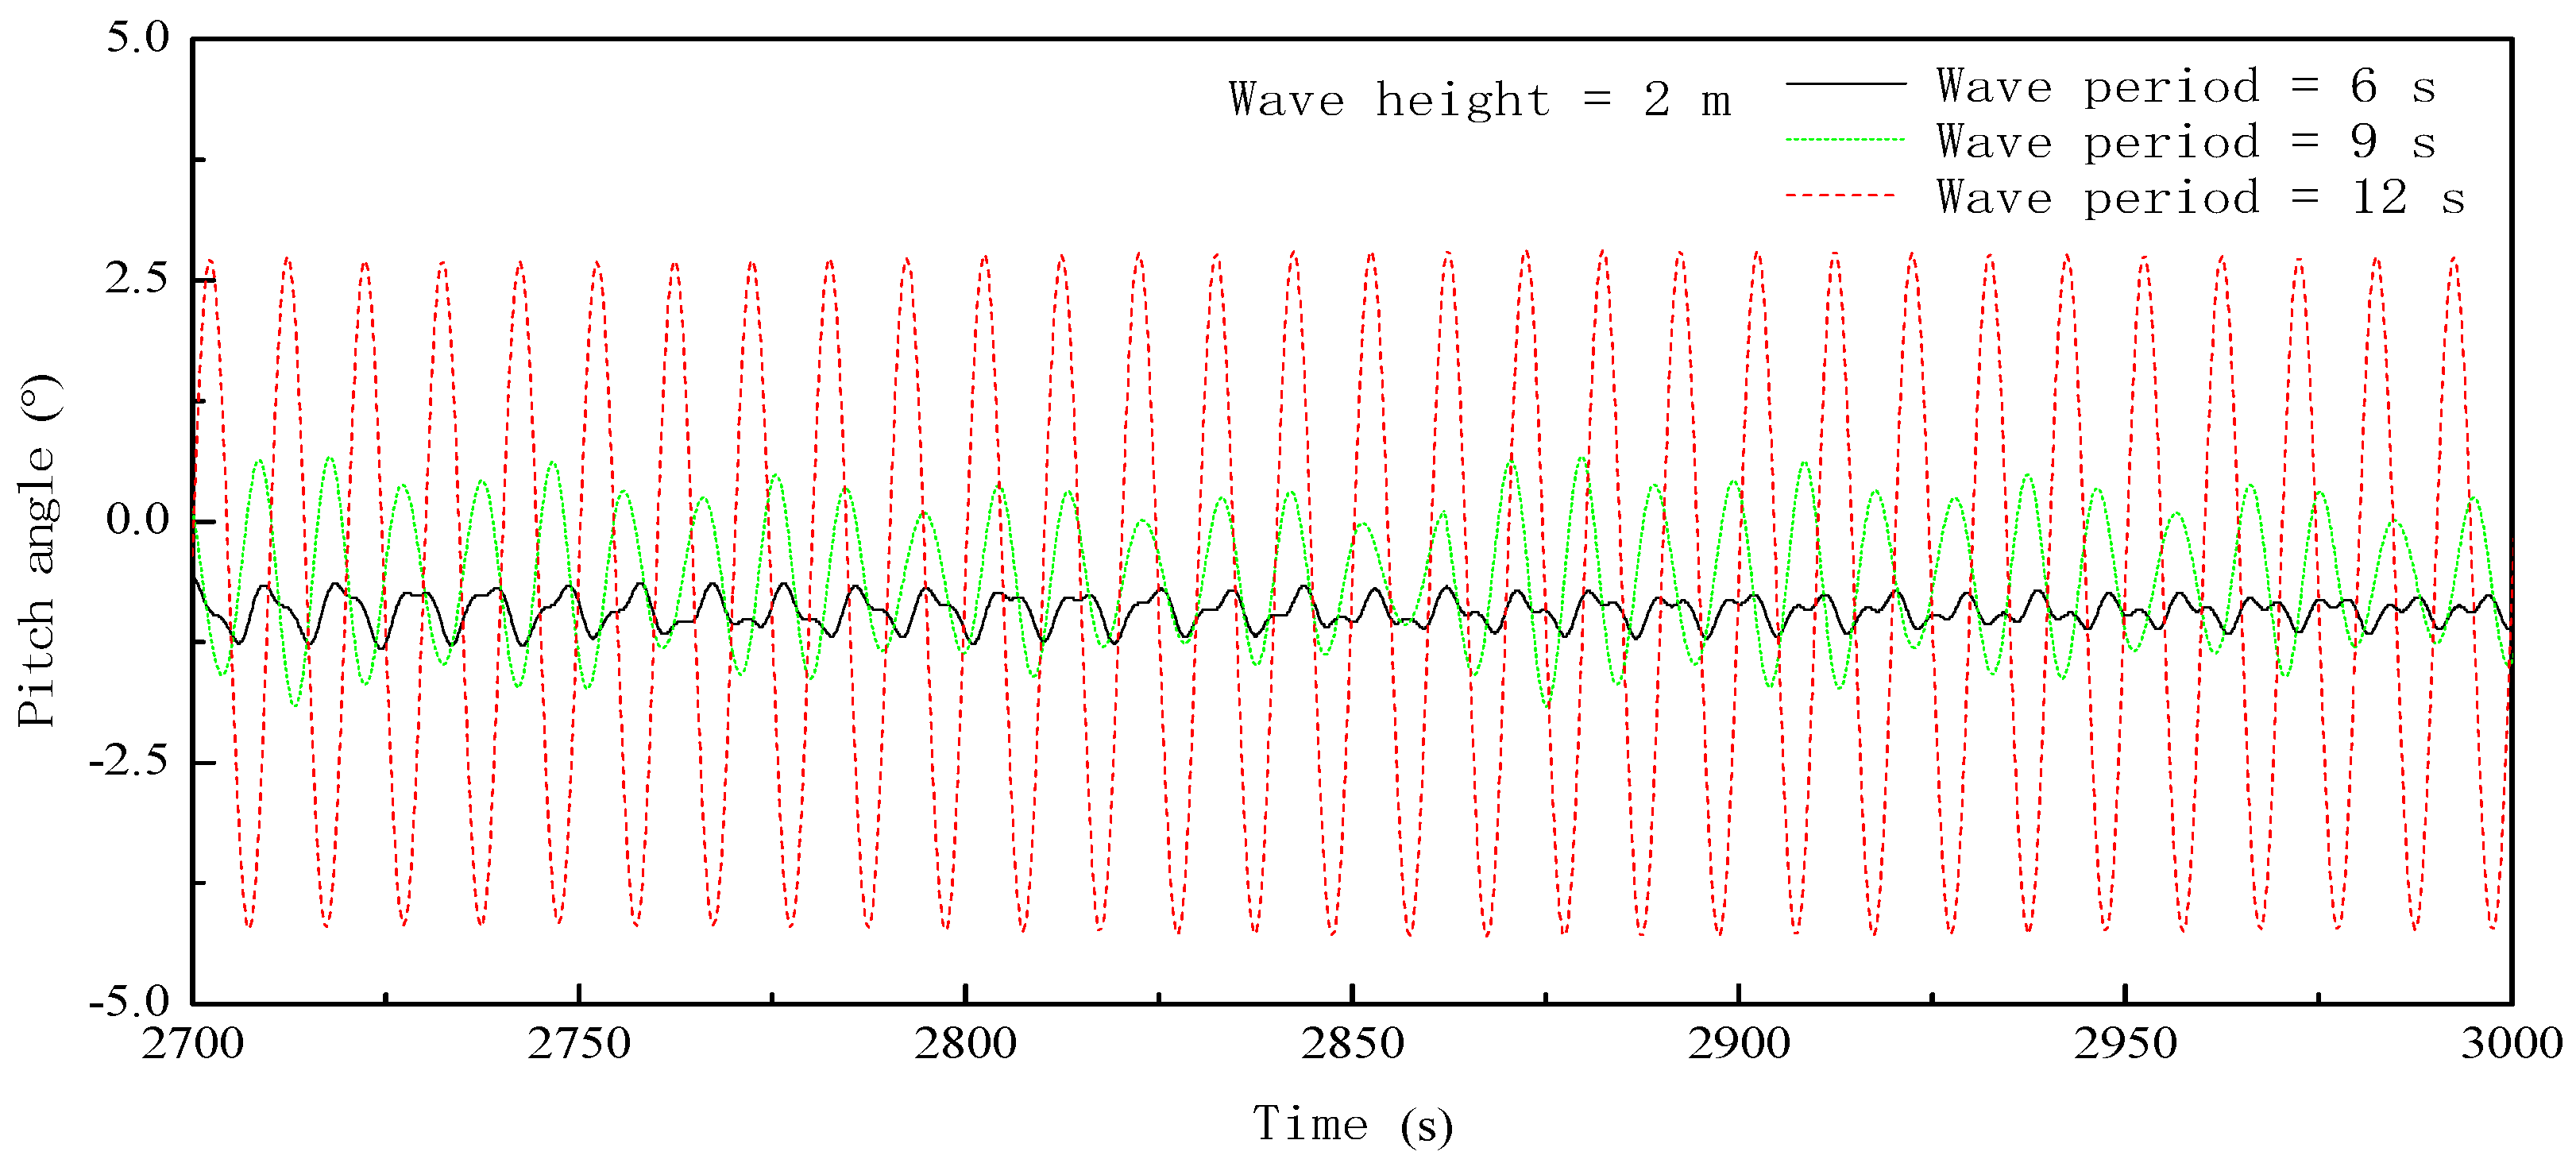
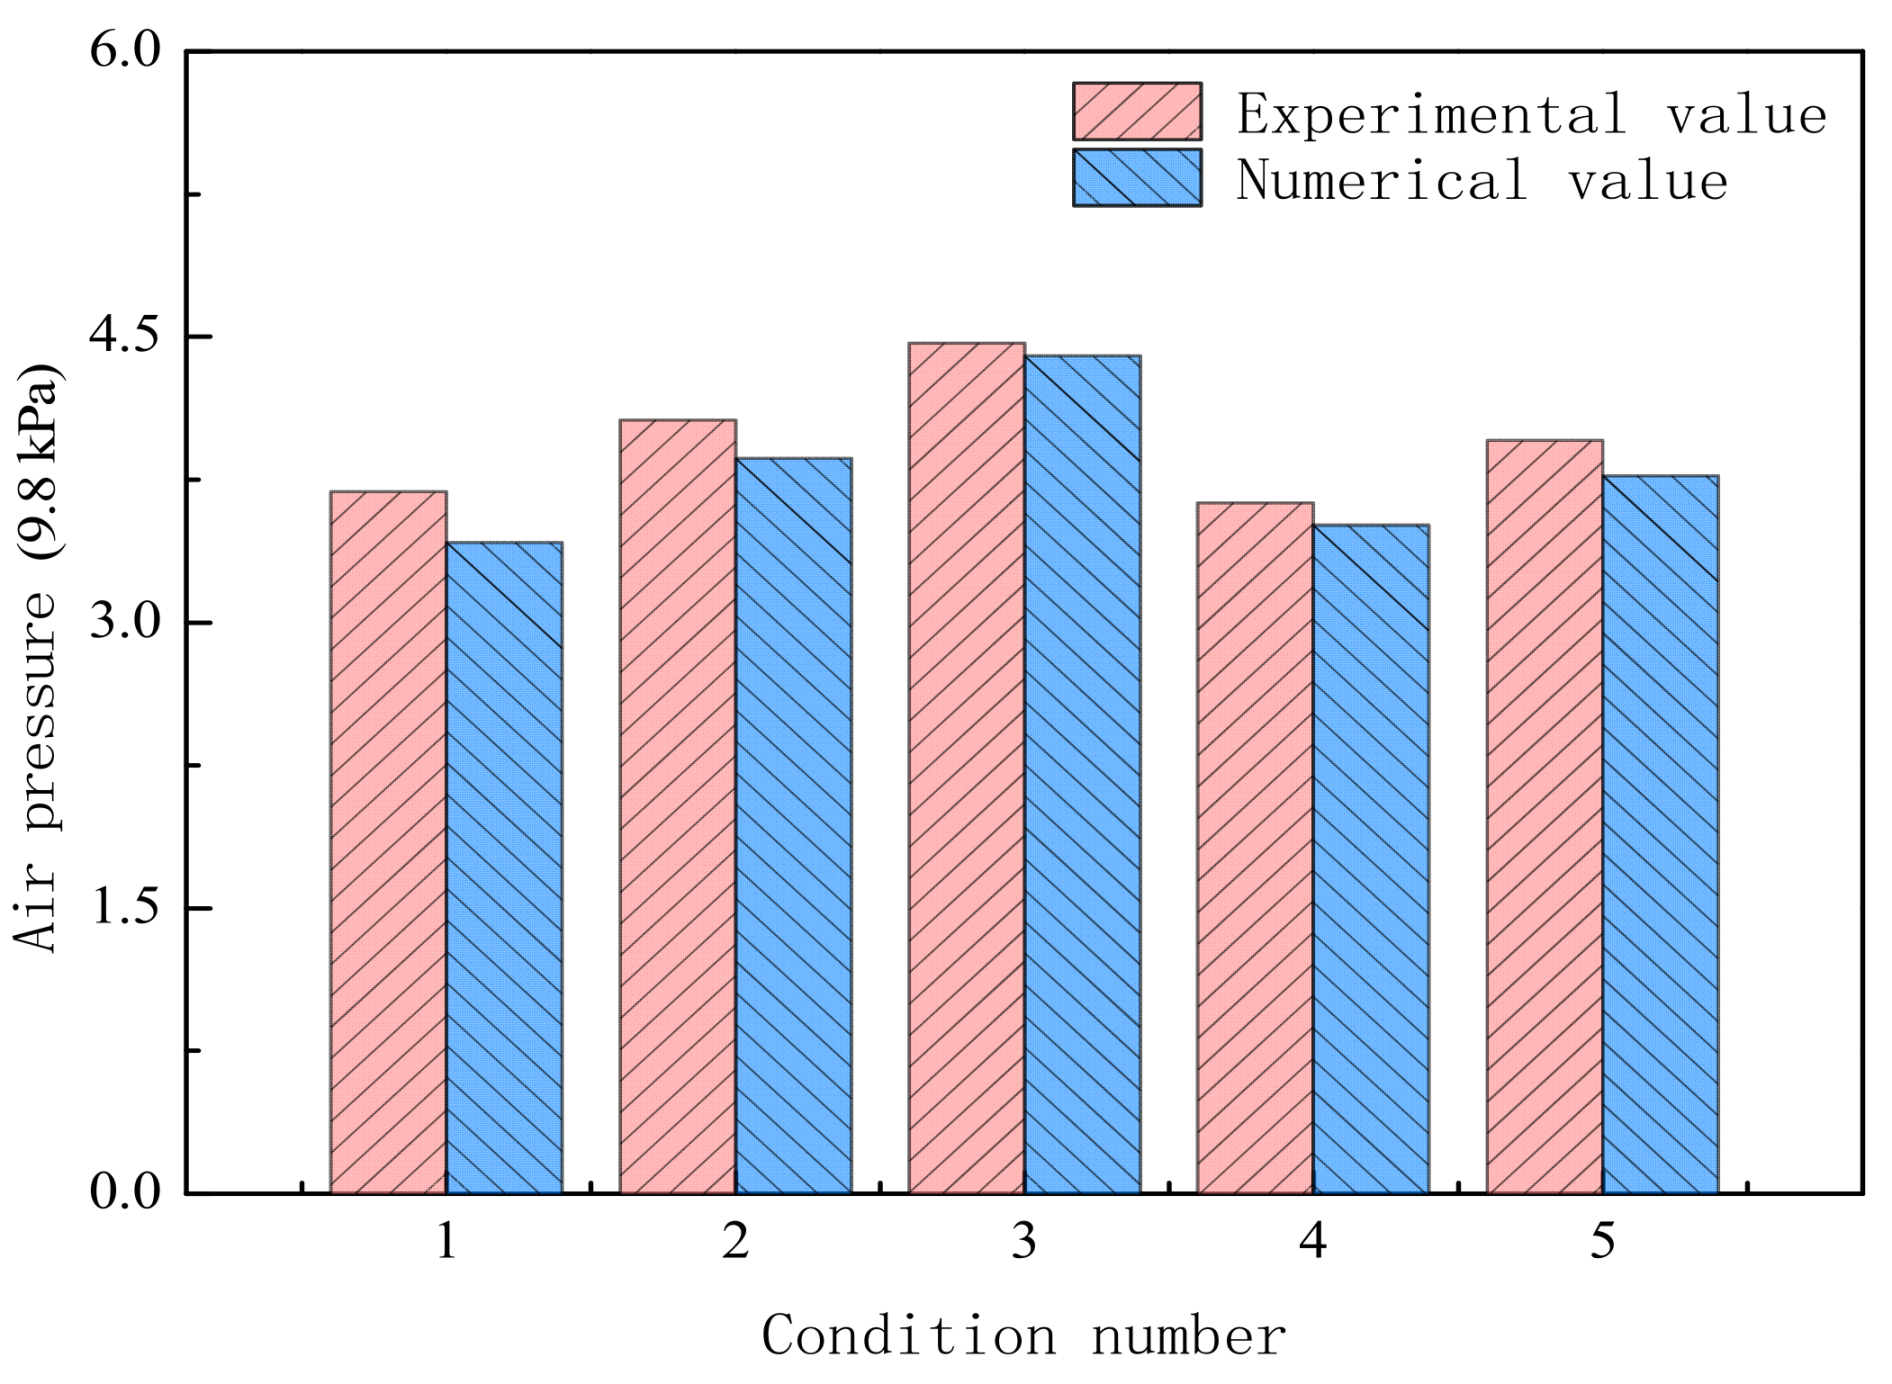
- In regular wave towing, the values and fluctuation range of dragging force, pitch angle and air pressure of bucket foundation increase with the increase of wave height or wave period. Combined with the experimental and numerical results, it can be seen that the increase of wave height will increase the wave force of the structure, and then cause greater swing and air pressure change of the structure. With the increase of wave period, it will gradually approach the swing natural period of the structure, resulting in the increase of the swing of the structure, which will lead to the increase of the fluctuation range of dragging force and air pressure. The numerical simulation is in good agreement with the values in the test, which further verifies the reliability of the numerical simulation.
- (3)
- Taking into account the combined action of wind and waves, towing simulation was performed under 3,5,7 level wind. The average value of the drag force in the three environments is basically the same, but the standard deviation of the fluctuation of the value shows an increasing trend, and the maximum values of the towing force are 138t, 212t, and 257t, respectively. The direction of the wave has a greater influence on the towing force. Under different wave directions, the maximum cable dragging force occurred under the head sea condition, followed by that under beam sea condition (245 t), while the minimum forces (221 t) was observed under the following sea condition. The calculation of the towing force helps to reasonably select the towing horsepower in the actual towing, reduce the construction cost, and improve the towing efficiency.
- (4)
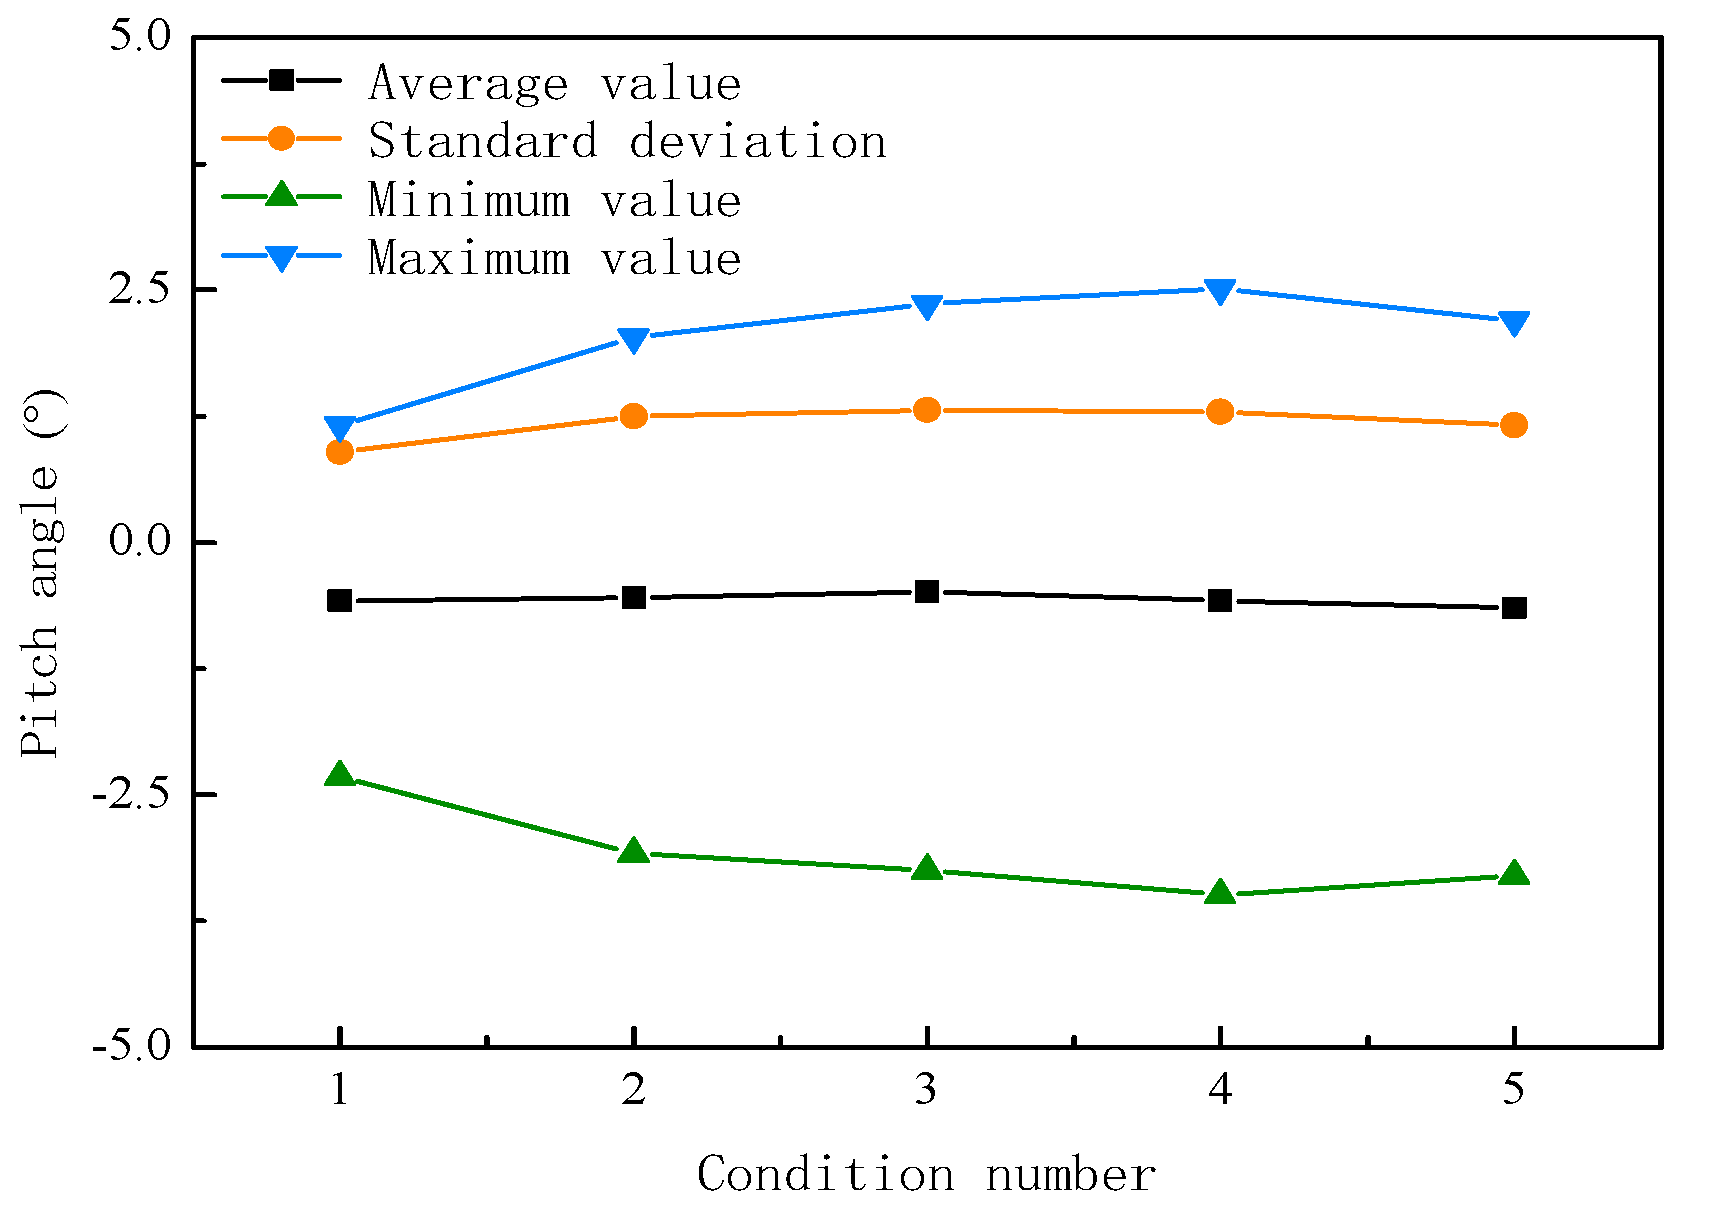
- When the draught is 7 m and the tether point is at sea level, the CBF will show a forward tilt during towing under 3,5,7 level wind, and the maximum forward tilt angles are 2.3°, 3.1°, and 3.2°, respectively. The maximum pitch angle was observed under the beam sea condition (3.5°), while the pitch angles under the following sea and head sea conditions were close to each other (approximately 3.3°).
- (5)
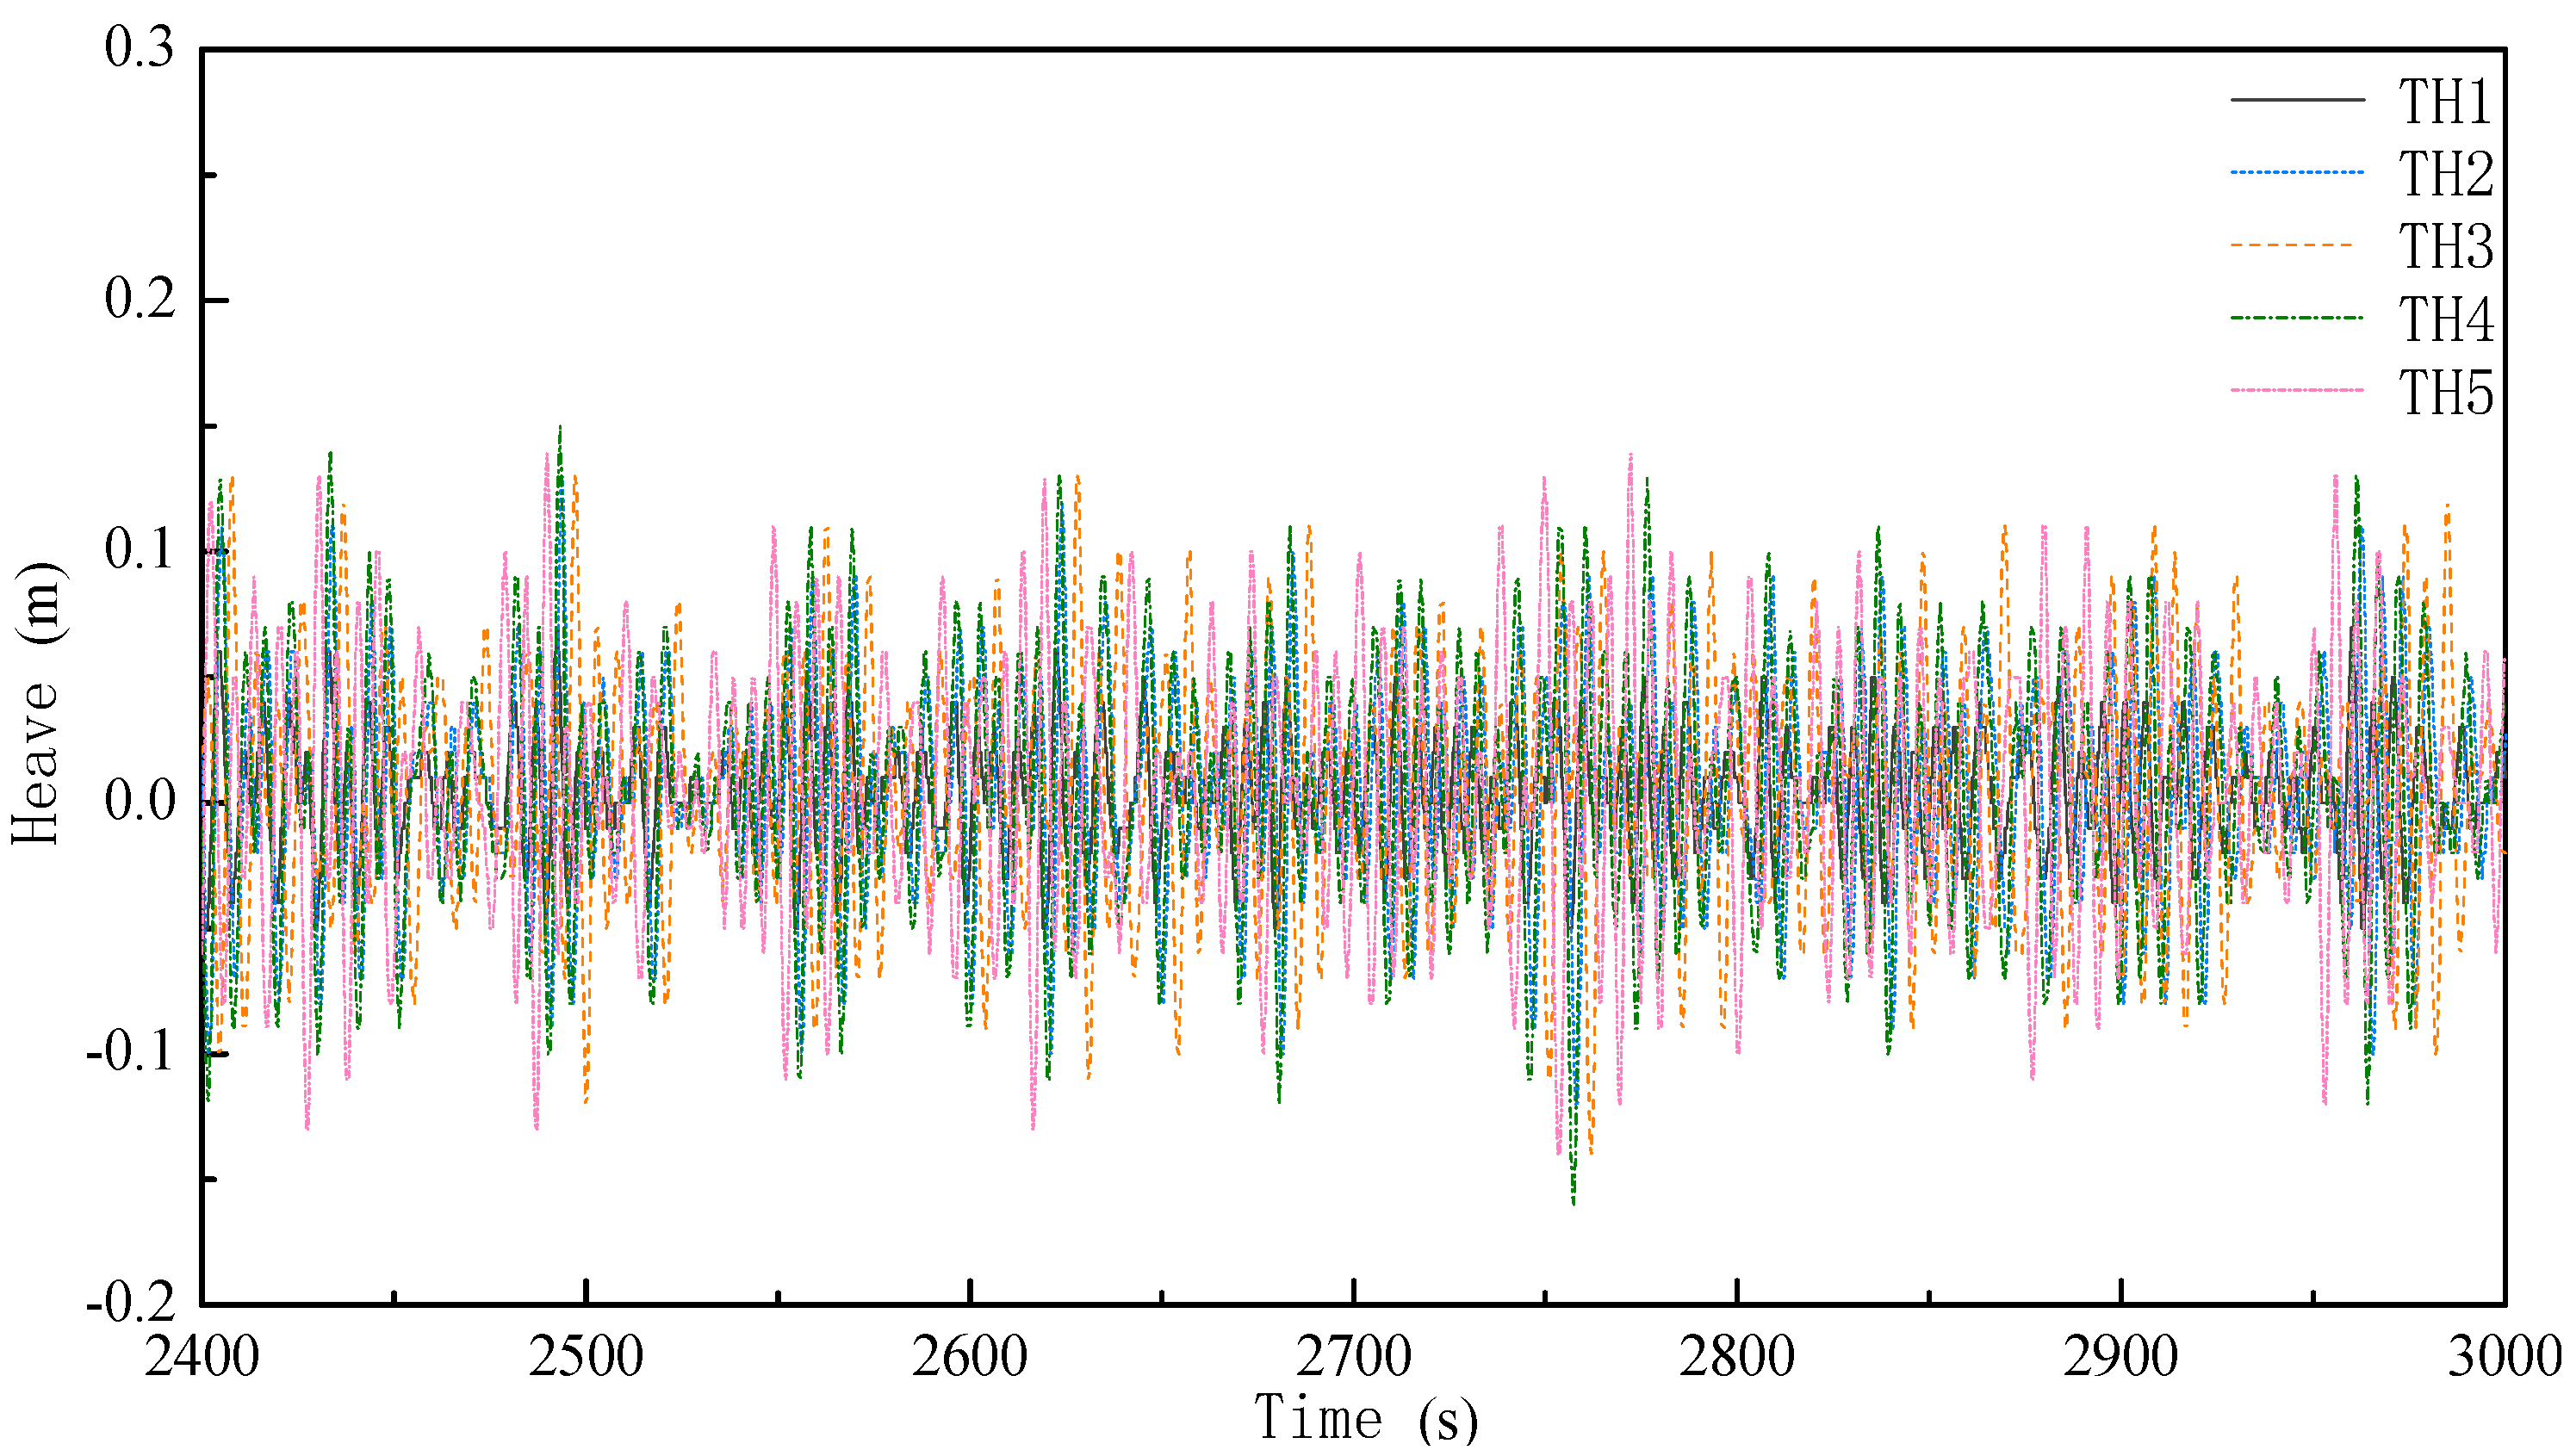
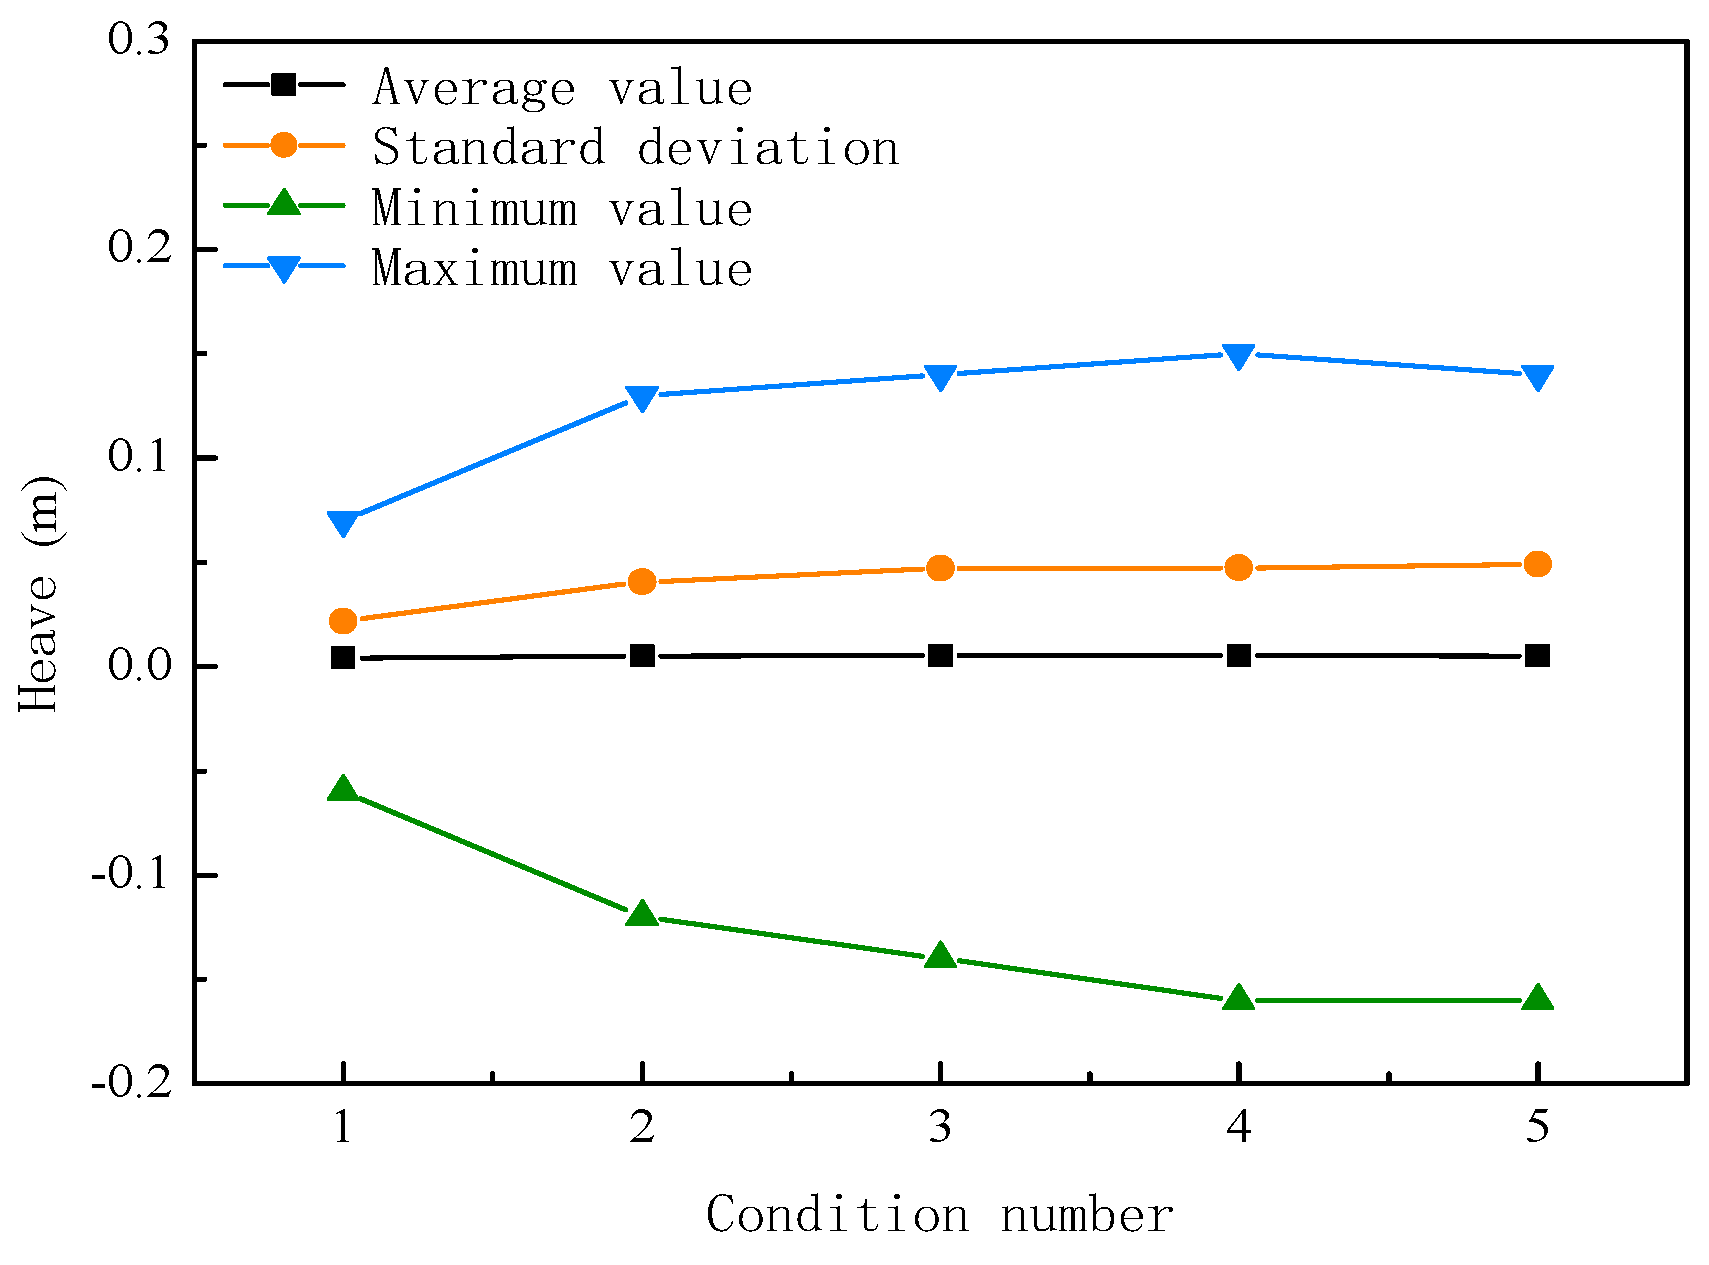
- As the level of wind and waves increases, the maximum heave value of the foundation also increases—0.07 m, 0.13 m, and 0.14 m, respectively,. The maximum heave value was observed under the beam sea condition (0.15 m), while the heave values under the following sea and head sea conditions were close to each other (approximately 0.14 m). It can be seen that the motion response of the CBF increases with the increase of the wind and wave level, and the direction of the wind and wave has little effect on it. However, towing should be avoided under the beam wind and beam sea condition as much as possible.
- (6)
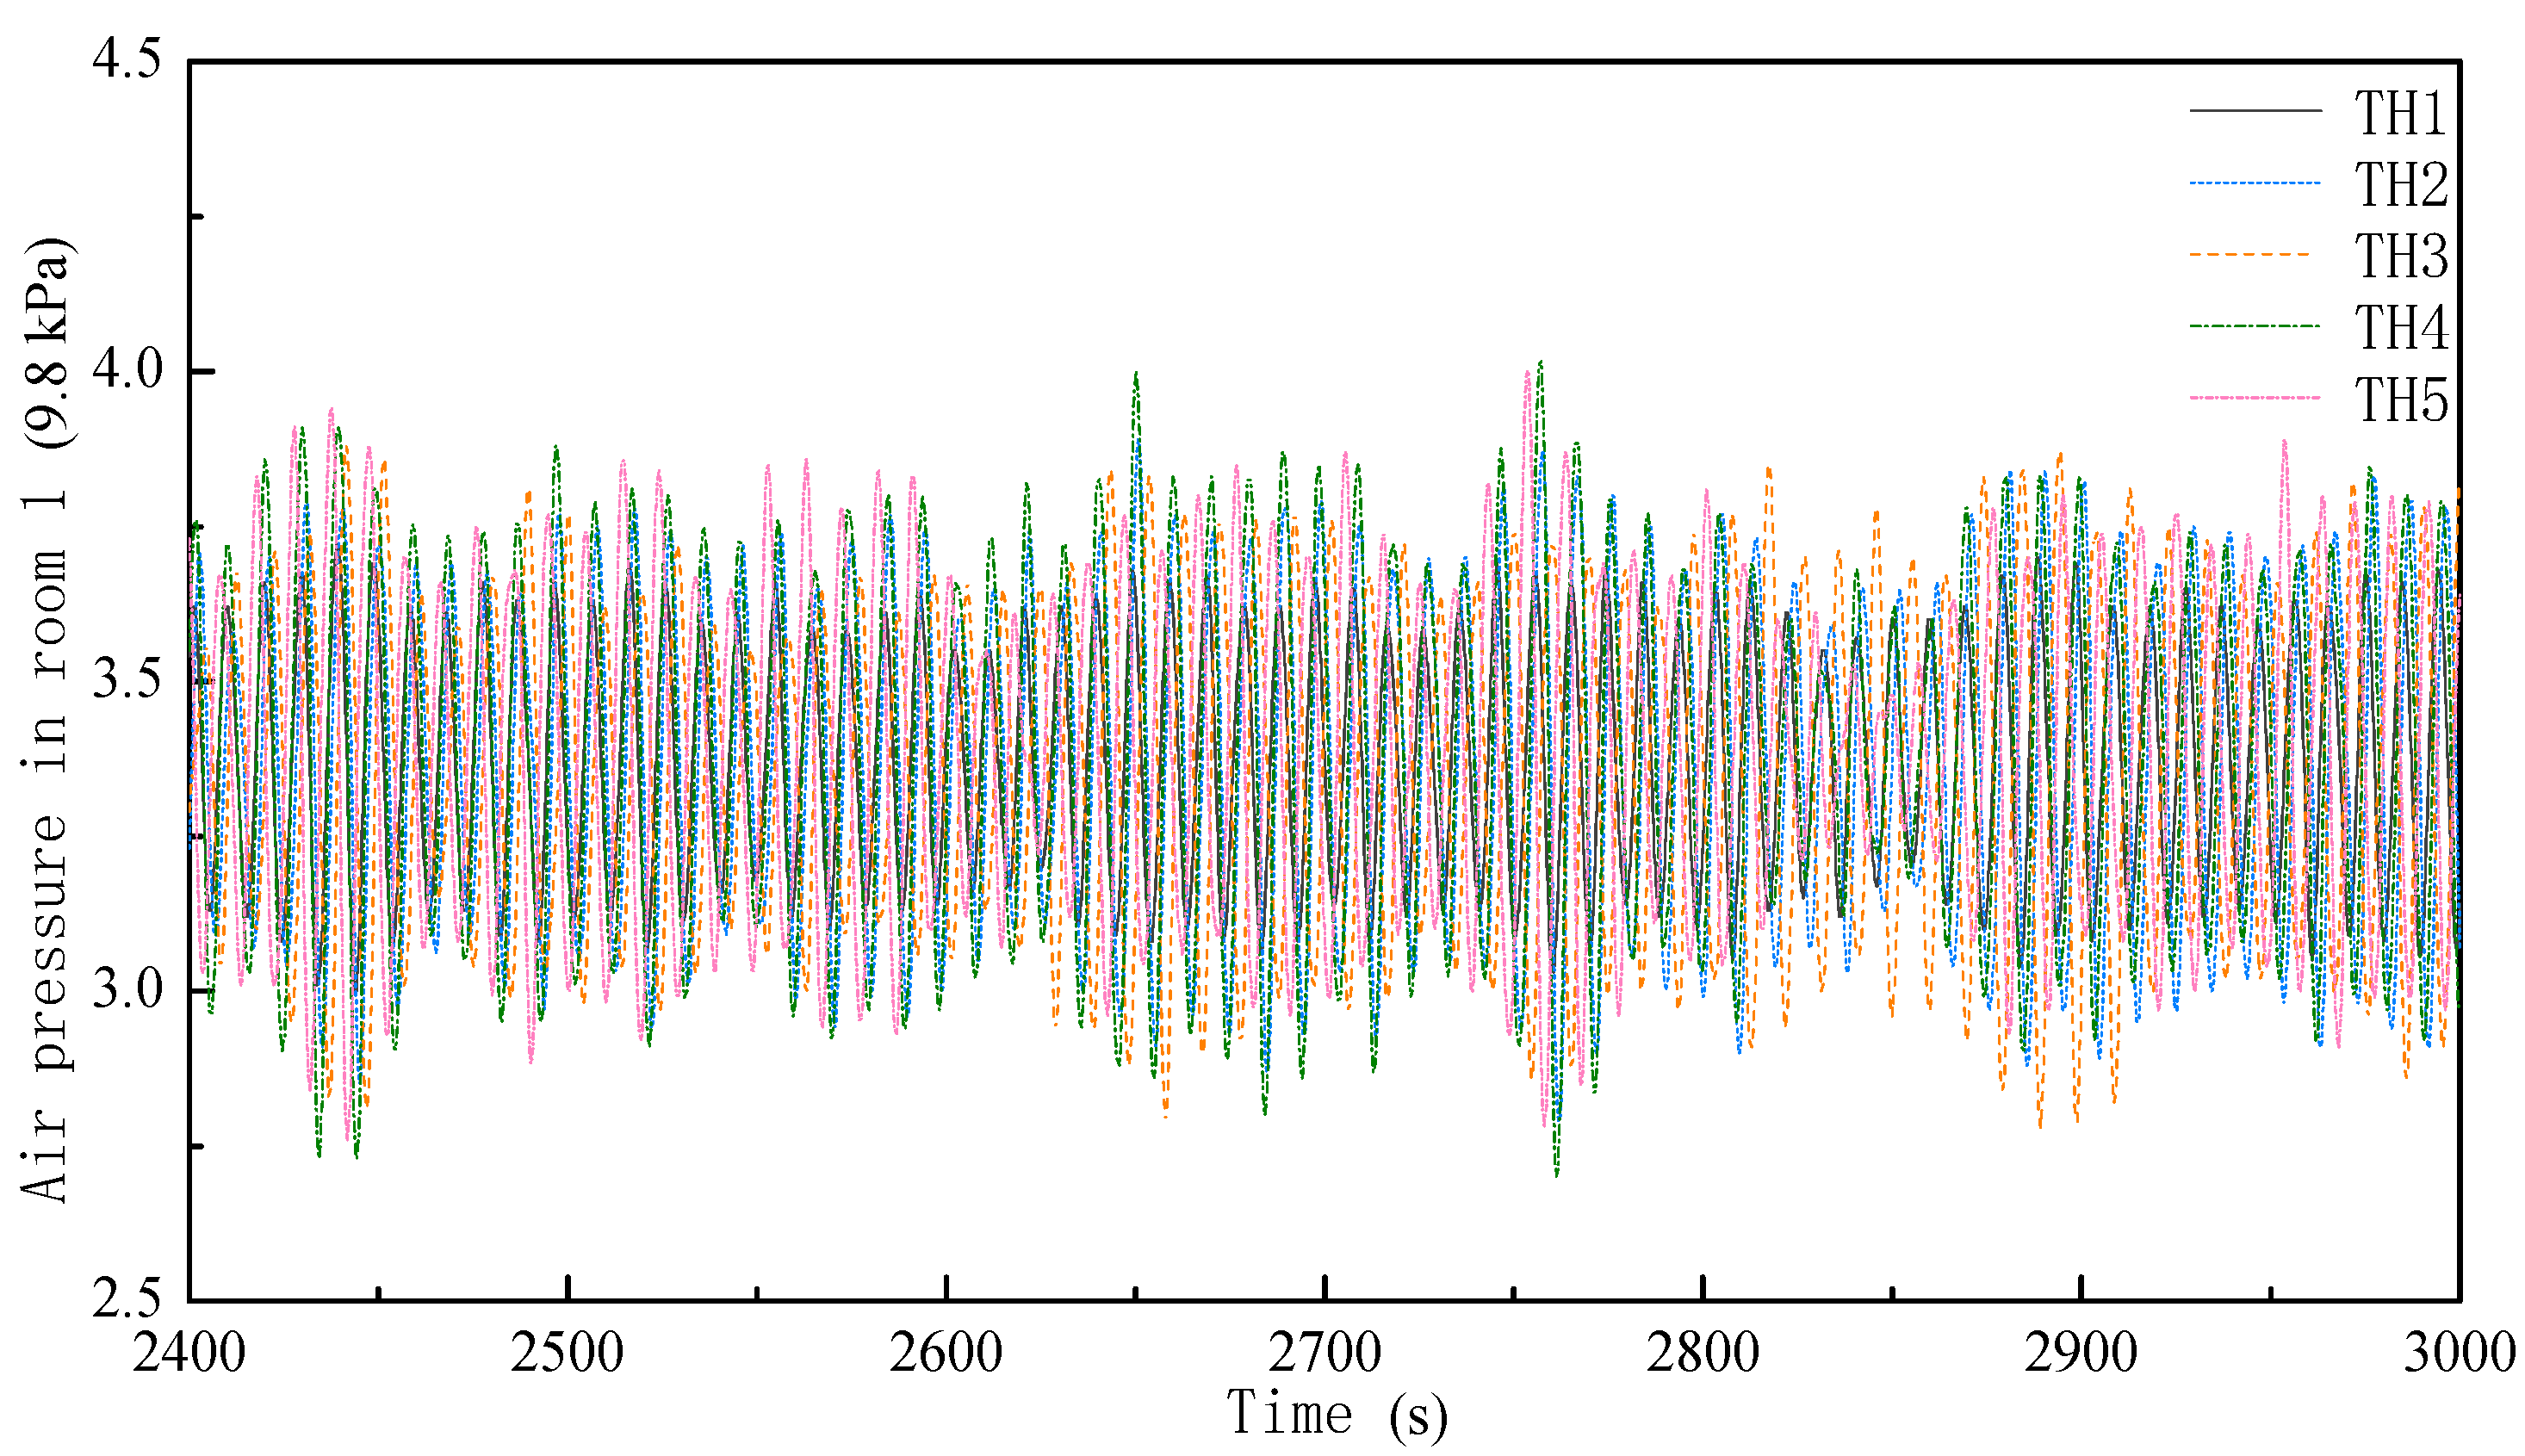
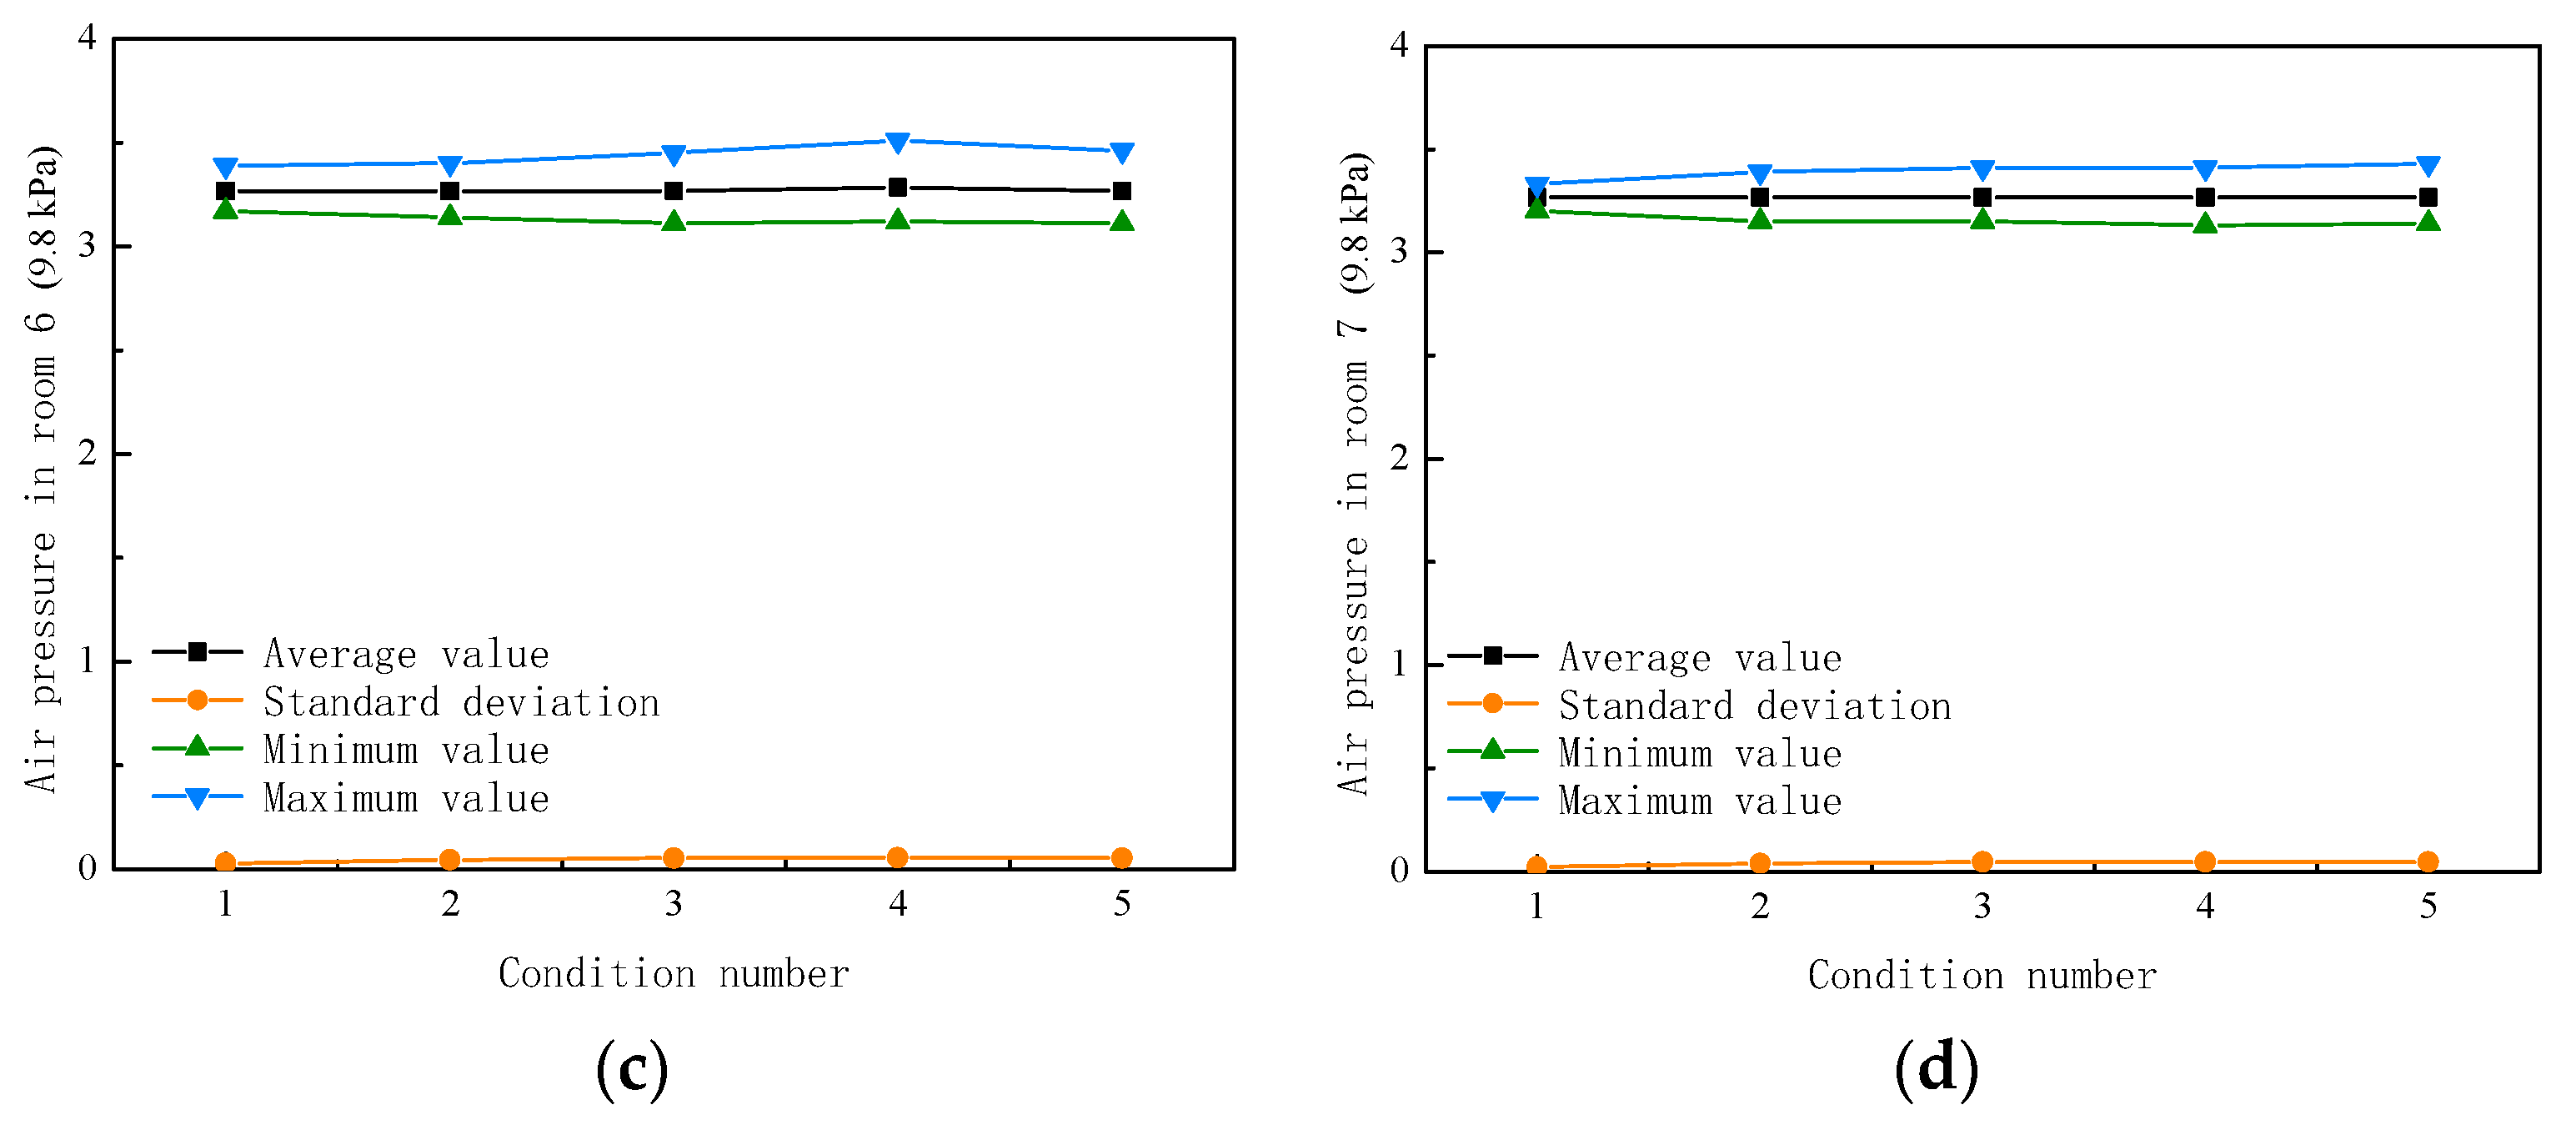
- As the level of wind and waves increases, the fluctuation range of the air pressure also increases significantly, and the fluctuation range of the atmospheric pressure of room 1 does not change much under different wave directions.
Author Contributions
Funding
Institutional Review Board Statement
Informed Consent Statement
Data Availability Statement
Conflicts of Interest
References
- Tarfaoui, M.; Shah, O.R.; Nachtane, M. Design and optimization of composite offshore wind turbine blades. J. Energy Resour. Technol. 2019, 141, 051204. [Google Scholar] [CrossRef]
- Tarfaoui, M.; Nachtane, M.; Boudounit, H. Finite element analysis of composite offshore wind turbine blades under operating conditions. J. Therm. Sci. Eng. Appl. 2020, 12, 042123. [Google Scholar] [CrossRef]
- Ren, Y.J.; Venugopal, V.; Shi, W. Dynamic analysis of a multi-column TLP floating offshore wind turbine with tendon failure scenarios. Ocean Eng. 2022, 245, 110472. [Google Scholar] [CrossRef]
- Ding, H.Y.; Lian, J.J.; Li, A.D.; Zhang, P.Y. One-step-installation of offshore wind turbine on large-scale bucket-top-bearing bucket foundation. Trans. Tianjin Univ. 2013, 19, 188–194. [Google Scholar] [CrossRef]
- Zhang, P.Y.; He, S.H.; Liu, Y.G. Force transfer characteristics of composite bucket foundation for offshore wind turbines. J. Renew. Sustain. Energy 2016, 8, 013307. [Google Scholar] [CrossRef]
- He, S.; Zhang, P.; Ding, H. Study on the Bearing Mode and Force Transfer Path of composite bucket foundations. Energies 2017, 10, 1041. [Google Scholar] [CrossRef] [Green Version]
- Jia, N.; Zhang, P.; Liu, Y.; Ding, H. Bearing capacity of composite bucket foundations for offshore wind turbines in silty sand. Ocean Eng. 2018, 151, 1–11. [Google Scholar] [CrossRef]
- Zhao, X.; Zhang, P.; Lv, Y.; Ding, H. Scour effects on bearing capacity of composite bucket foundation for offshore wind turbines. Mar. Georesour. Geotechnol. 2020, 38, 223–237. [Google Scholar] [CrossRef]
- Seidl, L.H. Development of an ASP (Air Stabilized Platform). NASA STI/Recon Technical Rep. N 1980, 81, 14183. [Google Scholar]
- Pinkster, J.; Scholte, E.M. The behaviour of a large air-supported MOB at sea. Mar. Struct. 2001, 14, 163–179. [Google Scholar] [CrossRef]
- Lee, C.H.; Newman, J.N. Wave effects on large floating structures with air cushions. J. Mar. Struct. 2000, 13, 315–330. [Google Scholar] [CrossRef]
- Bie, S.; Xu, Y.; Wang, G. Study on floating state and kinetic properties of the air floated structures. J. Tsinghua Univ. 2001, 41, 123–126. [Google Scholar]
- Bie, S.; Shi, Z.; Wang, L. Stability analysis of air float structuers with small roll angle. China Harb. Eng. 2001, 2, 31–36. [Google Scholar]
- Lian, J.J.; Chen, F.; Wang, H.J. Laboratory tests on soil–skirt interaction and penetration resistance of suction caissons during installation in sand. Ocean Eng. 2014, 84, 1–13. [Google Scholar] [CrossRef]
- Zhang, P.; Hu, R.; Ding, H.; Guo, Y.; Xiong, K. Comparative analysis of seepage field characteristics in bucket foundation with and without compartments. Ocean Eng. 2017, 143, 34–49. [Google Scholar] [CrossRef]
- Hu, R.; Zhang, P.; Ding, H.; Le, C. Numerical analysis of seepage field of bucket foundations for offshore wind turbines. Ships Offshore Struct. 2018, 13, 822–834. [Google Scholar] [CrossRef]
- Zhang, P.; Wei, W.; Jia, N.; Ding, H.; Liu, R. Effect of seepage on the penetration resistance of bucket foundations with bulkheads for offshore wind turbines in sand. Ocean Eng. 2018, 156, 82–92. [Google Scholar] [CrossRef]
- Ding, H.Y.; Huang, X.; Zhang, P.Y.; Liu, X.Q. Analysis on influence factors of towing of air float bucket foundation platform. Eng. Mech. 2012, 29, 193–198. [Google Scholar]
- Zhang, P.Y.; Ding, H.Y.; Le, C.H.; Huang, X. Towing characteristics of large-scale composite bucket foundation for offshore wind turbines. J. Southeast Univ. 2013, 3, 300–304. [Google Scholar]
- Zhang, P.Y.; Han, Y.Q.; Ding, H.Y.; Zhang, S.Y. Field experiments on wet tows of an integrated transportation and installation vessel with two bucket foundations for offshore wind turbines. Ocean Eng. 2015, 108, 769–777. [Google Scholar] [CrossRef]
- He, F.; Huang, Z.; Law, A.W.-K. An experimental study of a floating breakwater with asymmetric pneumatic chambers for wave energy extraction. Appl. Energy 2013, 106, 222–231. [Google Scholar] [CrossRef]
- Bie, S.A.; Ren, Z.J.; Li, Z.Z. Mechanical Properties of Air Floating Structures. Chin. J. Appl. Mech. 2004, 1, 68–71. [Google Scholar]
- Ding, H.; Zhao, X.; Le, C.; Zhang, P.; Min, Q. Towing Motion Characteristics of Composite Bucket Foundation for Offshore Wind Turbines. Energies 2019, 12, 3767. [Google Scholar] [CrossRef] [Green Version]
- Zhang, P.Y.; Shi, J.C.; Ding, H.Y.; Huang, X.X. Floating analysis of composite bucket foundation of offshore wind turbine. Acta Energ. Sol. Sin. 2014, 35, 2313–2319. [Google Scholar]
- Zhang, P.Y.; Zhao, X.; Ding, H.Y.; Le, C.H. The wet-towing resistance of the composite bucket foundation for offshore wind turbines. Marine Struct. 2021, 80, 103089. [Google Scholar] [CrossRef]
- Ding, H.Y.; Feng, Z.T.; Zhang, P.Y.; Le, C.; Guo, Y. Floating performance of a composite bucket foundation with an offshore wind tower during transportation. Energies 2020, 13, 882. [Google Scholar] [CrossRef] [Green Version]


| Diameter/m | Length of Subdivision Deck/m | Height/m | Weight | Height of Center of Gravity/m | Radius of Gyration/m | |
|---|---|---|---|---|---|---|
| Prototype | 35 | 8.75 | 10 | 3000 t | 3.9 | 10.6 |
| Test model | 1 | 0.25 | 0.285 | 70 kg | 0.11 | 0.3 |
| Direction | Wave Height (m) | Wave Period (s) | Wave Length (m) |
|---|---|---|---|
| N-NNE | 1.87 | 8.09 | 48.48 |
| NE-ENE | 1.89 | 9.75 | 59.35 |
| E-ESE | 1.92 | 9.87 | 60.07 |
| SE-SSE | 1.68 | 9.05 | 54.45 |
| Towing Condition | WavePeriod/s | Wave Height/m | Wave Direction | Towing Speed/m/s | Draft/m | Ratio of Air and Water in the Room | Mooring Position |
|---|---|---|---|---|---|---|---|
| S1 | 9 | 1 | Head sea | 1.5 | 7 | 1.57:1 | High |
| S2 | 9 | 2 | Head sea | 1.5 | 7 | 1.57:1 | High |
| S3 | 9 | 3 | Head sea | 1.5 | 7 | 1.57:1 | High |
| S4 | 6 | 2 | Head sea | 1.5 | 7 | 1.57:1 | High |
| S5 | 12 | 2 | Head sea | 1.5 | 7 | 1.57:1 | High |
| Environmental Parameter | TH1 | TH2 | TH3 | TH4 | TH5 |
|---|---|---|---|---|---|
| Wind level | 3 | 5 | 7 | 7 | 7 |
| Average wind speed/m/s | 5 | 10 | 17 | 17 | 17 |
| Significant wave height/m | 1 | 2 | 2.5 | 2.5 | 2.5 |
| Peak spectral period/s | 9.8 | 10 | 10.5 | 10.5 | 10.5 |
| Towing speed/m/s | 1.5 | 1.5 | 1.5 | 1.5 | 1.5 |
| Wave direction | 180 | 180 | 180 | 90 | 0 |
Publisher’s Note: MDPI stays neutral with regard to jurisdictional claims in published maps and institutional affiliations. |
© 2022 by the authors. Licensee MDPI, Basel, Switzerland. This article is an open access article distributed under the terms and conditions of the Creative Commons Attribution (CC BY) license (https://creativecommons.org/licenses/by/4.0/).
Share and Cite
Zhao, X.; Zhang, P.; Le, C.; Ding, H. Floating Behavior of a Composite Bucket Foundation under the Combined Action of Wind and Waves. J. Mar. Sci. Eng. 2022, 10, 147. https://doi.org/10.3390/jmse10020147
Zhao X, Zhang P, Le C, Ding H. Floating Behavior of a Composite Bucket Foundation under the Combined Action of Wind and Waves. Journal of Marine Science and Engineering. 2022; 10(2):147. https://doi.org/10.3390/jmse10020147
Chicago/Turabian StyleZhao, Xing, Puyang Zhang, Conghuan Le, and Hongyan Ding. 2022. "Floating Behavior of a Composite Bucket Foundation under the Combined Action of Wind and Waves" Journal of Marine Science and Engineering 10, no. 2: 147. https://doi.org/10.3390/jmse10020147