

Laboratory Experiments on the Influence of the Wave Spectrum Enhancement Factor on a Rubble Mound Breakwater
 ,
,
Abstract
:1. Introduction
2. Materials and Methods
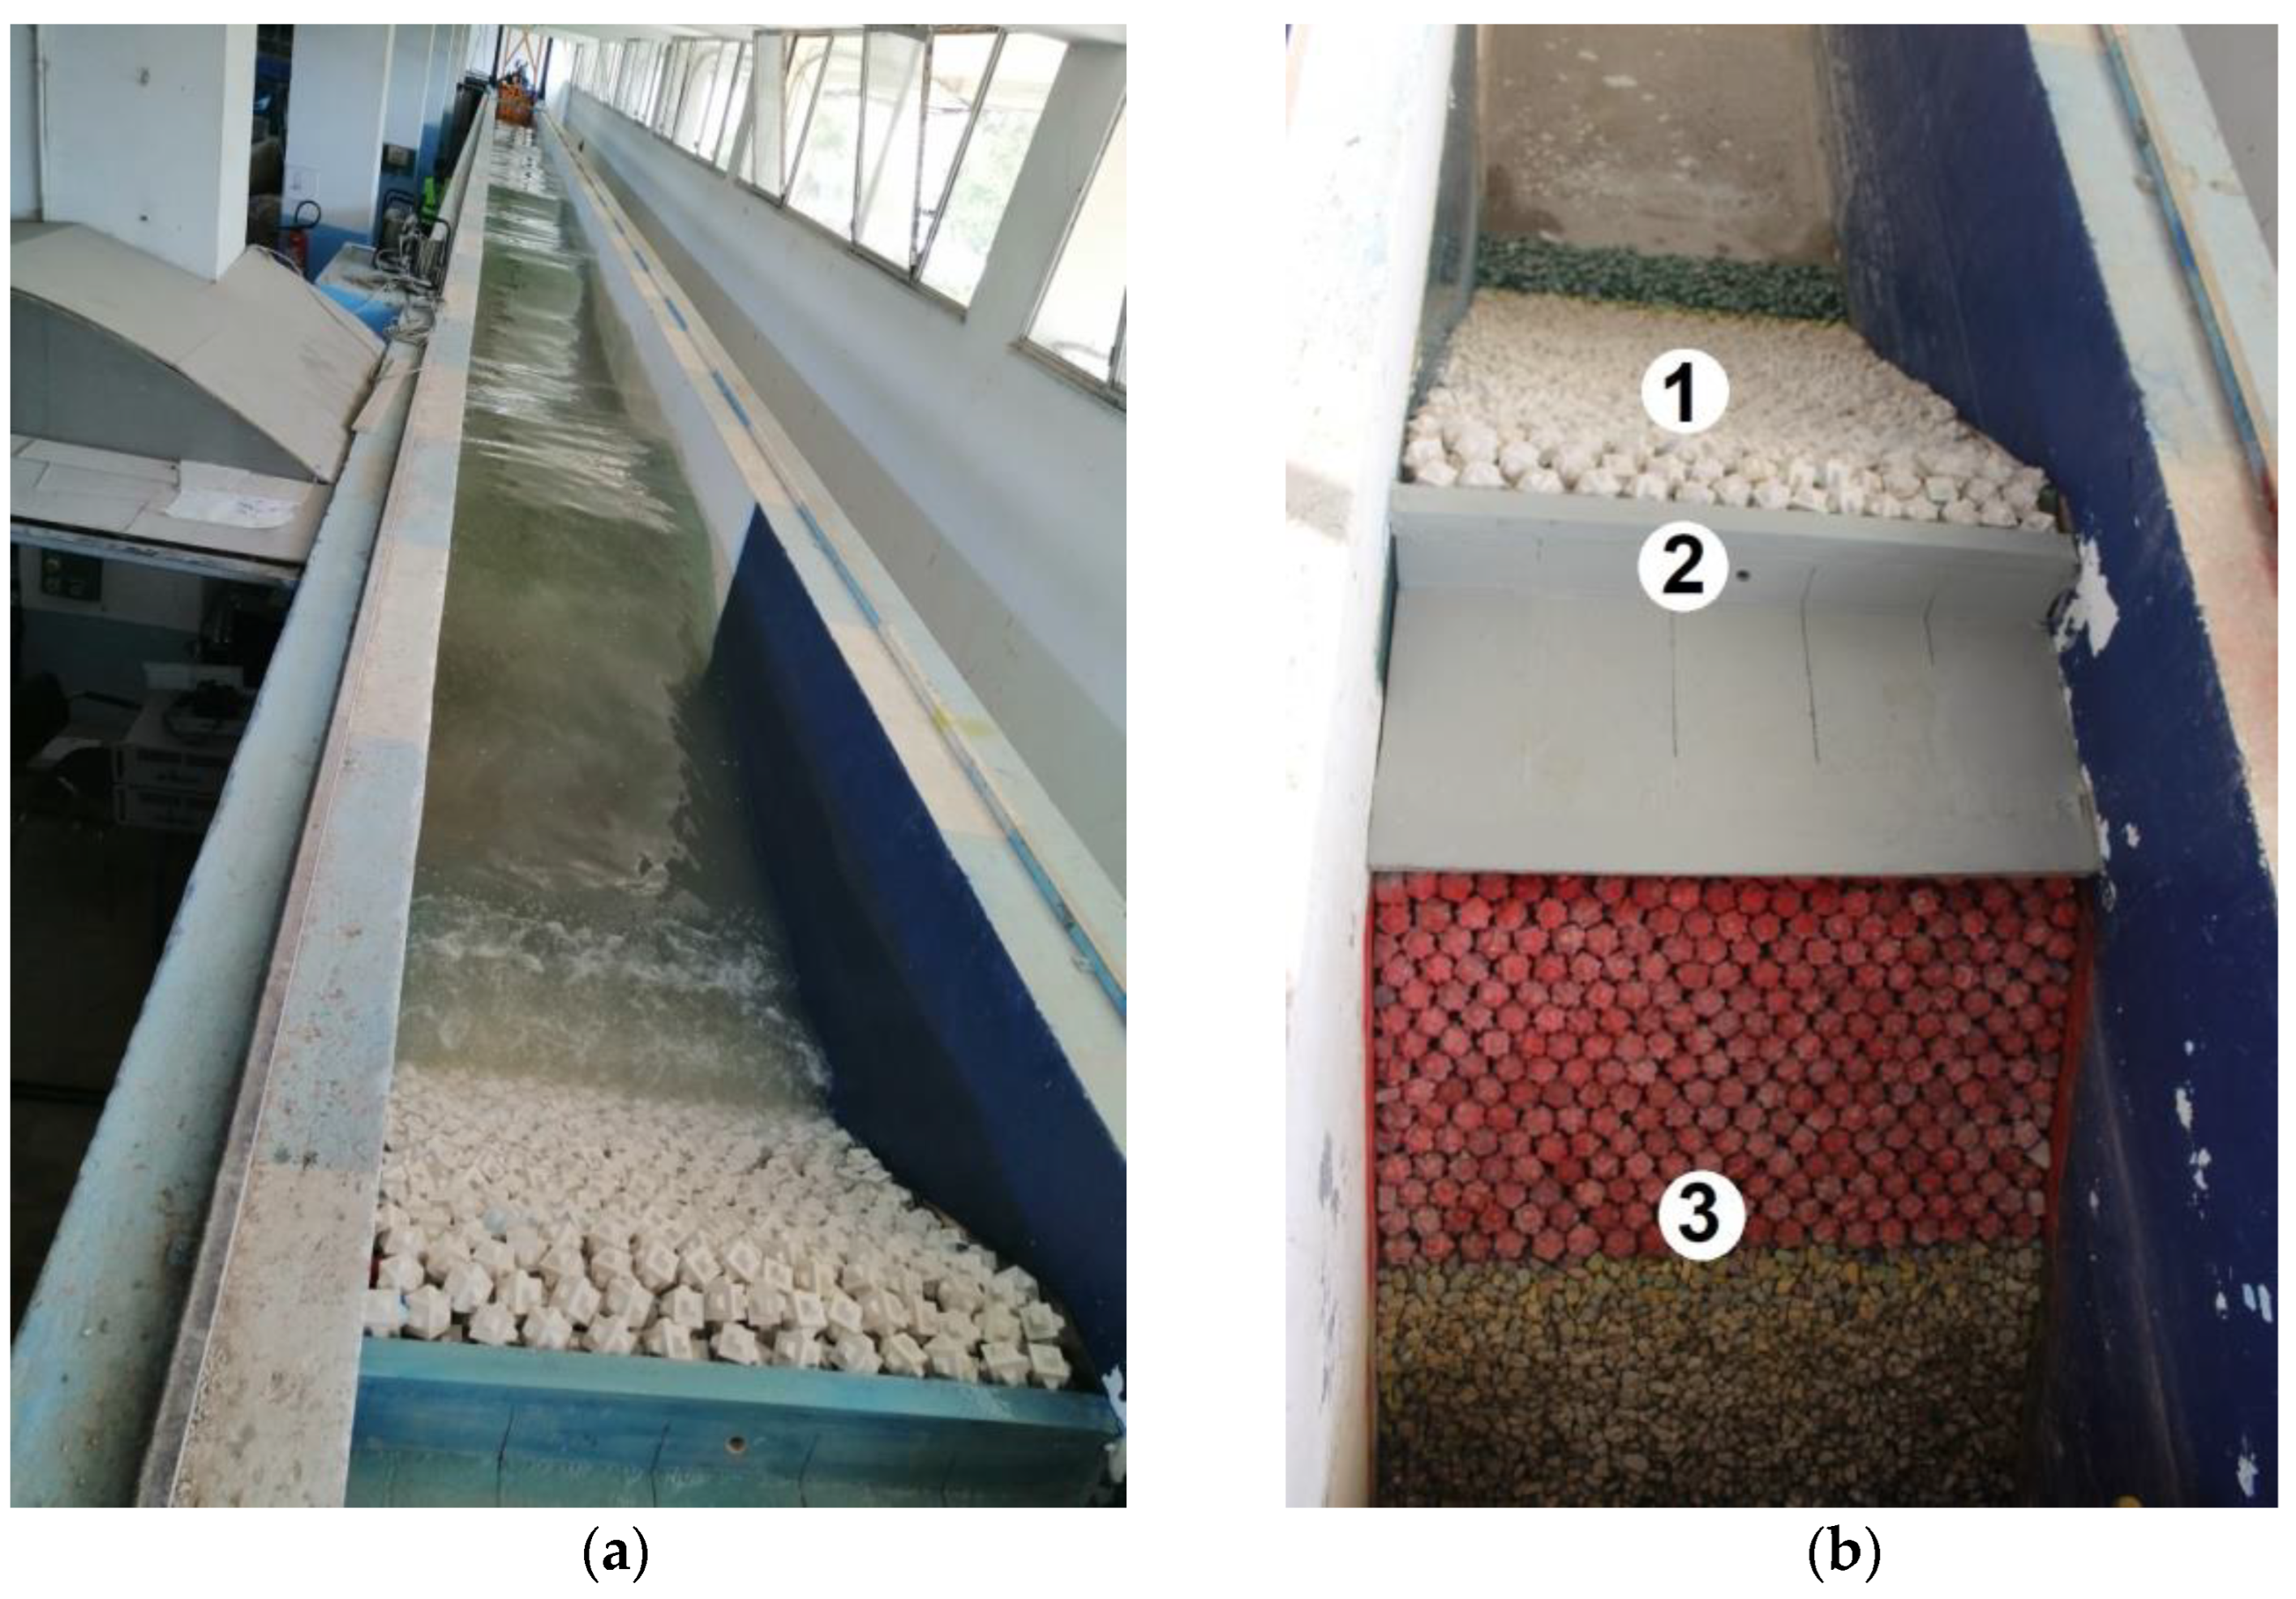
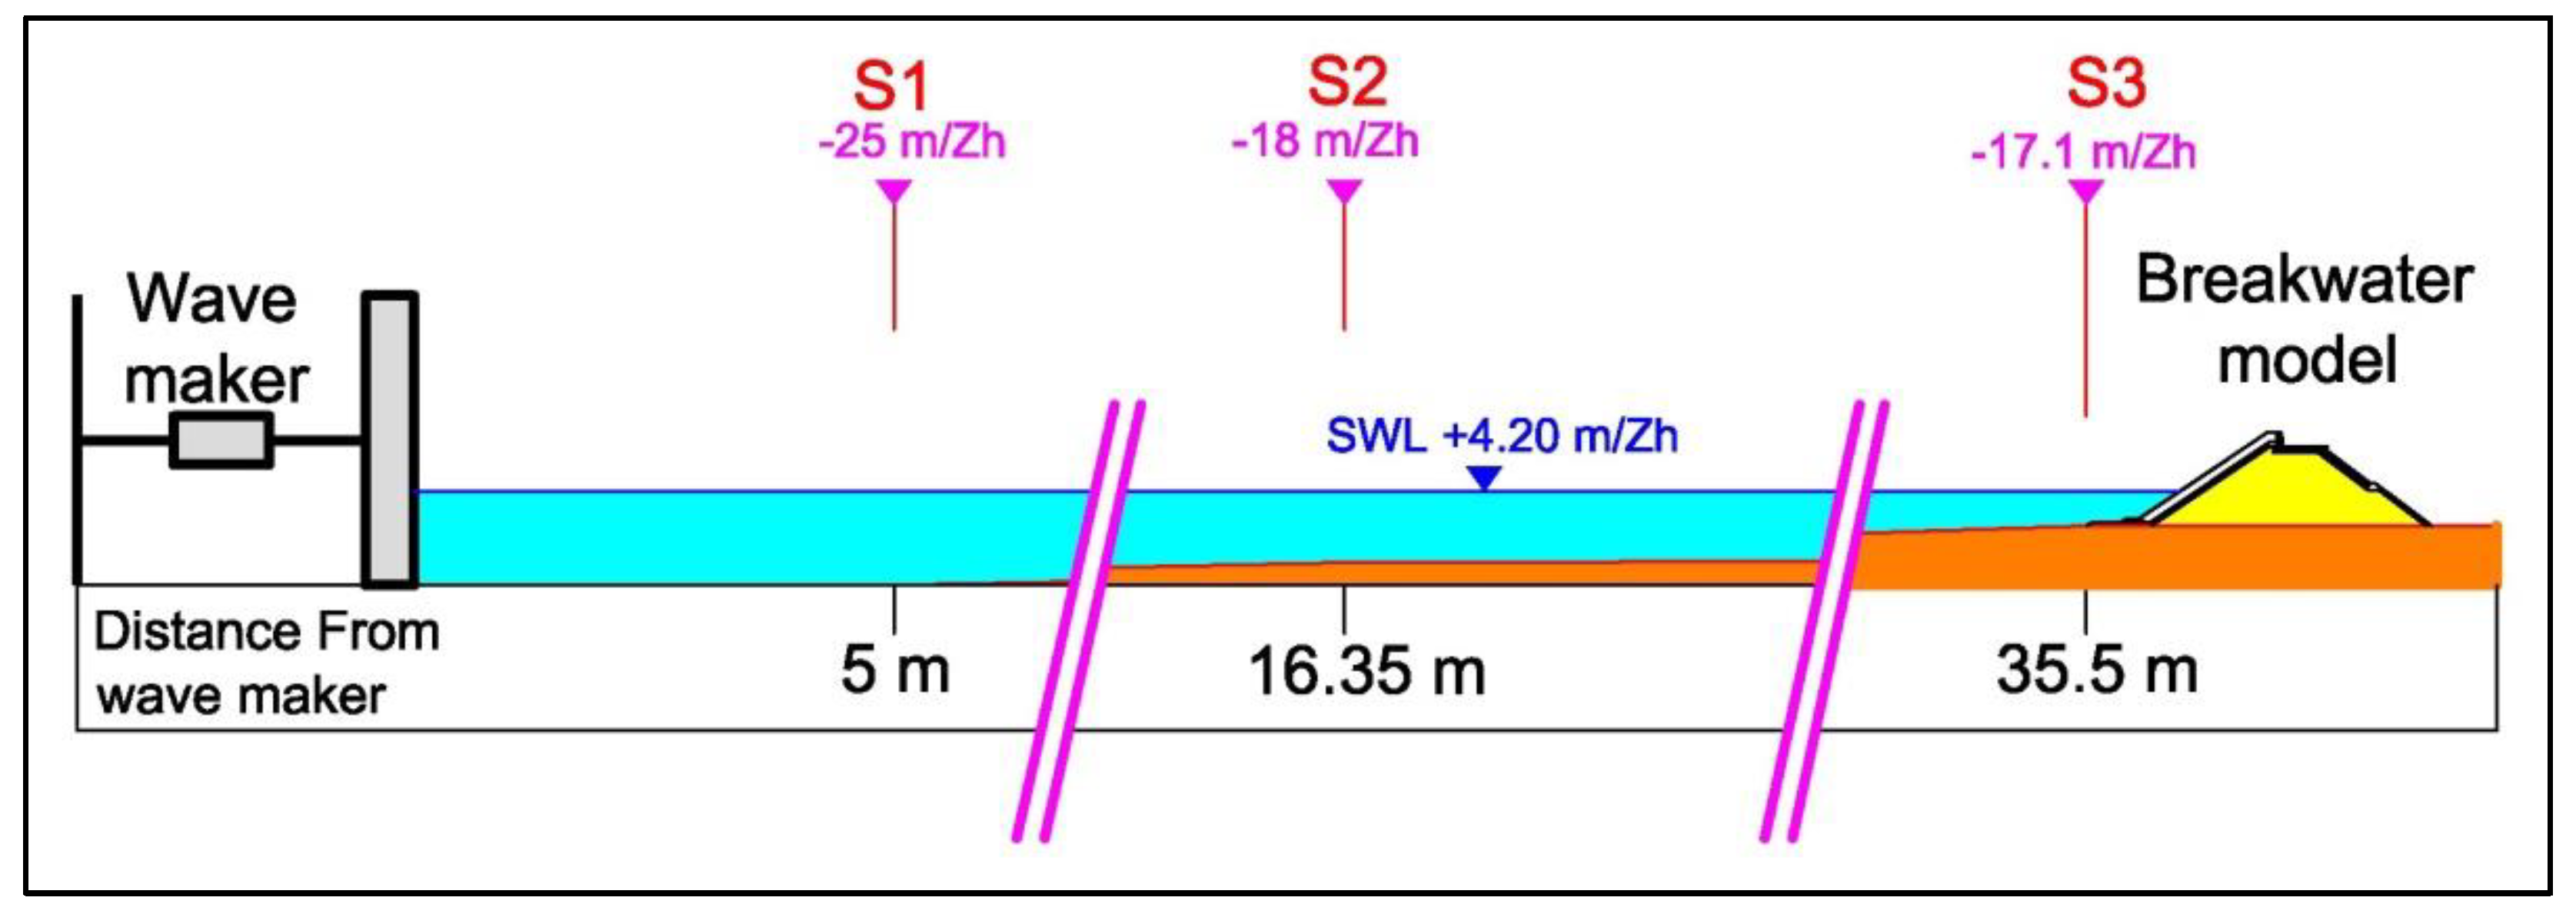
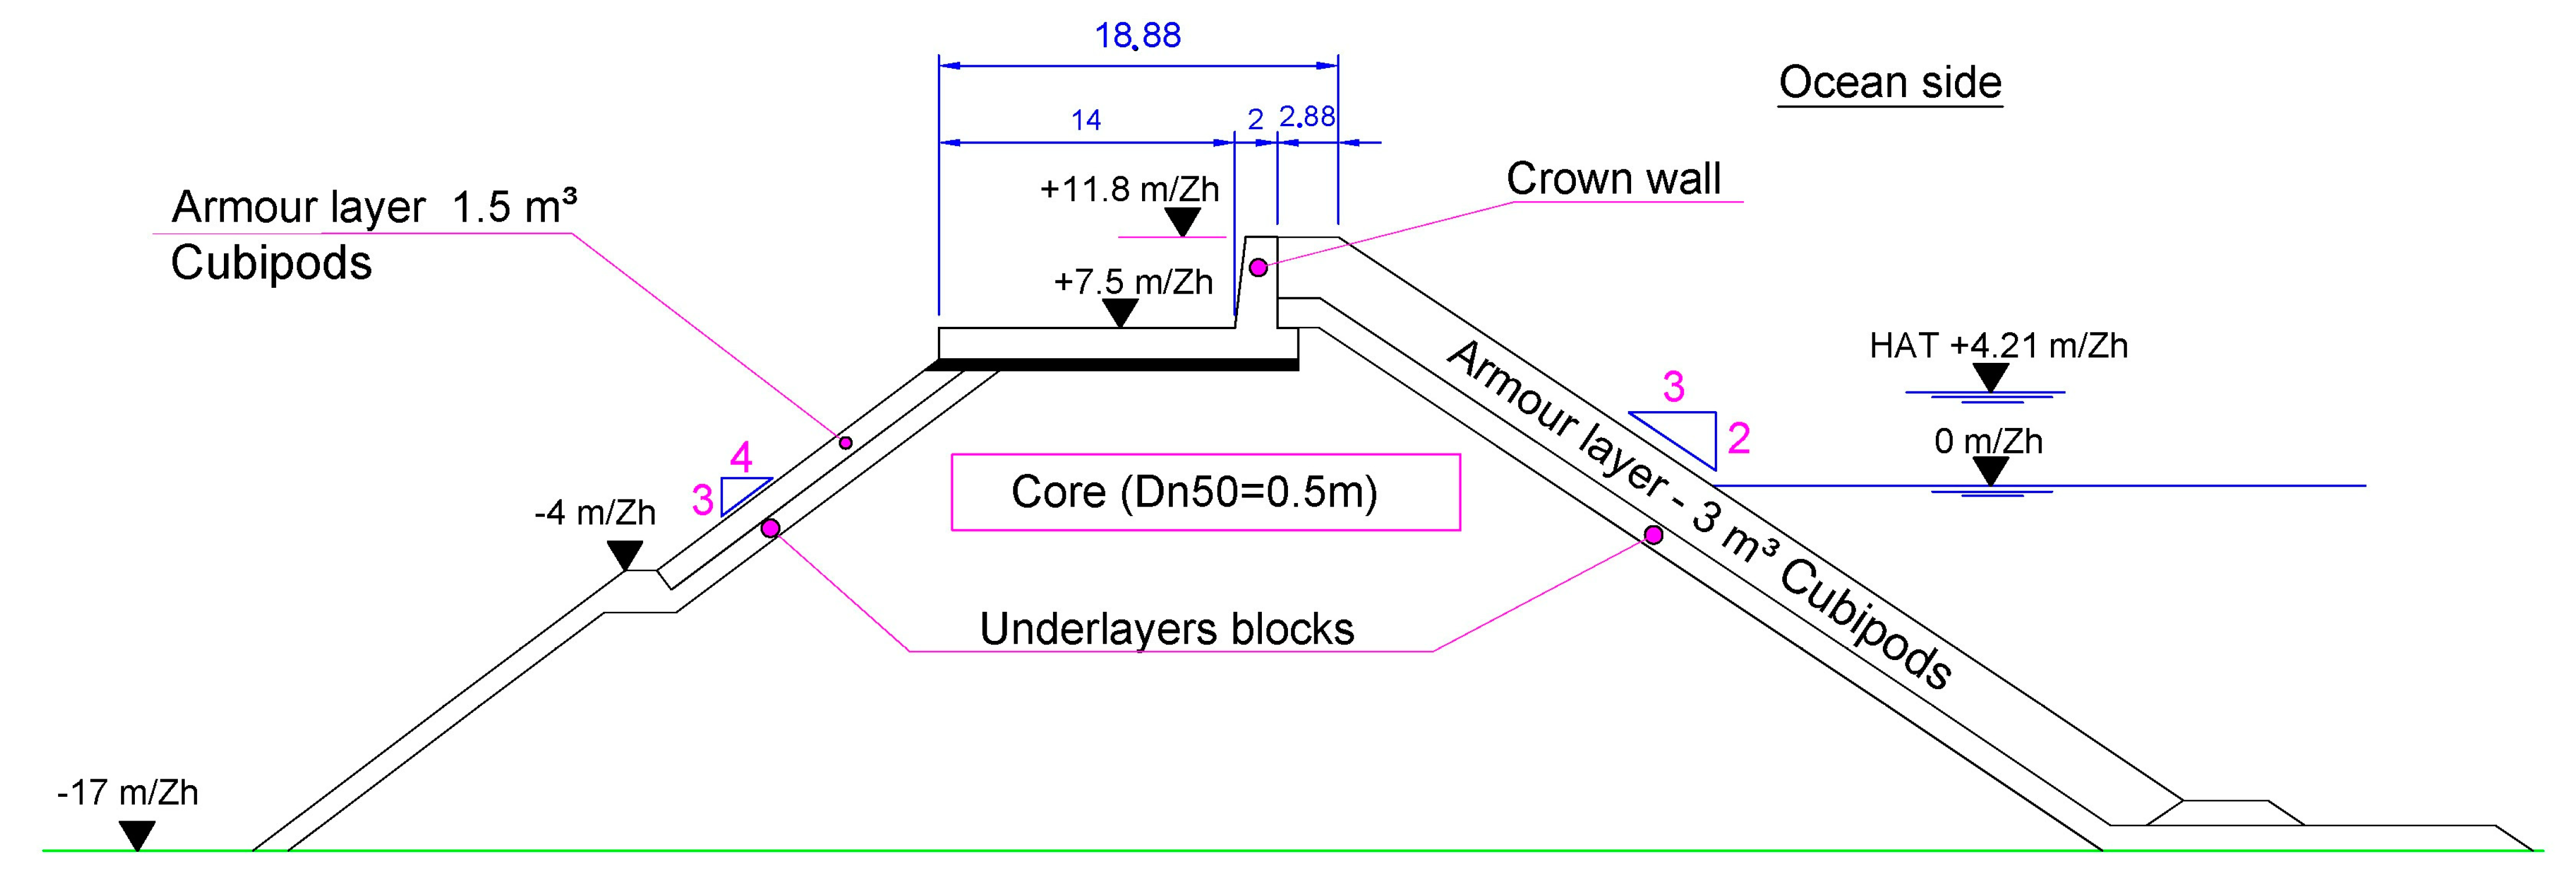
2.1. Model Set-up
2.2. Wave Spectrum
- α: Phillips constant
- fp is the frequency which corresponds to the peak value of the spectral density function
- σ = (σa if f ≤ fp; σb if f ≥ fp)
- γ varies from 1 to 7
- H1/3: Significant wave height
- T1/3: Significant wave period
- Tp: Peak period.
2.3. Wave Conditions
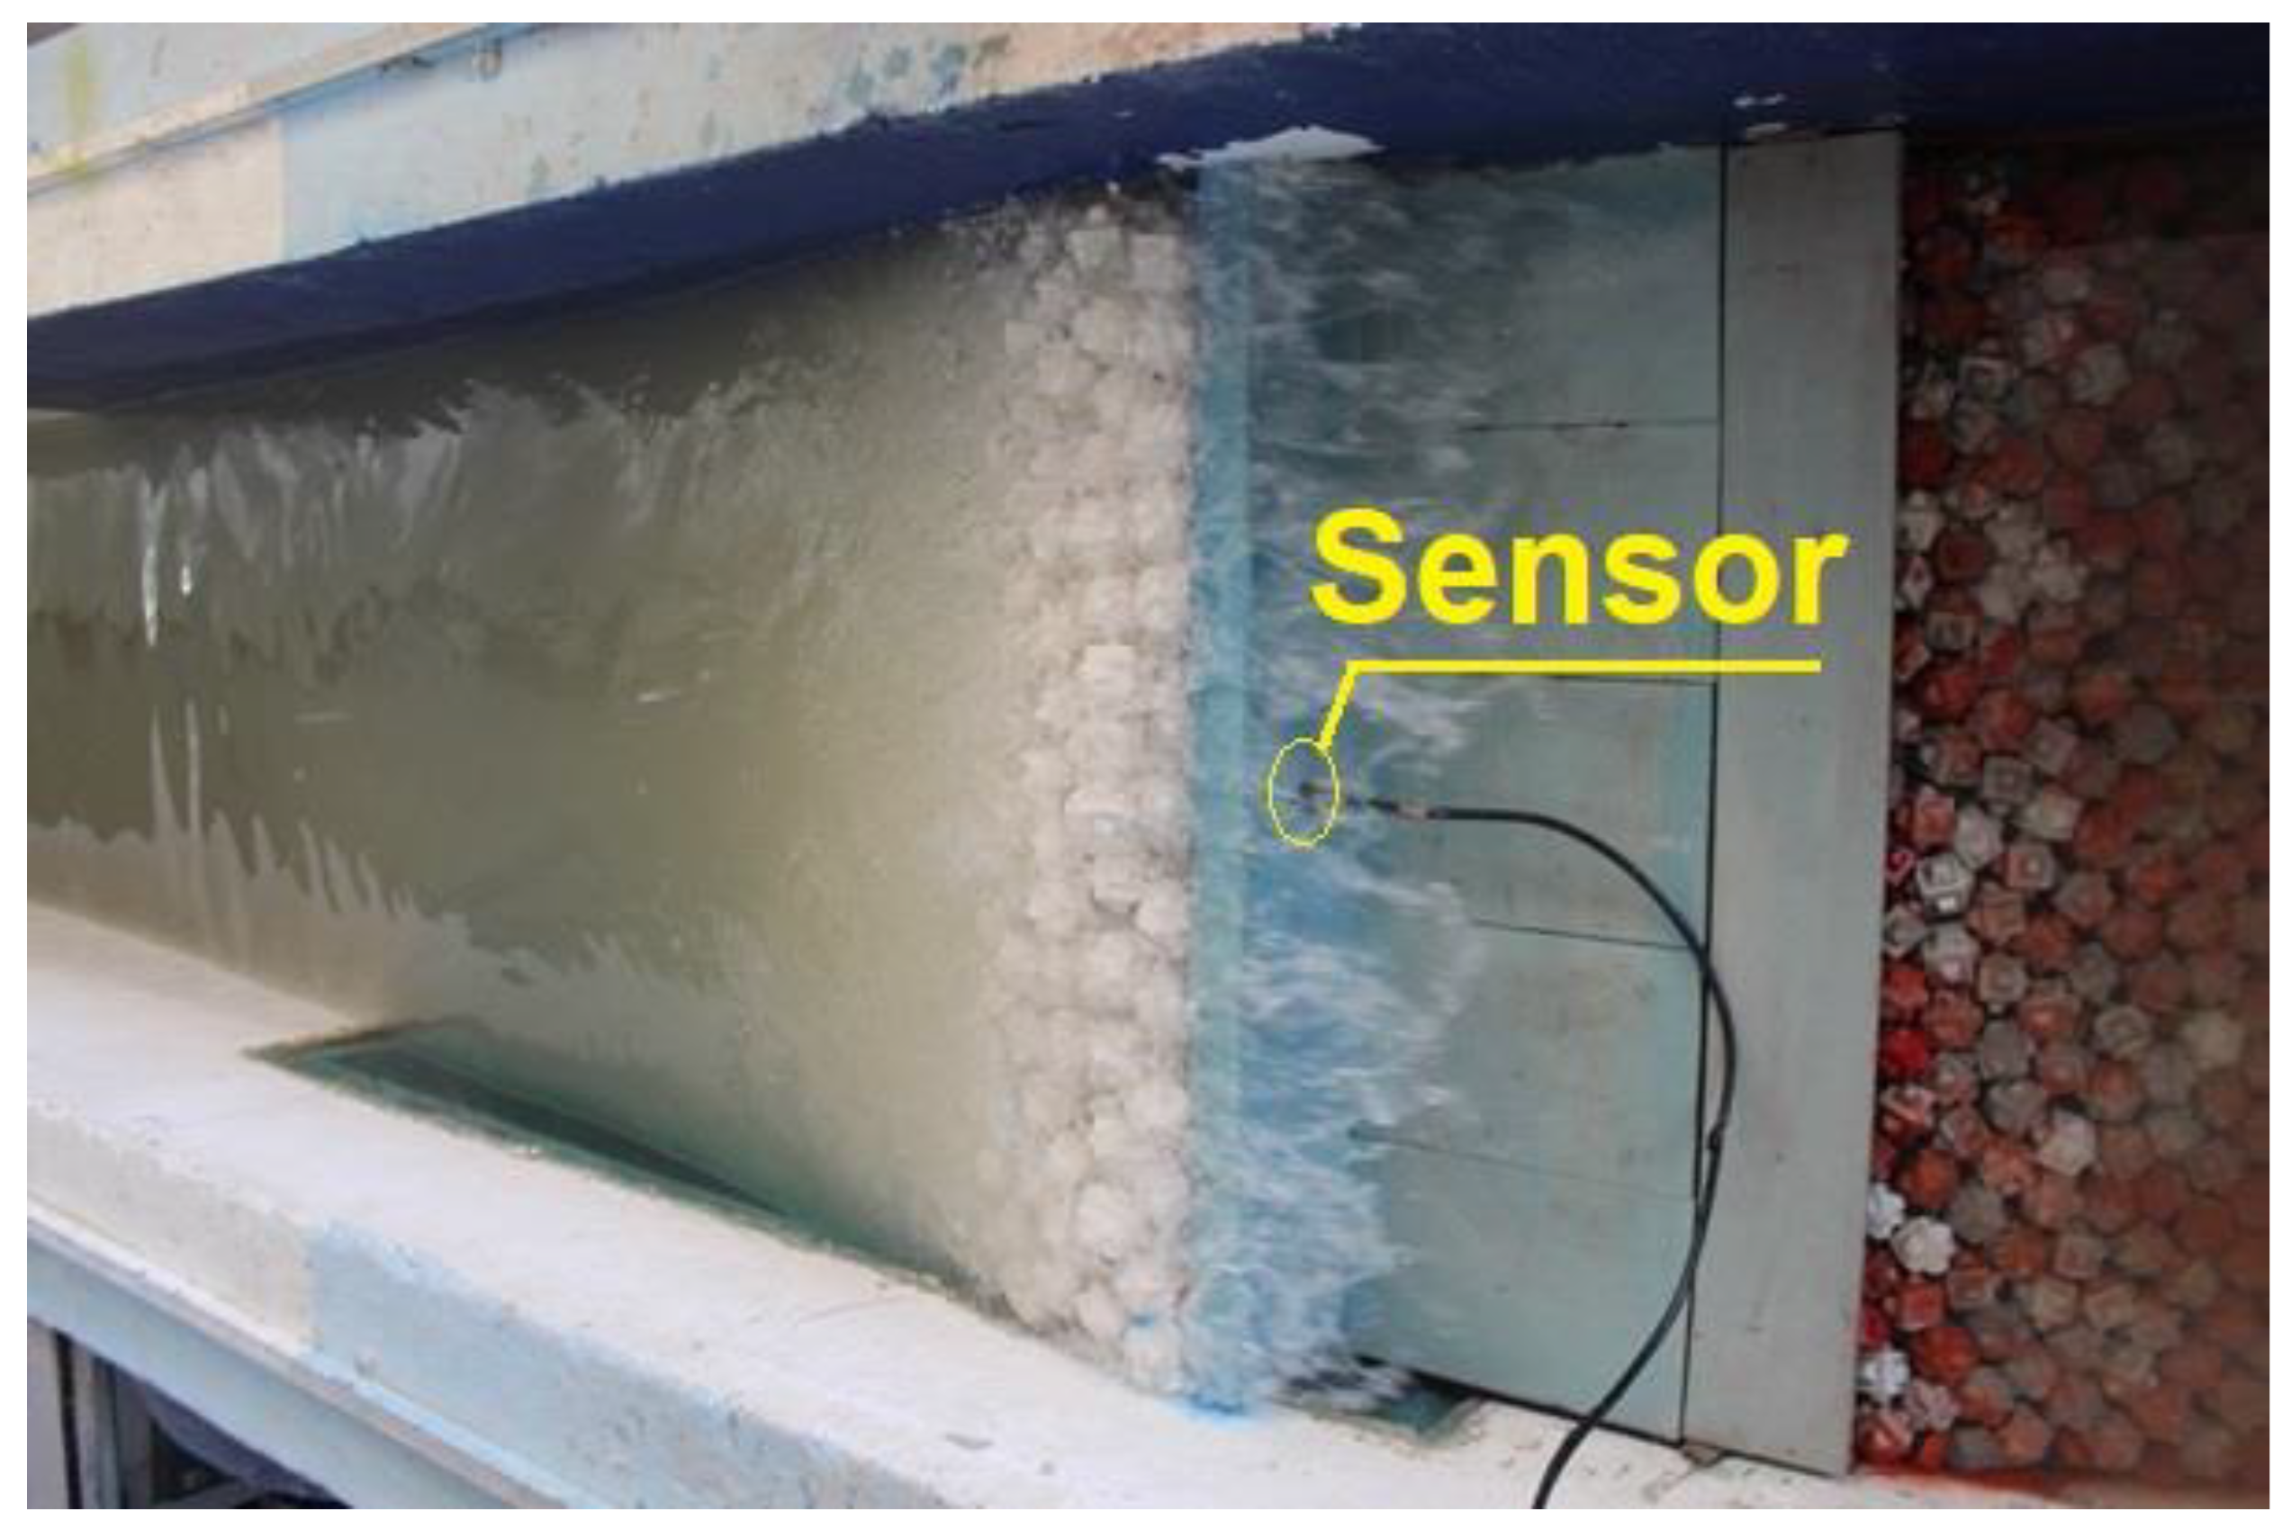
2.4. Measurements of Damage, Pressure on the Crown Wall and Overtopping
- Beginning of damage: Corresponds to the displacements of the armour blocks over a distance greater than or equal to D50 (mean diameter of armour blocks);
- Irribaren damage: Holes created in the armour surface cause the exposure of the sub-layer;
- Beginning of destruction: Corresponds to the beginning of damage to the sub-layer;
- Destruction: the sub-layer is exposed to the effect of incident waves.
- V: Total of the overtopping volume measured at the end of the test
- B: Width of the receptacle
- T: Test duration.
3. Results
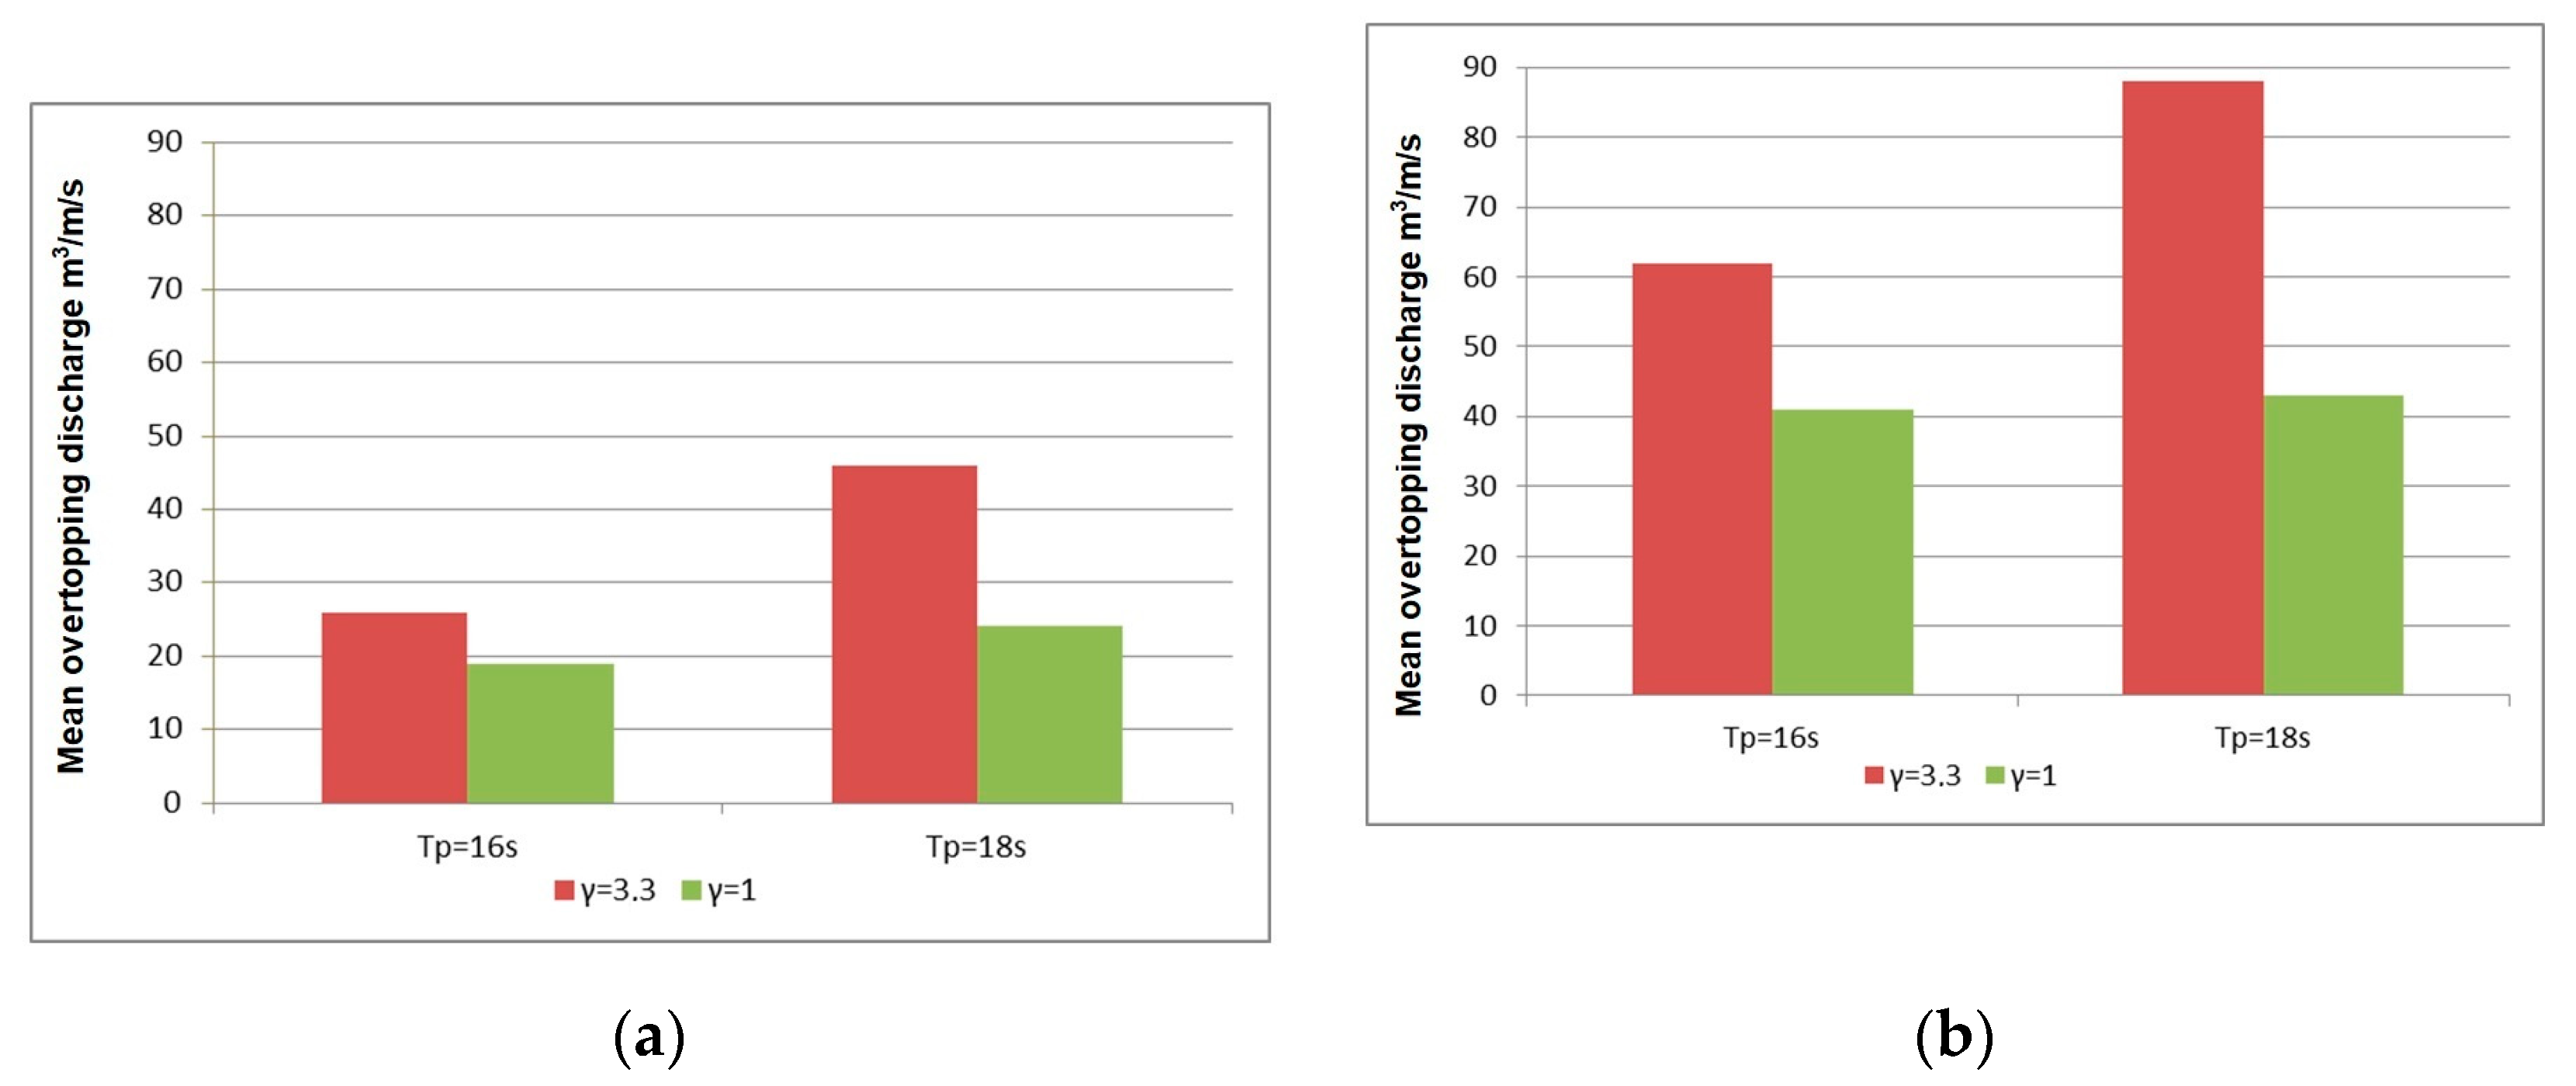
3.1. Overtopping
- The measured average overtopping rate (q) for a spectrum with γ = 3.3 is 35% to 100% greater than with the spectrum with γ = 1.
- For a wave spectrum generated with γ = 1, the measured average overtopping has almost the same value for the two peak periods Tp = 16 s and Tp = 18 s.
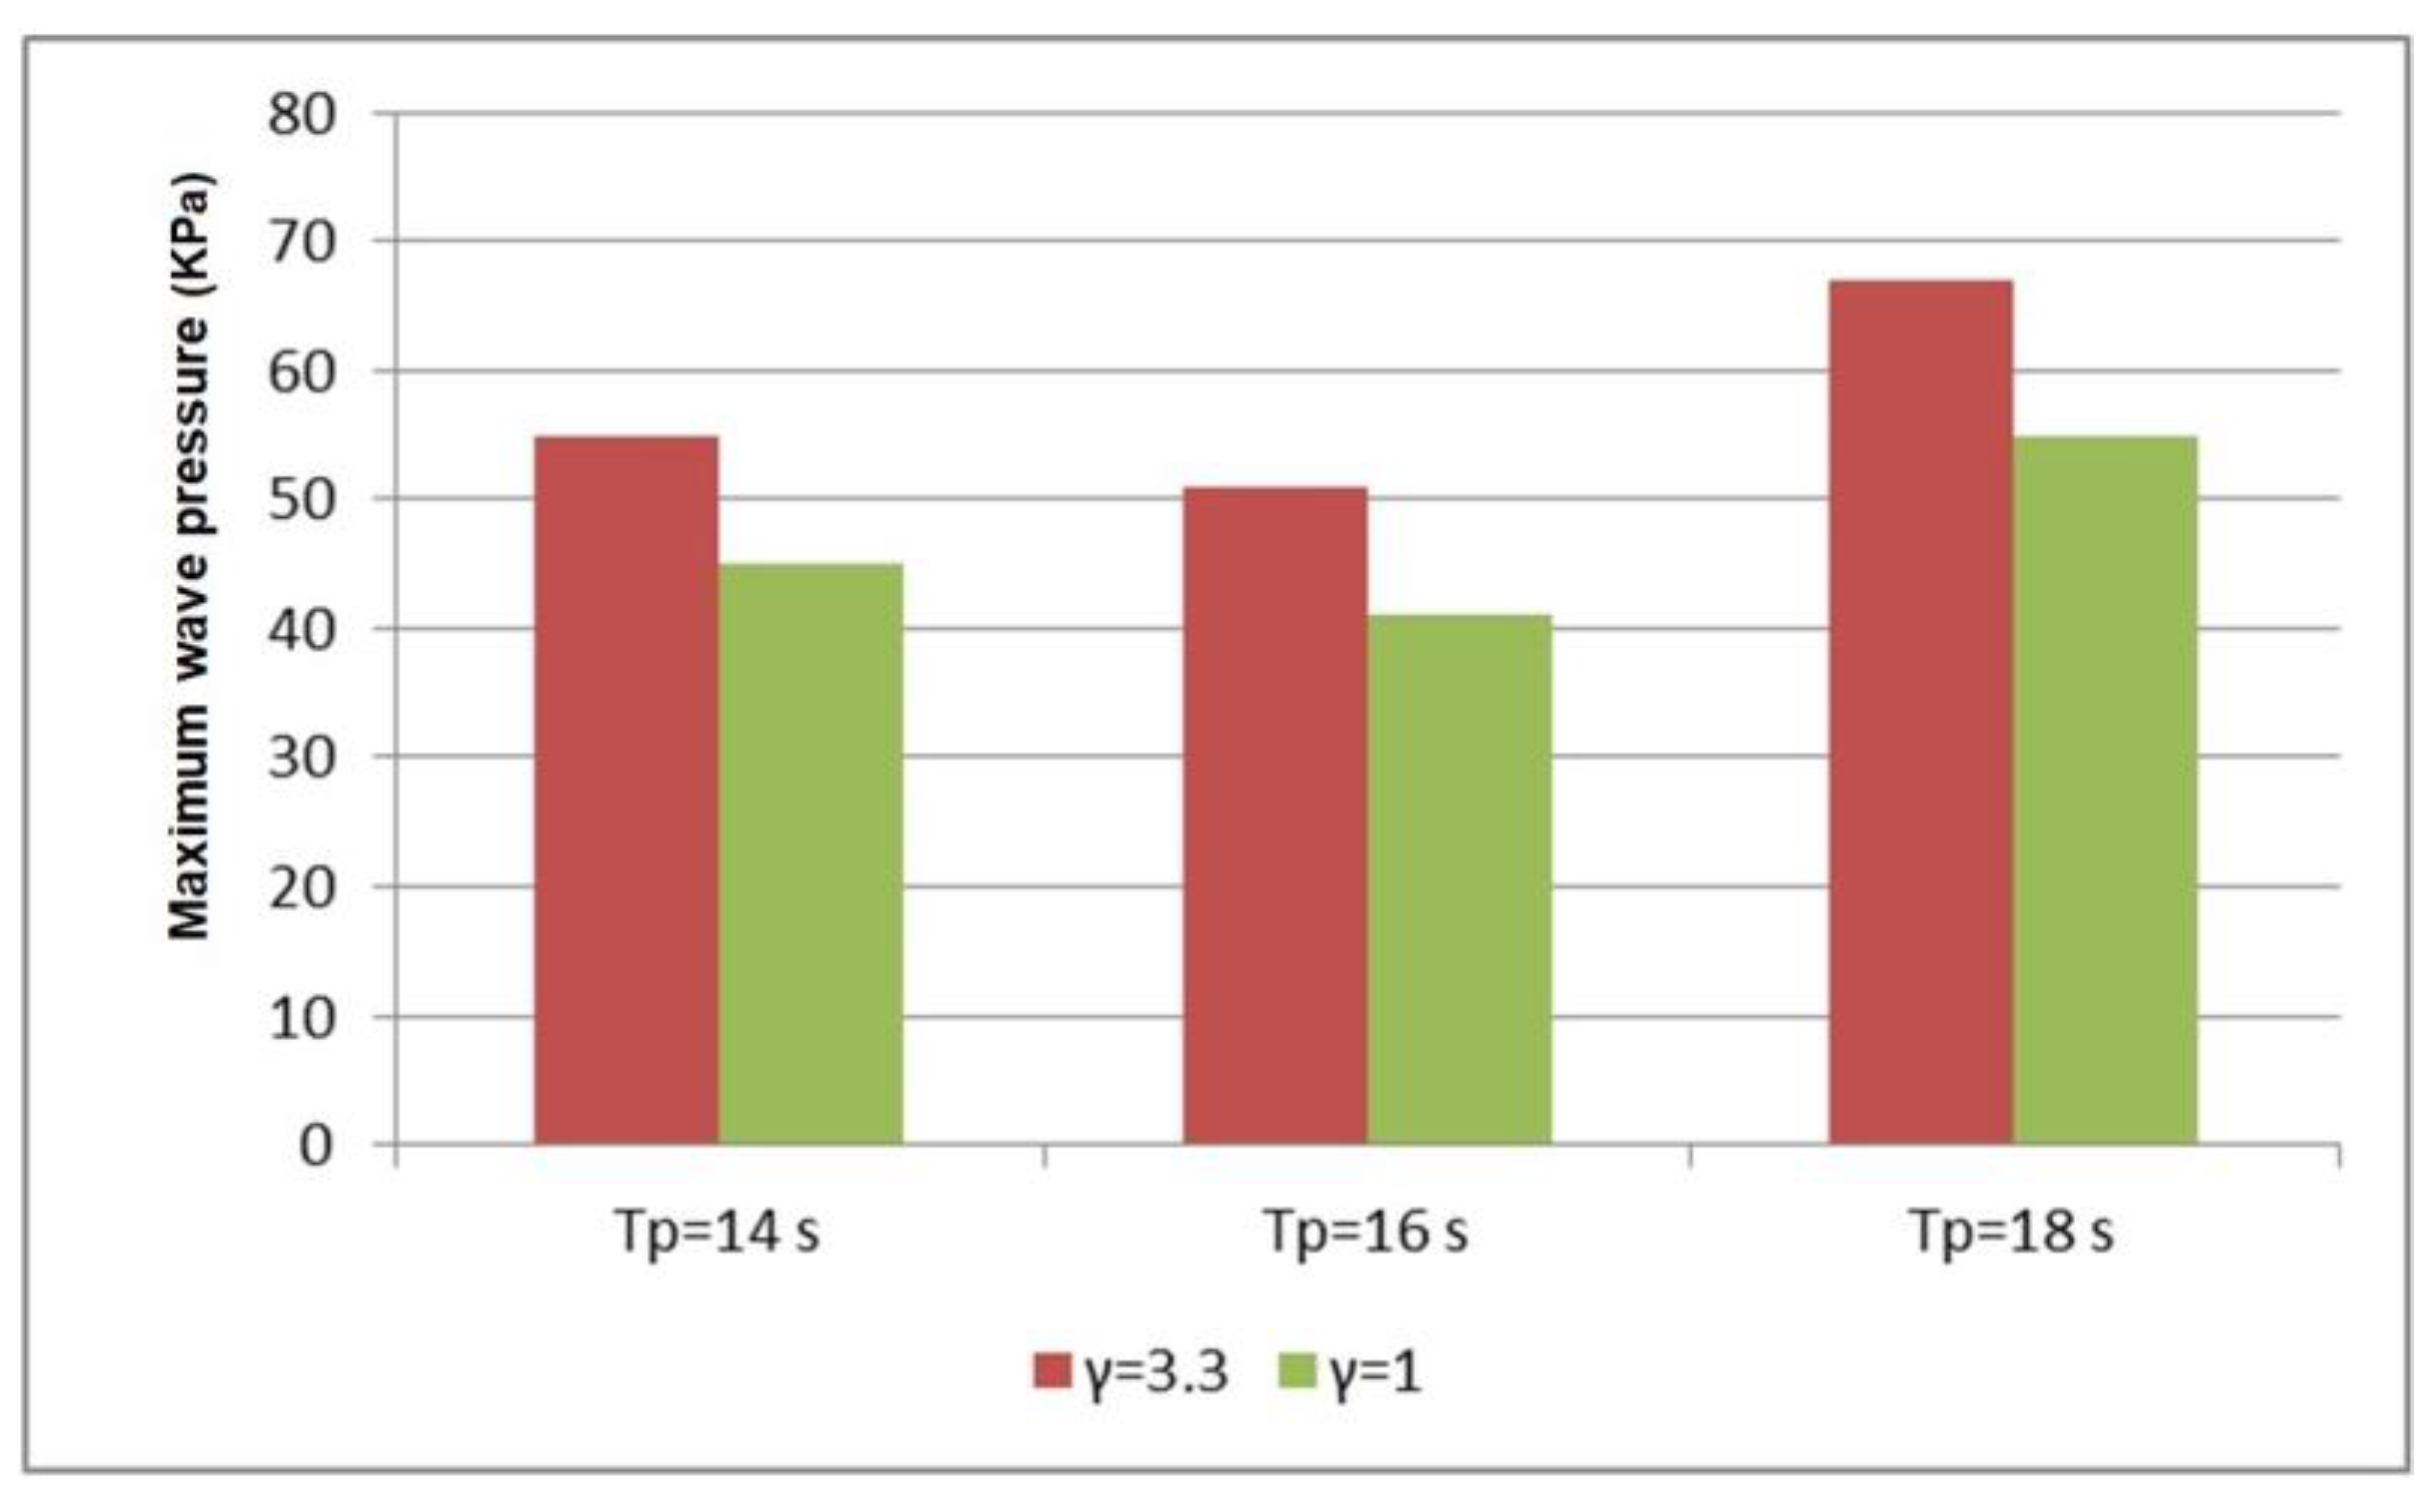
3.2. Water Pressure on the Crown Wall
- For a given value of the peak period (Tp), the measured maximum pressure for a spectrum with γ = 3.3 is 20% higher than the spectrum with γ = 1.
- For a given value of the PEF, the maximum peak period generated the higher value of maximum wave pressure.
3.3. Armour Block Stability
- For the first tests established for waves with Hs varying from 4 to 5 m, the variation of the PEF parameter has no consequence on armour stability. This is mainly due to the fact that the structural response is below the threshold of the damage beginning level;
- For the rest of the tests where we approached the destabilization limits (Hs varying from 5 to 6 m), we noted that the influence of the PEF becomes more meaningful for higher peak periods.
4. Discussion
5. Conclusions
- The PEF variation has a significant effect on the pressure exerted on vertical structures and on mean overtopping flow;
- The stability of the armour layers is not sensitive to the variation of the PEF for intermediate wave periods (12 to 14 s). This observation is consistent with the results of armour stability tests conducted by Van der Meer and Pilarczyk [36] for narrow and wide wave spectra. However, for longer waves, higher values of the PEF lead to more severe damage levels. The influence of the PEF on armour layer response is therefore highlighted for long period ocean waves.
Author Contributions
Funding
Institutional Review Board Statement
Informed Consent Statement
Data Availability Statement
Acknowledgments
Conflicts of Interest
References
- Mares-Nasarre, P.; Molines, J.; Gómez-Martín, M.E.; Medina, J.R. Individual wave overtopping volumes on mound breakwaters in breaking wave conditions and gentle sea bottoms. Coast. Eng. 2020, 159, 103703. [Google Scholar] [CrossRef]
- van Gent, M.R.; Wolters, G.; Capel, A. Wave overtopping discharges at rubble mound breakwaters including effects of a crest wall and a berm. Coast. Eng. 2022, 176. [Google Scholar] [CrossRef]
- Takahashi, S. Design of Vertical Breakwaters; Version 2.1; Port and Airport Research Institute: Kanagawa, Japan, 2002; (revised July 2002).
- Burcharth, H.F.; Andersen, T.L.; Lara, J.L. Upgrade of coastal defence structures against increased loadings caused by climate change: A first methodological approach. Coast. Eng. 2014, 87, 112–121. [Google Scholar] [CrossRef]
- CIRIA; CETMEF. L’utilisation des Enrochements Pour les Ouvrages Hydrauliques-Version Française, 2nd ed.; CETMEF: Compiègne, France, 2009. [Google Scholar]
- Nielsen, S.R.K.; Burcharth, H.F. Stochastic design of rubble mound breakwaters. In System Modelling and Optimization; Springer: Berlin/Heidelberg, Germany, 1984; pp. 534–544. [Google Scholar] [CrossRef]
- Campos, Á.; Molina-Sanchez, R.; Castillo, C.; Molina-Sanchez, R. Damage in rubble mound breakwaters. Part I: Historical review of damage models. J. Mar. Sci. Eng. 2020, 8, 317. [Google Scholar] [CrossRef]
- Van der Meer, J.W.; Allsop, N.W.H.; Bruce, T.; De Rouck, J.; Kortenhaus, A.; Pullen, T.; Zanuttigh, B. Manual on Wave Overtopping of Sea Defences and Related Structures; Van der Meer Consulting: Delft, the Netherlands, 2018. Available online: http://www.overtopping-manual.com/ (accessed on 4 May 2021).
- Pepi, Y.; Romano, A.; Franco, L. Wave overtopping at rubble mound breakwaters: A new method to estimate roughness factor for rock armours under non-breaking waves. Coast. Eng. 2022, 178. [Google Scholar] [CrossRef]
- DHI. Spectral Waves FM Module-User Manual, 10th ed.; Danish Hydrological Danish Institute: Hørsholm, Denmark, 2012. Available online: www.mikepoweredbydhi.com/products/mike-21/waves (accessed on 30 June 2021).
- Goda, Y. Random Seas and Design of Maritime Structures, 2nd ed.; World Scientific Pub Co Pte Ltd.: Singapore, 2000; Volume 15. [Google Scholar] [CrossRef]
- Ewans, K.; McConochie, J. Optimal methods for estimating the Jonswap spectrum peak enhancement factor from measured and hindcast data. In Proceedings of the Offshore and Arctic Engineering-OMAE2019, Glasgow, UK, 9–14 June 2019. [Google Scholar] [CrossRef]
- Pierson, W.J., Jr.; Moskowitz, L. A proposed spectral form for fully developed wind seas based on the similarity theory of S. A. Kitaigorodskii. J. Geophys. Res. Space Phys. 1964, 69, 5181–5190. [Google Scholar] [CrossRef]
- Chakrabarti, S.K. Hydrodynamics of Offshore Structures, 5th ed.; Computational Mechanics Publications: Boston, MA, USA, 2001. [Google Scholar]
- Hasselmann, K.; Barnett, T.P.; Bouws, E.; Carlson, H.; Cartwright, D.E.; Enke, K.; Ewing, J.A.; Gienapp, A.; Hasselmann, D.E.; Kruseman, P.; et al. Measurements of Wind-Wave Growth and Swell Decay during the Joint Sea Wave Project (JONSWAP); Deutsches Hydrographisches Institute: Hamburg, Germany. Available online: https://hdl.handle.net/21.11116/0000-0007-DD3C-E. (accessed on 21 August 2021).
- Gao, J.; Ma, X.; Zang, J.; Dong, G.; Ma, X.; Zhu, Y.; Zhou, L. Numerical investigation of harbor oscillations induced by focused transient wave groups. Coast. Eng. 2020, 158, 103670. [Google Scholar] [CrossRef]
- Gao, J.; Ma, X.; Dong, G.; Chen, H.; Liu, Q.; Zang, J. Investigation on the effects of Bragg reflection on harbor oscillations. Coast. Eng. 2021, 170, 103977. [Google Scholar] [CrossRef]
- Zhang, Q.; Zhai, H.; Wang, P.; Wang, S.; Duan, L.; Chen, L.; Liu, Y.; Jeng, D.-S. Experimental study on irregular wave-induced pore-water pressures in a porous seabed around a mono-pile. Appl. Ocean Res. 2020, 95, 102041. [Google Scholar] [CrossRef]
- Palemón-Arcos, L.; Torres-Freyermuth, A.; Pedrozo-Acuña, A.; Salles, P. On the role of uncertainty for the study of wave–structure interaction. Coast. Eng. 2015, 106, 32–41. [Google Scholar] [CrossRef]
- Van Der Meer, J.W.; Tönjes, P.; De Waal, J.P. A Code for Dike Height Design and Examination. In Proceedings of the Coastlines, Structures and Breakwaters Conference, London, UK, 19–20 March 1998; pp. 5–19. [Google Scholar] [CrossRef]
- Schüttrumpf, H.; Möller, J.; Oumeraci, H.; Grüne, J.; Weissmann, R. Effects of Natural Sea States on Wave Overtopping of Seadikes. In Proceedings of the Fourth International Symposium on Ocean Wave Measurement and Analysis, San Francisco, CA, USA, 2–6 September 2001. [Google Scholar] [CrossRef]
- TAW. Technisch Repport Golfoploop En Golfoverslag Bij Dijken/Wave Run-Up and Wave; Technical Advisory Committee on Flood Defence: Delft, The Netherland, 2002. [Google Scholar]
- Mansard, E.P.; Funke, E.R. The measurement of incident and reflected spectra using a least squares method. In Proceedings of the 17th Coastal Engineering Conference, Sydney, Australia, 23–28 March 1980. [Google Scholar] [CrossRef] [Green Version]
- Corredor, A.; Santos, M.; Peña, E.; Maciñeira, E.; Gómez-Martín, M.E.; Medina, J.R. Designing and Constructing Cubipod Armored Breakwaters in the Ports of Malaga and Punta Langosteira (Spain). In From Sea to Shore-Meeting the Challenges of the Sea; ICE Publishing: London, UK, 2014; pp. 518–527. [Google Scholar] [CrossRef]
- Frostick, L.E.; McLelland, S.J.; Mercer, T.G. Users Guide to Physical Modelling and Experimentation: Experience of The HYDRALAB Network; CRC Press: Dundee, UK, 2011. [Google Scholar]
- Phillips, O.M. On the dynamics of unsteady gravity waves of finite amplitude-Part The elementary interactions. J. Fluid Mech. 1960, 9, 193–217. [Google Scholar] [CrossRef]
- Inman, D.; Munk, W.; Balay, M. Spectra of low frequency ocean waves along the Argentine shelf. Deep Sea Res. 1953, 8, 155–164. [Google Scholar] [CrossRef]
- Mazzaretto, O.M.; Menéndez, M.; Lobeto, H. A global evaluation of the JONSWAP spectra suitability on coastal areas. Ocean Eng. 2022, 266. [Google Scholar] [CrossRef]
- Kirkegaard, J.; Wolters, G.; Sutherland, J.; Soulsby, R.; Frostick, L. Users Guide to Physical Modelling and Experimentation; Taylor & Francis Group: Dundee, UK, 2011. [Google Scholar]
- Losada, M.A.; Desire, J.M.; Alejo, L.M. Stability of blocks as breakwater stability of blocks as breakwater. J. Struct. Eng. 1986, 112, 2392–2401. [Google Scholar] [CrossRef]
- Vidal, C.; Losada, M.A.; Medina, R. Stability of mound breakwater’s head and trunk. J. Waterw. Port Coast. Ocean Eng. 1991, 117, 570–587. [Google Scholar] [CrossRef]
- Putz, R.R. Statistical distributions for ocean waves. Trans. Am. Geophys. Union 1952, 33, 685–692. [Google Scholar] [CrossRef]
- Goda, Y. Statistical Variability of Sea State Parameters as a Function of Wave Spectrum. Coast. Eng. Jpn. 1988, 31, 39–52. [Google Scholar] [CrossRef]
- Via-Estrem, L.; Bunn, N.; Abernethy, R. Wave Spectra Revisited–New guidelines based on observations. In Proceedings of the Coasts, Marine Structures and Breakwaters, 5–7 September 2017; pp. 1177–1188. Available online: https://www.icevirtuallibrary.com/doi/abs/10.1680/cmsb.63174.1177 (accessed on 5 December 2022). [CrossRef]
- USAERDC. US Army Engineer Research and Development Centre. Coastal Engineering Manual, Part VI: Design of Coastal Project Elements (EM 1110-2-1100); USACE Publications: Washington, DC, USA, 2002. [Google Scholar]
- Van der Meer, J.W.; Pilarczyk, K.W. Stability of Rubble Mound Slopes Under Random Wave Attack. In Proceedings of the 19th International Conference on Coastal Engineering, Houston, TX, USA, 3–7 September 1984. [Google Scholar] [CrossRef]


| Notation | Unit | Scaling Factor |
|---|---|---|
| Length, width, wave height | m | N |
| Surface | m2 | N2 |
| Volume | m3 | N3 |
| Time | s | N1/2 |
| Velocity | m/s | N1/2 |
| Mass | kg | N3 |
| Density | kg/m3 | 1 |
| Test Reference | Density (kg/m3) | Full-Scale Median Weight (kg) | Modelled Median Weight (kg) |
|---|---|---|---|
| Front armour layer | 2.4 | 7200 | 0.267 |
| Rear armour layer | 2.4 | 3600 | 0.133 |
| Underlayer in front side | 2.6 | 600 | 0.022 |
| Underlayer in rear side | 2.6 | 350 | 0.013 |
| Core | 2.6 | 500 | 0.018 |
| Test Reference | Return Period | Tp (s) | PEF | Hs |
|---|---|---|---|---|
| DAK21135 | 200 years | 14 | 1 | 6 m |
| DAK21136 | 200 years | 14 | 3.3 | 6 m |
| DAK21137 | 100 years | 16 | 3.3 | 5.5 m |
| DAK21139 | 100 years | 16 | 1 | 5.5 m |
| DAK21138 | 100 years | 18 | 3.3 | 5.5 m |
| DAK21146 | 100 years | 18 | 1 | 5.5 m |
| DAK21154 | 200 years | 16 | 3.3 | 6 m |
| DAK21155 | 200 years | 16 | 1 | 6 m |
| DAK21156 | 200 years | 18 | 3.3 | 6 m |
| DAK21157 | 200 years | 18 | 1 | 6 m |
| Test | Return Period | Tp [s] | γ | Hs | Q (L/s/m) |
|---|---|---|---|---|---|
| DAK21137 | 100 years | 16 | 3.3 | 5.5 | 26 |
| DAK21139 | 100 years | 16 | 1 | 5.5 | 19 |
| DAK21138 | 100 years | 18 | 3.3 | 5.5 | 46 |
| DAK21146 | 100 years | 18 | 1 | 5.5 | 24 |
| DAK21154 | 200 years | 16 | 3.3 | 6 | 62 |
| DAK21155 | 200 years | 16 | 1 | 6 | 41 |
| DAK21156 | 200 years | 18 | 3.3 | 6 | 88 |
| DAK21157 | 200 years | 18 | 1 | 6 | 43 |
| Water Level [m/Zh] | Hs (In −25 m/Zh) | Tp (In −25 m/Zh) | Observations for γ = 3.3 | Observations for γ =1 |
|---|---|---|---|---|
| +4.21 | 4 m | 12 s | No damage | No damage |
| +3.61 | 4.4 m | 14 s | No damage | No damage |
| +4.21 | 5 m | 12 s | No damage | No damage |
| +4.21 | 5 m | 18 s | No damage | No damage |
| +3.61 | 5 m | 18 s | No damage | No damage |
| +4.21 | 5.5 m | 14 s | Oscillation of 2 blocks | Oscillation of 1 block |
| +4.21 | 5.5 m | 18 s | Oscillation of 2 blocks | Oscillation of 2 blocks |
| + 3.61 | 5.5 m | 18 s | Oscillation of 2 blocks | Oscillation of 2 blocks |
| + 4.21 | 6 m | 18 s | Extraction of 3 blocks | Oscillation of 3 blocks |
| + 3.61 | 6 m | 18 s | Extraction of 3 blocks | Oscillation of 4 blocks |
| + 4.21 | 6.6 m | 18 s | Extraction of 3 blocks | Oscillation of 4 blocks |
| γ =1 | γ =3.3 | Rayleigh Distribution | |
|---|---|---|---|
| H1/10/Hs | 1.248 | 1.253 | 1.271 |
| Hmean/Hs | 0.639 | 0.636 | 0.626 |
Publisher’s Note: MDPI stays neutral with regard to jurisdictional claims in published maps and institutional affiliations. |
© 2022 by the authors. Licensee MDPI, Basel, Switzerland. This article is an open access article distributed under the terms and conditions of the Creative Commons Attribution (CC BY) license (https://creativecommons.org/licenses/by/4.0/).
Share and Cite
Bakali, H.; Aouiche, I.; Serhir, N.; Zahir, Y.; Ziane, E.h.; Harti, A.; Zerhouni, Z.; Anthony, E. Laboratory Experiments on the Influence of the Wave Spectrum Enhancement Factor on a Rubble Mound Breakwater. J. Mar. Sci. Eng. 2022, 10, 2035. https://doi.org/10.3390/jmse10122035
Bakali H, Aouiche I, Serhir N, Zahir Y, Ziane Eh, Harti A, Zerhouni Z, Anthony E. Laboratory Experiments on the Influence of the Wave Spectrum Enhancement Factor on a Rubble Mound Breakwater. Journal of Marine Science and Engineering. 2022; 10(12):2035. https://doi.org/10.3390/jmse10122035
Chicago/Turabian StyleBakali, Hosny, Ismail Aouiche, Najat Serhir, Youssef Zahir, El hassan Ziane, Abderrazak Harti, Zakariae Zerhouni, and Edward Anthony. 2022. "Laboratory Experiments on the Influence of the Wave Spectrum Enhancement Factor on a Rubble Mound Breakwater" Journal of Marine Science and Engineering 10, no. 12: 2035. https://doi.org/10.3390/jmse10122035