Article

Fleet Deployment Optimization for LNG Shipping Vessels Considering the Influence of Mixed Factors

1
School of Traffic and Transportation, Beijing Jiaotong University, Beijing 100044, China
2
Ocean College, Zhejiang University, Zhoushan 316021, China
3
The Logistics Institute Asia Pacific, National University of Singapore, Singapore 119077, Singapore
4
College of Transport & Communications, Shanghai Maritime University, Shanghai 201306, China
*
Author to whom correspondence should be addressed.
J. Mar. Sci. Eng. 2022, 10(12), 2034; https://doi.org/10.3390/jmse10122034
Submission received: 7 November 2022 / Revised: 18 November 2022 / Accepted: 23 November 2022 / Published: 19 December 2022

Abstract

:
Driven by China’s booming natural gas consumption market, LNG (Liquified Natural Gas) shipping import has grown rapidly. To facilitate scientific and efficient decision making on LNG shipping fleet deployment and the development of the LNG shipping industry, this article proposes an optimization model to minimize annual fleet operating costs, including voyage cost, running cost, and capital cost. Under the consideration of the mixed factors of self-owned and time charter vessels, epidemic prevention and control, port congestion, transportation time cost, and evaporation loss, as well as navigation security and emergency situations, the validity and optimality of the model are demonstrated by the empirical example and the cost comparison between the conventional and optimized solution. The results show that this optimization model can reduce the total cost by 9.87%. Then, through sensitivity analysis, various significant factors affecting the operating costs of LNG shipping enterprises and their degrees of influence are determined. Based on the analysis of the relevant causes, some actionable countermeasures are recommended, including establishing a shipping price reciprocity mechanism and full chain investment planning, optimizing the inbound link to reduce invalid berthing time, strengthening the construction competitiveness and economy of scale of larger LNG ships, and building a combined dual resource pool transportation mode. This paper contributes to improving transregional maritime energy transport and management capacity, while further enhancing the energy security and development of port cities and their economic hinterlands.

1. Introduction

In 2022, the Ukrainian war and the explosion of the Nord Stream gas pipelines worsened the energy dilemma of European countries and even the world, also showing that a single energy supply channel, especially the restriction of land energy transport channels, would pose a potential threat to the energy security of a country or region. Therefore, the importance of building a marine energy transport corridor is self-evident; especially in the context of global warming and carbon emission reduction, it is of practical significance to study the LNG marine transport system. As an environmentally friendly and clean energy [1], natural gas is an important support for ensuring national energy security, especially in this era of advocacy for environmental protection. Although pipeline transportation is the most economical and reliable way to transport large volumes of gas, LNG ocean shipping offers more flexibility between regions and the sea [2]. For short distance transportation, natural gas pipelines are usually more economical, while for long distance routes, especially those crossing long distance waters or oceans, it is more cost-effective to transport natural gas in the form of liquefied natural gas, because it is very expensive and technically challenging to build pipelines on the seabed [2]. By using an LNG carrier, a special kind of high-tech tanker designed to contain the cargo slightly above atmospheric pressure at a cryogenic temperature of approximately −169 °C [3], natural gas can be transported from overseas gas fields to consumer markets that cannot be reached by pipelines, such as Japan, South Korea, China, and the European Union. According to data from the BP World Energy Statistics Yearbook 2021 (https://www.bp.com.cn/zh_cn/china/home/news/reports.html accessed on 8 July 2021), China’s natural gas consumption reached 330.6 billion cubic meters in 2020, with an average annual increase of 13.1% in the past decade. LNG (Liquified Natural Gas), which is transported by sea, accounts for more than half of China’s total natural gas imports, with Australia, Qatar, Malaysia, and Indonesia being the main sources of LNG imports.
However, LNG shipping–being risky and exclusive–has high investment and transportation time costs, and its investment cost includes the voyage cost, the running cost, and the capital cost. Similar to liner shipping, LNG shipping has fixed ports, fixed routes, fixed shipping schedules and voyage plans, and a long-term COA (Contract of Affreightment) freight rate as well. Due to the variety of ship registries, ship age, self-owned ships, and time charter ships, its fleet structure is complex. Apart from the above characteristics, this highly monopolistic market of special energy transportation is closely related to the economy and national livelihood. A series of systematic and complex decision-making problems require the consideration of multiple factors–namely, how to rationally deploy different types of LNG ships in the fleet to appropriate routes and transportation projects in order to meet the freight demand while minimizing the total annual cost of fleet operation.
Based on carbon neutralization, rampant epidemic, port congestion, and the continuous expansion of the LNG fleet scale, this paper is committed to improving the efficiency and scientificity of decision-making and deployment of LNG shipping fleet and exploring methods and countermeasures conducive to promoting the efficiency, stability, and sustainability of the LNG maritime transport system. The optimization model we developed and the four policy recommendations we put forward are of reference significance for improving the profitability and management capacity of LNG shipping enterprises, as well as for promoting the prosperity of transregional marine energy transport and further strengthening the energy security and development of port cities and their economic hinterland.
The remainder of this paper is organized as follows. Section 2 reviews current studies on the LNG shipping market, the application of clean energy in the shipping industry, and the deployment of LNG fleets, and introduces the contributions of this paper. Section 3 briefly describes the problem to be solved and presents an optimization model that is verified in Section 4 with a rational and exact case study. Ultimately, Section 5 discusses a few remarkable conclusions and further research directions.

2. Literature Review

LNG shipping is a point-to-point direct transportation mode, the transportation time cost is quite high, the loss of cargo evaporation is tremendous–which makes it highly dangerous and exclusive–and the requirements of voyage planning, ship management, and cargo management and transportation are extremely strict. In the considerable consumer market and transportation demand, it is noticeable that the scale of the LNG fleet is expanding with the number of vessels increasing in recent years, opening up a good opportunity for LNG shipping companies, as shown in Figure 1 (the number of global LNG ships increased from 361 in 2011 to 621 in 2021 according to data from Clarkson Shipping Intelligence Network Timeseries). This also creates a situation and conditions for researchers to engage in the LNG shipping market analysis and fleet transportation planning.
In the study of LNG energy corridors, Yin and Lam [4] applied a system dynamics model to evaluate the coping strategies of LNG terminals and LNG fleets under scenarios of increased natural gas consumption, reduction in domestic production, and decrease in pipeline imports, and provided recommendations for governments, terminal operators and shipping companies. Engelen and Dullaert [5] presented a LNG shipping model that effectively supports decision making in practice and studied the implications of LNG project delays and increased decommissioning of ships with respect to market balance and fleet requirements to demonstrate the value added from the model. After empirical research, Yang et al. [6] found that the technology of LNG is more economic than that of pipeline. Additionally, Huemme et al. [7] demonstrated the 2020 World Gas Model (WGM) by examining two important case studies that currently affect the natural gas market, a critical component of the global energy industry. Liu et al. [8] introduced the research progress on LNG container transportation and believed that the demand for LNG in the future market will increase with each passing day, and multiple inland LNG transport chains will coexist, with LNG tank transportation as the main system, supplemented by small and medium-sized LNG carriers. Based on the current LNG transport network and the global LNG supply and demand pattern, Zeng et al. [9] established a multi-agent game model and proposed that the uncertainty of LNG import risk will have a significant impact on China’s energy security.
In order to comply with the rules of the International Maritime Organization (IMO), LNG is becoming an interesting option for merchant ships [10,11,12,13]. Burel et al. [14] found that the use of LNG is more profitable for tanker ships in the range of 10,000 to 60,000 DWT (deadweight), and for a 33,000 DWT tanker ship, LNG leads to a reduction of 35% of operational costs and 25% of CO2 emissions. Schinas and Butler [15] proposed a methodology to evaluate the commercial incentives required to promote LNG as a marine fuel, which could be used to assess policy initiatives that encourage the use of alternative technologies and estimate their market impact. Raj et al. [3] found that a propulsion system that burns only natural gas as primary fuel is the most economical scenario, while a propulsion system based on pure marine diesel oil is the least economical. At the same time, with increasing concerns about emissions from shipping, fuel cells are also expected to play an important role in ship propulsion. Baldi et al. [16] investigated the energy, cost, and emission savings on ships resulting from the use of solid oxide fuel cells (SOFC), and the results showed that SOFCs could provide a reduction in ship GHG emissions (Greenhouse Gas) emissions by up to 34% and that when using natural gas as fuel, SOFCs were the most cost-optimal solution that allowed a significant reduction in GHG emissions. In the research of Haseltalab et al. [17], novel components sizing and energy and power management approaches were proposed to enable the use of solid oxide fuel cells as the main power on board and were integrated into the LNG-fueled power and propulsion system of vessels. Then, they found that the proposed combined optimization-based approaches could yield a reduction of up to 53% CO2 and a higher fuel utilization efficiency of 21% compared to conventional diesel-electric vessels.
Currently, existing research mainly focuses on single or multi-objective optimization of liner shipping lines and proposes various linear, nonlinear, and integer programming fleet deployment optimization models [18,19,20,21,22,23,24,25,26], and some researchers also took into account carbon or sulfur emission reduction requirements [27,28,29,30,31,32]. However, the analysis of LNG shipping fleet deployment by industry insiders is quite limited [33,34,35,36,37]. Among existing studies, Niu et al. [38] constructed a fleet deployment optimization model for LNG shipping routes with the objective of minimizing the annual operating cost of the LNG fleet. Wang and Notteboom [39] explored the unique characteristics of the international LNG shipping market, especially investigating the structure and distribution of the ship fleet. Bittante et al. [40] developed a mathematical model considering LNG distribution in a heterogeneous fleet of ships to increase interest in small- to medium-scale liquefied natural gas maritime transportation. Koza et al. [41] developed a nonlinear arc-based model and an exact solution method based on a set partitioning formulation to minimize long-term onshore infrastructure and LNG tanker investment costs combined with an interrelated expected cost to operate the LNG tanker fleet.
Unfortunately, the factors considered in the current studies are not comprehensive enough with the assumptions on the ideal side, failing to fully reflect the demand and characteristics of LNG shipping. More specifically, the annual demand for LNG transport is relatively stable and is limited by the transportation contract. At the same time, factors such as COVID-19, port congestion, LNG transport time cost, and evaporation loss were not taken into account. Despite the fact that there are more or less deficiencies and limitations, it is indisputable that all of the above studies provide some theoretical references for the LNG transportation market.
In order to minimize annual operating cost, including voyage cost, running cost, and capital cost of the fleet, this study proposes a hybrid optimization model based on non-linear integer programming, considering the deployment of the LNG shipping fleet under multiple mixed factors, such as self-owned vessels and time charter ships, epidemic prevention, port congestion, transportation time cost, and evaporation loss, as well as navigation security and unexpected conditions. After a round of specific case studies supported by the latest market data from Clarkson, Lloyd’s Register, Shanghai Oil and Gas Trading Center, and CLNG (China Hong kong LNG Shipping (Holdings) Limited), the validity of the model is proved. Meanwhile, a cost comparison is conducted between the traditional and optimized scenario of fleet deployment to prove the optimization and application value of this model. Then, we conduct a sensitivity analysis of the main factors that affect the allocation of the LNG route. Finally, four feasible countermeasures are recommended for LNG shipping participants based on sensitivity analysis. The research ultimately aims to build a safe, stable, and efficient LNG shipping network that will serve the future development of LNG port cities and regions.

3. Methods and Methodology

3.1. Modeling Assumptions

In multi-ship, multi-route LNG voyage planning, the annual operating cost of the LNG fleet is minimized while meeting the annual cargo demand volume. Some assumptions for building the mathematical model are described as follows:
  • The model planning period is one year and the annual operating time of each type of vessel is 345 days, during which the size of the fleet is stable and constant.
  • The fleet has K types of ships operating H routes, the depreciable life of each type of LNG ship is 35 years, and the residual value at maturity is 10% of the vessel price.
  • The fleet operates M ships, of which I ships are self-owned and J ships are on a time charter, with the same operating costs and cargo carrying capacity for the same type of ships.
  • The same type of ship has the same loading and unloading efficiency, with the contract stipulating that the loading and unloading charges are borne by the carrier and that there are the same port charges at both the port of loading and the port of discharge.
  • The carrier signs a COA charter contract with the cargo owner with fixed freight and a determined annual cargo volume, which allows for a certain degree of volume maneuvering margin.
  • The model considers the losses caused by volatilization and the loss of time value of LNG in transit.
  • The model supposes the navigational safety and costs arising from unforeseen conditions, such as bad weather, rescue in distress, reasonable detours, etc.
  • All types of vessels are powered by LNG fuel without the use of fuel oil.
  • The model assumes that the full-service speed when sailing in ballast is already known.

3.2. Mathematical Model and Parameters

Based on the calculation rules for the fleet voyage cost, running cost, and capital cost, as well as the above assumptions, the following objective functions and 21 constraints are proposed, including cargo volume constraints, shipping frequency constraints, time constraints, quantity constraints, and numerical constraints. At the same time, a feedback loop diagram of the dynamics of the system is drawn to show the internal causal relationship between various costs and mixed factors.
Objective function:
M i n C = C v + C o + C c
C represents the objective function, namely, the annual fleet operating cost, which consists of the annual voyage cost C v , the annual running cost C o , and the annual capital cost C c .
Constraints:
C v = P f + P p + P h + P o
The voyage cost C v includes the fuel cost P f , the port charge P p , the stevedoring fee P h and other variable costs P o .
P f = k = 1 K h = 1 H [ ( F k h + G k h v ) T k h v + G k h b T k h b ] p f N k h
Among them, F k h represents the fuel consumption of the main engine during the voyage, G k h v represents the fuel consumption of the auxiliary engine during the voyage and G k h b means the fuel consumption of the auxiliary engine during the berthing. In addition, p f represents the price of LNG fuel, N k h represents the number of annual voyages of each type of vessel on each route.
T k h v = ( 1 + ρ ) D k h 24 V k
T k h b = T k h s + T k h f + T k h o
T k h s = Q k h 12 E k h z x + T y l + T c p
T k h f = α T k h s
T k h o = β ( T k h v + T k h s )
In these four equations, T k h v and T k h b represent the voyage time and berthing time of the type k vessel on the route h , respectively, where the berthing time is made up of productive berthing time T k h s , nonproductive berthing time T k h f , and other reasons berthing time T k h o . ρ represents the surplus factor considering the voyage reserve; D k h is the round trip distance of the type k vessel on the route h ; V k is the full-service speed of the type k vessel after considering the unladen voyage; Q k h means the cargo volume of the type k vessel on the route h ; E k h z x is the efficiency of loading and unloading of the type k vessel on the route h ; T y l indicates the time required to precool the pipelines and loading arms before discharge; T c p represents the time required to purge and discharge the equipment after discharge and disconnect the connections. In addition, α is the nonproductive berthing factor and β is the factor for other reasons for berthing.
P p = 2 k = 1 K h = 1 H p k h N k h
P h = 2 k = 1 K h = 1 H Q k h p k h N k h
P o = k = 1 K h = 1 H [ ( λ k + θ 365 H ) Q k h V L N G ( T k h v + T k h f + T k h o ) + ε P f + ϕ p k s ] N k h
Equation (9), Equation (10), and Equation (11) respectively show the port charge P p , the stevedoring fee P h and other variable cost P o . Among them, p k h represents the port charge for the type of k vessel on route h ; λ k indicates the LNG evaporation rate for each type of vessel; θ indicates the annual cost of ownership factor; H is the total number of routes; V L N G represents the unit cargo value of LNG; ε is the fuel surplus factor considering the safety of navigation and contingency; ϕ is the additional insurance rate for the voyage; p k s is the price of the type k vessel.
C o = I k = 1 K ( p k w + p k i + p k r + p k l + p k s + p k m ) + J k = 1 K 345 R k 30
The running cost C o includes the annual crew fee p k w , the annual Insurance premium p k i , the annual maintenance fee p k r , the annual lubricants fee p k l , the annual subsistence supply fee p k s , the annual shipping management fee p k m , and the annual charter hire for each type of vessel in the time charter vessel. Further, in this equation, I and J represent the number of self-owned ships and time charter ships, respectively, and R k represents the rent of K-type vessels.
C c = I k = 1 K ( p k s 0.1 p k s 25 + 0.09 φ p k s )
The capital cost C o includes annual depreciation and annual interest payable for each type of vessel on the owned vessels.
I h = 365 γ M a x ( M k ) h = 1 H ( 1 α ) Q h
F h = 345 I h
( 1 α ) Q h k = 1 K h = 1 H Q k h N k h ( 1 + α ) Q h , k = 1 , 2 , , K ,   h = 1 , 2 , , H
k = 1 K N k h F h
N k h ( T k h v + T k h b ) = 345 S k h , k = 1 , 2 , , K ,   h = 1 , 2 , , H
h = 1 H S k h = S k , k = 1 , 2 , , K
h = 1 H S h = M , M = I + J , i = 1 , 2 , , I ,   j = 1 , 2 , , J
I h , F h Z +
V k , E k h z x R +
In these equations, I h and F h represent the sailing interval and the minimum annual sailing frequency of the route, respectively; S k h stands for the number of type k vessels assigned to the route h ; S k is the total number of type k vessels, and S h is the total number of vessels of each type on the route h .
It is worth noting that N k h and S k h are decision variables in this model. The objective function (1) and the constraints (2)–(22) together constitute the optimization model of the LNG fleet deployment considering several factors, among which:
  • The annual voyage cost C v is determined by constraints (2) and (3) and constraints (9)–(11), the voyage time is determined by constraint (4), the berthing time is determined by constraints (5)–(8), the annual running cost C o is determined by constraint (12), and the annual capital cost C c is determined by constraint (13).
  • Constraint (16) is the cargo volume constraint, which shows that the annual total freight volume of each type of vessel on the corresponding route should meet the annual cargo demand of the route, considering the allowance for a certain amount of maneuver range.
  • In the shipping frequency constraints, the minimum annual shipping frequency of the route is determined by constraints (14) and (15), and constraint (17) shows that the annual number of voyages of each type of ship on the corresponding route must meet the requirements of the annual minimum sailing frequency of the route.
  • In the time constraint, it is indicated that the annual voyage time of the vessel type k on the corresponding route h shall be equal to the annual operating period of the vessel type k assigned to the route h by constraint (18).
  • In the quantity constraints, constraint (19) is the sum of the number of type vessels k assigned to each route. In constraint (20), it indicates the sum of the number of vessels assigned to each route.
  • In the numerical constraints, constraint (21) indicates that the departure interval and departure times shall be positive integers, and constraint (22) shows that the service speed and loading efficiency of each type of ship are positive real numbers.
To make the presentation more intuitive, the above function, constraints, parameters, and variables can be reflected in the feedback loop diagram of the system dynamics and the framework of various cost components, as shown in Figure 2 and Figure 3.

3.3. Numerical Experiments

The sailing time is set to be 1.2 times the sailing time at normal service speed, taking into account the voyage reserve and reasonable detour. Unproductive berthing time T k h f stands for the time for waiting for the pilot, tide, berth, dispatch, dealing with cargo damage and mechanical failure, etc., and under the consideration of port congestion and epidemic prevention and control situation, we set the unproductive berthing time to 0.5 times the productive berthing time T k h s . (As the unproductive berthing time is mainly affected by the operational efficiency of the port, if the loading and unloading speed of the terminal is fast, the waiting time of the next ship waiting for loading and unloading will be reduced, and the congestion of the port will be improved. Therefore, considering the historical berthing time data of major LNG terminals around the world, the unproductive berthing time is set as 0.5 times of the productive berthing time.) Other reasons berthing time T k h o is the time due to natural meteorological causes, such as high winds, heavy rain, fog, and the possibility of encountering bad weather, extending the time of the voyage, taking 10% of the sailing time and productive berthing time. (This is based on the historical AIS sailing data of LNG ships and the historical average of adverse weather conditions encountered during the voyage.) As for other variable costs, this study assumes the time value of the cargo in addition to the volatilization loss of LNG in transit, and the cargo time value refers to the amount of money that shippers are willing to pay for the saved time. Therefore, we refer to the study of Wang et al. [42] and Xing et al. [43], and combine the special cargo properties of LNG, taking the annual cargo hold cost factor of 0.1.
In terms of other annual running costs, considering the current increase in wages of the COVID-19 epidemic, the annual cost of the crew is taken to be approximately 1.5 times the original cost. (Under the prevention and control of global inflation and epidemic, many shipping companies increased their crew salaries in 2021, and some even paid 20-to-60-month year-end bonuses. However, considering that it may be reduced later, we conservatively set it to 1.5 times the original level.) The annual ship insurance fee is assumed to be 2% of the price of the vessel, annual repair and maintenance are taken as 2.5% of the price of the vessel, the annual moistening cost is considered 15% of the fuel cost, the annual subsistence supply is assumed to be 0.2 times of the crew’s salary, and ship management is taken to be 0.4 times the crew salary. (According to Clarksons’ data, the prices and hires of newbuilding and second-hand ships have generally increased, especially for LNG fuel ships responding to the call for carbon reduction. The insurance premium is based on the value of the ship, so it has also increased, and the cost of labor and materials required for ship maintenance has also risen.)
In chartering practice, the rental payment is usually called the hire. Based on the annual time charter rental data of LNG vessels from Clarkson Shipping Intelligence Network Timeseries (https://www.crsl.com/acatalog/shipping-intelligence-network.html) accessed on 23 November 2021, for the past three years, the average value is presumed and converted as the corresponding annual charter hire for each type of time charter ship in this study (no direct rental information is available for C-type vessels with a 220,000 bunker capacity, which is now processed according to market conditions and experience). Due to the limited information on the price of the ships, prices of the various types of ships are only specified according to the Clarkson reference data, as shown in Table 1.

4. Computational and Numerical Analyses

4.1. Data Preparation

In this part, to verify the validity of the model, it is assumed that an LNG transport company has a fleet of three type A vessels, four type B vessels, and three type C vessels. In the coming year, the company will use its three types of ships to transport LNG from special terminals in Australia, Malaysia, and Indonesia to Shenzhen, Putian, and Shanghai in China according to the requirements of the cargo owners and the terms of the annual cargo volume and volume mobility specified in the transportation contract. Some cost data and parameter values involved in the following calculation are based on the actual operation of shipping companies and trading institutions. We presume the details about the fuel price, the service speed of each type of vessel considering the unladen section, the cargo capacity (90% of the cabin capacity considering the LNG evaporation pressure [38]), the LNG evaporation rate in transit, the fuel consumption, and loading/unloading efficiency; see Table 2. According to data from CLNG and Clarkson Shipping Intelligence Network, we specifically set the fuel price at 150.29 USD/m3. In addition, the service speed is set with the consideration of the ballast voyage.
Note: According to the conversion rule:
This study stipulates that 1 ton of VLSFO (Vessel Low Sulfur Fuel Oil) has a calorific value of 41.3 million BTU (British Thermal Unit), 1 ton of MGO (Marine Gasoline Oil) has a calorific value of 43.5 million BTU, 1 ton of LNG has a calorific value of 51.8 million BTU, and 1 ton of LNG = 2.27 LNG.
Therefore: 1 ton of VLSFO = 1.81 LNG and 1 ton of MGO = 1.78 LNG. The LNG terminal handling efficiency is generally 11,000~12,000 m3/h; the precooling efficiency is 4 °C/min, which takes 1 h = 0.04 days; The equipment blowing and discharge residue and the interface disconnect operation take 5 h = 0.21 days.
This LNG shipping company is contracted to operate LNG transport projects on three routes from Shenzhen Dapeng LNG terminal to Withnell Bay, Australia; Fujian Putian LNG terminal to Tangguh LNG terminal, Indonesia; and Shanghai Yangshan LNG terminal to Bintulu LNG terminal, Malaysia. We assume some details about the round-trip distance (obtained using McDistance software), the annual cargo demand (allowing for a certain percentage of the volume maneuvering margin), the annual minimum sailing frequency, and the unit value of LNG for each route, as shown in Table 3. The cargo value is based on the average value of China’s LNG import CIF price and its index published by the Shanghai Oil and Gas Trading Center for the past two years, converted to “$/million British thermal unit”.

4.2. Calculation of the Voyage Time and Cost

According to data in Table 1 and Table 2, some data sources from Shanghai COSCO Shipping LNG Investment Co. (http://energy.coscoshipping.com/col/col19526/index.html accessed on 22 October 2021), China LNG Shipping (Holdings) Co., Clarkson Shipping Intelligence Network accessed on 22 October 2021), Shanghai Oil and Gas Trading Center (https://www.shpgx.com/html/jkLNGdajX.html (accessed on 23 October 2021), and Hifleet (https://www.hifleet.com/ accessed on 25 November 2021) are simultaneously integrated to bring this research closer and reflect the reality. Then, we combined all of them with constraints (4)–(8) to calculate the sailing time and berthing time of each type of ship on each route, as seen in Table 4.
The single voyage cost, annual capital cost, and annual running cost of each type of vessel on each route are calculated by constraints (2)–(15); see Table 5. To be specific, voyage cost includes fuel cost, other variable costs, port commission, and the cost of a single voyage multiplied by the number of voyages. As for capital cost, it includes annual depreciation, annual interest payable, and annual capital cost. Running cost includes the crew cost, the insurance premium, the maintenance fee, the moistening fee, the living supply cost, the ship management fee, the time charter hire, and the running cost of the self-owned ships. In terms of the annual running cost calculation, we assume that there is one type A vessel, two type B vessels, and one type C vessel for LNG carriers under time charter. Thus, the annual charter hire of four time-charter vessels is USD 121,777,000, the annual cost of self-owned vessels is USD 59,774,700, and the annual capital cost of self-owned vessels is USD 68,342,900.

4.3. Results and Cost Comparison Analysis

LINGO 17.0 is a general-purpose optimization solver for linear and non-linear domains. The most unique feature is that it allows the decision variables in the optimization model to be integers–that is, integer programming–which greatly facilitates the solution of this model. With the help of the LINGO 17.0 optimization software, the minimum value of the annual operating cost of the fleet is obtained as USD 451,949,500 by entering the objective function, constraints and relevant cost data mentioned above. The number of vessels of each type on each route and the number of trips are shown in Table 6, where all 10 vessels of each type can be arranged on the corresponding routes, the annual number of trips of each route meets the minimum frequency requirement of each route, and the annual cargo volume of the completed routes is also within the allowed range of the number of maneuvers (Route 1: 850 × 10 4   m 3 –8 52.35 × 10 4   m 3 , Route 2: 800 × 10 4   m 3 801.02 × 10 4   m 3 , Route 3: 900 × 10 4   m 3 900.72 × 10 4   m 3 ). To be specific, type A vessels are assigned two ships on route 2 and one ship on route 3; type B vessels are assigned one ship on route 1 and route 2 and two ships on route 3, respectively; and type C vessels are assigned one ship on each of the three routes. In total, 44 voyages are completed by type B and C vessels on route 1, 41 voyages are performed by each ship on route 2, and 46 voyages are performed by each ship on route 3.
The simulation and optimization results illustrate the effectiveness and practicality of the model, namely, in the planning of multi-vessel and multi-route LNG fleet deployment planning that integrates the effects of mixed factors, such as self-owned and time charter ships, epidemic prevention and control, port congestion, transportation time cost, and evaporation loss, as well as navigation safety and unexpected conditions; the annual operating cost of the LNG fleet is minimized while meeting the annual cargo demand of the route.
According to the model of Niu et al. [38], we also enter the objective functions, constraints, and parameters used in this paper (only the parameters involved in this model are considered) in LINGO 17.0. Since his model only calculates the annual voyage cost of LNG vessels without considering the capital cost and the running cost, we suppose that all vessels are self-owned. Then, some reasonable adjustments are made to it after combining the mixed factors considered in this study. Ultimately, Table 7 reveals the fleet deployment planning of LNG shipping routes, the total number of voyages performed, and the annual cargo volume of the route under the model. The annual operating cost of the LNG fleet is USD 510.458 million, which is USD 49.585 million higher than the minimum annual operating cost obtained from this model. That is, the model can reduce the annual operating cost by approximately 9.87%, which also demonstrates the optimization and application value of this model.

4.4. Sensitivity Analysis

Sensitivity analysis refers to a dynamic uncertainty analysis method from the perspective of quantitative analysis to study the degree of impact of a certain change in relevant factors on a key indicator or a group of key indicators. It identifies some sensitive factors that have an important influence on the consideration target from many factors, while measuring and analyzing the degree of their influence on the consideration target. Then, it studies the reasons for the change of the sensitive factors, which, in essence, is to explain the law of key indicators affected by the change of these factors by changing the value of relevant variables one by one.
Overall, eight significant variables, such as the price of the ship, the price of fuel, the value of cargo, the port charges, and other variable costs, are selected and increased by 10% to obtain the amount of variation of the annual operating cost and the degree of variation in cost [27,40], and the sensitivity coefficients of each variable are calculated, as revealed in Table 8. It can be seen that among the eight variables, cargo value, ship price, annual hire of the time charter vessel, fuel price, and other variable costs have the most prominent impact on annual operating costs, while the remaining three factors have a slightly less significant impact.
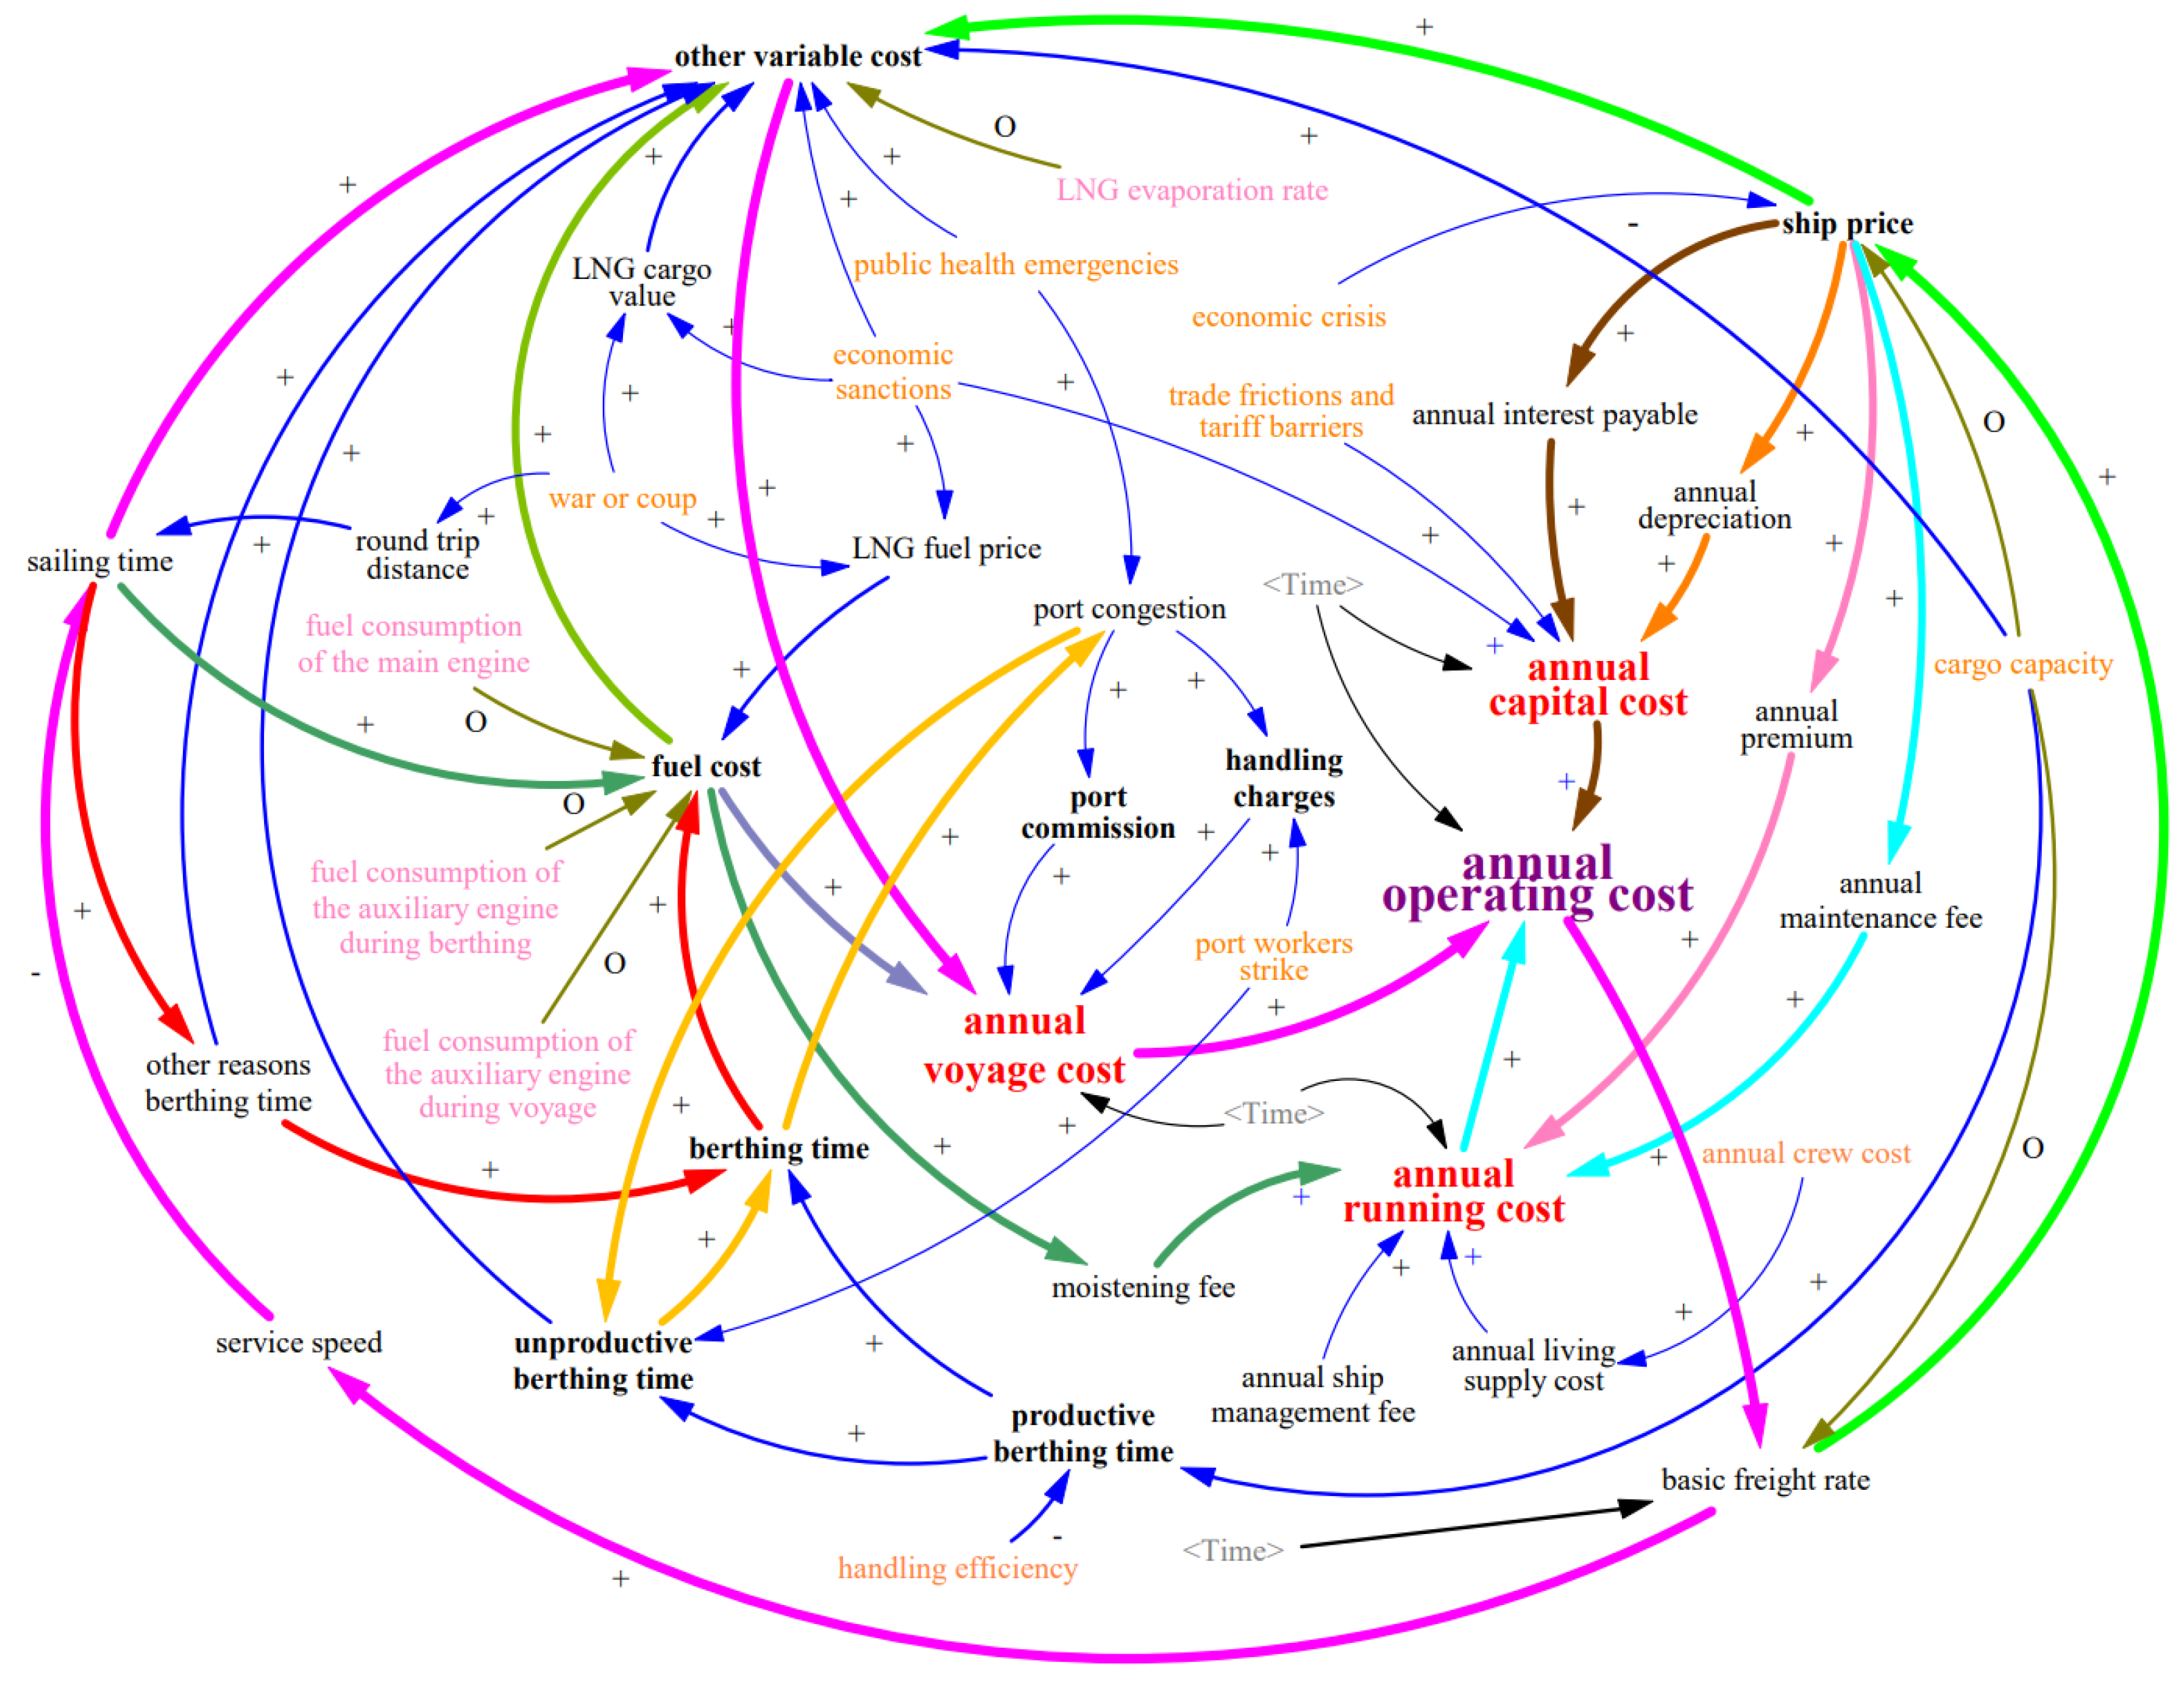
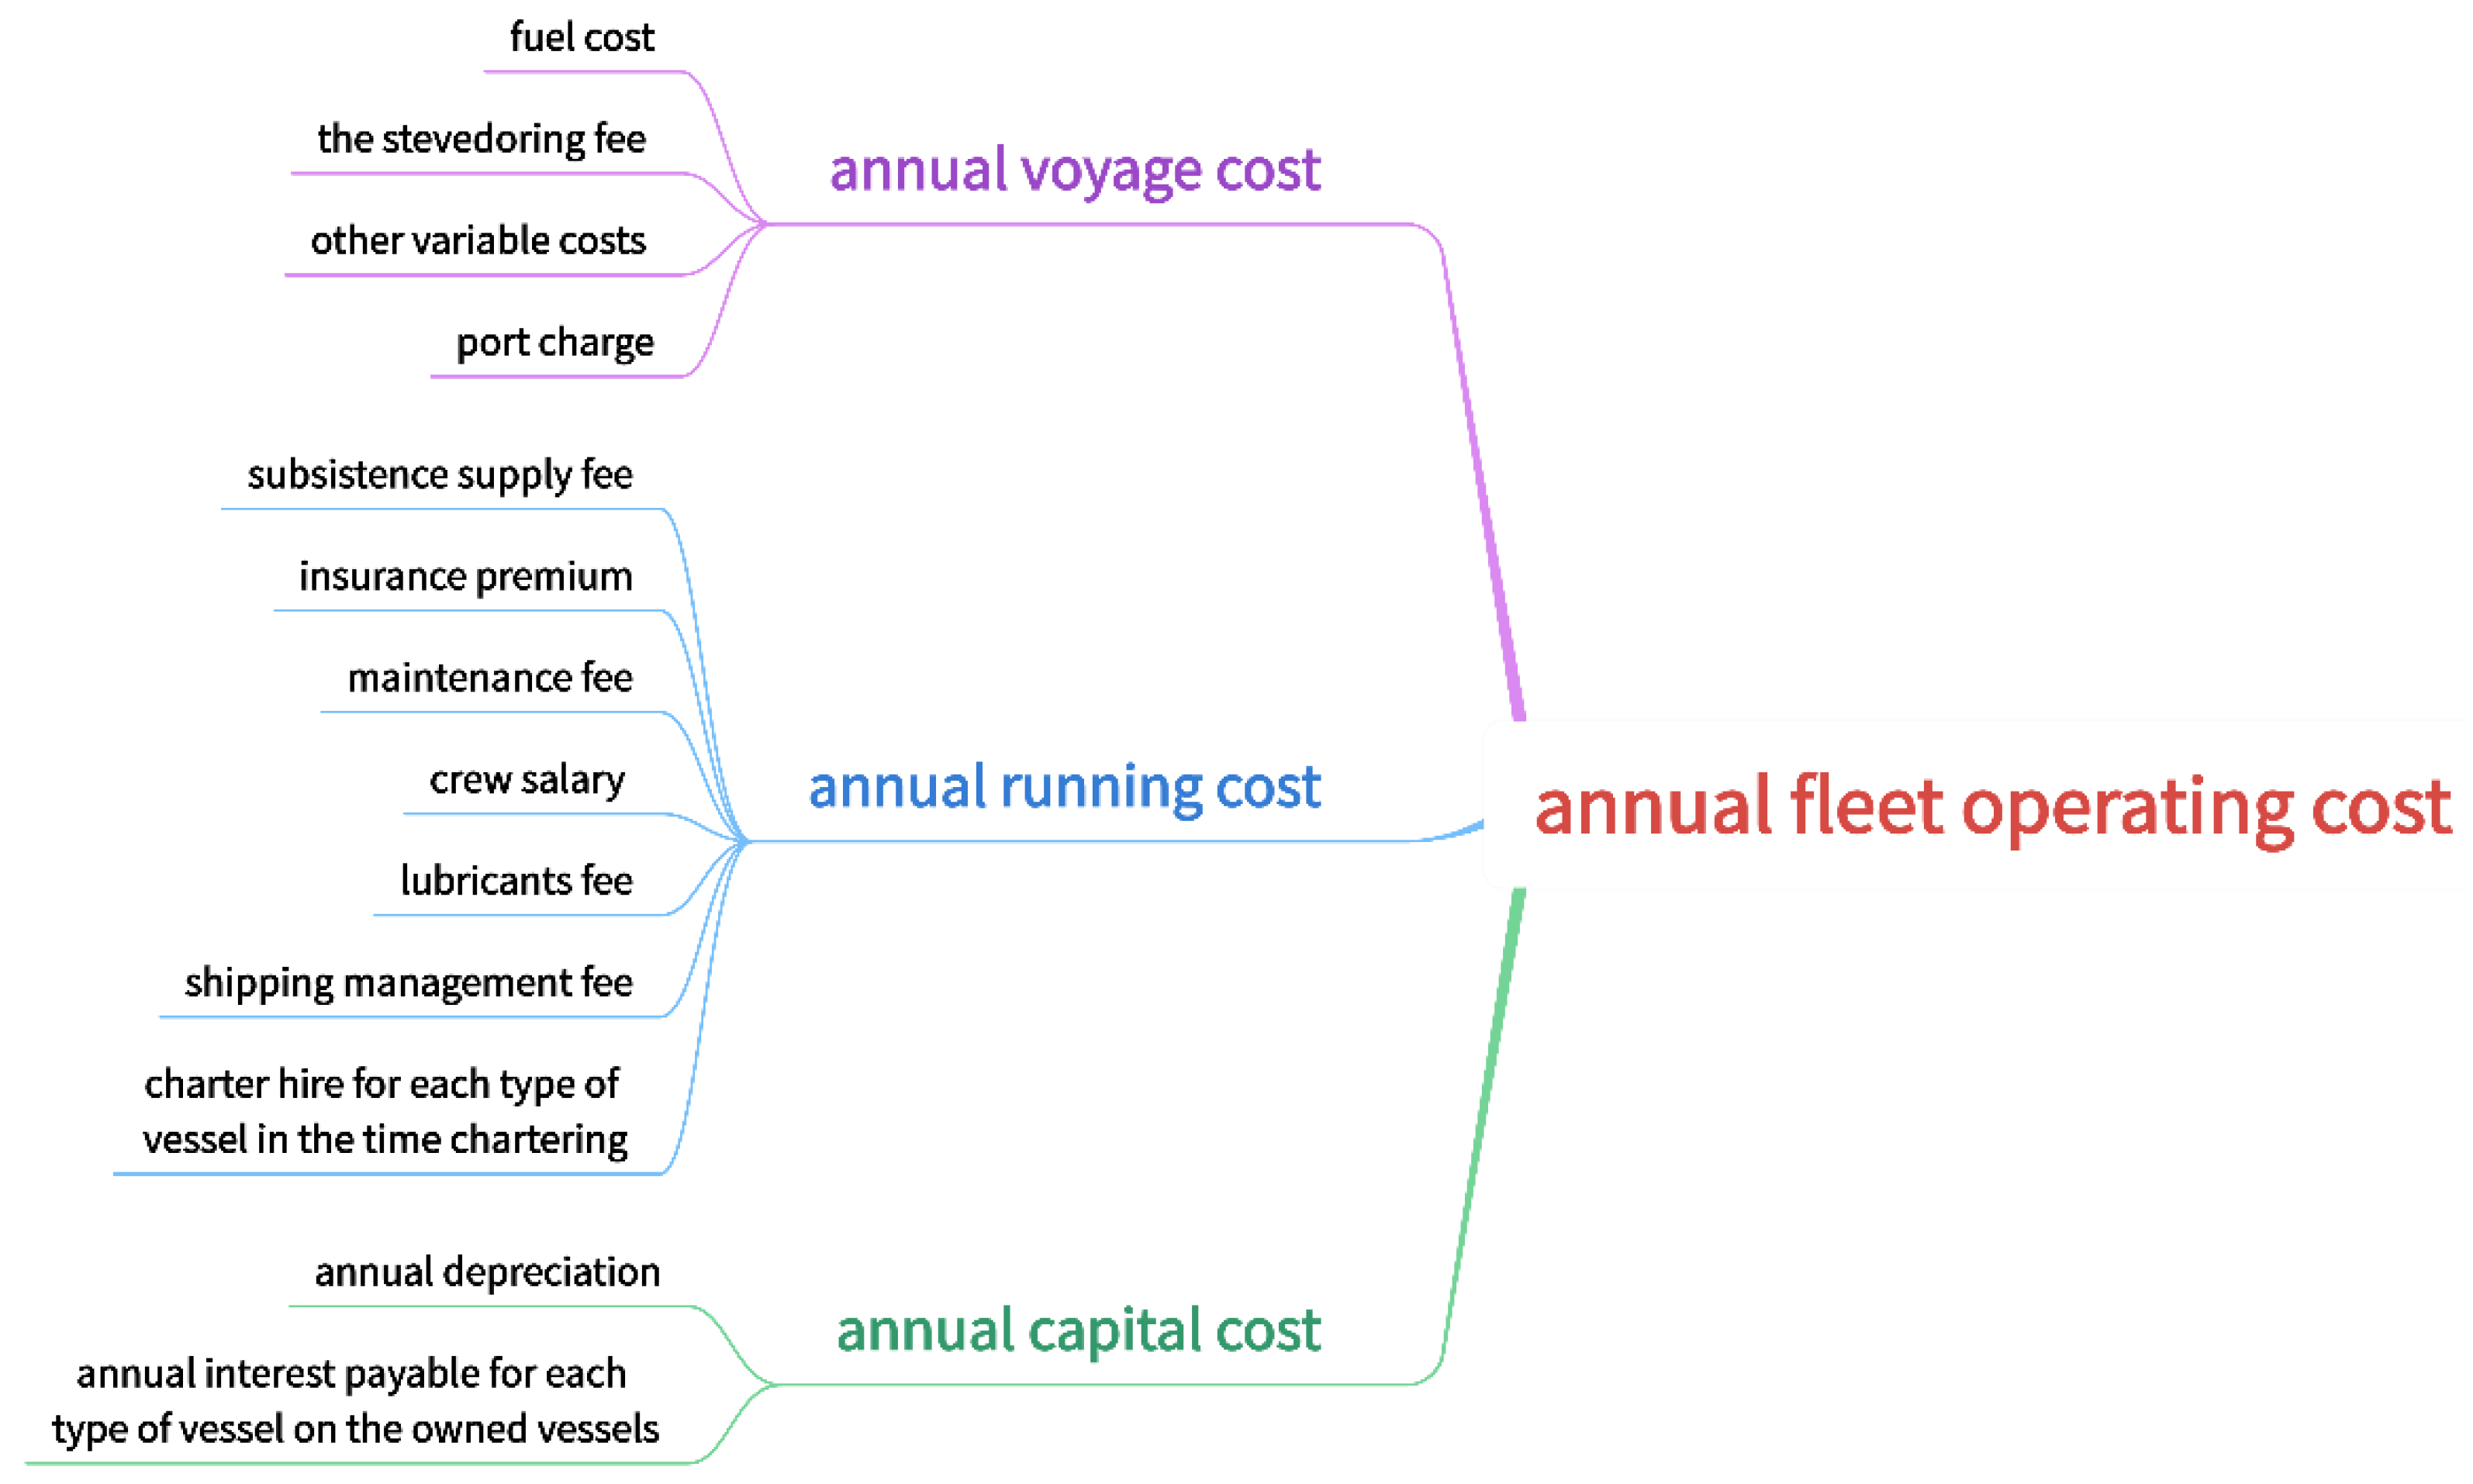
  • As LNG itself is a high value-added and high-value cargo related to the nation’s livelihood, its in-transit inventory holding cost–namely, the time value of the cargo–has a great impact on the annual operating cost of the fleet, and the evaporation loss of LNG in transit is also unavoidable. Meanwhile, being a capital and technology intensive cutting-edge project with high technical content and investment cost, difficult construction, and long construction period, the construction of large LNG ships has been regarded as one of the most sophisticated projects in the shipbuilding industry, which makes its ship price high, causing the fleet to bear the high capital cost of its own ships every year. Furthermore, this has resulted in high vessel prices in the hundreds of millions of dollars, making it necessary for the fleet to incur high annual capital costs for owned vessels.
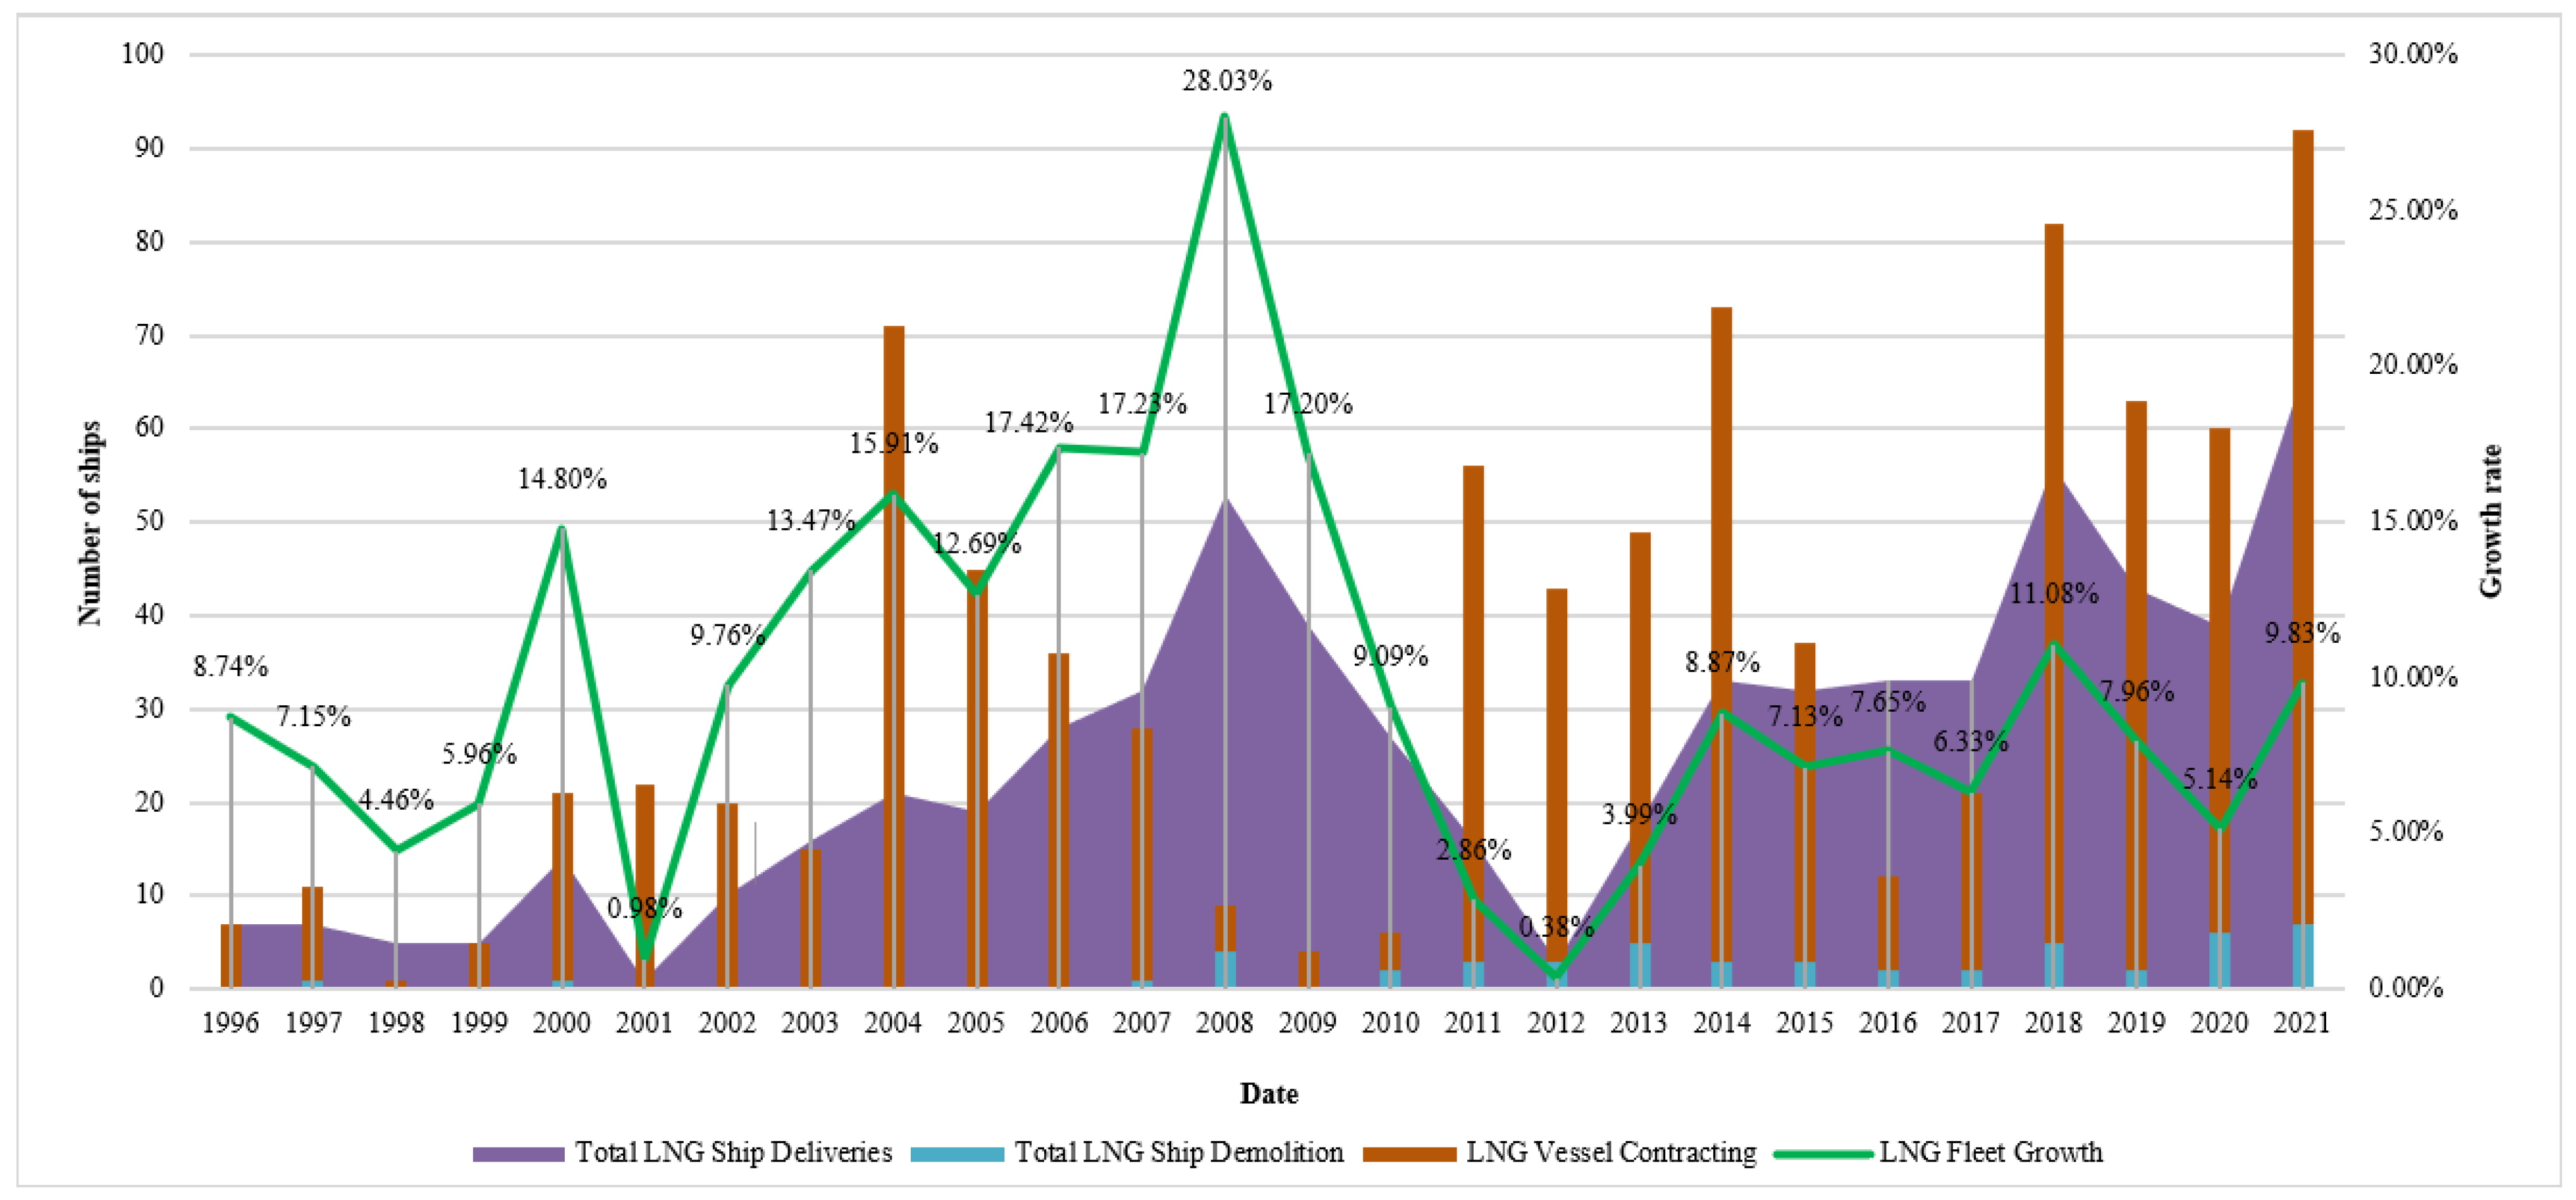
  • In addition, the LNG shipping market is a high-yield, high-monopoly special transportation market. Based on the latest Clarkson research data, the supply of ships in the whole market is only around 660 ships so far, which–coupled with the large consumption and transportation demand–makes LNG ship charter hire rise; in addition, the term chartering ship cost is quite expensive. Furthermore, the increase in port charges, crew wages, and nonproductive berthing time will also have a significant impact on the annual operating costs of the fleet, and especially on the current global port congestion. Additionally, the new wave of epidemic impact caused by the new variant of the Delta coronavirus strain and the Omicron strain on crew protection, shift change, and mental health issues is worth the review and attention of shipping companies, regulatory authorities, and relevant international organizations.

4.5. Suggestions for Countermeasures

In view of the market characteristics of LNG shipping and sensitivity analysis, the following suggestions are provided for all relevant parties of LNG shipping:
Establish a “Port and Shipping” price reciprocity mechanism and full-chain investment planning. LNG shipping enterprises are suggested to sign fuel price agreements with LNG filling stations and receiving stations at loading and unloading ports, namely, shipping companies exchanging certain freight concessions for stable long-term marine LNG fuel prices to reduce the negative impact of fuel price fluctuations on fleet operations. At the same time, the construction of their own bunkering stations at loading and unloading ports or the rental of them to store the required bunkers also allows LNG shipping companies to effectively cope with fuel price increases caused by economic sanctions, trade friction, economic crisis, war, or political unrest. In addition, LNG shipping companies can directly participate in the upstream, midstream, and downstream of LNG projects (natural gas production and supply companies, energy companies, shipyards, specialized equipment manufacturing companies, software technology companies and ports, etc.), throughout the supply chain, contract chain, and value chain of LNG projects with the main purpose of having a strong initiative and voice in the LNG market.
Optimize inbound links to reduce invalid berthing time. In terms of priority berthing, pilotage, navigation, advanced channel clearance, and simplification of entry and exit procedures, LNG shipping enterprises need to actively reach an agreement with port groups, port authorities, customs, and other government departments in the loading and unloading areas on these aspects. Especially in the case of public health emergencies, such as epidemics and force majeure, it is more necessary to build “secure, ensure access, ensure smoothness, and ensure transportation” for LNG carriers, shorten nonproductive berthing time and berthing time for other reasons, and reduce other variable costs (including the time value of freight transport) due to the increase in the whole voyage time. In this way, the rise of other variable costs (including cargo time value, LNG evaporation loss, and extra fuel cost) that are caused by increasing the duration of the whole journey will be reduced in the foreseeable future.
Improve the competitiveness of LNG vessel construction and economies of scale. The cost of ship construction plays a crucial role in the total operating cost. Compared to Japan and South Korea, the competitive advantages of LNG ship construction in China in terms of technology, time, and price are not too obvious. Under the background of the Chinese double carbon strategy, natural gas–a low-carbon and environmentally friendly clean energy–is expected to usher in a larger consumer market. Therefore, it is recommended that the Chinese government considers giving LNG shipbuilders and LNG transport enterprises (only when they are ship owners) certain preferential financing and loan policies and scientific and technological support to stimulate a new generation of large LNG ships to mature and develop better quality and price advantages. In the future, it will also effectively reduce the capital cost of ships, allowing LNG carriers to play the full role of the economies of scale of large LNG ships to reduce operating costs.
Construct a double resource pool combined transport mode. On one hand, the transportation mode of the combined resource pool of loading and unloading ports (i.e., all loading ports form an upstream resource pool, and all unloading ports form a downstream receiving pool, thus forming the transportation mode of multiple supply points to multiple receiving points), which can reduce the transportation cost to a large extent. On the other hand, referring to the joint operation mode of common vessel assignment and space exchange of the liner alliance [44,45], the LNG vessel pool alliance transportation mode is established to improve the productivity of LNG shipping through reasonable fleet deployment and efficient dispatch of alliance fleet resources, to improve the flexibility of LNG shipping to some extent. Consequently, LNG shipping companies can choose the best vessel (including the vessel with the best capacity, speed, registry, cost, and closest to the loading port) to carry out the voyage in the market at random, reducing the operating cost while facilitating the service level.

5. Conclusions and Further Research

The primary contribution of this paper comes from four main aspects.
  • First, it analyzes the fleet deployment in LNG shipping under the influence of several mixed factors, proposing an optimization model based on the characteristics of LNG shipping and relevant data sources. Through a case study and cost-contrast analysis, the practicality and optimality of the model are verified.
  • Second, the key factors that affect the annual operating cost of LNG shipping enterprises are identified through a sensitivity analysis, and their causes are analyzed one by one. LNG shipping companies can focus on these factors in fleet deployment and actual operation and adjust strategies in time to reduce total operating costs.
  • Third, from the segments of fuel filling, port operation, transportation economy, and fleet cooperation, four corresponding reference suggestions are provided to all relevant parties to LNG shipping for these key factors in the sensitivity analysis.
  • Ultimately, this study will be beneficial to promote the prosperity of transregional marine energy transport and further strengthen the energy security and development of port cities and their economic hinterland.
However, there are some limitations in this study that need further improvement.
  • For example, there is very little research literature on LNG route allocation. In the numerical experiments, some parameters and weights are determined by referring to research on liner shipping, Clarksons database, and some latest reports on LNG shipping industry.
  • Meanwhile, the arithmetic validation link of this study is to carry out a limited number of integer optimization cases with the combination optimization of three types of vessels, 10 ships, and three fixed shipping routes, which means that the research results have a certain degree of deviation. However, in reality, LNG shipping enterprises generally only have a few types of ships, with several to over 10 LNG ships, such as CLNG and BP, while operating stable routes within a year influenced by transportation agreements and more fixed import/export countries. Therefore, the empirical case evidence of this study is reliable and realistic to some extent.
  • With the increasing use of natural gas, a low carbon and clean energy, LNG shipping will become more prosperous and busier. Continuous expansion of the size of the LNG fleet will make the fleet operation more complex. In the near future, the system dynamics method may be used to provide LNG shipping enterprises with more scientific and adaptive decision-making reference.

Author Contributions

Conceptualization, Z.Z.; Data curation, S.C. and H.W.; Funding acquisition, Z.Z., X.W. and W.L.; Investigation, Z.Z.; Methodology, Z.Z.; Project administration, Z.Z.; Resources, W.L.; Software, Z.Z. and S.C.; Supervision, X.W.; Writing—original draft, Z.Z., H.W. and S.C.; Writing—review and editing, X.W. and W.L. All authors have read and agreed to the published version of the manuscript.

Funding

This research was supported by the National Natural Science Foundation of China (71272219; 71601014) and the National College Students Innovation and Entrepreneurship Training Program (202110254009) supported by the Ministry of Education of China.

Institutional Review Board Statement

Not applicable.

Informed Consent Statement

Not applicable.

Data Availability Statement

All data generated during this study are included in this article.

Conflicts of Interest

The authors declare that they have no conflict of interest.

References

  1. Zhang, F.; Yu, H.; Li, H.; Peng, L.; Zhou, T. Safety or Efficiency? An ECSO Framework of Traffic Organization Optimization for LNG Carriers Entering and Leaving Port. Math. Probl. Eng. 2021, 2021, e8804219. [Google Scholar] [CrossRef]
  2. Ríos-Mercado, R.Z.; Borraz-Sánchez, C. Optimization Problems in Natural Gas Transportation Systems: A State-of-the-Art Review. Appl. Energy 2015, 147, 536–555. [Google Scholar] [CrossRef]
  3. Raj, R.; Ghandehariun, S.; Kumar, A.; Geng, J.; Linwei, M. A Techno-Economic Study of Shipping LNG to the Asia-Pacific from Western Canada by LNG Carrier. J. Nat. Gas Sci. Eng. 2016, 34, 979–992. [Google Scholar] [CrossRef]
  4. Yin, Y.W.; Lam, J.S.L. Bottlenecks of LNG Supply Chain in Energy Transition: A Case Study of China Using System Dynamics Simulation. Energy 2022, 250, 123803. [Google Scholar] [CrossRef]
  5. Engelen, S.; Dullaert, W. Designing a Decision Support Model for the LNG Market. Transp. Plan. Technol. 2010, 33, 719–731. [Google Scholar] [CrossRef]
  6. Yang, S.; Xu, D.; Cui, Y.; Ni, Y.; Duan, C. The Research about Storage and Transportation of Natural Gas Based on LNG Technology. Nat. Resour. 2015, 6, 306–311. [Google Scholar] [CrossRef] [Green Version]
  7. Huemme, J.C.; Gabriel, S.A.; Chanpiwat, P.; Shu, T. An Analysis of the U.S.—China Trade War’s Impact on Global Natural Gas Markets and the U.S. Coast Guard’s LNG Inspection Workforce. J. Nat. Gas Sci. Eng. 2022, 97, 104198. [Google Scholar] [CrossRef]
  8. Liu, J.; Zhao, Y.; Lv, Z. Research Status and Prospect of LNG Inland Waterway Transportation Safety in China. In Proceedings of the 6th International Conference on Transportation Information and Safety (ICTIS), Wuhan, China, 22–24 October 2021; pp. 318–322. [Google Scholar] [CrossRef]
  9. Zeng, W.; Zhang, X.; Li, N.; Wang, X.; Wang, X. China’s LNG Import Risk Assessment Based on the Perspective of Global Governance. Sci. Rep. 2022, 12, 15754. [Google Scholar] [CrossRef]
  10. Zahedi, B.; Norum, L.E. Modeling and Simulation of All-Electric Ships With Low-Voltage DC Hybrid Power Systems. IEEE Trans. Power Electron. 2013, 28, 4525–4537. [Google Scholar] [CrossRef]
  11. van Biert, L.; Godjevac, M.; Visser, K.; Aravind, P.V. A Review of Fuel Cell Systems for Maritime Applications. J. Power Sources 2016, 327, 345–364. [Google Scholar] [CrossRef] [Green Version]
  12. Hou, J.; Song, Z.Y.; Hofmann, H.; Sun, J. Adaptive Model Predictive Control for Hybrid Energy Storage Energy Management in All-Electric Ship Microgrids. Energy Convers. Manag. 2019, 198, 111929. [Google Scholar] [CrossRef]
  13. Haseltalab, A.; Botto, M.A.; Negenborn, R.R. Model Predictive DC Voltage Control for All-Electric Ships. Control Eng. Pract. 2019, 90, 133–147. [Google Scholar] [CrossRef]
  14. Burel, F.; Taccani, R.; Zuliani, N. Improving Sustainability of Maritime Transport through Utilization of Liquefied Natural Gas (LNG) for Propulsion. Energy 2013, 57, 412–420. [Google Scholar] [CrossRef]
  15. Schinas, O.; Butler, M. Feasibility and Commercial Considerations of LNG-Fueled Ships. Ocean Eng. 2016, 122, 84–96. [Google Scholar] [CrossRef]
  16. Baldi, F.; Moret, S.; Tammi, K.; Maréchal, F. The Role of Solid Oxide Fuel Cells in Future Ship Energy Systems. Energy 2020, 194, 116811. [Google Scholar] [CrossRef]
  17. Haseltalab, A.; Van Biert, L.; Sapra, H.; Mestemaker, B.; Negenborn, R.R. Component Sizing and Energy Management for SOFC-Based Ship Power Systems. Energy Convers. Manag. 2021, 245, 114625. [Google Scholar] [CrossRef]
  18. Ng, M. Revisiting a Class of Liner Fleet Deployment Models. Eur. J. Oper. Res. 2017, 257, 773–776. [Google Scholar] [CrossRef]
  19. Tan, Z.Y.; Li, H.L.; Wang, H.W.; Qian, Q.Y. Maritime Container Shipping Fleet Deployment Considering Demand Uncertainty. Asia-Pac. J. Oper. Res. 2021, 38, 2140026. [Google Scholar] [CrossRef]
  20. Gao, C.F.; Hu, Z.H. Speed Optimization for Container Ship Fleet Deployment Considering Fuel Consumption. Sustainability 2021, 13, 5242. [Google Scholar] [CrossRef]
  21. Wang, X.; Fagerholt, K.; Wallace, S.W. Planning for Charters: A Stochastic Maritime Fleet Composition and Deployment Problem. Omega 2018, 79, 54–66. [Google Scholar] [CrossRef] [Green Version]
  22. Zhen, L.; Hu, Y.; Wang, S.A.; Laporte, G.; Wu, Y.W. Fleet Deployment and Demand Fulfillment for Container Shipping Liners. Transp. Res. Part B Methodol. 2019, 120, 15–32. [Google Scholar] [CrossRef]
  23. Chen, J.H.; Ye, J.; Zhuang, C.L.; Qin, Q.D.; Shu, Y.Q. Liner Shipping Alliance Management: Overview and Future Research Directions. Ocean Coast. Manag. 2022, 219, 106039. [Google Scholar] [CrossRef]
  24. Pantuso, G.; Fagerholt, K.; Hvattum, L.M. A Survey on Maritime Fleet Size and Mix Problems. Eur. J. Oper. Res. 2014, 235, 341–349. [Google Scholar] [CrossRef] [Green Version]
  25. Wang, S.A. Fundamental Properties and Pseudo-Polynomial-Time Algorithm for Network Containership Sailing Speed Optimization. Eur. J. Oper. Res. 2016, 250, 46–55. [Google Scholar] [CrossRef]
  26. Kosmas, O.T.; Vlachos, D.S. Simulated Annealing for Optimal Ship Routing. Comput. Oper. Res. 2012, 39, 576–581. [Google Scholar] [CrossRef] [Green Version]
  27. Wang, C.X.; Chen, J.J. Strategies of Refueling, Sailing Speed and Ship Deployment of Containerships in the Low-Carbon Background. Comput. Ind. Eng. 2017, 114, 142–150. [Google Scholar] [CrossRef]
  28. Wang, S.; Zhuge, D.; Zhen, L.; Lee, C.-Y. Liner Shipping Service Planning Under Sulfur Emission Regulations. Transp. Sci. 2021, 55, 491–509. [Google Scholar] [CrossRef]
  29. Zhuge, D.; Wang, S.A.; Wang, D.Z.W. A Joint Liner Ship Path, Speed and Deployment Problem under Emission Reduction Measures. Transp. Res. Part B Methodol. 2021, 144, 155–173. [Google Scholar] [CrossRef]
  30. Tan, Z.J.; Zhang, M.; Shao, S.; Liang, J.P.; Sheng, D. Evasion Strategy for a Coastal Cargo Ship with Unpunctual Arrival Penalty under Sulfur Emission Regulation. Transp. Res. Part E Logist. Transp. Rev. 2022, 164, 102818. [Google Scholar] [CrossRef]
  31. Wang, C.X.; Yu, S.S.; Xu, L. Decisions on Sailing Frequency and Ship Type in Liner Shipping with the Consideration of Carbon Dioxide Emissions. Reg. Stud. Mar. Sci. 2022, 52, 102371. [Google Scholar] [CrossRef]
  32. Tan, Z.J.; Zeng, X.Y.; Shao, S.; Chen, J.H.; Wang, H. Scrubber Installation and Green Fuel for Inland River Ships with Non-Identical Streamflow. Transp. Res. Part E Logist. Transp. Rev. 2022, 161, 102677. [Google Scholar] [CrossRef]
  33. Msakni, M.K.; Haouari, M. Short-Term Planning of Liquefied Natural Gas Deliveries. Transp. Res. Part C Emerg. Technol. 2018, 90, 393–410. [Google Scholar] [CrossRef]
  34. Zhu, M.C.; Huang, L.W.; Huang, Z.Q.; Shi, F.; Xie, C. Hazard Analysis by Leakage and Diffusion in Liquefied Natural Gas Ships during Emergency Transfer Operations on Coastal Waters. Ocean Coast. Manag. 2022, 220, 106100. [Google Scholar] [CrossRef]
  35. Budiyanto, M.A.; Singgih, I.K.; Riadi, A.; Putra, G.L. Study on the LNG Distribution to Mobile Power Plants Using a Small-Scale LNG Carrier for the Case of the Sulawesi Region of Indonesia. Energy Rep. 2022, 8, 374–380. [Google Scholar] [CrossRef]
  36. Eriksen, U.; Kristiansen, J.; Fagerholt, K.; Pantuso, G. Planning a Maritime Supply Chain for Liquefied Natural Gas under Uncertainty. Marit. Transp. Res. 2022, 3, 100061. [Google Scholar] [CrossRef]
  37. Doymus, M.; Denktas Sakar, G.; Topaloglu Yildiz, S.; Acik, A. Small-Scale LNG Supply Chain Optimization for LNG Bunkering in Turkey. Comput. Chem. Eng. 2022, 162, 107789. [Google Scholar] [CrossRef]
  38. Niu, D.X.; Gao, C.N.; Xie, X.L.; Bao, T.T. A fleet deployment optimization model for LNG shipping. Nat. Gas Ind. 2015, 35, 101–104. [Google Scholar] [CrossRef]
  39. Wang, S.Y.; Notteboom, T. Shipowners’ Structure and Fleet Distribution in the Liquefied Natural Gas Shipping Market. Int. J. Shipp. Transp. Logist. 2014, 6, 488–512. [Google Scholar] [CrossRef]
  40. Bittante, A.; Pettersson, F.; Saxén, H. Optimization of a Small-Scale LNG Supply Chain. Energy 2018, 148, 79–89. [Google Scholar] [CrossRef]
  41. Koza, D.F.; Ropke, S.; Boleda Molas, A. The Liquefied Natural Gas Infrastructure and Tanker Fleet Sizing Problem. Transp. Res. Part E Logist. Transp. Rev. 2017, 99, 96–114. [Google Scholar] [CrossRef] [Green Version]
  42. Wang, N.; Yan, B.; Wu, N.; Zhao, W.J. Comments on “Case Studies of Shipping along Arctic Routes. Analysis and Profitability Perspectives for the Container Sector. Transp. Res. Part A Policy Pract. 2016, 94, 699–702. [Google Scholar] [CrossRef]
  43. Xing, Y.W.; Yang, H.L.; Ma, X.F. Optimization of containership sailing speed and fleet deployment for continental ocean liner based on freight rate differentiation strategy. Syst. Eng.—Theory Pract. 2018, 38, 3222–3234. [Google Scholar] [CrossRef]
  44. Quartieri, F. Are Vessel Sharing Agreements Pro-Competitive? Econ. Transp. 2017, 11–12, 33–48. [Google Scholar] [CrossRef]
  45. Chen, J.H.; Zhuang, C.L.; Yang, C.; Wan, Z.; Zeng, X.; Yao, J.Y. Fleet Co-Deployment for Liner Shipping Alliance: Vessel Pool Operation with Uncertain Demand. Ocean Coast. Manag. 2021, 214, 105923. [Google Scholar] [CrossRef]
Figure 1. Number of LNG ships delivered, scrapped, and in new building from 2011 to 2021.
Jmse 10 02034 g001
Figure 2. System dynamics feedback loop diagram.
Jmse 10 02034 g002
Figure 3. Framework of various cost components.
Jmse 10 02034 g003
Table 1. Time charter hire and ship price.
Ship Type with Subdivision CapacityDaily Hire (USD/Day)Annual Hire (USD/Year)Ship Price (USD)
Type A LNG ship 145 K CBM49,16317,944,496.84130,000,000
Type B LNG ship 174 K CBM91,08433,245,508.84170,000,000
Type C LNG ship 220 K CBM102,30537,341,481.95220,000,000
Table 2. Basic information on vessels.
Ship TypeShip NumberFuel Price
(USD/m3)
Cabin Capacity (104 m3)Cargo Capacity (104 m3)Service
Speed (Knots)
Evaporation Rate (%/d)Main Engine
Consumption
(m3/d)
Auxiliary Engine Consumption during Navigation
(m3/d)
Auxiliary
Engine Consumption
during Berthing (m3/d)
Handling
Efficiency
(104 m3/d)
A3150.2914.7213.25200.135%325.8014.2423.1426.40
B4150.2917.4015.6619.50.142%289.6018.6927.0627.60
C3150.2921.6219.46190.145%262.4521.3630.9728.80
Source: Compiled by the authors based on CLNG (http://www.c-lngs.com/5/ accessed on 25 November 2021) and Clarkson Shipping Intelligence Network accessed on 23 November 2021.
Table 3. Basic information of routes.
LinePort of DischargePort of LoadingRound Trip Distance (Nautical Miles)Annual
Demand
(104 m3)
Quantity
Maneuver Range
Departure
Interval
(Days/Ship)
Annual Minimum Departure Frequency
(Times/Year)
Cargo Value
(USD/m3)
1Shenzhen Dapeng
LNG terminal, China
Withnell Bay, Australia5579.28503%8.6140205.16
2Fujian Putian LNG terminal, ChinaTangguh LNG
terminal, Indonesia
4041.48004%9.2537205.16
3Shanghai Yangshan
LNG terminal, China
Bintulu LNG terminal, Malaysia3652.89005%8.3142205.16
Source: Compiled by the authors based on CLNG and the Shanghai Oil and Gas Trading Center.
Table 4. Calculation of the voyage time (unit: day).
Vessel TypeTransportation TimeRoute 1Route 2Route 3
ASailing time13.9510.109.13
Berthing time3.282.892.79
Productive berthing1.251.251.25
Nonproductive berthing time0.630.630.63
Other reasons berthing time 1.391.010.91
BSailing time14.3110.369.37
Berthing time3.513.113.01
Productive berthing1.381.381.38
Nonproductive berthing time0.690.690.69
Other reasons berthing time 1.431.040.94
CSailing time14.6810.649.61
Berthing time3.873.473.36
Productive berthing1.601.601.60
Nonproductive berthing time0.800.800.80
Other reasons berthing time 1.471.060.96
Table 5. Cost calculation table (Unit: 104 USD).
Ship TypeVoyage CostRouteCapital CostRouteRunning CostRoute
123123123
AFuel cost72.452.647.6Annual depreciation334.3334.3334.3Annual crew cost126.2126.2126.2
Port commission161616Annual premium260260260
Annual maintenance fee325325325
Handling charges14.714.714.7Annual interest payable520520520Moistening fee10.97.97.1
Other variable cost7961.557.1Annual living supply cost25.225.225.2
Annual ship management fee50.550.550.5
Single voyage cost182.1144.9135.4Annual capital cost854.3854.3854.3Time charter annual hire1794.41794.41794.4
Annual running cost of self-owned ships797.8794.8794.1
BFuel cost74.35448.9Annual depreciation 437.1437.1437.1Annual crew cost128.2128.2128.2
Port commission181818Annual premium340340340
Annual maintenance hire425425425
Handling charges17.417.417.4Annual interest payable680680680Moistening fee11.18.17.3
Other variable cost100.478.372.8Annual living supply cost25.625.625.6
Annual ship management fee51.351.351.3
Single voyage cost210.1167.8157.1Annual capital cost1117.11117.11117.1Time charter annual hire3324.63324.63324.6
Annual running cost of self-owned ships981.2978.2977.4
CFuel cost76.455.650.3Annual depreciation565.7565.7565.7Annual crew cost130.2130.2130.2
Port commission202020Annual premium440440440
Annual maintenance fee550550550
Handling charges21.621.621.6Annual interest payable880880880Moistening fee11.58.37.5
Other variable cost130.3101.994.7Annual living supply cost262626
Annual ship management fee52.152.152.1
Single voyage cost248.3199.1186.6Annual capital cost1445.71445.71445.7Time charter annual hire3734.13734.13734.1
Annual running cost of self-owned ships1209.71206.61205.8
Table 6. The optimal fleet deployment and voyage frequency of the route.
Vessel TypeNumber of Ships Allocated to the RouteRouteAnnual VoyagesAnnual Cargo Volume of Completed Route (104 m3)Vessel TypeMaximum Voyages
Route 1Route 2Route 3Route 1Route 2Route 3
A021144852.35A202729
B112241801.02B242628
C111346900.72C232427
Table 7. Traditional model ship allocation scheme and voyage cargo.
Type of VesselNumber of Ships Allocated to the RouteRouteAnnual VoyagesAnnual Cargo Volume of Completed Route (104 m3)
Route 1Route 2Route 3
A111143842.36
B211242807.23
C111347898.31
Table 8. Sensitivity analysis.
Serial NumberVariable FactorsFactor ChangeCost VariationCost ChangeSensitivity Coefficient
1Ship price10%13,557,285.713.00%0.30
2Fuel price10%6,117,389.831.35%0.14
3Value of goods10%14,333,120.343.17%0.32
4Port Commission10%1,880,000.000.42%0.04
5Other variable costs10%10,377,366.842.30%0.23
6Annual crew cost10%1,230,528.000.27%0.03
7Time charter annual hire10%12,177,699.652.69%0.27
8Nonproductive berthing time10%492,256.370.11%0.01
Publisher’s Note: MDPI stays neutral with regard to jurisdictional claims in published maps and institutional affiliations.

