
Fault-Tree-Analysis-Based Health Monitoring for Autonomous Underwater Vehicle


Abstract
:1. Introduction
2. Literature Review
3. Health Evaluation Method
3.1. Reliability Evaluation Method
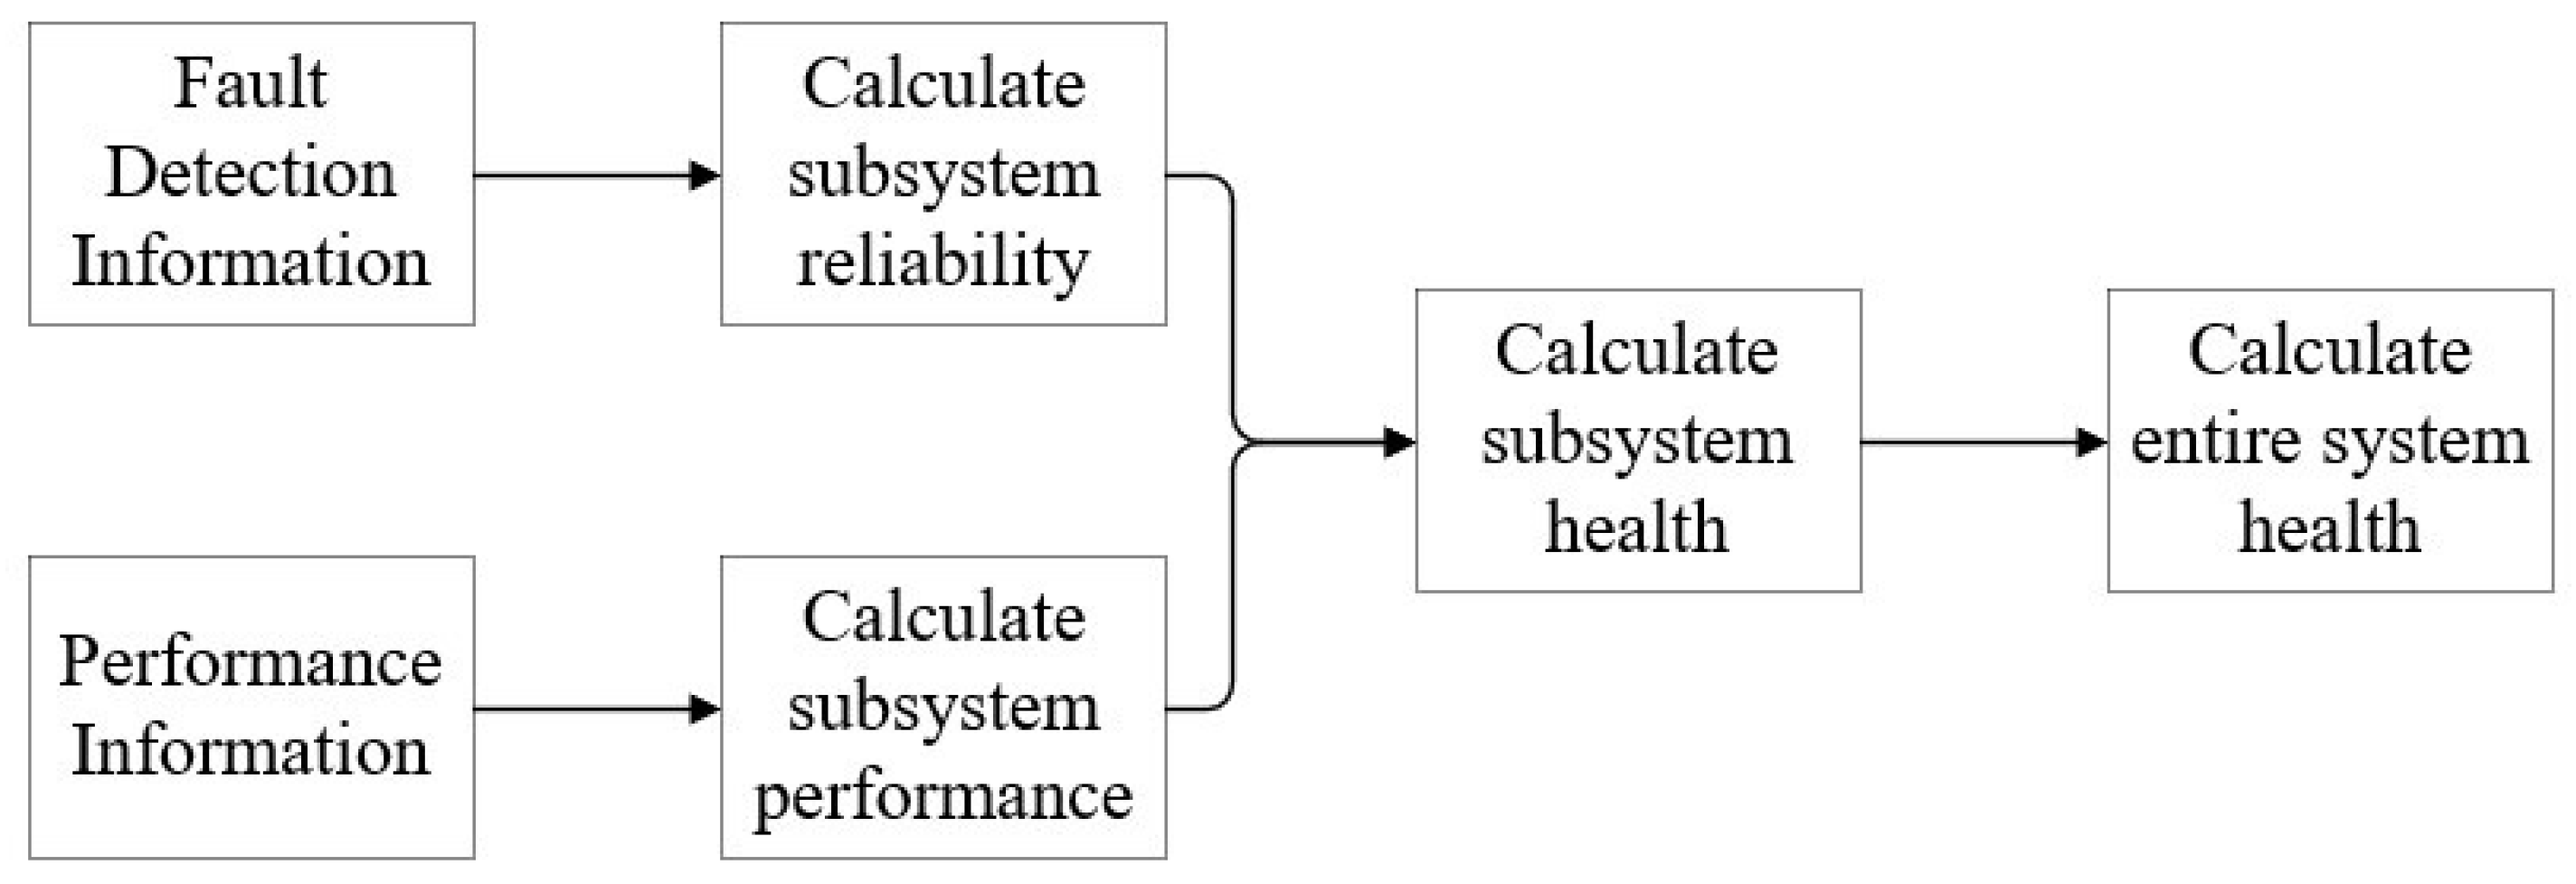
3.2. Health Evaluation Method
3.3. Health Evaluation of Subsystem
3.4. Evaluation of System Health
4. FTA for AUV
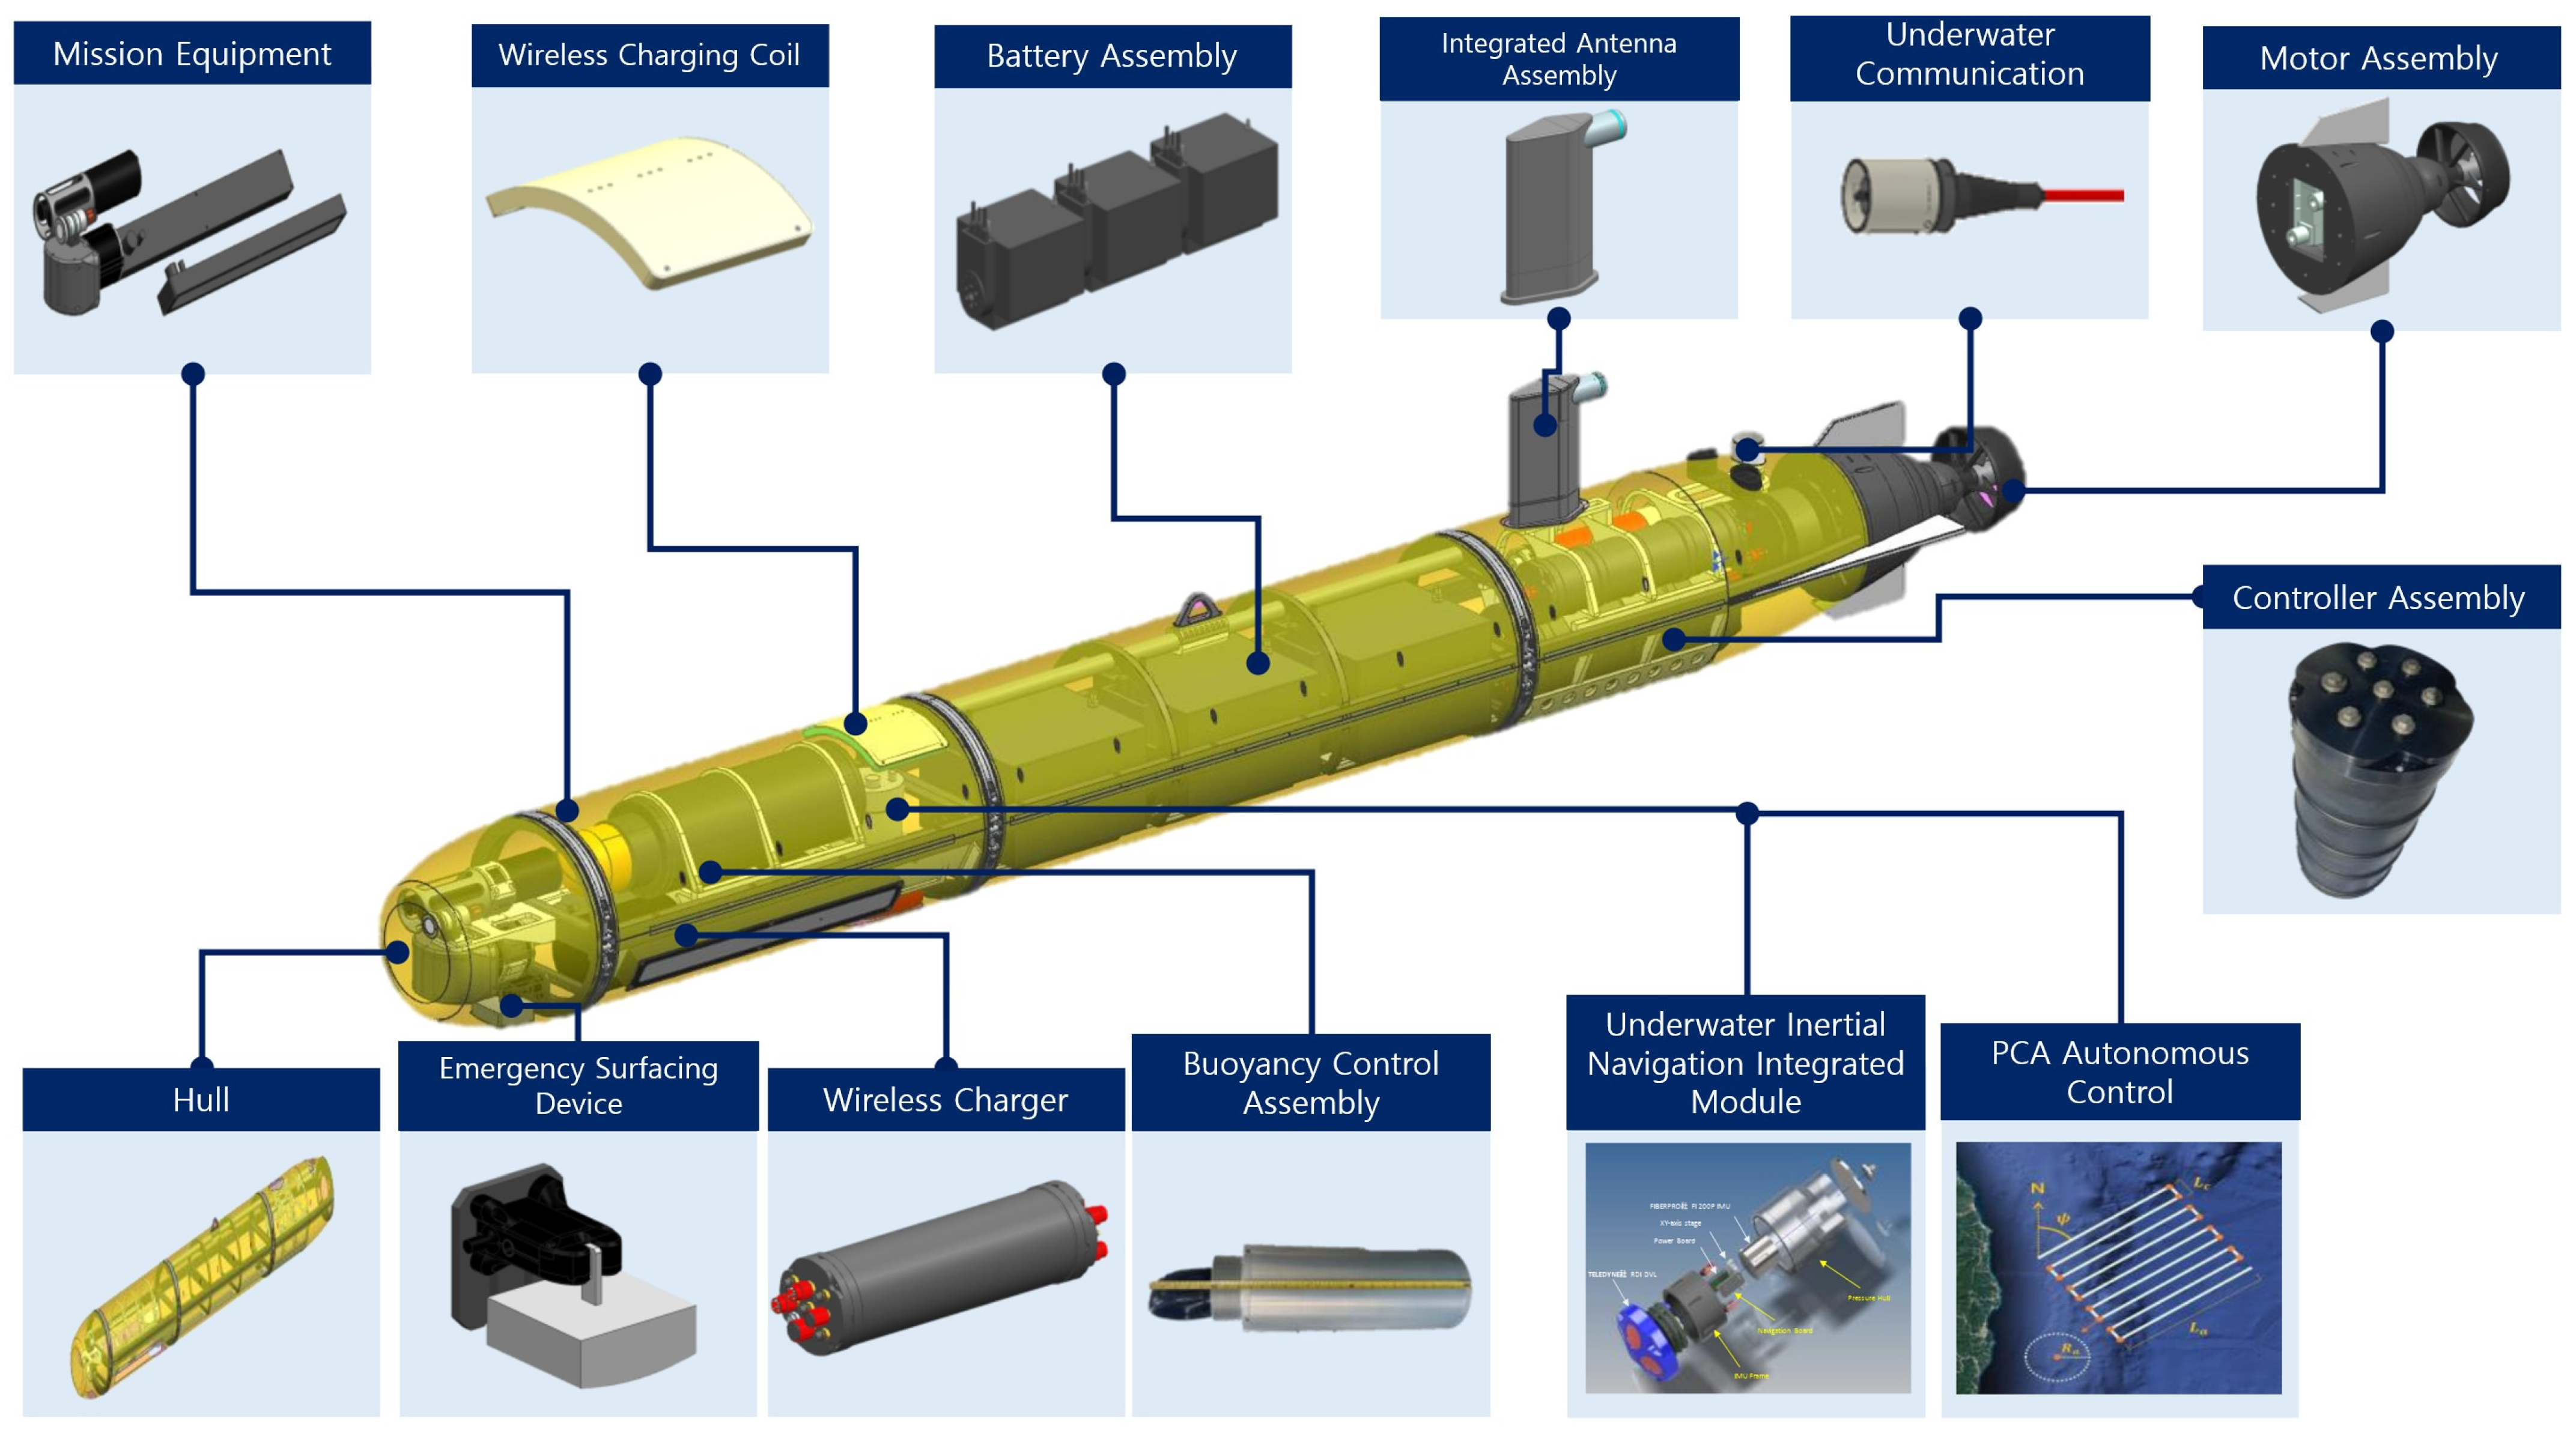
4.1. System Details
AUV Missions
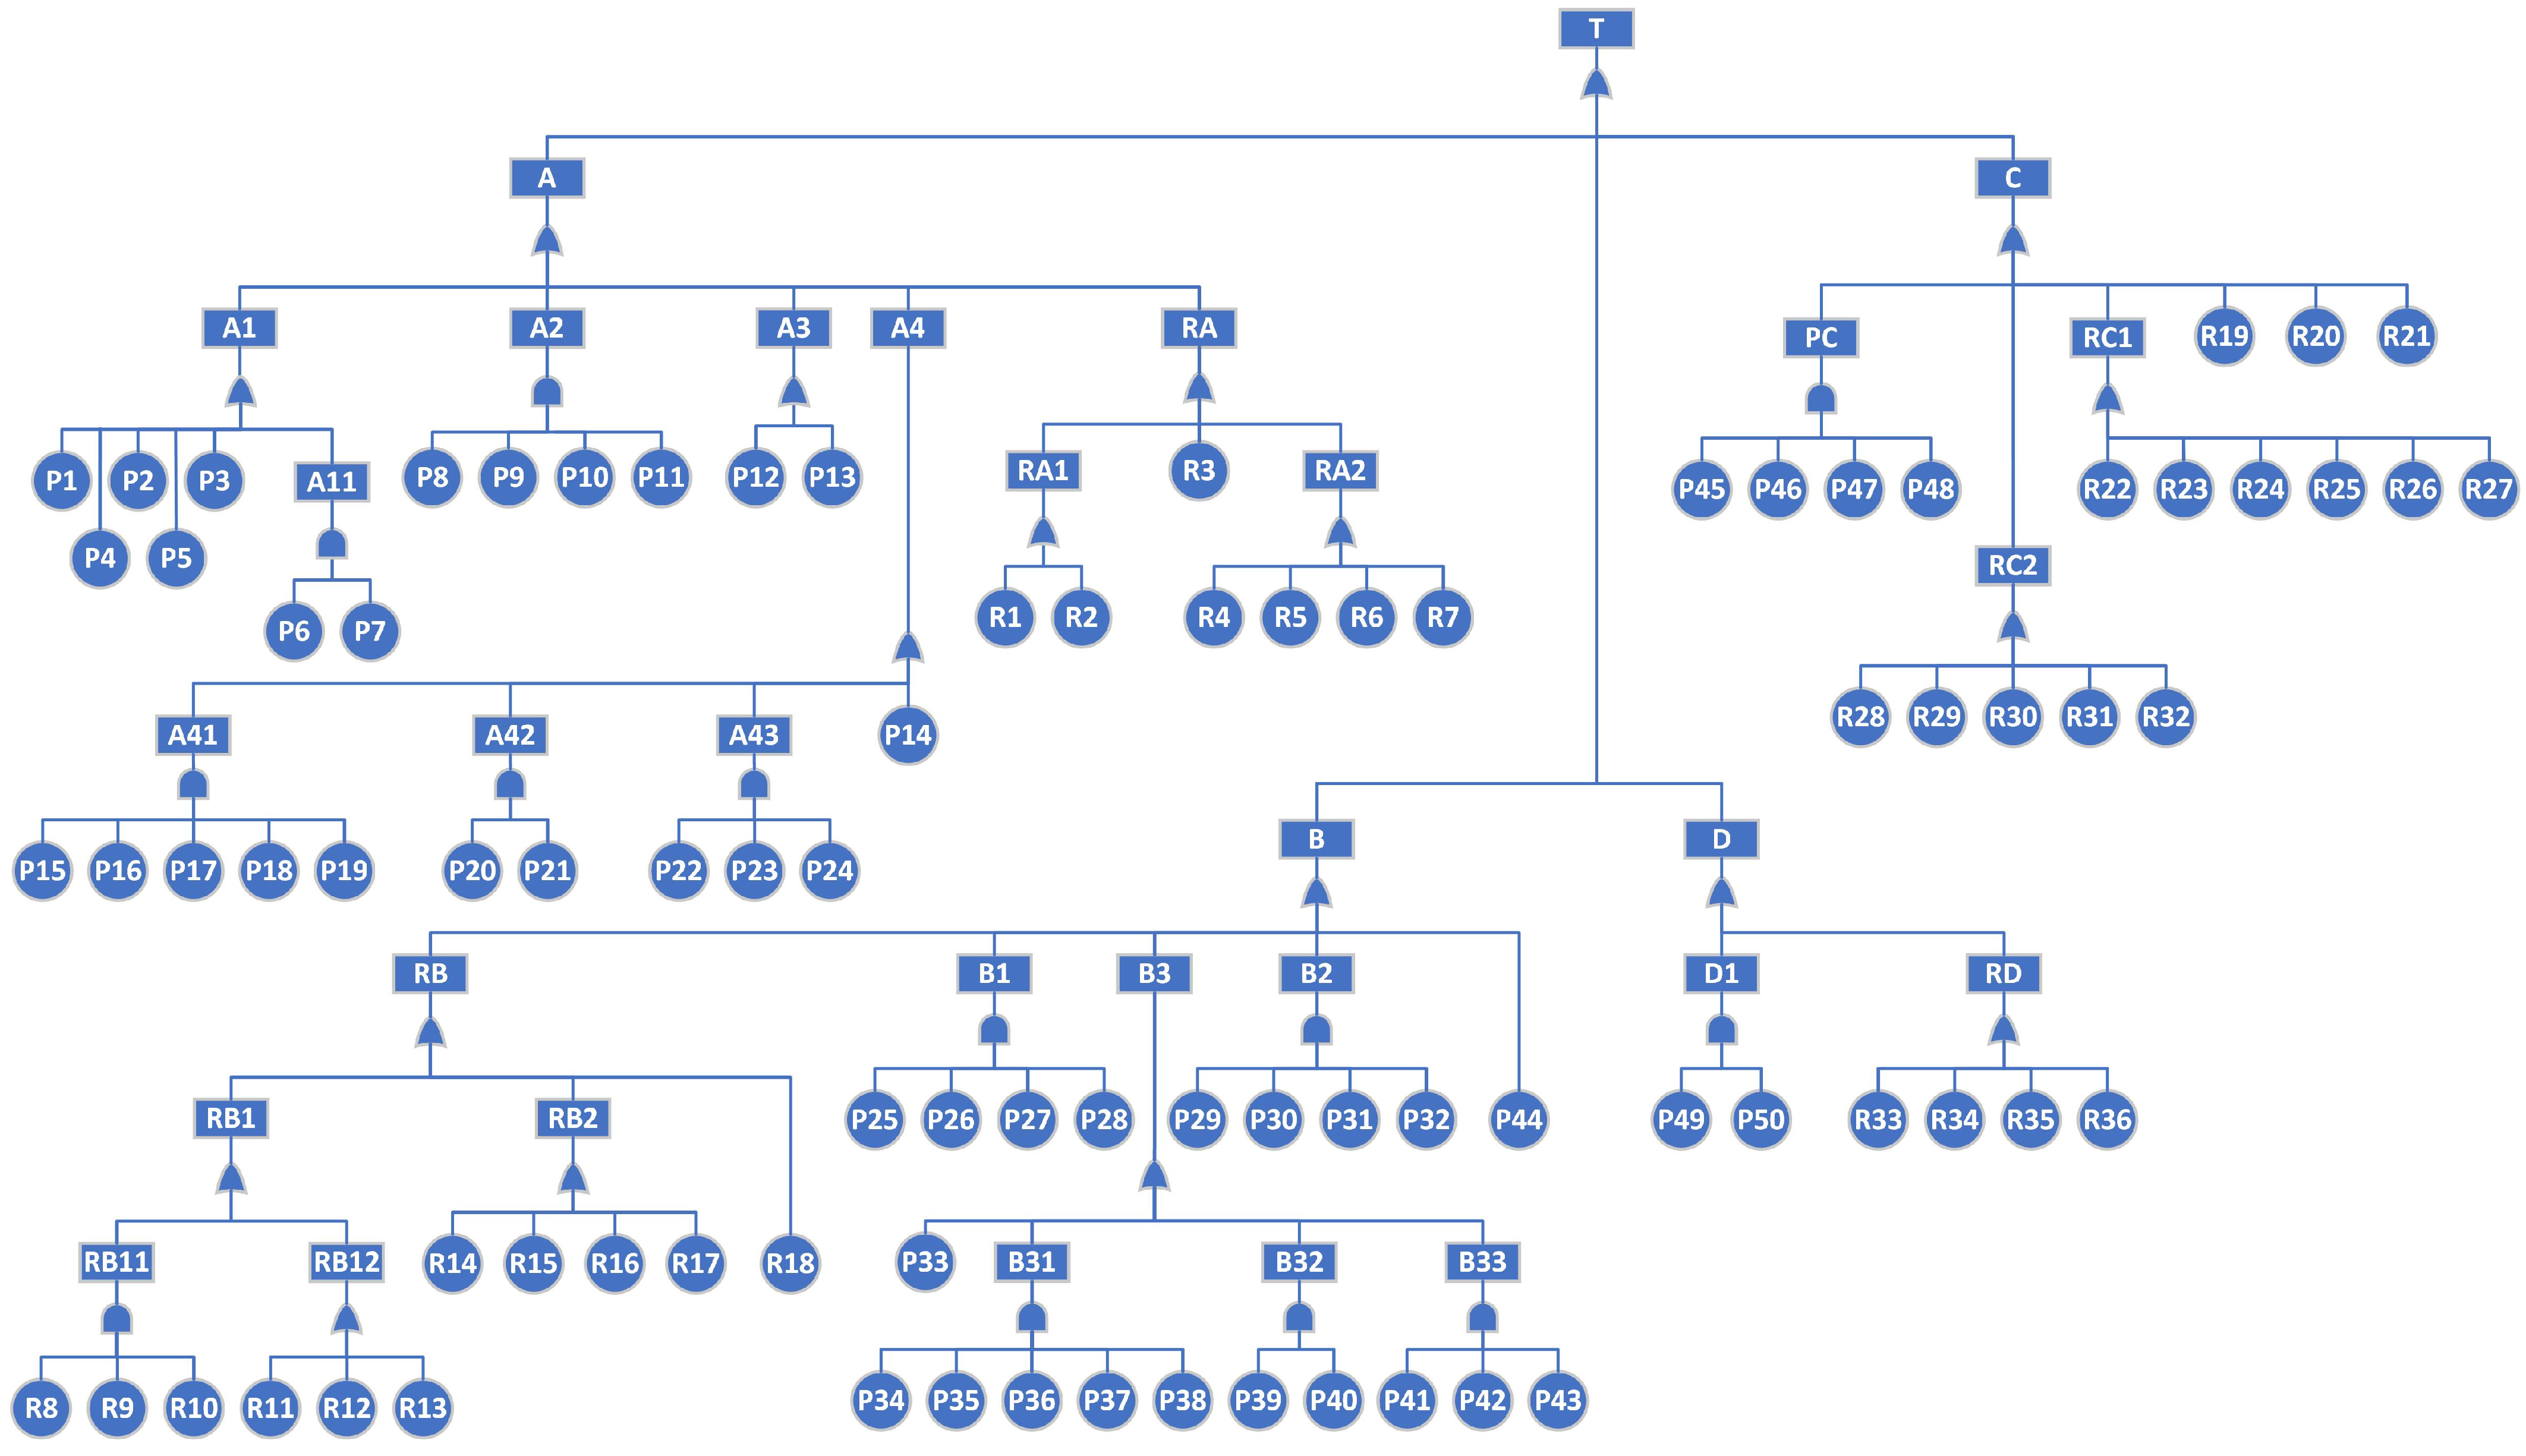
4.2. Fault Tree of AUV
4.2.1. Fault Tree for Driving Unit (Fault Tree A)
4.2.2. Fault Tree for Controller Unit (Fault Tree B)
4.2.3. Fault Tree for Mission Equipment Unit (Fault Tree C)
4.2.4. Fault Tree for Communication Unit (Fault Tree D)
5. Simulation
5.1. Simulation Setup
- Case 1: Normal operation.
- Case 2: Failure corresponding to priority 1.
- Case 3: Failure corresponding to priority 2.
- Case 4: Transient failure corresponding to priority 2.
5.2. Simulation Results
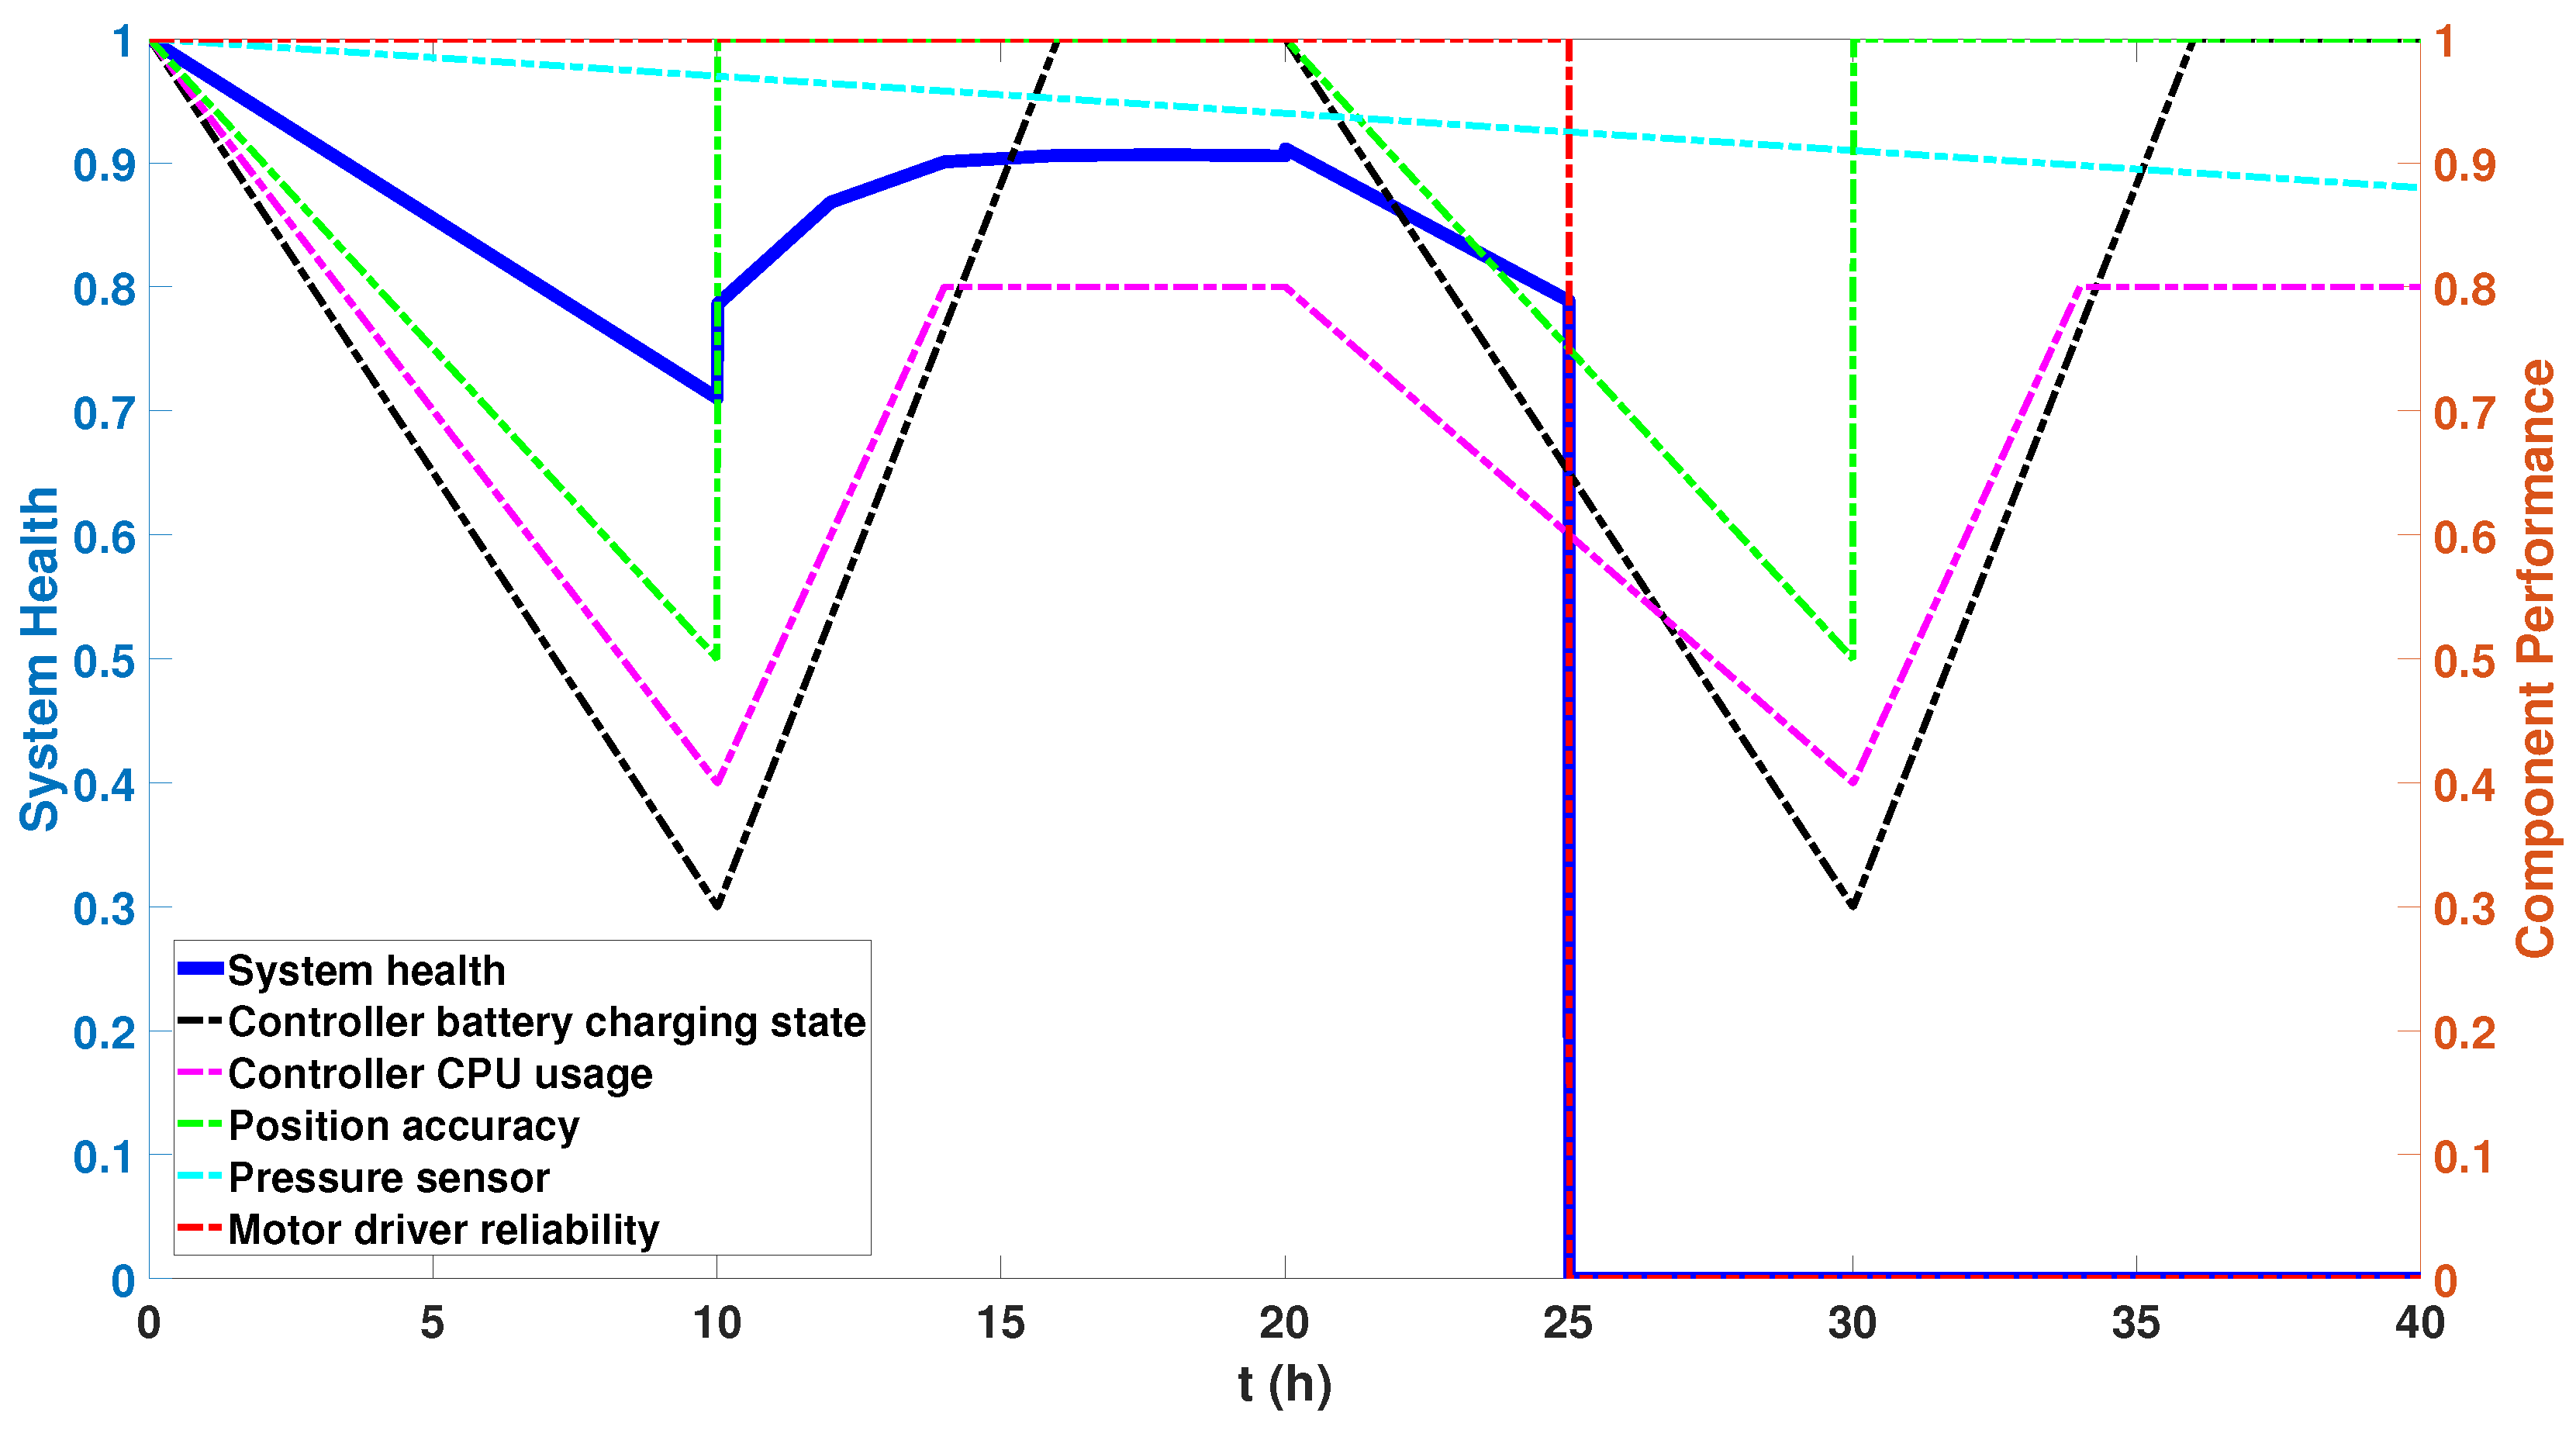
5.2.1. Case 1: Normal Operation
5.2.2. Case 2: Failure Corresponding to Priority 1
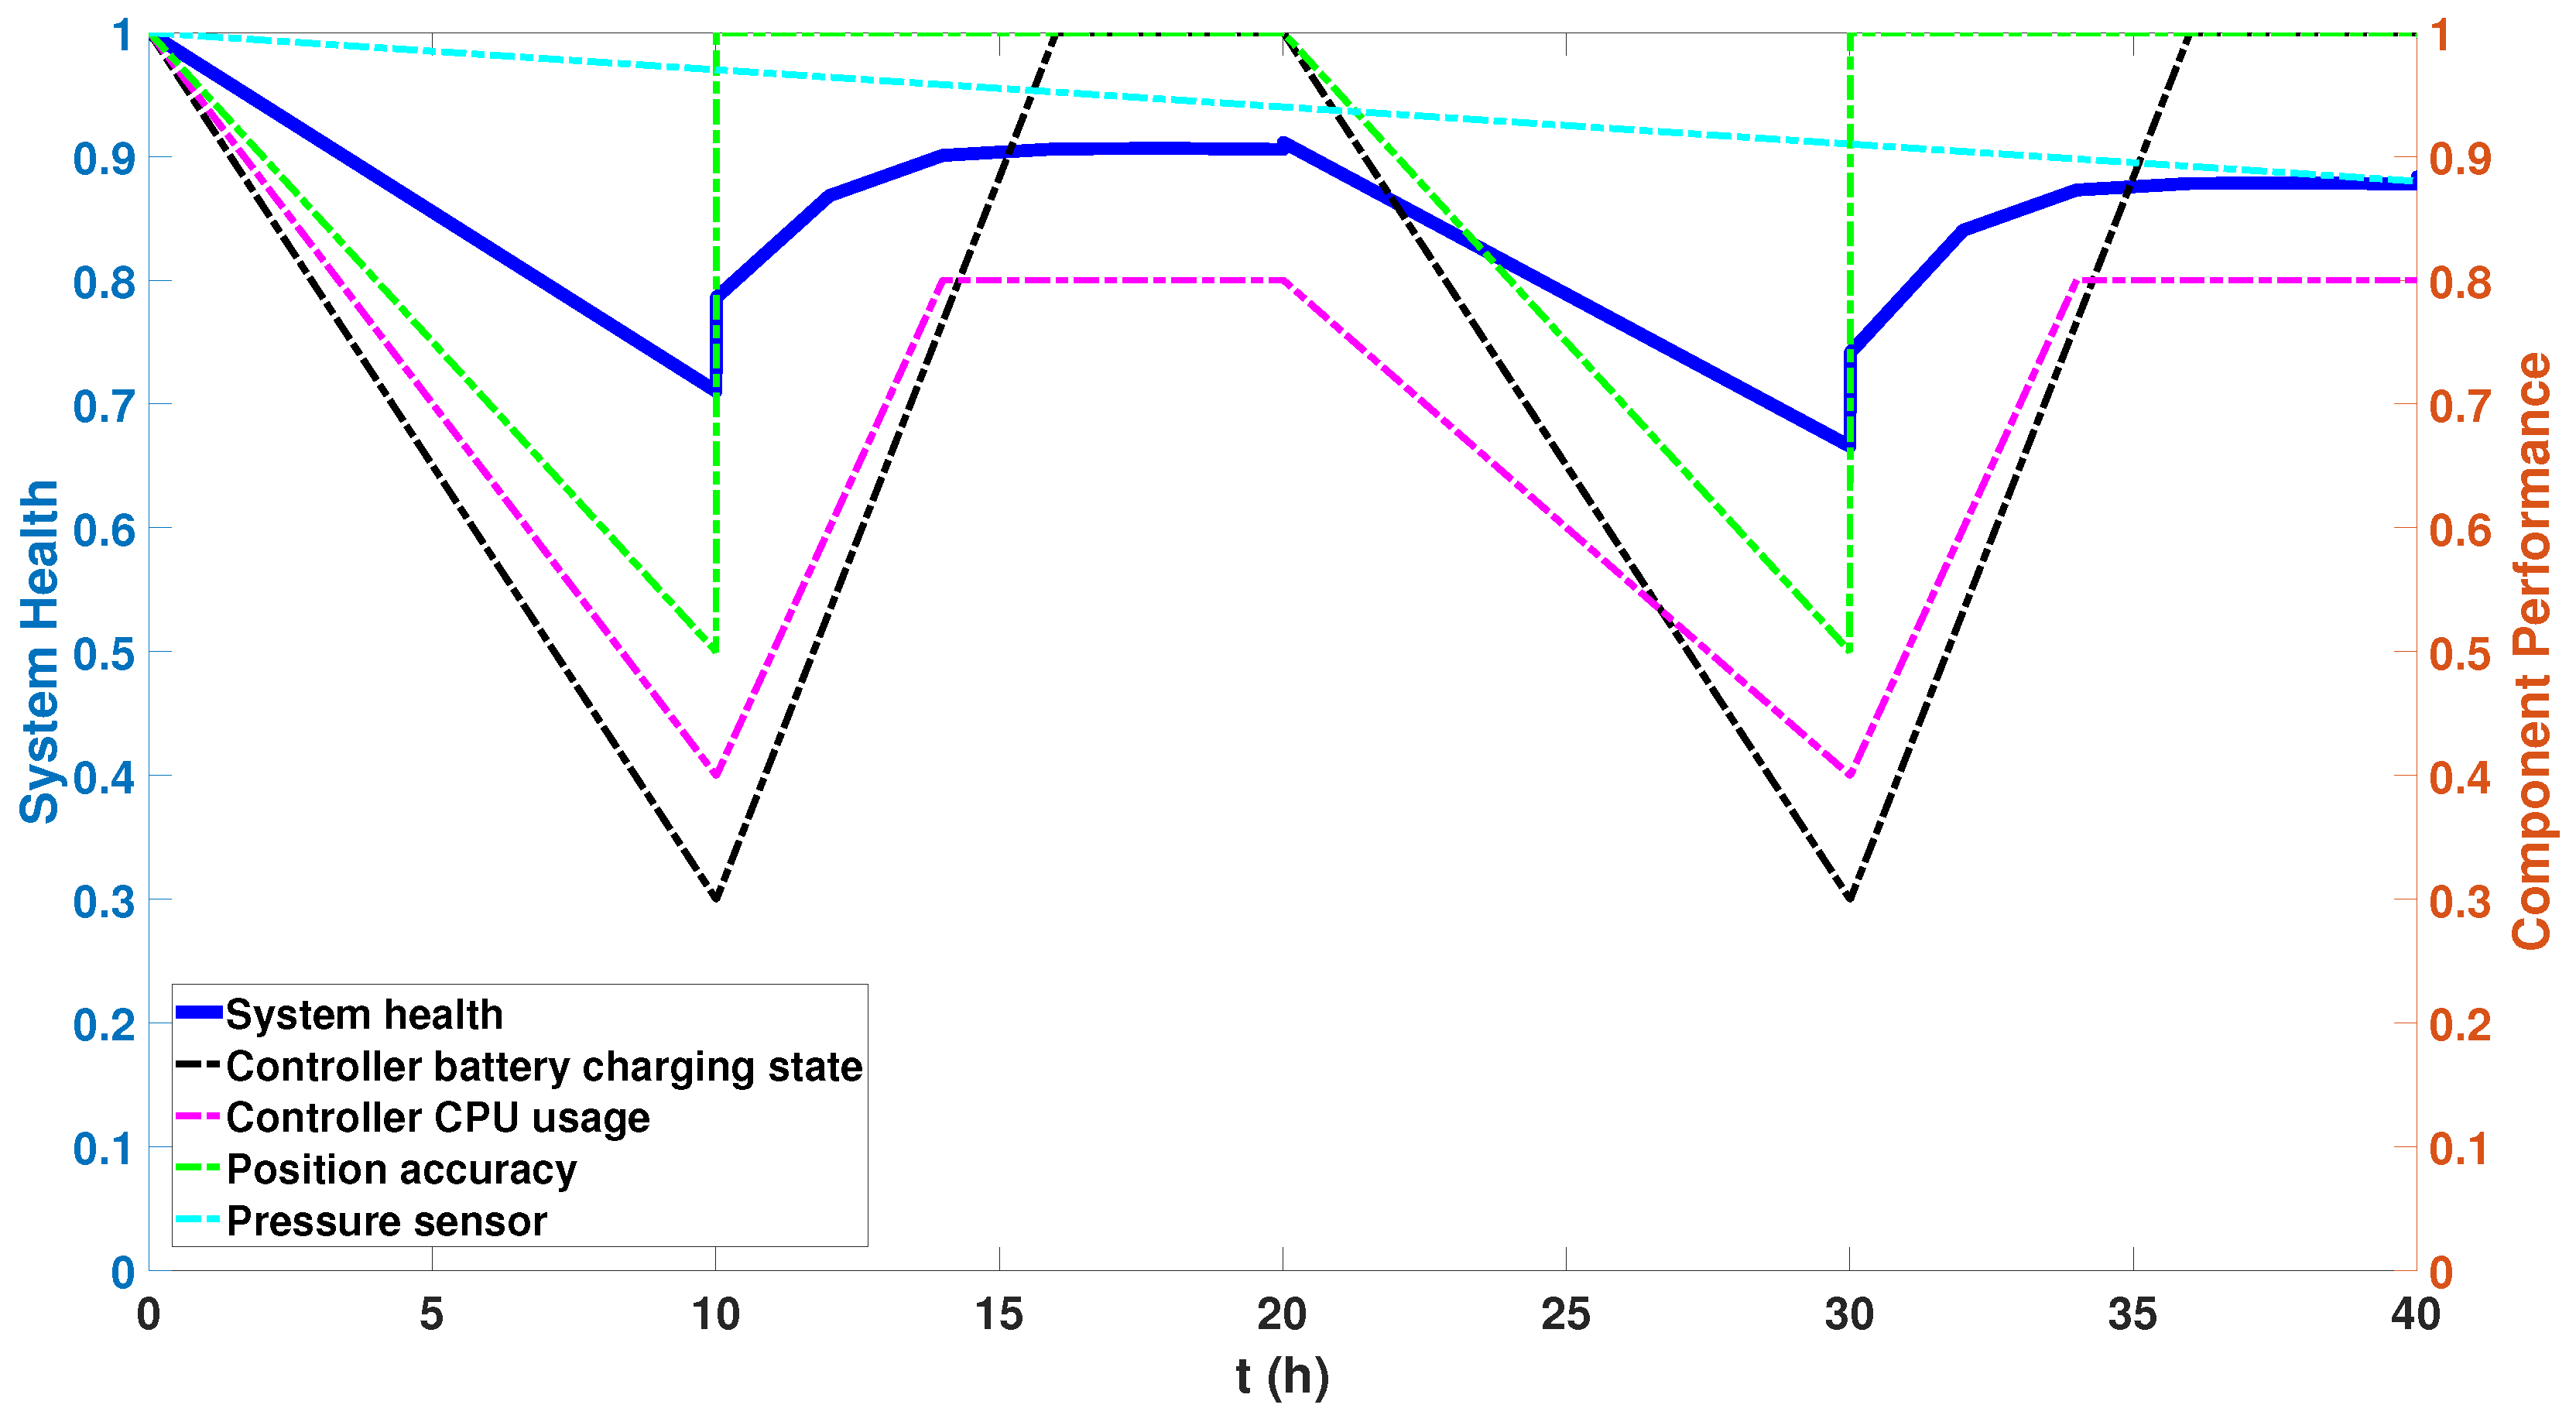
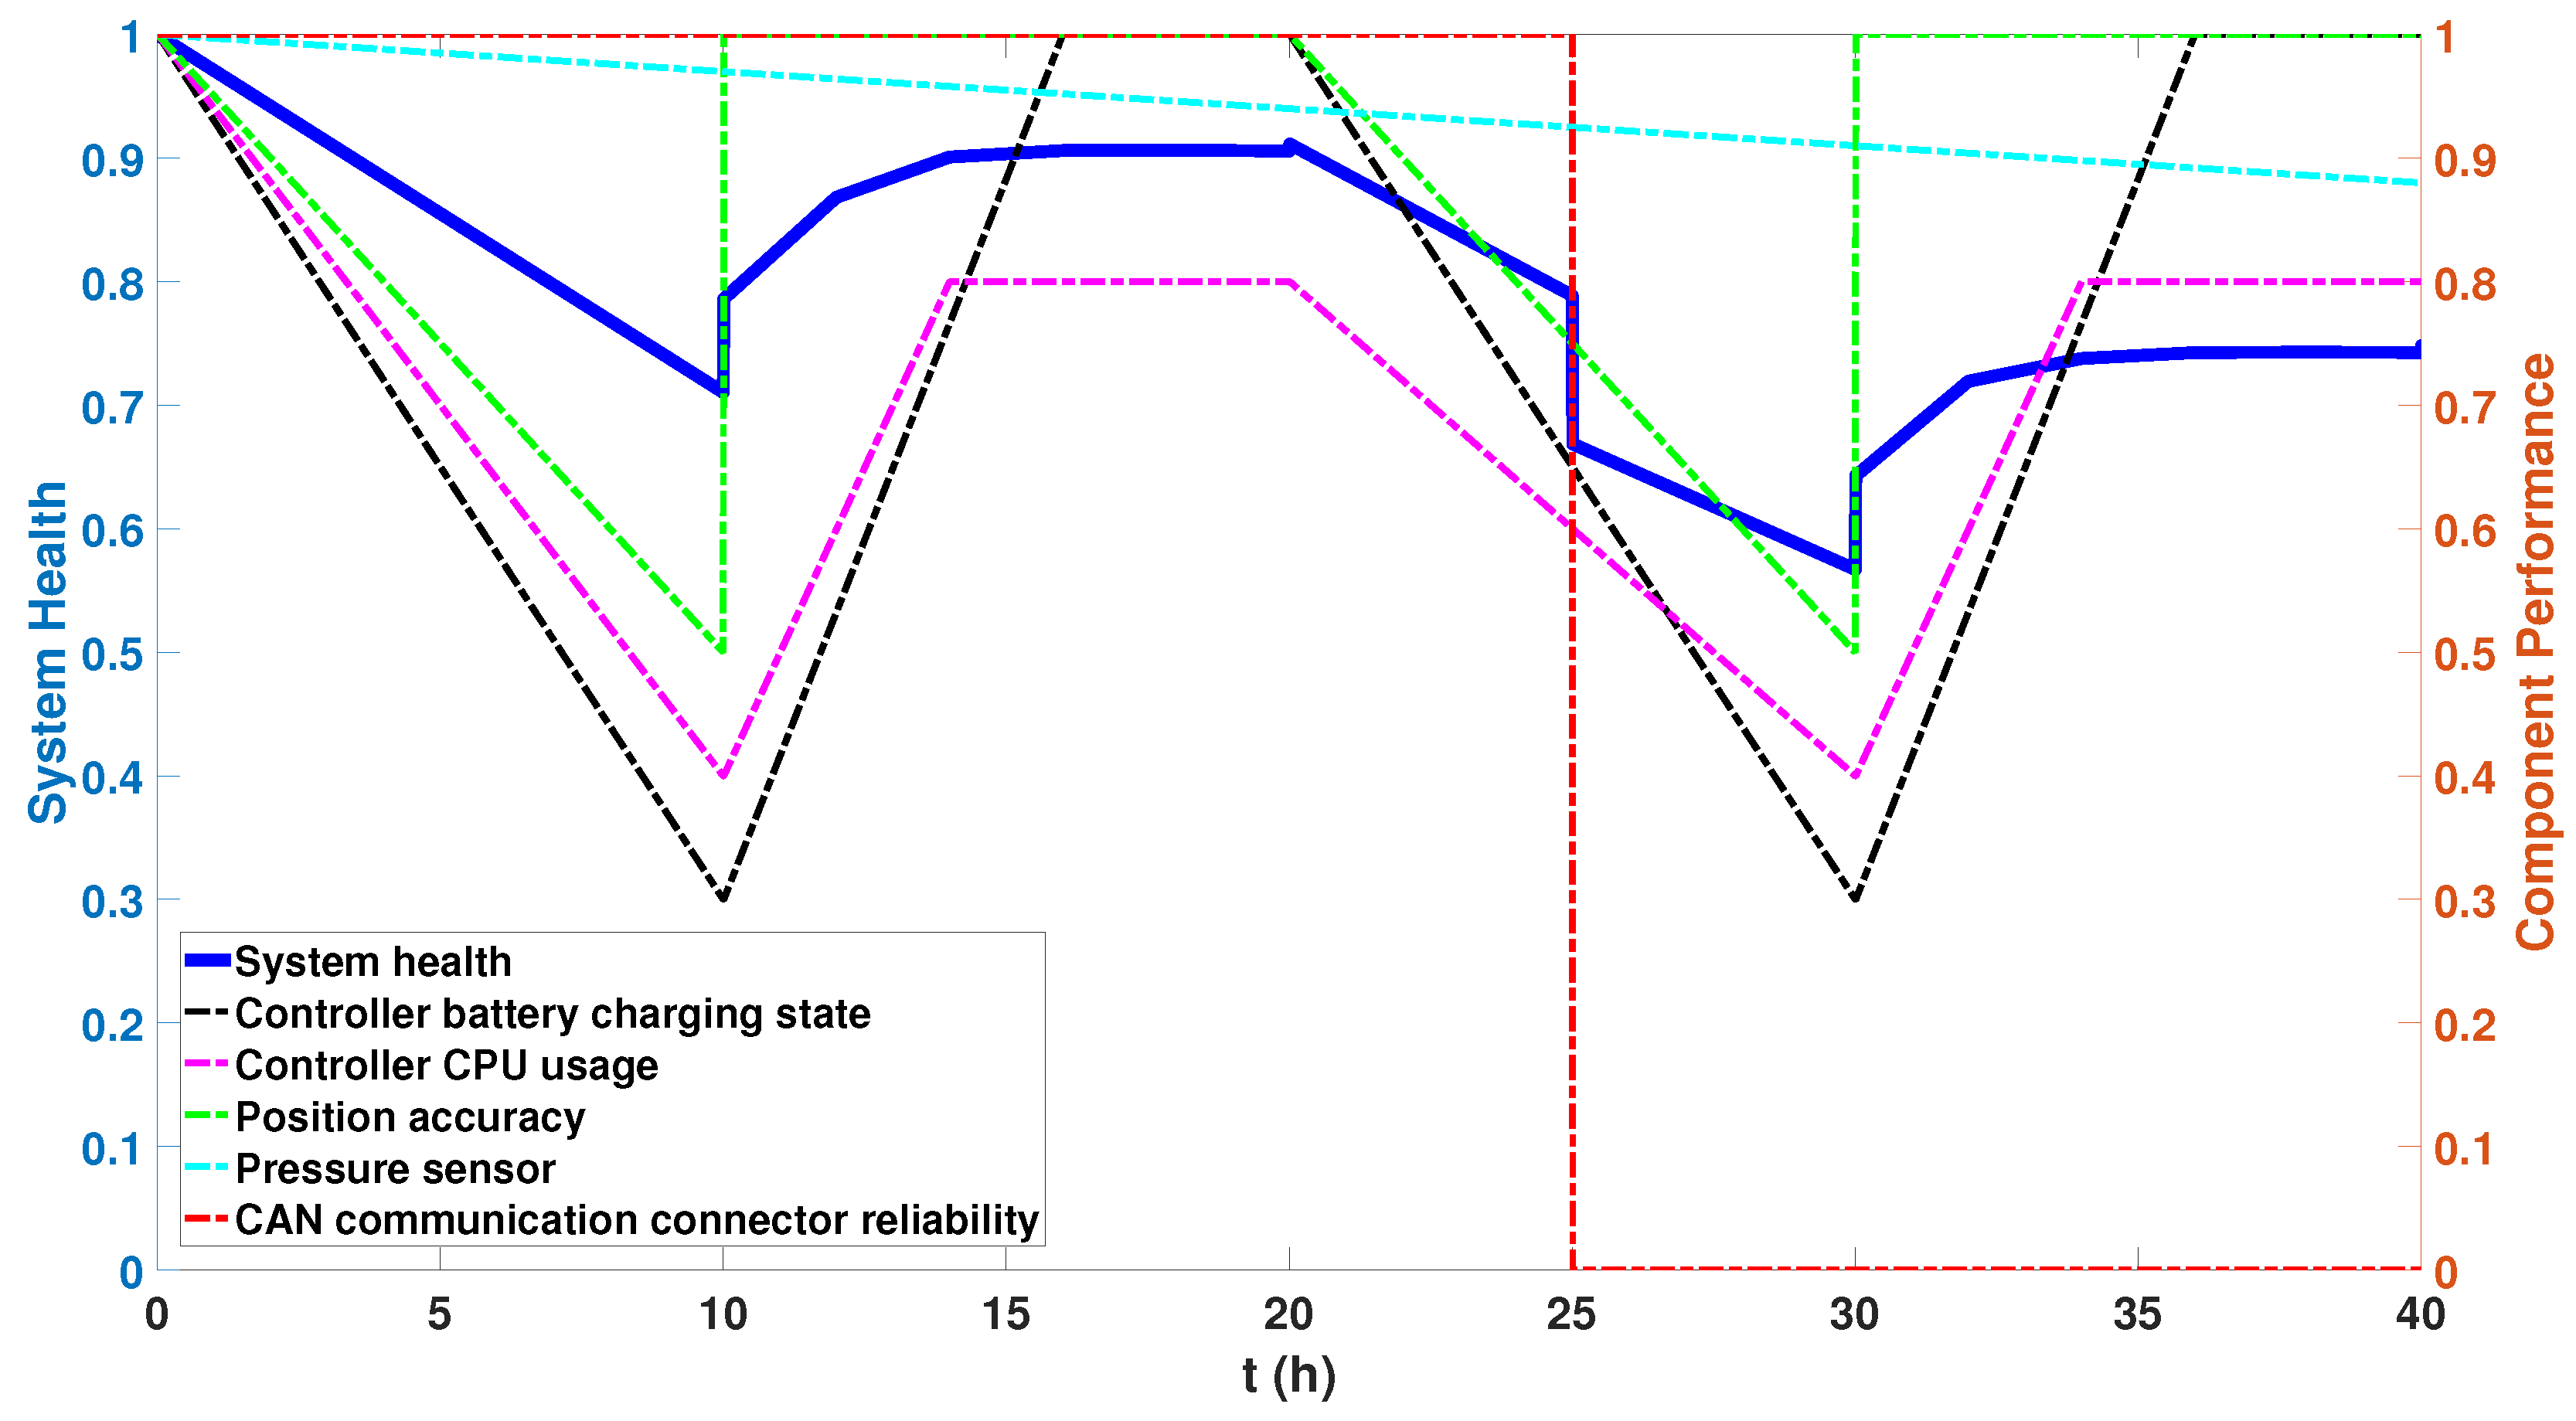
5.2.3. Case 3: Failure Corresponding to Priority 2
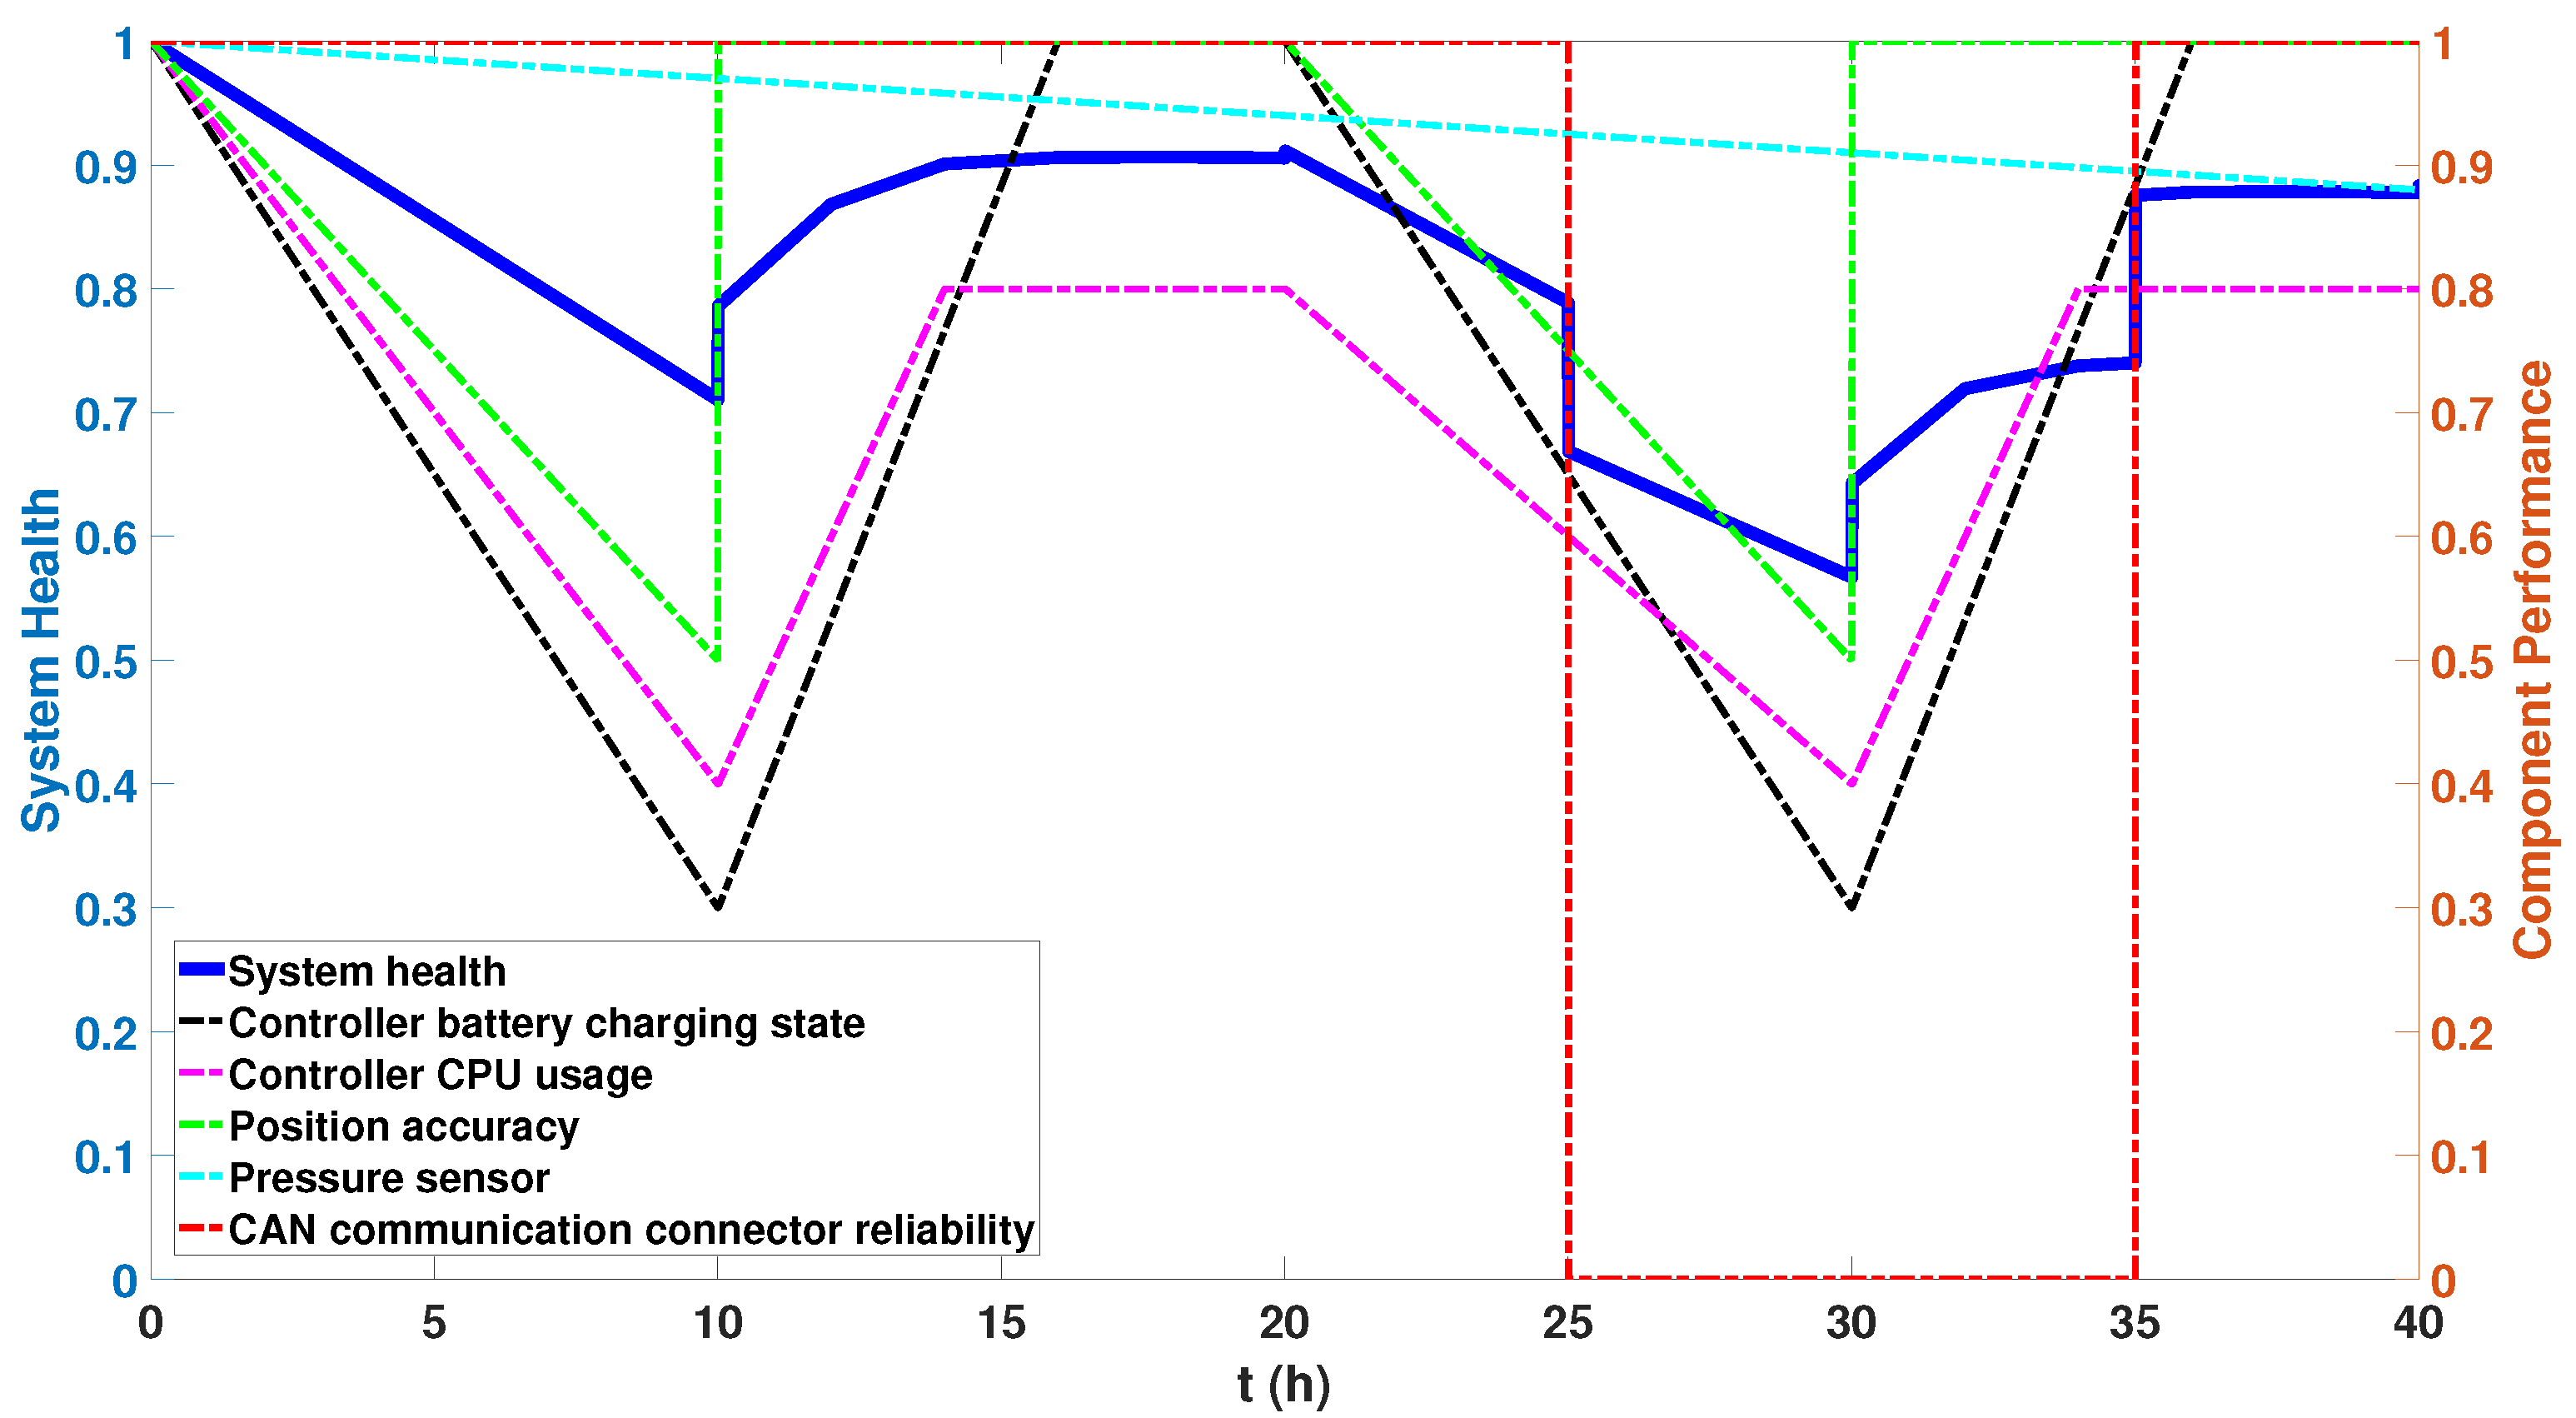
5.2.4. Case 4: Transient Failure Corresponding to Priority 2
6. Discussion
7. Conclusions
Author Contributions
Funding
Institutional Review Board Statement
Informed Consent Statement
Conflicts of Interest
Abbreviations
| ANN | Artificial Neural Network |
| AUV | Autonomous Underwater Vehicle |
| BDD | Binary Decision Diagram |
| BN | Bayesian Network |
| DBN | Dynamic Bayesian Network |
| DFT | Dynamic Fault Tree |
| DT | Decision Tree |
| FT | Fault Tree |
| FTA | Fault Tree Analysis |
| FFTA | Fuzzy Fault Tree Analysis |
| NN | Neural Network |
| PCM | Power Charging Module |
| PN | Petri Net |
| PTM | Power Transformation Module |
| RBD | Reliability Block Diagram |
| USV | Unmanned Surface Vehicle |
References
- Eng, Y.H.; Teo, K.M.; Chitre, M.; Ng, K.M. Online System Identification of an Autonomous Underwater Vehicle Via In-Field Experiments. IEEE J. Ocean. Eng. 2016, 41, 5–17. [Google Scholar] [CrossRef]
- Castaldi, P.; Menghini, M.; De Marchi, L.; Simani, S. Autonomous Underwater Vehicle Actuators Health Monitoring for Smart Harbour Application. In Proceedings of the 2020 fifth International Conference on Smart and Sustainable Technologies (SpliTech), Split, Croatia, 23–26 September 2020. [Google Scholar]
- Kim, E.J.; Kim, S.T.; Kim, Y.H.; Choi, M.J.; Viet, D.H.; Song, J.W. A Dual Fault Detection Algorithm Based on the Federated Kalman Filter to Enhance the Reliability of the Navigation System. J. Inst. Control Robot. Syst. 2020, 26, 136–143. [Google Scholar] [CrossRef]
- Kordestani, M.; Saif, M.; Orchard, M.E.; Razavi-Far, R.; Khorasani, K. Failure Prognosis and Applications—A Survey of Recent Literature. IEEE Trans. Reliab. 2021, 70, 728–748. [Google Scholar] [CrossRef]
- Maliuk, A.S.; Prosvirin, A.E.; Ahmad, Z.; Kim, C.H.; Kim, J.-M. Novel Bearing Fault Diagnosis Using Gaussian Mixture Model-Based Fault Band Selection. Sensors 2021, 21, 6579. [Google Scholar] [CrossRef] [PubMed]
- Glowacz, A.; Tadeusiewicz, R.; Legutko, S.; Caesarendra, W.; Irfan, M.; Liu, H.; Brumercik, F.; Gutten, M.; Sulowicz, M.; Daviu, J.A.A.; et al. Fault diagnosis of angle grinders and electric impact drills using acoustic signals. Appl. Acoust. 2021, 179, 108070. [Google Scholar] [CrossRef]
- Abubakar, S.; Ahmad, I.S.; Gambo, F.L.; Gadanya, M.S. A Rule-Based Expert System for Automobile Fault Diagnosis. Int. J. Perceptive Cogn. Comput. 2021, 7, 20–25. [Google Scholar]
- Xu, G.; Hou, D.; Qi, H.; Bo, L. High-speed train wheel set bearing fault diagnosis and prognostics: A new prognostic model based on extendable useful life. Mech. Syst. Signal Process. 2021, 146, 107050. [Google Scholar] [CrossRef]
- Encalada-Dávila, Á.; Puruncajas, B.; Tutivén, C.; Vidal, Y. Wind Turbine Main Bearing Fault Prognosis Based Solely on SCADA Data. Sensors 2021, 21, 2228. [Google Scholar] [CrossRef]
- Peng, J.; Xia, G.; Li, Y.; Song, Y.; Hao, M. Knowledge-based prognostics and health management of a pumping system under the linguistic decision-making context. Expert Syst. Appl. 2022, 209, 118379. [Google Scholar] [CrossRef]
- Catelani, M.; Ciani, L.; Galar, D.; Patrizi, G. Optimizing Maintenance Policies for a Yaw System Using Reliability-Centered Maintenance and Data-Driven Condition Monitoring. IEEE Trans. Instrum. Meas. 2020, 69, 6241–6249. [Google Scholar] [CrossRef]
- Zhou, D.; Li, Z.; Zhu, J.; Zhang, H.; Hou, L. State of health monitoring and remaining useful life prediction of lithium-ion batteries based on temporal convolutional network. IEEE Access 2020, 8, 53307–53320. [Google Scholar] [CrossRef]
- Wu, C.; Yue, J.; Liu, J.; Wang, L. An online proactive health monitoring method for output capacitors of vehicular auxiliary converter. IEEE J. Emerg. Sel. Top. Power Electron. 2021, 10, 1219–1231. [Google Scholar] [CrossRef]
- Asoodar, M.; Nahalparvari, M.; Danielsson, C.; Söderström, R.; Nee, H.P. Online health monitoring of DC-link capacitors in modular multilevel converters for FACTS and HVDC applications. IEEE Trans. Power Electron. 2012, 36, 13489–13503. [Google Scholar] [CrossRef]
- Zhou, Y.; Zheng, Y.; Tao, J.; Sun, M.; Sun, Q.; Dehmer, M.; Chen, Z. Servo Health Monitoring Based on Feature Learning via Deep Neural Network. IEEE Access 2021, 9, 160887–160896. [Google Scholar] [CrossRef]
- Martínez, J.; Gómez-Pau, A.; Riba, J.R.; Moreno-Eguilaz, M. On-line health condition monitoring of power connectors focused on predictive maintenance. IEEE Trans. Power Deliv. 2020, 36, 3611–3618. [Google Scholar] [CrossRef]
- Wang, D.; Peng, Z.; Xi, L. Theoretical and experimental investigations on spectral Lp/Lq norm ratio and spectral Gini index for rotating machine health monitoring. IEEE Trans. Autom. Sci. Eng. 2020, 18, 1074–1086. [Google Scholar] [CrossRef]
- Tai, A.T.; Meyer, J.F.; Avižienis, A. Software Performability: From Concepts to Applications; Springer: New York, NY, USA, 1996; pp. 9–13. [Google Scholar]
- Golnas, A. PV system reliability: An operator’s perspective. In Proceedings of the 2012 IEEE 38th Photovoltaic Specialists Conference (PVSC), Austin, TX, USA, 3–8 June 2012. [Google Scholar]
- Nikoaos, L. Fault Trees; ISTE LTD: London, UK, 2007; pp. 49–66. [Google Scholar]
- Ruijters, E.; Stoelinga, M. Fault tree analysis: A survey of the state-of-the-art in modeling, analysis and tools. Comput. Sci. Rev. 2015, 15, 29–62. [Google Scholar] [CrossRef] [Green Version]
- Shu, X.; Guo, Y.; Yang, W.; Wei, K.; Zhu, Y.; Zou, H. A Detailed Reliability Study of the Motor System in Pure Electric Vans by the Approach of Fault Tree Analysis. IEEE Access 2020, 8, 5295–5307. [Google Scholar] [CrossRef]
- Ikwan, F.; Sanders, D.; Hassan, M. Safety evaluation of leak in a storage tank using fault tree analysis and risk matrix analysis. J. Loss Prev. Process Ind. 2021, 73, 104597. [Google Scholar] [CrossRef]
- Márquez, F.P.G.; Ramírez, I.S.; Mohammadi-Ivatloo, B.; Marugán, A.P. Reliability Dynamic Analysis by Fault Trees and Binary Decision Diagrams. Information 2020, 11, 324. [Google Scholar] [CrossRef]
- Sarbayev, M.; Yang, M.; Wang, H. Risk assessment of process systems by mapping fault tree into artificial neural network. J. Loss Prev. Process Ind. 2019, 60, 203–212. [Google Scholar] [CrossRef]
- Khakzad, N.; Khan, F.; Amyotte, P. Dynamic safety analysis of process systems by mapping bow-tie into Bayesian network. Process Saf. Environ. Prot. 2013, 91, 46–53. [Google Scholar] [CrossRef]
- Khakzad, N.; Khan, F.; Amyotte, P. Safety analysis in process facilities: Comparison of fault tree and Bayesian network approaches. Reliab. Eng. Syst. Saf. 2011, 96, 925–932. [Google Scholar] [CrossRef]
- Zhifeng, L.; Wang, Z.; Ren, Y.; Yang, D.; Lv, X. A novel reliability estimation method of multi-state system based on structure learning algorithm. Eksploat. Niezawodn. Maint. Reliab. 2019, 22, 170–178. [Google Scholar]
- Jakkula, B.; Mandela, G.R.; Ch S N, M. Reliability block diagram (RBD) and fault tree analysis (FTA) approaches for estimation of system reliability and availability—A case study. Int. J. Qual. Reliab. Manag. 2021, 38, 682–703. [Google Scholar] [CrossRef]
- Zheng, Y.; Zhao, F.; Wang, Z. Fault diagnosis system of bridge crane equipment based on fault tree and Bayesian network. Int. J. Adv. Manuf. Technol. 2019, 105, 3605–3618. [Google Scholar] [CrossRef]
- Sun, B.; Li, Y.; Wang, Z.; Yang, D.; Ren, Y.; Feng, Q. A combined physics of failure and Bayesian network reliability analysis method for complex electronic systems. Process Saf. Environ. Prot. 2021, 148, 698–710. [Google Scholar] [CrossRef]
- Li, K.; Yi, R.; Ma, Z. Reliability analysis of dynamic reliability blocks through conversion into dynamic bayesian networks. In Proceedings of the 2016 IEEE International Conference on Industrial Engineering and Engineering Management (IEEM), Bali, Indonesia, 4–7 December 2016. [Google Scholar]
- Mi, J.; Li, Y.; Huang, H.Z.; Liu, Y.; Zhang, X. Reliability analysis of multi-state systems with common cause failure based on bayesian networks. In Proceedings of the 2012 International Conference on Quality, Reliability, Risk, Maintenance, and Safety Engineering, Chengdu, China, 15–18 June 2012. [Google Scholar]
- Montani, S.; Portinale, L.; Bobbio, A.; Codetta-Raiteri, D. Radyban: A tool for reliability analysis of dynamic fault trees through conversion into dynamic Bayesian networks. Reliab. Eng. Syst. Saf. 2008, 93, 922–932. [Google Scholar] [CrossRef]
- Jafari, M.J.; Pouyakian, M.; Khanteymoori, A.; Hanifi, S.M. Reliability evaluation of fire alarm systems using dynamic Bayesian networks and fuzzy fault tree analysis. J. Loss Prev. Process Ind. 2020, 67, 104229. [Google Scholar] [CrossRef]
- Márquez, F.P.G.; Pérez, J.M.P.; Marugán, A.P.; Papaelias, M. Identification of critical components of wind turbines using FTA over the time. Renew. Energy 2016, 87, 869–883. [Google Scholar] [CrossRef] [Green Version]
- Jiang, G.-J.; Li, Z.-Y.; Qiao, G.; Chen, H.-X.; Li, H.-B.; Sun, H.-H. Reliability Analysis of Dynamic Fault Tree Based on Binary Decision Diagrams for Explosive Vehicle. Math. Probl. Eng. 2021, 2021, 5559475. [Google Scholar] [CrossRef]
- Jiménez, A.A.; Muñoz, C.Q.G.; Márquez, F.P.G. Dirt and mud detection and diagnosis on a wind turbine blade employing guided waves and supervised learning classifiers. Reliab. Eng. Syst. Saf. 2019, 184, 2–12. [Google Scholar] [CrossRef]
- Muñoz, C.Q.G.; Márquez, F.P.G.; Lev, B.; Jimenez, A. New Pipe Notch Detection and Location Method for Short Distances employing Ultrasonic Guided Waves. Acta Acust. United Acust. 2017, 103, 772–781. [Google Scholar] [CrossRef] [Green Version]
- Huang, T.; Huang, H.-Z.; Li, Y.-F.; Shi, L.; Qian, H.-M. 3-Reliability analysis of solar array drive assembly by dynamic fault tree. In Advances in Reliability Science, Safety and Reliability Modeling and its Applications; Elsevier: Amsterdam, The Netherlands, 2021; pp. 31–42. [Google Scholar]
- Fazlollahtabar, H.; Niaki, S.T.A. Integration of fault tree analysis, reliability block diagram and hazard decision tree for industrial robot reliability evaluation. Ind. Robot. 2017, 44, 754–764. [Google Scholar] [CrossRef]
- Abbasi, F.; Allahviranloo, T. Estimation of Failure Using Fault Tree Analysis Based on New Operations on LR-Type Flat Fuzzy Numbers. New Math. Nat. Comput. 2021, 17, 153–174. [Google Scholar] [CrossRef]
- Kabir, S.; Taleb-Berrouane, M.; Papadopoulos, Y. Dynamic reliability assessment of flare systems by combining fault tree analysis and Bayesian networks. Energy Sources Part Recover. Util. Environ. Eff. 2019, 1–18. [Google Scholar] [CrossRef]
- Wang, W.; He, X.; Li, Y.; Shuai, J. Risk analysis on corrosion of submarine oil and gas pipelines based on hybrid Bayesian network. Ocean. Eng. 2022, 260, 111957. [Google Scholar] [CrossRef]
- Ferdous, R.; Khan, F.; Sadiq, R.; Amyotte, P.; Veitch, B. Fault and Event Tree Analyses for Process Systems Risk Analysis: Uncertainty Handling Formulations. Risk Anal. 2011, 31, 86–107. [Google Scholar] [CrossRef] [Green Version]
- Abdelgawad, M.; Fayek, A.R. Comprehensive Hybrid Framework for Risk Analysis in the Construction Industry Using Combined Failure Mode and Effect Analysis, Fault Trees, Event Trees, and Fuzzy Logic. J. Constr. Eng. Manag. 2012, 138, 642–651. [Google Scholar] [CrossRef]
- Hyun, K.C.; Min, S.Y.; Choi, H.S.; Park, J.J.; Lee, I.M. Risk analysis using fault-tree analysis (FTA) and analytic hierarchy process (AHP) applicable to shield TBM tunnels. Tunn. Undergr. Space Technol. 2015, 49, 121–129. [Google Scholar] [CrossRef]
- Purba, J.H.; Lu, J.; Ruan, D.; Zhang, G. A Hybrid Approach for Fault Tree Analysis Combining Probabilistic Method with Fuzzy Numbers. Artificial Intell. Soft Comput. 2010, 6113, 194–201. [Google Scholar]
- Soltanali, H.; Khojastehpour, M.; Farinha, J.T.; Pais, J.E.d.A.e. An Integrated Fuzzy Fault Tree Model with Bayesian Network-Based Maintenance Optimization of Complex Equipment in Automotive Manufacturing. Energies 2021, 14, 7758. [Google Scholar] [CrossRef]
- Zhao, C.; Yip, T.L.; Wu, B.; Lyu, J. Use of fuzzy fault tree analysis and Bayesian network for occurrence likelihood estimation of navigational accidents in the Qinzhou Port. Ocean. Eng. 2022, 263, 112381. [Google Scholar] [CrossRef]
- Yan, R.; Jackson, L.; Dunnett, S. Automated guided vehicle mission reliability modelling using a combined fault tree and Petri net approach. Int. J. Adv. Manuf. Technol. 2017, 92, 1825–1837. [Google Scholar] [CrossRef] [Green Version]
- Kabir, S.; Aslansefat, K.; Sorokos, I.; Papadopoulos, Y.; Konur, S. A Hybrid Modular Approach for Dynamic Fault Tree Analysis. IEEE Access 2020, 8, 97175–97188. [Google Scholar] [CrossRef]
- Chang, Y.; Brito, M. On the Reliability of Experts’ Assessments for Autonomous Underwater Vehicle Risk of Loss Prediction: Are Optimists better than Pessimists? In Proceedings of the Probabilistic Safety Assessment and Management (PSAM), Los Angeles, CA, USA, 16–21 September 2018. [Google Scholar]
- Wang, X.; Huang, N.; Chen, W.; Li, R. A new method for evaluating the performance reliability of communications network. In Proceedings of the 2010 International Conference on Information, Networking and Automation (ICINA), Kunming, China, 18–19 October 2010. [Google Scholar]
- Department of Defense. MIL-HDBK-217F, Military Handbook: Reliability Prediction of Electronic Equipment; Department of Defense: Arlington, VI, USA, 1991.
- Bian, X.; Mou, C.; Yan, Z.; Xu, J. Reliability analysis of AUV based on fuzzy fault tree. In Proceedings of the International Conference on Quality, Reliability, Risk, Maintenance, and Safety Engineering (QR2MSE), Chengdu, China, 9–12 August 2009. [Google Scholar]
- Hu, Z.; Yang, Y.; Lin, Y. Failure analysis for the mechanical system of autonomous underwater vehicles. In Proceedings of the International Conference on Quality, Reliability, Risk, Maintenance, and Safety Engineering (QR2MSE), Chengdu, China, 15–18 July 2013. [Google Scholar]
- Aslansefat, K.; Latif-Shabgahi, G.; Kamarlouei, M. A strategy for reliability evaluation and fault diagnosis of Autonomous Underwater Gliding Robot based on its Fault Tree. Int. J. Adv. Sci. Eng. Technol. 2014, 2, 83–89. [Google Scholar]
- Gao, Z.; Liu, X. An Overview on Fault Diagnosis, Prognosis and Resilient Control for Wind Turbine Systems. Processes 2021, 9, 300. [Google Scholar] [CrossRef]


| Event | Meaning | Event | Meaning | Event | Meaning | Event | Meaning |
|---|---|---|---|---|---|---|---|
| P1 | Motor RPM | P14 | Power supply temperature | P27 | HDD Capacity | P40 | Controller PTM current |
| P2 | Motor voltage | P15 | Controller battery voltage | P28 | CPU temperature | P41 | Controller PCM voltage |
| P3 | Motor current | P16 | Controller battery temperature | P29 | CPU usage | P42 | Controller PCM current |
| P4 | Controller voltage | P17 | Controller battery charging state | P30 | Memory usage | P43 | Charging time |
| P5 | Controller temperature | P18 | Charging current | P31 | HDD capacity | P44 | Pressure sensor |
| P6 | Motor horizontal direction control | P19 | Discharging current | P32 | CPU temperature | P45 | Conductivity |
| P7 | Motor vertical direction control | P20 | Motor power transformation module (PTM) voltage | P33 | Temperature | P46 | Temperature |
| P8 | Hydraulic pump motor ouput current | P21 | Motor PTM current | P34 | Actuator battery voltage | P47 | Pressure sensor |
| P9 | Throttle valve motor output current | P22 | Motor power charging module (PCM) voltage | P35 | Actuator battery temperature | P48 | Underwater sound velocity |
| P10 | Pressure sensor | P23 | Motor PCM current | P36 | Actuator battery charging state | P49 | Position accuracy |
| P11 | LVDT | P24 | Charging time | P37 | Carging current | P50 | Depth accuracy |
| P12 | Battery voltage | P25 | CPU usage | P38 | Discharging current | ||
| P13 | Driver status check current | P26 | Memory usage | P39 | Controller PTM voltage |
| Event | Meaning | Failure Rate () | Event | Meaning | Failure Rate () | Event | Meaning | Failure Rate () |
|---|---|---|---|---|---|---|---|---|
| R1 | Leak detection | 13.59 | R13 | CAN communication connector | 3.624 | R25 | Pressure sensor failure | 1 |
| R2 | Motor driver | 1.8 | R14 | Leakage | 1 | R26 | Gyroscope sensor failure | 1 |
| R3 | SOL | 0.1 | R15 | Actuator battery | 0.24 | R27 | Accelerometer failure | 1 |
| R4 | Power supply leakage | 1 | R16 | Controller PTM | 8.6 | R28 | Highest temperature warning | 1 |
| R5 | Controller battery | 0.24 | R17 | Controller PCM | 8.6 | R29 | Lowest temperature warning | 1 |
| R6 | Motor PTM | 8.6 | R18 | Depth gauge | 0.3 | R30 | Presurre out of range | 1 |
| R7 | Motor PCM | 8.6 | R19 | SSS transducer | 1.5 | R31 | Gyroscope out of range | 1 |
| R8 | WIFI/LTE communication modem | 3.624 | R20 | Forward monitoring MBS | 1.5 | R32 | Accelerometer out of range | 1 |
| R9 | Satellite communication modem | 5 | R21 | Underwater camera | 1 | R33 | Underwater ultrasonic communication transducer | 3.624 |
| R10 | RF communication modem | 3.624 | R22 | GPS antenna | 1 | R34 | Underwater wireless optical transmitter | 0.24 |
| R11 | RS232 communication connector | 3.624 | R23 | GPS failure | 1 | R35 | Integrated antenna assembly | 0.24 |
| R12 | Ethernet communication connector | 3.624 | R24 | DVL failure | 0.1 | R36 | Underwater location tracker | 14 |
| Approaches | Advantages | Disadvantages |
|---|---|---|
| Fault diagnosis and prognosis [59] |
|
|
| Proposed method |
|
|
Publisher’s Note: MDPI stays neutral with regard to jurisdictional claims in published maps and institutional affiliations. |
© 2022 by the authors. Licensee MDPI, Basel, Switzerland. This article is an open access article distributed under the terms and conditions of the Creative Commons Attribution (CC BY) license (https://creativecommons.org/licenses/by/4.0/).
Share and Cite
Byun, S.; Papaelias, M.; Márquez, F.P.G.; Lee, D. Fault-Tree-Analysis-Based Health Monitoring for Autonomous Underwater Vehicle. J. Mar. Sci. Eng. 2022, 10, 1855. https://doi.org/10.3390/jmse10121855
Byun S, Papaelias M, Márquez FPG, Lee D. Fault-Tree-Analysis-Based Health Monitoring for Autonomous Underwater Vehicle. Journal of Marine Science and Engineering. 2022; 10(12):1855. https://doi.org/10.3390/jmse10121855
Chicago/Turabian StyleByun, Sungil, Mayorkinos Papaelias, Fausto Pedro García Márquez, and Dongik Lee. 2022. "Fault-Tree-Analysis-Based Health Monitoring for Autonomous Underwater Vehicle" Journal of Marine Science and Engineering 10, no. 12: 1855. https://doi.org/10.3390/jmse10121855