Article

Application of Probabilistic Approach to Investigate Influence of Details in Time History of Temperature Changes on the HCF Life of Integrated Bridge Steel Piles Installed on Water

by
Hamid Abdollahnia
1,
Mohammad Hadi Alizadeh Elizei
1 and
Kazem Reza Kashyzadeh
2,*
1
Department of Civil Engineering, Roudehen Branch, Islamic Azad University, Roudehen 3973188981, Iran
2
Department of Transport, Academy of Engineering, Peoples’ Friendship University of Russia (RUDN University), 6 Miklukho-Maklaya Street, 117198 Moscow, Russia
*
Author to whom correspondence should be addressed.
J. Mar. Sci. Eng. 2022, 10(12), 1802; https://doi.org/10.3390/jmse10121802
Submission received: 2 October 2022 / Revised: 15 November 2022 / Accepted: 18 November 2022 / Published: 22 November 2022
(This article belongs to the Special Issue Failure Analysis of Marine Structure)

Abstract

:
This research estimates the high-cycle fatigue (HCF) life of integrated concrete bridge installed on water due to temperature changes. To this end, CATIA software was used to geometrically model of a real-scale bridge. Next, thermal–structural coupling analysis was performed by finite element (FE) simulation in ANSYS WORKBENCH software. The comparison technique with experimental data was used to validate the simulation. Afterward, thermal analysis was performed due to air temperature changes in different modes, including the average monthly temperature changes (large variations) as well as the maximum and minimum monthly temperature changes (small variations). The results showed that the most changes in deck length and subsequent maximum deviation in the upper part of steel piles were related to the three warm seasons in the presence of the water. Eventually, a probabilistic approach was employed to find variable amplitude fatigue lifetime of the component based on the number of annual loading blocks. To achieve the high-accuracy response, the effective parameters of the proposed probabilistic approach, including order of Fourier series and the stress range, were optimized automatically. In addition, to obtain HCF behavior of raw material, axial tension–compression fatigue tests were performed on the standard specimens fabricated from steel piles. The results revealed that considering small variations in the calculation of structural fatigue life led to a 550% reduction in life compared to structural analysis due to large variations. In addition, the obtained results were compared with the finite element results.

1. Introduction

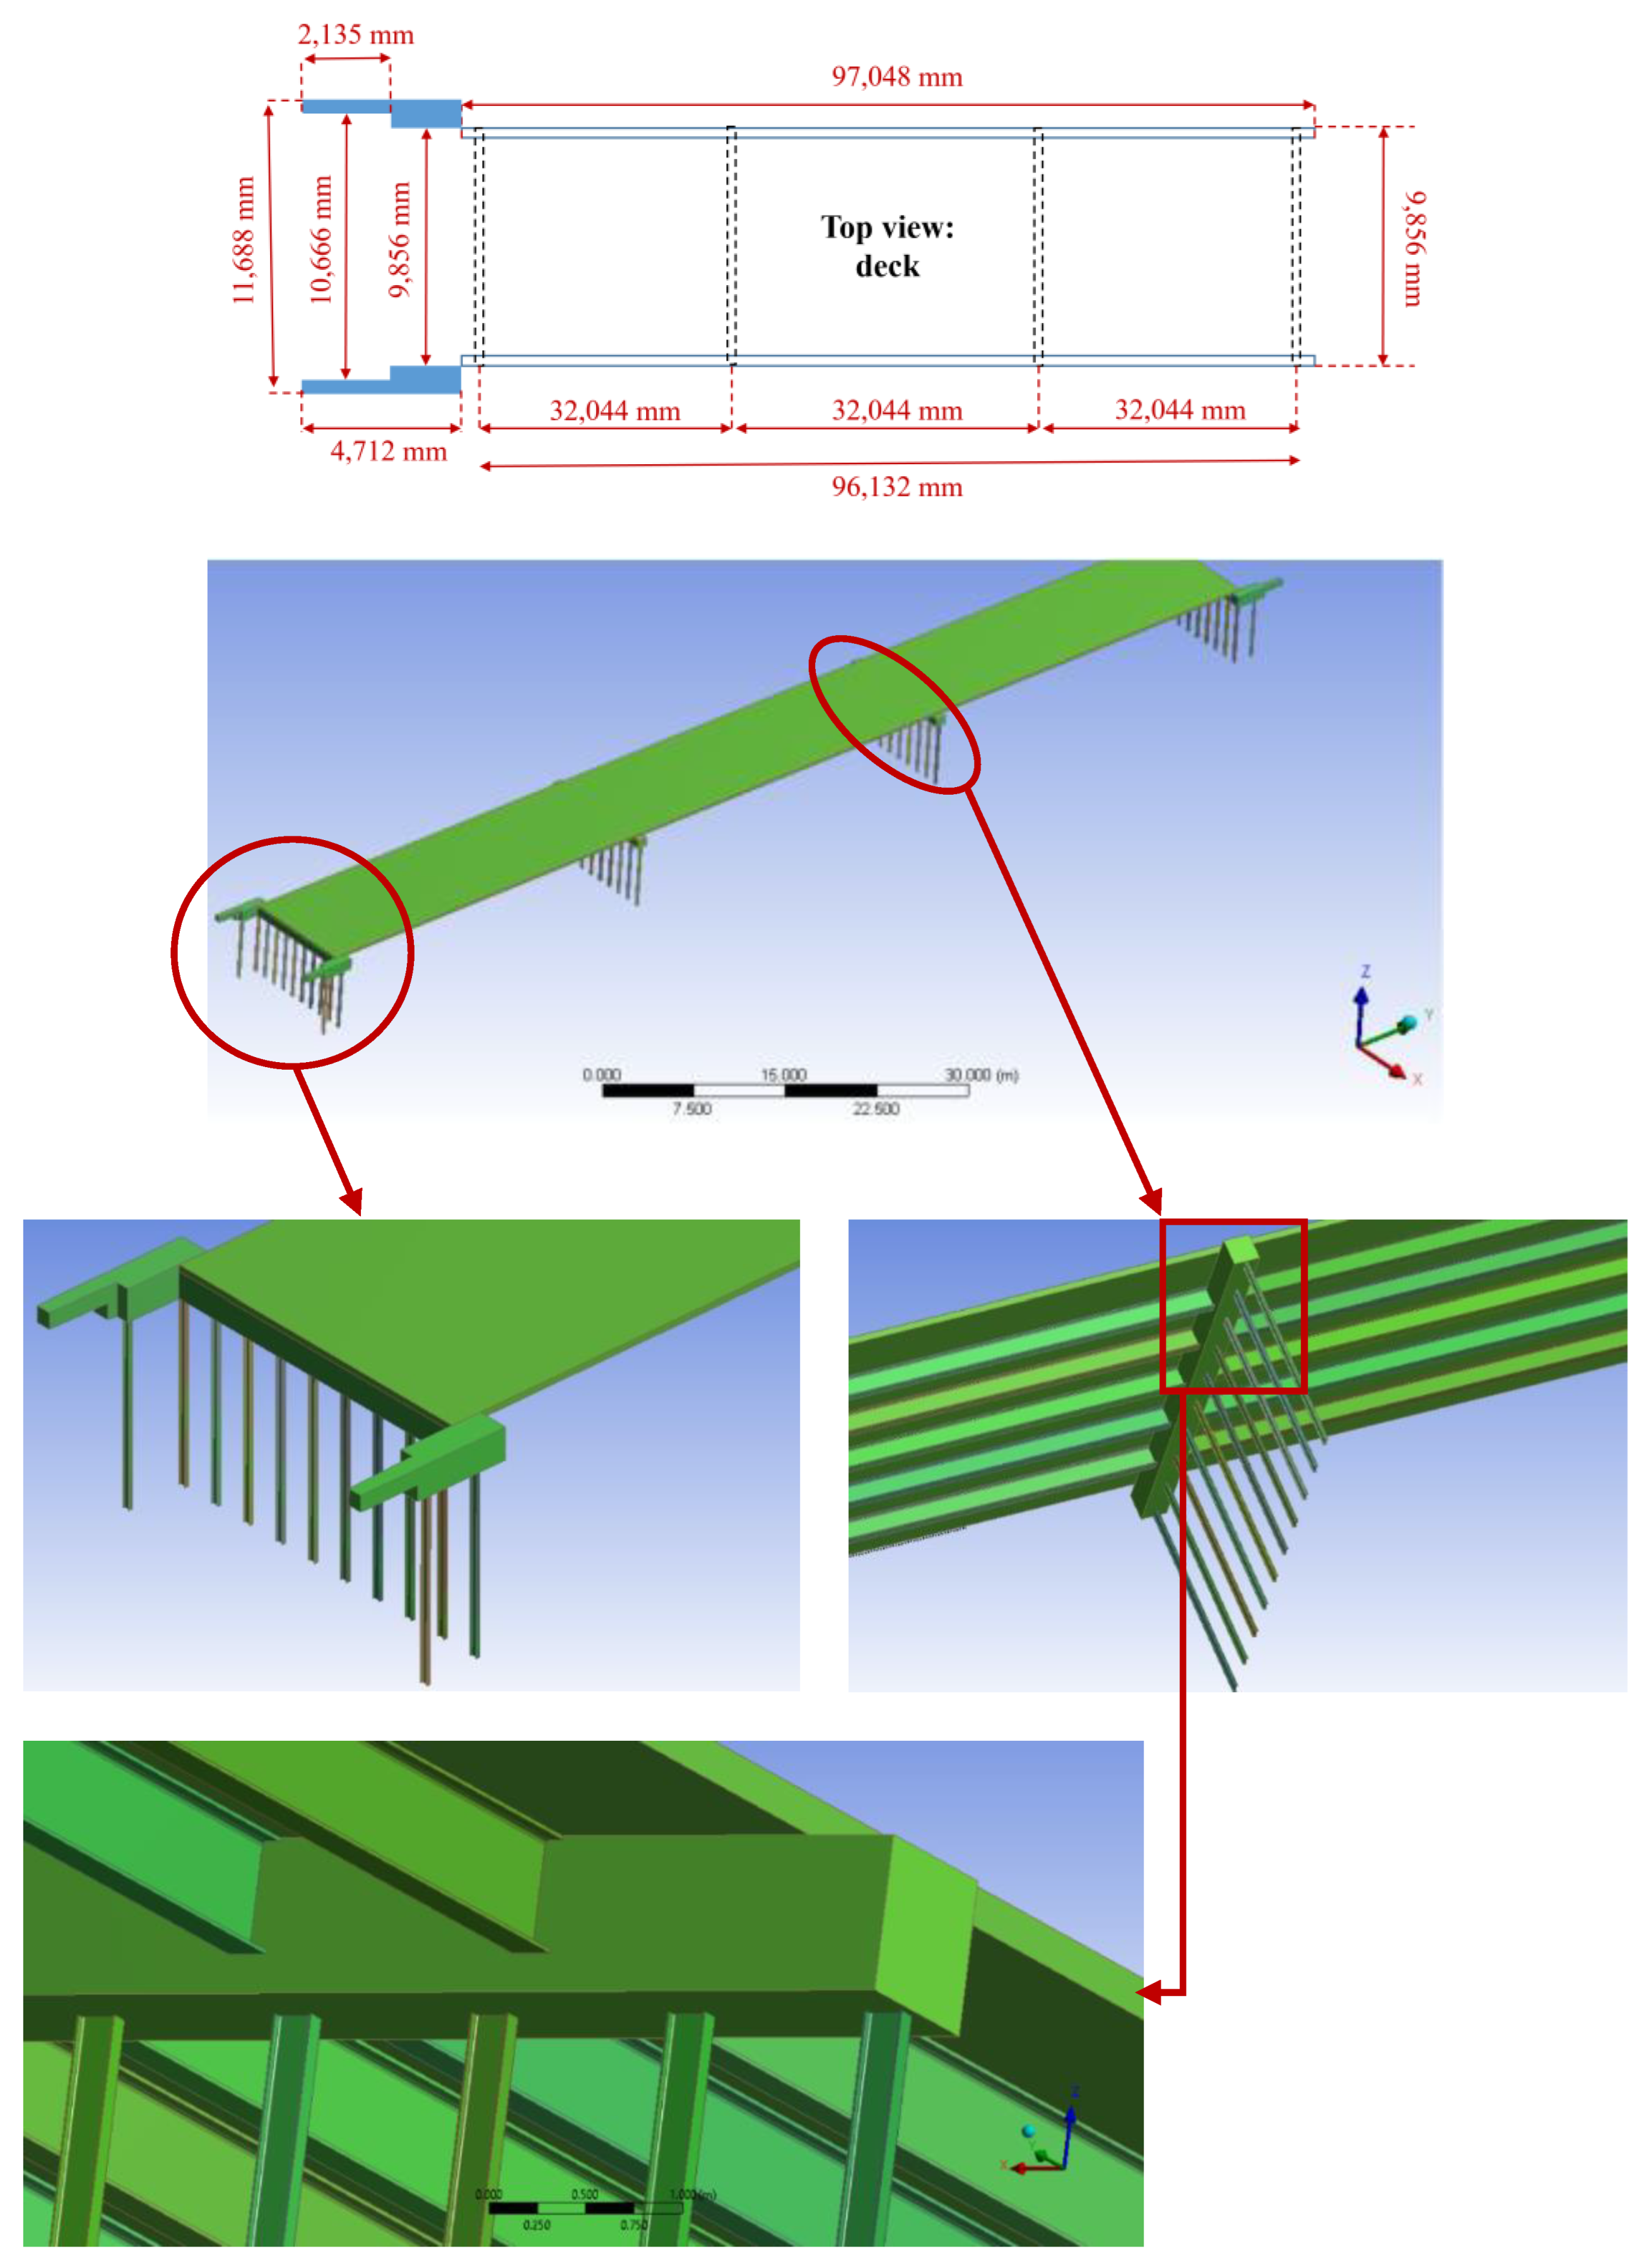
Bridges play a major role in a country’s transportation system. In general, bridges are considered as communication nodes of the country’s transportation arteries and are of particular importance in this regard. On the other hand, these concrete structures are old in some cases and are gradually approaching their design life according to the regulations of civil engineering. Therefore, it is necessary to evaluate the strength of concrete structures to estimate the current condition and make a decision to repair, improve, or dismantle them [1]. Extensive studies have been conducted to assess the strength of concrete structures based on laboratory results and the use of various techniques, such as finite element simulation, data mining, and machine learning [2,3,4,5,6,7]. Moreover, some scholars have sought to optimize raw materials of concrete and their compounds [8,9,10,11,12] or production process parameters [13,14,15,16] to increase the strength of such structures. The scientists have given most attention to the instantaneous strength due to different loads, including tension, compression, bending, and shear loading conditions or a combination of two or more loads. In fact, these calculations are carried out by engineers at the design stage. However, one of the most destructive phenomena that leads to sudden failure due to cyclic loading is fatigue [17,18,19,20]. Therefore, it is necessary to evaluate the service life and fatigue behavior of engineering structures, especially civil structures such as bridges, which are subjected to various and complex cyclic loads such as temperature variations in thermal cyclic loading and moving vehicle load in structural cyclic loading. In addition to the study on concrete, welding joints are one of the critical points in engineering structures, where cracks are usually formed in the heat-affected zone (HAZ) and the system fails from the weld area. One of the conventional methods to increase the fatigue life of metallic materials is surface treatment by creating compressive residual stress (CRS) on the surface and subsurface and also refinement of grain size. In this regard, different types of shot peening process are successful and sometimes multifold the fatigue life of metals [21,22,23,24,25,26]. This process also has an effect on the welding joints and leads to the elimination of tension residual stress (TRS) caused by the welding process [27]. However, the Almen intensity as one of the most effective parameters of shot peening treatment is very important because the martensitic phase is formed in the HAZ (i.e., material is extremely brittle in this area) [28,29]. In this way, the incorrect selection of shot peening parameters causes the formation of cracks in the welding area and ultimately reduces the life of the structure. In other words, in this case, shot peening has a negative effect. Recently, in order to prevent from this happening, some scientists have suggested water jet peening treatment for welded joints [30,31]. Apart from employing various techniques to improve the welding joints that exist in bridges, both metal and others, nowadays, the use of integrated bridges to address the shortcomings of previous structures in its implementation and efficiency during operation has become very common all around the world. In addition, to prevent corrosion of steel piles in the vicinity of water, reinforced concrete barriers are used around the piles or completely composite concrete bridges are implemented. In this regard, integrated bridges are those concrete bridges in which the sub-structure and the main structure are executed continuously. The most important advantage of this issue is that the expansion interface between the deck and the wall of other parts is removed with integrated concreting. Accordingly, various behaviors of such structures (static strength, vibrational properties, fatigue strength, corrosion resistance, and other damaging phenomena) should be identified considering different conditions, including the type of application (human, car, and cargo), environmental conditions (temperature variations, wind intensity, mounting steel piles in stagnant water, or investigating the effect of wave impact due to running water), and working conditions. In this paper, studies conducted by other scholars and experts in this field are reviewed. Additionally, their important achievements are expressed and finally, the innovation of the current research is presented in comparison with the previously published papers.
The impact of thermal elongation of the integrated bridge deck on the pressure applied to the bridge has been examined [32]. In this research, the analyses were performed for one steel pile in the FE software. The FE results indicated that the pressure value on the walls had a direct relationship with the displacement amplitude and the number of thermal cycles. Furthermore, the impact of deck height as a geometric parameter of the bridge on the behavior of piles in clay soils and rock shallow floors has been studied [33]. The most important achievement of this study is that on the bridges with taller piles, the bending moment may be reaching its final level before the piles are fatigued and the bridge fails. In other words, as the height of the bridge increases, the application of the fatigue criterion decreases, and the use of the bending moment criterion to investigate the main cause of failure will be appropriate. Moreover, Ehteshami and Shooshtari studied the interaction of soil and structure on the seismic behavior of integrated bridges [34]. They considered six different modes of soil–structure interaction, and compared the analyses results to the non-interacting structural response. The effects of thermal-induced flexural strain cycles on the low-cycle fatigue (LCF) life of steel H-piles have been studied [35]. In the research conducted by Karalar and Dicleli, a new cycle counting technique was proposed. They also developed a mathematical formula for estimating the LCF life of H-shaped steel piles based on the measurement data in North America. In addition, a novel sinusoidal function-based model has been proposed to obtain bridge displacements due to the daily and seasonal temperature changes [36]. Abdollahnia et al. predicted fatigue life of H cross-section steel piles of an integrated concrete bridge under different conditions of motionless water and sea waves clash [37]. They reported that motionless water could not led to the fatigue phenomenon in bridges. Furthermore, the impact of sea waves clash could trigger a great deal of deformation in the steel piles and eventually cause fatigue damage and failure to bridges. Afterward, they predicted the fatigue life of steel piles considering the effect of water waves clash using two methods, including finite element simulation and probabilistic approach. In addition, the authors evaluated the LCF behavior of steel piles with H cross-section due to temperature changes [38]. In this study, the strain-life ( ε N ) criterion was employed to assess the fatigue lifetime of the component under displacement control loading (zero ratios: R = 0 and frequency of 1 Hz). Finally, it was shown that the simulation results presented with 6.5% of the discrepancies compared to the fatigue test results were suitable for future studies. Recently, different well-known equivalent stress criteria have been utilized to assess the multi-axial fatigue life of integrated concrete bridge due to the simultaneous effects of temperature changes and sea waves clash [
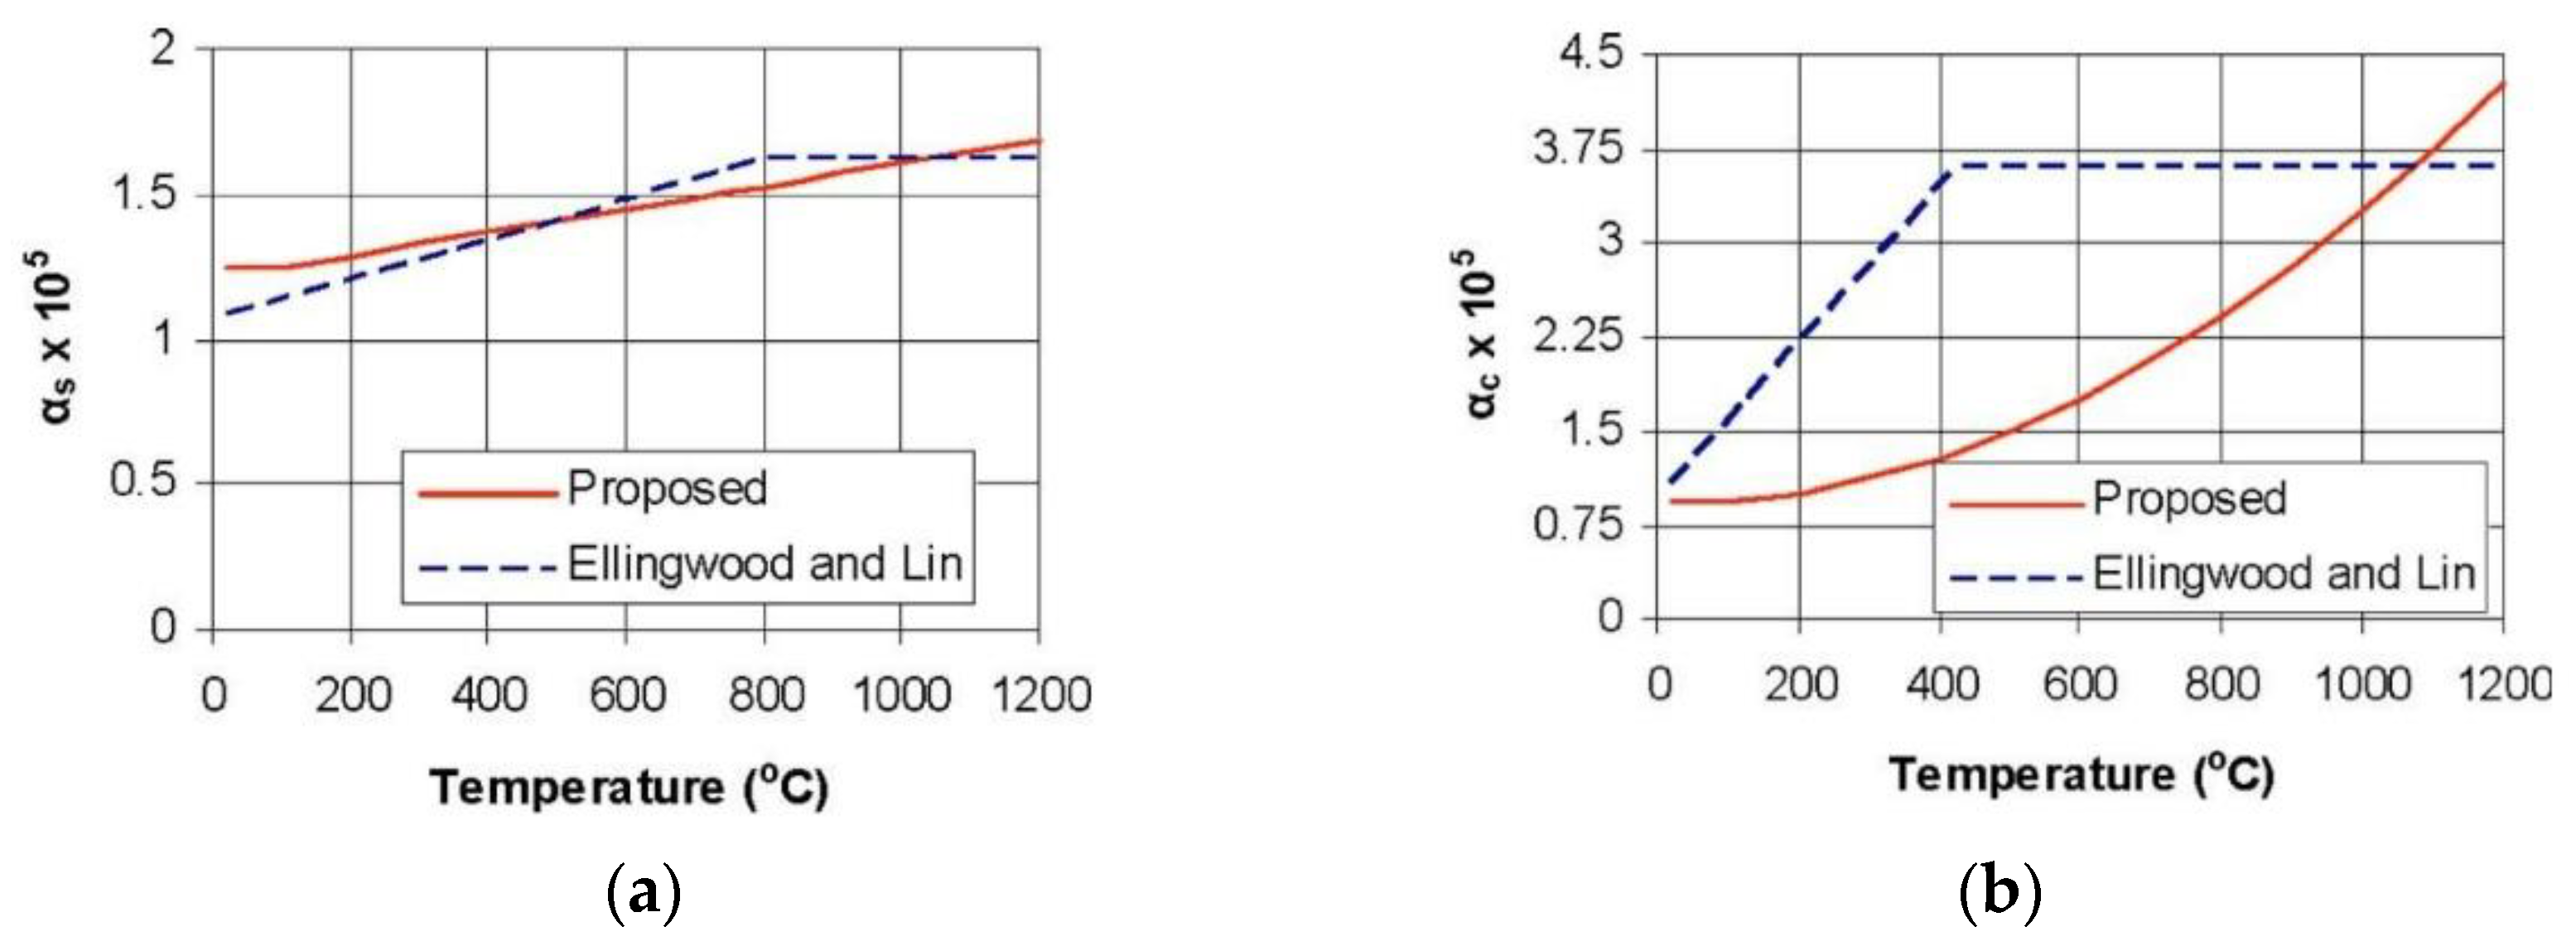
39]. In this research, the history of temperature changes was considered as a monthly average. The analysis results indicated that the Liu–Zenner criterion is more conservative than other equivalent stress-based fatigue criteria (i.e., Findley, McDiarmid, Carpinteri-Spagnoli, von Mises, Dang Van, and Modified-Findley and Modified-McDiarmid proposed by Shariyat). Similar conclusions have been repeatedly reported for industrial components [40,41,42,43]. Moreover, they reported that the multi-axial fatigue life of the bridge due to the simultaneous effects of temperature variations and sea waves clash is reduced by a minimum 66% compared to the fatigue life of the structure due to the effect of each factor. In summary, extensive studies have been carried out in the field of fatigue life prediction of integrated concrete bridges and their H-shaped steel piles subjected to temperature changes. Meanwhile, most of them have been conducted analytically [41,42,43,44,45,46,47,
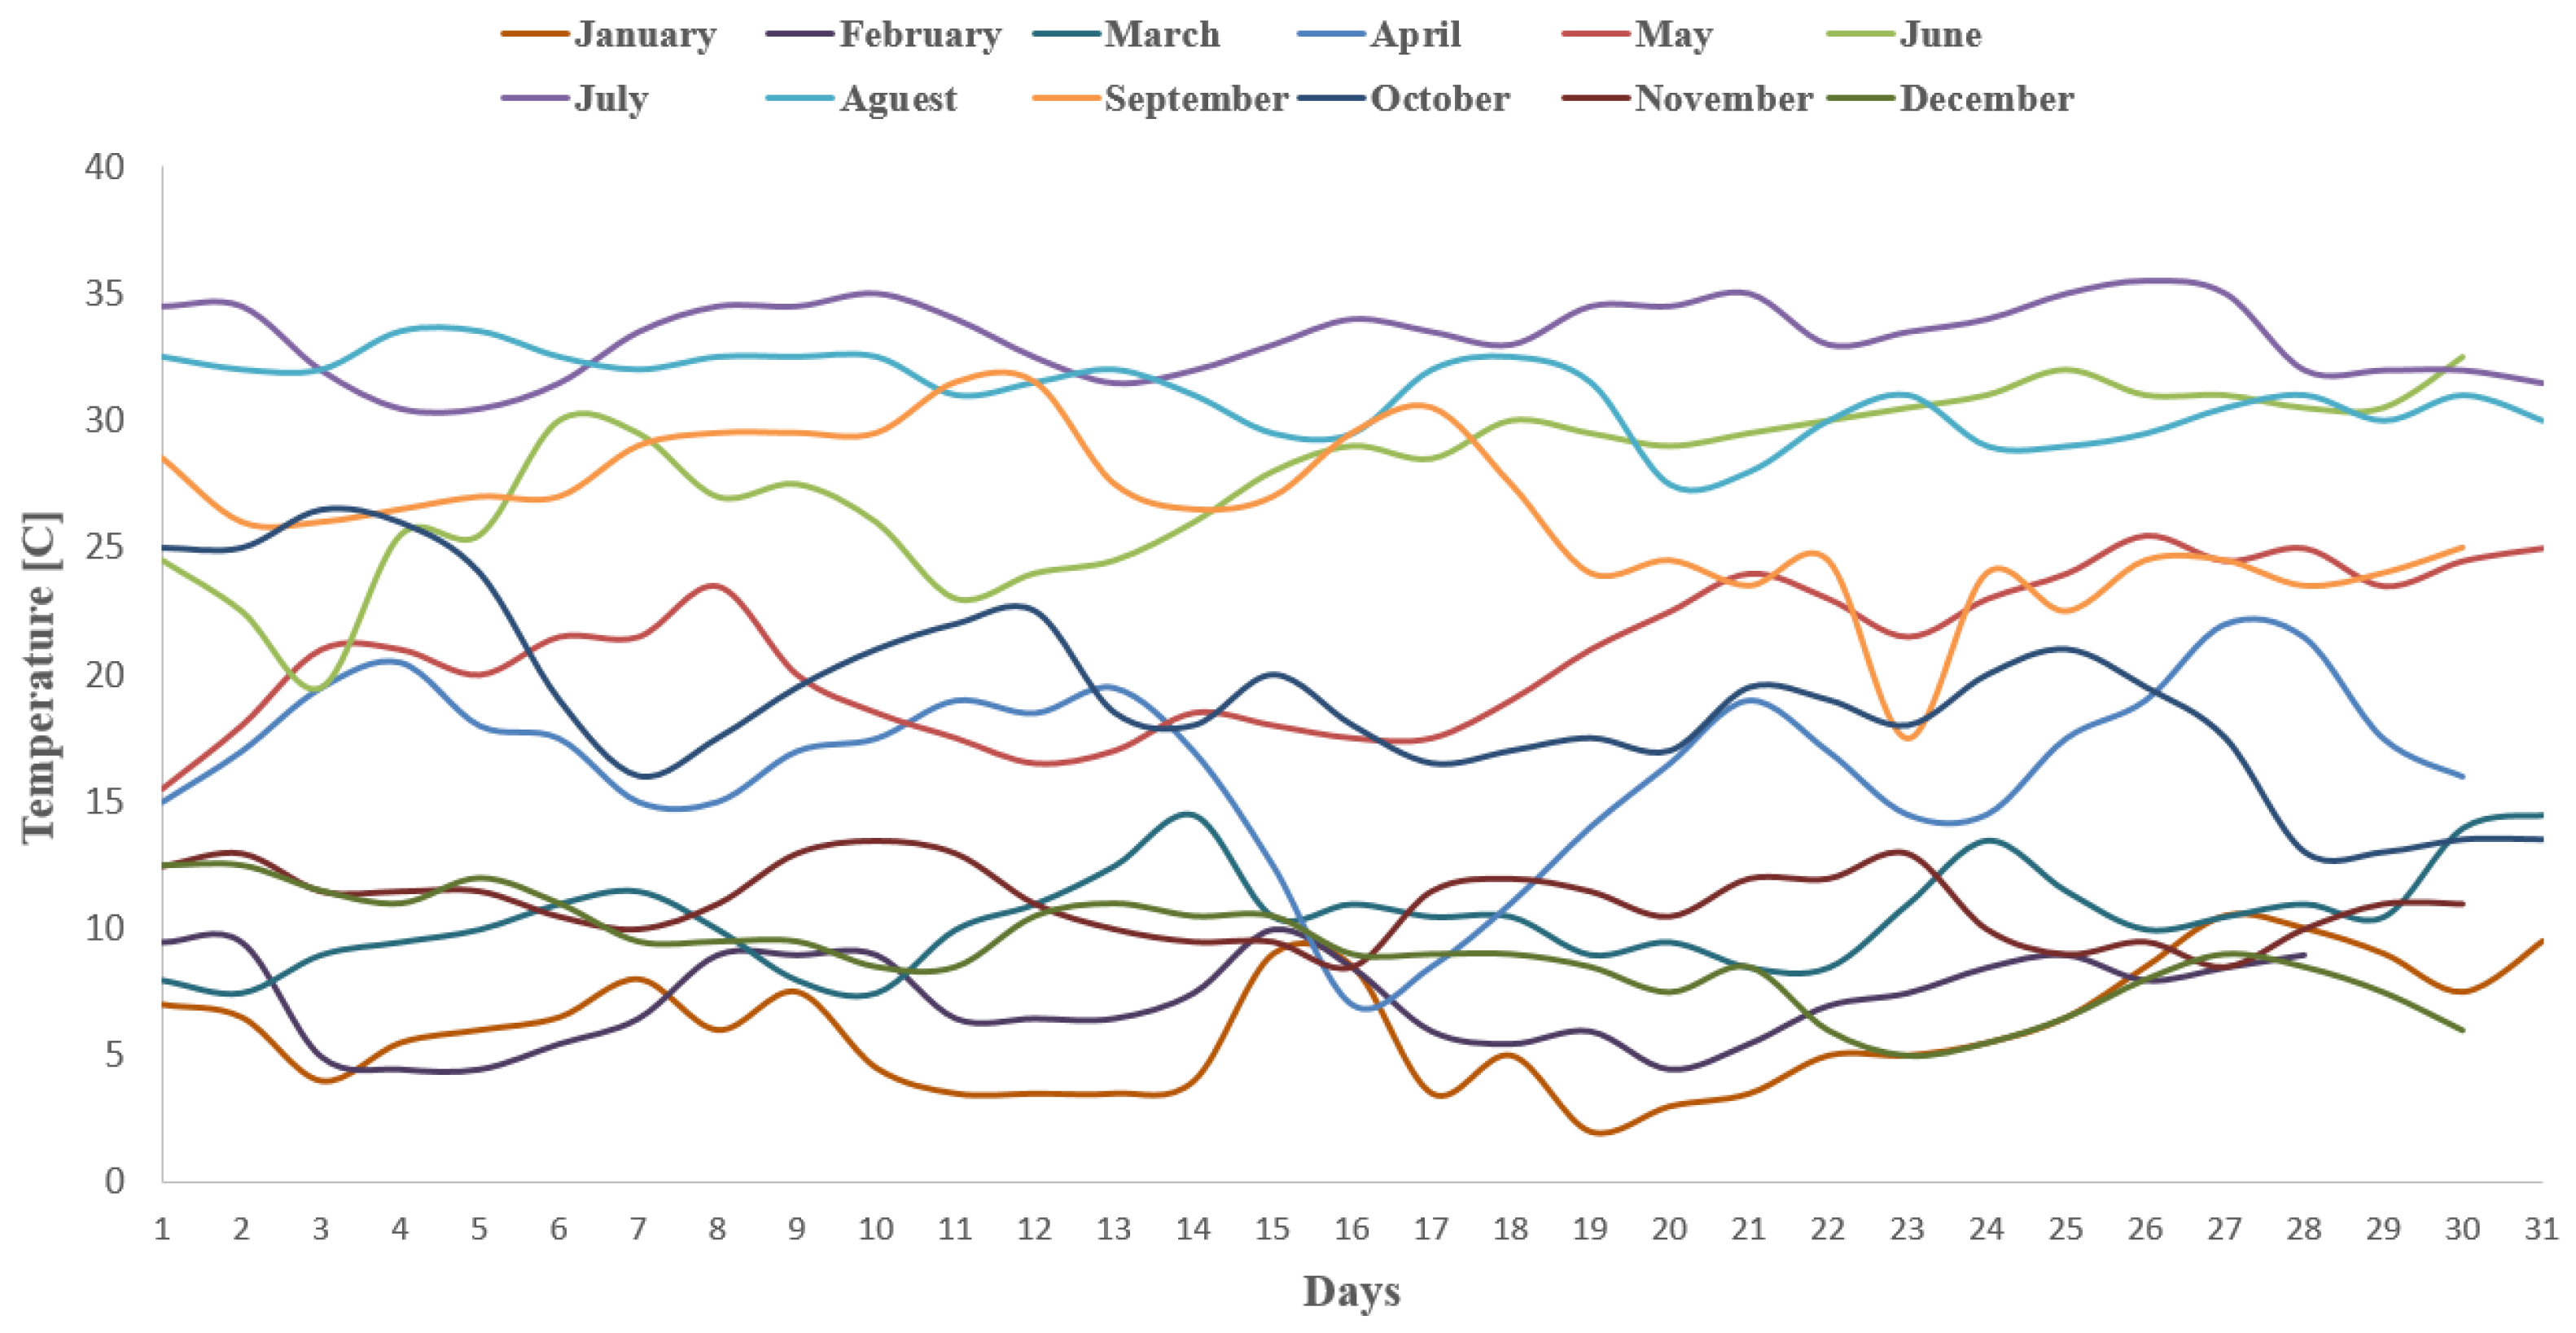
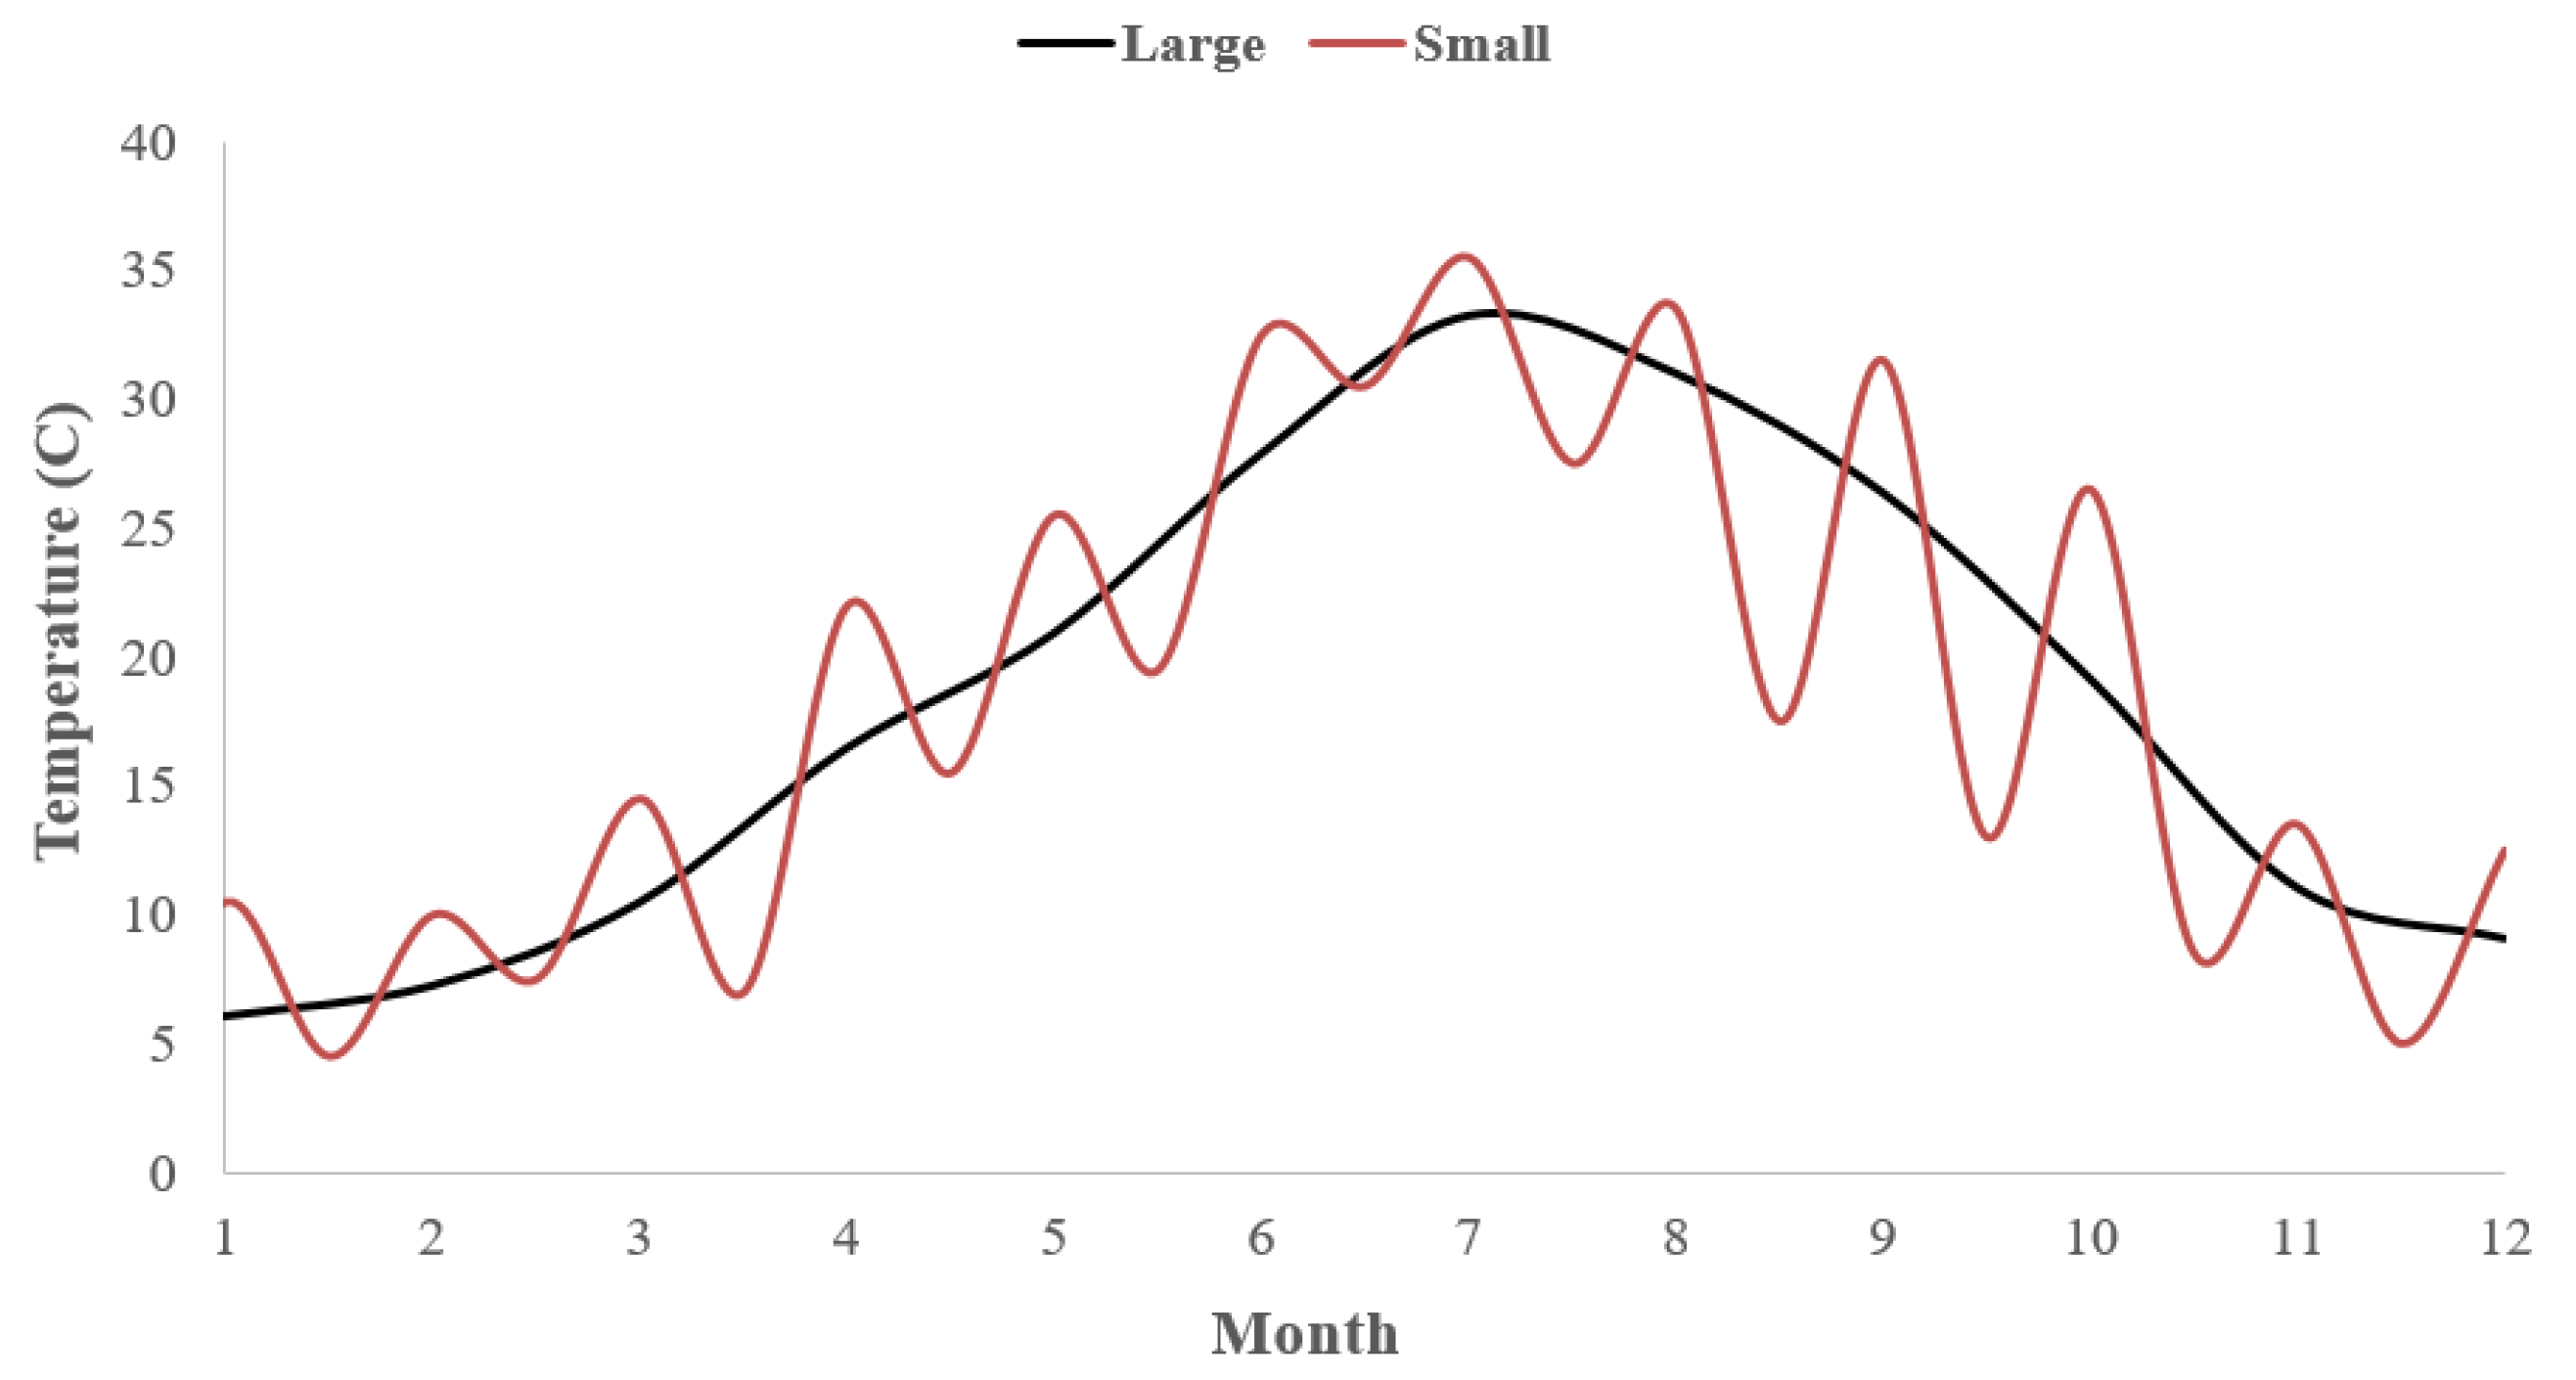
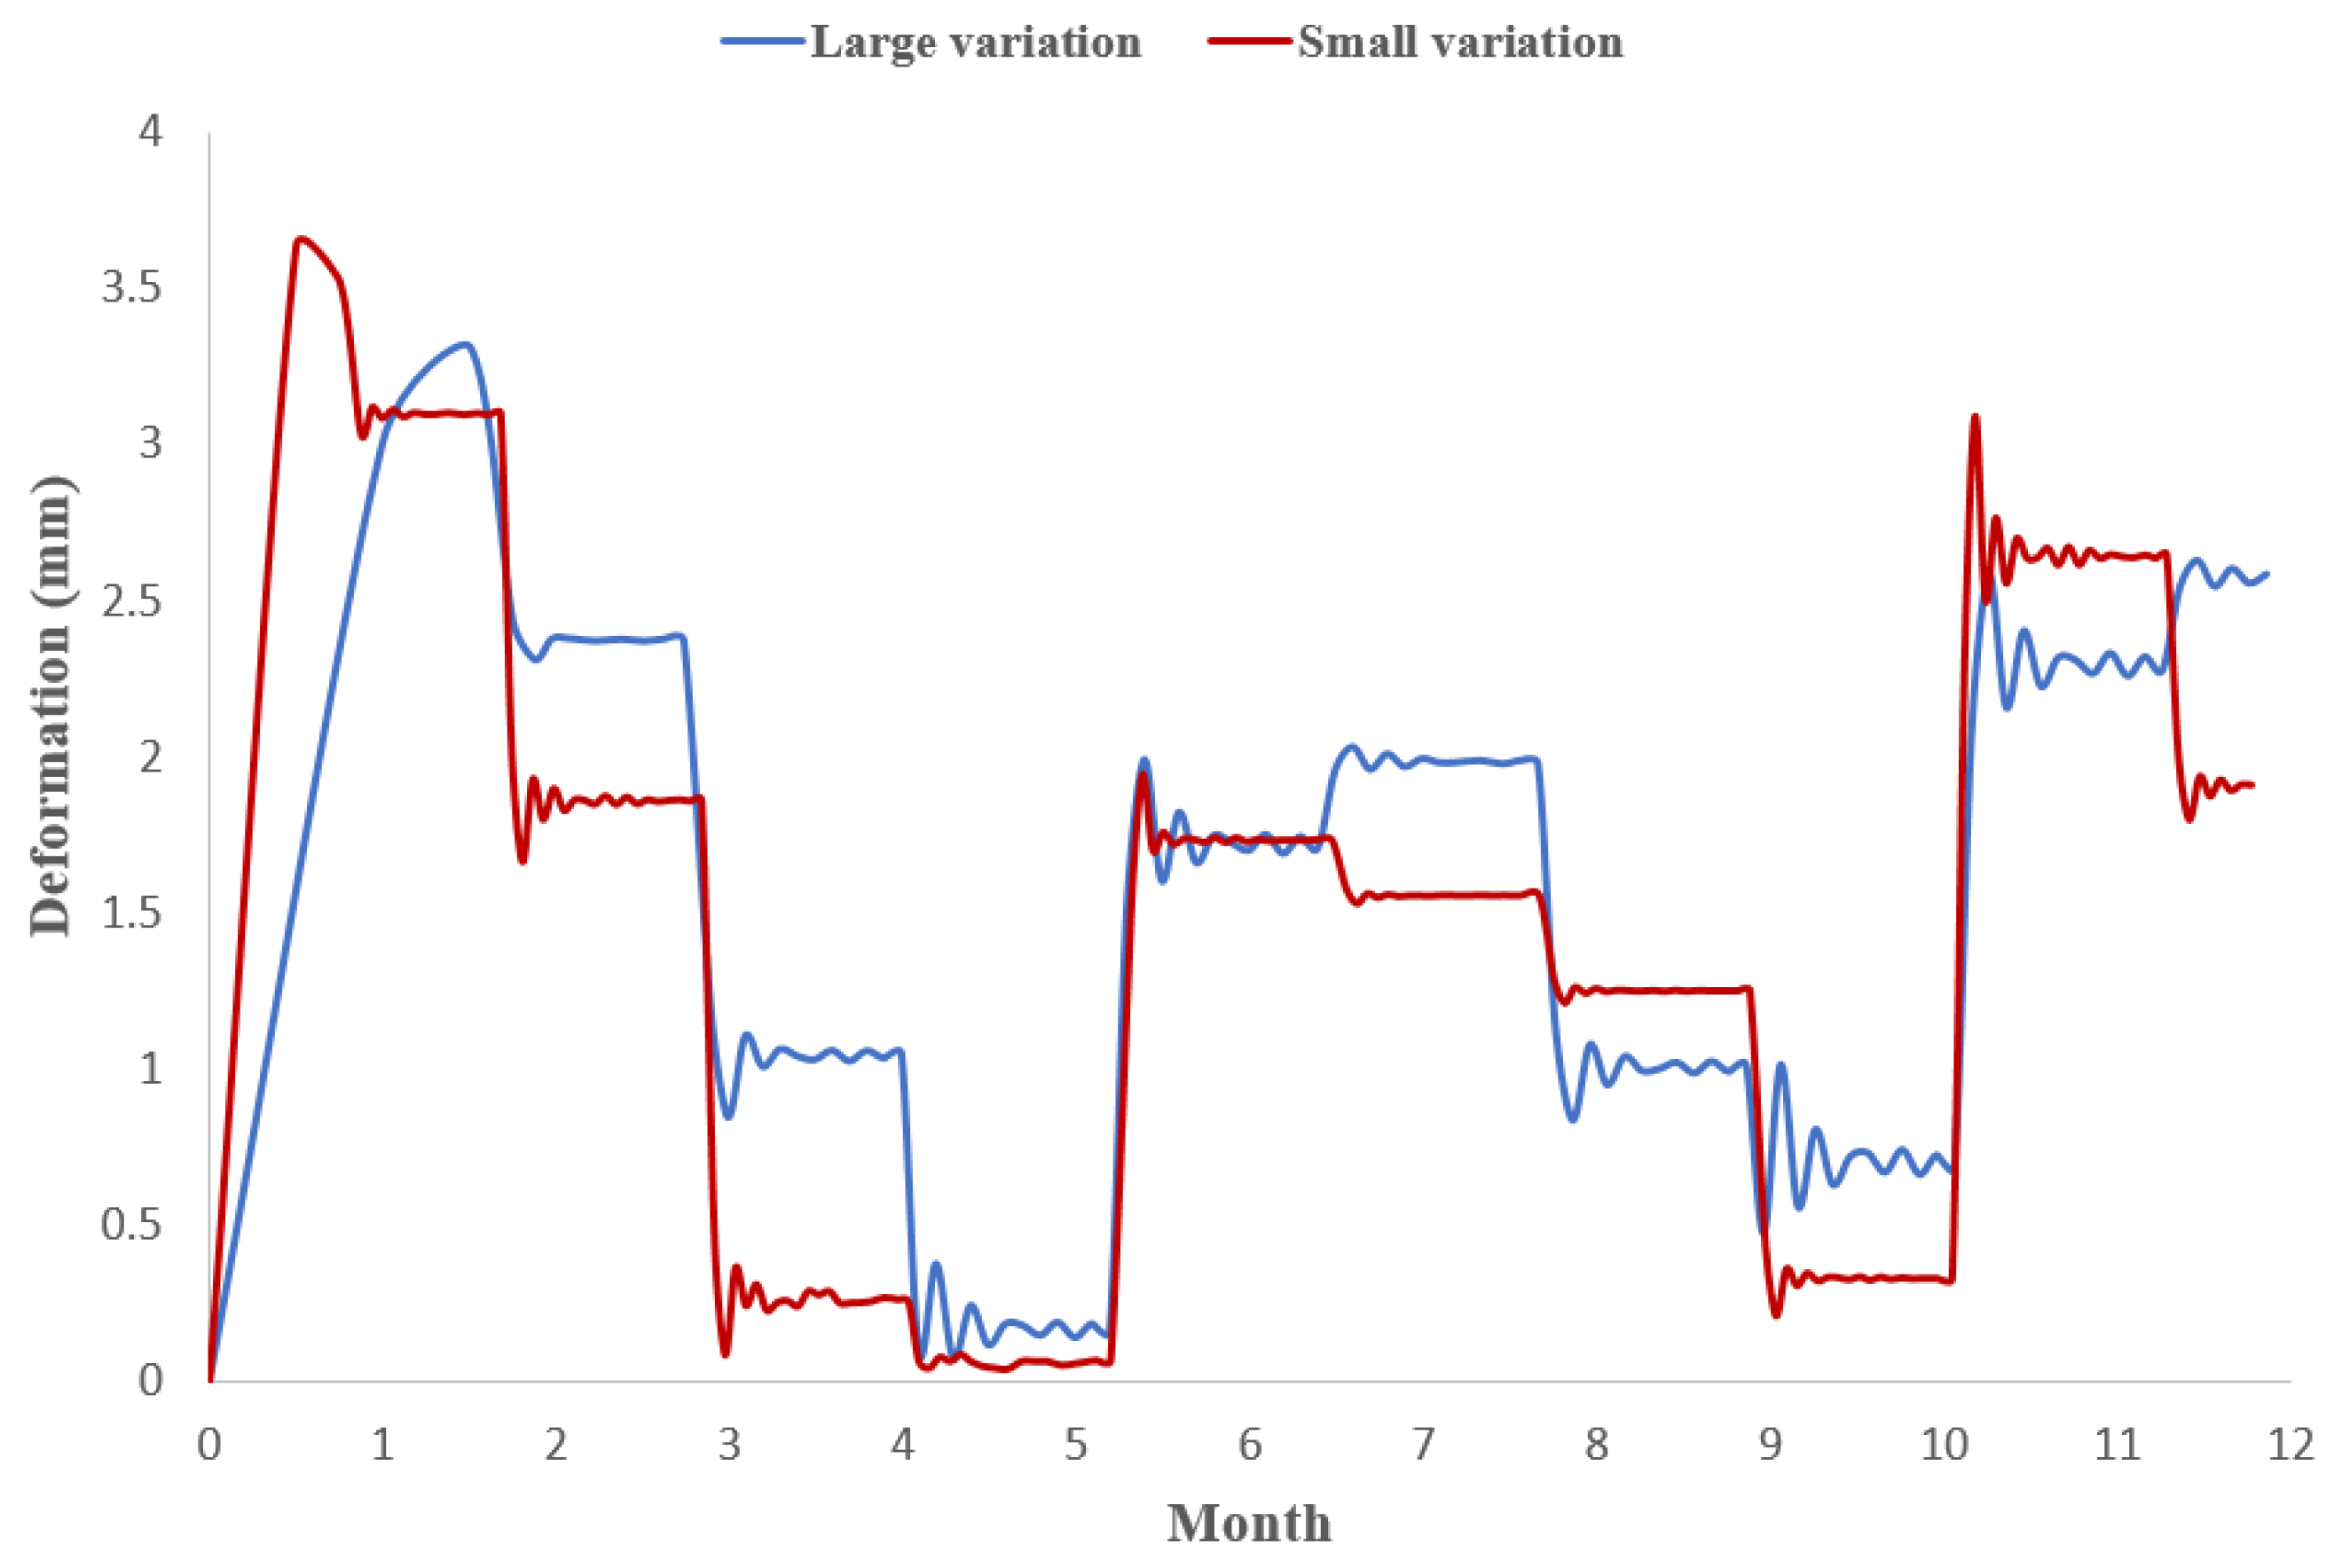
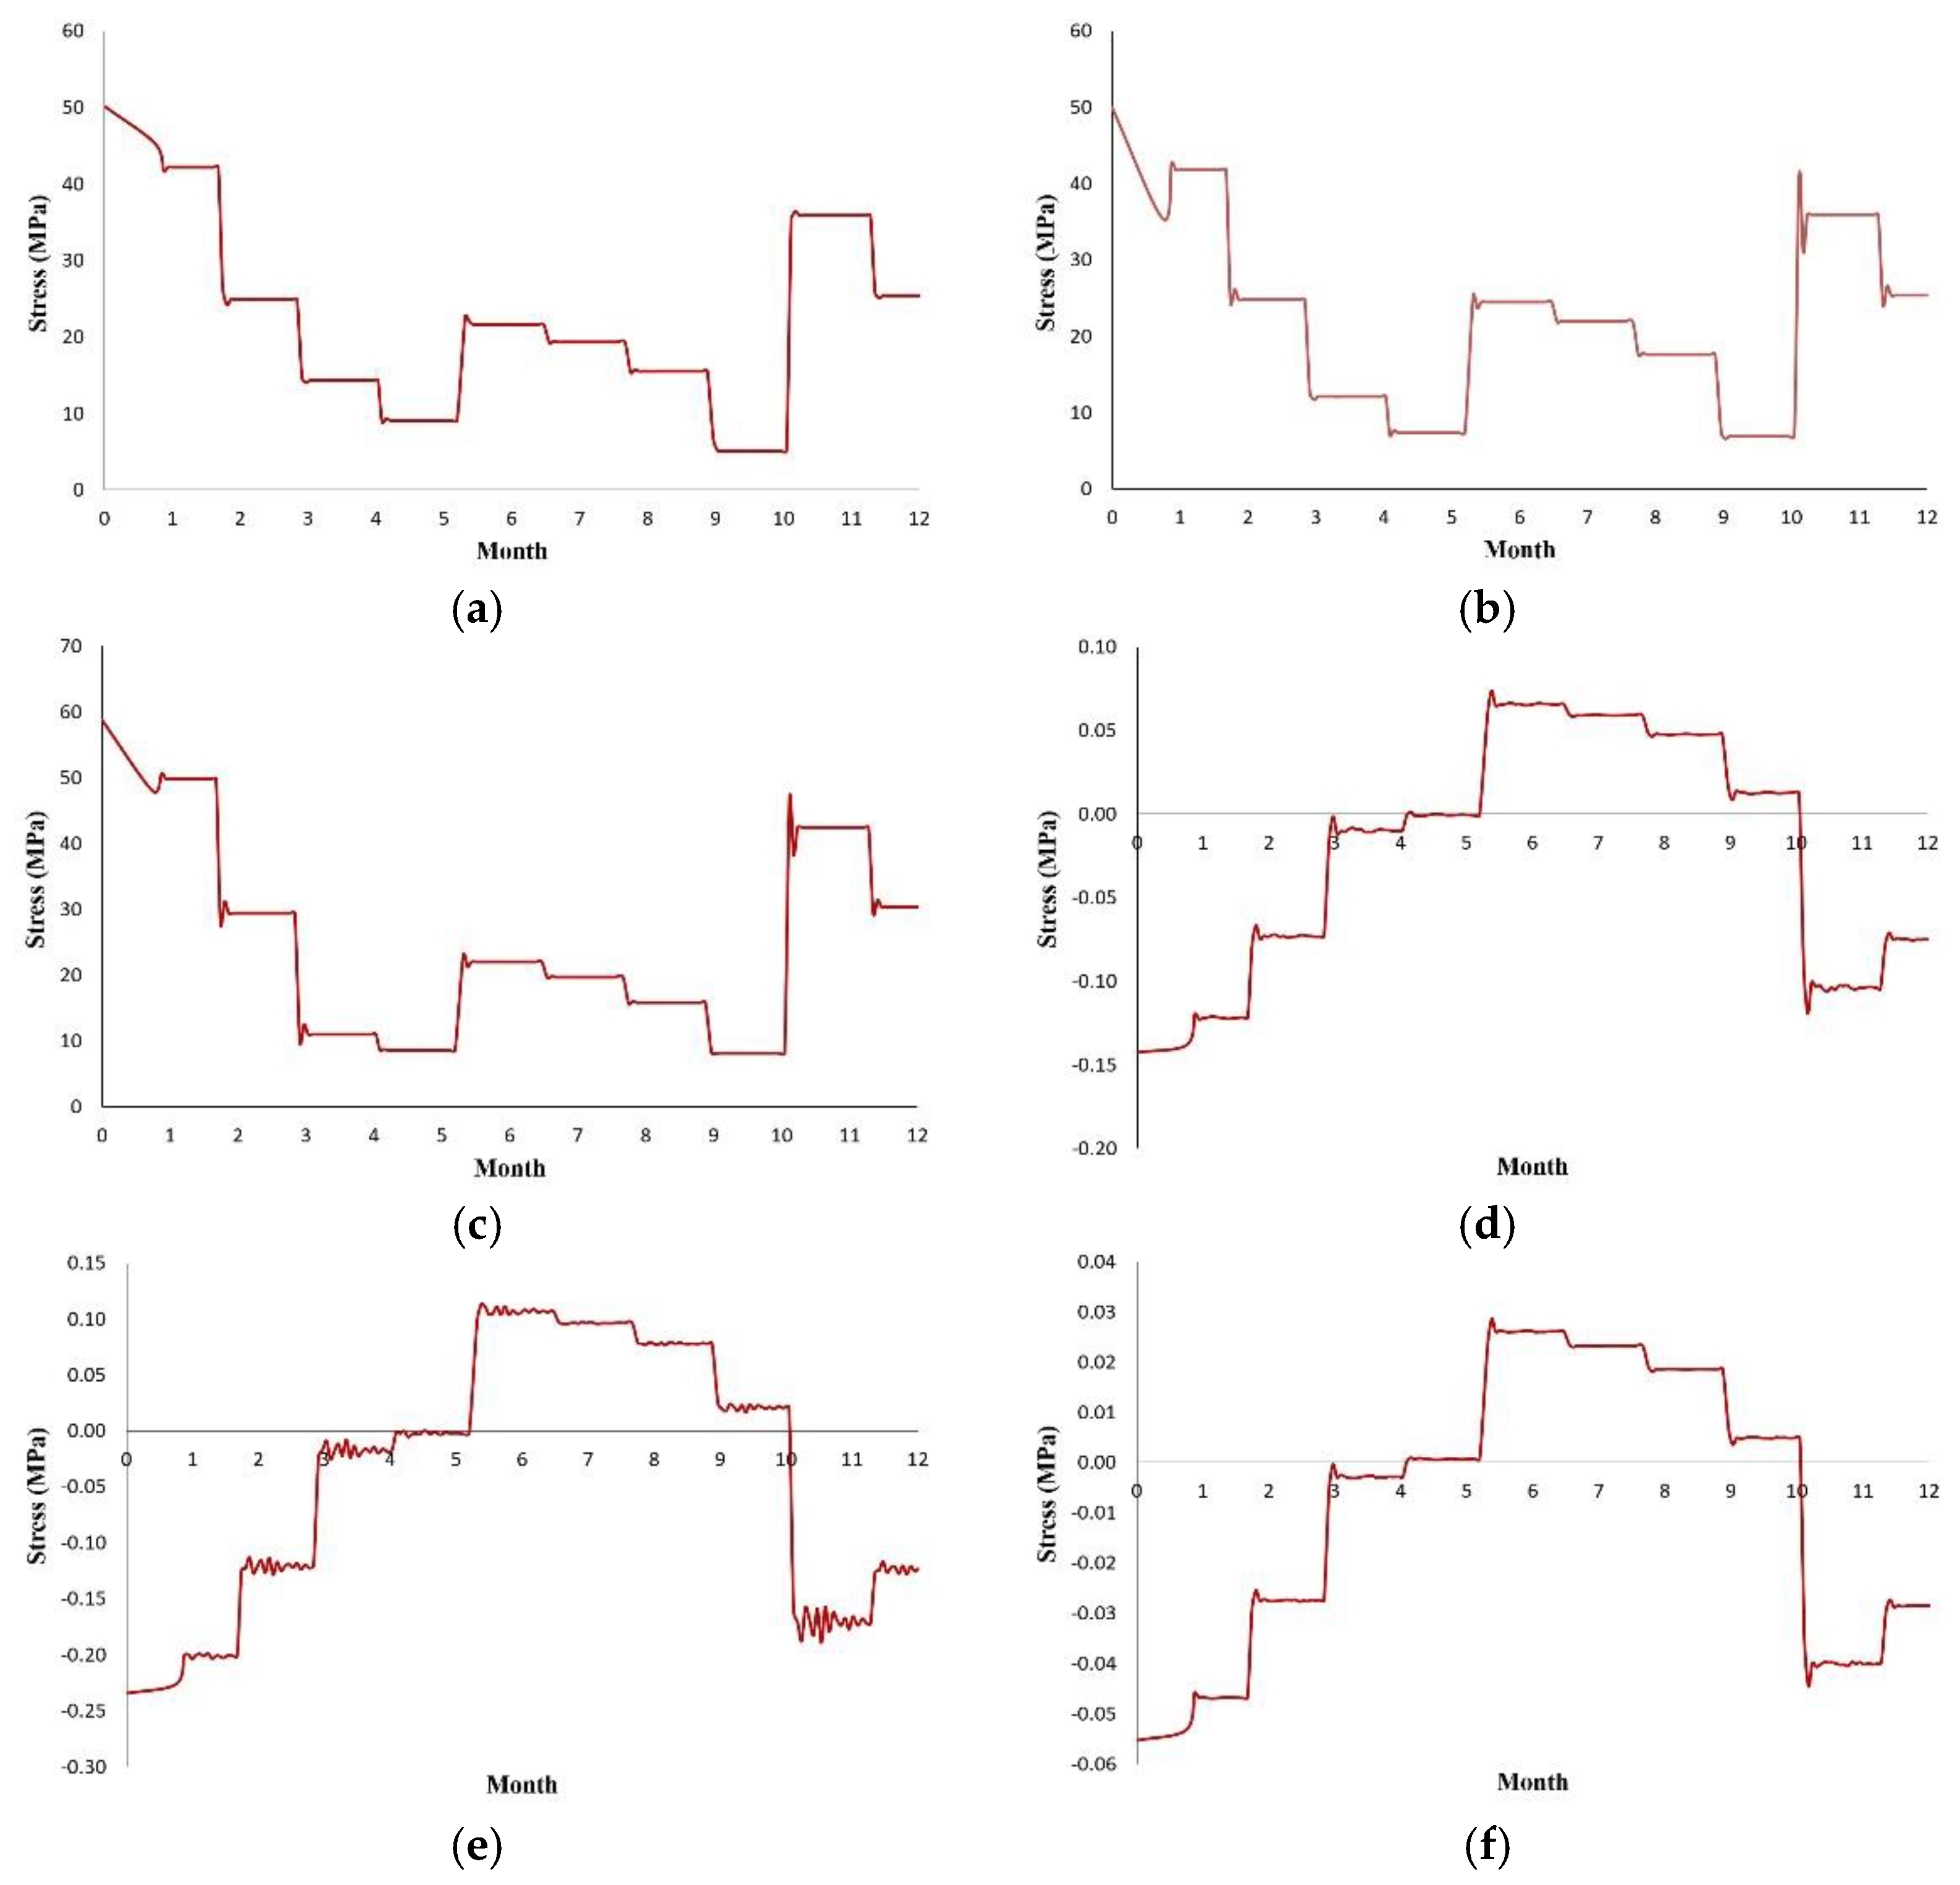
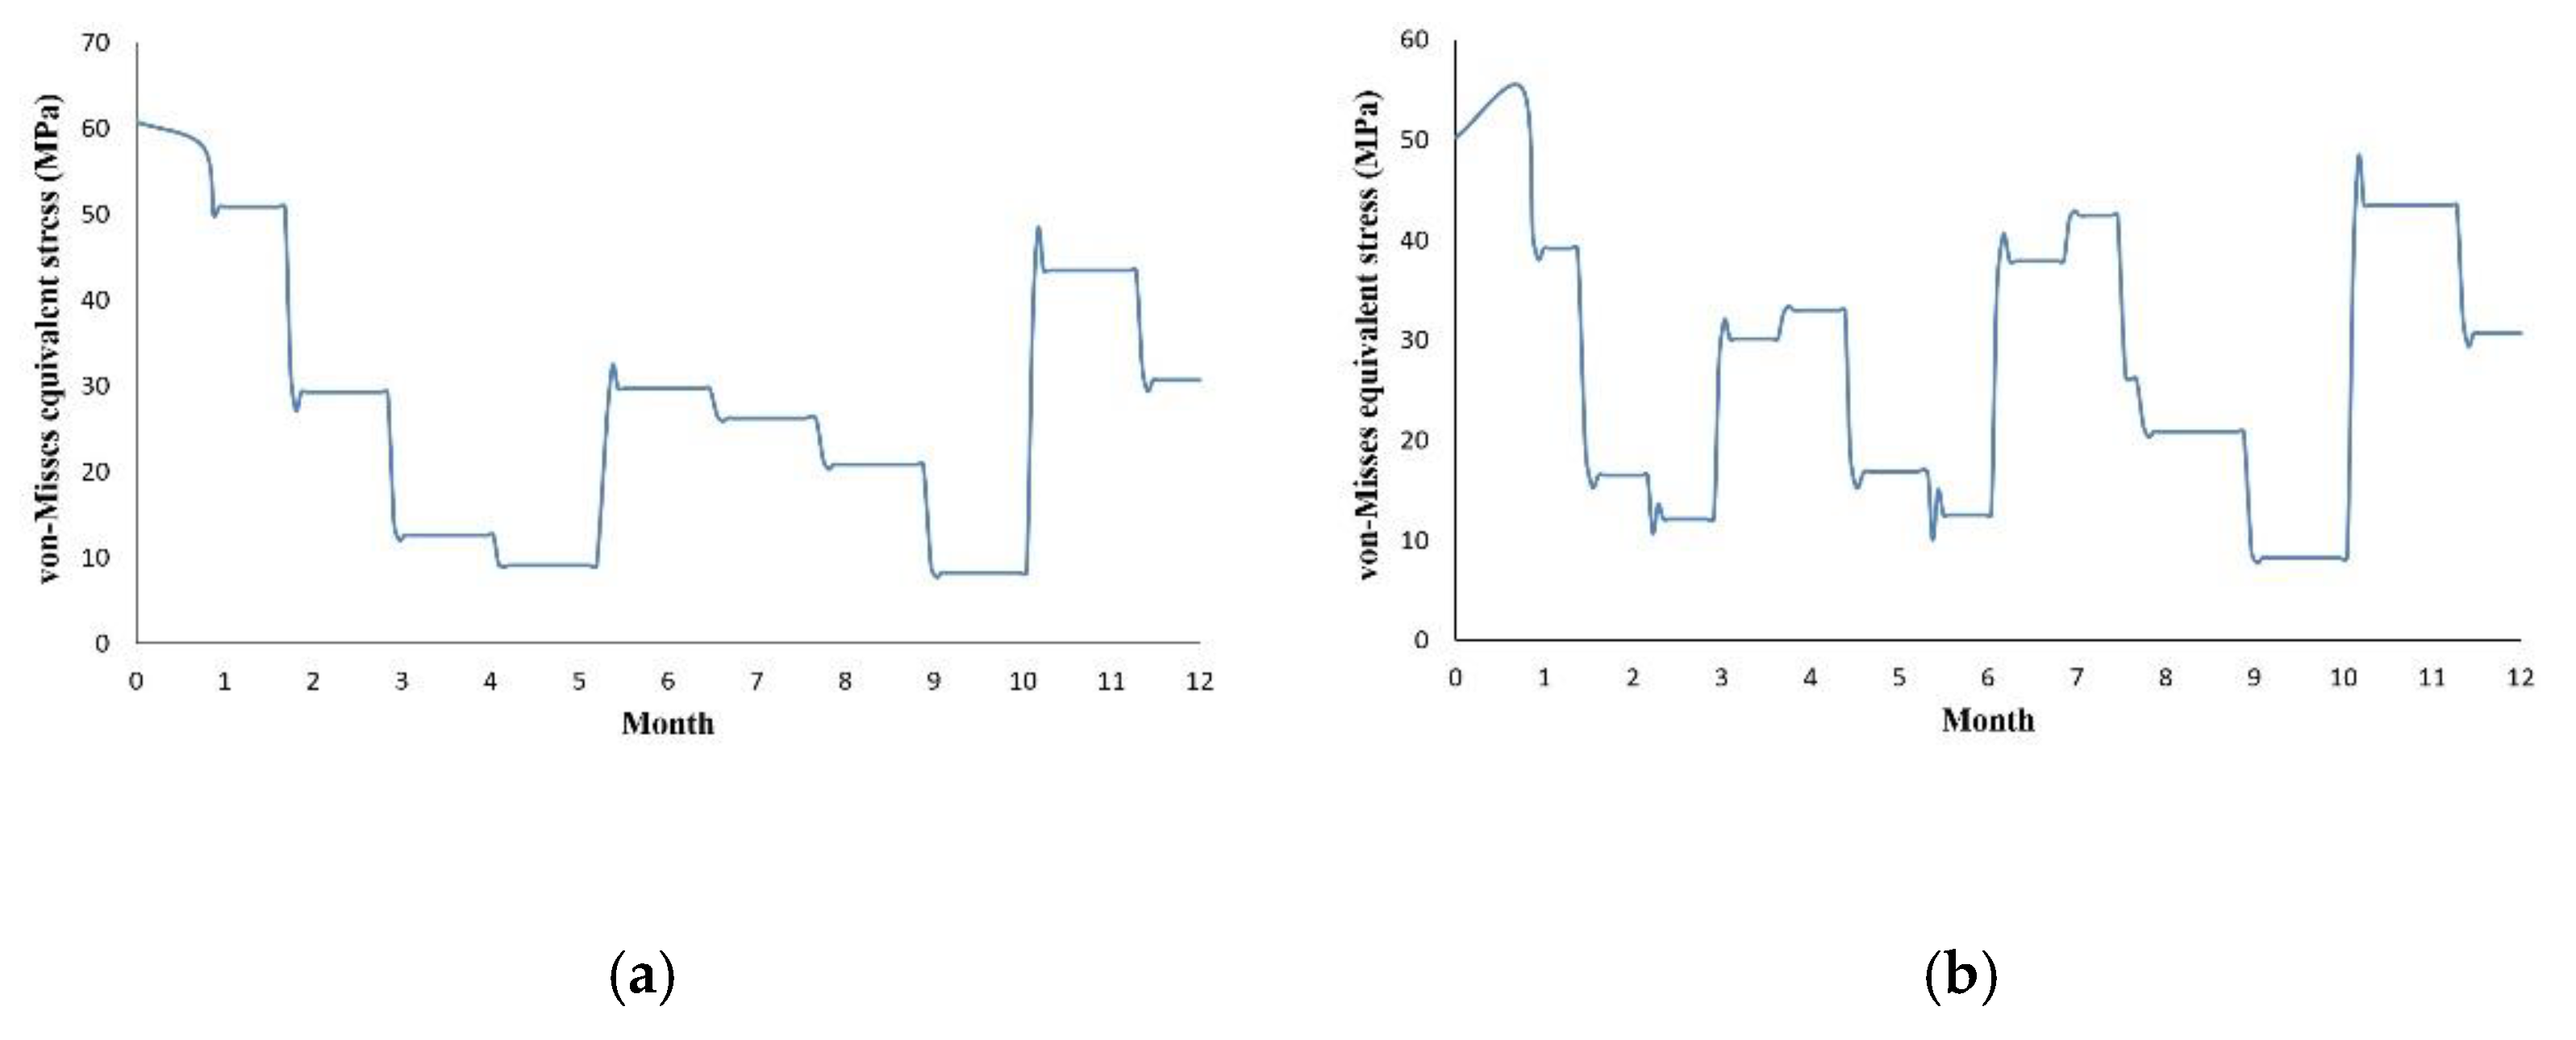
48]. Finite element simulations are rarely found in this area. Nevertheless, valuable results from costly and time-consuming cyclic experiments have also been published. However, in none of the previous studies, have the details of the time–temperature diagram and their effects on the system response and fatigue life prediction been discussed. In fact, to predict the fatigue life of integrated concrete bridges and also in the design stage of structures under cyclic thermal loads caused by temperature changes, there is no general instruction to clearly define the quality of temperature measurement (the time interval of temperature events i.e., daily, weekly, monthly, or seasonal). Furthermore, based on the above-mentioned literature review, further details about them are not recommended. For example, if daily temperature events are considered, the average temperature is sufficient to achieve the most accurate assessment of the structure, or the minimum and maximum temperature should be taken into account. To study this challenge, for the first time, the detailed influences in time history of temperature changes (i.e., how to consider loading conditions) on the fatigue life of these structures were investigated. In other words, herein, the difference of the fatigue life of a structure installed on water considering the average and the max–min temperature conditions throughout a year and monthly was detected. To this end, thermal analysis was performed due to air temperature changes in different modes, including the mean values of monthly temperature changes (large variations) as well as the maximum and the minimum values of monthly temperature changes (small variations). Next, thermal–structural coupling analysis was performed to extract displacements, stresses, and strains in the structure, especially in the critical region prone to fail. Eventually, by utilizing a valid probabilistic approach with automatic optimization of effective parameters, the variable amplitude fatigue lifetime of component was estimated. In addition, the obtained results were compared with the finite element results.

2. Simulation Method

2.1. Geometry of Bridge Structure

In the current study, the bridge structure and its accessories, including a concrete deck, concrete anchors (walls), I-shaped concrete beams (Ribs), and steel piles, were modeled three-dimensionally and separately. Afterward, they were assembled in CATIA software and inserted into the ANSYS WORKBENCH software as a well-known finite element software (using *.stp file). This model consists of two middle pedestals, each of which includes 10 steel piles. Moreover, this model comprises 44 steel piles (type IPE-220). In addition, four rectangular concrete beams were considered for connecting steel piles to concrete material under the bridge’s deck. Between each of these beams, I-shaped cross-section concrete beams (Ribs) with IPE-600 specifications were integrated into the concrete deck. Dimensional specifications and geometrical parameters of piles are given in Table 1 [37].
These beams are divided into three sections: between the first wall and the first middle pedestals, between the first and second middle pedestals, and between the second middle pedestals and the second wall. Five Ribs at equal intervals were considered for each section (it means that 15 Ribs were modeled as integrated with the bridge’s deck) [37,39]. Figure 1 presents the real-scale geometric model of an integrated concrete bridge in details. The length of steel piles is 6 m. Additionally, width and length of the bridge deck, regardless of the concrete anchors and its accessories, are 11.688 and 104.644 m, respectively.
To consider the integrated behavior for concrete parts of the bridge, one group, including the geometries of the deck, middle beams, and I-shaped concrete beams (IPE 600), was defined by non-separation and continuous deformation in the FE software. However, the edges and surfaces of these parts are identifiable, and boundary and loading conditions could be applied on them separately.

2.2. Materials Used for FE Simulation

In the current study, structural steel and ordinary concrete were used as the raw materials. The mechanical characteristics and thermal properties for both materials are given in Table 2 and Table 3, respectively [37,39]. Since temperature changes are studied as the main cause of failure in this research, the thermal properties of the material, i.e., coefficient of thermal expansion (CTE) in terms of temperature for steel and concrete were considered in accordance with Figure 2a,b, respectively (red color lines) [49]. It is obvious that the CTE changes are noticeable by increasing temperature over 200 degrees, and in the current case study where the maximum ambient temperature does not exceed 35 degrees, there are no significant changes in thermal coefficients. Accordingly, most scholars consider constant value for this parameter and perform steady-state thermal analysis, but in this research, to achieve the most accurate response, temperature-dependent CTE was defined in the software and transient thermal analysis was performed.
The current study aimed to predict the fatigue life of steel piles as one of the most important and vulnerable components in the bridge structure due to the temperature variations and also sea waves clash [32,33,34,35,36,37,38,39]. Most research in this area has identified intermediate steel piles as the most critical part of the bridge under cyclic loading. Therefore, the focus of the present study is solely on assessing the fatigue life of this component. Accordingly, the fatigue properties of concrete material were neglected [37,38,39]. In addition, to obtain HCF behavior of structural steel, one IPE-220 steel beam was provided, and standard axial high-cycle fatigue test specimens were fabricated according to Figure 3. To this end, a CNC wire-cutting machine was used to prepare samples based on dimensional recommendations and surface roughness stated in ASTM E466 standard [50]. The force controlled axial fatigue test was performed at room temperature; loading ratio and loading frequency were considered to zero and 10 Hz, respectively. Moreover, fatigue tests were conducted on six applied stress levels and in order to check the accuracy and repeatability of the response, four tests were performed in each stress level and the average number of cycles to failure was entered in the FE software as the failure cycle corresponding to the applied stress (based on the recommendations of fatigue standards, at least three repetitions are required in each fatigue test). Figure 4 demonstrates the stress-life diagram as the results of fatigue tests performed in the present research.

2.3. Meshing and Convergence Analysis

The element type and meshing method directly affect the FE responses. Accordingly, after selecting the appropriate type of element related to the desired analysis, it is necessary to check the independence of the response to the meshing method and the number of elements. Furthermore, this sensitivity analysis helps to achieve a reliable response by reducing computational costs and having sufficient accuracy [51,52,53]. Hence, mesh sensitivity analysis was conducted considering different sizes of the element in each component. To this end, the maximum deformation in the upper part of steel piles was assumed as the target (for further details of the process of the mesh convergence, the readers refer to [37]). The final FE model (Figure 5) contains 121,655 elements; the element size of the deck, wall, concrete beam under the deck, concrete I-shaped beam (IPE-600), and H-shaped steel piles (IPE-220) is 1, 0.5, 0.2, 0.2, and 0.2 m, respectively.

3. Finite Element Analysis

The validation process of the presented FE simulation was thoroughly examined in the authors’ previous research [38]. However, for the LCF analysis due to temperature variations, the accuracy of the FE results in comparison with the real-scale laboratory results was reported to be approximately 93.5%. Therefore, to prevent the repetition of statements and also to provide more important content, this section was ignored in this article. Next, to predict variable amplitude fatigue life of the structure, we described different types of analysis using this valid FEM.

3.1. Thermal Analysis

Daily changes in the air temperature led to an increase or decrease in component length of the structure, which results in thermal strain and stress in the structure. These changes are known as the non-uniform cyclic thermal stresses applied to the structure, which after a while, leads to damage and eventually failure in the structure. Hence, one of the most important steps in calculating and predicting the thermal fatigue life of a structure is to extract the history of temperature variations, which must be collected depending on the geographical zone of the bridge.

3.1.1. Extraction of the Temperature Variations History for One Year

In the present research, the temperature information of Tehran city (the capital of Iran) was collected as the maximum and minimum daily temperature. Afterward, the average temperature of each day was calculated (Figure 6). As can be seen, these temperature changes do not have a specific trend; in other words, they are random in nature. On the other hand, each color represents the temperature changes in one month. To draw this graph, the average temperature of each day was considered, and the data were discontinuous. To simplify the matter, the temperature data in one month were connected to each other. In other words, the data were considered as a continuously data. So, there is a data jump between the connection of daily temperature and consecutive months with each other. In fact, this task is known as a prerequisite for conducting transient thermal analysis. Nevertheless, it is not economical for engineers since the data on daily temperature information is very large and transient thermal analysis using FE simulation requires a significant amount of time and high computational costs. To overcome this challenge, the mean value of temperature was calculated monthly and the maximum and minimum temperatures were extracted for each month to be used in future analyses.
In general, temperature variations are applied to the bridge deck (top surface of the structure) and cause changes in the dimensions, specifically the length of deck. However, these temperature changes do not significantly change the dimensions of other bridge components, such as infrastructure. This is because these parts are usually located in the soil and will not be affected by these temperature changes, or they will not be of considerable length to be sensitive to temperature changes. The thermal energy of the sun is the main factor in changing the length of the deck due to air temperature variations and external loads do not play a role in creating it. This change in length does not impose any force or stress on the structure if it does not limit, but if this change in length is not possible (this movement is prevented by fixed supports), large forces and stresses are created in the structure.
To apply the initial, boundary, and loading conditions with the aim of thermal analysis, the temperature history was considered as two modes, namely, large variations (mean values) and small variations (maximum and minimum values) on the concrete deck. Figure 7 displays the comparison of temperature loading conditions in the two different modes. In this diagram, the daily temperature changes are ignored, and the focus is on the monthly temperature changes. So, we lose a significant amount of data in this way. Importantly, as a representative of the daily temperature, it is enough to know the average temperature of that day or it is necessary to consider the maximum and minimum temperature of each day. Furthermore, it was assumed that the temperature of steel piles is equal to the ambient temperature (22 °C). In addition, a temperature of 7 degrees Celsius was considered for the part of the steel piles that was located in the water (height of 75 cm from the floor). In the present research, it is assumed that the water temperature is constant throughout the year. Moreover, in the simulation, the time interval of temperature variations was considered to be constant. Transient thermal analysis was performed to extract the temperature distribution in various parts of the bridge in terms of months.

3.2. Thermal–Structural Coupling Analysis

The temperature distribution obtained from the previous step was entered into the structural analysis. In other words, in the new structural analysis, the temperature values are considered as the initial boundaries of nodes. As the boundary conditions, the end of steel piles was fixed in different directions (all DOF). In addition, water pressure flow ( P = 51.2 × K × V 2 ), was uniformly distributed on the middle steel piles [37]. In this equation, K coefficient was assumed to be 0.78 based on the geometric shape of the pile cross-section. In addition, the speed of water flow (V) is 0.3 m/s. This pressure distribution is in the form of a triangle with a height of 75 cm and its base, which is the highest pressure, corresponds to the end of the steel pile. Furthermore, transient dynamic analysis was performed to obtain the deck deformation in the length direction and consequently, the skew of the upper part of steel piles was compared to its initial state.

3.3. Fatigue Life Assessment by Utilizing Probabilistic Approach

The results of thermal and structural analyses in different working conditions showed that load histories applied to the structure had time-dependent values. In other words, the type of load is variable amplitude loading. In the previous section, the most critical region of integrated bridge (i.e., H cross-section steel piles) was determined, which is apt to fail under cyclic loading based on the results of the thermal–structural coupling analysis [52]. Afterward, time histories of stress tensor components were extracted in the critical element for large and small variations [42]. Next, the time history of von Mises equivalent stress was calculated on the critical element for both loading modes. This well-known equivalent criterion is appropriate, since the time histories of the stress tensor components showed that proportional loading prevails in the critical element [42,52]. On the other hand, the maximum and minimum values of all the normal and shear stresses occurred at an equal time [54,55,56]. Eventually, service lifetime of IPE-220 steel pile was assessed using an algorithm based on the probabilistic approach presented by Reza Kashyzadeh [40]. Additionally, two variables influencing the accuracy of the algorithm, including the curve fitting order and stress counting ranges, were optimized so that the statistical responses could be examined more accurately. Moreover, the results obtained from the statistical algorithm were compared with the fatigue analysis results in the finite element software. Because both of them used the same criterion (i.e., von Mises) for equivalent stress, only the evaluation method is different.

4. Results and Discussion

4.1. Thermal Analysis

The temperature distribution contour in the entire structure of the integrated concrete bridge with steel piles was extracted separately in different months; for example, the temperature contour for the first month of the year is shown in Figure 8. The details of the thermal analysis results for all months are also given in Table 4.
The obtained results indicated that in the warm seasons of the year, the temperature of the concrete deck is significantly higher than other seasons and in other parts. Moreover, in these seasons, the difference between the maximum and minimum temperatures is more than other seasons. Accordingly, temperature changes and temperature gradients of the structure were extracted.

4.2. Thermal–Structural Coupling Analysis

The longitudinal deformation contour of the deck in the integrated concrete bridge with steel piles was extracted due to the mean values of monthly temperature changes as the results of the thermal–structural coupling analysis (Figure 9).
As Figure 9 shows, the system deformation is completely symmetric. This is because both the initial model of the symmetrical bridge and the temperature distribution in different parts, water conditions, as well as the number of steel piles and their location were symmetric, which indicates the accuracy of the response obtained from the FE analysis [37]. In addition, the maximum deviation of the upper part of steel piles with IPE-220 characteristic is equal to 2.45 mm (the results extracted at the end of the 12th month of the year). This deformation was also observed in the area of 1.3 m above the steel piles. Moreover, the area of 1.25 m from the bottom of the steel pile was without deformation (in real, the deformation was so small that it can be ignored). Afterward, the deformation history via months for the critical area, including both modes of large and small variations, was extracted and compared to each other in Figure 10.
From this Figure, deformation changed suddenly with the month, and it is not continuous, because, as stated in Section 3.1.1, temperature changes were considered discontinuously and suddenly without the passage time from one event to other. Rather, only the duration of the novel model staying at any temperature is equal to half a day, i.e., 12 h. This is the reason why there are several jumps in the stress or deformation, and these jumps indicate the change in the day, month, or season. The system response related to the loading conditions of large variations indicated that a deformation of 3.3157 mm also occurred in the upper part of the bridge, which is associated with the passing of the assumed ambient temperature equal to 22 degrees compared to the temperature gradient changes in the first month. On the other hand, the results of FE simulation showed that the effect of the minimum and maximum temperatures applied to the structure in comparison with the effect of mean temperature applied to the structure was different in the deformation created in the upper part of the steel pile. In other words, the relationship between temperature changes and deformation variations was completely linear, which indicates the correctness of the FE response considering thermal length change in metals (it has been proven in physics that the change in metal’s length at high temperatures directly relates to the temperature, initial length, and the longitudinal expansion coefficient of the metal). It is clear that each of these deformation histories and their repetition would result in their unique damage that is effective in calculating and predicting the fatigue life of a structure.

4.3. Fatigue Analysis

Figure 11 presents the time histories of stress tensor components, including normal and shear stresses in terms of various months, in the critical element for small variations mode. In addition, the results showed that the trend of stress changes is the same in both modes of large and small variations and only the stress values shifted. Therefore, presenting the stress components for the large variations mode was omitted in this manuscript. However, the stress levels in the large temperature variations mode are much smaller than the stress levels in the small temperature variations mode, and this behavior was observed in all normal stress components, but not in the case of shear stress components. Although, the difference in the values of stress components leads to the creation of different von Mises equivalent stress histories. Therefore, the von Mises stress history for both studied modes is demonstrated in Figure 12.
Level counting was carried out by considering various stress ranges including 5, 10, and 20 MPa. Additionally, normalization of the values was carried out to plot Probability Distribution of Stress (PDS). Figure 13 illustrates the PDS of von Mises for small temperature variations.
It is clear that as the stress count range decreases, the accuracy of statistical operations increases, but this is not always true, and as the data shrinks and their number increases, calculation errors will occur, especially in statistical parameters. Moreover, the results of previous studies have shown that the effects of natural resources mostly have Gaussian probability distribution (normal). Therefore, in this issue, probably the 20 MPa stress range is more suitable compared to the others. However, different orders of Fourier series were used to fit the PDS data in all three states of the stress range. The general equation is written as follows:
y = a 0 + n = 1 n = a n × cos ( n x w ) + n = 1 n = b n × sin ( n x w )
in which a 0 , a n ,   and   b n are the Fourier coefficients, and w represents the non-linear system frequency. Additionally, index n indicates the order of the Fourier series. The initial data related to the stress counting curves (Figure 13) were entered as inputs in MATLAB software. Then the curve fitting module was selected and the Fourier method was set. The various coefficients obtained for this approximation as well as the accuracy measurement criteria for different ranges of stress levels are reported in Table 5, Table 6 and Table 7. In this regard, Equations (2) and (3) were used to calculate the error criteria [1,57].
R 2 = i = 1 n ( f E X P , i F ¯ E X P ) ( f f i t t i n g , i F ¯ f i t t i n g ) i = 1 n ( ( f E X P , i F ¯ E X P ) 2 ( f f i t t i n g , i F ¯ f i t t i n g ) 2 )  
RMSE = 1 n i = 1 n ( f f i t t i n g , i f E X P , i ) 2
in which, n is the number of fed samples, f E X P and f f i t t i n g represent the experimental values and predicted values by fitting method, respectively. The values of F ¯ E X P and F ¯ f i t t i n g were determined as follows [58]:
F ¯ E X P = 1 n i = 1 n f E X P , i
F ¯ f i t t i n g = 1 n i = 1 n f f i t t i n g , i
Considering different error criteria reported in the above tables and the shape of the PDS function, the stress leveling range of 20 MPa and the first-order Fourier series were selected for future research. Next, fatigue life of the system on the critical region was calculated using statistical parameters, which included the number of peak and Fourier curve fitting data [40,42].
E [ D ] = E [ P ] × N K 0 σ eq , max S m . F ( S ) dS
where E[D] and E[P] are the mathematical expectation of fatigue damage and the number of upload history peaks, respectively [40,42]. In addition, F(S) is the function of PDS (F(S) = 0.2418–0.2103 × Cos (0.085508 × S) + 0.1693 × Sin (0.085508 × S)). The m and k are material constant, which are obtained experimentally and based on the Basquin equation for HCF regime as N × S m = k . In summary, the prediction algorithm of fatigue life due to variable amplitude multi-axial loading based on the statistical parameters used in this research is given in the Appendix A.
As expected, the fatigue life of steel piles due to small temperature variations was much shorter than that of steel piles due to the large temperature variations. In this regard, loading conditions of small temperature variations contain the maximum and minimum temperature values per month, which led to higher temperature gradients applied to the system. The results of fatigue analysis indicated that by considering the mean temperature of each month, the middle steel piles of the bridge will last over 610 years. In this case study, if the maximum and minimum temperatures are considered for every month, its lifetime would be approximately 108 years. This difference is almost more than 550%. To compare the results obtained from this methodology with the routine one for fatigue life prediction (i.e., cycle counting by rain-flow technique and employing the linear damage accumulation rule), the results of variable domain fatigue analysis in Ncode-Design-Life module of ANSYS WORKBENCH software are given below. From Figure 14, the routine fatigue prediction method has reported the fatigue lifetime of the structure equal to 98.427 and 705.12 years, respectively, to consider small and large temperature variations. The difference between both methodologies for predicting the fatigue life of the structure is less than 16% and 10%, respectively, according to the type of loading including large and small temperature variations. However, in calculating the fatigue life of the structure using the present algorithm and also using Miner’s linear damage rule, it does not consider the precedence and latency of the amplitudes, and this issue can have a significant impact on the fatigue life of the structure [27,59]. In summary, to perform fatigue life calculations, it is necessary to consider the small daily changes to obtain a more accurate and realistic response. This issue is in the future plans of the authors.

5. Conclusions

In the current study, the fatigue life of H cross-section steel piles of the integrated concrete bridge installed on water subjected to the temperature variations was predicted using a probabilistic approach. In this regard, the effect of details in the temperature history was considered as an influential variable in the calculation of fatigue life. Temperature data were primarily collected over a one year period, and two types of loading, called large variations (i.e., monthly mean temperature variations) and small variations (i.e., maximum and minimum monthly temperature values), were considered. Thermal analysis of the real-scale bridge model was conducted to extract the temperature distribution and temperature gradient. Furthermore, the previous results were coupled to the structural analysis, water pressure was applied as a triangular loading, and transient dynamic analysis was performed to extract the longitudinal deformation of the bridge and its members, particularly, in the concrete deck and middle steel piles. Next, the deformation history in the critical region was extracted considering both types of loading (large and small variations). Eventually, the fatigue life of the H cross-section steel pile was assessed. To increase the prediction accuracy in the used algorithm, two parameters of the stress counting range and the order of the Fourier series were investigated and the best one was selected. Finally, the findings revealed that the lifetime of steel piles subjected to the monthly temperature variations was about 610 and 108 years for the loading conditions of large and small changes, respectively. These values were obtained using fatigue analysis in the software, respectively equal to 705.12 and 98.427. One of the most important achievements of this research is that it could recommend computational engineers to consider small temperature changes as much as possible to obtain the fatigue life of the bridge due to the air temperature variations. It is also better to enter temperature changes in the calculations daily to achieve an accurate and close to reality response.

Author Contributions

Conceptualization, M.H.A.E. and K.R.K.; methodology, H.A., M.H.A.E. and K.R.K.; software, H.A. and K.R.K.; validation, K.R.K.; formal analysis, H.A., M.H.A.E. and K.R.K.; investigation, H.A., M.H.A.E. and K.R.K.; resources, K.R.K.; data curation, K.R.K.; writing—original draft preparation, H.A., M.H.A.E. and K.R.K.; writing—review and editing, K.R.K.; visualization, K.R.K.; supervision, M.H.A.E. and K.R.K.; project administration, K.R.K.; funding acquisition, K.R.K., All authors have read and agreed to the published version of the manuscript.

Funding

This research received no external funding.

Institutional Review Board Statement

Not applicable.

Informed Consent Statement

Informed consent was obtained from all subjects involved in the study.

Data Availability Statement

The data that support the findings of this study are available from the corresponding author upon reasonable request.

Acknowledgments

This paper has been supported by the RUDN University Strategic Academic Leadership Program.

Conflicts of Interest

The authors declare no conflict of interest.

Appendix A

Figure A1 displays a new algorithm for estimating component fatigue life based on the probabilistic approach presented by the first author. In addition, by studying automotive components with complex geometry and under severe loading conditions, he has shown that the use of this algorithm is better than the use of routine fatigue life prediction methods, such as cycle counting using the rain-flow technique and employing various accumulation damage theories. However, in this study, a small change is given in this algorithm and it is the equivalent stress criterion. The Liu–Zenner criterion is used in this algorithm because many scholars have proved that for non-proportional loading, the use of this criterion gives the most accurate prediction. However, in this study, it was shown that the loading is proportional and thus, von Mises equivalent stress criterion was used.

References

  1. Reza Kashyzadeh, K.; Amiri, N.; Ghorbani, S.; Souri, K. Prediction of Concrete Compressive Strength Using a Back-Propagation Neural Network Optimized by a Genetic Algorithm and Response Surface Analysis Considering the Appearance of Aggregates and Curing Conditions. Buildings 2022, 12, 438. [Google Scholar] [CrossRef]
  2. Fernandes Neto, J.A.D.; Haach, V.G. Flexural and direct tensile strength ratio for concrete unusual cross-sections. Rev. IBRACON De Estrut. E Mater. 2022, 16. [Google Scholar] [CrossRef]
  3. Ahmad, M.; Tang, X.W.; Qiu, J.N.; Ahmad, F.; Gu, W.J. Application of machine learning algorithms for the evaluation of seismic soil liquefaction potential. Front. Struct. Civ. Eng. 2021, 15, 490–505. [Google Scholar] [CrossRef]
  4. Tang, Y.X.; Lee, Y.H.; Amran, M.; Fediuk, R.; Vatin, N.; Kueh, A.B.H.; Lee, Y.Y. Artificial Neural Network-Forecasted Compression Strength of Alkaline-Activated Slag Concretes. Sustainability 2022, 14, 5214. [Google Scholar] [CrossRef]
  5. Ahmad, M.; Kami´nski, P.; Olczak, P.; Alam, M.; Iqbal, M.J.; Ahmad, F.; Sasui, S.; Khan, B.J. Development of Prediction Models for Shear Strength of Rockfill Material Using Machine Learning Techniques. Appl. Sci. 2021, 11, 6167. [Google Scholar] [CrossRef]
  6. Huang, L.; Jiang, W.; Wang, Y.; Zhu, Y.; Afzal, M. Prediction of long-term compressive strength of concrete with admixtures using hybrid swarm-based algorithms. Smart Struct. Syst. 2022, 29, 433–444. [Google Scholar] [CrossRef]
  7. Ahmad, M.; Al-Mansob, R.A.; Jamil, I.; Al-Zubi, M.A.; Sabri, M.M.S.; Alguno, A.C. Prediction of Rockfill Materials’ Shear Strength Using Various Kernel Function-Based Regression Models—A Comparative Perspective. Materials 2022, 15, 1739. [Google Scholar] [CrossRef] [PubMed]
  8. Herath, H.M.U.R.; Dissanayake, P.B.R. Proposing a Methodology to Identify the Optimum Mix Design of Autoclaved Aerated Concrete Blocks in the Context of Sri Lanka. In ICSBE 2020; Springer: Singapore, 2020; pp. 507–517. [Google Scholar] [CrossRef]
  9. Rahchamani, G.; Movahedifar, S.M.; Honarbakhsh, A. Fusion-Learning-Based Optimization: A Modified Metaheuristic Method for Lightweight High-Performance Concrete Design. Complexity 2022, 2022, 6322834. [Google Scholar] [CrossRef]
  10. DeRousseau, M.A.; Kasprzyk, J.R.; Srubar Iii, W.V. Computational design optimization of concrete mixtures: A review. Cem. Concr. Res. 2018, 109, 42–53. [Google Scholar] [CrossRef]
  11. Zhang, J.; Huang, Y.; Wang, Y.; Ma, G. Multi-objective optimization of concrete mixture proportions using machine learning and metaheuristic algorithms. Constr. Build. Mater. 2020, 253, 119208. [Google Scholar] [CrossRef]
  12. García-Segura, T.; Yepes, V.; Martí, J.V.; Alcalá, J. Optimization of concrete I-beams using a new hybrid glowworm swarm algorithm. Lat. Am. J. Solids Struct. 2014, 11, 1190–1205. [Google Scholar] [CrossRef]
  13. Kantarci, F.; Türkmen, I.; Ekinci, E. 5—Optimization of production parameters of alkali-activated concrete. In Handbook of Advances in Alkali-Activated Concrete; Woodhead Publishing: Sawston, UK, 2022; pp. 89–106. [Google Scholar] [CrossRef]
  14. Reza Kashyzadeh, K.; Ghorbani, S.; Forouzanmehr, M. Effects of drying temperature and aggregate shape on the concrete compressive strength: Experiments and Data mining techniques. Int. J. Eng. 2020, 33, 1780–1791. [Google Scholar] [CrossRef]
  15. Paya-Zaforteza, I.; Yepes, V.; Gonzalez-Vidosa, F.; Hospitaler, A. Multiobjective optimization of concrete frames by simulated annealing. Comput. -Aided Civ. Infrastruct. Eng. 2008, 23, 596–610. [Google Scholar] [CrossRef]
  16. Abd Elrehim, M.Z.; Eid, M.A.; Sayed, M.G. Structural optimization of concrete arch bridges using Genetic Algorithms. Ain Shams Eng. J. 2019, 10, 507–516. [Google Scholar] [CrossRef]
  17. Arghavan, A.; Reza Kashyzadeh, K.; Asfarjani, A.A. Investigating effect of industrial coatings on fatigue damage. Appl. Mech. Mater. 2011, 87, 230–237. [Google Scholar] [CrossRef]
  18. Kashyzadeh, K.R.; Arghavan, A. Study of the effect of different industrial coating with microscale thickness on the CK45 steel by experimental and finite element methods. Strength Mater. 2013, 45, 748–757. [Google Scholar] [CrossRef]
  19. Lee, Y.L.; Pan, J.; Hathaway, R.; Barkey, M. Fatigue Testing and Analysis: Theory and Practice; Butterworth-Heinemann: Oxford, UK, 2005; Volume 13, ISBN 0-7506-7719-8. [Google Scholar]
  20. Reza Kashyzadeh, K.; Souri, K.; Gharehsheikh Bayat, A.; Safavi Jabalbarez, R.; Ahmad, M. Fatigue Life Analysis of Automotive Cast Iron Knuckle under Constant and Variable Amplitude Loading Conditions. Appl. Mech. 2022, 3, 517–532. [Google Scholar] [CrossRef]
  21. Maleki, E.; Unal, O.; Kashyzadeh, K.R. Effects of conventional, severe, over, and re-shot peening processes on the fatigue behavior of mild carbon steel. Surf. Coat. Technol. 2018, 344, 62–74. [Google Scholar] [CrossRef]
  22. Maleki, E.; Unal, O.; Kashyzadeh, K.R. Fatigue behavior prediction and analysis of shot peened mild carbon steels. Int. J. Fatigue 2018, 116, 48–67. [Google Scholar] [CrossRef]
  23. Maleki, E.; Unal, O.; Reza Kashyzadeh, K. Efficiency analysis of shot peening parameters on variations of hardness, grain size and residual stress via Taguchi approach. Met. Mater. Int. 2019, 25, 1436–1447. [Google Scholar] [CrossRef]
  24. Maleki, E.; Farrahi, G.H.; Reza Kashyzadeh, K.; Unal, O.; Gugaliano, M.; Bagherifard, S. Effects of conventional and severe shot peening on residual stress and fatigue strength of steel AISI 1060 and residual stress relaxation due to fatigue loading: Experimental and numerical simulation. Met. Mater. Int. 2021, 27, 2575–2591. [Google Scholar] [CrossRef]
  25. Maleki, E.; Unal, O.; Kashyzadeh, K.R.; Bagherifard, S.; Guagliano, M. A systematic study on the effects of shot peening on a mild carbon steel: Microstructure, mechanical properties, and axial fatigue strength of smooth and notched specimens. Appl. Surf. Sci. Adv. 2021, 4, 100071. [Google Scholar] [CrossRef]
  26. Maleki, E.; Unal, O.; Reza Kashyzadeh, K. Influences of shot peening parameters on mechanical properties and fatigue behavior of 316 L steel: Experimental, Taguchi method and response surface methodology. Met. Mater. Int. 2021, 27, 4418–4440. [Google Scholar] [CrossRef]
  27. Reza Kashyzadeh, K. Fatigue Failure in Different Fields of Engineering. Coursera Website. 2020. Available online: https://list.xpdev.ru/all/course/11729/ (accessed on 1 October 2022).
  28. Wang, X.; Hu, L.; Xu, Q.; Chen, D.X.; Sun, S.T. Influence of martensitic transformation on welding residual stress in plates and pipes. Sci. Technol. Weld. Join. 2017, 22, 505–511. [Google Scholar] [CrossRef]
  29. Chen, X.; Wang, P.; Pan, Q.; Lin, S. The effect of martensitic phase transformation dilation on microstructure, strain–stress and mechanical properties for welding of high-strength steel. Crystals 2018, 8, 293. [Google Scholar] [CrossRef] [Green Version]
  30. Luo, Y.; Zheng, H.X.; Jiang, W.; Fang, Y.; Zhao, X. Improving Structure Integrity and Fatigue Properties of 316L Welded Joint by Water Jet Peening Treatment. J. Mater. Eng. Perform. 2022, 1–16. [Google Scholar] [CrossRef]
  31. Luo, Y.; Zhang, Q.; Zheng, H.X.; Jiang, W. Reducing Full-Field Residual Stress of Girth Weld with Thick Wall by Combining Local PWHT and Water Jet Peening. J. Press. Vessel. Technol. 2022, 144, 061302. [Google Scholar] [CrossRef]
  32. Movahedifar, M.; Bolouri Bazaz, J.; Jafari, M.K. Influence of thermal elongation of integrated bridge deck on the amount of pressure applied to the bridges. In Proceedings of the 6th International Congress of Civil Engineering, Semnan University, Semnan, Iran, 26 April 2011. [Google Scholar]
  33. Najafi, H. Investigation of the influence of height deck on the behavioral parameters of integrated bridge retaining piles in clay soils with rock shallow floor. In Proceedings of the 10th International Congress of Civil Engineering, Tabriz University, Tabriz, Iran, 5 May 2015. [Google Scholar]
  34. Ehteshami, A.; Shooshtari, A. Investigation of soil and structure interaction on seismic behavior of integrated bridges. In Proceedings of the 8th Congress of Civil Engineering, Babol University, Mazandaran, Iran, 7 May 2014. [Google Scholar]
  35. Karalar, M.; Dicleli, M. Effect of thermal induced flexural strain cycles on the low cycle fatigue performance of integral bridge steel H-piles. Eng. Struct. 2016, 124, 388–404. [Google Scholar] [CrossRef]
  36. Arsoy, S. Proposed mathematical model for daily and seasonal thermal bridge displacements. Transp. Res. Rec. 2008, 16, 3–12. [Google Scholar] [CrossRef]
  37. Abdollahnia, H.; Alizadeh Elizei, M.H.; Reza Kashyzadeh, K. Fatigue life assessment of integral concrete bridges with H cross-section steel piles mounted in water. J. Fail. Anal. Prev. 2020, 20, 1661–1672. [Google Scholar] [CrossRef]
  38. Abdollahnia, H.; Alizadeh Elizei, M.H.; Reza Kashyzadeh, K. Low-cycle fatigue behavior of H-shaped steel piles of an integral concrete bridge subjected to temperature variations. Mater. Today Proc. 2021, 46, 1657–1662. [Google Scholar] [CrossRef]
  39. Abdollahnia, H.; Alizadeh Elizei, M.H.; Reza Kashyzadeh, K. Multiaxial Fatigue Life Assessment of Integral Concrete Bridge with a Real-Scale and Complicated Geometry Due to the Simultaneous Effects of Temperature Variations and Sea Waves Clash. J. Mar. Sci. Eng. 2021, 9, 1433. [Google Scholar] [CrossRef]
  40. Kashyzadeh, K.R. A new algorithm for fatigue life assessment of automotive safety components based on the probabilistic approach: The case of the steering knuckle. Eng. Sci. Technol. Int. J. 2020, 23, 392–404. [Google Scholar] [CrossRef]
  41. Reza Kashyzadeh, K.; Farrahi, G.H.; Shariyat, M.; Ahmadian, M.T. The Role of Wheel Alignment Over the Fatigue Damage Accumulation in Vehicle Steering Knuckle. J. Stress Anal. 2018, 3, 21–33. [Google Scholar] [CrossRef]
  42. Kashyzadeh, K.R.; Ghorbani, S. Comparison of some selected time domain fatigue failure criteria dedicated for multi input random non-proportional loading conditions in industrial components. Eng. Fail. Anal. 2022, 106907. [Google Scholar] [CrossRef]
  43. Kashyzadeh, K.R.; Farrahi, G.H. Improvement of HCF life of automotive safety components considering a novel design of wheel alignment based on a Hybrid multibody dynamic, finite element, and data mining techniques. Eng. Fail. Anal. 2022, 106932. [Google Scholar] [CrossRef]
  44. Pétursson, H.; Collin, P.; Veljkovic, M.; Andersson, J. Monitoring of a Swedish integral abutment bridge. Struct. Eng. Int. 2011, 21, 175–180. [Google Scholar] [CrossRef] [Green Version]
  45. Razmi, J.; Ladani, L.; Aggour, M.S. Fatigue crack initiation and propagation in piles of integral abutment bridges. Comput. -Aided Civ. Infrastruct. Eng. 2013, 28, 389–402. [Google Scholar] [CrossRef]
  46. Girton, D.D.; Hawkinson, T.R.; Greinmann, L.F. Validation of design recommendations for integral-abutment piles. J. Struct. Eng. 1991, 117, 2117–2134. [Google Scholar] [CrossRef]
  47. Lawyer, A.; French, C.; Shield, C.K. Field performance of integral abutment bridge. Transp. Res. Rec. 2000, 1740, 108–117. [Google Scholar] [CrossRef]
  48. Arsoy, S.; Duncan, J.M.; Barker, R.M. Behavior of a semi-integral bridge abutment under static and temperature-induced cyclic loading. J. Bridge Eng. 2004, 9, 193–199. [Google Scholar] [CrossRef]
  49. Rafi, M.M.; Nadjai, A. Analytical behaviors of steel and CFRP reinforced concrete beams in fire. J. ASTM Int. 2010, 7, 1–21. [Google Scholar]
  50. ASTM E466-15; Standard Practice for Conducting Force Controlled Constant Amplitude Axial Fatigue Tests of Metallic Materials. ASTM International: West Conshohocken, PA, USA, 2015.
  51. Reza Kashyzadeh, K.; Farrahi, G.H.; Shariyat, M.; Ahmadian, M.T. Experimental and finite element studies on free vibration of automotive steering knuckle. Int. J. Eng. 2017, 30, 1776–1783. [Google Scholar] [CrossRef]
  52. Kashyzadeh, K.R.; Farrahi, G.H.; Shariyat, M.; Ahmadian, M.T. Experimental accuracy assessment of various high-cycle fatigue criteria for a critical component with a complicated geometry and multi-input random non-proportional 3D stress components. Eng. Fail. Anal. 2018, 90, 534–553. [Google Scholar] [CrossRef]
  53. Reza Kashyzadeh, K. Effects of axial and multiaxial variable amplitude loading conditions on the fatigue life assessment of automotive steering knuckle. J. Fail. Anal. Prev. 2020, 20, 455–463. [Google Scholar] [CrossRef]
  54. Shariyat, M. A fatigue model developed by modification of Gough’s theory, for random non-proportional loading conditions and three-dimensional stress fields. Int. J. Fatigue 2008, 30, 1248–1258. [Google Scholar] [CrossRef]
  55. Shariyat, M. Three energy-based multiaxial HCF criteria for fatigue life determination in components under random non-proportional stress fields. Fatigue Fract. Eng. Mater. Struct. 2009, 32, 785–808. [Google Scholar] [CrossRef]
  56. Shariyat, M. New multiaxial HCF criteria based on instantaneous fatigue damage tracing in components with complicated geometries and random non-proportional loading conditions. Int. J. Damage Mech. 2010, 19, 659–690. [Google Scholar] [CrossRef]
  57. Maleki, E.; Unal, O.; Seyedi Sahebari, S.M.; Reza Kashyzadeh, K.; Danilov, I. Application of Deep Neural Network to Predict the High-Cycle Fatigue Life of AISI 1045 Steel Coated by Industrial Coatings. J. Mar. Sci. Eng. 2022, 10, 128. [Google Scholar] [CrossRef]
  58. Maleki, E.; Unal, O.; Kashyzadeh, K.R. Surface layer nanocrystallization of carbon steels subjected to severe shot peening: Analysis and optimization. Mater. Charact. 2019, 157, 109877. [Google Scholar] [CrossRef]
  59. Stephens, R.I.; Fatemi, A.; Stephens, R.R.; Fuchs, H.O. Metal Fatigue in Engineering; John Wiley & Sons: Hoboken, NJ, USA, 2000. [Google Scholar]
Figure 1. Details of the real-scale geometric model of an integrated concrete bridge with H-shaped steel piles.
Jmse 10 01802 g001
Figure 2. Temperature-dependent coefficient of thermal expansion for different materials used in the present study, including (a) structural steel and (b) ordinary concrete [49].
Jmse 10 01802 g002
Figure 3. Fabrication of HCF test specimens: (a) schematic of the preparation location of the samples from IPE-220 steel pile and (b) sample geometry and dimensions.
Jmse 10 01802 g003
Figure 4. Axial fatigue test results for standard samples fabricated from IPE-220 steel pile.
Jmse 10 01802 g004
Figure 5. The final FE model of the integrated concrete bridge with steel piles based on the studies of mesh convergence.
Jmse 10 01802 g005
Figure 6. Mean values of daily temperature changes in different months for Tehran city [39].
Jmse 10 01802 g006
Figure 7. Comparison of temperature loading conditions in two different modes, including large and small variations.
Jmse 10 01802 g007
Figure 8. Temperature contour of the integrated concrete bridge in the first month of the year.
Jmse 10 01802 g008
Figure 9. Longitudinal deformation contour of the deck in the integrated concrete bridge with steel piles due to the mean values of monthly temperature changes (large variations).
Jmse 10 01802 g009
Figure 10. Comparison of the structure’s deformation due to two types of temperature loading, namely large and small variations.
Jmse 10 01802 g010
Figure 11. Time histories of stress tensor components in the critical region due to small temperature variations, including (a) normal stress in X-direction, (b) normal stress in Y-direction, (c) normal stress in Z-direction, (d) shear stress in XY-plane, (e) shear stress in YZ-plane, and (f) shear stress in XZ- plane.
Jmse 10 01802 g011
Figure 12. The von Mises equivalent stress history for both modes, including (a) small temperature variations and (b) large temperature variations.
Jmse 10 01802 g012
Figure 13. Probabilistic distribution of von Mises equivalent stress on the critical element due to small temperature variations.
Jmse 10 01802 g013
Figure 14. Fatigue life contour of the steel pile of an integrated concrete bridge due to temperature variations (the right side image is related to the large variations and the left side image is related to the small variations).
Jmse 10 01802 g014
Figure A1. Novel algorithm for estimating the fatigue life of the component based on the probabilistic approach proposed by the first author [42].
Jmse 10 01802 g0a1
Table 1. Dimensional specifications and geometrical parameters of piles used in the current study.
Jmse 10 01802 i001SymbolUnitValue
IPE-220IPE-600
hmm220600
Bmm110220
smm5.912
tmm9.219
rmm1224
cmm21.243
h-2cmm177514
A cm 2 33.4156
G kg / m 26.2122
J x cm 4 277092,080
W x cm 3 2523070
I x cm9.1124.3
J y cm 4 2053390
W y cm 3 37.3308
I y cm2.484.66
Table 2. Mechanical characteristics of the materials used in the current study [37,39].
ParameterUnitValue
Structural SteelOrdinary Concrete
Density Kg / m 3 78502300
Young ModulusGPa20030
Poisson’s Ratio---0.30.18
Bulk ModulusGPa166---
Shear ModulusGPa76.92---
Tensile Yield StressMPa250---
Compressive Yield StressMPa250---
Tensile Ultimate StrengthMPa4605
Compression Ultimate StrengthMPa---41
Table 3. Thermal properties of the materials used in the current study.
ParameterUnitValue
Structural SteelOrdinary Concrete
Reference temperature 2222
Coefficient of thermal expansion (CTE) 10 5 × 1 1.30.95
Table 4. Thermal analysis results of the integrated concrete bridge subjected to temperature variations.
Month No.Temperature of Bridge Members (℃)
Maximum ValueMinimum Value
131.346712.3399
233.87169.7182
341.20611.9898
447.2158−5.3795
540.74830.4667
628.677812.6523
730.970313.4125
839.84133.9106
940.30693.6578
1031.062013.1651
1127.994113.4379
1240.95621.1799
Table 5. Fourier coefficients and different types of fitting errors considering various orders of Fourier series for stress leveling of 5 MPa.
SymbolFirst-OrderSecond-OrderThird-Order
Fourier coefficients a 0 0.07780.080210.05739
a 1 −0.08372−0.068990.002429
b 1 −0.063180.04705−0.03576
a 2 ------−0.013070.06272
b 2 ------−0.1736−0.04106
a 3 ------------−0.03809
b 3 ------------−0.05169
System frequencyw0.37810.42460.4442
Assessment criteriaSSE0.11880.12260.1206
R-square0.29730.41970.429
RMSE0.099480.11070.1228
Table 6. Fourier coefficients and different types of fitting errors considering various orders of Fourier series for stress leveling of 10 MPa.
SymbolFirst-OrderSecond-OrderThird-Order
Fourier coefficients a 0 0.10750.12290.1226
a 1 −0.04235−0.05927−0.06913
b 1 0.10410.086690.08115
a 2 ------−0.03531−0.04746
b 2 ------0.026590.02173
a 3 ------------0.03297
b 3 ------------0.01008
System frequencyw0.069860.079810.08205
Assessment criteriaSSE0.023510.016670.01121
R-square0.69220.78180.8533
RMSE0.068570.074540.1059
Table 7. Fourier coefficients and different types of fitting errors considering various orders of Fourier series for stress leveling of 20 MPa.
SymbolFirst-OrderSecond-OrderThird-Order
Fourier coefficients a 0 0.24180.19820.1372
a 1 −0.21030.17920.01288
b 1 0.1693−0.2073−0.2311
a 2 ------−0.06963−0.1287
b 2 ------−0.021050.007925
a 3 ------------0.05035
b 3 ------------0.01083
System frequencyw0.0855082.4352.273
Assessment criteriaSSE0.0020052.778 × 10−322.136 × 10⁻³²
R-square0.988311
RMSE0.04478NaNNan
Publisher’s Note: MDPI stays neutral with regard to jurisdictional claims in published maps and institutional affiliations.

