Article

Research on Multi-Energy Integrated Ship Energy Management System Based on Hierarchical Control Collaborative Optimization Strategy

1
College of Intelligent Science and Engineering, Harbin Engineering University, Harbin 150001, China
2
School of Information Science and Technology, Fujian University of Technology, Fuzhou 350100, China
3
National Research Base of Intelligent Manufacturing Service, Chongqing Technology and Business University, Chongqing 400067, China
*
Author to whom correspondence should be addressed.
J. Mar. Sci. Eng. 2022, 10(10), 1556; https://doi.org/10.3390/jmse10101556
Submission received: 20 September 2022 / Revised: 11 October 2022 / Accepted: 18 October 2022 / Published: 20 October 2022
(This article belongs to the Special Issue Smart Control of Ship Propulsion System)

Abstract

:
The propulsion systems of hybrid electric ship output and load demand have substantial volatility and uncertainty, so a hierarchical collaborative control energy management scheme of the ship propulsion system is proposed in this paper. In a layer of control scheme, the traditional perturbation algorithm is improved. Increasing the oscillation detection mechanism and establishing the dynamic disturbance step length realizes the real-time stability of maximum power point tracking control. In the second-layer control scheme, the power sensitivity factor and voltage and current double closed-loop controller is introduced. By designing a two-layer coordinated control strategy based on the dynamic droop coefficient, the problem of voltage and frequency deviation caused by load switching is solved. In the third-layer control scheme, due to the need of the optimal scheduling function, the multi-objective particle swarm optimization algorithm was improved through three aspects: introducing the mutation factor, improving the speed formula, and re-initializing the strategy. Compared with other algorithms, this algorithm proves its validity in day-ahead optimal scheduling strategy. The superiority of the hierarchical collaborative optimization control schemes proposed was verified, in which power loss was reduced by 39.3%, the overall tracking time was prolonged by 15.4%, and the environmental cost of the diesel generator was reduced by 8.4%. The control strategy solves the problems of the steady-state oscillation stage and deviation from the tracking direction, which can effectively suppress voltage and frequency fluctuations.

1. Introduction

Ship electric propulsion systems have grown significantly over the last century, but at present advanced new energy ship propulsion technologies require lower pollutant emissions from ships [1]. Clean energy (fuel cells, photovoltaic power generation, wind power generation), advanced control technology, and power energy management technology are being introduced into ship power systems [2,3,4]. As these technologies develop and change, future marine power systems are expected to include generator sets and other alternative power sources with different characteristics. Therefore, electric propulsion systems will become multi-energy complementary, and new hybrid-energy ship propulsion systems will be built to meet the new demands [5,6,7].
Mixing the two types of energy storage systems, Fang, S., et al., proposed a two-step multi-objective optimization method for optimizing the management of all-electric ships, striving to minimize the total operating cost [8]. In order to optimize the operating cost of diesel generators and energy storage systems, Anvari, M., et al., extended the principles of optimal planning and economic dispatch problems to shipboard systems in order to realize the coordinated power supply of diesel generators and energy storage systems [9]. Mistress, G., et al., focused on the parameter identification method of the onboard battery storage system electrical model, which solves the energy storage system degradation problem [10]. Lee, K., et al. realized green ship and low-carbon operation by showing the experimental results of a prototype green ship and achieved the demanding output on the load side with the minimum cost and less volatility [11]. In order to minimize fuel consumption and verify the feasibility of its scheme through simulation, Accetta et al. proposed an energy management system for the electrical system of yachts [12], but most of the existing research focuses on optimizing energy storage. Energy systems and controllers ignore the overall scheduling of power system energy. In addition, previous work has rarely noted that for the hybrid propulsion systems of photovoltaic power generation systems, wind turbines, and diesel generators. It is necessary to carry out the maximum power point tracking control of wind and photovoltaic power generation systems and the system connection of distributed power sources.
Hybrid electric ships are generally designed to improve energy utilization: Brizuela-Mendoza, J.A., et al. [13] analyzed in detail the efficiency of a ship’s DC hybrid power system, constructed an optimization strategy aiming at improving energy efficiency, and provided the optimal on-load operating point of the generator set. Zhu, L., et al. [14] proposed an energy management strategy based on fuzzy logic for a hybrid ship that uses fuel cells, batteries, and supercapacitors as energy sources, aiming to optimize the power distribution among generating units and optimize the performance and fuel economy of the hybrid system.
Fully electric ships in the military field, equipped with sophisticated electronic instruments, require high power quality and fault handling capabilities: Feng, X., et al. [15] proposed a multi-agent system coordination controller for the Marine MVAC power system, which can balance load and power generation in real-time while meeting system operation constraints while considering load priority and reducing the influence of pulse load on power quality by coordinating pulse load and propulsion load. Seenumani, G., et al. [16] proposed a hierarchical control method to meet the real-time requirements, aiming at the power failure problem of all-electric ships for military applications. The top-level controller realized the suboptimal power decomposition of batteries and online power supply to meet the system power demand, while the local controller regulated the power command of each independent power supply. Nelson, M., et al. [17] proposed the use of graph theory to provide complete autonomous control for the power system when the power system fails or the ship task changes.
There are also some energy management strategies for specific needs: Mensah, E., et al. [18] built a model for the design of energy management systems for simulation and including system reconfiguration and load shedding functions, allowing the simulation and analysis of power systems with discrete events. Hou, J., et al. [19] evaluated the interaction of multiple power sources in the ship electric propulsion system with a hybrid energy storage system on the basis of model analysis and revealed the important role of system-level energy management strategy. Kanellos, F. D., et al. [20] proposed an optimization method of load-side management and power generation planning, in which the load-side management is realized by adjusting the power consumption of the propulsion motor and the dynamic programming algorithm is used to solve the optimization problem according to the constraints of ship operation and environment, so as to ensure the operation mode with minimum cost. López, A. R., et al. [21] proposed the adoption of load-shedding technology based on expert system rules in order to control the voltage level of the ship power grid, and the application was verified in a ship power grid. Paran, S., et al. [22] proposed the energy management of ship DC power system based on model predictive control to ensure reasonable load-sharing among generators while maintaining a stable DC bus voltage.
There have been several identified optimization methods for hybrid schemes, such as the use of artificial intelligence, as the appropriate way to enhance the optimization process. Hatata, A. Y., et al. [23] used clonal selection techniques to optimize hybrid solar and wind power schemes with batteries to utilize their outputs with minimal cost and small volatility. Hadidian, M. J., et al. [24] used an intelligent pollination algorithm to optimize the power output of a hybrid system (solar/wind/hydrogen) so as to minimize the total operating cost. Sanajaoba Singh, S., et al. [25] analyzed and studied the effectiveness of cuckoo search using a hybrid solar/wind/battery scheme design problem in remote areas of India. De la Cruz, J., et al. [26] used a well-known heuristic algorithm based on simulated annealing to optimize independent wind power and photovoltaic systems. In another paper, the influence of using predicted load information on the performance of small independent hybrid power was studied [27]. Maleki, A., et al. [28] optimized the size of the battery pack, the area of the PV system, and the fuel consumption of the diesel generator in the hybrid system to minimize the cycle operation cost of the system and used a heuristic algorithm based on tabu search. These hybrid methods provide a new way for microgrid optimization and show certain advantages and application prospects.
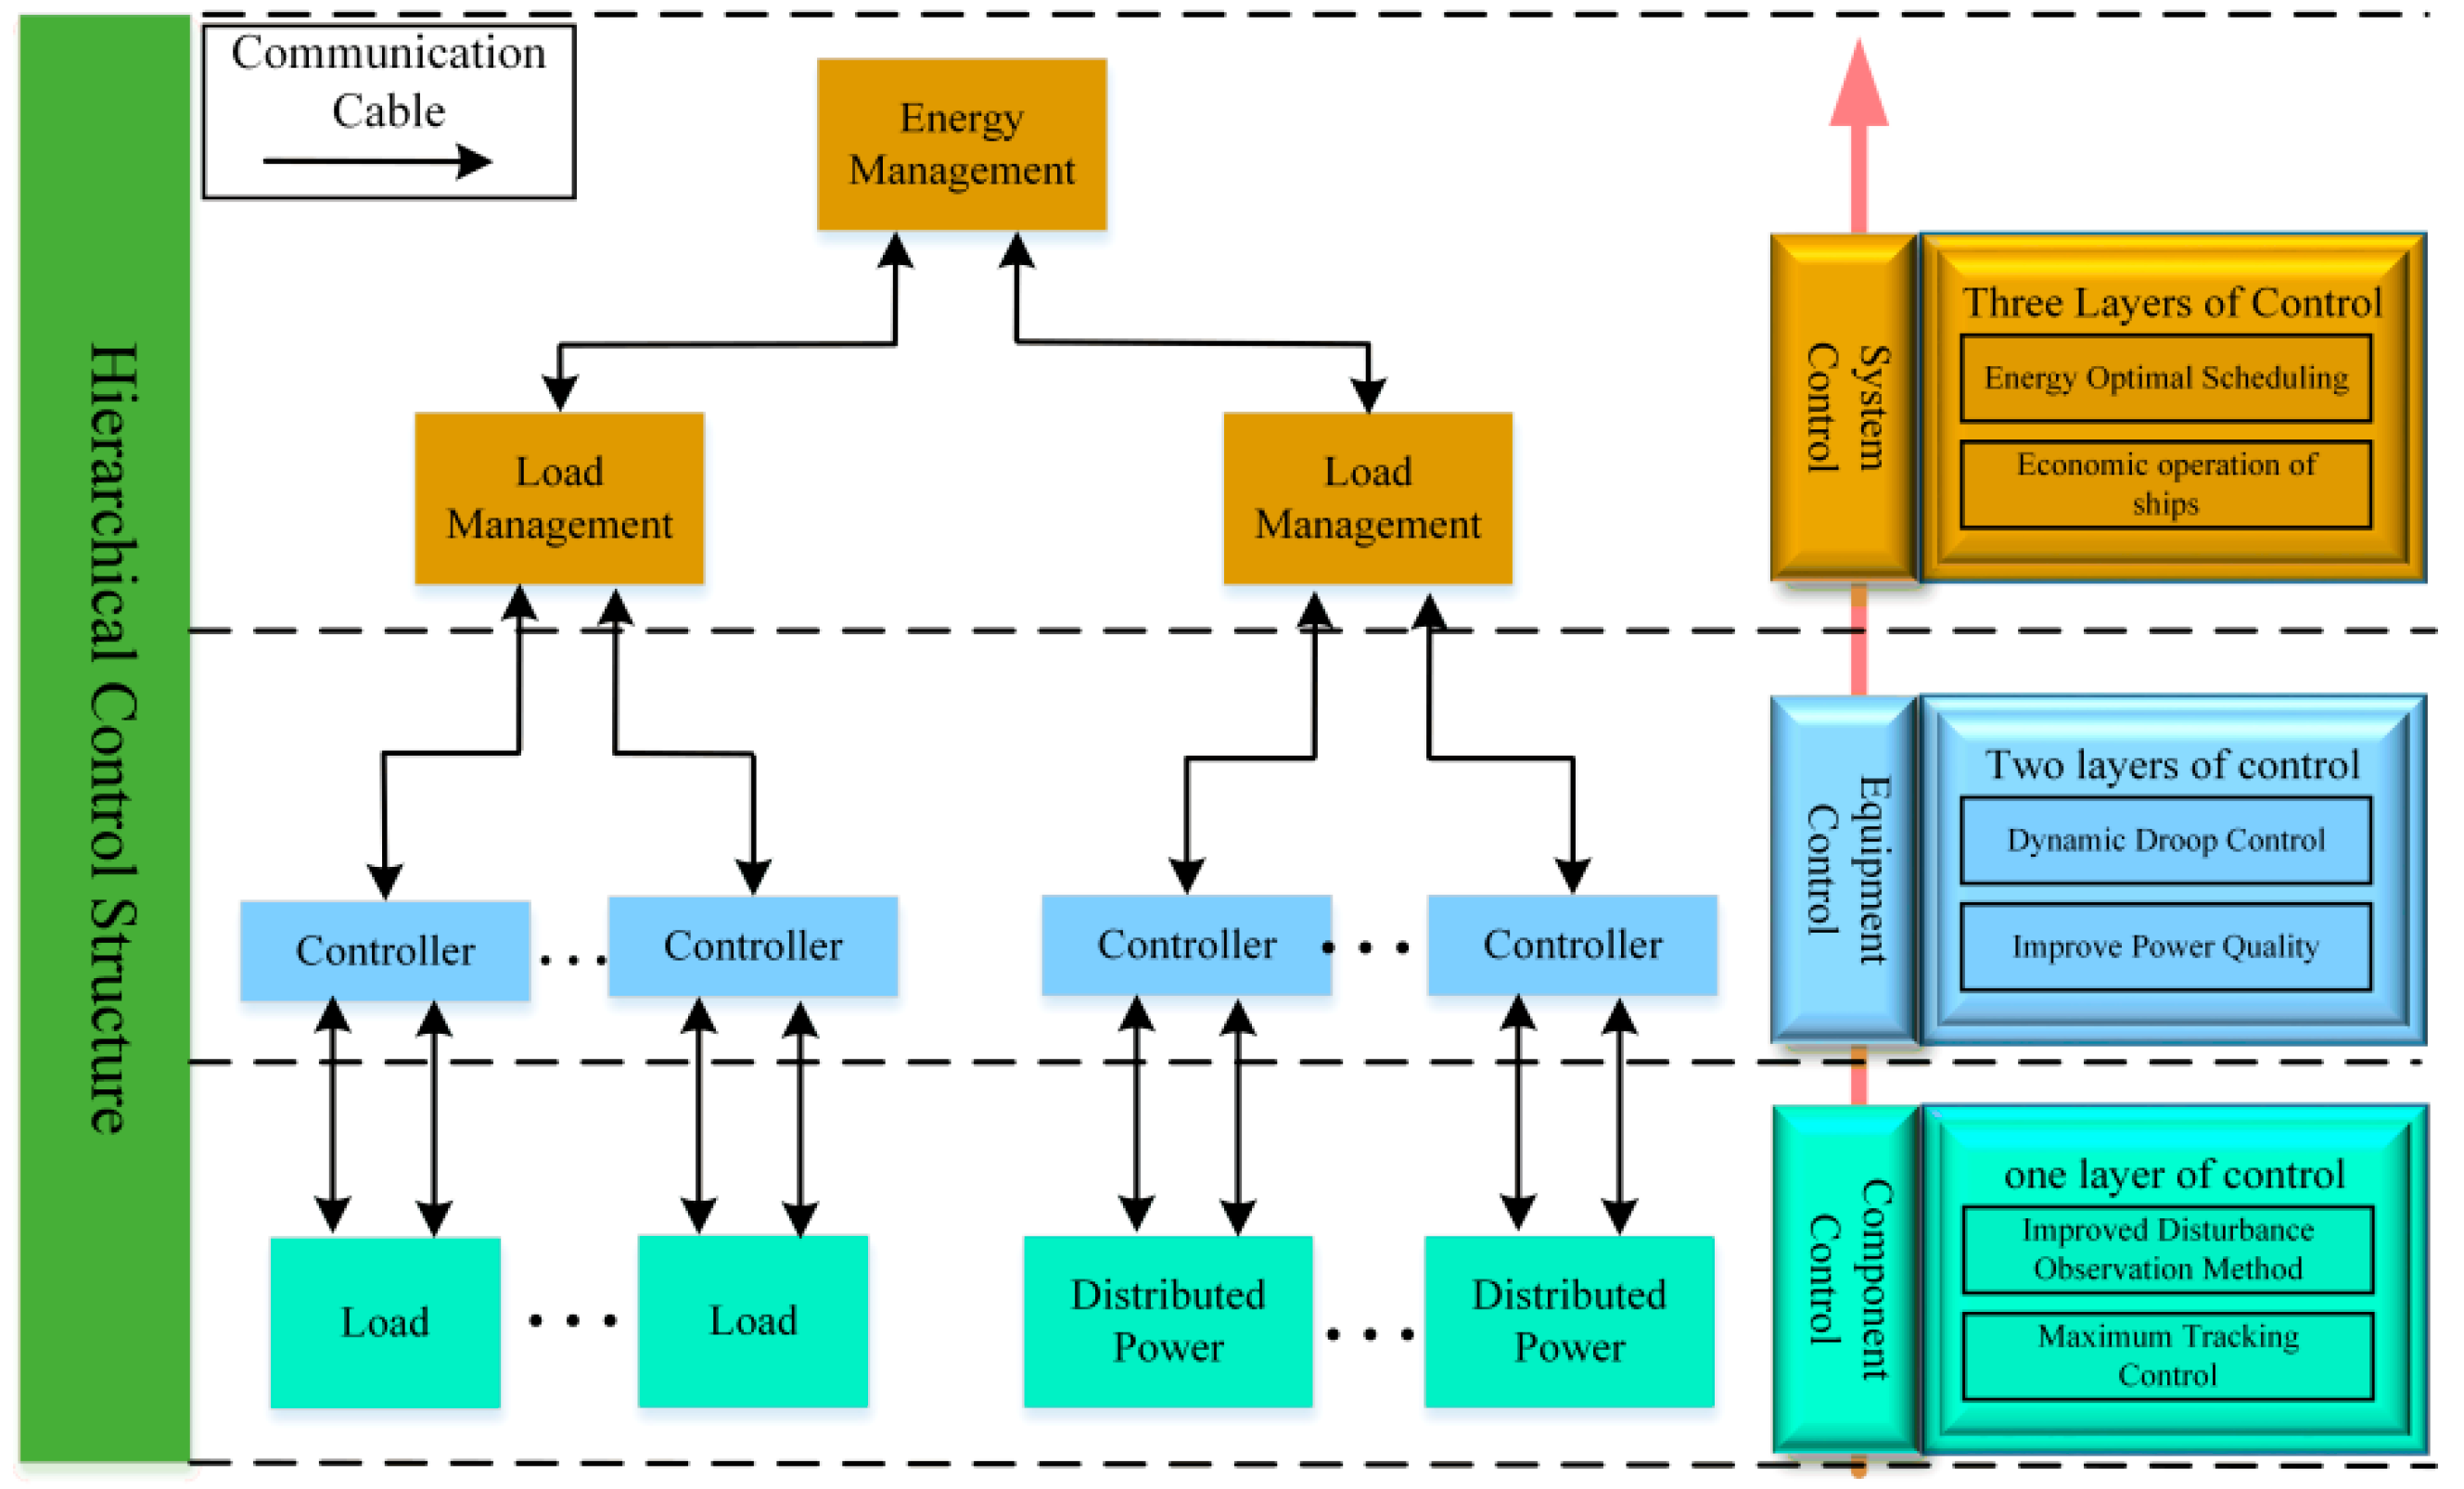
In the master–slave control, one of the distributed power supply (or energy storage unit) controllers is selected as the master controller, and the others are used as the slave controllers. In this mode, the distributed power supply of the main control unit needs to track the change of charge, which requires its power output to be controlled within a certain range, and it can also respond quickly to charge fluctuation. In peer-to-peer control, all distributed power controllers are in the same position [29]. Therefore, when the power required by the load changes, the distributed power supply can make the microgrid return to a stable state by properly adjusting its voltage and frequency, but its control results have certain deviations.
According to the existing research literature, the strategies of paralleling multiple distributed power sources are generally divided into master–slave control and peer-to-peer control. The master–slave control method is simple and easy to implement, mainly relying on high-speed communication units, but the communication cost is high and the system redundancy is poor. The peer-to-peer control in the form of point-to-point, such as droop control, does not require high-bandwidth communication and is easy to implement using the “plug and play” of micro-sources, which meets the needs of the distributed system. Therefore, droop control can be used as an ideal load voltage and frequency control method for the ship propulsion system. There is a conflict between current sharing and voltage regulation due to the virtual impedance introduced by droop control. Additionally, there are problems with the steady-state oscillation phase and deviation from tracking direction. In order to solve the above contradictions, a hierarchical control collaborative optimization strategy for propulsion systems with multiple distributed power sources is proposed.

2. Typical System Structure and Mathematical Modeling of Hybrid Electric Ship

2.1. Typical System Structure

The typical system structure of a ship propulsion system consists of the wind turbine, photovoltaic power generation system, diesel generator set, energy storage system, load, electric energy conversion device, and energy management system. A typical system structure diagram of a hybrid ship is shown in Figure 1. In the following sections, the working principle and mathematical model of the leading equipment in the system will be presented.

2.2. Distributed Power Mathematical Model

2.2.1. Diesel Engine and Speed-Governing System Model

The diesel engine converts the released chemical energy into thermal energy by burning diesel oil and then converts the thermal energy into the mechanical energy of the rotating shaft to provide the motive power for the synchronous generator, forming a closed-loop speed to ensure the stability of the generator speed [30]. The block diagram of the system structure is shown in Figure 2.
According to the external characteristic curve of the diesel engine (torque–speed characteristic curve), when the diesel engine is in a standard and operation state, the resistance torque is balanced with the output torque of the diesel engine. The load power driven by the diesel engine changes, the fuel injection quantity of the diesel engine will change, and the output torque will also change until a new equilibrium state is reached.
According to D’Alembert’s principle, the equation of motion of the unit is:
J d ω g d t + K p ω g = M d M c
where K represents the damping coefficient, which is related to the damping winding; ω g is the angular velocity of the diesel engine; p is the number of pole pairs of the synchronous generator; M d and M c represent, respectively, the output torque and resistance torque of the diesel engine.
When the load carried by the diesel engine decreases, the rotor speed increases. Therefore, in order to keep the speed change of the diesel engine within a reasonable range, a speed control link should be installed on the diesel generator to ensure that the speed of the diesel engine does not fluctuate considerably. The diesel engine speed adjustment system is shown in Figure 3.
When the load increases, the speed of the diesel engine will decrease. Then by comparing with the given speed, the speed feedback unit obtains a speed difference signal and acts on the speed control unit, transmits the control amount to the actuator, and finally injects the oil pump increases the amount of fuel injected, so that the speed of the diesel engine rises to the rated speed. The model of the diesel engine speed control system in Power Systems Computer Aided Design (PSCAD software) is shown in Figure 4.

2.2.2. Synchronous Generator and Excitation System Model

Driven by the diesel engine, the synchronous generator rotates and converts the mechanical energy on the rotating shaft into electrical energy and outputs a three-phase alternating current through the stator [31]. The generator excitation system changes the reactive power output by adjusting the excitation current, thereby changing the output voltage to ensure the stability of the generator output voltage.
When the synchronous generator is mathematically modeled, the rotating dq0 coordinate system is adopted through Park transformation, which can simplify the model and reduce the amount of calculation. The transformation from the abc coordinate system to the dq0 coordinate system is realized through the Park transformation, which can be written as a matrix:
i d i q i 0 = 2 3 cos α cos ( α 2 3 π ) cos ( α + 2 3 π ) sin α sin ( α 2 3 π ) sin ( α + 2 3 π ) 1 2 1 2 1 2 i a i b i c
The potential equation of the dq0 system after Park transformation is:
u d = φ ˙ d ω φ q r i d u q = φ ˙ q ω φ d r i q u 0 = φ ˙ 0 r i 0
The flux linkage equation of the dq0 system after Parker transformation is:
φ a φ b φ c φ f φ D φ Q = L d 0 0 m a f m a D 0 0 L q 0 0 0 m a Q 0 0 L 0 0 0 0 3 2 m f a 0 0 L f L f D 0 3 2 m D a 0 0 L D f L D 0 0 3 2 m Q a 0 0 0 L Q i d i q i 0 i f i D i Q
The synchronous generator excitation system model adopts the AC1A excitation model recommended by IEEE preset in PSCAD, which further stabilizes the output voltage of the synchronous generator by adjusting the magnitude of the excitation current. The model of the synchronous generator and excitation system in PSCAD is shown in Figure 5.

2.2.3. Photovoltaic Power Generation System Model

The photovoltaic cell is the core device of photovoltaic power generation. Its primary function is to convert the light energy of solar radiation into electrical energy through the photovoltaic effect. Since the single-diode model is relatively simple and can be applied to higher irradiance conditions, it can better simulate the actual loss and charge diffusion effect inside the photovoltaic cell, so this paper chooses the single-diode model, and its equivalent circuit is shown in Figure 6.
where I L is the constant current source that produces the photogenerated current and I D represents the current passing through the diode.
A mathematical model of photovoltaic cells is established under standard irradiance R r e f = 1 kW/m2 and ambient temperature conditions T r e f = 25 °C. Through the above brief analysis of the circuit diagram, the output current characteristics of the photovoltaic cell can be obtained, and the following formula can express its mathematical function:
I = I S C 1 A U D e B U O C 1 + C
A = 1 I m I S C e U m B U o c
B = U m U o c 1 ln 1 I m I S C
C = α R R r e f E + R R r e f 1 I S C
D = β E R s C
E = T m T r e f
where α represents the temperature coefficient, I m and U m represent the current and voltage corresponding to the maximum power output, U represents the voltage to the photovoltaic array, U o c represents the open circuit voltage, and T m represents the temperature of the photovoltaic array, and the formula is calculated as follows:
T m = T a + t R
where T a is the ambient temperature, t is the temperature of the photovoltaic array, and R is the actual solar irradiance. Therefore, the following formula can specifically describe the output power of the photovoltaic array:
P = I U = I S C 1 A U D e B U O C 1 + C U
The I V characteristic curve and the P V characteristic curve under ambient temperature and irradiance can be obtained by fitting them with the above formula, as shown in Figure 7.
The model of the photovoltaic power generation system in PSCAD is shown in Figure 8:

2.2.4. Doubly-Fed Wind Power Generation System Model

The doubly-fed wind power generation system comprises wind turbines, shafting modules, doubly-fed wind turbines, and back-to-back double PWM converters. The external wind drives the wind turbine and converts the wind energy into mechanical energy. After the wind turbine rotor passes through the shafting module, the rotational speed is converted to a rotational speed suitable for the doubly-fed generator. The conversion of mechanical energy to electrical energy is realized in the doubly-fed generator [32,33]. The doubly-fed generator generally uses a three-phase wound asynchronous motor. The power system and the stator winding are directly connected, and the rotor winding is connected to the power system through the back-to-back double PWM converter. The schematic diagram of the doubly-fed wind power generation system is shown in Figure 9.
According to Bates’s theory, the calculation formula of the wind energy utilization coefficient C p ( β , λ ) is as follows:
C p ( β , λ ) = 0.5176 116 λ 0.4 β 5 e 21 λ + 0.0068 λ 1 λ = 1 λ + 0.08 β 0.035 β 3 + 1
where β is the pitch angle of the blade and λ is the tip speed ratio, which can be expressed as:
λ = ω T R V 0
where ω T is the rotational speed, R is the radius of the rotor, and V 0 is the wind speed.
The maximum power point tracking control of wind turbines means that under different wind speed conditions, C P can always be kept at the maximum value by controlling the speed of wind turbines. The mechanical power P m captured by the wind turbine can be expressed as:
P m = 1 2 ρ S V 0 3 C p ( β , λ )
where ρ is the air density and S sweeps the area of the rotor. The model of the doubly-fed wind power generation system in PSCAD is shown in Figure 10.

2.3. Mathematical Model of Energy Storage System

At present, the lithium-ion battery is the most widely used power battery, so a lithium-ion battery is selected as the energy storage system in the ship propulsion system in the research process [34,35]. The equivalent modeling of the lithium battery and the functions of its voltage and capacity in the charging and discharging process are as follows.
When discharging:
V B T = E 0 K Q t Q Q Q t K I Q Q Q t I R + A I e B Q t
When charging:
V B T = E 0 K Q t Q Q Q t K I Q Q t 0.1 Q + I R + A I e B Q t
and
Q t = Q ( t 1 ) Q ( t ) = I Δ t ε
S O C ( t ) = Q ( t ) Q
where V B T is the lithium battery voltage (V); E 0 is the constant voltage source voltage (V); K is the polarization resistance proportional constant; Q is the battery capacity (Ah); Q t is the lithium battery charge/discharge capacity (Ah); I is the Filtered current (A); R is the internal resistance of lithium battery ( Ω ); A is the amplitude coefficient of the exponential region; B is the time the inverse proportion of the exponential region; ε is the charge-discharge efficiency; and S O C ( t ) is the state of charge of the lithium battery. The simulation model of the energy storage system in PSCAD is shown in Figure 11.

3. Hierarchical Control Scheme and Optimization Algorithm Design for Hybrid Ships

3.1. Hierarchical Control Scheme

As the core of the ship propulsion system, the energy management system is not only responsible for the management of the generation and scheduling of the entire ship’s electrical energy but also needs to manage the operation status of the propulsion system. To ensure that the ship propulsion system can provide continuous, stable, and economic power support during operation [36,37,38,39]. Based on the above functional requirements, this paper designs the overall scheme of the layered control of the ship propulsion system, as shown in Figure 12.
This hierarchical control structure defines three primary control levels, component-level control, device-level control, and system-level control, and communication lines connect them. Among them, the first-level control mainly focuses on controlling a single unit (load, distributed power supply), and the second-level and third-level controls, respectively, focus on coordinated and stable control and the improvement of power quality. The adjustment speed needs to be faster and more responsive to meet the fast dynamic characteristics of the system.

3.2. Maximum Power Point Tracking Control Strategy for Ship Propulsion Systems

The traditional disturbance observation method has two main problems: steady-state oscillation and deviation from the tracking trajectory [40]. If the system wants to achieve the fast and stable tracking of the maximum power point, it needs to achieve the following: (1) MPPT must be able to automatically locate the maximum power point; (2) the tracking must be dynamic, and the operating point must be continuously adjusted according to the measured irradiance and temperature conditions.
Based on the above two viewpoints, this paper designs a P&O algorithm based on dynamic perturbation step size, which improves the tracking efficiency of the P&O algorithm by reducing steady-state oscillation and adding perturbation steps [41,42]. The improved algorithm adds two features: (1) The algorithm includes a built-in oscillation detection mechanism to ensure the consistent detection of oscillations and changes the size of the disturbance accordingly to achieve adaptive performance. (2) The algorithm establishes a dynamic disturbance step long to ensure that the working point not deviate from its tracking trajectory.
The initial operating voltage V M P P is set to 65% V O C , and V O C is the open-circuit voltage of the photovoltaic array. Δ P and Δ V represent the amount of slope change. The value is the sign of the two quantities multiplied and normalized, as shown in Table 1.
The oscillation detection mechanism detects oscillations by recording three consecutive slope values. When the sign of the disturbance voltage is the same as the sign of the power variation, the value of the slope is +1. Otherwise, it is −1. From this, the following oscillation state detection formula can be obtained:
s l o p e = 3 ,     no   converge   to   steady   state   oscillation 1 ,     Convergence   to   Steady-State   Oscillation
Dynamic perturbation step adjustment strategy: The initial perturbation size is set to 2% of V O C , and when the operating point converges to near the maximum power point, the perturbation size is reduced by 0.5% of V O C in each iteration step. The perturbation step size is continuously reduced until it reaches 0.5% of V O C . This tiny oscillation allows the algorithm to consume almost zero power while simultaneously making it immune to the circuit’s radiation and noise.
Under normal conditions, the maximum irradiance variation can reach up to 0.027 KW/m2/s. To enhance the algorithm robustness, this paper choose T 1 and T 2 to be 0.001 s and 0.05 s, and any change in irradiance between 1.0 W/m2/s and 50 W/m2/s is considered a gradual change. When the perturbation step size changes, if a value greater than 50 W/m2/s is detected, it is considered a rapid step change and the perturbation step size is increased to 2%. The algorithm flowchart is shown in Figure 13.
The algorithm adopts dynamic perturbation step size to reduce the oscillation and introduces boundary conditions to prevent it from deviating from the maximum power point. The performance of the P&O algorithm is improved by eliminating steady-state oscillation and preventing the algorithm from deviating from the maximum power point trajectory.

3.3. Design of Two-Layer Coordinated Control Strategy Based on Dynamic Droop Controller

A dynamic droop controller is designed to aim at the problem of voltage and frequency deviation caused by one-layer control and switching loads. This control strategy can quickly adjust the fixed droop coefficient, realize the adaptive change of the droop coefficient, and introduce power at the same time. The sensitivity factor improves the system dynamic performance. A voltage and current double closed-loop controller is designed to further improve immunity and power quality of the inverter and reduce the influence of random disturbances on the voltage and frequency of the ship propulsion system [43,44,45]. The schematic diagram of the droop controller is shown in Figure 14.
where i o a b c and U o a b c represent the three-phase current and voltage output by the inverter; P and Q are the actual active and reactive power of the inverter; P 0 and Q 0 are the reference active and reactive power of the control system; m, n is the droop coefficients of active and reactive conditions; ω and U represent the given actual voltage frequency and voltage; ω 0 and U 0 represent the given reference frequency and voltage; and u is the SPWM modulation signal.
Droop control plays an essential role in the entire inverter control system. When the propulsion system inverter adopts traditional droop control, the droop coefficient is fixed. Fluctuations are likely to occur in the propulsion system at the moment of load switching on the system-connected side, resulting in the distributed circulating current occurring between the power supplies. This paper adopts a real-time dynamic change control method of the droop coefficient, which can effectively suppress the circulation phenomenon. Through this method, the droop coefficient and power are combined to form a new droop coefficient term with dynamic adjustment ability, suppressing the circulation phenomenon and enhancing frequency and voltage stability. Designing the power sensitivity factor can reduce the transient impact caused by power fluctuations during system load switching. The formula of this dynamic droop control strategy is:
f = f 0 k f 1 + k f 2 P P η f P P 0 1 U = U 0 k U 1 + k U 2 Q Q η U Q Q 0 1
where k f 1 and k f 2 represent the dynamic droop coefficient during active power regulation, k U 1 and k U 2 represent the dynamic droop factor during reactive power regulation, and η f and η U are sensitivity factors. Using the minimum and maximum values of voltage and frequency to solve the dynamic droop coefficient formula is as follows:
k f 1 = f max f min P max , k f 2 = 0.6 k f 1 P max k U 1 = v d _ max v d _ min Q max , k U 1 = 0.6 k U 1 Q max
where f max and f min are the maximum and minimum frequencies due to the instantaneous change of the load with values of 50.5 Hz and 49.5 Hz; P max and Q max are the maximum active power and reactive power values of the system overload, which are 5 kW and 2 kW; and v d _ max and v d _ min are the maximum and minimum values of the d-axis voltage component, which are 150 V and 145 V.

3.4. Research on Day-Ahead Optimal Dispatching Strategy of Ship Power System

In this part, based on the third-layer control of the ship power system, the relevant research of the optimization scheduling method is carried out. In order to give full play to the advantages of renewable energy, a multi-objective optimization model of the power system under the cooperative work of multiple power generation systems is established.

3.4.1. Mathematical Model of Day-Ahead Optimal Scheduling Problem in Power System

The day-ahead optimal scheduling of the power system is to predict the output power of the wind and photovoltaic power generation system, which, based on the wind and solar data of the next day, formulate the load power usage curve according to the load usage and schedule the renewable energy reasonably.
The following formula can describe the mathematical model of the day-ahead optimal scheduling problem. These include the operating costs F L , F B , F R of diesel power generation systems, energy storage systems, and renewable power generation systems, and the overall benefit F L of the ship load.
y P , u = F D P D , u D + F B P B , u B + F R P p v , P w t F L u L
Diesel power generation system:
Without considering the influence of external factors, such as vibration and friction, it is assumed that the diesel generator operate in a stable state. Therefore, its fuel cost can be described by the following mathematical formula:
f D = p f t = 1 T v f t
where p f is the fuel price and v f is the total fuel consumption. On the other hand, in the wind–solar diesel-storage ship power system, only diesel generators emit pollutants, and the following mathematical formula can describe its environmental cost:
g D = j = 1 n E ε j V F , j
where n = 4 represents four air pollution sources, SO2, CO2, CO, and NOX; E is the total output power of diesel generators per day (kWh); ε j is the emission coefficient of pollution source (g/kWh); V F , j represents the penalty amount for the pollution source (CNY/kWh), and its specific parameters are shown in Appendix A and Appendix B.
Energy storage system:
For the ship power system, the charging and discharging function of the energy storage system is essential, so the cost of the energy storage unit must be calculated. The following mathematical formula can describe its running cost:
F B = t = 1 T j = 1 n B u B , j t C B P B , j t
where n B = 4 is the number of lithium-ion battery packs; u B , j t is 1 or 0 to indicate two states of operation and shutdown; C B is the operating cost coefficient (CNY/kW); and P B , j t is the lithium-ion battery pack output power.
Renewable energy power generation system:
The core power generation sector in the ship power system is the renewable energy power generation system, and its operating cost can be described by the following mathematical formula:
F R P p v , P w t = t = 1 T m = 1 n w t f w t P w t , m t + n = 1 n p v f p v P p v , n t
where f w t and f p v are the operating cost coefficients of wind and photovoltaic power generation systems; n w t and n p v are the numbers of wind and photovoltaic power generation units; and P w t , m t and P p v , n t are the output power of wind and photovoltaic power generation systems at the moment.
Overall benefit of load:
The overall benefit of the load refers to the sum of the benefits obtained from the sale of electricity through marine loads, and its mathematical description is as follows:
F L = t = 1 T k = 1 n L f L , s a l e P L , k t
where F L is the income value; n L is the number of loads; f L , s a l e is the electricity price; and P L , k t is the power of the load.
Restrictions:
The constraints are set according to the power generation characteristics of the distributed power generation. In order to obtain more accurate optimization results, the system must meet the following constraints.
Power balancing constraints:
P D t + P B t + P w t t + P p v t = P L t
Energy storage power constraints:
P c P B t P d
Energy storage electric constraints:
S o c B , min S o c B t S o c B , max
Diesel generator operating power constraints:
α P D , r P D t P D , r
Renewable energy operating constraints:
0 P w t t P w t p t
0 P p v t P p v p t

3.4.2. Research on Day-Ahead Optimization Scheduling Method Based on Improved PSO

In this section, a particle swarm optimization algorithm based on mutation particles is designed to solve the multi-objective function problem [46,47,48].
Introduce mutation factor: improve the particle swarm optimization algorithm in each generation to evolve a population, which can be expressed as X i , G , where i = 1 , 2 , 3 , N P and N P is the population size. After initialization, padding is randomly generated within the search domain. The algorithm mixes the set information of some top-ranked vectors with the new mutation particles generated by mutation and generates the following mutation vectors:
X i p s o _ b e s t , G = k = 1 m w k X k , G
where m represents the number of top-ranked vectors and w k represents the weight of the k selected vectors X k , G . The weights for each selected vector are calculated as follows:
w k = m k + 1 1 + 2 + + m , k = 1 , 2 , m
Improvement of the speed formula: In order to improve the search performance of the algorithm, the method of improving the speed formula in sections is adopted in the algorithm. To make better use of the mutated particles in IPSO, the velocity update formula should be changed to:
v i ( t + 1 ) = ω v i ( t ) + λ c 1 r 1 ( p i ( t ) x i ( t ) ) + c 2 r 2 ( p g ( t ) x i ( t ) )
where λ is the adjustment function:
λ = 2 η g g max , 0 < g g max 2 η 2 2 g g max , g max 2 < g g max
where η is a random coefficient between 0 and 1, g is the number of iterations, and g max is the maximum number of iterations.
Re-initialization strategy: Since the current IPSO suffers from premature and stagnant problems, there will be premature convergence when the population falls into a local optimum. A re-initialization strategy is designed to deal with premature convergence and stagnation. Both of the above cases can be detected by the following formula:
s t g = 0 f U i < f X i i 1 , 2 , , N P s t g f U i f X i i 1 , 2 , , N P
where f U i is the test vector function, f X i is the target vector function, and s t g is an indicator used to monitor whether the current population reaches a stagnation state in a particular generation.

4. Simulation Verification and Analysis

4.1. Simulation and Verification of MPPT Control Strategy Based on Improved Disturbance Observation Method

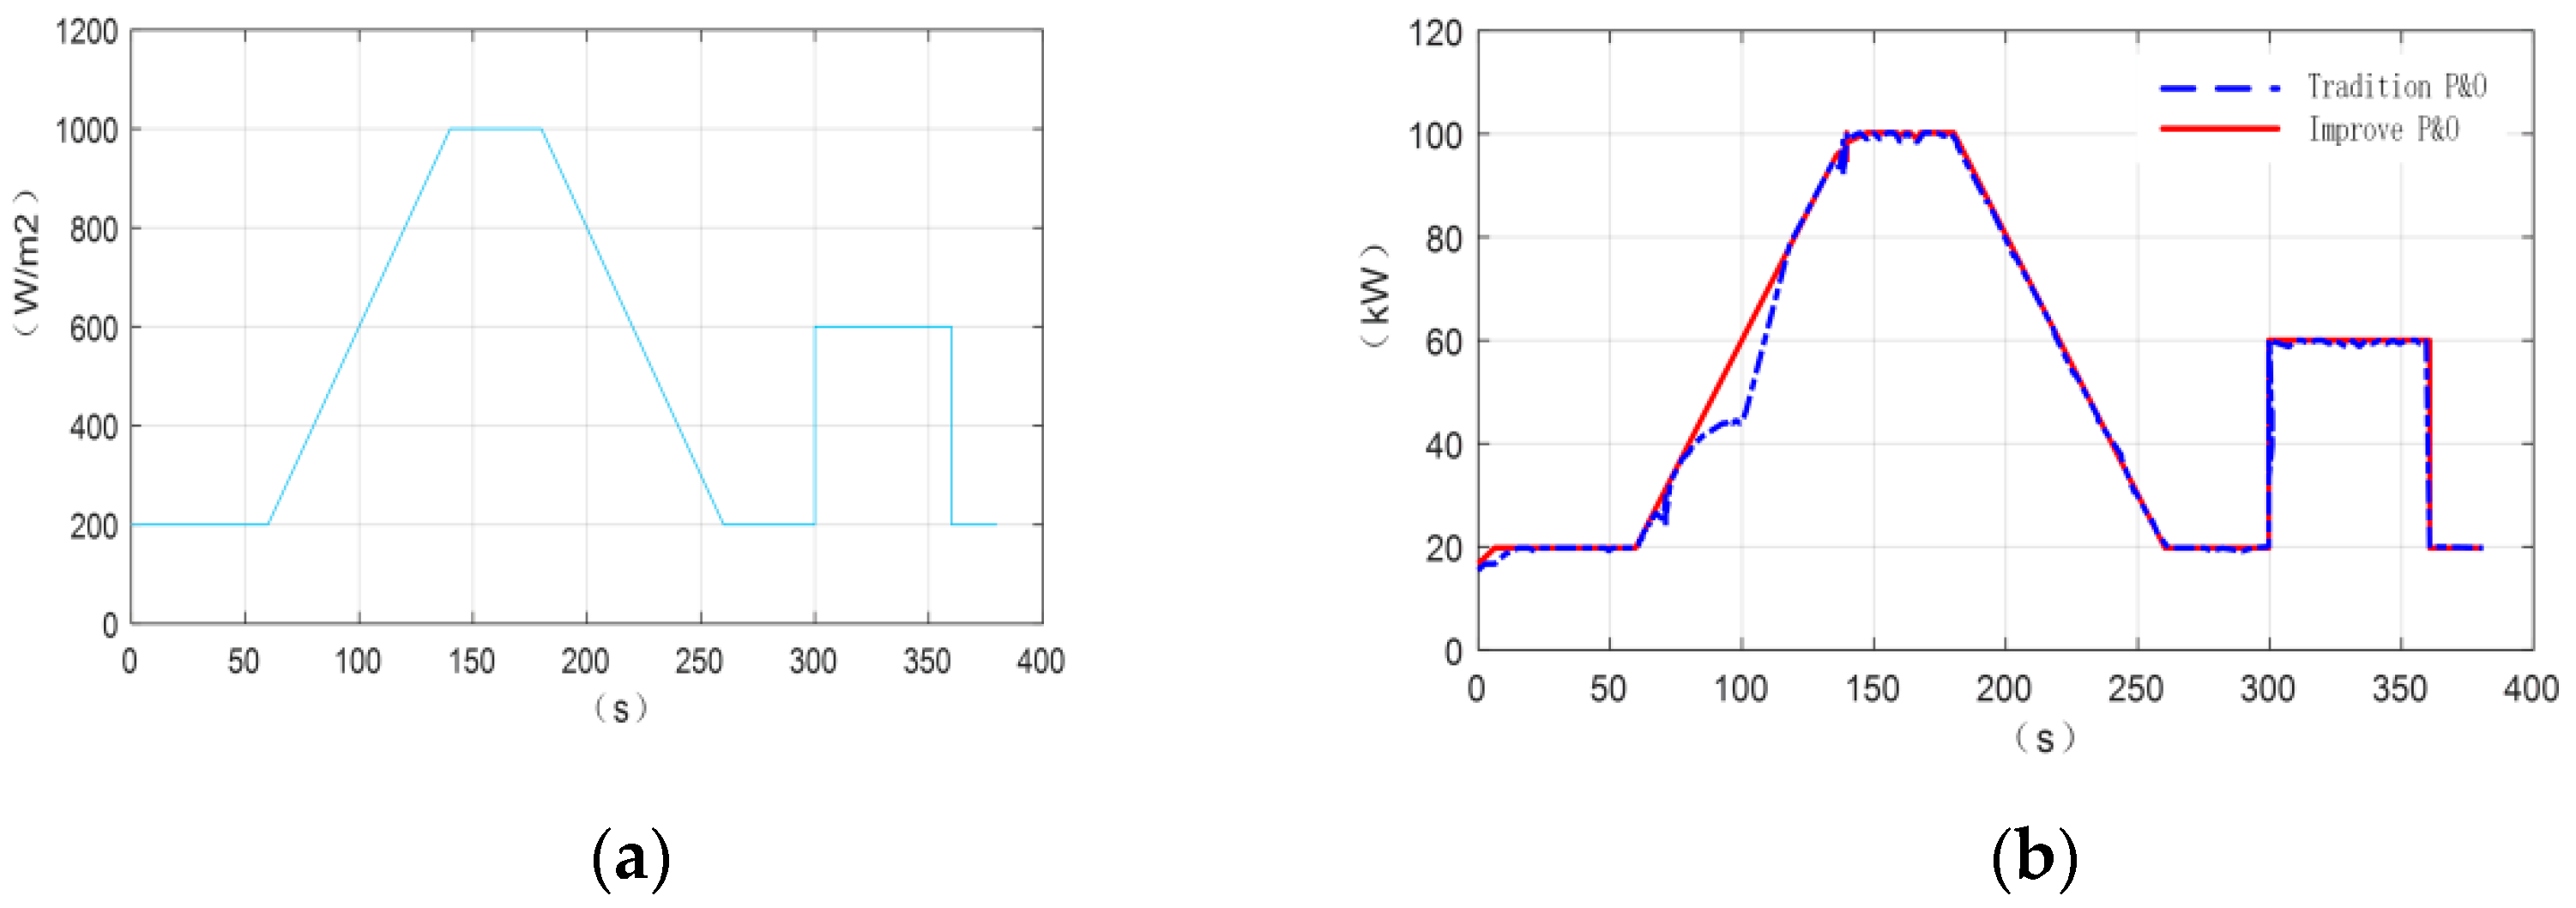
In order to verify the feasibility and effectiveness of the algorithm, a mathematical model of the related system is built in this paper, in which the maximum output power of the wind and photovoltaic power generation systems are 200 kW and 120 kW and the wind speed drive simulates the input wind speed. The MPPT module is used to achieve the maximum wind mechanical power tracking.
  • Simulation of photovoltaic power generation system:
The irradiance change curve shown in Figure 15a is used as the test input signal, and the simulation duration is set to 400 s to verify the effectiveness of the control strategy in dealing with the gradual and sudden change of irradiance.
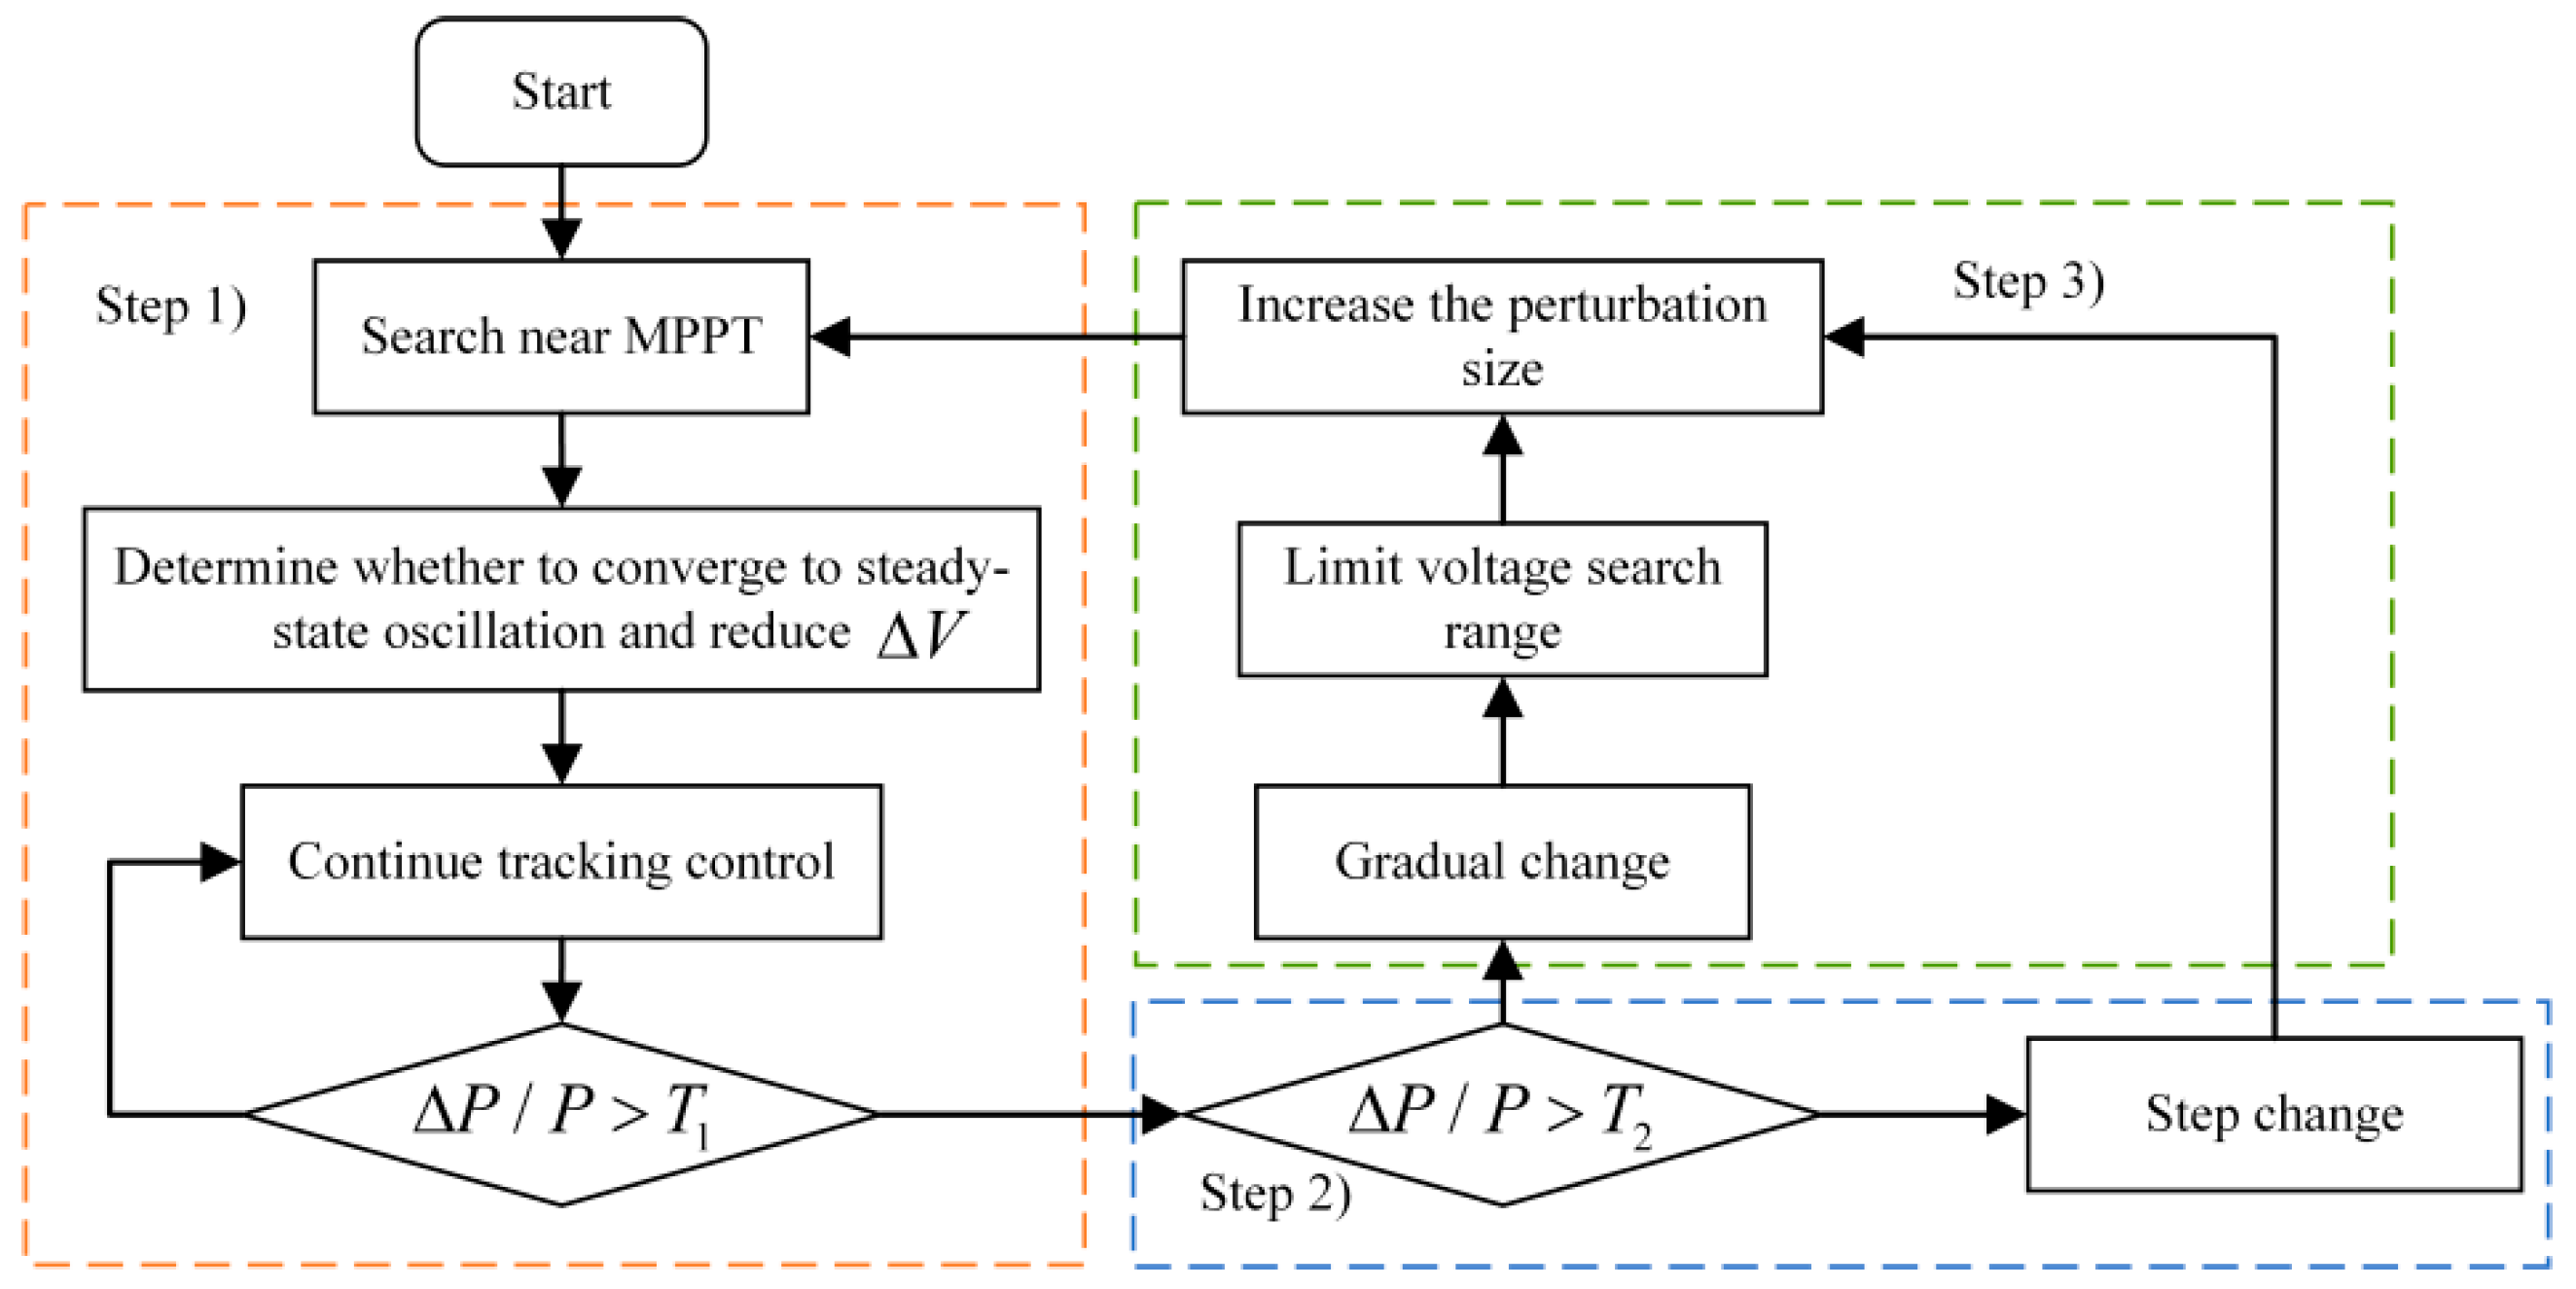
The two curves in the figure are the output power curves of the traditional and improved P&O algorithms, and the voltage disturbance is fixed at 2% of V O C . From the overall simulation results, the improved algorithm only consumes 6.3 s in approaching the maximum power point at the beginning, the oscillation amplitude is relatively small, and the trajectory can be tracked well.
The tracking effects of the two algorithms are shown in Table 2. It can be seen more intuitively that the tracking time of the improved P&O algorithm is increased by 15.4% compared with the traditional P&O algorithm, and the power loss is reduced by 39.3%. Therefore, the improved P&O algorithm can effectively reduce power loss to achieve the full tracking of the maximum power point, which will improve the efficiency of renewable energy generation.
2.
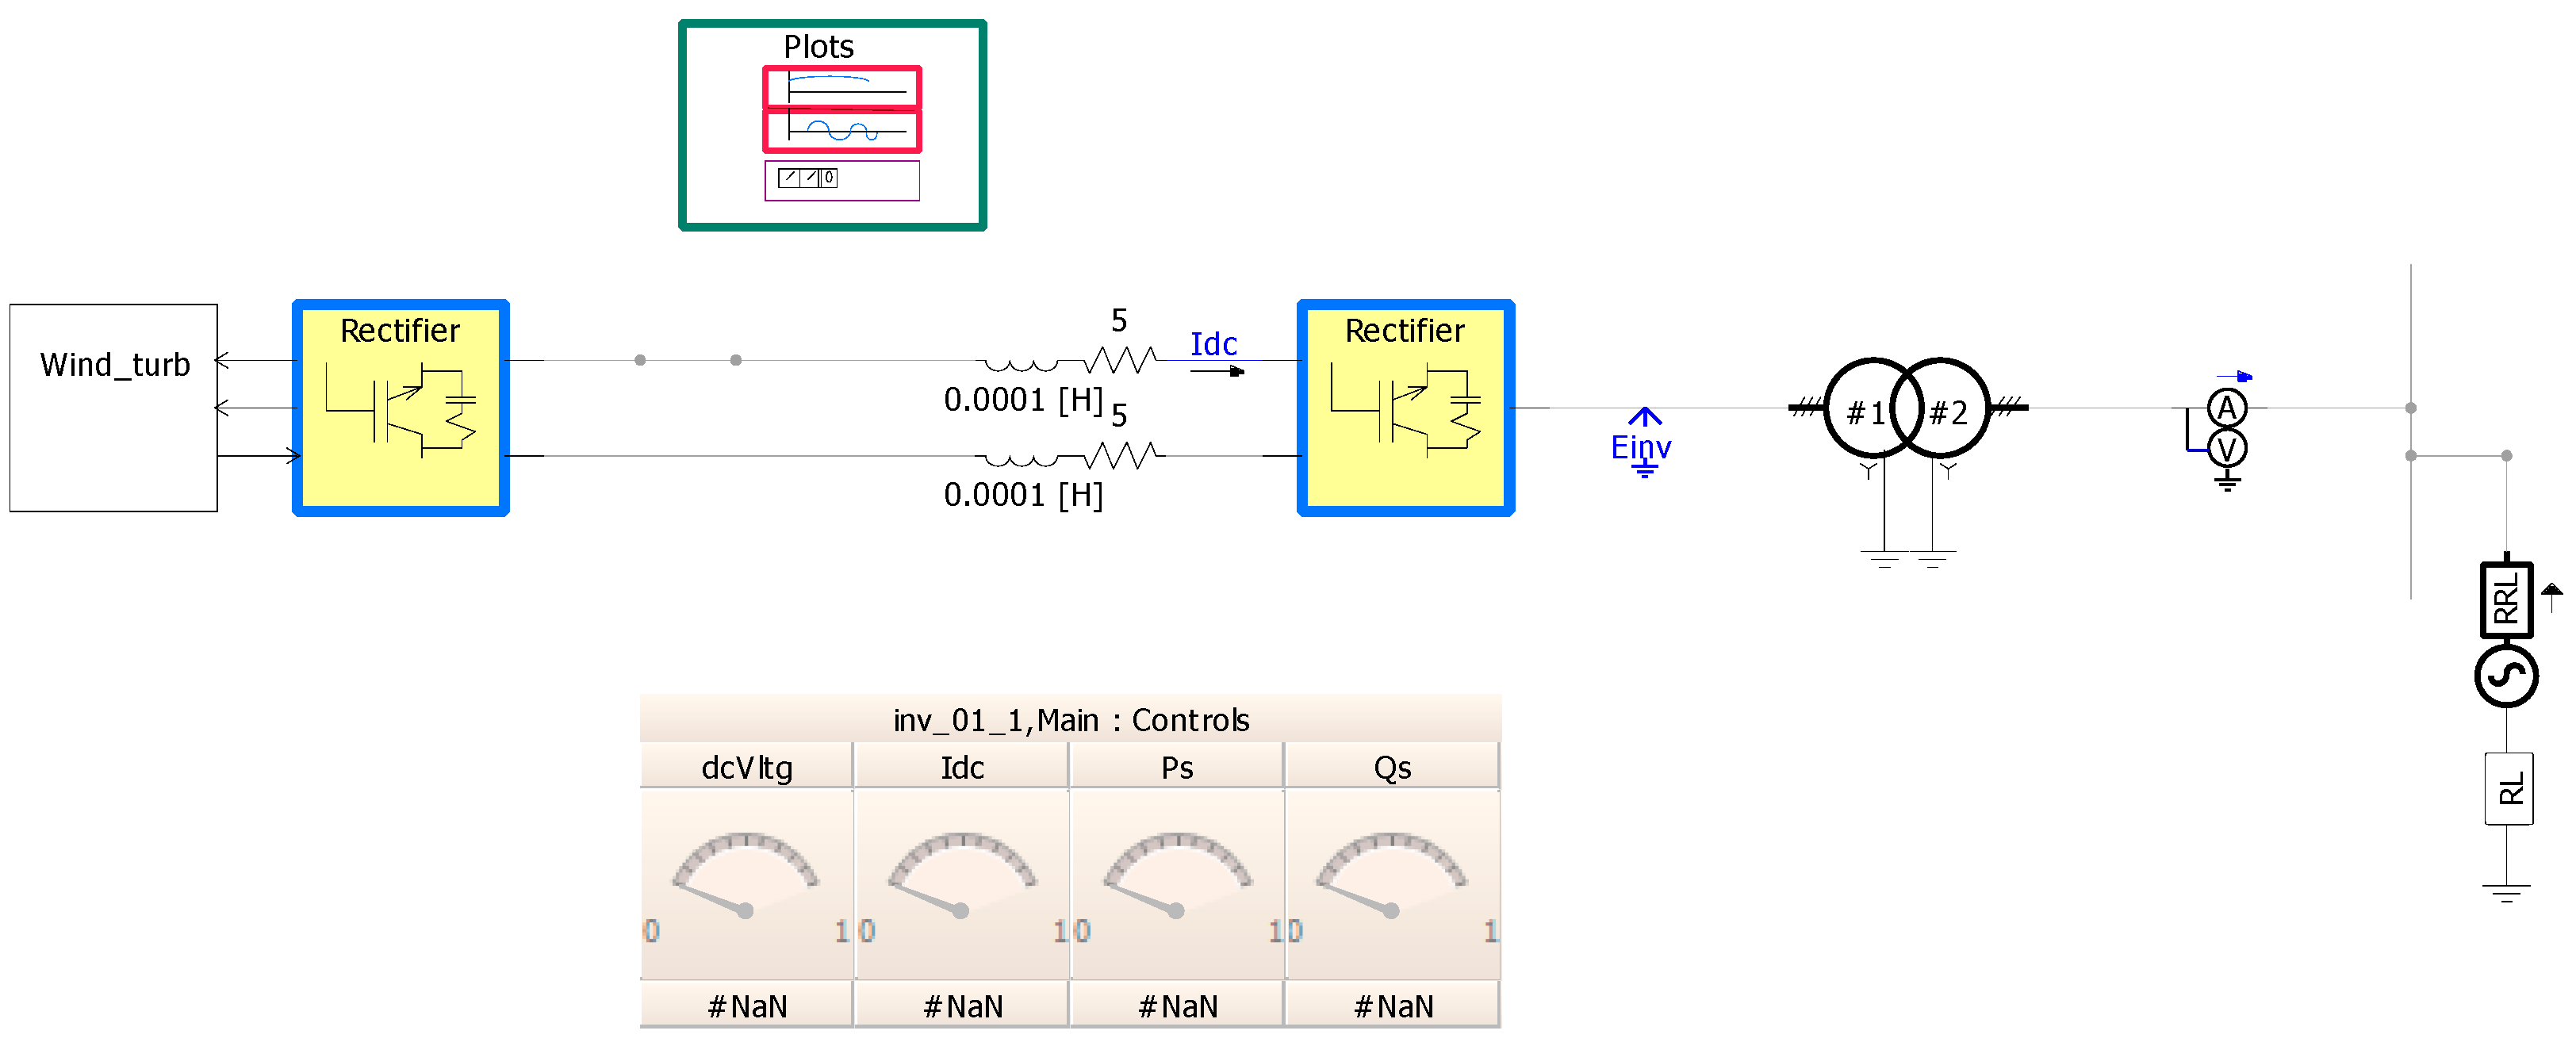
Wind Power System Simulation
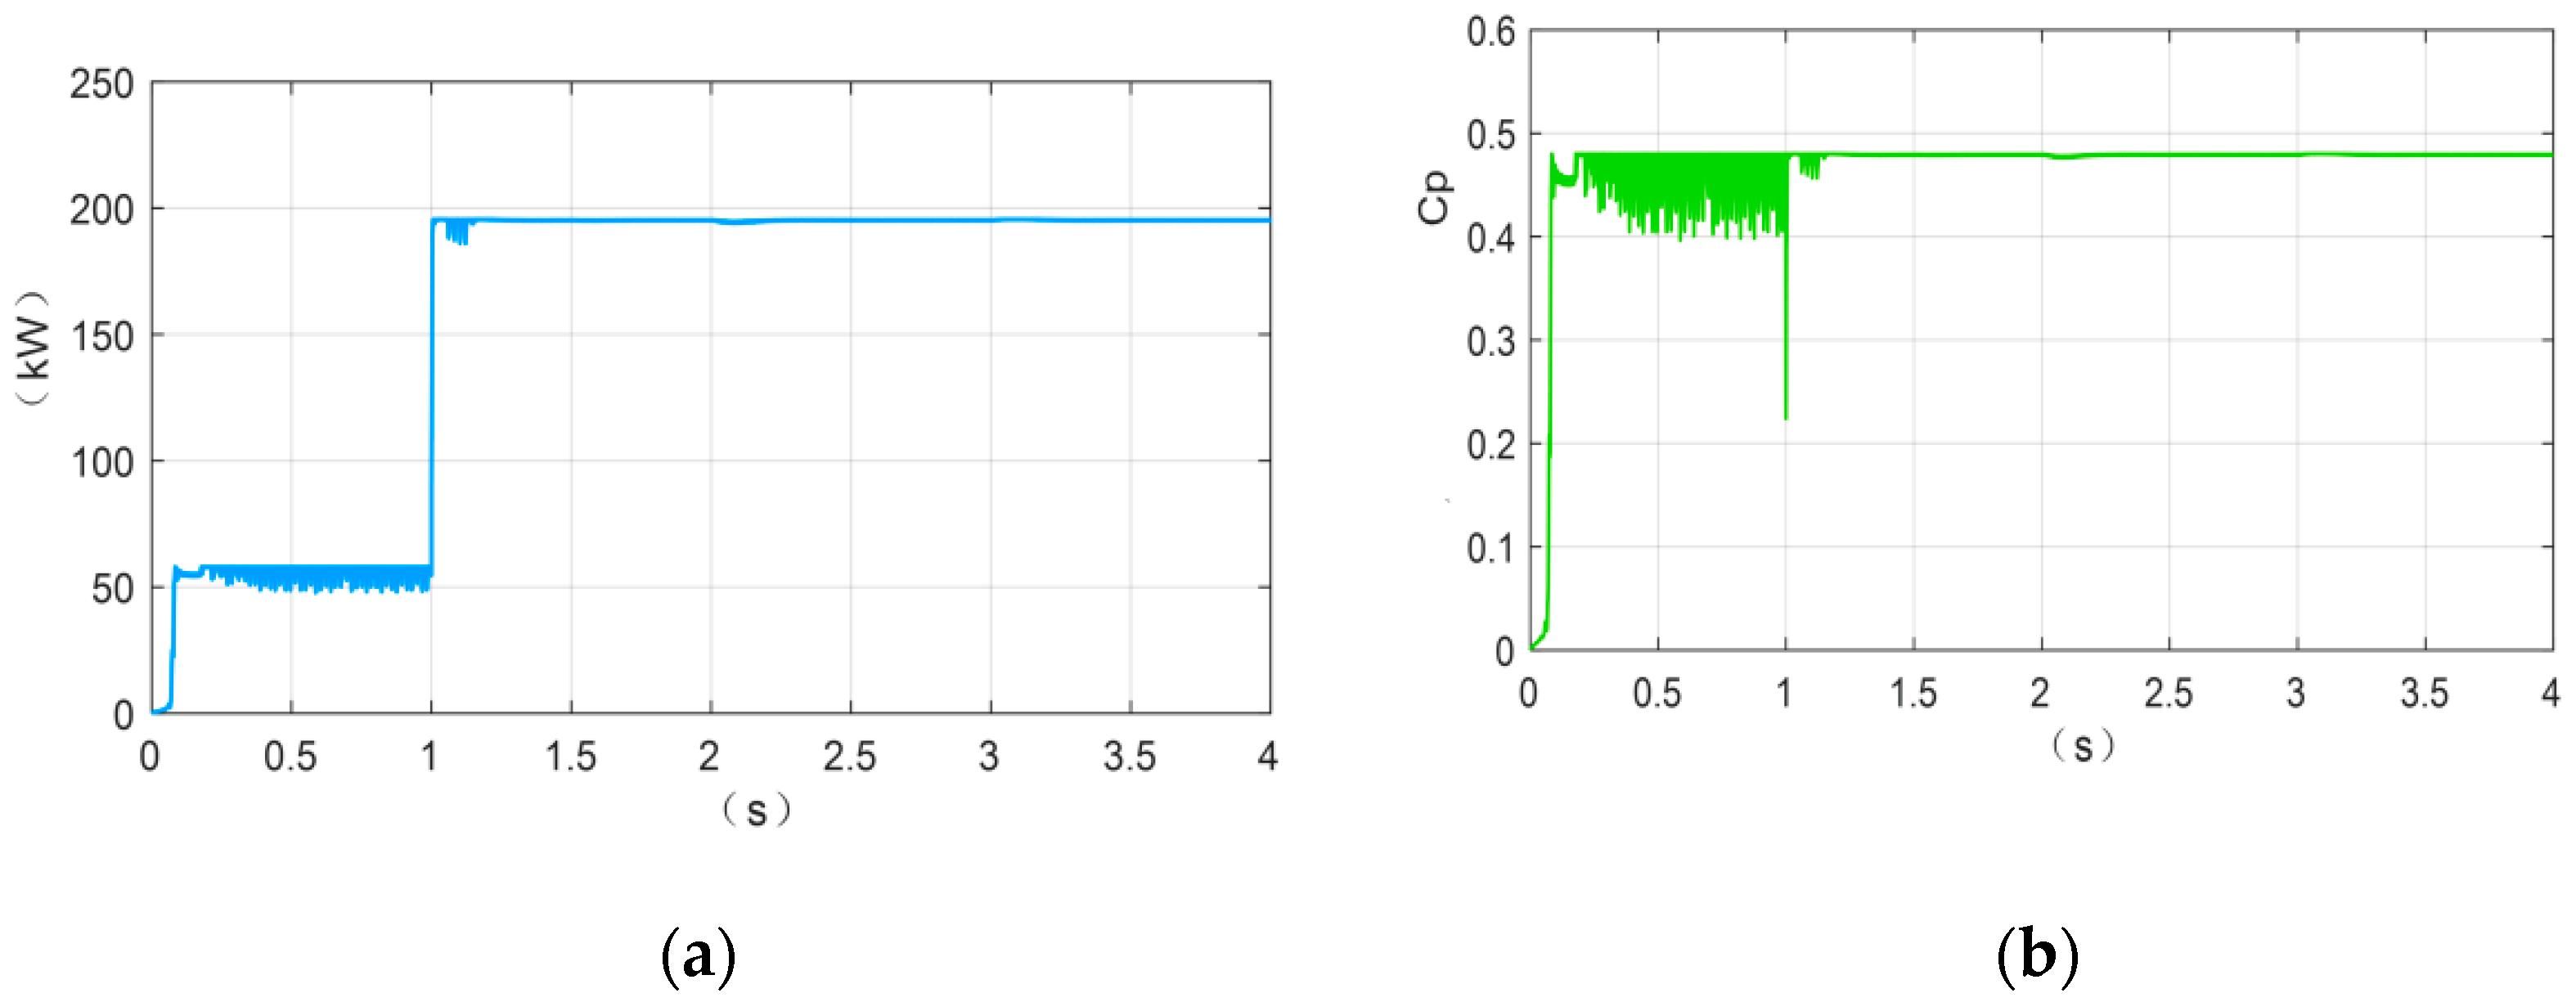
Based on the improved P&O algorithm to verify the performance of the system in dealing with sudden changes in wind speed and in steady state, two main working conditions are set to detect in the simulation verification; step signal detection is working condition one and steady output signal is working condition two. The simulation time is set to 4 s, and the initial wind speed is set to 8 m/s. Entering the step signal detection part at 1 s, the wind speed suddenly changes from 8 m/s to 12 m/s, and then enters the steady-state output part of working condition two.
At the beginning of the simulation, the wind turbine is in the state of starting. Since the wind speed has not stabilized, the power will fluctuate in a small range, but it is still within the controllable range. At 1 s, the system enters the step signal detection stage of working condition one, the wind speed suddenly increases from 8 m/s to 12 m/s, the output power fluctuates slightly, and the output power remains stable at 180 kW. Then enter the steady state stage of working condition two, and the output power curve does not fluctuate.
Figure 16b is the simulation diagram of the wind energy utilization coefficient curve. The transient fluctuation occurs at the time of 1 s. After the dynamic adjustment of the algorithm, it quickly recovers and stabilizes, and finally stabilizes at a maximum value of about 0.48.

4.2. Simulation Verification of Control Strategy Based on the Dynamic Droop Controller

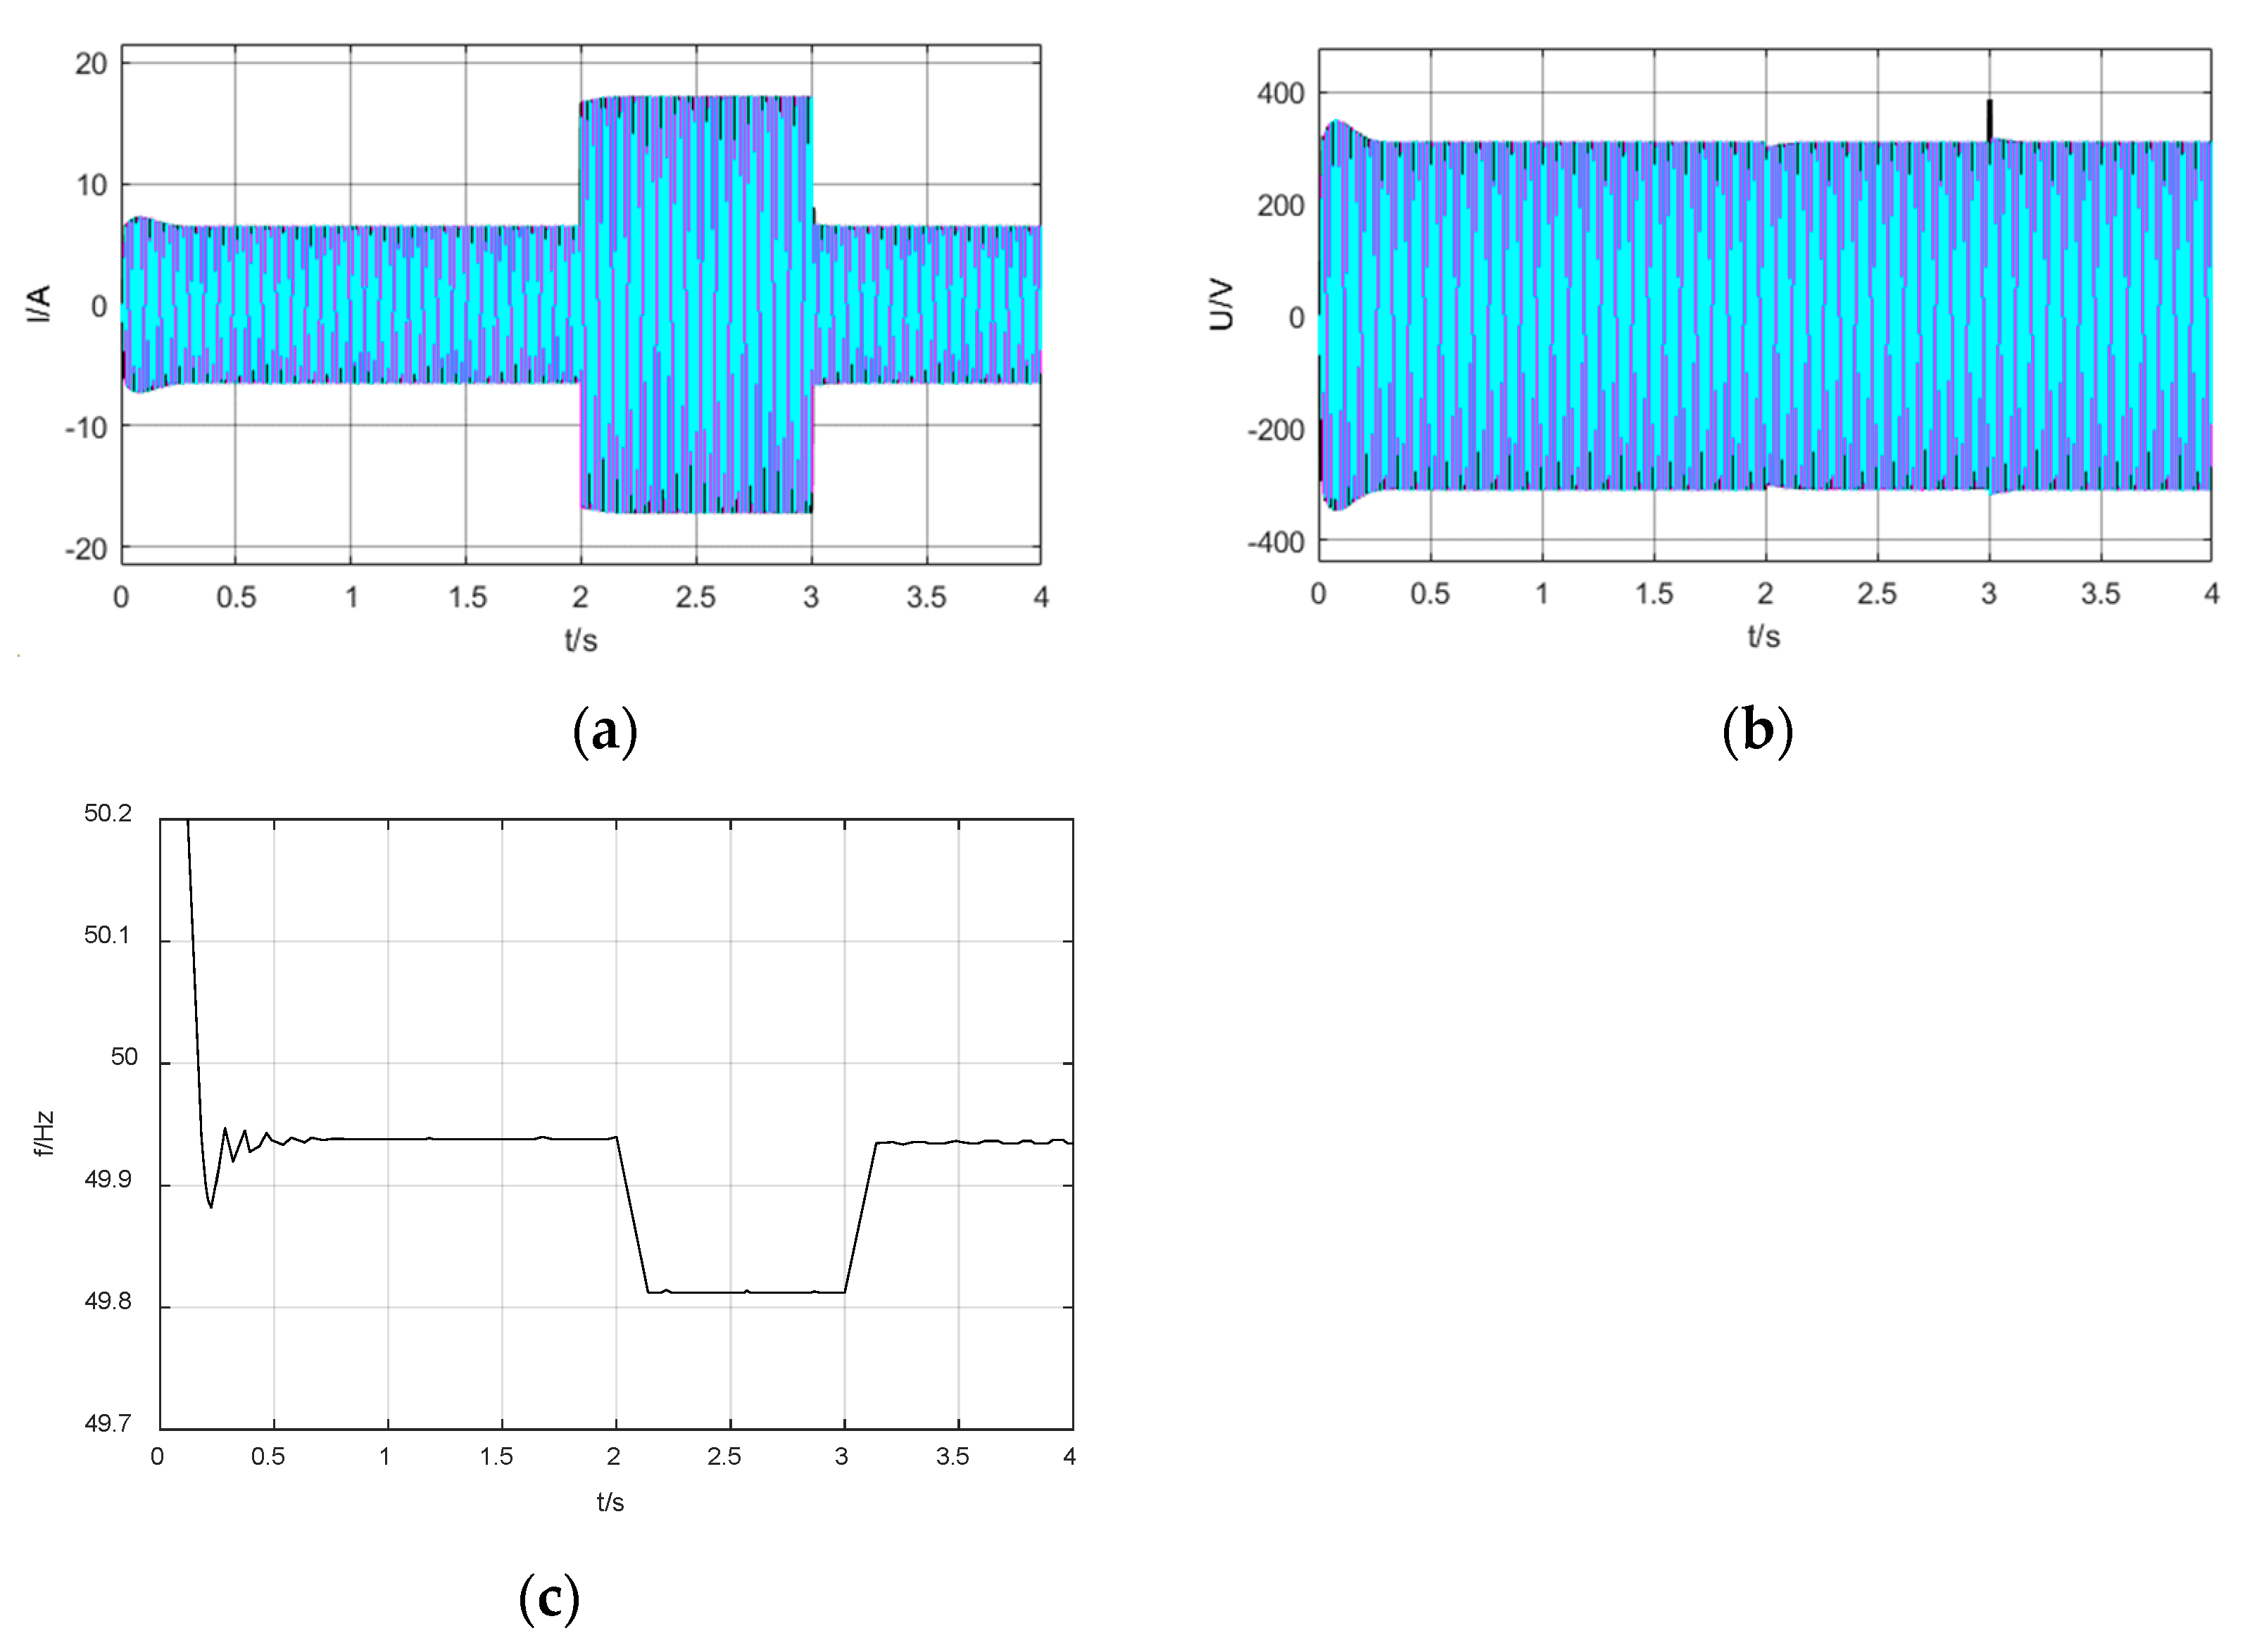
In the system-connected mode of distributed power generation, the process of adding and cutting off the load of the propulsion system is simulated. The simulation time is set to 4 s, and the initial value of the load power is set to 10 kW. The load power suddenly changes from 10 kW to 70 kW in 2 s and then drops back to 10 kW in 3 s, and the system-connected side voltage, current waveform, and frequency fluctuation are detected.
It can be seen from the figure that the output voltage and current are standard sinusoidal waveforms. The system enters a stable state at about 0.2 s, the current amplitude increases to about 16.5 A after a sudden load is applied at 2 s, and the current waveform stabilizes around 16.5 A in 2~3 s; Figure 17b shows the voltage curve of the system-connected side, which is maintained at around 300 V after the system is stable, and the voltage waveform not change significantly after the load suddenly changes; Figure 17c displays the frequency change curve when the system is running, where the system frequency can be maintained at around 50 Hz and the load switching process can be realized smoothly and quickly.
It can be seen from the simulation results that the designed two-layer coordinated control strategy of the propulsion system, which is based on the dynamic droop coefficient, has a significant effect on eliminating the voltage and frequency deviation. The system has the characteristics of rapid dynamic response and strong stability.

4.3. Simulation Verification of Day-Ahead Optimal Scheduling Control Strategy

Through the wind and solar forecast data and the electricity consumption of the shipload, the forecast curve of the day-ahead load power and the output power of the renewable energy is given, as shown in Figure 18.
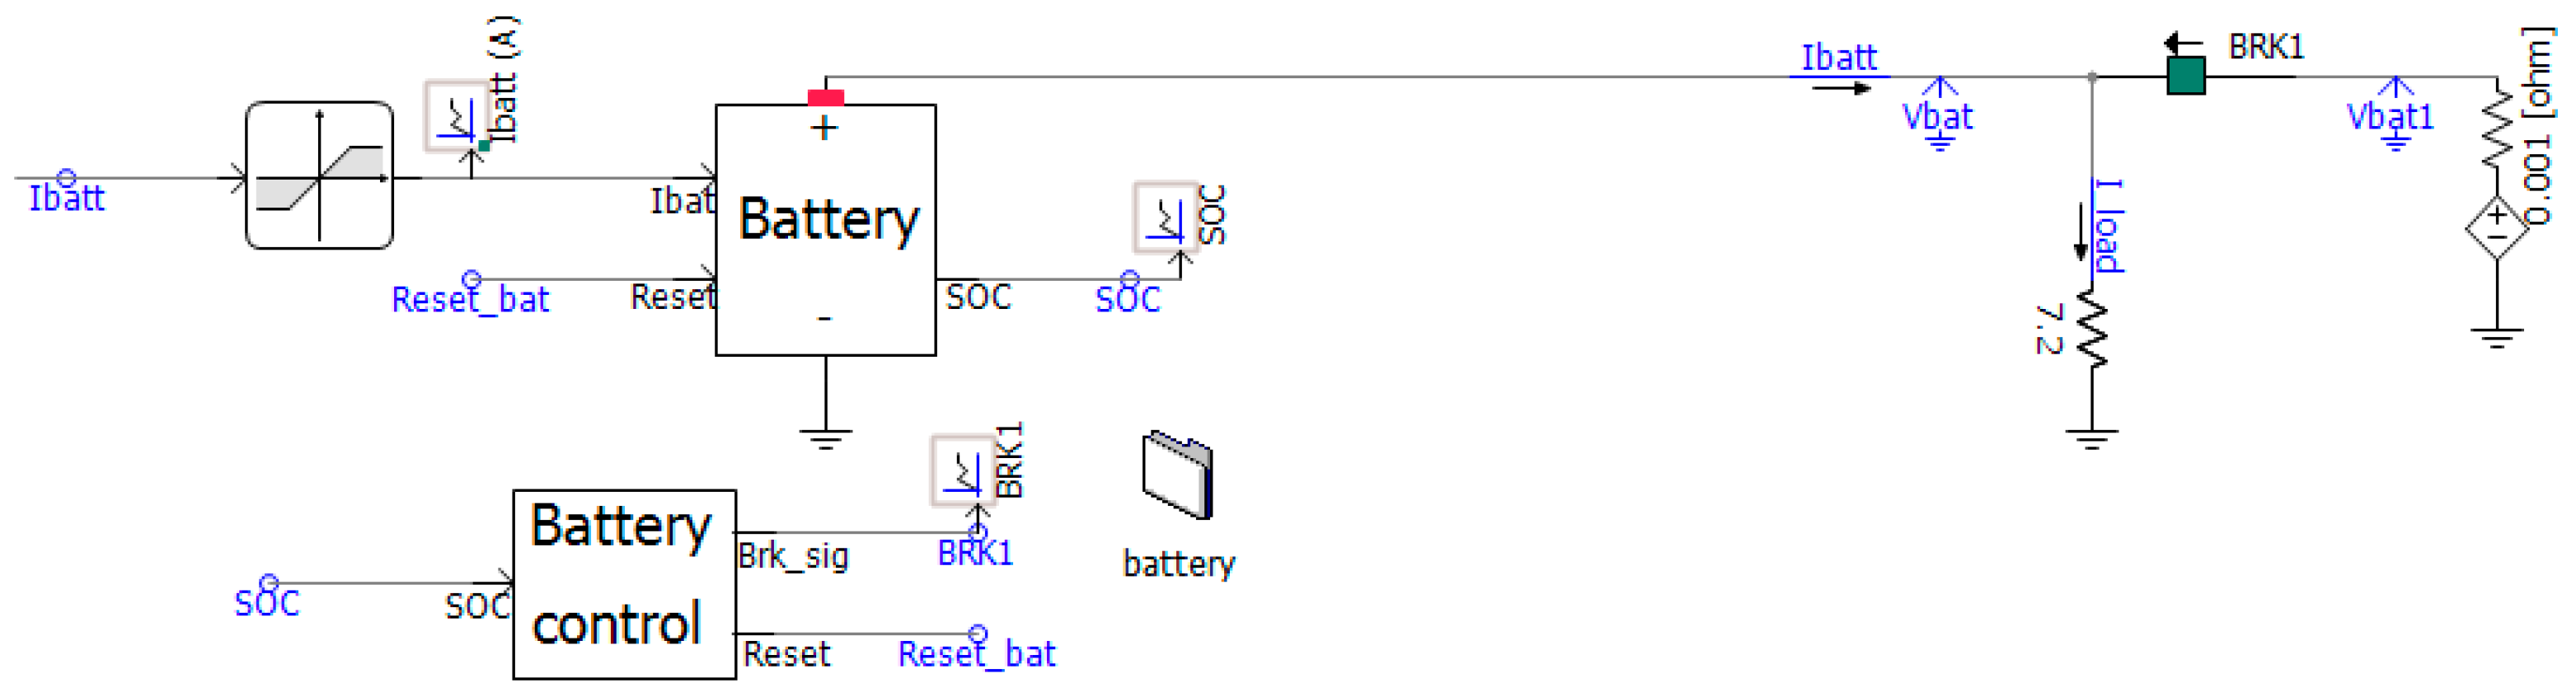
The day-ahead load power and renewable energy output power are input into system, and the day-ahead optimal dispatch curve and the energy storage system SOC curve can be obtained through the control calculation of each layer, as shown in Figure 19. It can be seen that the diesel generator set is basically maintained near the minimum operating power, which effectively reduces the pollutants produced by diesel generator sets.
During the period from 0:00 to 5:00, since the light intensity is zero, renewable energy is supplied by the wind power generation part, and through the charge and discharge control of the energy storage system, the output power of the diesel unit is maintained at the minimum operating power of about 100 kW. From 6:00 to 11:00, the first peak period of electricity consumption is ushered in. The load power increases, and the output power of the diesel generator needs to be started to make up for the remaining power required by the load. From 12:00 to 16:00, since the light intensity reaches the highest value, the total output power of renewable energy reaches the maximum. From 17:00 to 21:00, the second peak period of electricity consumption is ushered in. The load power of the ship power system increases. Due to the reduction of the light intensity to zero, the total output power of renewable energy begins to decrease. After 21:00, as the power required by the ship power system load decreases, SOC returns to around 50% and the SOC value remains within the optimal range.
In order to verify the economy of the IPSO algorithm proposed in the optimal scheduling problem in this paper, the day-ahead optimal scheduling strategy of traditional logic is used as a comparison with the strategy proposed in this paper. In the fixed logic day ahead optimal scheduling strategy, the energy storage unit only charges and discharges according to the predetermined fixed time period (selects the charging and discharging periods according to the wind and solar load day ahead prediction results to ensure the life of energy storage) and uses the diesel generator set as the main power source for distributed discharge to track the ship load data and the total charging and discharging power of the energy storage system. The economic cost is shown in Table 3.
The above economic operation cost formula is used to calculate the economic costs of the two methods. Since renewable energy always maintains the maximum power output and no load is in the state of power loss, the renewable energy operation cost and load income of the two strategies are consistent. Through calculation, it can be concluded that compared with the fixed logic strategy, the diesel generator fuel cost of the proposed strategy is reduced by 8.4%, the energy storage cost is reduced by 30%, and the total cost is saved by 8.2%. It not only saves energy but also reduces the pollution to the environment, which proves the superiority of the optimization algorithm proposed in this paper.
Traditional PSO, GA, and DE algorithms are used as comparison algorithms for a performance comparison test to prove the superiority of the proposed IPSO algorithm. The dimension of the standard test function is D = 30. For all test functions and algorithms, the initial value of the algorithm is set as follows: population size N P = 100; the maximum number of iterations g max = 30; threshold s t g max = 20; and the maximum number of fitness calculations F E max = 3 × 10 5 and the convergence error ε = 10 5 is set as the termination condition of the algorithm. The simulation results are shown in Figure 20.
In addition to the function speed of IPSO algorithm is slightly slower than DE algorithm except for ( a ) f 1 function, compared with the other three algorithms, the convergence speed is faster. Among them, when solving function ( a ) f 1 , ( c ) f 3 , PSO and GA algorithms have not converged to the allowable error range of ε = 10 5 when the maximum computation times of 10,000 D are reached, and the same situation also occurs when solving function ( d ) f 4 for PSO algorithm. Both DE and IPSO algorithms achieve global optimal solutions on ( a ) f 1 , ( b ) f 2 functions. In addition, the GA algorithm achieves global optimal solutions on ( b ) f 2 functions, but its performance in other functions is not as good as the IPSO algorithm. Although the convergence speed of the DE algorithm is faster than that of the IPSO algorithm on ( a ) f 1 function, the convergence speed of the DE algorithm is not as fast as that of the IPSO algorithm on other functions, so it can be seen that the overall quality of its solution is not as good as that of the IPSO algorithm.
The above figure show the convergence curve of the tested algorithm. Under different test functions, the IPSO algorithm (the solid red line in the figure) is more competitive than the other three algorithms regarding solution quality and convergence speed. The search speed has also been improved while ensuring the accuracy of solution.

5. Conclusion and Discussion

The energy management strategy of a ship propulsion system based on hierarchical control is studied, including research on the MPPT control strategy for renewable energy and the two-layer coordinated control strategy for distributed power system-connected inverters. The following primary research results were obtained:
  • The overall scheme of the layered control system of the ship propulsion system is designed, and a detailed and complete mathematical model is established. An overall simulation model of the ship propulsion system is built, which meets the needs of subsequent related research and simulation tests.
  • A P&O algorithm based on dynamic perturbation step size is designed, including oscillation detection mechanism, dynamic perturbation step adjustment strategy, and voltage boundary setting. Through the comparison example simulation test with the traditional algorithm, the results show that the power loss of the MPPT control strategy using the P&O algorithm with a dynamic disturbance step size is reduced by 39.3%, and the overall tracking time is prolonged by 15.4%.
  • A three-layer coordinated control strategy of the propulsion system based on the dynamic droop coefficient is designed, which dynamically adjusts the fixed droop coefficient. Realizing the adaptive change of the droop coefficient solves the problem of voltage and frequency deviation. In order to improve the system performance, the power sensitivity factor is designed simultaneously; moreover, a voltage and current double closed-loop controller are further designed to improve the inverter noise immunity and power quality. The simulation results show that the proposed control strategy can effectively suppress the voltage and frequency fluctuations and improve the system-connected security and power quality of the system-connected side.
  • A PSO algorithm based on mutation particles is designed, and the collection information of some top-ranked vectors is mixed in the generated mutation vector; furthermore, the method of the segmental improvement speed formula is adopted in order to improve the accuracy and search speed. Through the standard function performance test with other intelligent optimization algorithms, the results show that the improved algorithm has a faster convergence speed and higher accuracy in solving the load optimization problem. The total running cost of the algorithm is reduced 8.4%, and the total cost was reduced by 8.2%.
In addition, the ship energy management system designed in this paper can give distributed power supply output results through the predicted data. However, there is no relevant operating software and interface display. Despite the lack of visualization-related research, the equipment involved is assumed to be in good operating condition. The built simulation model focuses more on the overall design of the control strategy, ignoring the actual multi-interference situation. Therefore, follow-up work should mainly focus on the above aspects for further study in order to improve the practicability of the simulation model.

Author Contributions

Conceptualization, L.Z. and P.S.; methodology, L.Z. and P.S.; software, Y.R.; validation, Y.R. and Z.Z.; data curation, Y.R.; writing—original draft preparation, Y.R.; writing—review and editing, L.Z. and P.S.; visualization, Y.R. All authors have read and agreed to the published version of the manuscript.

Funding

Supported by the Fundamental Research Funds for the Central Universities. The funding number: 3072022JC0404.

Institutional Review Board Statement

Not applicable.

Informed Consent Statement

Not applicable.

Conflicts of Interest

The authors declare no conflict of interest.

Nomenclature

CategorySymbolImplication
abbreviationsPSOParticle Swarm Optimization
IPSOImproved Particle Swarm Optimization
PVPhotovoltaic
MPPTMaximum Power Point Tracking
P&OPerturbation Observation Algorithm
GAGenetic Algorithm
DEDifferential Evolution
PWMPulse Width Modulation
parameter K the damping coefficient
ω g the angular velocity of the diesel engine
p the number of pole pairs of the synchronous generator
M d the output torque of the diesel engine
M c resistance torque of the diesel engine
I L the constant current source
I D the current passing through the diode
α the temperature coefficient
β the pitch angle of the blade
I m the maximum power output of the current
U m the maximum power output of the voltage
U the voltage to the photovoltaic array
U o c the open circuit voltage
T m the temperature of the photovoltaic array
T a the ambient temperature
R the actual solar irradiance
λ the tip speed ratio
ω T the rotational speed
V 0 the wind speed
C P the speed of wind turbines
V B T the lithium battery voltage
E 0 the constant voltage source voltage
Q t the lithium battery charge/discharge capacity
I the filtered current
S O C ( t ) the state of charge of the lithium battery
i o a b c the three-phase current output by the inverter
U o a b c the three-phase voltage output by the inverter
P 0 the reference active power
Q 0 the reference reactive power
u the SPWM modulation signal
ω 0 the given reference frequency
U 0 the given reference voltage
k f 1 the dynamic droop coefficient
k U 1 the dynamic droop factor
η f the sensitivity factor
f w t the operating cost coefficients
n w t the numbers of wind power generation units
P w t , m t the output power of wind power generation systems
g max the maximum number of iterations
f U i the test vector function
f X i the target vector function
s t g an indicator used to monitor

Appendix A

Table A1. Diesel generator pollutant emission factor (g/kWh).
SO2CO2CONOX
4.342.320.47232.04

Appendix B

Table A2. Environmental pollutant penalty amount (CNY/kg).
SO2CO2CONOX
0.750.00280.1251.00

References

  1. Pan, P.; Sun, Y.; Yuan, C.; Yan, X.; Tang, X. Research progress on ship power systems integrated with new energy sources: A review. Renew. Sust. Energ. Rev. 2021, 144, 111048. [Google Scholar] [CrossRef]
  2. Zhang, R.; Liang, H. Application of solar energy in ship power field. In Proceedings of the 2022 IEEE Asia-Pacific Conference on IPEC, Dalian, China, 14–16 April 2022. [Google Scholar]
  3. Zhu, Y.; Zhou, S.; Feng, Y.; Hu, Z.; Yuan, L. Influences of solar energy on the energy efficiency design index for new building ships. Int. J. Hydrogen Energy 2017, 42, 19389–19394. [Google Scholar] [CrossRef]
  4. Babarit, A.; Ghani, N.; Brouillette, E. Experiment validation of the energy ship concept for far-offshore wind energy conversion. Ocean Eng. 2021, 239, 109830. [Google Scholar] [CrossRef]
  5. Altosole, M.; Balsamo, F.; Campora, U.; Mocerino, L. Marine Dual-Fuel Engines Power Smart Management by Hybrid Turbocharging Systems. J. Mar. Sci. Eng. 2021, 9, 663. [Google Scholar] [CrossRef]
  6. Yuan, Y.; Wang, J.; Yan, X.; Shen, B.; Long, T. A review of multi-energy hybrid power system for ships. Renew. Sust. Energ. Rev. 2020, 132, 110081. [Google Scholar] [CrossRef]
  7. Huang, Y.; Wang, L.; Zhang, Y.; Wang, L.; Zhang, Z. An Overview of Multi-Energy Microsystem in All-Electric Ships. Front. Energy Res. 2022, 10, 881548. [Google Scholar] [CrossRef]
  8. Fang, S.; Xu, Y.; Li, Z. Two-Step Multi-Objective Management of Hybrid Energy Storage System in All-Electric Ship Microgrds. IEEE Trans. Veh. Technol. 2019, 68, 3361–3373. [Google Scholar] [CrossRef]
  9. Anvari, M.; Dragicevic, T.; Lexuan, M. Optimal planning and operation management of a ship electrical power system with energy storage system. In Proceedings of the IECON2016-42nd Annual Conference of the IEEE industrial Electronics Society, Florence, Italy, 23–26 October 2016. [Google Scholar]
  10. Misyris, G.; Marinopoulos, A.; Doukas, D. On battery state estimation algorithms for electric ship applications. Electr. Power Syst. Res 2017, 151, 115–124. [Google Scholar] [CrossRef]
  11. Lee, K.; Shin, D.; Yoo, D. Hybrid photovoltaic/diesel green ship operating in standalone and system-connected mode Experimental investigation. Energy 2013, 49, 475–483. [Google Scholar] [CrossRef]
  12. Accetta, A.; Pucci, M. Energy Management System in DC micro-system of Smart Ships: Main Gen-Set Fuel Consumption Minimization and Fault Compensation. IEEE Trans. Ind. Appl. 2019, 55, 3097–3113. [Google Scholar] [CrossRef]
  13. Brizuela-Mendoza, J.A.; Sorcia-Vazquez, F.D.J.; Rumbo-Morales, J.Y.; Lozoya-Ponce, R.E.; Rodriguez-Cerda, J.C. Active fault tolerant control based on eigen structure assignment applied to a 3-DOF helicopter. Asian J. Control 2021, 23, 673–684. [Google Scholar] [CrossRef]
  14. Zhu, L.; Han, J.; Peng, D. Fuzzy Logic based Energy Management Strategy for a Fuel Cell/Battery/Ultra-capacitor Hybrid Ship. In Proceedings of the International Conference on Green Energy, Sfax, Tunisia, 25–27 March 2014. [Google Scholar]
  15. Feng, X.; Butler-Purry, K.L.; Zourntos, T. A Multi-Agent System Framework for Real-Time Electric Load Management in MVAC All-Electric Ship Power Systems. IEEE Trans. Power Syst. 2015, 30, 1327–1336. [Google Scholar] [CrossRef]
  16. Seenumani, G.; Peng, H.; Jing, S. A Reference Governor-Based Hierarchical Control for Failure Mode Power Management of Hybrid Power Systems for All-electric Ships. J. Power Sources 2011, 196, 1599–1607. [Google Scholar] [CrossRef]
  17. Nelson, M.; Jordan, P.E. Automatic Reconfiguration of a Ship’s Power System Using Graph Theory Principles. IEEE Trans. Ind. Appl. 2015, 51, 2651–2656. [Google Scholar] [CrossRef]
  18. Mensah, E.; Kwatny, H. Models for Optimal Dynamic Reconfiguration and Simulation of Ship Power Systems in Simlink with Stateflow. In Proceedings of the 2007 IEEE Electric Ship Technologies Symposium, Arlington, VA, USA, 21–23 May 2007. [Google Scholar]
  19. Hou, J.; Sun, J.; Hofmann, H. Interaction Analysis and Integrated Control of Hybrid Energy Storage and Generator Control System for Electric Ship Propulsion. In Proceedings of the American Control Conference (ACC), Chicago, IL, USA, 1–3 July 2015. [Google Scholar]
  20. Kanellos, F.D.; Tsekouras, G.J.; Hatziargyriou, N.D. Optimal Demand-Side Management and Power Generation Scheduling in an All-Electric Ship. IEEE Trans. Sustain. Energy 2014, 5, 1166–1175. [Google Scholar] [CrossRef]
  21. López, A.R.; Mina, J.D.; Calderón, G.; Aguayo, J.; Calleja, J.H. Combined parameters selection of a proportional integral plus resonant controller for harmonics compensation in a wind energy conversion system. Electr. Eng. 2018, 100, 2277–2286. [Google Scholar] [CrossRef]
  22. Paran, S.; Vu, T.V.; Mezyani, T. MPC-based Power Management in the Shipboard Power System. In Proceedings of the 2015 IEEE Electric Ship Technologies Symposium (ESTS), Alexandria, VI, USA, 21–24 July 2015. [Google Scholar]
  23. Hatata, A.Y.; Osman, G.; Aladl, M.M. An optimization method for sizing a solar/wind/battery hybrid power system based on the artificial immune system. Sustain. Energy Technol. 2018, 27, 83–93. [Google Scholar] [CrossRef]
  24. Hadidian, M.J.; Nowdeh, S.A. Optimal sizing and energy management of stand-alone hybrid photovoltaic/wind system based on hydrogen storage considering LOEE and LOLE reliability indices using flower pollination algorithm. Renew Energy 2019, 135, 1412–1434. [Google Scholar] [CrossRef]
  25. Sanajaoba, S.S.; Fernandez, E. Modeling, size optimization and sensitivity analysis of a remote hybrid renewable energy system. Energy 2018, 143, 719–731. [Google Scholar] [CrossRef]
  26. De la Cruz, J.; Ramirez, J.M.; Leyva, L. Modification of Geometric Parameters in Outer Rotor Permanent Magnet Generators to Improve THD, Efficiency, and Cogging Torque. Int. J. Emerg. Electr. Power Syst. 2014, 15, 471–483. [Google Scholar] [CrossRef]
  27. Zhang, W.; Maleki, A. A heuristic-based approach for optimizing a small independent solar and wind hybrid power scheme incorporating load forecasting. J. Clean. Prod. 2019, 241, 117920. [Google Scholar] [CrossRef]
  28. Maleki, A.; Pourfayaz, F. Optimal sizing of autonomous hybrid photovoltaic/wind/battery power system with LPSP technology by using evolutionary algorithms. Sol. Energy 2015, 115, 471–483. [Google Scholar] [CrossRef]
  29. Borunda, M.; Garduno, R.; Nicholson, A.E.; De la Cruz, J. Assessment of Small-Scale Wind Turbines to Meet High-Energy Demand in Mexico with Bayesian Decision Networks. In Proceedings of the 18th Mexican International Conference on Artificial Intelligence (MICAI), Xalapa, Mexico, 27 November–2 November 2019. [Google Scholar]
  30. Xu, L.; Wei, B.; Yun, Y. Coordinated Control of Diesel Generators and Batteries in DC Hybrid Electric Shipboard Power System. J. Mar. Sci. Eng. 2021, 14, 6246. [Google Scholar] [CrossRef]
  31. Lamichhane, A.; Zhou, L.; Yao, G. Modeling, Control and Power Management of Six-Phase PMSM Based Shipboard MVDC Distribution System. J. Mar. Sci. Eng. 2020, 13, 4229. [Google Scholar] [CrossRef]
  32. Nair, R.; Narayanan, G. Emulation of Wind Turbine System Using Vector Controlled Induction Motor Drive. IEEE Trans. Ind. Appl. 2020, 56, 4124–4133. [Google Scholar] [CrossRef] [Green Version]
  33. Puchalapalli, S.; Tiwari, S.; Singh, B.; Goel, P. A Microsystem Based on Wind-Driven DFIG, DG, and Solar PV Array for Optimal Fuel Consumption. IEEE Trans. Ind. Appl. 2020, 56, 4689–4699. [Google Scholar] [CrossRef]
  34. He, W.; Mo, O. Accelerating Efficient Installation and Optimization of Battery Energy Storage System Operations Onboard Vessels. J. Mar. Sci. Eng. 2022, 15, 4098. [Google Scholar] [CrossRef]
  35. Kim, S.; Kim, J. Optimal Energy Control of Battery Hybrid System for Marine Vessels by Applying Neural Network Based on Equivalent Consumption Minimization Strategy. J. Mar. Sci. Eng. 2021, 9, 1228. [Google Scholar] [CrossRef]
  36. Antonopoulos, S.; Vissser, K.; Kalikatzarakis, M.; Reppa, V. MPC Framework for the Energy Management of Hybrid Ships with an Energy Storage System. J. Mar. Sci. Eng. 2021, 9, 993. [Google Scholar] [CrossRef]
  37. Jin, Z.; Meng, L.; Guerrero, J.; Han, R. Hierarchical Control Design for Shipboard Power System with DC Distribution and Energy Storage Aboard Future More-Electric Ships. IEEE Trans. Industr. Inform. 2018, 14, 703–714. [Google Scholar] [CrossRef]
  38. Deng, C.; Wen, C.; Zou, Y.; Wang, W.; Li, X. A Hierarchical Security Control Framework of Nonlinear CPS Agent DoS Attacks With Application To Power Sharing of AC Microgrid. IEEE Trans. Cybern. 2022, 52, 5255–5266. [Google Scholar] [CrossRef] [PubMed]
  39. Xiao, S.; Dong, J. Distributed Fault-Tolerant Containment Control for Linear Heterogeneous Multiagent System: A Hierarchical Design Approach. IEEE Trans. Cybern. 2022, 52, 971–981. [Google Scholar] [CrossRef] [PubMed]
  40. Cortajarena, J.; Barambones, O.; Alkorta, P.; Cortajarena, J. Sliding mode control of an active power filter with photovoltaic maximum power tracking. Int. J. Electr. Power Energy Syst. 2019, 110, 747–758. [Google Scholar] [CrossRef]
  41. Mousa, H.; Youssef, A.; Mohamed, E. State of the art perturb and observe MPPT algorithms based wind energy conversion systems: A technology review. Int. J. Electr. Power Energy Syst. 2021, 126, 106598. [Google Scholar] [CrossRef]
  42. Farhat, M.; Barambones, O.; Sbita, L. A Real-Time Implementation of Novel and Stable Variable Step Size MTTP. Energies 2020, 13, 4668. [Google Scholar] [CrossRef]
  43. Abo Gabl, O.M.; Shaaban, M.F.; Zeineldin, H.H.; Ammar, M.E. A Multi-objective Secondary Control Approach for Optimal Design of DG Droop Characteristic and Control Mode for Autonomous Micrsystems. IEEE Syst. J. 2021, 8, 1–10. [Google Scholar] [CrossRef]
  44. Shivam; Dahiya, R. Distributed Control for DC Microsystem Based on Optimized Droop Parameters. IETE J. Res. 2020, 66, 192–203. [Google Scholar] [CrossRef]
  45. Mo, S.; Chen, W.-H.; Lu, X. Hierarchical Hybrid Control for Scaled Consensus and Its Application to Secondary Control for DC Microgri. IEEE Trans. Cybern. 2022, 1–13. [Google Scholar] [CrossRef]
  46. Hou, P.; Hu, W.; Soltani, M.; Chen, Z. Optimized Placement of Wind Turbines in Large-Scale Offshore Wind Farm Using Partical Swarm Optimization Algorithm. IEEE Trans. Sustain. Energy 2015, 6, 1272. [Google Scholar] [CrossRef]
  47. Yang, R.; Wei, H.; Wang, L. Research on Energy Regulation and Optimal Operation Strategy of Multi-energy Ship Power Station Based on Improved Particle Swarm Algorithm. In Proceedings of the 2021 IEEE 5th Conference on IAEAC, Chongqing, China, 12–14 March 2021. [Google Scholar]
  48. Jasim, A.; Jasim, B.; Kraiem, H.; Flah, A. A Multi-Objective Demand/Generation Scheduling Model-Based Microsystem Energy Management System. J. Mar. Sci. Eng. 2022, 14, 10158. [Google Scholar]
Figure 1. Typical system structure diagram.
Jmse 10 01556 g001
Figure 2. Schematic diagram of the diesel engine system.
Jmse 10 01556 g002
Figure 3. Block diagram of diesel engine speed regulation system.
Jmse 10 01556 g003
Figure 4. Diesel engine speed control system model.
Jmse 10 01556 g004
Figure 5. Simulation diagram of synchronous generator and excitation system.
Jmse 10 01556 g005
Figure 6. Equivalent circuit diagram of single diode model.
Jmse 10 01556 g006
Figure 7. Simulation curves of I V (a) and P V (b) for PV power generation system.
Jmse 10 01556 g007
Figure 8. Photovoltaic power generation system simulation diagram.
Jmse 10 01556 g008
Figure 9. Schematic diagram of the doubly-fed wind power generation system.
Jmse 10 01556 g009
Figure 10. Model of a doubly-fed wind power generation system.
Jmse 10 01556 g010
Figure 11. Simulation model of energy storage system.
Jmse 10 01556 g011
Figure 12. Design diagram of the hierarchical control scheme.
Jmse 10 01556 g012
Figure 13. Flowchart of the improved P&O algorithm.
Jmse 10 01556 g013
Figure 14. Block diagram of the droop controller.
Jmse 10 01556 g014
Figure 15. Photovoltaic power generation system simulation diagram. (a) Irradiance variation diagram; (b) output power curve diagram.
Jmse 10 01556 g015
Figure 16. Simulation diagram of wind power generation system. (a) Wind power system output power; (b) C p curve.
Jmse 10 01556 g016
Figure 17. Simulation result of control system. (a) Current waveform; (b) Voltage waveform; (c) System frequency.
Jmse 10 01556 g017
Figure 18. Load day-ahead power forecast (a) and renewable energy day-ahead power forecast (b).
Jmse 10 01556 g018
Figure 19. Power curve of each power generation (a) and SOC curve of energy storage system (b).
Jmse 10 01556 g019
Figure 20. Algorithm comparison graph.
Jmse 10 01556 g020
Table 1. Slope value table.
P Symbol V SymbolSlope Value
+++1
+−1
+−1
+1
Table 2. Comparison of algorithm effects.
AlgorithmTrack Time (s)Maximum Power Loss (kW)
traditional P&O341.115.46
improved P&O393.74.74
Table 3. Economic cost.
Day-Ahead Planned CostImprovement StrategyFixed Strategy *
Diesel generator fuel cost7663.28371.2
Environmental cost of diesel generator751.51820.93
Operating cost of diesel generator28.7428.74
Cost of energy storage system280400
Renewable energy cost99.1999.19
Load profit12151215
Total cost10,037.6410,935.06
* Calculated from basic data.
Publisher’s Note: MDPI stays neutral with regard to jurisdictional claims in published maps and institutional affiliations.

