Article

Study the Flow Capacity of Cylindrical Pellets in Hopper with Unloading Paddle Using DEM

1
College of Mechanical and Electrical Engineering, Henan Agricultural University, Zhengzhou 450002, China
2
Key Laboratory of Swine Facilities Engineering, Ministry of Agriculture, Harbin 150030, China
3
Department of Mechanical Engineering, Faculty of Engineering, Taif University, P.O. 11099, Taif 21944, Saudi Arabia
4
Department of Production and Mechanical Design, Faculty of Engineering, Mansoura University, Mansoura 35516, Egypt
*
Author to whom correspondence should be addressed.
Agriculture 2024, 14(4), 523; https://doi.org/10.3390/agriculture14040523
Submission received: 28 February 2024 / Revised: 20 March 2024 / Accepted: 21 March 2024 / Published: 25 March 2024
(This article belongs to the Special Issue Design, Optimization and Analysis of Agricultural Machinery)

Abstract

:
The hopper is an important piece of basic equipment used for storing and transporting materials in the agricultural, grain, chemical engineering, coal mine and pharmaceutical industries. The discharging performance of hoppers is mainly affected by material properties and hopper structure. In this work, the flow capacity of cylindrical pellets in the hopper with the unloading paddle is studied. A series of numerical simulation analyses with the aid of the discrete element method (DEM) platform are carried out. Then, the discharging process is illustrated, and the flow capacity of pellets in the hopper is analyzed by the mass flow index (MFI), the dynamic discharging angle (DDA) formed in the discharging process and porosity among pellets. Furthermore, the effect of parameters such as hopper half angle, rotation speed of the unloading paddle and outlet diameter of the hopper is investigated. The results show that MFI increases with an increase in hopper half angle or outlet diameter and a decrease in rotation speed. Meanwhile, DDA and porosity decrease with the increase in the hopper half angle or outlet diameter and the decrease in the rotation speed. Finally, the MFI ~0.24 is identified as the criterion to distinguish the mass flow from the funnel flow for the hopper with an unloading paddle, and the optimization results are decided as follows: hopper half angle greater than 60°, outlet diameter greater than 60 mm and rotation speed between 45 rpm and 60 rpm. These results should be useful for providing a theoretical reference for the optimization design of feeding devices for swine feeders.

Graphical Abstract

1. Introduction

Cylindrical pellet feed is a bulk solid feed used widely in the swine industry [1,2,3,4,5]. A feeder typically consists of a hopper, an unloading unit (optional design according to feed requirements) and a feed trough. The cylindrical pellets fall into the feed trough from the hopper by the unloading unit or gravity. However, it is also indicated that cylindrical pellets are blocked once arching behavior occurs in the discharging process, which seriously affects the feeding program due to the suspension of the feeding process of the swine. Meanwhile, if the discharging process cannot ensure cylindrical pellets “first in first out” from the hopper in a continuous feeding process, feed quality will be affected, thus affecting the health of swine. Therefore, the flow capacity of cylindrical pellets in the hopper during the discharging process is important to the design, optimization and application of feeders [6,7].
Recently, scholars have focused their research on discharge characteristics in the hopper [8,9,10,11,12,13,14]. For instance, Mahajan et al. [15] modified the design to improve the feeding accuracy of the belt weigh feeder system, which ensured uniform feeding of material by adjusting the gate opening of the feeding hopper and adjusting the vibrating motors attached to the feeding hopper. Chandravanshi et al. [16] carried out the theory analysis for the vibratory feeder. Furthermore, the movement of particles being delivered was analyzed at different frequencies in the experiment. Zhang et al. [17] revealed that the transition from mass flow to funnel flow existed during the discharging process for a conical silo with a flapper at the outlet of the silo. Specifically, the height of the flow pattern transition could be determined by DEM simulations, and the impact of the outlet size of the silo on the critical height was investigated. Fernandez et al. [18] evaluated the effect of the relative performance of different screw options, including a variable screw pitch, variable screw flight outside diameters and variable core diameters, on spherical particles in a horizontal screw feeder so as to evaluate the relative performance of different screw options. To date, all studies tend to optimize the parameters of the mechanism in accordance with different groups of experiments. Many measures have been adopted in the design of feeders, including adding vibrating motors attached to hoppers, adding a flapper at the outlet of the silo and setting up the screw device in the elevation direction with the longitudinal section of hoppers [19,20]. Although many kinds of feeders have been designed and applied in different kinds of industries, the flow capacity of pellets discharged from the hopper with an unloading paddle is seldom studied.
The discrete element method (DEM) is used extensively for the simulation of granules and in powder technology [21,22,23,24]. Ma et al. [25] proposed an intelligent calibration method for microscopic parameters based on the measured landslide accumulation morphology and the discrete element numerical simulation method. DEM is often used to investigate the particle flow in a feeder and obtain some useful findings [26]. The main advantage of DEM is that it can describe some dynamic information that is difficult to obtain by experiment [27]. In this work, DEM is adopted to investigate the flow capacity of cylindrical pellets in a hopper with an unloading paddle.
The goal of the work is to investigate the effect of the main parameters on the discharging process of cylindrical pellets in the hopper with an unloading paddle and to determine these parameters using the mass flow theory. Using DEM and physical experiments, we achieved the following objectives: to investigate the effect of main parameters, such as hopper half angle, rotation speed of the unloading paddle and outlet diameter of the hopper, on the flow capacity of cylindrical pellets; to evaluate the flow capacity by introducing the mass flow index (MFI), the dynamic discharging angle (DDA) and porosity; to decide the criterion for distinguishing between mass flow and funnel flow; and to determine the optimized parameters for the design of the hoppers with an unloading paddle.

2. Technical Solution and DEM Simulations

2.1. Research Technology Route

For the purpose of exploring the flow capacity of pellets in the hopper with an unloading paddle, numerical simulation and physical experiments are applied in this work. The research technology route is presented in Figure 1, which is determined according to the research characteristics. The work is carried out step by step according to the progress sequence: kinematics analysis of an unloading paddle, analyzing the influence law of the unloading paddle on discharging, determining the key parameters affecting the discharging of the hopper, studying the virtual discharge process, determining the MFI value used to define the flow patterns and optimizing parameters for the experimental research.

2.2. DEM Model Description

2.2.1. Mechanical Contact Model

A three-dimensional DEM based on the soft-sphere model is used to simulate the flow process of cylindrical pellets (simplified as pellets in the following) in a hopper with an unloading paddle. The translation and rotation of each particle in a system are described by Newton’s law of motion. Therefore, the equations (translational and rotational motion) of a particle i interacting with another particle j can be given by:
m i d v i d t = m i g + j = 1 n i ( F n k + F n c + F t k + F t c ) I i d ω i d t = j = 1 n i ( M t + M f )
where vi and ωi are the translational and angular velocities of particle i respectively, with the gravity m i g and the moment of inertia Ii. ni is the number of particle j in collision with particle i. F n k and F t k are the elastic contact force in both normal and tangential components at the contact point, respectively. F n c and F t c are the viscous damping force in both normal and tangential components at the contact point, respectively. Mt and Mf are the torque generated by tangential force and rolling friction torque respectively.
Considering the numerous studies, the Hertz–Mindlin is the most widespread contact model that can be applied in DEM simulations [17,28]. Thus, the no-slip Hertz–Mindlin contact model is adopted for the calculation of the above forces and torques of pellets; this model combines Hertz’s theory in the normal direction and Mindlin’s no-slip model in the tangential direction [29,30,31]. All forces and torques in the contact model, according to the above equations, are summarized in Table 1 [32,33,34]. The simulation of the pellet flow process is performed by the professional EDEM 2.7 (DEM Solution, Edinburgh, UK) software, which was installed on an Intel Xeon CPU E5-2690 v4 with 24 GB of RAM and a 64-bit Windows 7 Professional operating system. With the existing configuration, it takes approximately six CPU hours to simulate 1 s of real-time. When the number of cores in the simulator engine can be adjusted to six, the time step is 2.5 × 10⁻⁵ s for all simulations, ensuring the real situation and increasing calculation speed.

2.2.2. Simulation Condition

In this work, the prototype of a simulated pellet is pellet feed used in the swine industry, and the appearance is similar to that of a cylinder. The geometrical dimensions of 100 pellets are randomly measured by the Vernier Calipers; they can get a pellet with an average length L of 7.98 mm and an average radius R of 2.5 mm. At the same time, if the density measurement of a pellet is 1538 kg·m−3, then the discrete element modeling of a pellet is established according to the above data [16,35,36,37,38,39,40,41]. In order to truly restore the state of the pellets and consider the computation of the simulation test, it is usually necessary to adjust the number and size of subspheres. Finally, the virtual model of the pellet is composed of 45 overlapping spheres of the same radius as EDEM. The theoretical radius of the nine spheres in the top section is shown in Figure 2a; the coordinate values of the nine spheres are determined based on the actual pellet diameter, as shown in Table 2, and the virtual model of the pellet is shown in Figure 2b.
The team independently designed a swine feeder; its structure diagram is shown in Figure 3. It shows that the device contains a hopper, a rotating shaft, an unloading unit and a feeding trough. As the key part of the feeding device, the unloading unit consists of an unloading paddle and a fixed disk. The unloading paddle is arranged 9 mm below the discharge outlet of the hopper based on the requirements of pellets’ unloading. The fixed disk mentioned above is designed as a stainless-steel disk with thickness hF = 3 mm and is by Equation (2). The structural parameters of the unloading paddle are thickness hP = 3 mm, rotation diameter Dr = (DF + 6) mm, maximum width B1 = 20 mm and radius of curvature r = 70 mm, respectively, as shown in Figure 4. Furthermore, the back wall of the unloading paddle is a line shape, and the front wall is designed as an arc curve for pushing pellets on the fixed disk.
D F = 2 × h 1 tan β r + D 2 2 + h 1
where DF and D2 are the diameters of the fixed disk and the discharge outlet, respectively (mm). βr is the angle of repose of pellets (°). h1 = 9 mm (the distance between the outlet and the unloading paddle mentioned above).
In the simulations, the coordinate axis is placed in the center of the intersection between the cylindrical part and conical part in the hopper, the positive direction of the X axis is pointed to the inside of the hopper, and the global variable parameters used between the pellet and the feeding system are determined based on the physical test results of the basic characteristic parameters and contact parameters of pellets, feeding system, pellet-pellet and pellet-feeding system, as shown in Table 3. The values of the characteristic parameters used in the simulation tests are the same as in our previous work [42].
In order to improve the accuracy of the simulation calculation, the simulation started with the random generation of pellets from the top of the hopper in each simulation test, and all pellets in an unlimited style fell onto the bottom of the hopper under gravity until more than 100 mm high in the cylindrical part was reached, which ensured the flow capacity of pellets in the hopper. When all the pellets are in a steady state, the unloading paddle is driven by the stepper motor and pellets in the hopper fall into the feeding trough. During the simulation test, the position and velocity data for each pellet are automatically saved every 0.01 s.

2.3. Evaluation Index

2.3.1. MFI Theory

MFI [14,17,43] is used to define the flow patterns in the hopper with an unloading paddle accurately. The MFI value is the ratio of the average vertical velocity of the pellet near the wall to the average vertical velocity of the pellet in the center, it is calculated as follows:
ν W = i = 1 t ν i t
Then
MFI = ν W ν C
where vc and vw are the average vertical velocity of pellets in the center and near the wall, respectively (m/s). vi is the average vertical velocity of pellets in each cuboid unit at time step i (m/s). t is the total time step when the top surface at the center of the hopper flows downward from Y = 100 mm to the position of Y = 45 mm (s).
To observe the flow pattern and analyze the important data conveniently, the vi mentioned above can be obtained in a series of cuboid units (in the height range of 0 mm ≤ Y ≤ 40 mm) as shown in Figure 3. The left (right) cuboid unit is 10 mm away from the hopper wall.

2.3.2. DDA and Porosity Theory

The dynamic discharging angle (DDA) and porosity are used to describe the flow characteristics of pellets in the hopper during the discharging process. The DDA is defined as the maximum angle between the tangent of the top slope surface and the level in the center when the top surface flows downward from 100 mm to the position of Y = 45 mm, as shown in Figure 3. The tangent of the top slope surface above is formed by the tangent between the lowest point of the level in the center and the slope surface. The mean value of the DDA at the different layer heights is calculated by applying Equation (5). Meanwhile, the porosity in each cuboid unit with a range of 0 mm ≤ Y ≤ 40 mm is calculated in Equation (6).
α i = arctan ( y r y l z r z l )
where α i is the DDA formed in the discharging process (°). (yl, zl) are the coordinate average in the intersection of the tangent of the top slope surface and the level in the center at the time step i (mm, mm). (yr, zr) are the coordinate average at the intersection of the top slope surface and the tangent at the time step i (mm, mm).
P = V N ¯ V p V
where P and N ¯ are the porosity and the average number of pellets in each cuboid unit, respectively, when the top surface flows downward from 100 mm to the position of Y = 45 mm (/,/). V is the volume of each cuboid unit (mm3). Vp is the volume of each pellet (mm3).

2.4. Simulation Tests Arrangement

The hopper half angle, outlet diameter of the hopper and rotation speed of the unloading paddle are important parameters in the design of the hopper with the unloading unit [44,45]. For the purpose of studying the effect of the parameters on the flow capacity of pellets inside the hopper, experimental factors and levels are determined by pretest and the Beverloo Equation [46], as well as the prediction of mass discharge rate suggested by Zheng [47]. The hopper half angle varies from 45 to 75°, the rotation speed transitions from 30 rpm to 60 rpm, and the outlet diameter changes from 60 mm to 140 mm, as shown in Table 4.

3. Analysis of the Discharging Effect of the Unloading Paddle

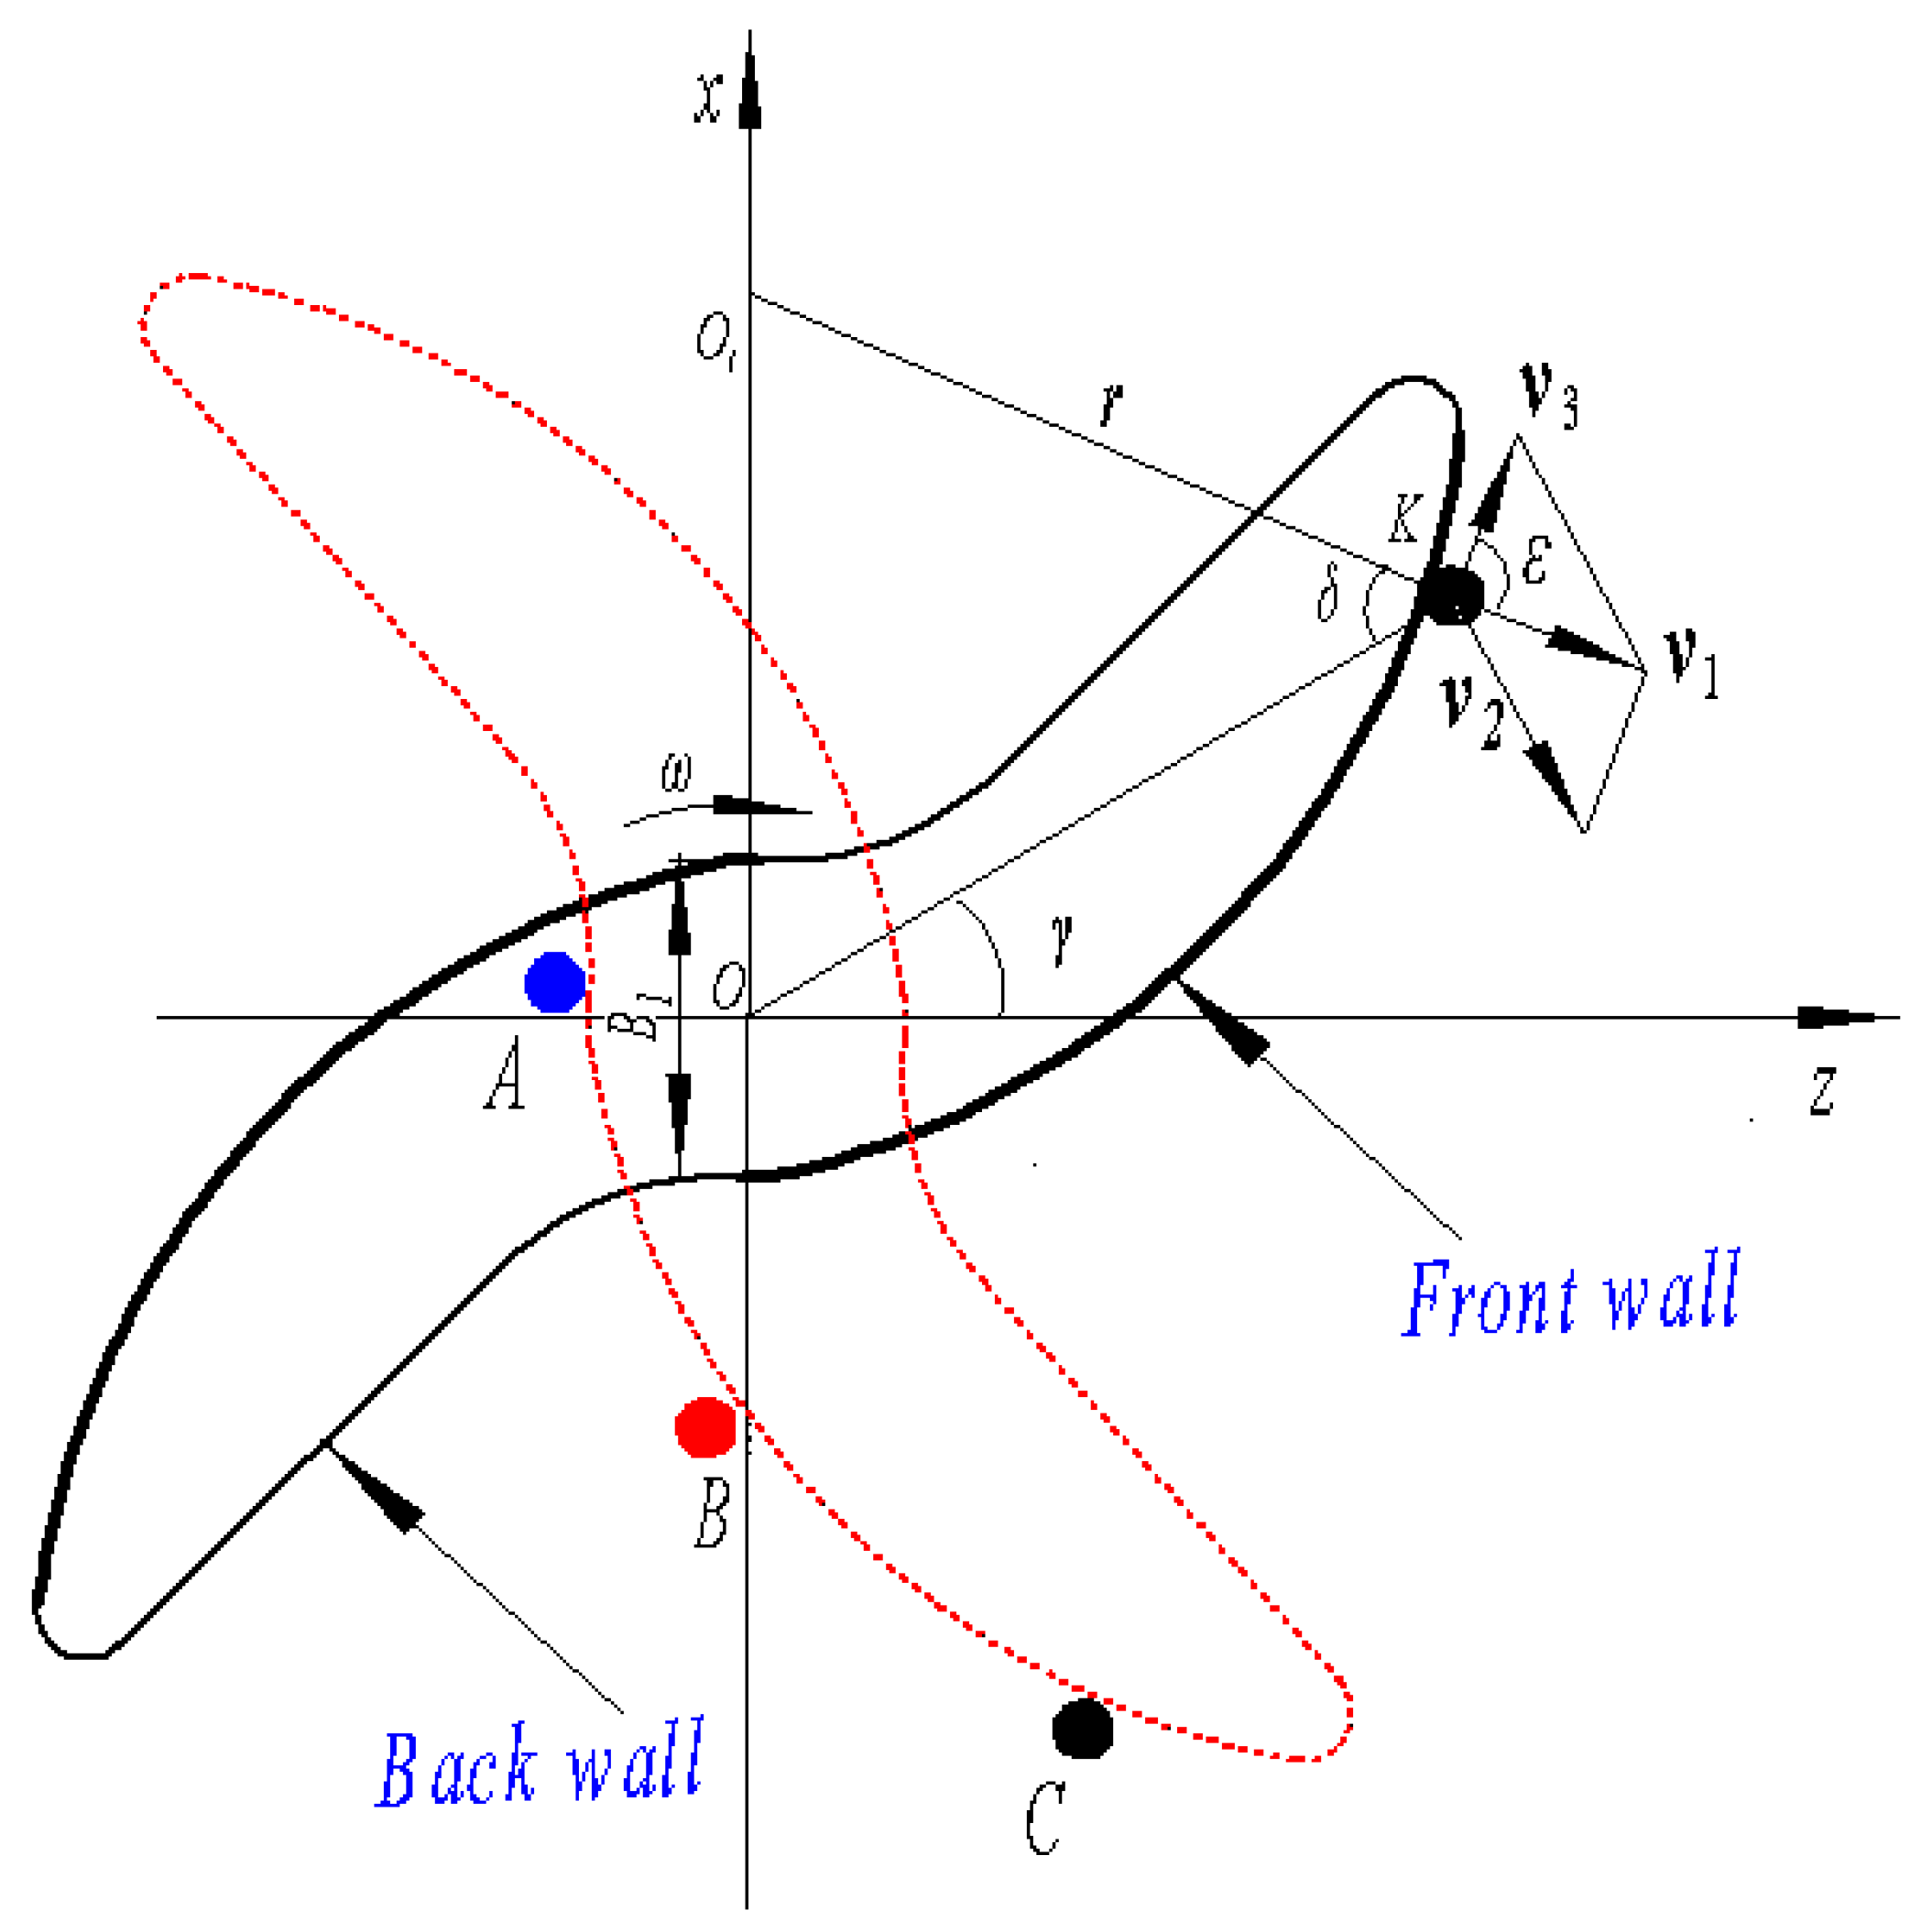
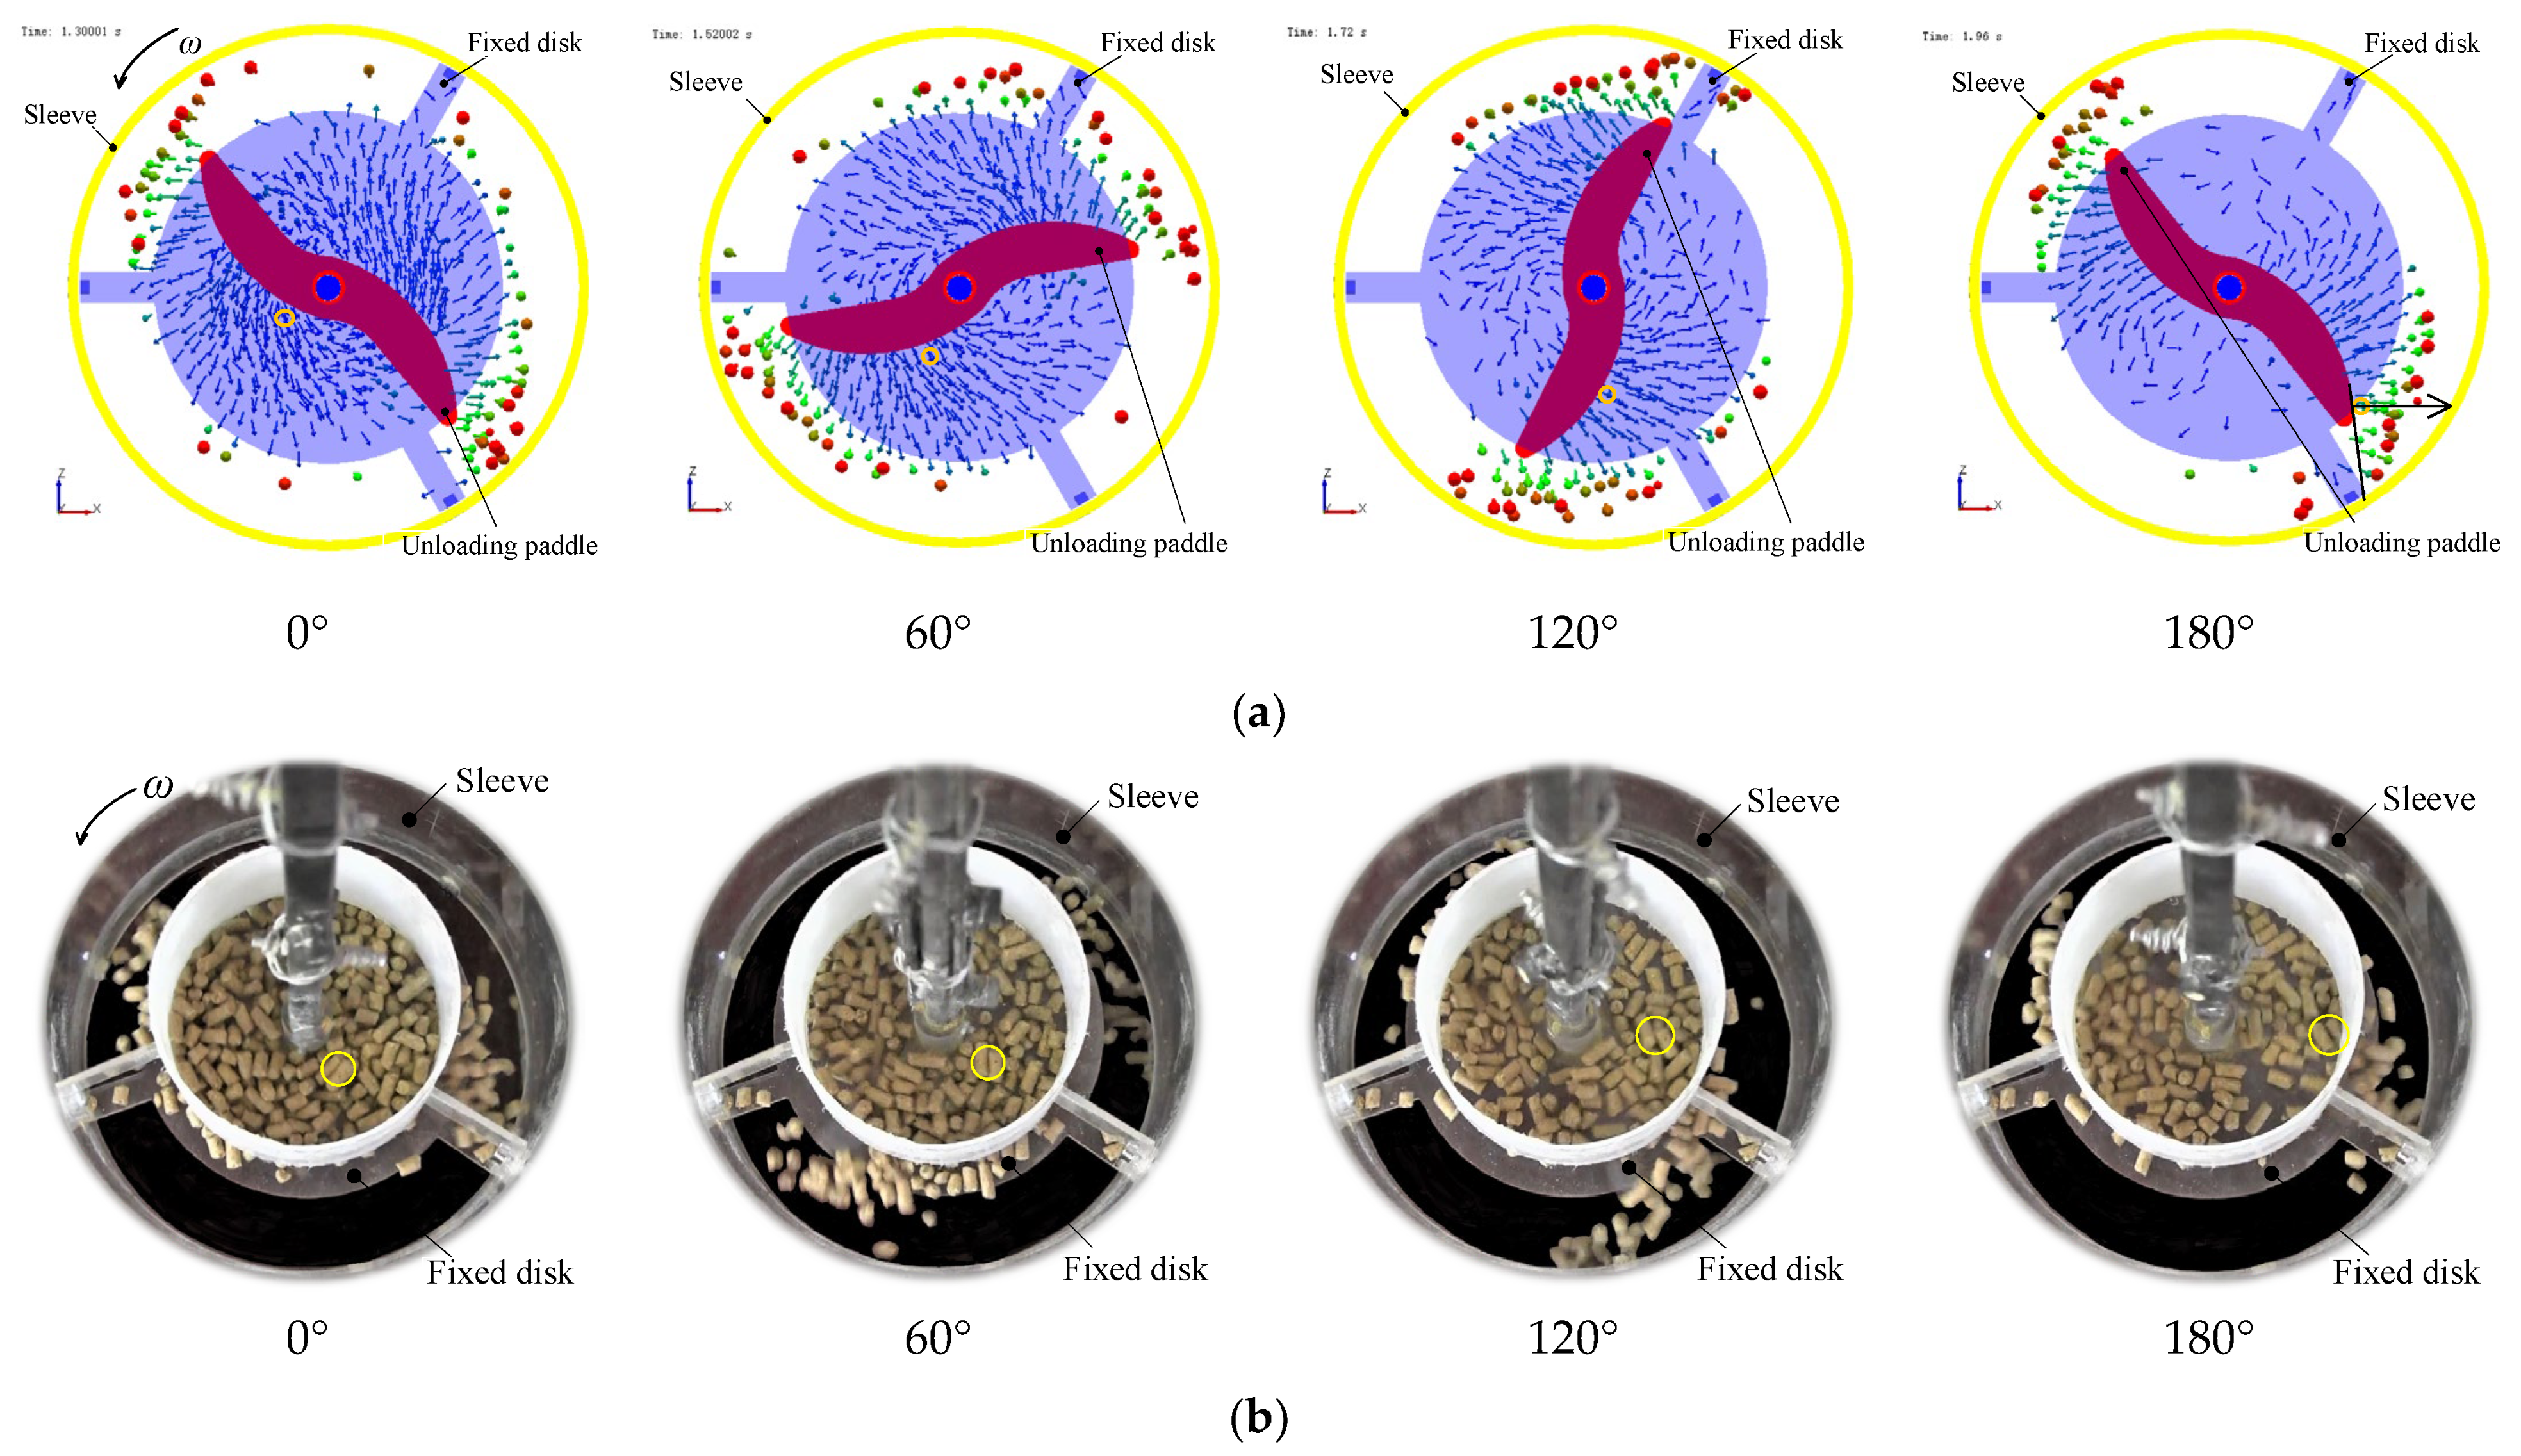
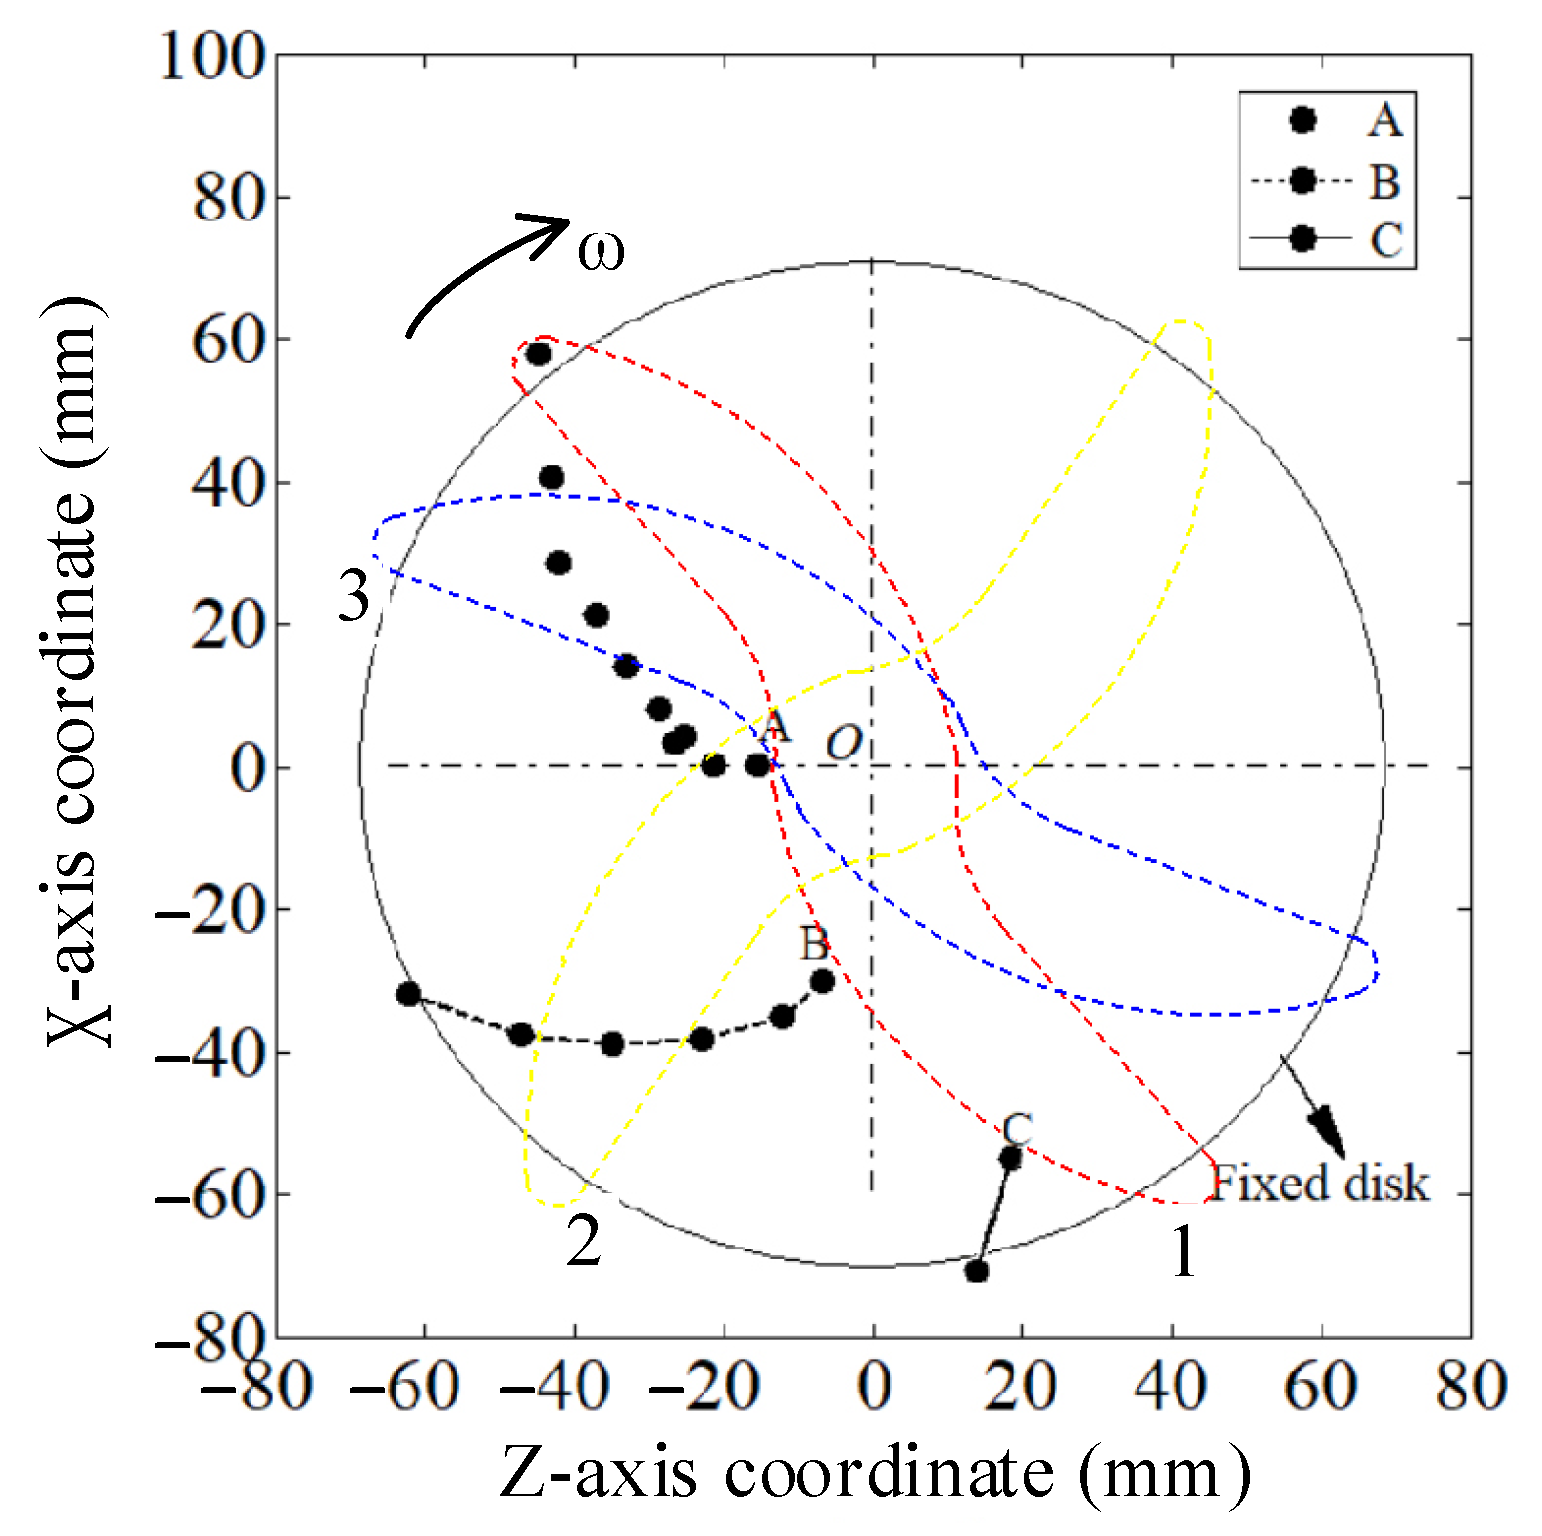
3.1. Effect of the Unloading Paddle on Pellets on the Fixed Disk

With the rotation of the unloading paddle, such as from the initial solid line position to the dotted line position, as shown in Figure 4, pellets on the fixed disk are pushed and discharged. In Figure 4, A pellet K that is about to leave the edge of the fixed disk is randomly selected as the research object for theoretical analysis to reflect the movement law of pellets on the fixed disk. Firstly, the relative formula in ΔO1OK is shown in Equations (7)–(9).
cos ( π 2 γ ) = l O O 1 2 + l O K 2 r 2 2 l O O 1 l O K
sin ( π 2 γ ) r = sin δ l O O 1 ( 0 < γ < π 2 )
l O O 1 = r B 1 2
The relation between the absolute velocity and the following velocity can be obtained through the kinematic analysis of the pellet K, as shown in Equation (7).
sin ε ν 2 = sin π 2 + ε δ ν 1
v 2 = ω l O K
where v1 is the absolute velocity (m/s). v2 is the following velocity (m/s).
From Figure 4 and Equation (10), v1 gradually increases from the inside to the outside along the curved unloading paddle, meanwhile the direction of v1 is anisotropic, which is to the realization of the uniform discharge. In Figure 4, angle ε is the angle between the relative velocity v3 and the absolute velocity v1 (°). Based on the calculation, angle ε is 97.3° ± 1° when the rotation speed changes from 30 to 60 rpm, which indicates pellets left the fixed disk approximately along the arc normal direction. Then, the direction of pellet absolute velocity is anisotropic along the curved unloading paddle, which is beneficial to uniform discharge.
Then, the DEM 2.7 software is used to conduct a virtual simulation of the movement process of pellets by the unloading paddle, and the discharging process is also tested according to the rotation speed of 45 rpm and the outlet diameter of 100 mm. After simulation, the vector display method is used to visually process the pellets on the fixed disk, the arrow direction is specified by the velocity magnitude. Meanwhile, the pellets are given different colors to reflect the velocity magnitude; red, green and blue are the min color, mid color and max color, respectively. The simulation snapshots in Figure 5a revealed that pellets showed an anisotropy distribution. As the unloading paddle rotates counterclockwise, it can be seen that the inside pellets were pushed gradually to the outside of the fixed disk by the unloading paddle and finally, the outside pellets left the fixed disk at a rapid velocity approximately along the arc normal.
Additionally, the discharge experiment in the straight part of the hopper is carried out under the same parameter conditions. Then, a pellet is randomly selected in the central area of the fixed disk and circled with yellow marks to analyze the details. The results show that the pellets discharged from the fixed disk are basically evenly distributed, as shown in Figure 5b, and the movement rule of pellets at the yellow mark is approximately consistent with the simulation, which proves the correctness of the virtual simulation.
Further, the trajectory of three pellets near the inside, middle and outside of the paddle on the fixed disk is tracked by the simulation so as to clarify the discharging process. As shown in Figure 6, the trajectory of the C pellet is a straight line, and it can be seen that the direction of the C pellet is approximately along the arc normal combining with position 1 of the unloading paddle. While the trajectory of the B pellet consists of an arc and a straight line, which is due to the B pellet first being pushed towards the edge of the fixed disk by the unloading paddle, the B pellet leaves the fixed disk approximately along the arc normal of the unloading paddle, similar to the C pellet combining with position 2 of the unloading paddle. Finally, the trajectory of the A pellet is similar to that of the B pellet; the motion direction of the A pellet is approximately along the arc normal, combining with position 3 of the unloading paddle. Nevertheless, the curvature of the arc in the A pellet trajectory is slightly larger than that of the B pellet; this may be because the velocity of the A pellet increases gradually when the A pellet moves outside.
In other words, the above analysis and experiment verify that the inside pellets gradually move outside as the unloading paddle rotates and eventually move away from the fixed disk approximately along the normal arc of the unloading paddle.
Figure 6. The movement trajectory of three pellets on the fixed disk. A is the pellet near the inside, B is the pellet near the middle and C is the pellet near the outside of the unloading paddle. Noting that red, yellow and blue represent the three positions in the clockwise rotation of the unloading paddle on the fixed disk.
Agriculture 14 00523 g006

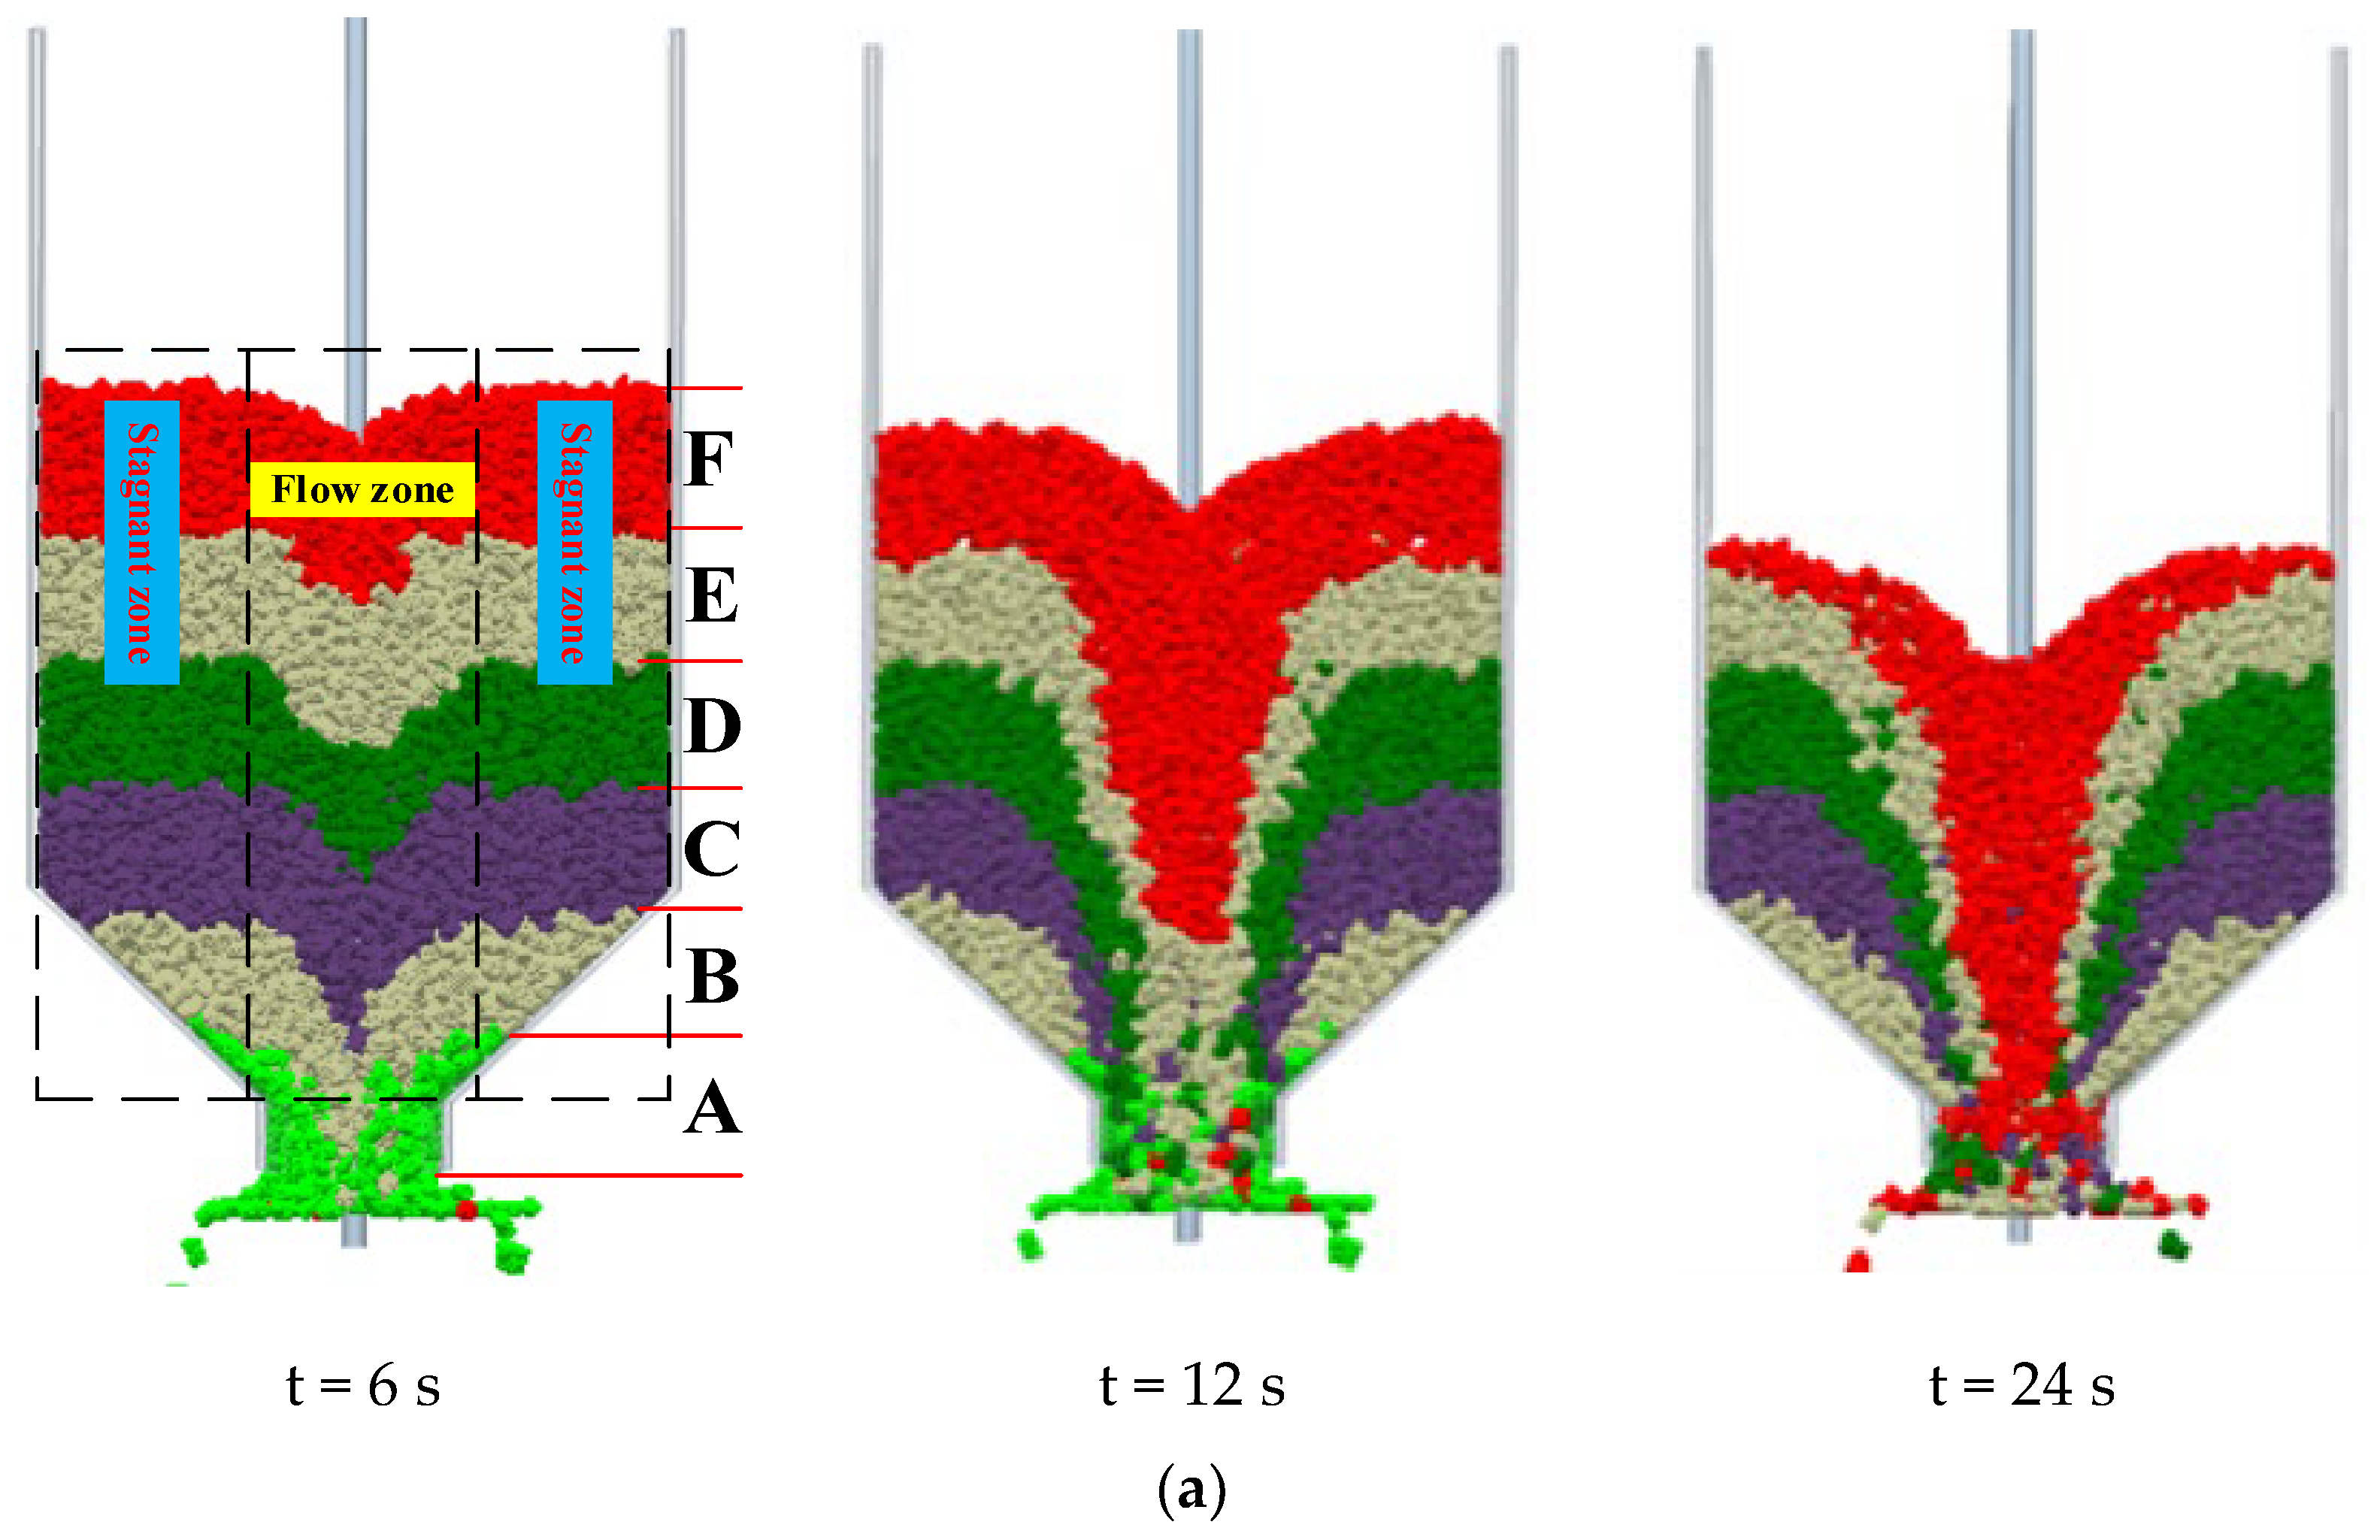
3.2. Effect of the Unloading Paddle on Pellets in the Hopper

According to Figure 6, the unloading paddle pushes pellets on the fixed disk away. In order to discuss the effect of the unloading paddle on pellets in the hopper during the discharging process, the movement trajectory of the three pellets is tracked at a distance of 20 mm, 36 mm and 60 mm from the hopper center, respectively. When the hopper half angle is 75°, the rotation speed is 45 rpm and the outlet diameter is 100 mm. As shown in Figure 7, the pellets A, B and C move down a vertical line in the cylindrical part. Then, the pellets A, B and C have a motion trend towards the hopper center when falling into the lower conical part of the hopper, which is because the shrinkage of the hopper wall impels pellets near the hopper wall to move toward the hopper center.
Near the straight part of the outlet, the pellets A and B begin to have both a downward displacement and a reciprocating motion away from the hopper center, while the pellet C basically moves downward. The pellet A spreads towards the outside of the outlet more obviously than the pellets B and C after entering the straight part of the outlet, which may be because when the unloading paddle rotates, the center pellets gradually move to the outer edge of the fixed disk with the rotation, while a small number of particles on the edge of the straight part fall to the edge of the fixed disk and are directly sent to the feeding trough by the unloading paddle. Therefore, the pellets in the center are most frequently and actively sent by the unloading paddle, resulting in the radial displacement of the pellets in the center during the falling process. As a result, the pellets in the center of the upper layer will continue to be carried out along with the pellets on the fixed disk, but the energy may be lost during the transfer process, resulting in the movement trajectory (flow characteristics) of the pellets above the straight part not being greatly affected. Finally, pellets A, B and C are discharged through the gap between the fixed disk and the outlet of the hopper. Therefore, pellets are distributed into the feeding trough layer by layer by the unloading paddle, which is beneficial to evenly discharge pellets from the hopper [48].
The above analyses show that the motion of the unloading paddle and the shrinkage of the hopper wall have certain effects on the discharging process of pellets. Thus, it is necessary to study the effect of the hopper half angle, the outlet diameter and the rotation speed on the flow capacity of pellets in the hopper with the unloading paddle.

4. Effect Analysis of Main Parameters on Flow Capacity and Bench Test

4.1. The Effect of Hopper Half Angle on Flow Capacity

Numerous studies have shown that the hopper half angle is one of the key structural parameters in the design of hoppers, meanwhile, which has a significant influence on flow patterns [17,47]. The hopper half angle increases from 45 to 75° with a step of 5° when the rotation speed is 45 rpm and the outlet diameter is 100 mm. Simulation results from test 1 to test 7 are analyzed.

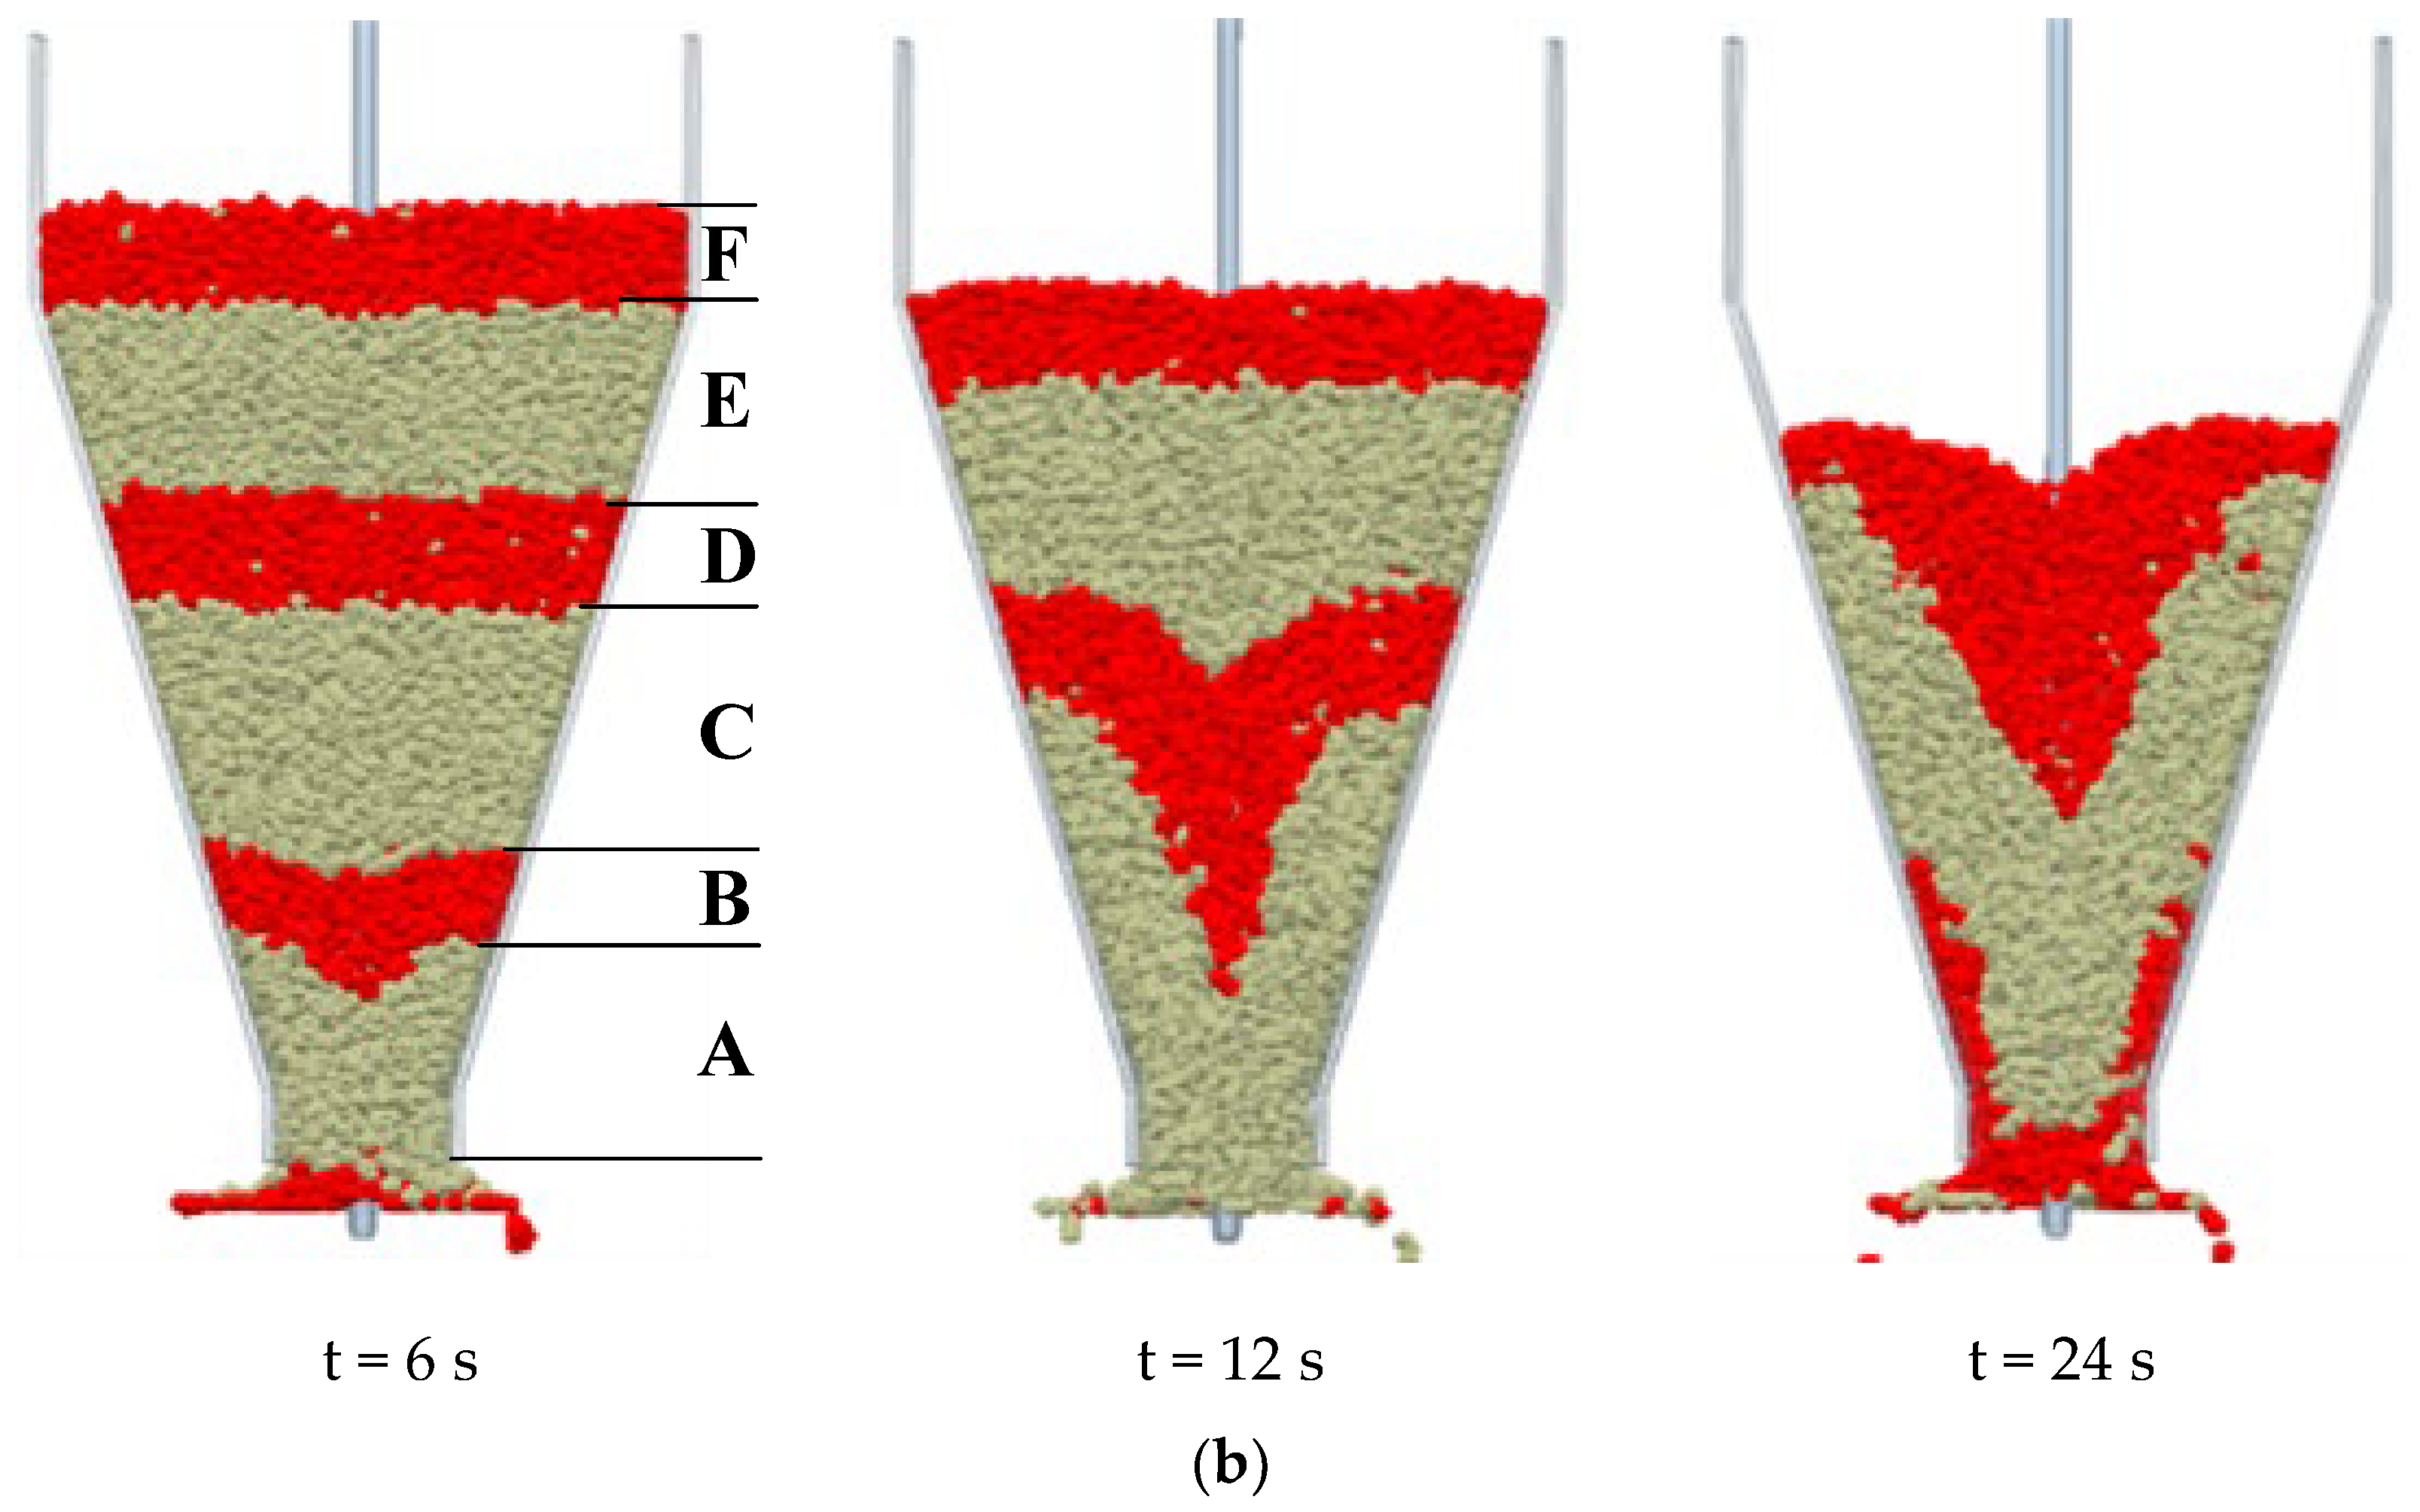
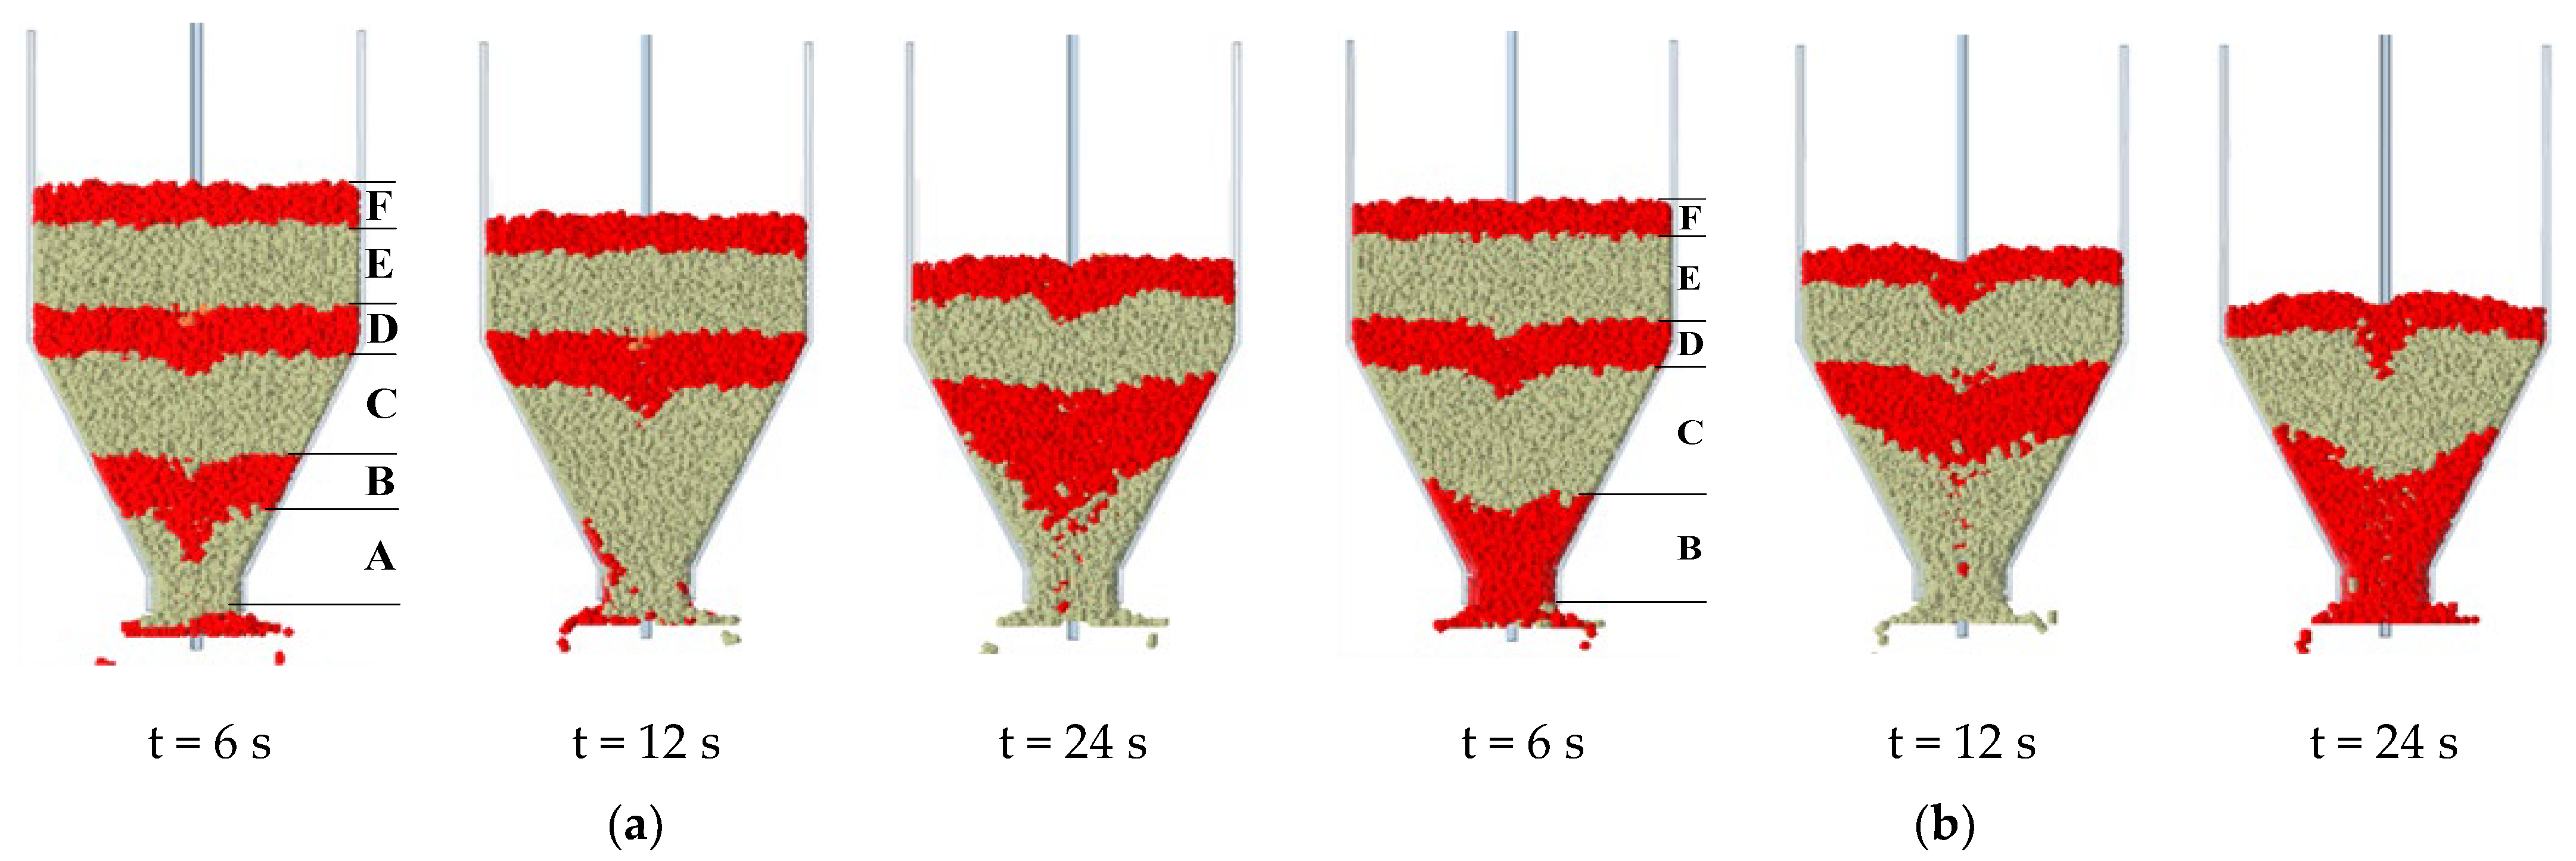
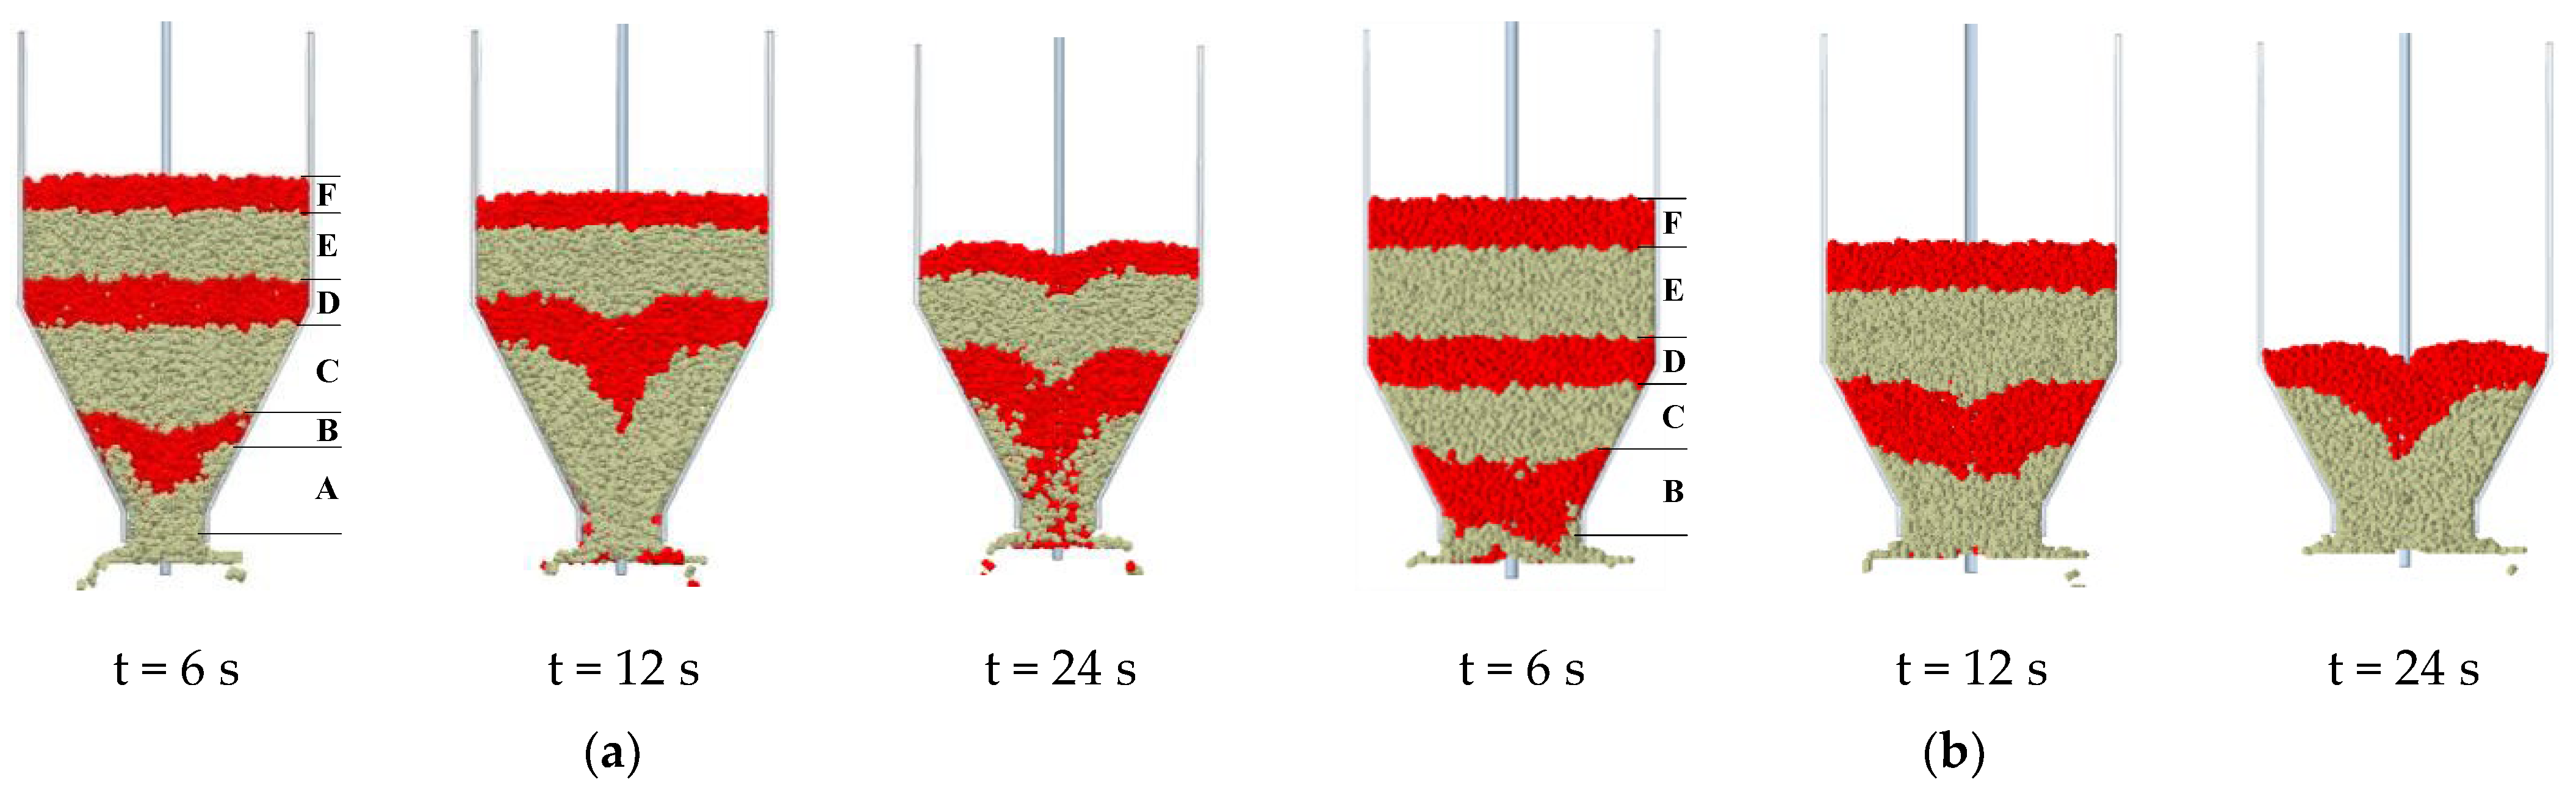
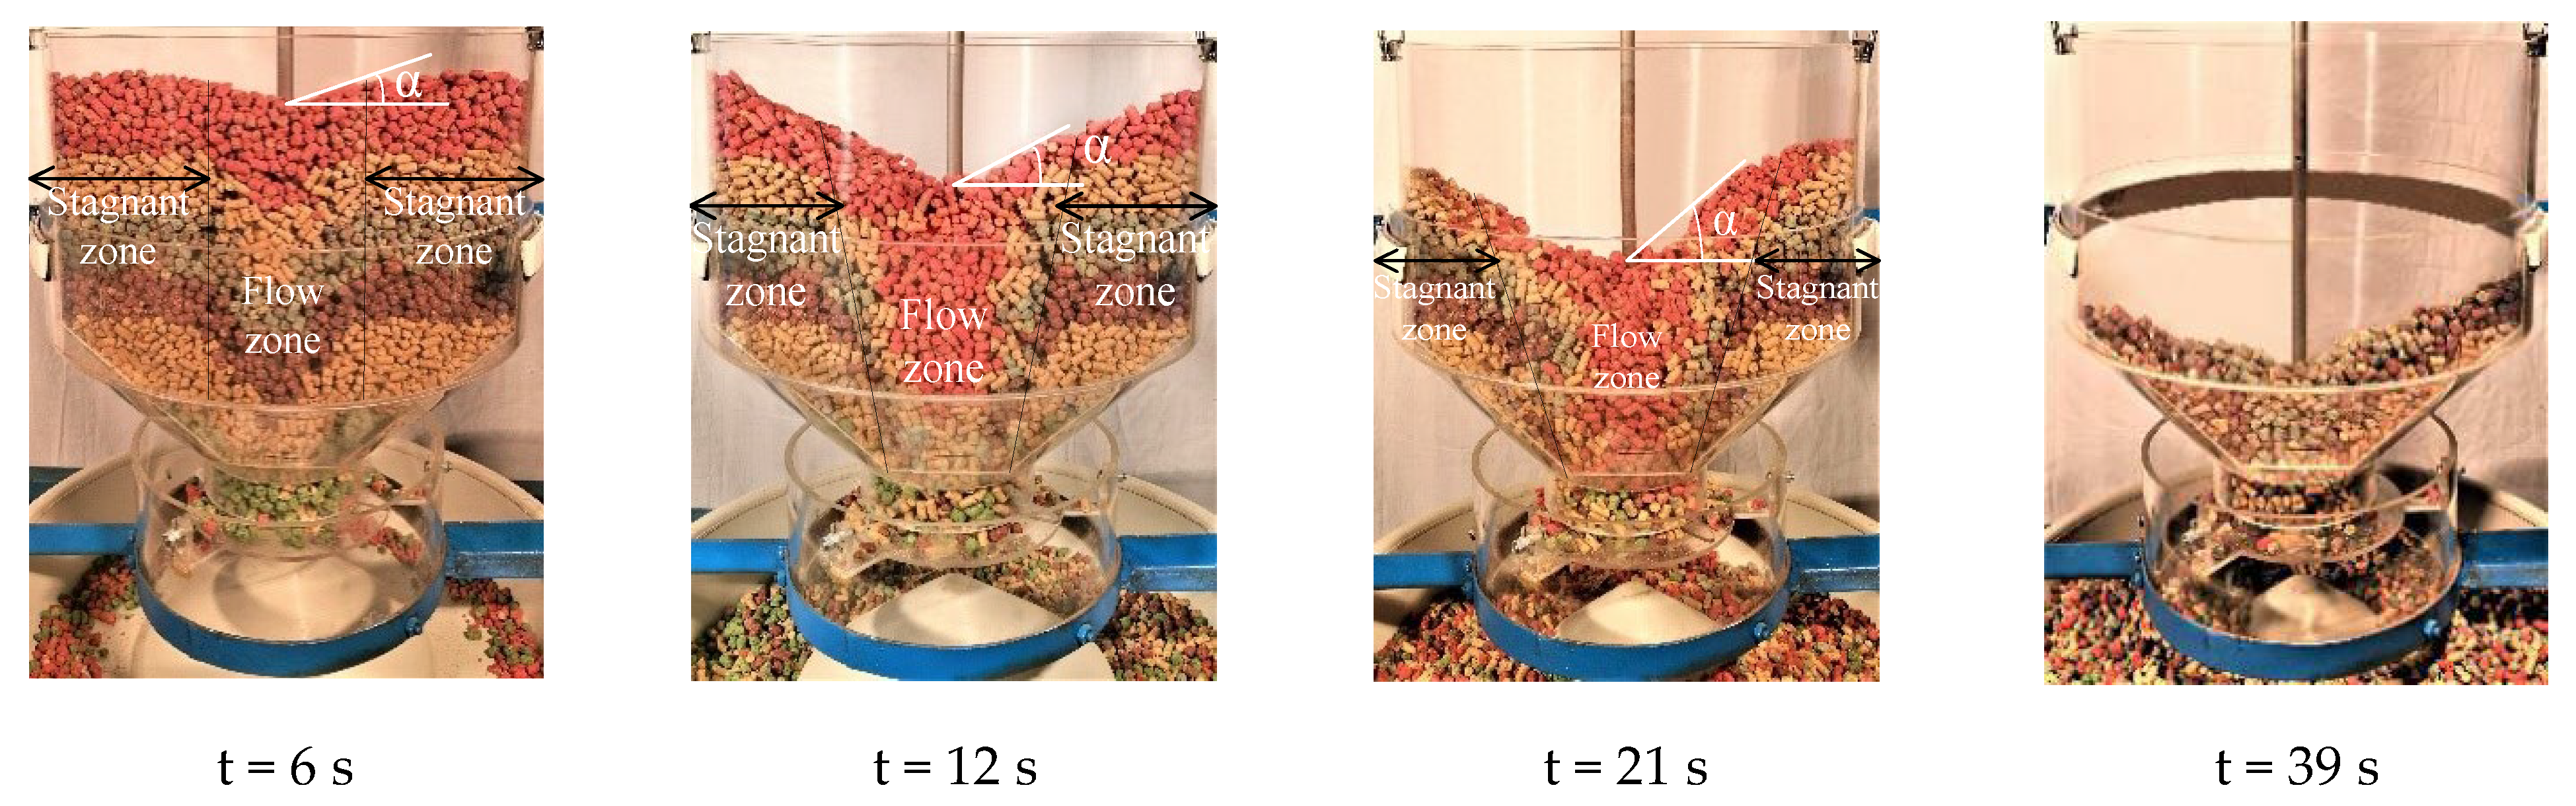
4.1.1. Analysis of Discharging Process

It is worthy to study the complex pellet-flowing phenomena in the hopper during the discharging process [49]. Figure 8a,b show the discharging process under the hopper half angle of 45° and 75°, respectively, when the rotation speed is 45 rpm and the outlet diameter is 100 mm. Different pellet-coloring layer classification methods are used to conveniently distinguish different flow patterns of pellets in the hopper.
In Figure 8a, at 6 s, pellets in the center of layer A have been discharged from the hopper, and pellets in the center of layer B~F are in turn filled toward the hopper center. A narrow flow zone is formed in the center of each layer of pellets, and a symmetrical dip is formed on the top surface, which is consistent with that presented by Drescher et al. [50]. However, pellets near the wall of layer B~F remained relatively in their original posture, which forms the stagnant zone proposed in [21]. Then, from 6 s to 12 s, pellet layers in the flow zone continue to flow to the outlet, and the symmetrical dip on the top surface gradually increases with the discharging process. As the number of pellets in layer F are filled into the flow zone, this stagnant zone slowly decreases. From 12 s to 24 s, pellets in layer F are poured into the flow zone continuously and pellets in the stagnant zone of layer E begin to fill up the flow zone because most pellets in layer F have been discharged from the hopper. The symmetrical dip is even more pronounced at this moment, and the stagnant zone decreases obviously with the discharging process. In short, the above phenomena demonstrate the characteristics of “fast in the center, slow near the wall”. Nevertheless, in livestock and poultry industry, continuous or regular filling of pellets into the hopper of the feeder is necessary to ensure feed supply, which will cause pellets near the wall to further extend retention time in the hopper, and the flow pattern may affect the feeding quality in the long run.
Figure 8b demonstrates that pellets in layer A are discharging, pellets in layer B form a small, inverted cone and pellets in other layers keep falling as a whole at 6 s. Then, from 6 s to 12 s, pellets in layer A have been discharged from the hopper and pellets in layer B have basically been discharged. Meanwhile, pellets in layer C are flowing to the outlet of the hopper, layer D and layer E have formed an inverted cone. While layer F in the cylindrical part has been downward as a whole, no inverted cone has appeared until pellets completely enter the conical part. From 12 s to 24 s, pellets in layer D have basically been discharged and pellets in layer E have basically reached the outlet, whereas layer F forms an inverted cone at this moment, and the symmetrical dip formed by the top surface begins to appear. It can be seen that the pellet layer in the cylindrical part falls overall during the discharging process, while the pellet layer in the conical part forms an inverted cone. This can be explained for the following reasons: the hopper wall in the conical part gradually shrinks and friction exists between the hopper wall and pellets. This reflects the characteristics of mass flow in the conical part according to the principle of volume conservation, which is basically consistent with Fullard’s explanation [51]. In short, the discharge rule of “pellets in the lower layer are firstly discharged from the hopper, and pellets on the upper layer are subsequently discharged” is shown; therefore, the flow zone is filled all over the hopper during the discharging process. The discharging process can be described as “first in, first out”.

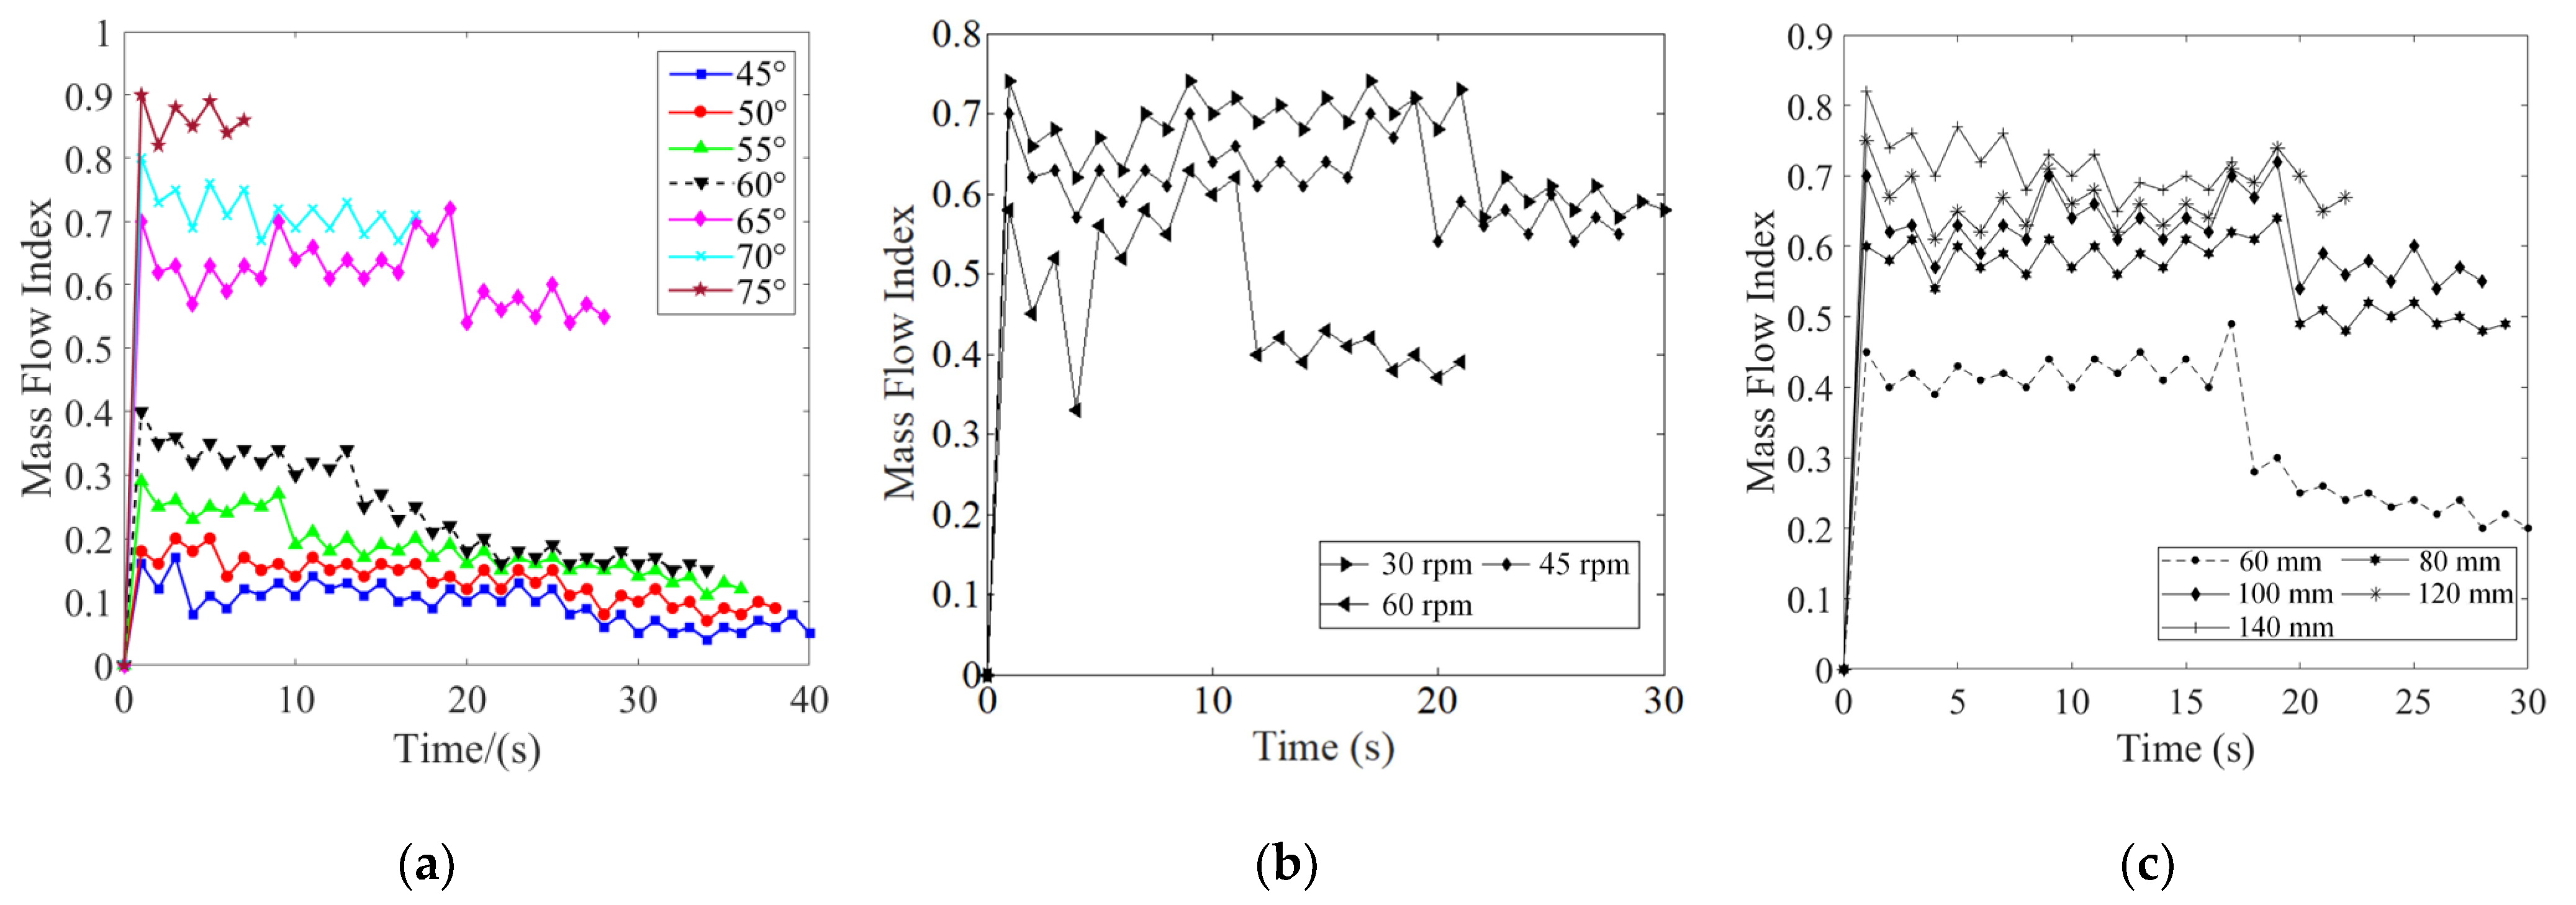
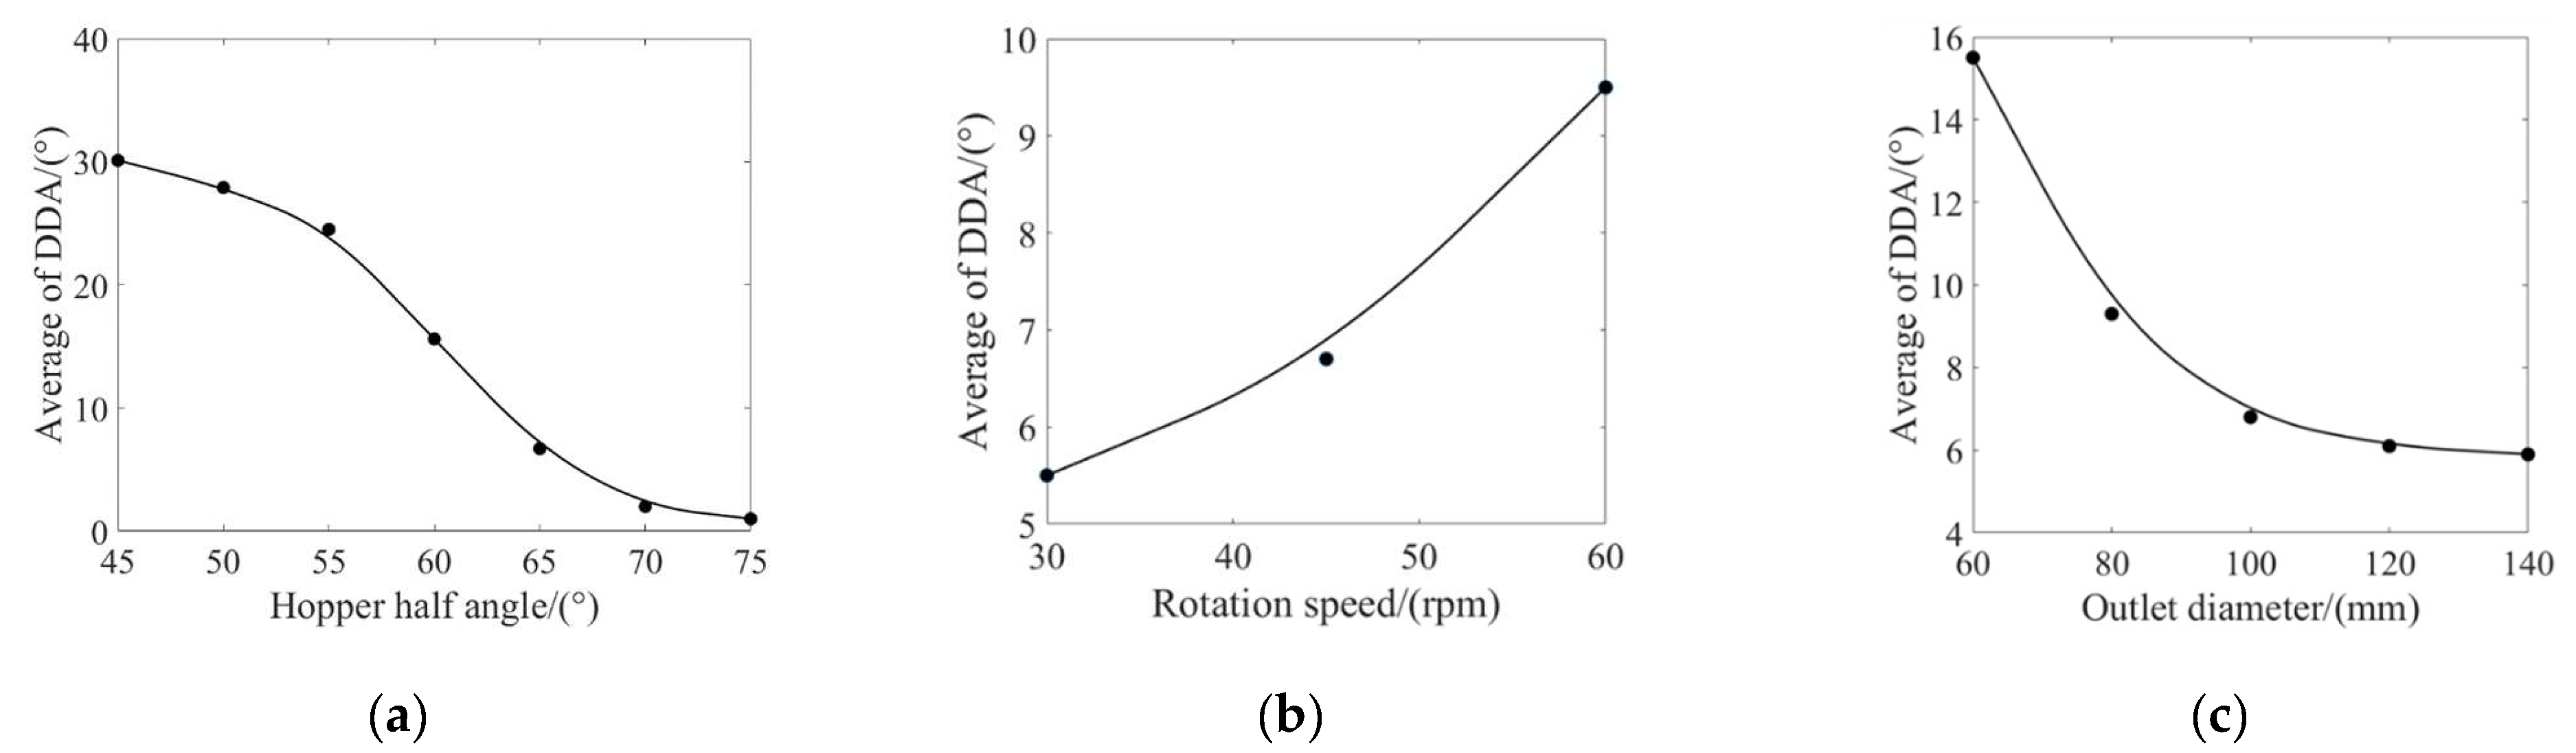
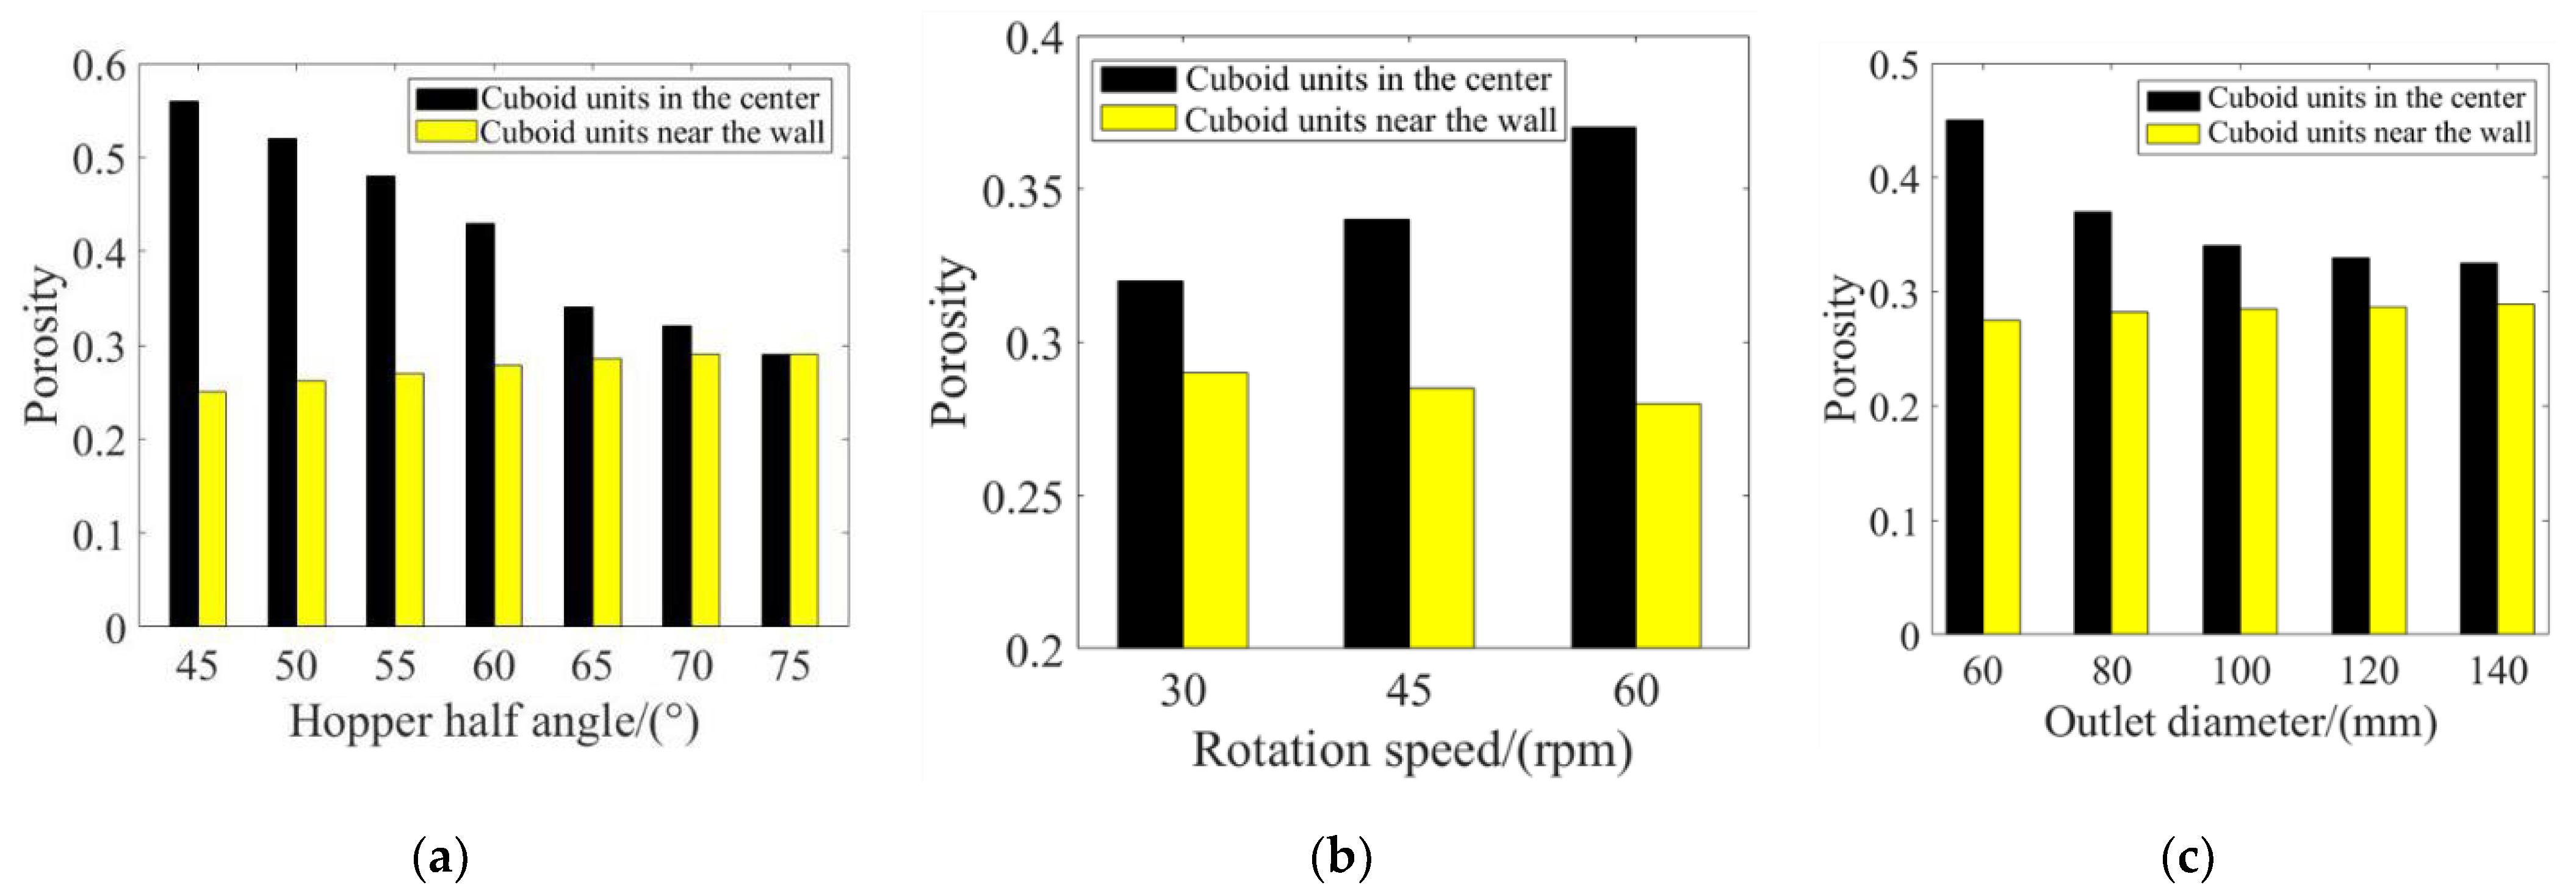
4.1.2. Evaluation of Flow Capacity

This section investigated the effect of the hopper half angle on flow capacity, MFI, DDA and porosity were adopted to explain the above discharging process.
Figure 9a shows the effect of the hopper half angle on the MFI and the calculation of the MFI according to Equation (4). Apparently, the value of MFI increases when the hopper half angle increases from 45° to 75° in a step of 5°. For the hoppers at 70° and 75°, the value of MFI is basically constant, approximately 0.7 and 0.85, respectively, which means little difference in the vertical velocity of pellets in the center and near the wall during the discharging process. For the hopper at 65°, the value of MFI is stable firstly at approximately 0.65 and then decreases and stabilizes at approximately 0.56, which may be because the top pellet layer begins to form a small inverted cone when the layer is near the boundary between the cylindrical part and conical part during the discharging process, resulting in an increase in the difference in vertical velocity in the hopper center and near the hopper wall. Especially when the hopper half angle is less than 60°, the value of MFI decreases from 0.39 to 0.18 during the discharging process. The average value of MFI < 0.24 is clearly identified by the data processing, which reflects the difference in vertical velocity. Evidently, the value of MFI has a significant downward trend when the hopper half angle decreases from 65° to 60°. This may be because the component force of pellet gravity downward along the hopper wall starts to obviously decrease in the conical part. Meanwhile, the friction between the pellets and the hopper wall keeps increasing, which results in a small velocity of pellets near the hopper wall and a faster passage of pellets in the center of the cylindrical part.
In Figure 10a, it is observed that the value of DDA (as Equation (5)) increases with the decrease in the hopper half angle. Additionally, the variation of DDA for hopper half angle between 55° and 65° is large, which has a value between 7° and 25°, while the variation of DDA for hopper half angle between 65° and 75° and 45° and 55° tends to be gentle, which has a value between 2° and 7° and 25° and 30°, respectively. The smaller the value of DDA, the smaller the difference in vertical velocity of pellets in the center and near the wall during the discharging process. In this work, the hopper half angle is 63° when the value of DDA is less than 10°.
Figure 11a shows that the porosity of cuboid units (see Equation (6)) in the center obviously increases and that near the wall decreases slightly with the decrease in the hopper half angle, which illustrates that the flow characteristics of pellets in the center have changed more significantly. When the hopper half angle is between 45° and 50°, the porosity among pellets in the center and near the wall is approximately 0.5 and 0.25, respectively, and the pellets in the center are in a loose state because of faster vertical velocity, resulting in a decrease in the contact friction force among the pellets in the center field. The movement of the pellets at the center of the cylindrical part is more intense, which explains the discharge phenomenon in Figure 8a. Additionally, the porosity among pellets in the center and near the wall is approximately 0.3 and 0.29, respectively. When the hopper half angle is between 70° and 75°, pellets in the center and near the wall for the cylindrical part fall almost simultaneously, which verifies the discharging process of the cylindrical part in Figure 8b. In other words, these investigations reveal that the decrease in the hopper half angle accelerates the appearance of the uneven flow. Especially, a rapid transition zone occurs at the hopper half angle from 55° to 65°, which is basically in agreement with the above analysis.

4.2. The Effect of Rotation Speed on Flow Capacity

In order to investigate the effect of rotation speed on the flow capacity of pellets in the hopper, the simulation results of test 5, test 8 and test 9 are analyzed. The rotation speed increases from 30 rpm to 60 rpm in step of 15 rpm when the hopper half angle is 65° and the outlet diameter is 100 mm, respectively.

4.2.1. Analysis of the Discharging Process

As shown in Figure 12a (the rotation speed is 30 rpm), at 12 s, pellets in layer A and layer B have been discharged from the hopper. Meanwhile, layer C in the conical part forms a large-inverted cone and layer D begins to form a small, inverted cone just when entering the conical part. While layer E and layer F keep falling as a whole. Then, from 12 s to 24 s, pellets in layer C have basically been discharged. Meanwhile, layer D has formed a large, inverted cone. While a small, inverted cone begins to appear when layer F is close to the boundary between the cylindrical part and the conical part, this is affected by the flow characteristics of pellets in the conical part. In other words, the pellets in the cylindrical part keep falling as a whole. The bottom pellet layer in the conical part is discharged from the hopper first, and the upper pellet layer is discharged subsequently. The inverted cone in the conical part is getting bigger and bigger as pellet layers lower, according to the principle of volume conservation of pellet layers.
Figure 12b shows the discharging process when the rotation speed is 60 rpm. From 0 s to 12 s, layers A and B have been discharged, and layer C in the conical part is flowing to the outlet of the hopper, and a large, inverted cone is formed in layer D. Furthermore, layer F just arises as a small, inverted cone when it is close to the boundary between the cylindrical part and the conical part. The discharging characteristics at this moment are approximately the same as those at 24 s in Figure 11a. From 12 s to 24 s, layer C has been discharged and layer D is being discharged; layer F begins to enter the conical part and the inverted cone is more obvious. Similarly, the reason for the inverted cone formation in the discharging process is basically consistent with the analysis in Figure 12a.
Combining Figure 12a,b, it can be seen that the discharging characteristics of “first in, first out” do not change with the increase in the rotation speed; only the speed of forming an inverted cone is accelerated, which means the discharging process is accelerated.

4.2.2. Evaluation of Flow Capacity

In order to investigate the effect of rotation speed on flow capacity, MFI, DDA and porosity as a function of rotation speed are illustrated in Figure 9b, Figure 10b and Figure 11b.
Figure 9b shows the effect of the rotation speed on the MFI. Apparently, the value of MFI decreases with an increase in the rotation speed. The value of MFI is stable initially at approximately 0.7 and then decreases and stabilizes at approximately 0.6 when the rotation speed is 30 rpm, which means there is little difference in the vertical velocity of pellets in the center and near the wall in the cylindrical. Furthermore, the value of the MFI decreases obviously during the rotation speed increase from 45 rpm to 60 rpm, which is between 0.38 and 0.55. Nevertheless, the average values of MFI are more than 0.3 when the rotation speed changes from 30 rpm to 60 rpm, the flow pattern of pellets is still confirmed by the mass flow. On the whole, the rotation speed has little effect on the flow patterns of pellets in the hopper, which is less than that of the hopper half angle.
Figure 10b shows that the average of DDA increases from 5.5° to 9.5° when the rotation speed increases from 30 rpm to 60 rpm, which indicates that the increase in the rotation speed does not cause a great change in DDA.
Figure 11b shows the porosity of cuboid units (as Equation (6)) as the center increases and that near the wall decreases with the increase in the rotation speed. The porosity in the center is 0.32 at 30 rpm and 0.38 at 60 rpm, and that near the wall is approximately 0.29 at 30 rpm and 0.28 at 60 rpm, which also indicates that the increase in the rotation speed does not cause a great change in porosity in the center or near the wall. Based on the above analysis, when the rotation speed is 30 rpm, pellets in the center and near the wall of the cylindrical part fall almost simultaneously, conforming to the discharging process of the cylindrical part in Figure 12a. Only when the rotation speed is 60 rpm, the difference in porosity in the center and near the wall is big, which illustrates that the vertical velocity of the pellets in the center is bigger, explaining the discharge phenomenon in Figure 12b. In other words, because the variation of porosity with the rotation speed is small, it is a revelation that the rotation speed has no significant effect on the flow characteristics of pellets.

4.3. The Effect of Outlet Diameter on Flow Capacity

In order to determine the effect of the outlet diameter of the hopper on the flow capacity of pellets, the simulation results of test 5, test 10 and test 13 are analyzed. The outlet diameter increases from 60 mm to 140 mm in a step of 20 mm when the hopper half angle is 65° and the rotation speed is 45 rpm.

4.3.1. Analysis of Discharging Process

As shown in Figure 13a (the outlet diameter is 100 mm), from 0 s to 12 s, layers A and B have been discharged, layer C in the conical part basically has reached the outlet of the hopper, layer D in the cylindrical part just enters the conical part and an inverted cone forms in layer D. While layers E and F in the cylindrical part have been downward as a whole. From 12 s to 24 s, the inverted cone formed by layer D is more obvious; furthermore, a small inverted cone begins to appear when layer F is near the boundary between the cylindrical part and the conical part. In conclusion, the pellet layers in the cylindrical part basically fall down as a whole, while the pellet layers in the conical part form the inverted cone and fall down layer by layer as a whole.
As shown in Figure 13b (the outlet diameter is 140 mm), from 0 s to 12 s, layer D in the cylindrical part has entered the conical part, and a large, inverted cone has formed. While layers E and F in the cylindrical part have been downward as a whole. From 12 s to 24 s, layer F in the cylindrical part enters the conical part completely and forms an inverted cone. Pellets in layer E are discharging. In general, the pellet layers in the cylindrical part fall overall during the discharging process; no inverted cone appears until pellets completely enter the conical part. The pellet layers in the conical part form the inverted cone, and the inverted cone increases with the shrinkage of the hopper wall, which can be explained by the principle of volume conservation of pellet layers, and pellets in the lower layer are discharged first from the hopper and pellets in the upper layer are subsequently discharged.
A comprehensive analysis of Figure 13a,b shows that the flow characteristics are “first in, first out”. Only the speed of forming an inverted cone and the discharging process are accelerated when the outlet diameter is increased.

4.3.2. Evaluation of Flow Capacity

In order to investigate the effect of outlet diameter on flow capacity, MFI, DDA and porosity as a function of outlet diameter are illustrated in Figure 9c, Figure 10c and Figure 11c.
The variation of MFI is plotted over the outlet diameter in Figure 9c according to Equation (4), which reveals that the increase in outlet diameter causes an increase in MFI. Furthermore, the value of MFI is basically stable at approximately 0.75 for the outlet diameter of 140 mm, which means a little difference in the vertical velocity of pellets in the center and near the wall during the discharging process. The value of MFI is basically stable at approximately 0.7 when the outlet diameter is 120 mm. The value of MFI is stable initially at approximately 0.6~0.65 and then decreases and stabilizes at approximately 0.5~0.56 when the outlet diameter is between 100 mm and 80 mm. In particular, the value of the MFI shows a sharp decrease when the outlet diameter changes from 80 mm to 60 mm, which is similar to the phenomenon of a linear decrease in the DDA when the outlet diameter increases from 60 mm to 80 mm in Figure 10c. This may be because the discharge rate decreases when the outlet diameter changes from 80 mm to 60 mm and the pellets in the hopper are in a state of compaction. Additionally, the value of MFI is less than 0.2 after 25 s when the outlet diameter is 60 mm, which illustrates the large difference in the vertical velocity of pellets in the center and near the wall. The flow pattern should be in transition between the mass flow and the funnel flow at this moment and the outlet diameter has a great influence on the flow pattern when the outlet diameter is less than 60 mm.
On the whole, when the outlet diameter is more than 60 mm, the values of MFI are more than 0.24, whatever the outlet diameter is. Flow patterns are almost unaffected and the flow pattern of pellets is still confirmed by the mass flow, which illustrates that the effect of the outlet diameter on flow patterns is less than that of the hopper half angle in the previous section. In conclusion, combined with the pretest results and the feed discharge requirements of swine, the outlet diameter should be 100–120 mm when the hopper is designed.
Figure 10c shows a slight variation in the value of DDA when the outlet diameter is from 100 mm to 140 mm, the value is approximately 6°, which means the vertical velocity of pellets in the center is basically the same as that of the pellets near the wall. However, the DDA is almost linearly increasing as the outlet diameter decreases from 100 mm to 60 mm, and the value of DDA is approximately 9° for an outlet diameter of 80 mm, but the value is approximately 16° for an outlet diameter of 60 mm, which means the vertical velocity of pellets in the center is obviously bigger than that of the pellets near the wall.
Figure 11c shows the porosity of cuboid units in the center increases and that near the wall decreases with the decrease in the outlet diameter, and the variation trend of porosity with the increase in the outlet diameter is nearly the same as shown in Figure 10c. The porosity among pellets in the center and near the wall is approximately 0.32 and 0.29, respectively, when the outlet diameter is between 120 mm and 140 mm, which indicates pellets in the center and near the wall for the cylindrical part fall almost simultaneously. Only the porosity among pellets in the center increases slightly when the outlet diameter is 100 mm. It can be observed that the movement of the pellets at the center of the cylindrical part is more intense compared to the outlet diameter of 140 mm. Concurrently, the analysis verifies the discharge phenomenon in Figure 13a,b. Additionally, the porosity among pellets in the center and near the wall is approximately 0.37 and 0.28, respectively. When the outlet diameter is 80 mm, which indicates the vertical velocity of pellets in the center increases slightly, the velocity difference between the center and hopper wall begins to get bigger. While the porosity among pellets in the center and near the wall is approximately 0.45 and 0.27, respectively, when the outlet diameter is 60 mm, it can be observed that the vertical velocity of the pellets at the center of the cylindrical part increases rapidly. In other words, these investigations reveal that the appearance of the uneven flow is accelerated when the outlet diameter is less than 60 mm, and the flow characteristics are almost unaffected when the outlet diameter is more than 60 mm.
In order to formulate an explicit decision criterion for flow patterns according to the MFI, referring to the relevant literature, Johanson and Jenike [52] insisted that a velocity ratio of MFI ~0.3 could be used as the boundary line between the funnel flow and mass flow in hoppers, which meant the funnel flow is defined under MFI < 0.3, reversely, if MFI > 0.3, the flow pattern is the mass flow. Based on the results of this study for the hopper with the unloading paddle, the evaluation method is also feasible, but if the boundary value of MFI is determined to be 0.24, then the flow pattern of pellets in the hopper can be confirmed to be the funnel flow when the value of MFI is less than 0.24, the mass flow is determined when the value of MFI is more than 0.24.
In conclusion, the above studies indicate that the flow pattern of pellets can be identified as the mass flow when the hopper half angle exceeds 60°. The characteristics of “first in, first out” in the mass flow could ensure the quality of feed. Otherwise, it is confirmed by the funnel flow. Therefore, according to the pre-test and the design requirements of the existing feeder structure, the hopper half angle should be in the range of 65°to 75° when the hopper is designed.

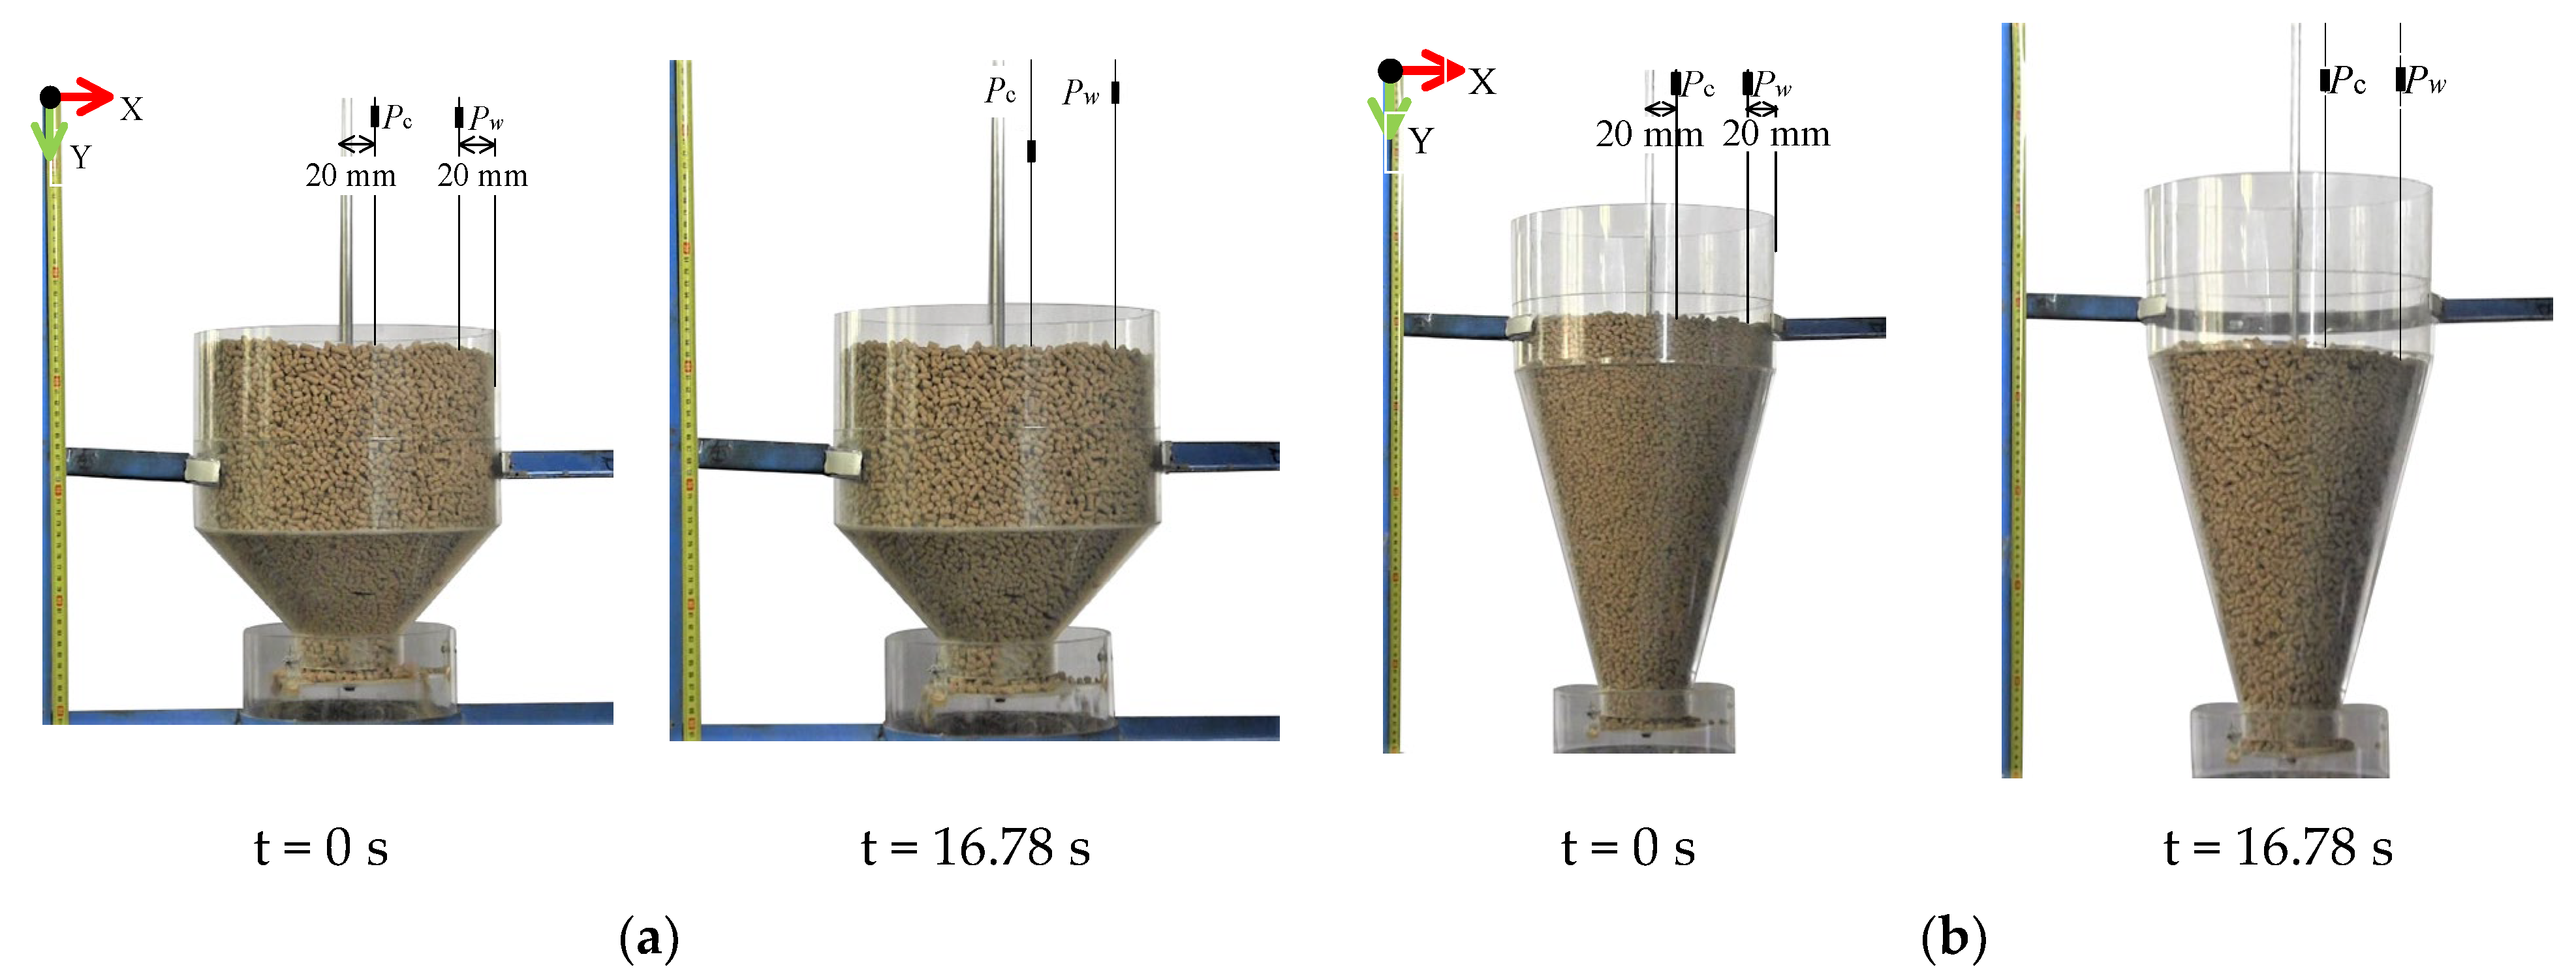
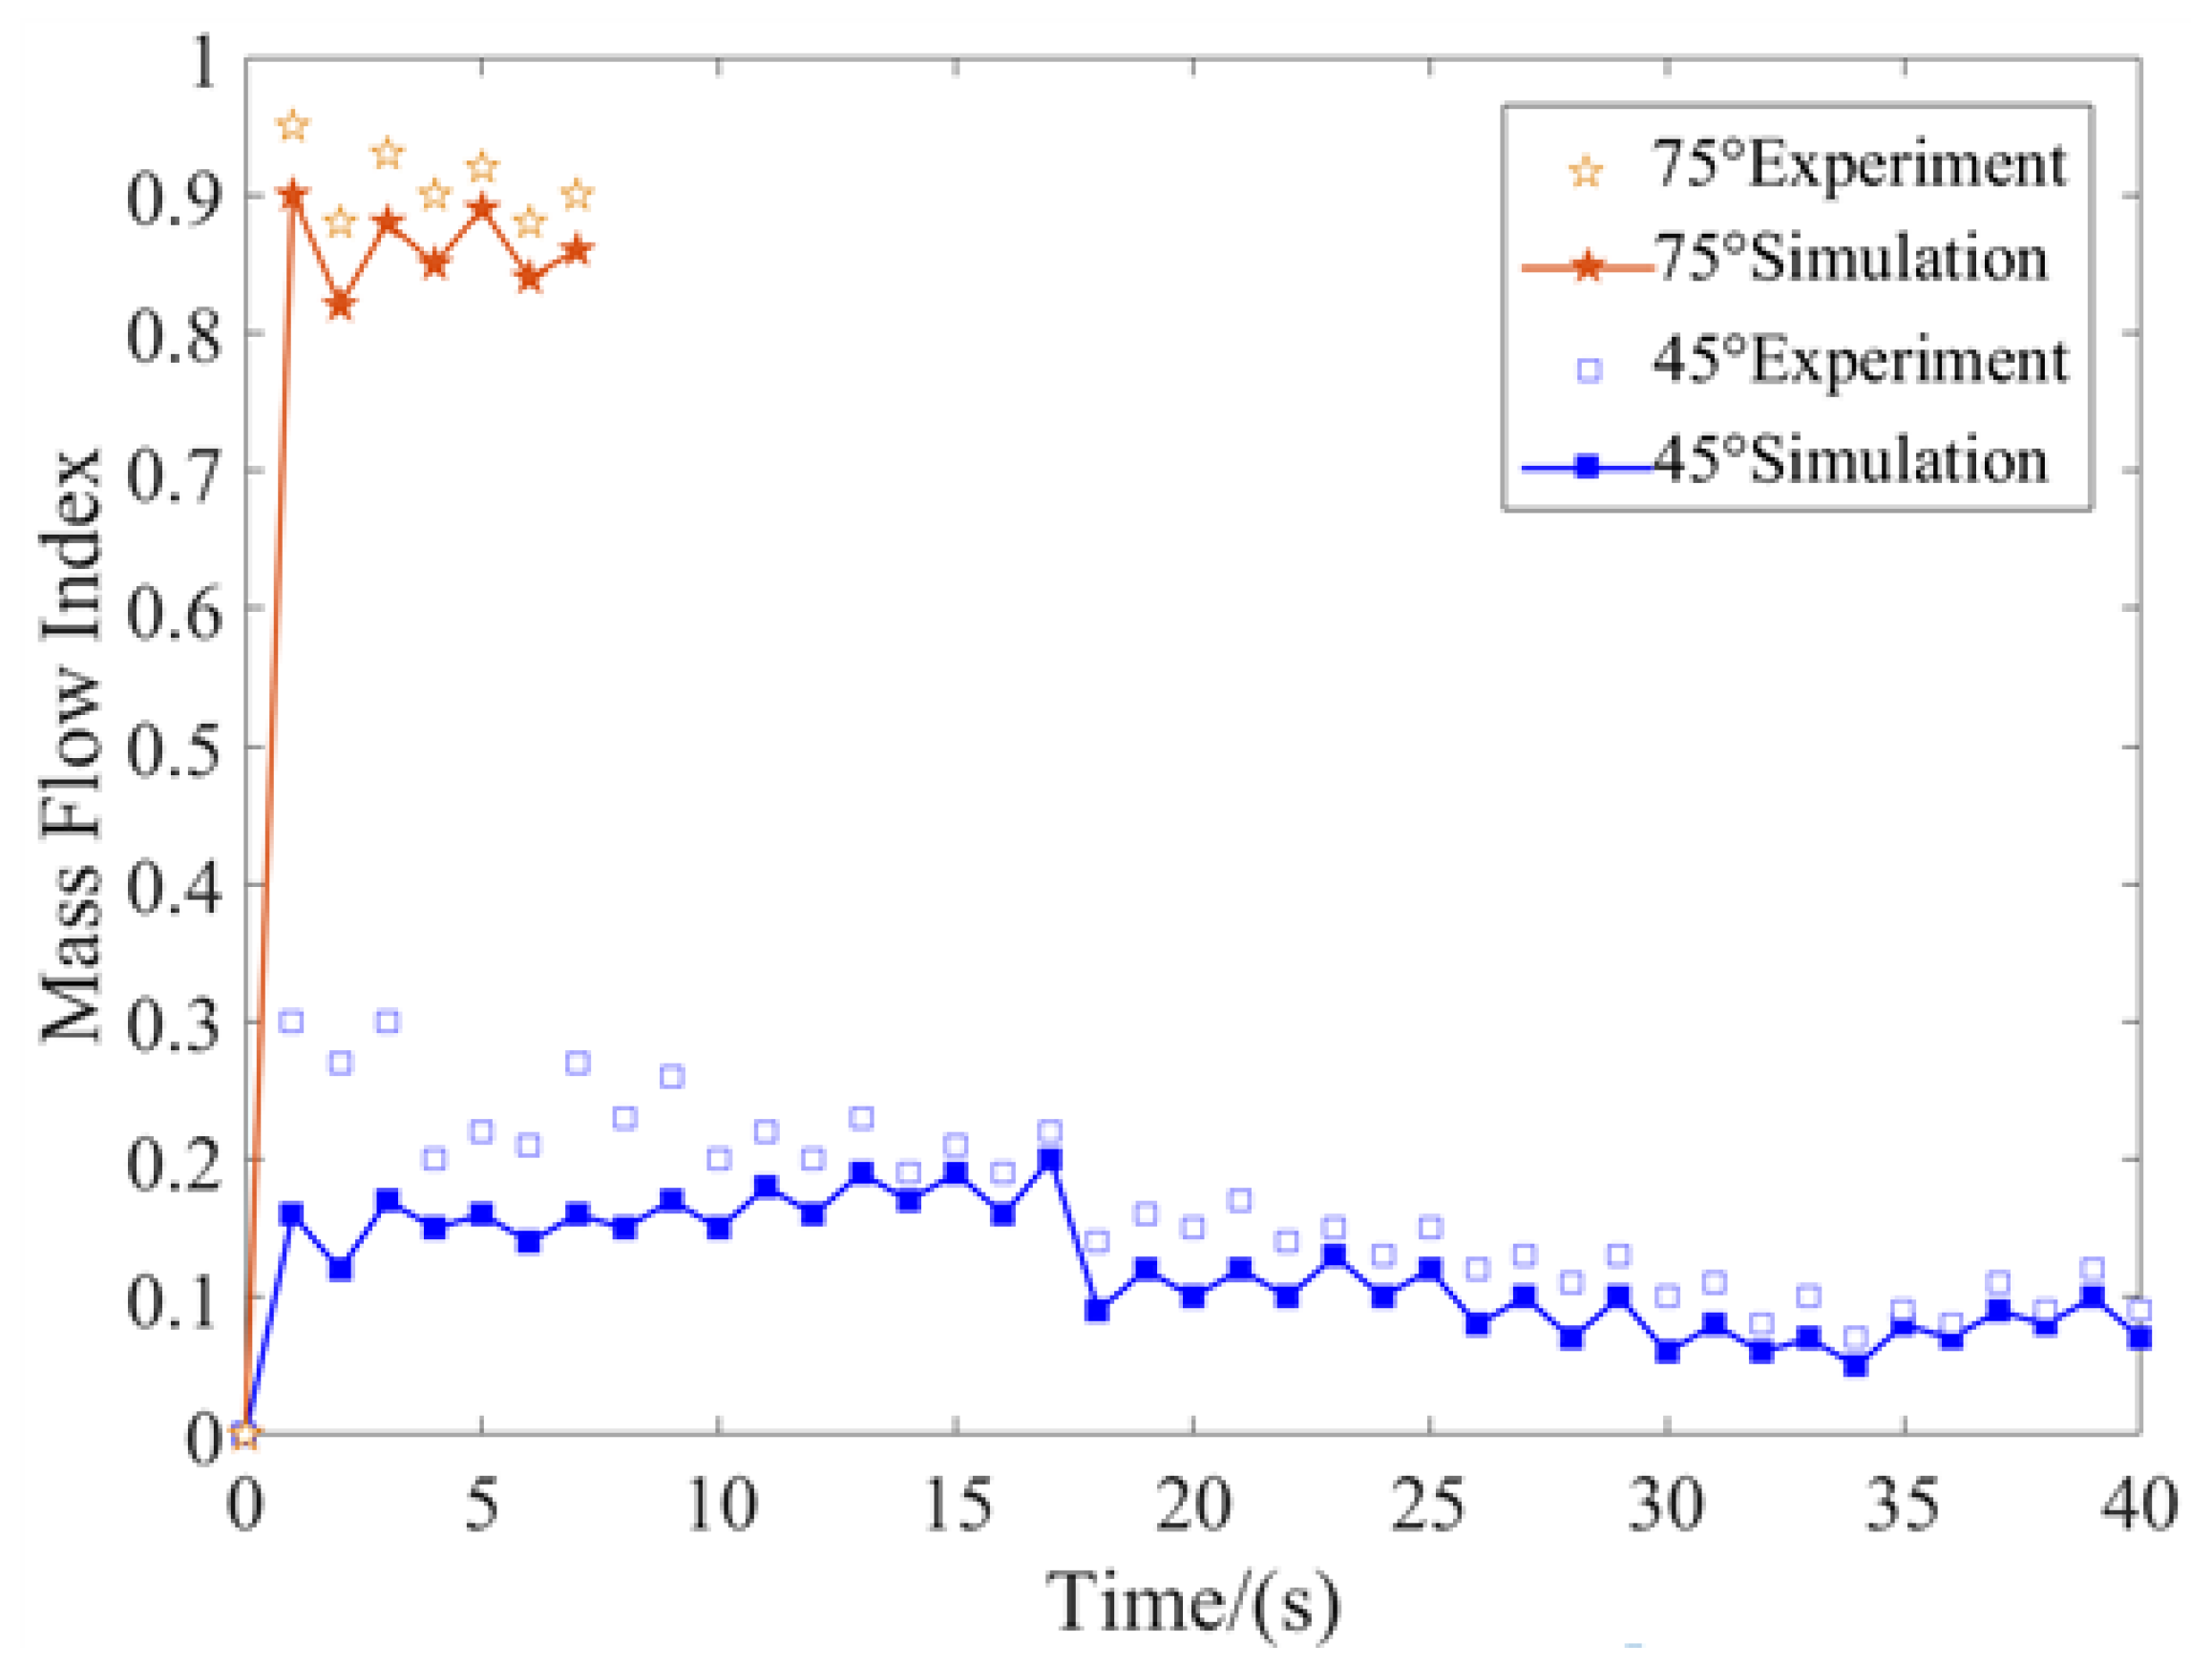
4.4. Experimental Validation

To clarify the DEM model, physical experiments were carried out with experimental equipment in the Laboratory of Animal Husbandry Mechanization at Northeast Agricultural University. To ensure that the experiment conditions were consistent with the simulation, the component materials of the experiment equipment were the same as those of the model components in the simulation process. The same structural and operating parameters are selected between the experiment and simulation test, noting that the hopper half angle is 45° and 75°, respectively, when the rotation speed and the outlet diameter are 45 rpm and 100 mm. In order to more clearly represent the problems found in the pre-test, the hopper is composed of clear plastic, and pellets are filled into the area by two parallel clear sheets to be observed visually. The clear sheet is 25 mm away from the hopper center to reduce the influence on the flow behavior of pellets in the hopper. The colored and original pellets crossed in the hopper at the initial time, which made it easy to visually reflect the flow and pattern of pellets.
Snapshots of different kinds of posture during the discharging process at a hopper half angle of 45° are shown in Figure 14. All layers of pellets in the center initially formed a small flow zone and a small DDA at 6 s; however, the positions of pellets near the wall hardly changed at this time. From 6 s to 12 s, little pellets on the top surface in the cylindrical part are poured into the flow zone first due to the pellet repose angle characteristics and the DDA increases, so the stagnant zone formed by pellets near the wall decreases slightly. Afterwards, a lot of pellets on the top surface in the cylindrical part are poured into the flow zone with the pellet layers down from 12 s to 21 s, the DDA increases constantly, and the stagnant zone decreases obviously. Finally, the last photo revealed that the pellet layers had entered the conical part at approximately 39 s. The top two pellet layers in the cylindrical part have entered the feeding trough completely, whereas the few pellets in the conical part still stay near the wall. The stagnant zone decreases obviously at this moment. The above phenomena were in line with Figure 8a in the simulation test. In a word, the average value of DDA in the cylindrical part is 29.6° during discharging, which conforms to the characteristics of “fast in the center, slow near the wall” in the funnel flow.
In order to investigate the flow pattern of pellets in the hopper, the pellet-tracking tests were conducted, and the experimental equipment is presented in Figure 15. Firstly, the red pellet is placed in the center and near the wall on the top surface, respectively, in the experiment. The position of the red pellet is obtained by the downward displacement of the black marker on the fishing line with a scale of 10 mm, and it is recorded by the high-speed camera (PCC 2.8 new version Phantom V9.1 camera, Vision Research Inc. Wayne, NJ, USA, shooting frequency is 1000 f/s).
Figure 16a shows the discharging process of the pellets in the hopper under the hopper half angle of 45°. The position of the black marker in the center is in a fast-straight descent line, while the black marker near the wall hardly moves from 0 s to 16.78 s. In contrast, Figure 16b shows the black marker in the center and near the wall, which basically dropped the same height in the same discharging time.
The function of MFI and discharging time is established by collecting the coordinates of the black marker to quantitatively analyze the accuracy of the simulation test, as shown in Figure 17. As expected, when the rotation speed and the outlet diameter are 45 rpm and 100 mm, the average value of MFI is 0.79 under the hopper half angle of 75°, however, the average value of MFI is 0.17 under the hopper half angle of 45°, which is in agreement with the results in the simulation test. Notwithstanding, the experimental results are slightly bigger than the simulation test results. The error could be explained in two aspects. Firstly, the size of the pellet model established by DEM 2.7 software is the average of 100 pellets, which is different from the distribution of pellets in the experiment. Secondly, it may come from a system error caused by the operator in the experiment.

5. Discussion

Combined with the discussion above, it is confirmed that the hopper half angle determines the flow pattern mainly, which proves Lu et al.’s [14] point. On the other hand, the work analyzes the effects of structural and motion parameters of the hopper with an unloading paddle on the flow capacity of pellets. The deficiencies in the flow capacity of pellets were investigated:
  • Environmental impact:
The pellets will be deliquesced by environmental factors during the feeding process, so that their own moisture content changes in real-time, the pellet group in the hopper is reunited, and the vertical velocity of the pellet in the center decreases more significantly than near the wall, resulting in the vertical velocity difference decreasing in the pellets in the center and near the wall. Finally, the error in measurement results is caused.
2.
Test bench construction error:
In order to track the velocity and trajectory change of pellets, a pellet was randomly selected in the center and near the wall and tied with a fishing line, while the other end of the fishing line was used to adjust the counterweight (straw). In the process of the downward movement of pellets, the quality of the two counterweights might be inconsistent and the sliding friction between the fishing line and the frame was caused. The difference in vertical velocity of pellets in the center and near the wall changes, resulting in an error in measurement results.
3.
Pellets are broken during discharge:
A small amount of broken pellets will be produced continuously in the fixed disk during the unloading paddle rotation. The friction among the pellets on the fixed disk causes the falling of the pellets in the straight part to lag, and the vertical velocity of the pellets in the flow zone of the hopper decreases by layer-by-layer upward conduction, resulting in a decrease in the vertical velocity difference of the pellets in the center and near the wall. Finally, the error in measurement results is caused.

6. Conclusions

In this work, DEM was applied to simulate the discharging of pellets in the hopper of the feeder with an unloading paddle. The impacts of the hopper half angle, rotation speed and outlet diameter on the flow capacity of pellets were investigated. The results in the experiment and simulation test were in good agreement, which verifies the confidence of the results. The detailed conclusions can provide important support for the design of the hopper with an unloading paddle.
  • The Mass Flow Index (MFI) can define the flow patterns of pellets in the hopper with an unloading paddle, and the MFI~0.24 is identified to distinguish the mass flow and the funnel flow by the DEM simulation tests.
  • The MFI decreases with an increase in the rotation speed from 30 rpm to 60 rpm, the outlet diameter from 60 mm to 140 mm and the hopper half angle from 45° to 75°. Additionally, the flow pattern is mainly determined by the hopper half angle; the rotation speed and the outlet diameter have little influence on the flow patterns of pellets in the hopper, but the outlet diameter has a greater influence on the flow pattern when the outlet diameter is less than 60 mm.
  • For the design of the hopper with an unloading paddle, the optimum parameters are as follows: the hopper half angle is between 65° and 75°, the outlet diameter is between 100 mm and 120 mm and the rotation speed is between 45 rpm and 60 rpm.

Author Contributions

Conceptualization, H.H. and Y.Z.; methodology, Z.L. and D.W.; software, H.H. and Z.F.; resources, H.T. and J.S.; data curation, H.H., D.W. and Y.Z.; writing—original draft preparation, H.H., Y.Z. and M.H. All authors have read and agreed to the published version of the manuscript.

Funding

This research was funded by the Henan Province Science and Technology Research Project (222102110351) and the Chinese Natural Science Foundation (51405076).

Institutional Review Board Statement

Not applicable.

Informed Consent Statement

Not applicable.

Data Availability Statement

The data used to support the findings of this study are available from the corresponding author upon request.

Acknowledgments

The authors would like to thank the Laboratory of Animal Husbandry Mechanization; also, the authors are grateful to Taif University (KSA) and Mansoura University (Mansoura, Egypt) for their support and gratefully appreciate the reviewers who provided helpful suggestions for this manuscript.

Conflicts of Interest

The authors declare no conflicts of interest.

References

  1. Vukmirovic, D.; Colovic, R.; Rakita, S.; Briek, T.; Duragic, O.; Sola-Oriol, D. Importance of feed structure (particle size) and feed form (mash vs. pellets) in pig nutrition—A review. Anim. Feed Sci. Technol. 2017, 233, 133–144. [Google Scholar] [CrossRef]
  2. Lv, M.; Yan, L.; Wang, Z.; An, S.; Wu, M.; Lv, Z. Effects of feed form and feed particle size on growth performance, carcass characteristics and digestive tract development of broilers. Anim. Nutr. 2015, 1, 252–256. [Google Scholar] [CrossRef] [PubMed]
  3. Pampuro, N.; Busato, P.; Cavallo, E. Gaseous Emissions after Soil Application of Pellet Made from Composted Pig Slurry Solid Fraction: Effect of Application Method and Pellet Diameter. Agriculture 2018, 8, 119. [Google Scholar] [CrossRef]
  4. Pampuro, N.; Bisaglia, C.; Romano, E.; Brambilla, M.; Pedretti, E.F.; Cavallo, E. Phytotoxicity and Chemical Characterization of Compost Derived from Pig Slurry Solid Fraction for Organic Pellet Production. Agriculture 2017, 7, 94. [Google Scholar] [CrossRef]
  5. Bao, Z.; Li, Y.; Zhang, J.; Li, L.; Zhang, P.; Huang, F.R. Effect of particle size of wheat on nutrient digestibility, growth performance, and gut microbiota in growing pigs. Livest. Sci. 2016, 183, 33–39. [Google Scholar] [CrossRef]
  6. Tao, H.; Jin, B.; Zhong, W.; Wang, X.; Ren, B.; Zhang, Y.; Xiao, R. Discrete element method modeling of non-spherical granular flow in rectangular hopper. Chem. Eng. Process. Process Intensif. 2010, 49, 51–158. [Google Scholar] [CrossRef]
  7. Nguyen, V.D.; Cogne, C.; Guessasma, M.; Bellenger, E.; Fortin, J. Discrete modeling of granular flow with thermal transfer: Application to the discharge of silos. Appl. Thermal Eng. 2009, 29, 1846–1853. [Google Scholar] [CrossRef]
  8. Zhao, Y.; Yang, S.L.; Zhang, L.Q.; Chew, J.W. Understanding the varying discharge rates of lognormal particle size distributions from a hopper using the Discrete Element Method. Powder Technol. 2019, 342, 356–370. [Google Scholar] [CrossRef]
  9. Xiao, H.Y.; Fan, Y.; Jacob, K.V.; Umbanhowar, P.B.; Kodam, M.; Koch, J.F.; Lueptow, R.M. Continuum modeling of granular segregation during hopper discharge. Chem. Eng. Sci. 2019, 193, 188–204. [Google Scholar] [CrossRef]
  10. Engisch, W.E.; Muzzio, F.J. Method for characterization of loss-in-weigh feeder equipment. Powder Technol. 2012, 228, 395–403. [Google Scholar] [CrossRef]
  11. Engisch, W.E.; Muzzio, F.J. Feedrate deviations caused by hopper refill of loss-in-weigh feeders. Powder Technol. 2015, 283, 389–400. [Google Scholar] [CrossRef]
  12. Carcel, C.R.; Starr, A.; Nsugbe, E. Estimation of powder mass flow rate in a screw feeder using acoustic emissions. Powder Technol. 2018, 336, 122–130. [Google Scholar] [CrossRef]
  13. Chen, S.; Baumes, L.A.; Gel, A.; Adepu, M.; Emady, H.; Jiao, Y. Classification of particle height in a hopper bin from limited discharge data using convolutional neural network models. Powder Technol. 2018, 339, 615–624. [Google Scholar] [CrossRef]
  14. Lu, H.F.; Guo, X.L.; Jin, Y.; Gong, X.; Zhao, W.; Barletta, D.; Poletto, M. Powder discharge from a hopper-standpipe system modelled with CPFD. Adv. Powder Technol. 2017, 28, 481–490. [Google Scholar] [CrossRef]
  15. Mahajan, N.P.; Deshpande, S.B.; Kadwane, S.G. Design and implementation of advanced controller in plant distributed control system for improving control of non-linear belt weigh feeder. J. Proc. Control. 2018, 62, 55–65. [Google Scholar] [CrossRef]
  16. Chandravanshi, M.L.; Mukhopadhyay, A.K. Dynamic analysis of vibratory feeder and their effect on feed particle speed on conveying surface. Measurement 2017, 101, 145–156. [Google Scholar] [CrossRef]
  17. Zhang, Y.X.; Jia, F.G.; Zeng, Y.; Han, Y.L.; Xiao, Y.W. DEM study in the critical height of flow mechanism transition in a conical silo. Powder Technol. 2018, 331, 98–106. [Google Scholar] [CrossRef]
  18. Fernandez, J.W.; Cleary, P.W.; Mcbride, W. Effect of screw design on hopper drawdown of spherical particles in a horizontal screw feeder. Chem. Eng. Sci. 2011, 66, 5585–5601. [Google Scholar] [CrossRef]
  19. Wang, Y.F.; Li, T.Y.; Muzzio, F.J.; Glasser, B.J. Predicting feeder performance based on material flow properties. Powder Technol. 2017, 308, 135–148. [Google Scholar] [CrossRef]
  20. Mellmann, J.; Hoffmann, T.; Fürll, C. Mass flow during unloading of agricultural bulk materials from silos depending on particle form, flow properties and geometry of the discharge opening. Powder Technol. 2014, 253, 46–52. [Google Scholar] [CrossRef]
  21. Weinhart, T.; Labra, C.; Luding, S.; Ooi, J.Y. Influence of coarse-graining parameters on the analysis of DEM simulations of silo flow. Powder Technol. 2016, 293, 138–148. [Google Scholar] [CrossRef]
  22. Emden, H.K.; Kacianauskas, R. Discrete element analysis of experiments on mixing and bulk transport of wood pellets on a forward acting grate in discontinuous operation. Chem. Eng. Sci. 2013, 92, 105–117. [Google Scholar] [CrossRef]
  23. Moysey, P.A.; Baird, M.H.I. Size segregation of spherical nickel pellets in the surface flow of a packed bed: Experiments and Discrete Element Method simulations. Powder Technol. 2009, 196, 298–308. [Google Scholar] [CrossRef]
  24. Yuan, H.; Cai, Y.; Liang, S.F.; Ku, J.S.; Qin, Y. Numerical Simulation and Analysis of Feeding Uniformity of Viscous Miscellaneous Fish Bait Based on EDEM Software. Agriculture 2023, 13, 356. [Google Scholar] [CrossRef]
  25. Ma, C.H.; Chen, L.; Yang, K.; Yang, J.; Tu, Y.; Cheng, L. Intelligent calibration method for microscopic parameters of soil–rock mixtures based on measured landslide accumulation morphology. Comput. Methods Appl. Mech. Eng. 2024, 422, 116835. [Google Scholar] [CrossRef]
  26. Hou, Q.F.; Dong, K.J.; Yu, A.B. DEM study of the flow of cohesive particles in a screw feeder. Powder Technol. 2014, 256, 529–539. [Google Scholar] [CrossRef]
  27. Tao, H.; Zhong, W.Q.; Jin, B.S. Comparison of construction method for DEM simulation of ellipsoidal particles. Chin. J. Chem. Eng. 2013, 21, 800–807. [Google Scholar] [CrossRef]
  28. Saeed, M.K.; Siraj, M.S. Mixing study of non-spherical particles using DEM. Powder Technol. 2019, 344, 617–627. [Google Scholar] [CrossRef]
  29. Jiang, Y.J.; Fan, X.Y.; Li, T.H.; Xiao, S.Y. Influence of particle-size segregation on the impact of dry granular flow. Powder Technol. 2018, 340, 39–51. [Google Scholar] [CrossRef]
  30. Han, Y.L.; Jia, F.G.; Meng, X.Y.; Cao, B.; Zeng, Y.; Xiao, Y.W. Numerical analysis of similarities of particle flow behavior in stirred chambers. Powder Technol. 2019, 344, 286–301. [Google Scholar] [CrossRef]
  31. Zeng, Y.; Jia, F.G.; Meng, X.Y.; Han, Y.L.; Xiao, Y.W. The effects of friction characteristic of particle on milling process in a horizontal rice mill. Adv. Powder Technol. 2018, 29, 1280–1291. [Google Scholar] [CrossRef]
  32. Zhou, Z.Y.; Zhu, H.P.; Yu, A.B.; Wright, B.; Zulli, P. Discrete particle simulation of gas-solid flow in a blast furnace. Comput. Chem. Eng. 2008, 32, 1760–1772. [Google Scholar] [CrossRef]
  33. Yang, W.J.; Zhou, Z.Y.; Yu, A.B. Discrete particle simulation of solid flow in a three-dimensional blast furnace sector model. Chem. Eng. J. 2015, 278, 339–352. [Google Scholar] [CrossRef]
  34. Zhang, T.F.; Gan, J.Q.; Pinson, D.; Zhou, Z.Y. Size-induced segregation of granular materials during filling a conical hopper. Powder Technol. 2018, 340, 331–343. [Google Scholar] [CrossRef]
  35. Toson, P.; Khinast, J.G. Impulse-based dynamics for studying quasi-static granular flows: Application to hopper emptying of non-spherical particles. Powder Technol. 2017, 313, 353–360. [Google Scholar] [CrossRef]
  36. Scherer, V.; Wirtz, S.; Krause, B.; Wissing, F. Simulation of reacting moving granular material in furnaces and boilers an overview on the capabilities of the discrete element method. Energy Procedia 2017, 120, 41–61. [Google Scholar] [CrossRef]
  37. You, Y.; Zhao, Y.Z. Discrete element modelling of ellipsoidal particles using super-ellipsoids and multi-spheres: A comparative study. Powder Technol. 2018, 331, 179–191. [Google Scholar] [CrossRef]
  38. Zhong, W.Q.; Yu, A.B.; Liu, X.J.; Tong, Z.B.; Zhang, H. DEM/CFD-DEM Modelling of non-spherical particulate systems: Theoretical developments and applications. Powder Technol. 2016, 302, 108–152. [Google Scholar] [CrossRef]
  39. Cabiscol, R.; Finke, J.H.; Kwade, A. Calibration and interpretation of DEM parameters for simulations of cylindrical tablets with multi-sphere approach. Powder Technol. 2018, 327, 232–245. [Google Scholar] [CrossRef]
  40. Qian, Q.; An, X.Z.; Zhao, H.Y.; Dong, K.J.; Yang, X.H. Numerical investigations on random close packings of cylindrical particles with different aspect ratios. Powder Technol. 2019, 343, 79–86. [Google Scholar] [CrossRef]
  41. Coetzee, C.J. Review: Calibration of the discrete element method. Powder Technol. 2017, 310, 104–142. [Google Scholar] [CrossRef]
  42. Huang, H.N.; Wang, D.F.; Li, B.Q.; Zhang, J.F.; Li, J.Q. Design and Experiment of Discharging Performance of Feeder for Nursery. Trans. Chin. Soc. Agric. Mach. 2018, 49, 161–169. [Google Scholar]
  43. Kumar, R.; Patel, C.M.; Jana, A.K.; Gopireddy, S.S. Prediction of hopper discharge rate using combined discrete element method and artificial neural network. Adv. Powder Technol. 2018, 29, 2822–2834. [Google Scholar] [CrossRef]
  44. Faqih, A.N.; Alexander, A.W.; Muzzio, F.J.; Tomassone, M.S. A method for predicting hopper flow characteristics of pharmaceutic powders. Chem. Eng. Sci. 2007, 62, 1536–1542. [Google Scholar] [CrossRef]
  45. Höhner, D.; Wirtz, S.; Scherer, V. A numerical study on the influence of particle shape on hopper discharge within the polyhedral and multi-sphere discrete element method. Powder Technol. 2012, 226, 16–28. [Google Scholar] [CrossRef]
  46. Beverloo, W.A.; Leniger, H.A.; Velde, J.V.D. The flow of granular solids through orifices. Chem. Eng. Sci. 1961, 15, 260–269. [Google Scholar] [CrossRef]
  47. Zheng, Q.J.; Xia, B.S.; Pan, R.H.; Yu, A.B. Prediction of mass discharge rate in conical hoppers using elastoplastic model. Powder Technol. 2017, 307, 63–72. [Google Scholar] [CrossRef]
  48. Xu, K.M.; Wang, J.; Wei, Z.B.; Deng, F.F.; Wang, Y.W.; Cheng, S.M. An optimization of the MOS electronic nose sensor array for the detection of Chinese pecan quality. J. Food Eng. 2017, 203, 25–31. [Google Scholar] [CrossRef]
  49. Song, J.; Yang, H.; Li, R.; Chen, Q.; Zhang, Y.J.; Wang, Y.J.; Kong, P. Improved PTV measurement based on Voronoi matching used in hopper flow. Powder Technol. 2019, 355, 172–182. [Google Scholar] [CrossRef]
  50. Drescher, A.; Ferjani, M. Revised model for plug/funnel flow in bins. Powder Technol. 2004, 141, 44–54. [Google Scholar] [CrossRef]
  51. Fullard, L.A.; Davies, C.E.; Wake, G.C. Modelling powder mixing in mass flow discharge: A kinematic approach. Adv. Powder Technol. 2013, 24, 499–506. [Google Scholar] [CrossRef]
  52. Johanson, J.R. Stress and velocity fields in the gravity flow of bulk solids. J. Appl. Mech. 1964, 31, 499–506. [Google Scholar] [CrossRef]
Figure 1. Research procedures.
Agriculture 14 00523 g001
Figure 2. Model of a pellet in DEM simulation: (a) 2D model of a pellet and (b) 3D model of a pellet.
Agriculture 14 00523 g002
Figure 3. The schematic diagram of the feeder used in DEM simulation.
Agriculture 14 00523 g003
Figure 4. The motion analysis of the pellets on the unloading unit. Noting that A, B, and C represent three pellets randomly selected near the front wall of the unloading paddle and corresponding to Figure 6.
Agriculture 14 00523 g004
Figure 5. Qualitative comparison between simulation (left) and experiment (right) (n = 45 rpm, D2 = 100 mm). (a) The simulation test in the straight part; (b) the discharging experiment in the straight part.
Agriculture 14 00523 g005
Figure 7. The movement trajectory of pellets in the hopper during the discharging process (β = 75°, n = 45 rpm and D2 = 100 mm).
Agriculture 14 00523 g007
Figure 8. Different snapshots of the discharging process. (a) When the hopper half angle is 45°, the rotation speed is 45 rpm and the outlet diameter is 100 mm; (b) when the hopper half angle is 75°, the rotation speed is 45 rpm and the outlet diameter is 100 mm.
Agriculture 14 00523 g008aAgriculture 14 00523 g008b
Figure 9. Effect of the main parameters on the MFI. (a) The hopper half angle (n = 45 rpm and D2 = 100 mm); (b) the rotation speed (D2 = 100 mm and β = 65°); (c) the outlet diameter (n = 45 rpm and β = 65°).
Agriculture 14 00523 g009
Figure 10. Effect of main parameters on the DDA. (a) The hopper half angle; (b) The rotation speed; (c) The outlet diameter.
Agriculture 14 00523 g010
Figure 11. Effect of main parameters on porosity. (a) The hopper half angle; (b) the rotation speed; (c) the outlet diameter.
Agriculture 14 00523 g011
Figure 12. Comparison of flow characteristics for different rotation speeds. (a) When the rotation speed is 30 rpm, the hopper half angle is 65° and the outlet diameter is 100 mm; (b) when the rotation speed is 60 rpm, the hopper half angle is 65° and the outlet diameter is 100 mm.
Agriculture 14 00523 g012
Figure 13. Comparison of flow characteristics for different outlet diameters of the hopper. (a) When the outlet diameter is 100 mm, the rotation speed is 45 rpm and the hopper half angle is 65°; (b) when the outlet diameter is 140 mm, the rotation speed is 45 rpm and the hopper half angle is 65°.
Agriculture 14 00523 g013
Figure 14. Snapshots for flow patterns of pellets at different times in the hopper (β = 45°, n = 45 rpm and D2 = 100 mm).
Agriculture 14 00523 g014
Figure 15. The experimental equipment.
Agriculture 14 00523 g015
Figure 16. High-speed photograph diagrams of different pellet positions on the front faces. (a) When the hopper half angle is 45°, the rotation speed is 45 rpm and the outlet diameter is 100 mm; (b) when the hopper half angle is 75°, the rotation speed is 45 rpm and the outlet diameter is 100 mm.
Agriculture 14 00523 g016
Figure 17. MFI of pellets discharged from the hopper.
Agriculture 14 00523 g017
Table 1. Components of forces and torque acting on pellet i.
Forces and TorquesSymbolsEquations
Normal elastic force/N F n k 4 / 3 E R δ n 3 / 2 n
Normal damping force/N F n c c n 8 m i j E R δ n 1 / 2 ν n , i j
Tangential elastic force/N F t k μ s F n k 1 1 δ t / δ t , max 3 / 2 δ t , δ t < δ t , max
Tangential damping force/N F t c c t 6 μ s m i j F n k 1 ν t / δ t , max / δ t , max 1 / 2 ν t , i j , δ t < δ t , max
Torque by tangential forces/N M t R i j × F n k + F t c
Rolling friction torque/N·m M f μ r , i j F n , i j ω t , i j n
Coulomb friction force/N f t μ s F n k δ t , δ t δ t , max
where 1 R = 1 R i + 1 R j , E = E 2 1 ν 2 , ω t , i j = ω t , i j ω t , i j , δ t = δ t δ t , δ t , max = μ s 2 ν 2 1 ν , ν i j = ν j ν i + ω j × R j ω i × R i , ν n , i j = ν i j × n × n , ν t , i j = ν i j × n × n . Note that tangential forces F t k + F t c should be replaced by f t when δ t δ t , max .
Table 2. Parameter setting of cylindrical pellet modeling.
Spherical Unit NumberX/mmY/mmZ/mm
10.000945−0.0003210.001012
21.36691−0.000980.733574
3−1.365020.000337−0.73155
4−0.731617−0.0001141.36697
50.733507−0.000529−1.36495
60.450455−0.0006411.49029
71.49022−0.000936−0.448498
8−1.488330.0002930.450522
9−0.448565−2 × 10⁻⁶−1.48826
X, Y and Z in the Table 2 represent the spatial coordinate values of the unit sphere in the EDEM 2.7 software.
Table 3. Global variable parameters and their values in simulations.
TypeParametersValues
Pellet feedDensity, ρf (kg·m−3)1538
Poisson ratio, νf0.26
Shear modulus, Gf (Pa)7.1 × 10⁷
hopperHopper half angle, β (°)45–75
Outlet diameter, D2 (mm)60–140
Hopper diameter, D1 (mm)290
Density, ρh (kg·m−3)2000
Poisson ratio, νh0.3
Shear modulus, Gh (Pa)1.1 × 10⁹
Rotating shaftDensity, ρR (kg·m−3)7800
Poisson ratio, νR0.3
Shear modulus, GR (Pa)7 × 10¹⁰
feeding troughDensity, ρt (kg·m−3)1340
Poisson ratio, νt0.32
Shear modulus, Gt (Pa)1.2 × 10⁹
Feed-feedRestitution coefficient, eff0.65
Coefficient of static friction, μs,ff0.4
Coefficient of rolling friction, μr,ff0.01
Feed-hopperRestitution coefficient, efh0.48
Coefficient of static friction, μs,ff0.4
Coefficient of rolling friction, μr,fh0.01
Feed-rotating shaftRestitution coefficient, efr0.62
Coefficient of static friction, μs,fr0.27
Coefficient of rolling friction, μr,fr0.01
Feed-feeding troughRestitution coefficient, eft0.5
Coefficient of static friction, μs,ft0.38
Coefficient of rolling friction, μr,ft0.01
SimulationTime step, ∆t (s)2.5 × 10⁻⁵
Pellet feed in Table 3 refers to the columnar pellet feed (processed by the pelleting machine) for nursery.
Table 4. List of simulation cases.
TestHopper Half Angle β (°)Rotation Speed n (rpm)Outlet Diameter D2 (mm)MFI (/)
145451000.10
250451000.13
355451000.18
460451000.24
565451000.60
670451000.67
775451000.75
865301000.64
965601000.45
106545600.30
116545800.54
1265451200.64
1365451400.68
Disclaimer/Publisher’s Note: The statements, opinions and data contained in all publications are solely those of the individual author(s) and contributor(s) and not of MDPI and/or the editor(s). MDPI and/or the editor(s) disclaim responsibility for any injury to people or property resulting from any ideas, methods, instructions or products referred to in the content.

