
Investigation into the Performance Characteristics of the Organic Dry Farming Transition and the Corresponding Impact on Carbon Emissions Reduction

Abstract
:1. Introduction
2. Materials and Methods
2.1. Theoretical Analysis
- (1)
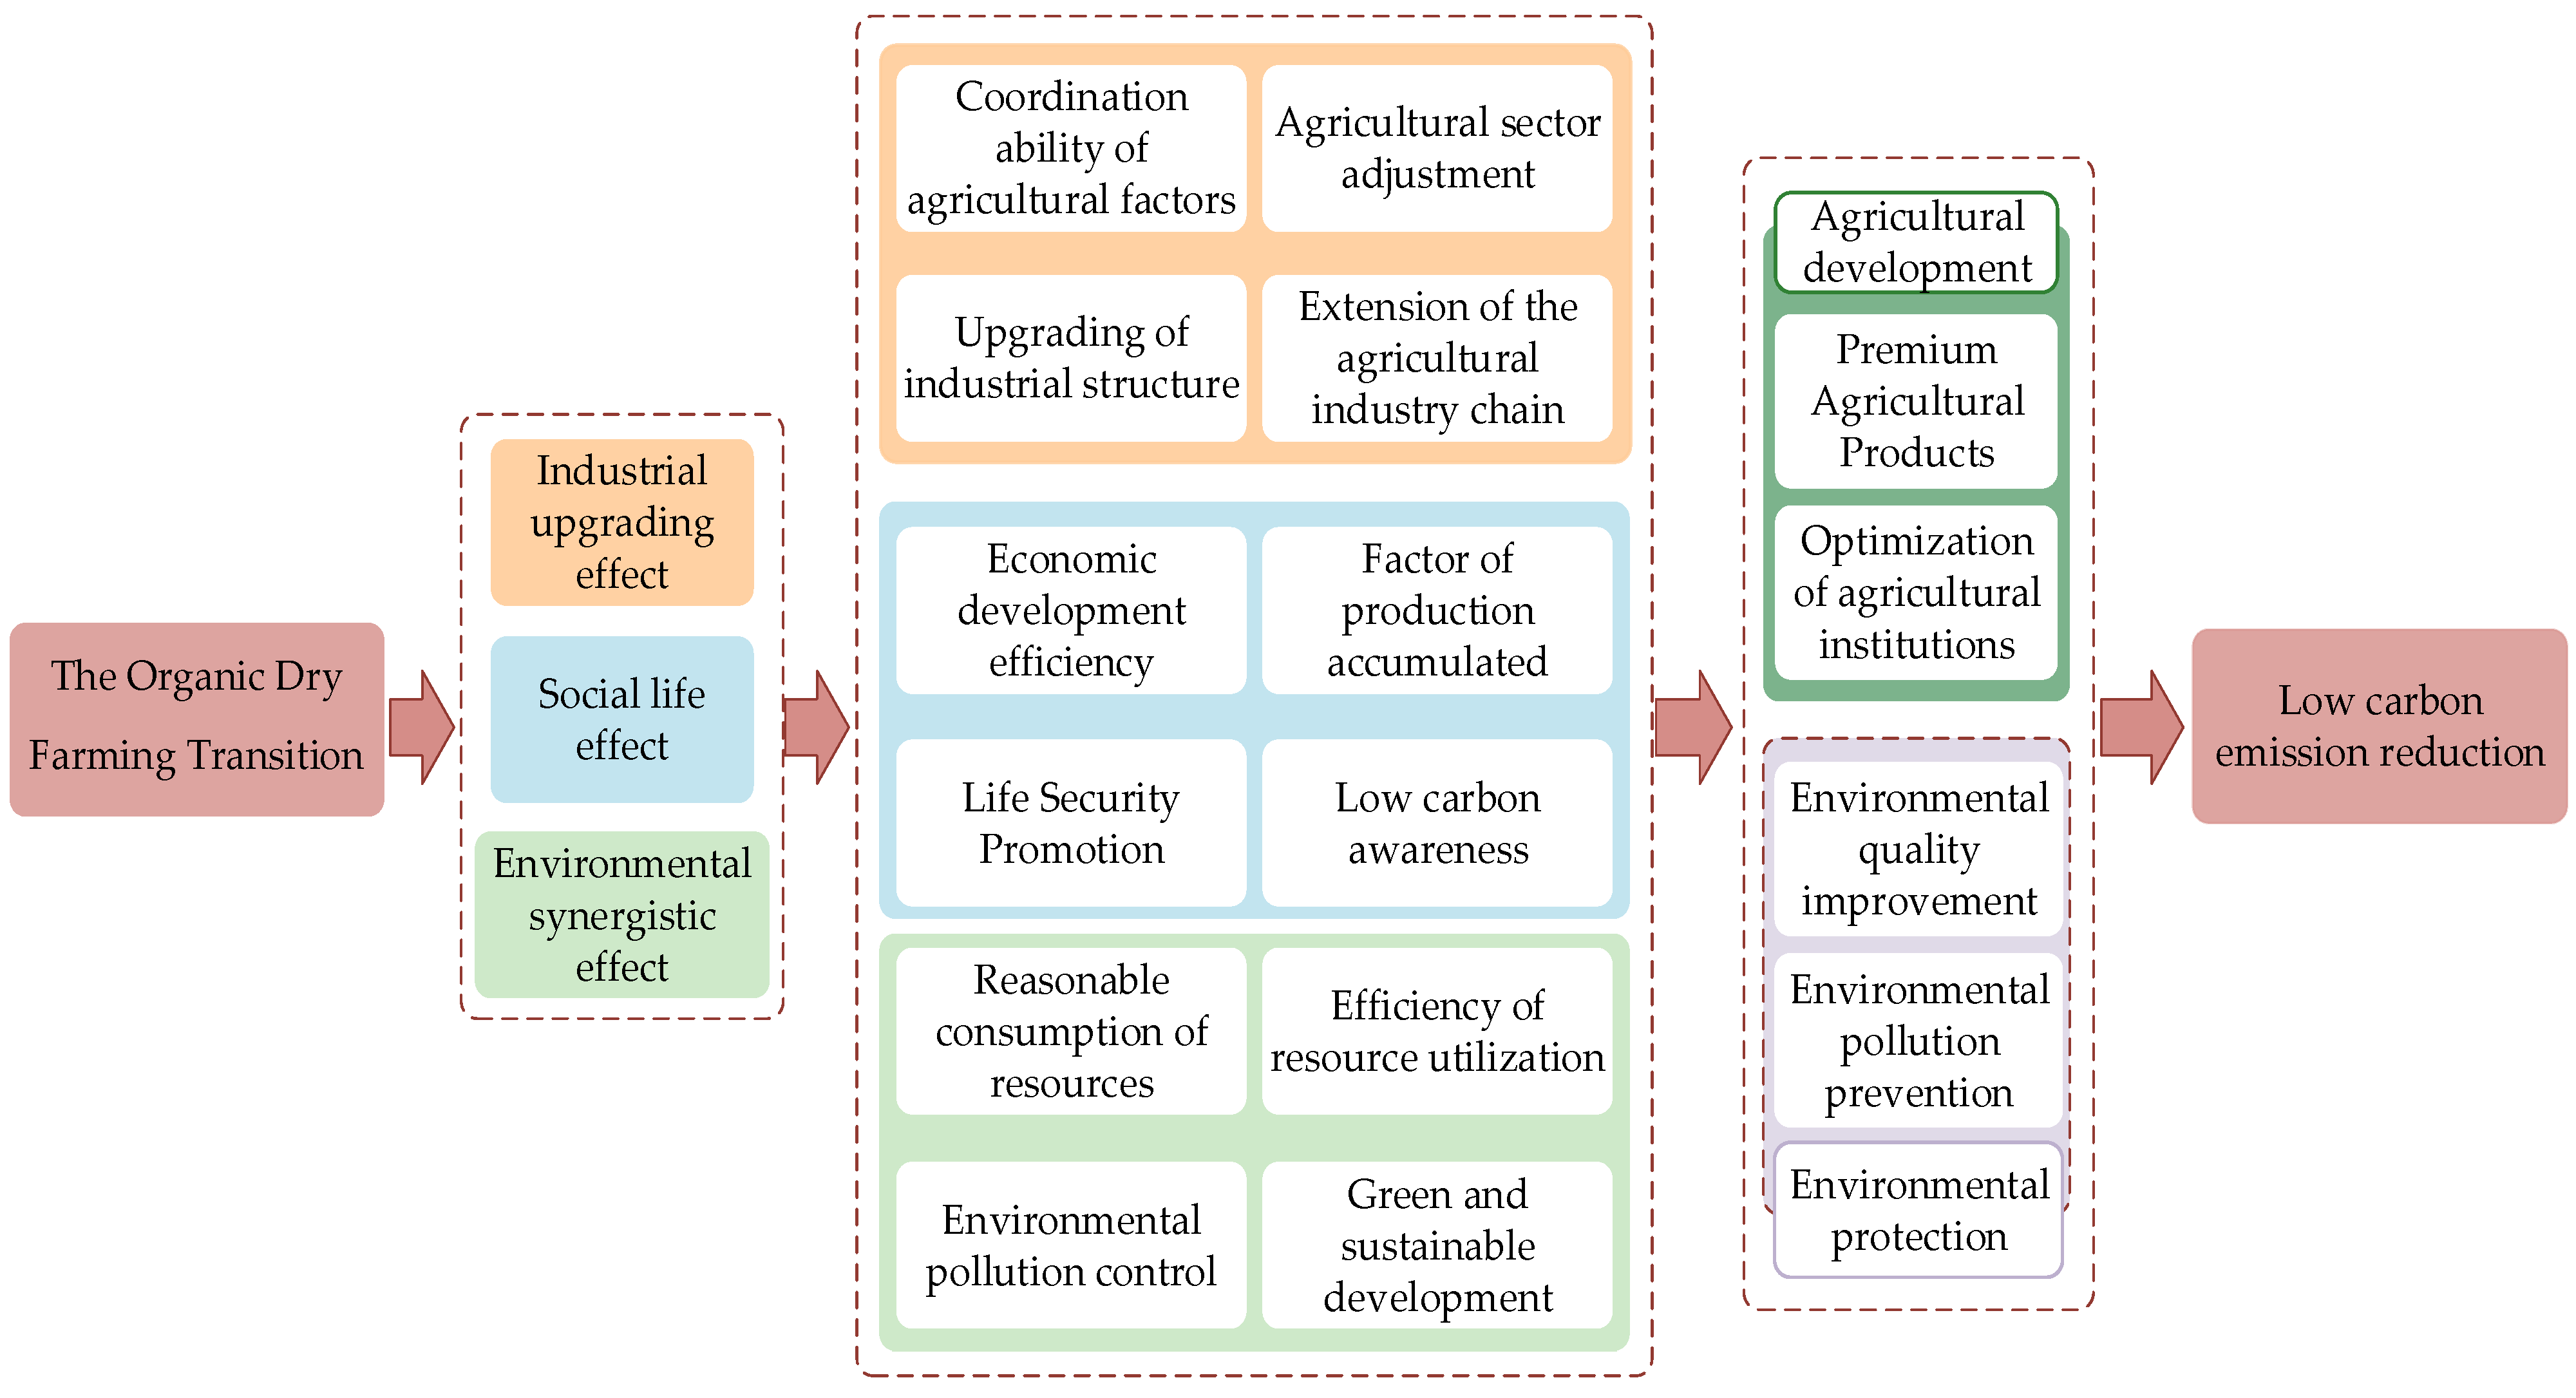
- The industrial upgrading effect of organic dryland agriculture. The transformation of agricultural industries serves as a critical foundation for the development of organic dryland agriculture and constitutes the fundamental basis for carbon emission reduction in organic dryland agriculture. This transformation primarily occurs through the rationalization and upgrading of agricultural structures. Regarding the rationalization of agricultural structures, enhanced coordination among various elements facilitates the redistribution of agricultural factors across sectors, thereby promoting the restructuring of agricultural sectors. Concerning the upgrading of industrial structures, agriculture transitions towards high technology and high value-added processes, directing factors towards high value-added agricultural sectors and consequently reducing agricultural carbon emissions.
- (2)
- The societal impact of organic dryland agriculture. The societal transformation induced by organic dryland agriculture is primarily manifested in the enhancement of economic development efficiency and livelihood security. Technological advancements and educational initiatives accelerate the accumulation of agricultural production factors. The application of advanced agricultural production technologies improves agricultural resource-utilization efficiency and reduces agricultural carbon emissions. The transformation to organic dryland agriculture compels agricultural enterprises to reduce carbon emissions and pollution, fostering economic quality enhancement and efficiency improvement. As living standards rise, awareness of low-carbon practices increases, thereby promoting carbon emission reduction with heightened public environmental consciousness.
- (3)
- The environmental synergistic effects of organic dryland agriculture. The collaborative improvement of the environment by organic dryland agriculture stems from the management of agricultural resource consumption and environmental pollution control. On one hand, reductions in pollutant emissions and resource consumption during the development of agricultural environmental transformations contribute to energy conservation and emission reduction, thereby positively impacting carbon emission reduction. On the other hand, environmental pollution control during agricultural environmental transformations plays a constructive role in carbon emission reduction. For instance, ecosystem protection and restoration facilitate the formation and development of ecological balance, significantly contributing to environmental improvement and achieving carbon emission reduction effects (Figure 1).
2.2. Materials
2.3. Methods
2.3.1. Performance Evaluation Index System for the Transformation of Organic Dry Farming
2.3.2. Spatiotemporal Characteristic Analysis Method for the TRODF
- (1)
- Theil index
- (2)
- Spatial Markov chain
2.3.3. Method for the Analysis of the Carbon Emission Reduction Effect of the Transformation of Organic Dry Farming
- (1)
- Panel fixed-effect model
- (2)
- Spatial econometric model
3. Results
3.1. Spatiotemporal Evolution Characteristics of the Transformation Performance of Organic Dry Farming
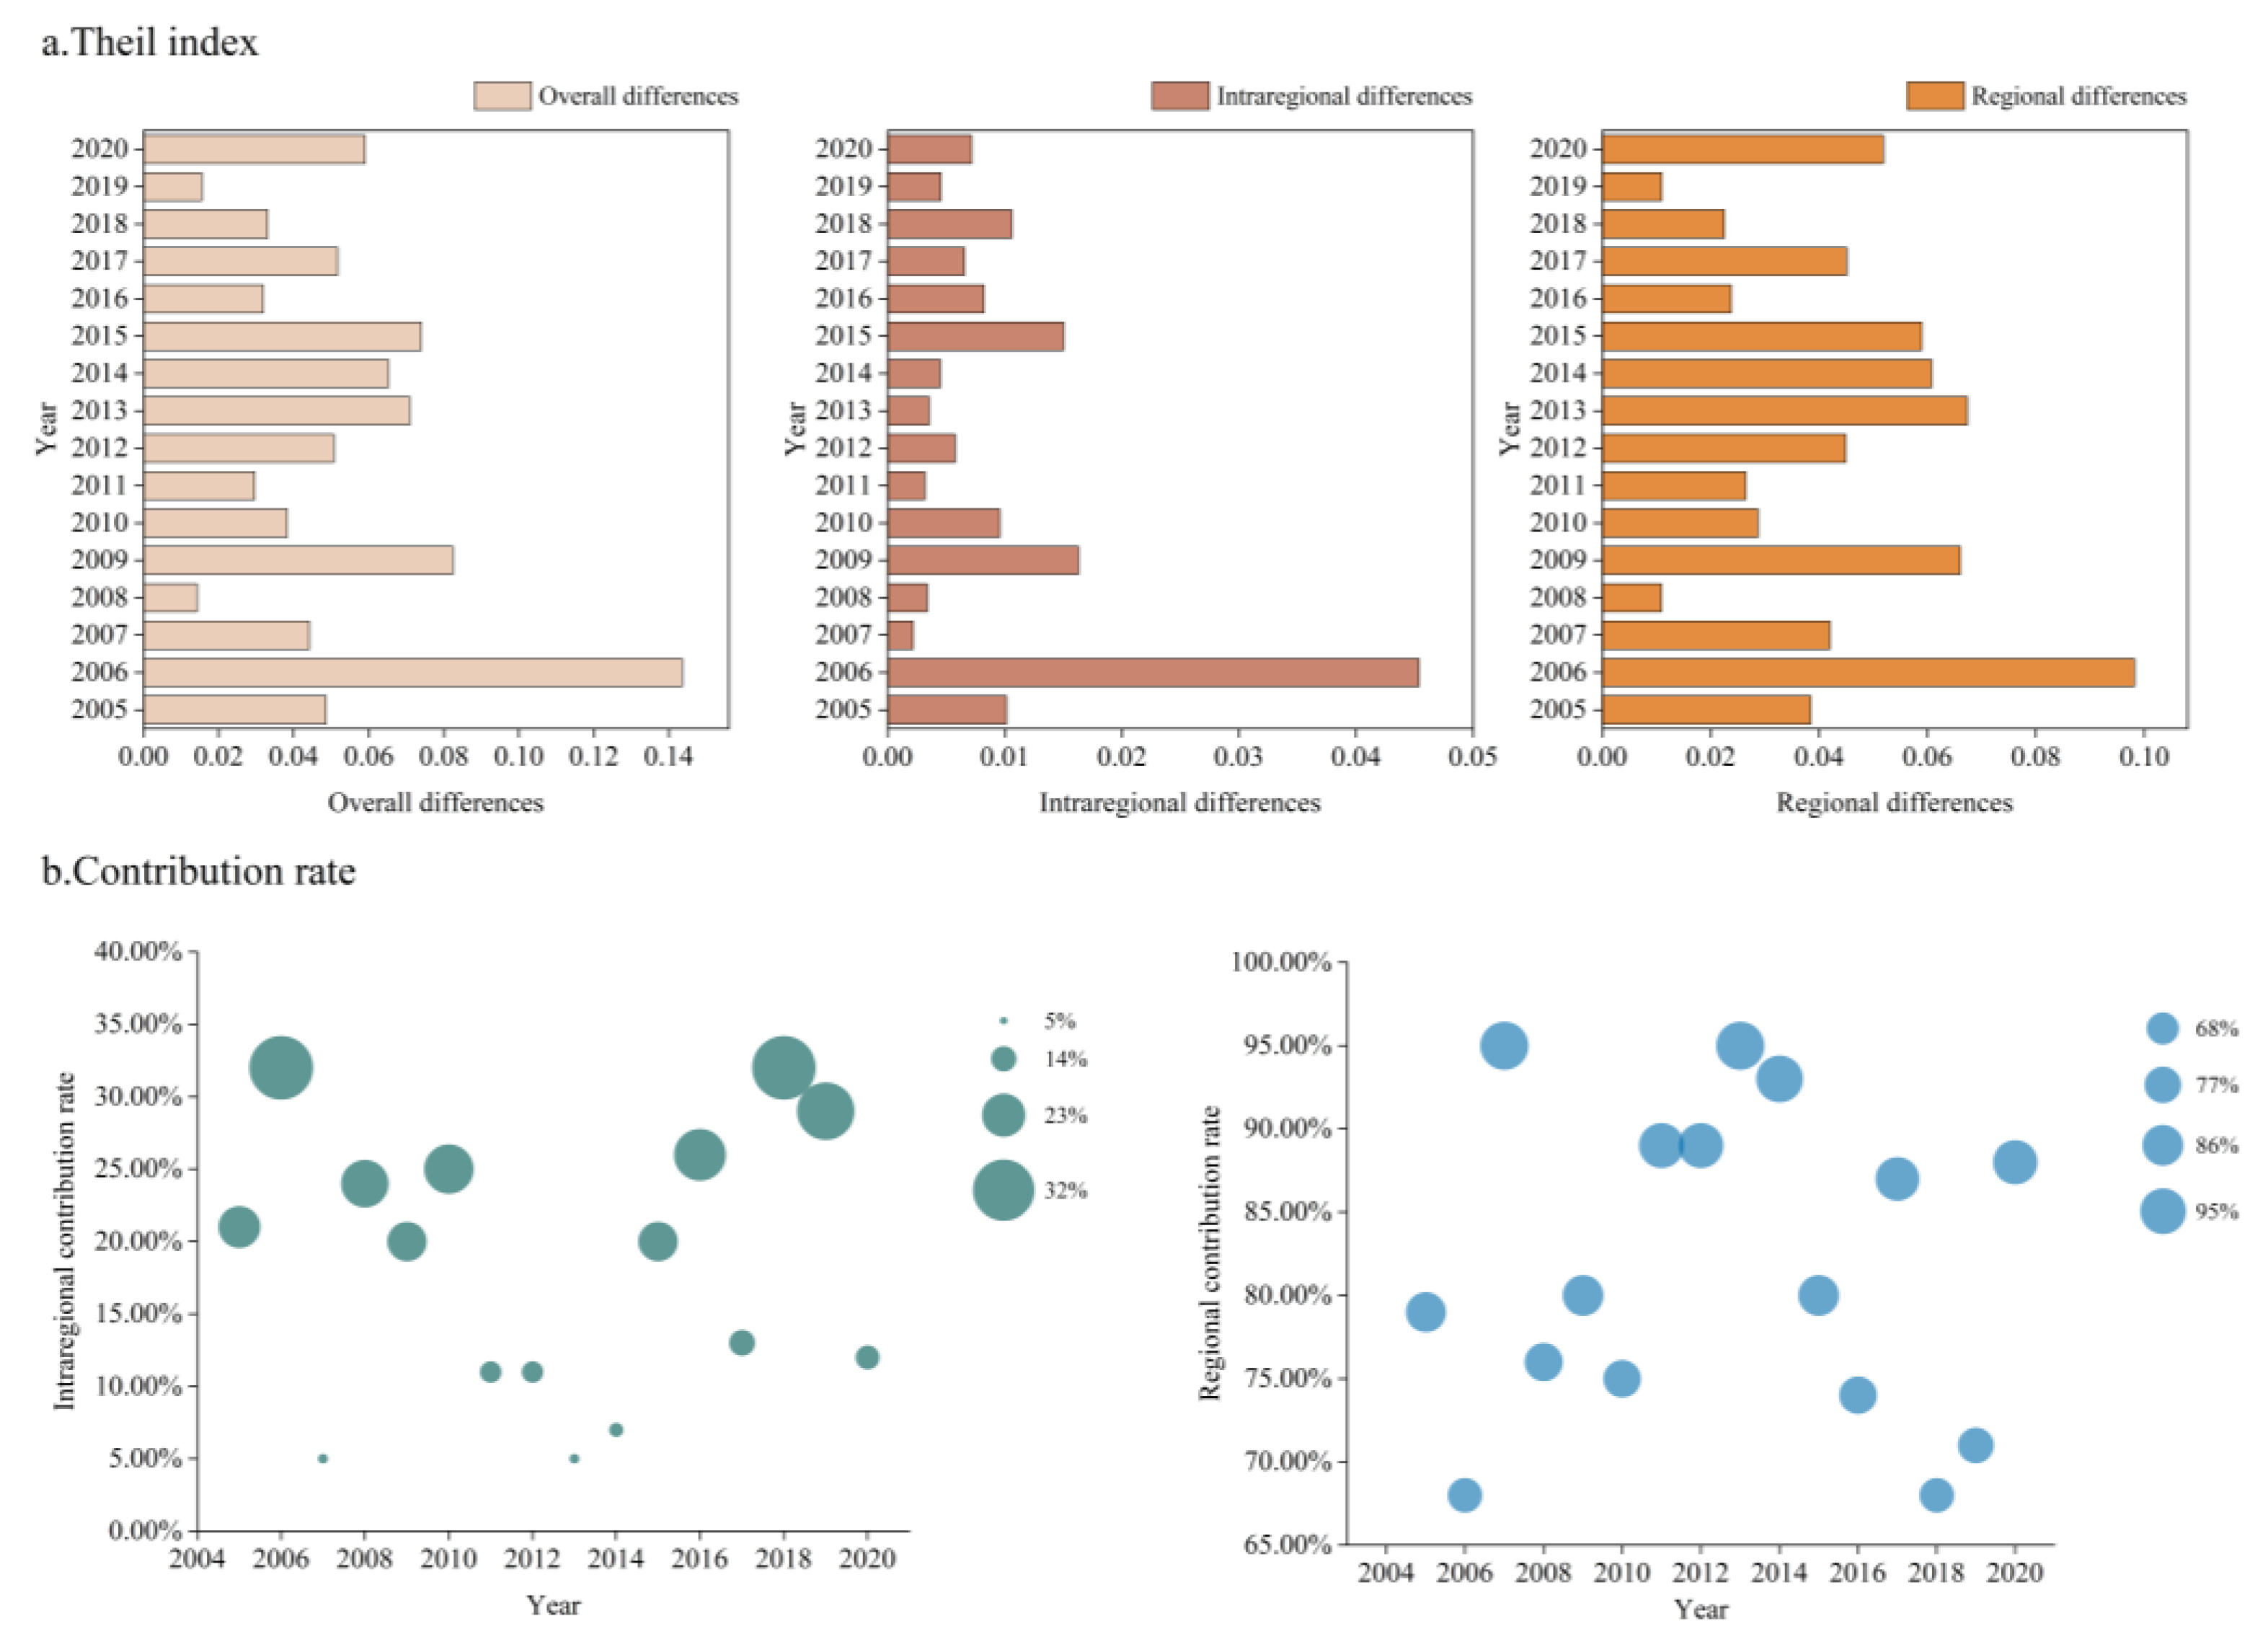
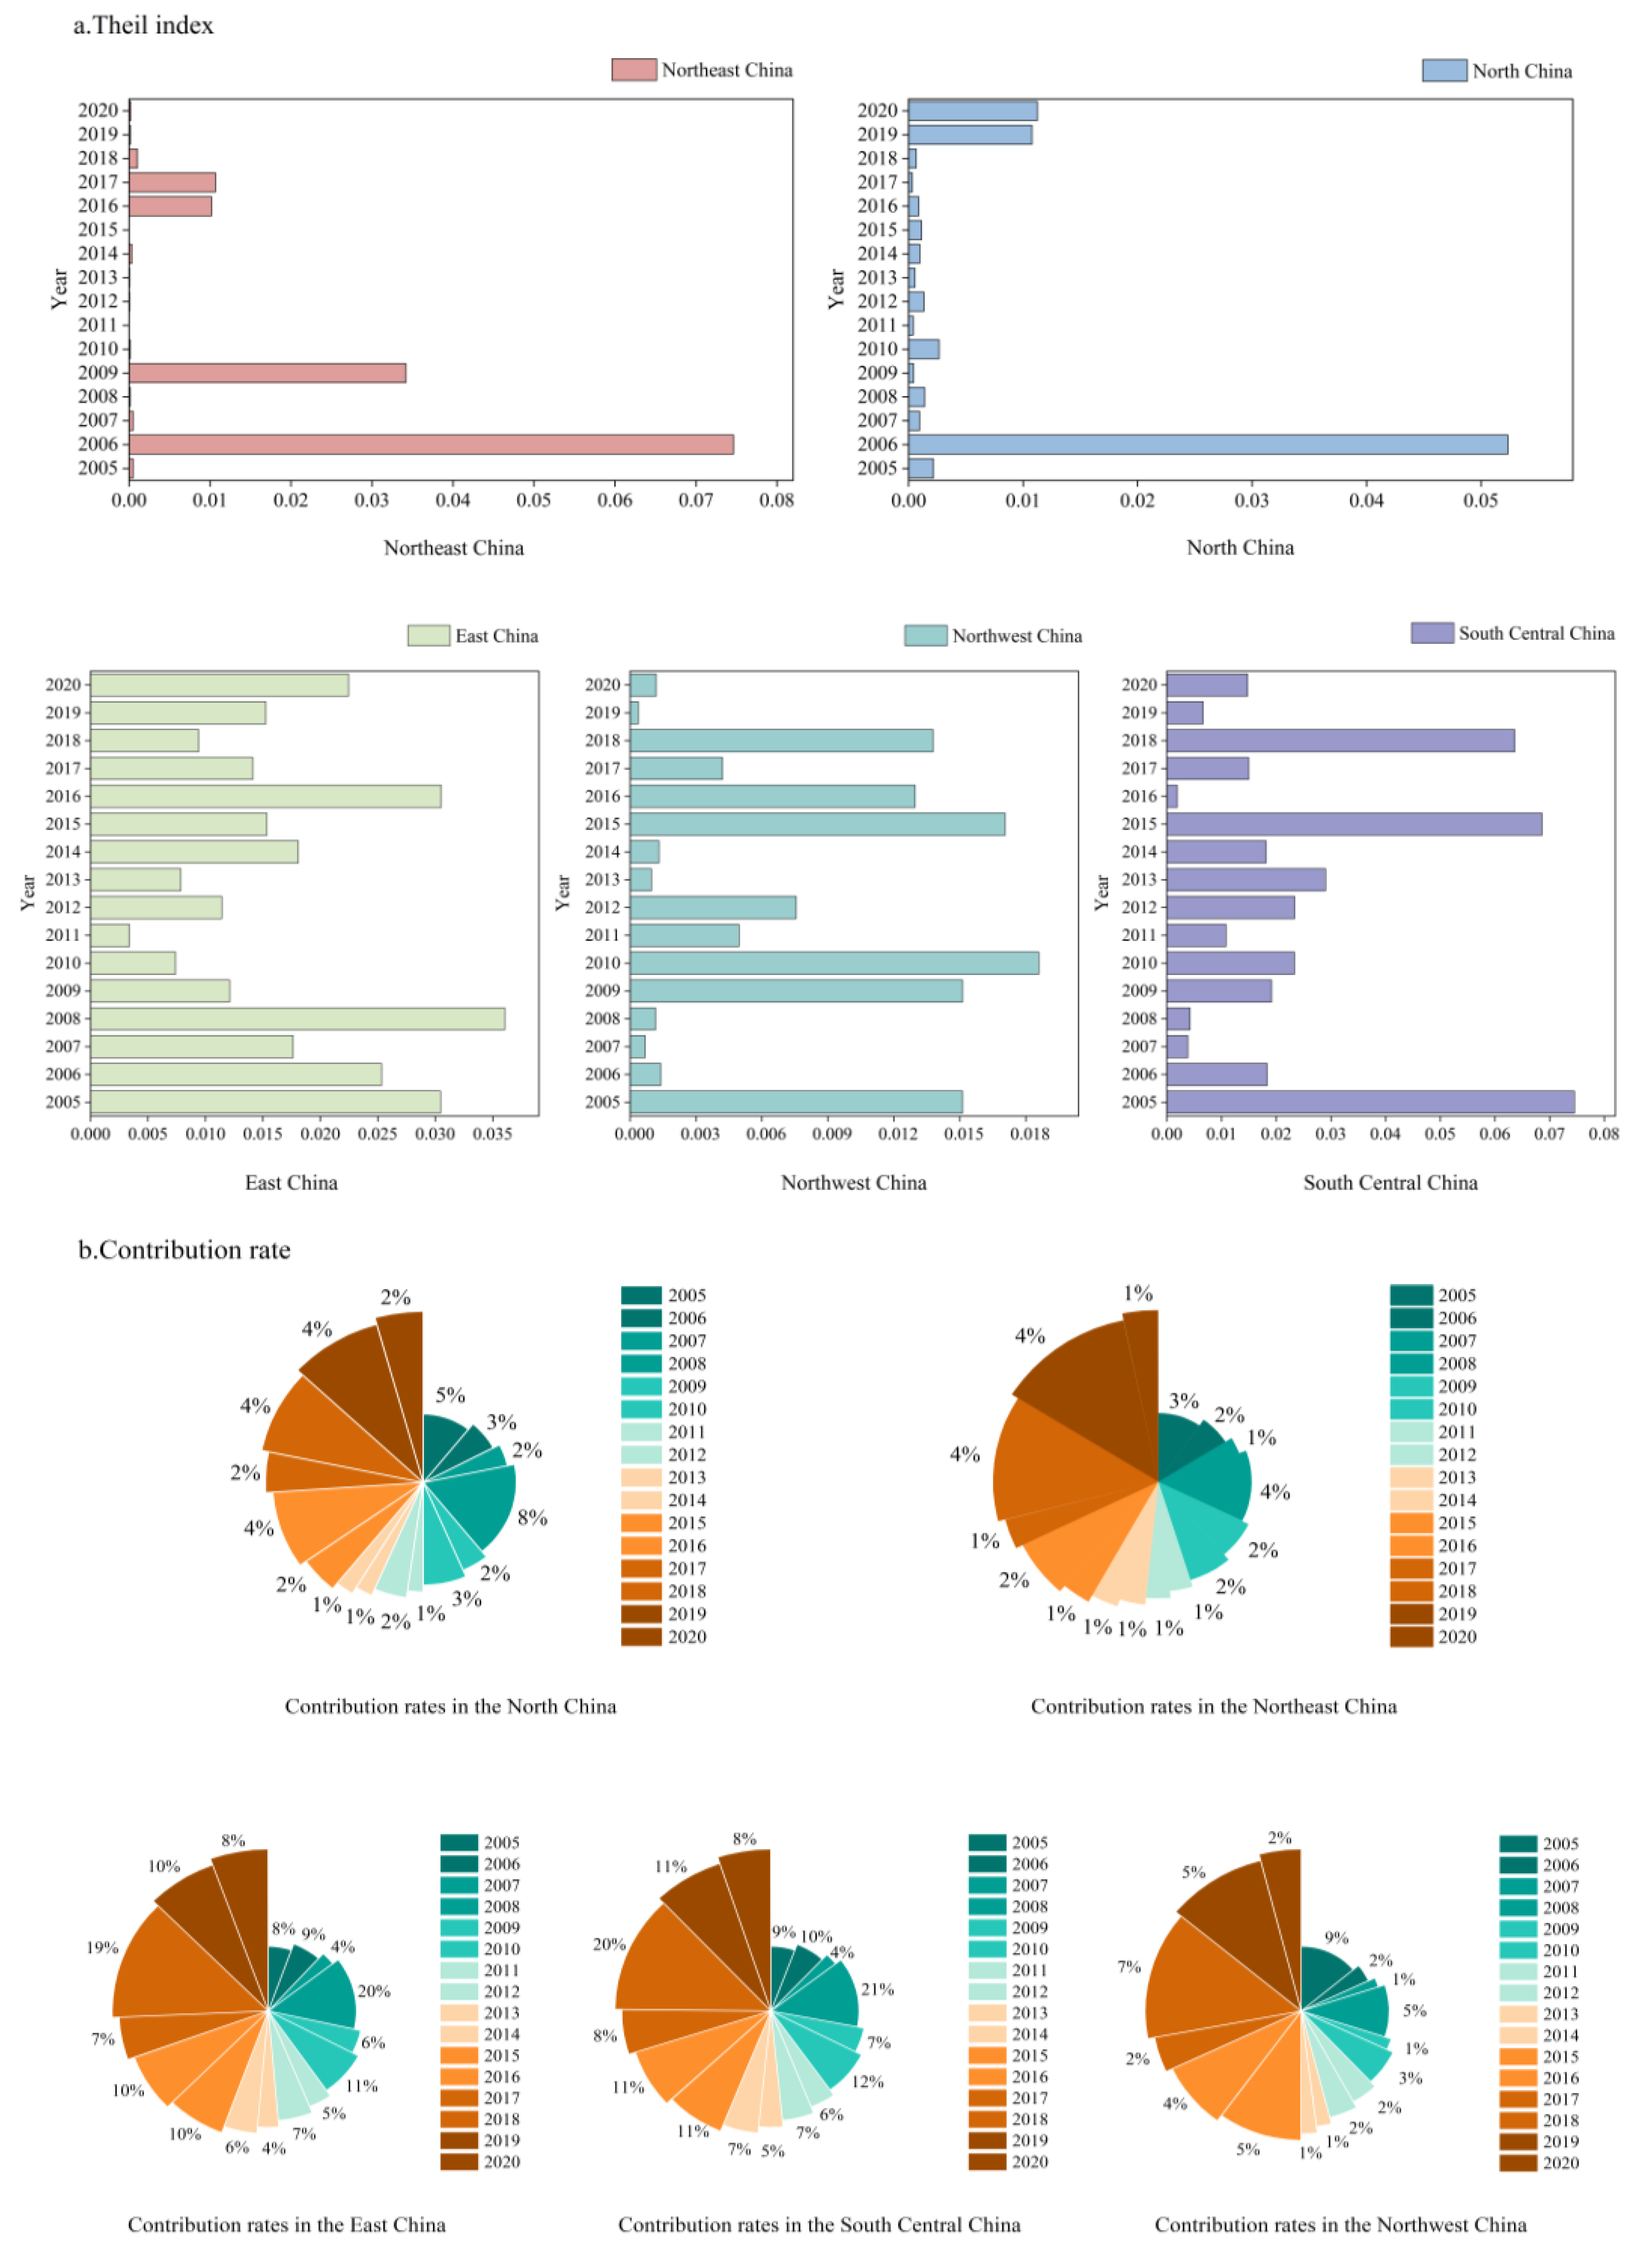
3.1.1. Regional Differences and Structural Decomposition
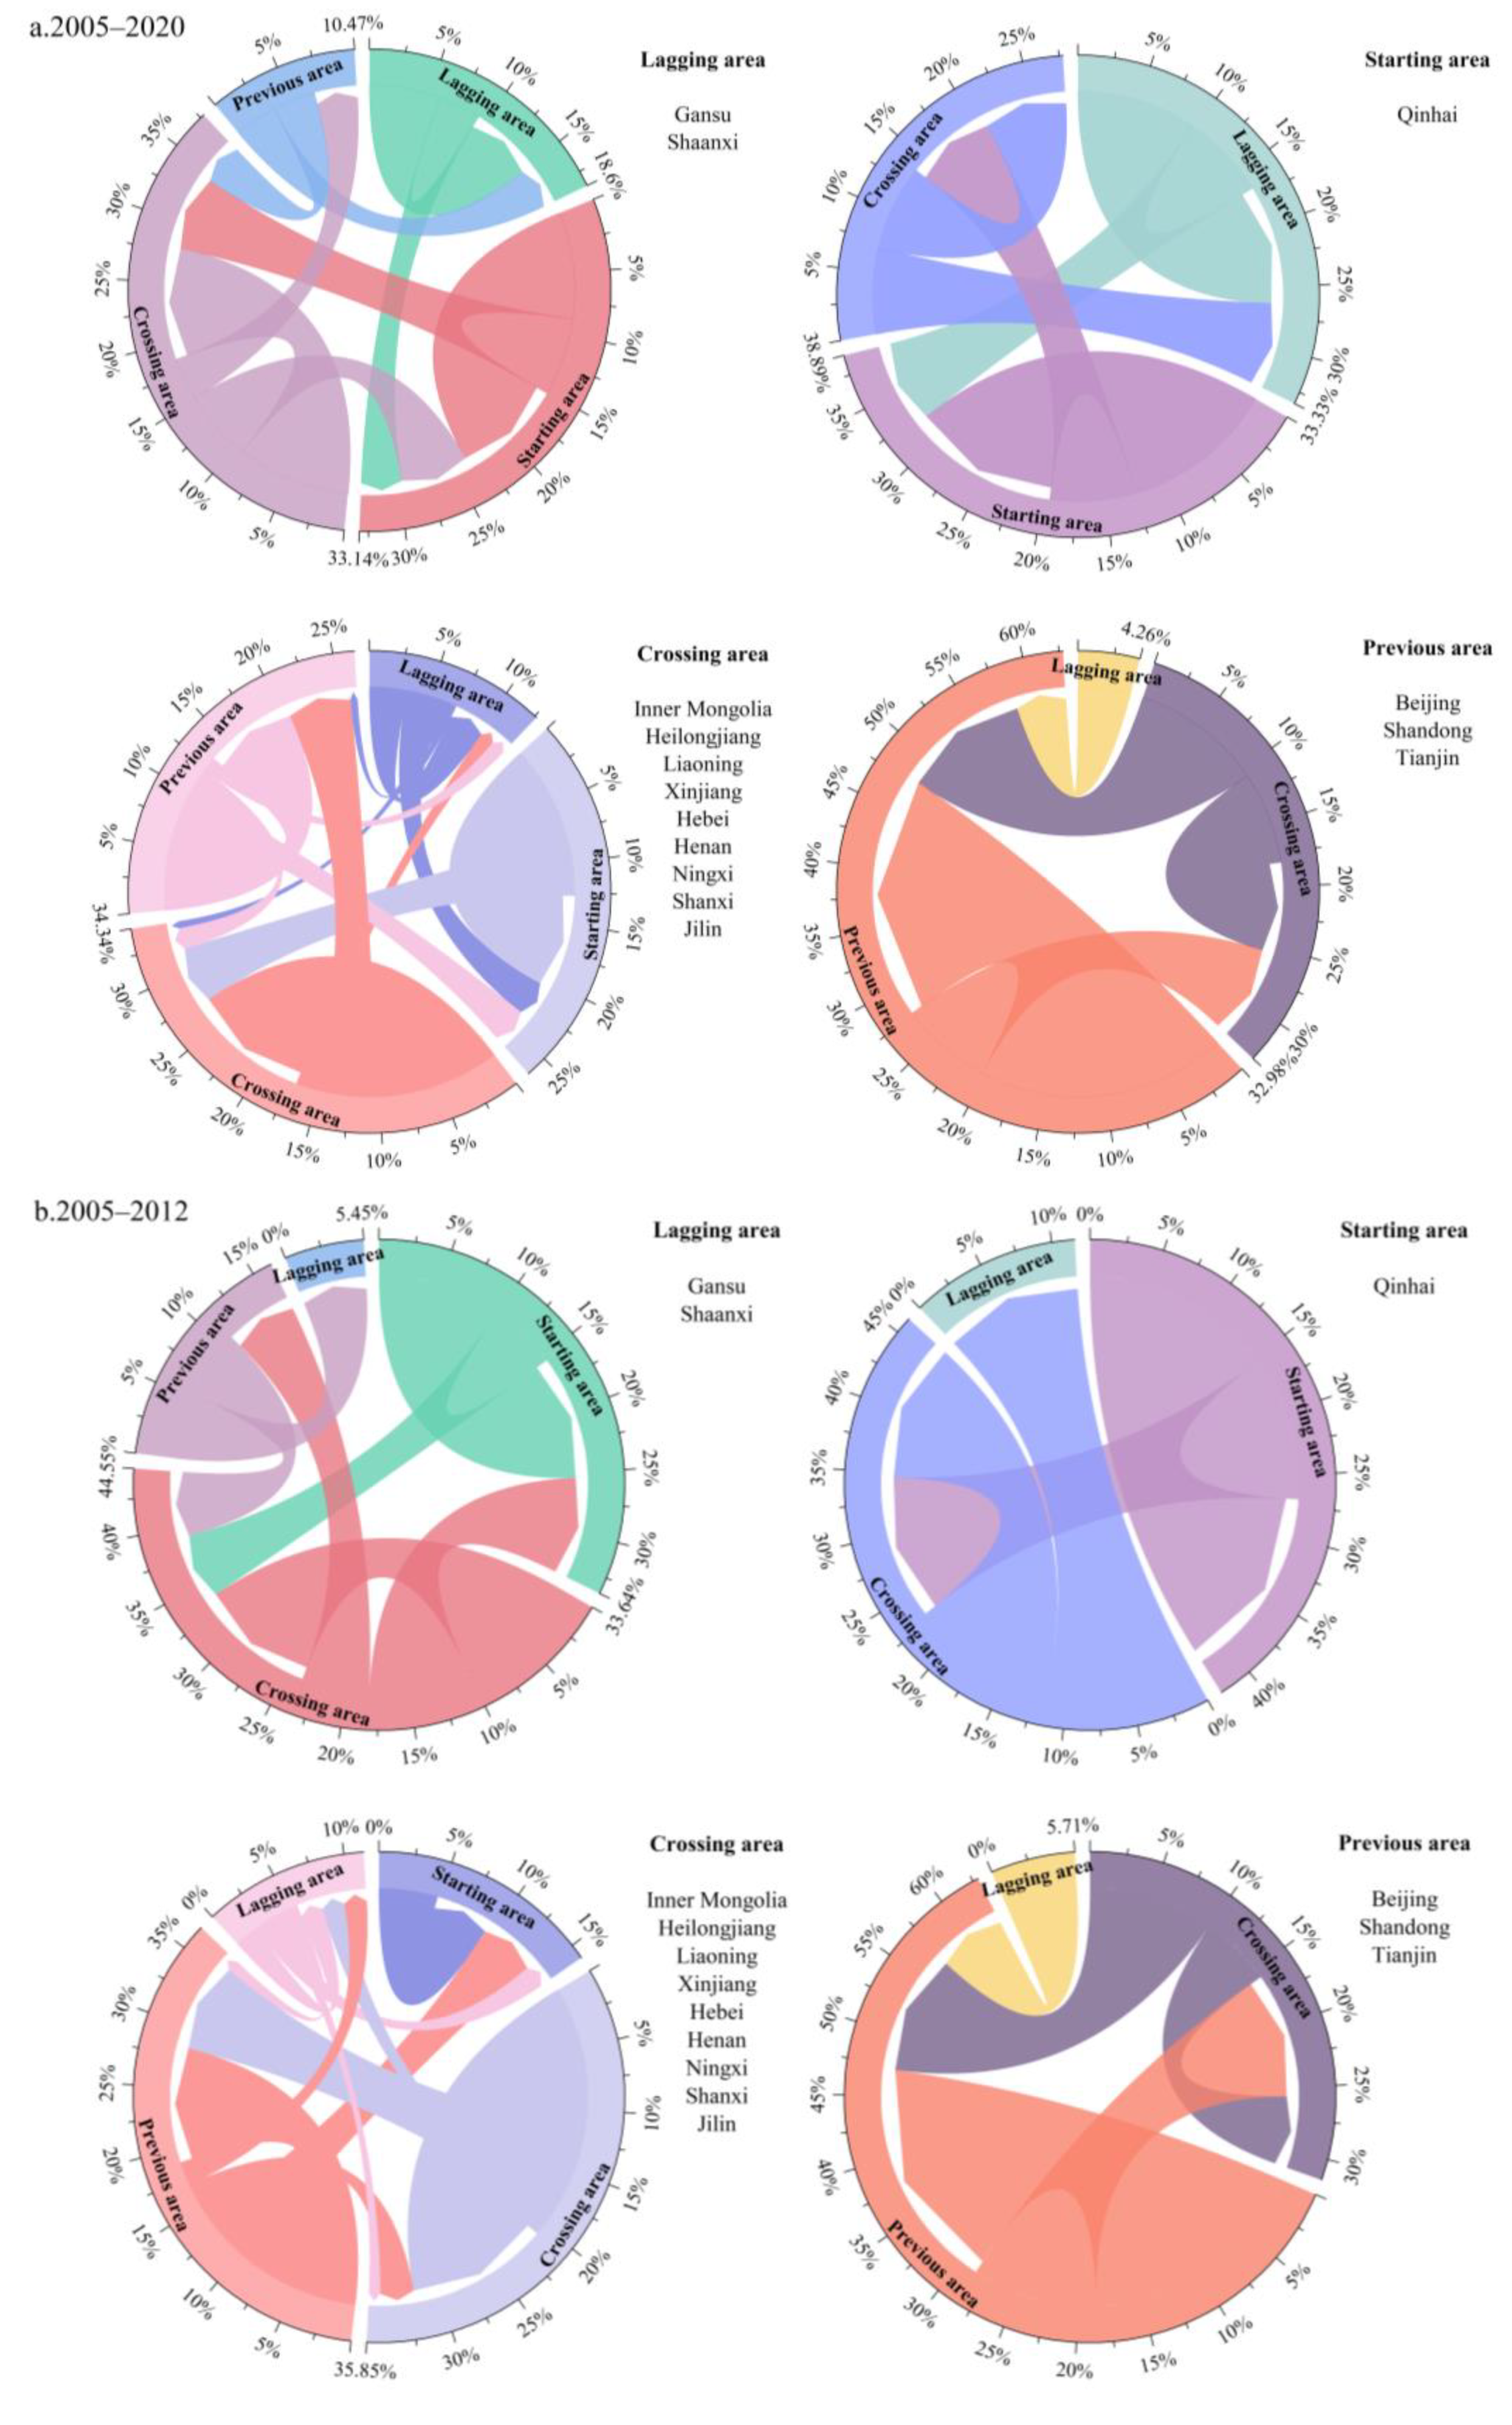
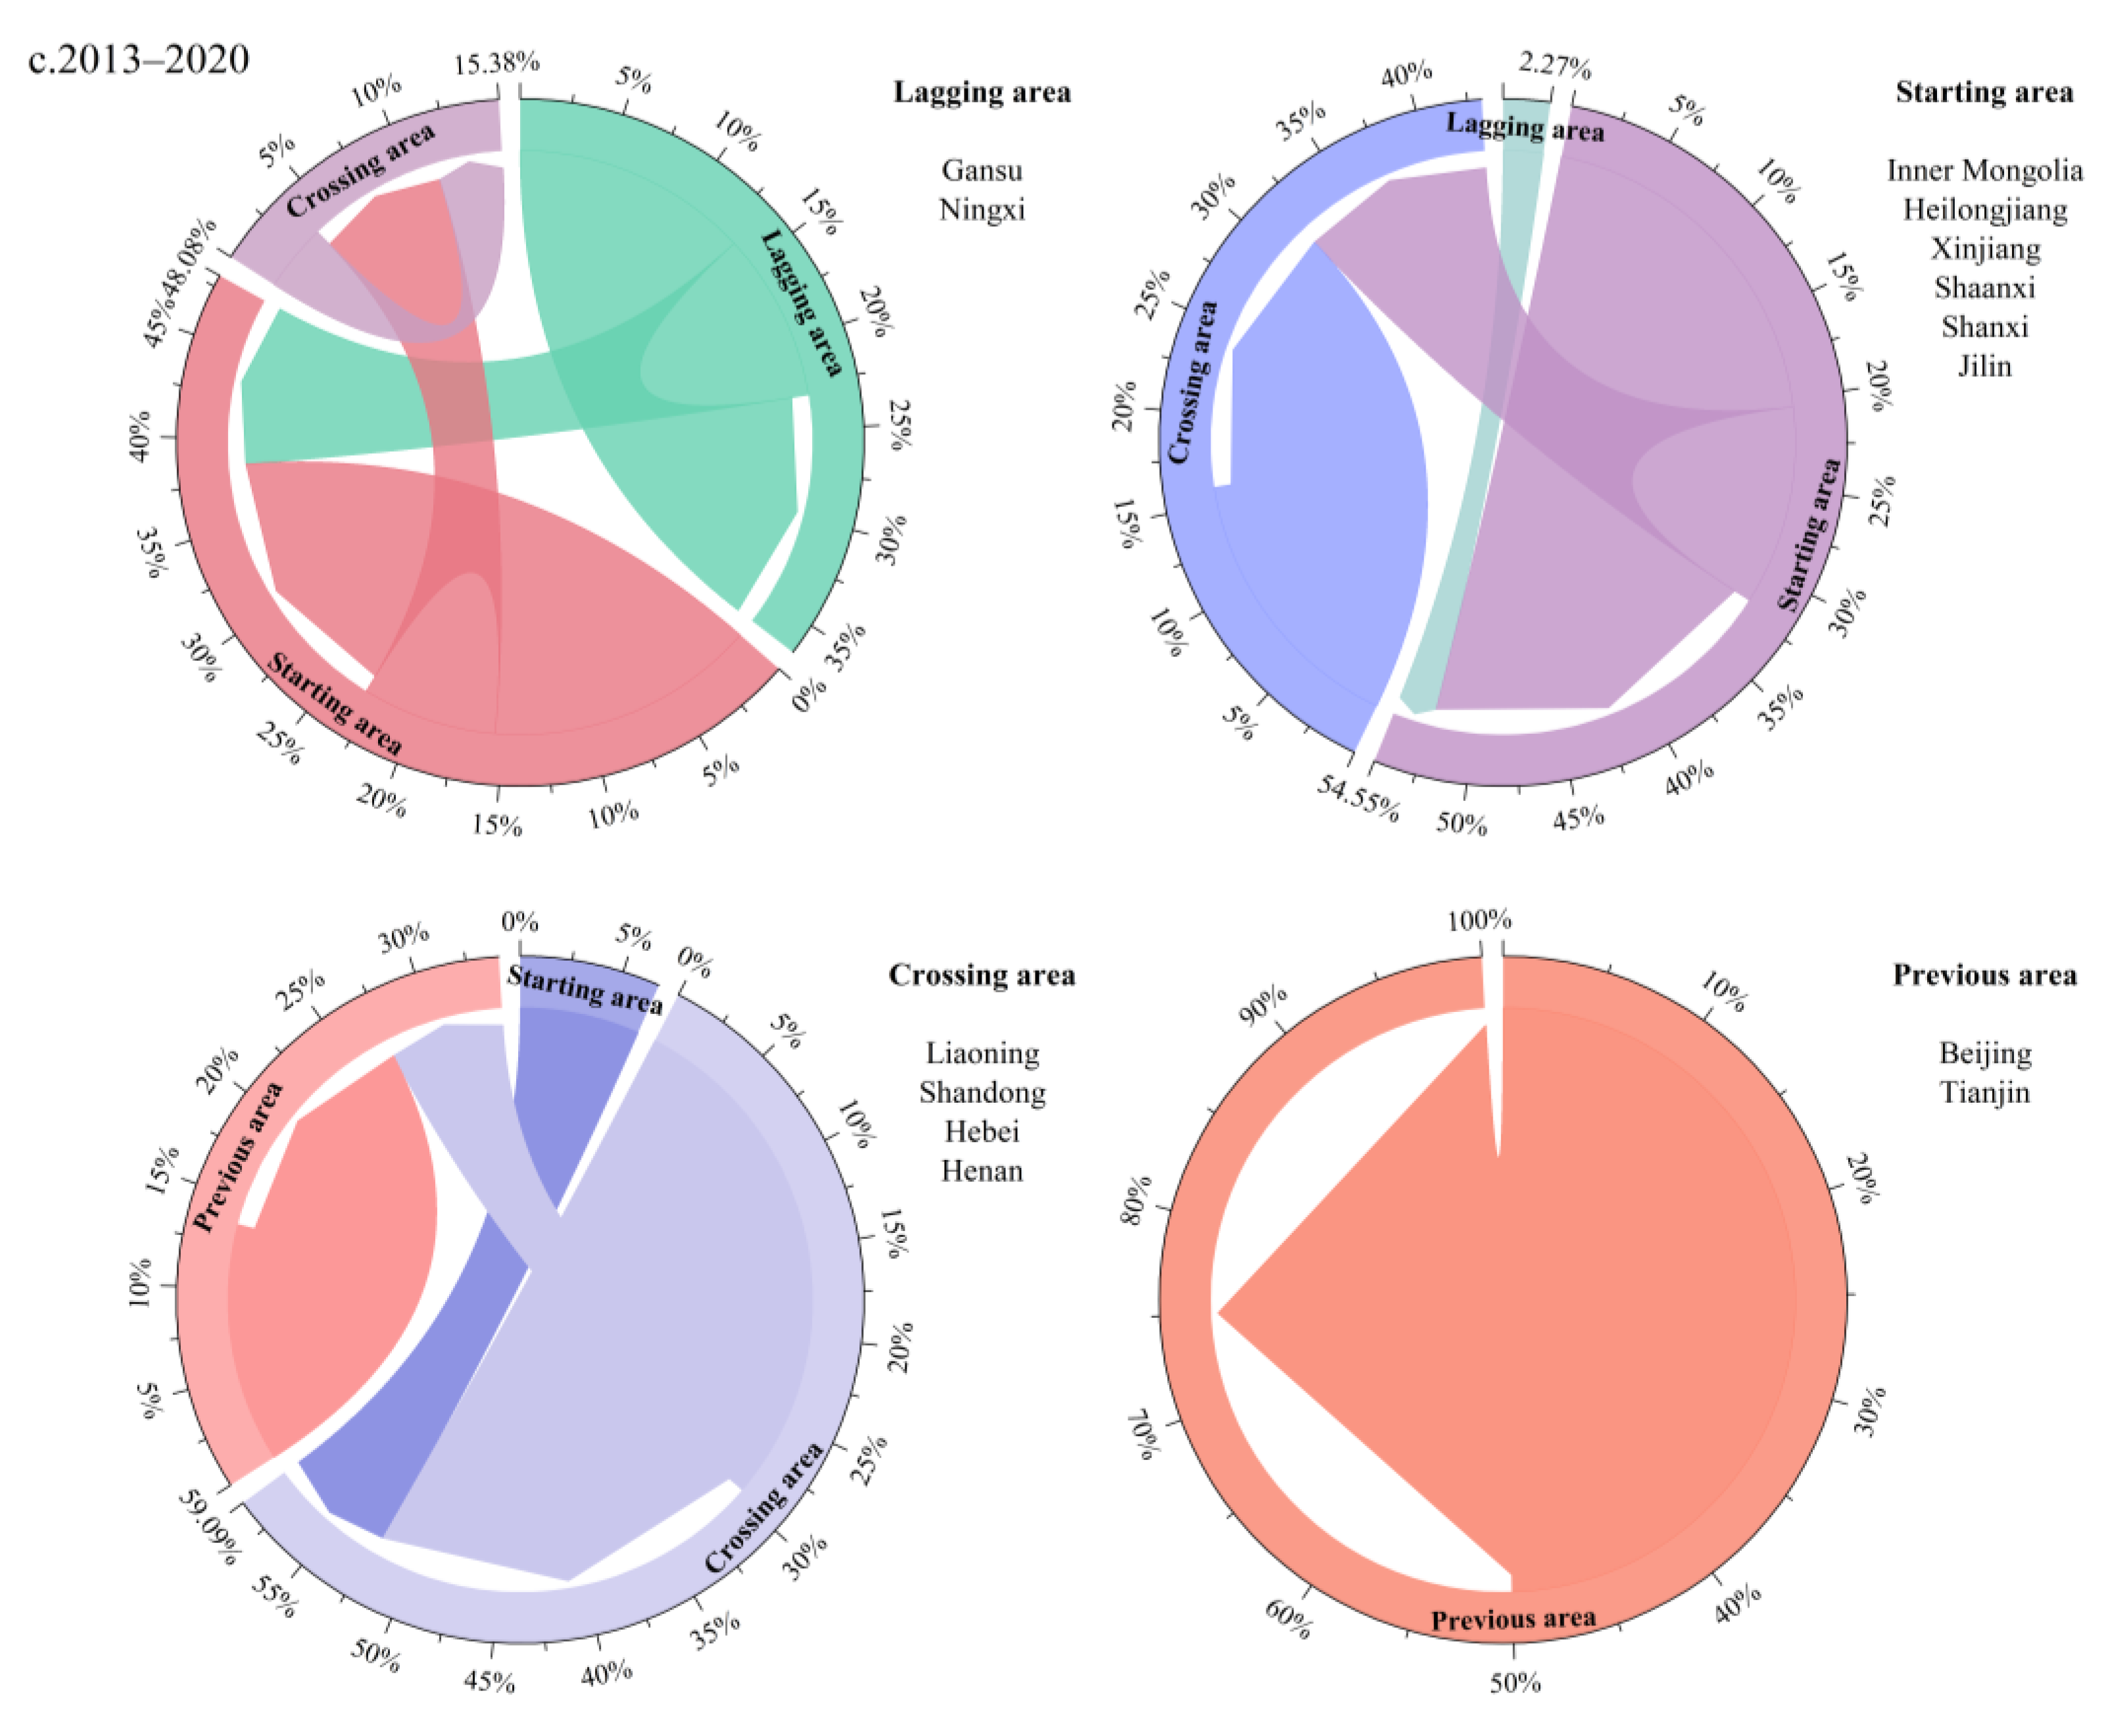
3.1.2. Dynamic Transfer Characteristics
3.2. Impact of the Regional Transformation of Organic Dry Farming on Carbon Emissions
3.2.1. Spatial Correlation Test
3.2.2. Parameter Estimation and Analysis of Results
- (1)
- Panel fixation effect
- (2)
- Endurance test
- (3)
- Robustness test
- (4)
- Spatial Durbin model
3.2.3. Heterogeneity Analysis
- (1)
- Different development stages of organic dry farming areas
- (2)
- For provinces with different locations
- (3)
- Provinces at different stages
3.2.4. Decomposition of the Transformation Effect of Agricultural Provinces
4. Discussion
5. Conclusions
Author Contributions
Funding
Institutional Review Board Statement
Data Availability Statement
Acknowledgments
Conflicts of Interest
References
- Xi, J. Holding High the Great Banner of Socialism with Chinese Characteristics and Uniting for the Comprehensive Construction of a Socialist Modernized Country—Report at the 20th National Congress of the CPC; People’s Daily: Beijing, China, 2022. [Google Scholar]
- Gu, Q.; Wei, J.; Luo, S.; Ma, M.; Tang, X. Potential and environmental control of carbon sequestration in major ecosystems across arid and semi-arid regions in China. Sci. Total Environ. 2018, 645, 796–805. [Google Scholar] [CrossRef]
- National Bureau of Statistics. Bulletin of the Main Data of the Third National Land Survey [EB/OL]. 2021. Available online: https://www.gov.cn/xinwen/2021-08/26/content_5633490.htm (accessed on 25 August 2021).
- He, T.; Song, H.; Chen, W. Recognizing the transformation characteristics of resource-based cities using night-time light remote sensing data: Evidence from 126 cities in China. Resour. Policy 2023, 85, 104013. [Google Scholar] [CrossRef]
- Liu, B.; Wang, J.; Jing, Z.; Tang, Q. Measurement of sustainable transformation capability of resource-based cities based on fuzzy membership function: A case study of Shanxi Province, China. Resour. Policy 2020, 68, 101739. [Google Scholar] [CrossRef]
- Feng, Y.; Dong, X.; Zhao, X.; Zhu, A. Evaluation of urban green development transformation process for Chinese cities during 2005–2016. J. Clean. Prod. 2020, 266, 121707. [Google Scholar] [CrossRef]
- Zheng, H.; Ge, L. Carbon emissions reduction effects of sustainable development policy in resource-based cities from the perspective of resource dependence: Theory and Chinese experience. Resour. Policy 2022, 78, 102799. [Google Scholar] [CrossRef]
- Long, R.; Li, H.; Wu, M.; Li, W. Dynamic evaluation of the green development level of China’s coal-resource-based cities using the TOPSIS method. Resour. Policy 2021, 74, 102415. [Google Scholar] [CrossRef]
- Xu, J.; Yu, Y.; Zhang, M.; Zhang, J.Z. Impacts of digital transformation on eco-innovation and sustainable performance: Evidence from Chinese manufacturing companies. J. Clean. Prod. 2023, 393, 136278. [Google Scholar] [CrossRef]
- Matarazzo, M.; Penco, L.; Profumo, G.; Quaglia, R. Digital transformation and customer value creation in Made in Italy SMEs: A dynamic capabilities perspective. J. Bus. Res. 2021, 123, 642–656. [Google Scholar] [CrossRef]
- Jiao, H.; Yang, J.F.; Wang, P.N. Research on the dynamic capability mechanism of data-driven enterprises-Analysis of digital transformation process based on data life cycle management. China Ind. Econ. 2021, 11, 174–192. [Google Scholar]
- Li, Q.; Liu, S.; Yang, M.; Xu, F. The effects of China’s sustainable development policy for resource-based cities on local industrial transformation. Resour. Policy 2021, 71, 101940. [Google Scholar] [CrossRef]
- Yang, J.; Chen, F.; Wang, Y.; Mao, J.; Wang, D. Performance evaluation of ecological transformation of mineral resource-based cities: From the perspective of stage division. Ecol. Indic. 2023, 154, 110540. [Google Scholar] [CrossRef]
- Shi, W.; Fang, Y.R.; Chang, Y.; Xie, G.H. Toward sustainable utilization of crop straw: Greenhouse gas emissions and their reduction potential from 1950 to 2021 in China. Resour. Conserv. Recycl. 2023, 190, 106824. [Google Scholar] [CrossRef]
- Mehmood, S.; Zaman, K.; Khan, S.; Ali, Z. The role of green industrial transformation in mitigating carbon emissions: Exploring the channels of technological innovation and environmental regulation. Energy Built Environ. 2024, 5, 464–479. [Google Scholar] [CrossRef]
- Luo, L.; Liu, P.; Zhu, F.; Sun, Y.; Liu, L. Policy objective bias and institutional quality improvement: Sustainable development of resource-based cities. Resour. Policy 2022, 78, 102932. [Google Scholar] [CrossRef]
- Wang, X.N.; Sun, W. Transformation eficiency of resource-based cities in the Yellow River Basin and its influencing factors. Prog. Geogr. 2020, 39, 1643–1655. [Google Scholar] [CrossRef]
- Li, J.S.; Wang, X.R.; Miao, C.H. Comparison of development efficiency evaluation resource-based cities based on DEA model. Econ. Geogr. 2017, 37, 99–106. [Google Scholar]
- Fang, L.; Hu, R.; Mao, H.; Chen, S. How crop insurance influences agricultural green total factor productivity: Evidence from Chinese farmers. J. Clean. Prod. 2021, 321, 128977. [Google Scholar] [CrossRef]
- Li, X.; Ozturk, I.; Ullah, S.; Andlib, Z.; Hafeez, M. Can top-pollutant economies shift some burden through insurance sector development for sustainable development? Econ. Anal. Policy 2022, 74, 326–336. [Google Scholar] [CrossRef]
- Guo, Z.; Zhang, X. Carbon reduction effect of agricultural green production technology: A new evidence from China. Sci. Total Environ. 2023, 874, 162483. [Google Scholar] [CrossRef]
- Bai, T.; Qi, Y.; Li, Z.; Xu, D. Digital economy, industrial transformation and upgrading, and spatial transfer of carbon emissions: The paths for low-carbon transformation of Chinese cities. J. Environ. Manag. 2023, 344, 118528. [Google Scholar] [CrossRef]
- Bell, J.; DeLaune, P.B.; Fischer, B.L.; Foster, J.L.; Lewis, K.L.; McCarl, B.A.; Outlaw, J.L. Carbon sequestration and water management in Texas—One size does not fit all. Agrosyst. Geosci. Environ. 2023, 6, e20372. [Google Scholar] [CrossRef]
- Rosa, L.; Gabrielli, P. Achieving net-zero emissions in agriculture: A review. Environ. Res. Lett. 2023, 18, 063002. [Google Scholar] [CrossRef]
- He, Y.; Wang, H.; Chen, R.; Hou, S.; Xu, D. The Forms, Channels and Conditions of Regional Agricultural Carbon Emission Reduction Interaction: A Provincial Perspective in China. Int. J. Environ. Res. Public Health 2022, 19, 10905. [Google Scholar] [CrossRef]
- Rahman, M.M.; Aravindakshan, S.; Hoque, M.A.; Rahman, M.A.; Gulandaz, M.A.; Rahman, J.; Islam, M.T. Conservation tillage (CT) for climate-smart sustainable intensification: Assessing the impact of CT on soil organic carbon accumulation, greenhouse gas emission and water footprint of wheat cultivation in Bangladesh. Environ. Sustain. Indic. 2021, 10, 100106. [Google Scholar] [CrossRef]


| Numerical Value | Unit | National Share | |
|---|---|---|---|
| Area | 579.09 | 104 km2 | 60.32% |
| GDP | 354,784.37 | 108 CNY | 35% |
| Cropland area | 82,799.06 | 104 hm2 | 64.7% |
| Gross agricultural product | 33,024.21 | 108 CNY | 46.03% |
| Total grain output | 39,646.71 | 104 t | 59.22% |
| Population | 57,224 | 104 | 40.53% |
| Year | 2005 | 2006 | 2007 | 2008 | 2009 | 2010 | 2011 | 2012 |
|---|---|---|---|---|---|---|---|---|
| TRA | 0.439 *** | 0.450 *** | 0.438 *** | 0.540 *** | 0.476 *** | 0.322 *** | 0.434 *** | 0.384 *** |
| EMI | 0.346 *** | 0.348 *** | 0.332 *** | 0.323 *** | 0.318 *** | 0.306 *** | 0.290 *** | 0.264 *** |
| Year | 2013 | 2014 | 2015 | 2016 | 2017 | 2018 | 2019 | 2020 |
| TRA | 0.440 *** | 0.420 *** | 0.634 *** | 0.386 *** | 0.396 *** | 0.270 *** | 0.469 *** | 0.303 *** |
| EMI | 0.250 *** | 0.214 *** | 0.201 | 0.200 | 0.199 | 0.187 | 0.178 | 0.183 |
| Variable | Panel FE Model | Endurance Test | Robustness Test | Spatial Durbin Model | ||
|---|---|---|---|---|---|---|
| lnEMI | lnEMI | lnCOG | lnEMI | Main | W × X | |
| TRA | −2.022 *** | −2.022 | −0.490 * | −0.424 * | −0.309 *** | −0.005 |
| (−6.55) | (−2.02) | (−1.84) | (1.83) | (−3.93) | (−0.03) | |
| GOV | 3.496 *** | 3.496 | 0.230 | 0.859 ** | 0.0121 | 0.268 |
| (−6.92) | (3.50) | (1.06) | (2.66) | (0.08) | (0.69) | |
| POP | 0.000 *** | 0.000 *** | −0.000 ** | −0.000 * | −0.000 *** | −0.001 ** |
| (11.97) | (0.00) | (−2.53) | (−2.03) | (−6.01) | (−2.50) | |
| ENR | 123.166 * | 123.166 | 27.538 | 113.670 * | 42.268 ** | 312.711 *** |
| (−1.91) | (123.17) | (0.49) | (2.09) | (2.22) | (4.47) | |
| INF | 0.038 * | 0.038 ** | 0.027 ** | 0.027 | 0.015 | −0.064 *** |
| (−1.93) | (0.04) | (2.25) | (1.62) | (1.38) | (−4.57) | |
| SIZ | −65.310 *** | −65.310 | 9.354 | 0.940 | −3.203 | −72.095 *** |
| (−10.11) | (−65.31) | (1.74) | (0.12) | (−1.36) | (−10.56) | |
| cons/rho | 6.668 *** | 6.668 | 8.563 *** | 6.138 *** | −0.742 *** | |
| (20.91) | (6.67) | (14.15) | (7.2) | (−4.08) | ||
| N/individual | 240 | 210 | 240 | 240 | 240 | |
| R2 | 0.44 | 0.00 | 0.43 | 0.54 | 0.68 | |
| Order | Z | Prob > z |
|---|---|---|
| 1 | −0.21438 | 0.8303 |
| 2 | −0.10131 | 0.9193 |
| Test | Statistic | df | p-Value |
|---|---|---|---|
| Spatial error: | |||
| Lagrange multiplier | 14.369 | 1 | 0.000 |
| Robust Lagrange multiplier | 22.708 | 1 | 0.000 |
| Spatial lag: | 1 | ||
| Lagrange multiplier | 3.826 | 1 | 0.050 |
| Robust Lagrange multiplier | 12.165 | 1 | 0.000 |
| Variable | Different Stages of Development | Different Spatial Locations | Different Time Stages | |||||
|---|---|---|---|---|---|---|---|---|
| Lag Area | Start Area | Across the Area | NC | Northeast | Northwest | 2005–2013 | 2014–2020 | |
| TRA | 0.319 ** (2.11) | −0.036 (−0.57) | −0.019 (−0.07) | −0.252 *** (−3.74) | 0.292 * (1.75) | −0.034 (−0.18) | 0.05 (1.489) | −2.59 *** (−113.376) |
| W × TRA | −0.407 *** (−2.87) | −0.039 (−0.38) | −0.049 (−0.16) | −0.376 *** (−2.85) | −0.278 * (−1.66) | 0.0133 (0.006) | — | — |
| Controlled variable | yes | yes | yes | yes | yes | yes | yes | yes |
| rho | −0.149 (−1.09) | 0.006 (0.04) | −0.593 *** (−3.51) | −0.616 *** (−4.83) | −0.033 (−0.24) | 0.161 (1.08) | 20.29 (314.22) | 436.505 (18.83) |
| N/individual | 48 | 96 | 64 | 80 | 48 | 80 | 210 | 105 |
| R2 | 0.957 | 0.944 | 0.710 | 0.808 | 0.977 | 0.925 | 0.537 | 0.436 |
| Variable | Economic and Industrial Transformation | Transformation of Social Life | Ecological Transformation | |||
|---|---|---|---|---|---|---|
| Main | Wx | Main | Wx | Main | Wx | |
| TRA | 0.329 (0.91) | 0.073 (0.06) | −2.559 *** (−5.92) | −5.283 *** (−2.67) | −0.394 (−0.98) | −0.249 (−0.49) |
| GOV | 0.055 (0.34) | 0.453 (1.14) | −0.090 (−0.60) | 0.390 (1.10) | 0.016 (0.10) | 0.204 (0.50) |
| POP | −0.001 *** (−6.36) | −0.001 *** (−3.10) | −0.001 *** (−5.10) | −0.001 *** (−2.17) | −0.001 *** (−6.19) | −0.001 *** (−2.62) |
| ENR | 41.558 ** (2.11) | 390.727 *** (5.82) | 65.280 *** (3.60) | 465.918 *** (7.14) | 43.040 ** (2.13) | 327.269 *** (4.45) |
| INF | 0.029 *** (2.76) | −0.074 *** (−5.27) | 0.017 * (1.75) | −0.0024 (−0.10) | 0.0245972 ** (2.28) | −0.080 *** (−5.43) |
| SIZ | −3.054 (−1.26) | −71.476 *** (−9.98) | −3.294 (−1.48) | −77.055 *** (−11.37) | −3.548 (−1.47) | −72.782 *** (−10.17) |
| Controlled variable | yes | yes | yes | |||
| rho | −0.749 *** (−3.97) | −1.030 *** (−5.68) | −0.753 *** (−4.05) | |||
| R2 | 0.653 | 0.695 | 0.661 | |||
Disclaimer/Publisher’s Note: The statements, opinions and data contained in all publications are solely those of the individual author(s) and contributor(s) and not of MDPI and/or the editor(s). MDPI and/or the editor(s) disclaim responsibility for any injury to people or property resulting from any ideas, methods, instructions or products referred to in the content. |
© 2024 by the authors. Licensee MDPI, Basel, Switzerland. This article is an open access article distributed under the terms and conditions of the Creative Commons Attribution (CC BY) license (https://creativecommons.org/licenses/by/4.0/).
Share and Cite
Wang, G.; Zhao, B.; Zhao, M. Investigation into the Performance Characteristics of the Organic Dry Farming Transition and the Corresponding Impact on Carbon Emissions Reduction. Agriculture 2024, 14, 459. https://doi.org/10.3390/agriculture14030459
Wang G, Zhao B, Zhao M. Investigation into the Performance Characteristics of the Organic Dry Farming Transition and the Corresponding Impact on Carbon Emissions Reduction. Agriculture. 2024; 14(3):459. https://doi.org/10.3390/agriculture14030459
Chicago/Turabian StyleWang, Guofeng, Baohui Zhao, and Mengqi Zhao. 2024. "Investigation into the Performance Characteristics of the Organic Dry Farming Transition and the Corresponding Impact on Carbon Emissions Reduction" Agriculture 14, no. 3: 459. https://doi.org/10.3390/agriculture14030459