1. Introduction
Industrial hemp refers to an annual herbaceous plant of the cannabis genus with a tetrahydrocannabinol (THC) content of less than 0.3%, making it devoid of significant psychoactive properties [
1,
2,
3]. Due to its low THC content, industrial hemp lacks drug utility but possesses excellent fiber characteristics, leading to widespread legal cultivation in various regions worldwide. It serves as a crucial raw material in industries such as textiles, papermaking, chemicals, pharmaceuticals, and military equipment [
4,
5,
6,
7,
8].
Due to the thick stalks of industrial hemp, the toughness and strength of hemp fibers are high, leading to significant cutting resistance for blades and low cutting stubble quality. This characteristic poses a challenge for the mechanical harvesting of industrial hemp. Therefore, achieving high-quality and low-resistance harvesting is a critical issue that urgently needs to be addressed in the development process of industrial hemp harvesting machines.
In response to the challenges in cutting industrial hemp and similar fiber crops, researchers globally have focused on enhancing blade cutting performance. Dauda S. M. conducted experiments using a serrated disc cutting test bed, exploring the impact of cutting speed on torque and cutting power consumption for jute stalks at different moisture levels. They established regression equations predicting the relationship between cutting torque, cutting power, stalk diameter, and cutting speed [
9]. Liu Z. P., based on the physical-mechanical properties of ramie stalks, developed a finite element numerical simulation model for ramie stalk cutting. The study analyzed the influence of various factors (such as the sliding cutting angle, blade tilt angle, blade rotation speed, and forward speed) on the maximum cutting force under different conditions [
10]. Shen C. et al. conducted cutting experiments on ramie stalks using a self-developed cutting test bed, studying the impact of different blade geometric parameters (blade length, blade type), cutting speed, and stalk feeding speed on cutting performance (cutting power consumption, cutting quality, and overall rating). They determined the optimal parameter combination, providing a theoretical basis for the selection of cutting blade structure and motion parameters for ramie harvesters [
11].
Tian K. P. et al. used the longicorn, a common pest with excellent biting and cutting performance, as a biomimetic model. They designed biomimetic blades for industrial hemp harvesters based on the structural characteristics of the woodworm’s mandibles. Comparative experiments were conducted between biomimetic blades and conventional rice and wheat harvester blades for single stalk cutting performance. The results showed that compared to conventional blades, biomimetic blades reduced average maximum cutting force and cutting power consumption by 7.4% and 8.0%, respectively, and produced a more even stubble cut. The study demonstrated the superior cutting performance of biomimetic blades [
12].
Addressing the unclear dynamic cutting performance and optimization potential of the previously developed biomimetic industrial hemp blades in practical conditions, Tian K. P. et al. utilized numerical simulation techniques to investigate the impact of biomimetic blade parameters, such as tooth spacing, tooth inclination angle, and speed ratio coefficient, on cutting energy consumption. The study determined the optimal structural and motion parameter combination for biomimetic blades and further validated the model’s reliability [
4].
Similar research has been conducted in the context of stalk cutting for sugarcane [
13,
14,
15,
16,
17], cotton stalks [
18,
19], tomatoes [
20], mulberry branches [
21], and wild chrysanthemums [
22].
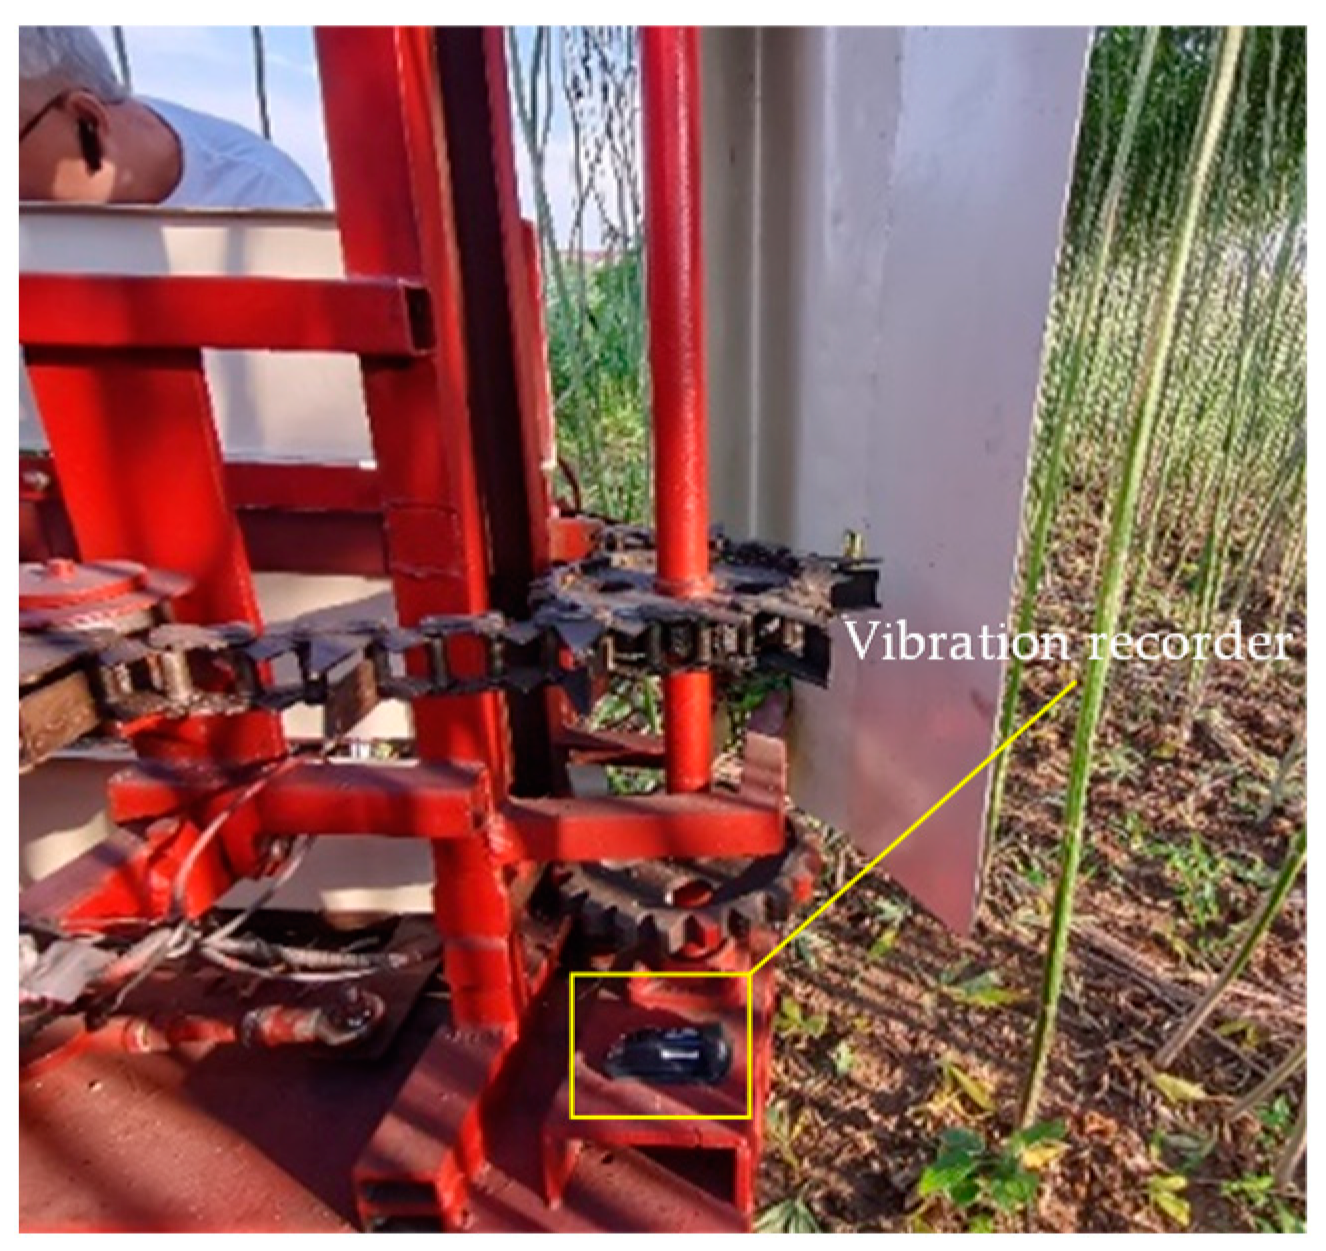
During field operations of industrial hemp harvesters, in addition to the lateral reciprocating cutting motion and the random forward movement of the cutting device, the vibration induced by the ground roughness of the hemp field and the motion of machine working components were an other important forms of motion for the blades (The overall structure of the industrial hemp harvester and the detailed structure of the cutting unit, as well as the power transmission diagram, are shown in Figures 1 and 2 of Ref. [
4], respectively). Existing relevant research primarily focuses on the impact of factors, such as the type of cutting blades, blade structural parameters, cutting speed, and forward speed on cutting performance. However, the influence of harvester header vibration on cutting performance remains unclear, and research in this area is currently lacking.
To address the aforementioned issues, this study built upon previous research and conducted data collection and processing of header vibration during field operations of industrial hemp harvesters. The vibration spectrum data were obtained. Subsequently, utilizing the typical frequencies and amplitudes of the header vibration as experimental factors, numerical simulation cutting experiments under vibration conditions were carried out. This aimed to quantitatively investigate the impact of blade vibration parameters (frequency and amplitude) on stalk cutting quality, cutting energy consumption, and overall cutting performance. The goal was to provide insights into achieving low energy consumption and high-quality cutting in industrial hemp harvesters.
3. Numerical Simulation Model Construction for Stalk Cutting
The numerical simulation model construction process for blade cutting of hemp stalks is as follows: Based on the measured dimensions of industrial hemp stalks (measured by randomly selecting 30 industrial hemp stalks and measuring the diameter of the stalks at a cutting section, specifically 10 cm above the root, obtaining an average diameter of 18 mm for the hemp stalks), a model of industrial hemp stalks was created in PTC Creo. Different structural parameter models of biomimetic blades were designed and constructed, and the biomimetic blades were assembled with the stalk model according to the actual cutting relationship. Once the cutting relationship was determined, the blade-stalk three-dimensional model was imported into the finite element analysis software Abaqus through an intermediate format. Following the experimental requirements, the model was defined with material properties, component assembly, creation of analysis steps, definition of loads and boundary conditions, mesh partitioning, computation submission, and other operations for the blade cutting numerical simulation experiment analysis. In defining the material properties of the model, the blade was set as a rigid body, and the stem was set as a flexible body. Since the material properties of industrial hemp stalks follow a transversely isotropic constitutive relationship, their engineering constants can be obtained from the literature [
23]. In addition, due to the high similarity between the material characteristics of industrial hemp stalks and wood, values for the transverse failure strength of industrial hemp stalks can be obtained by referring to the transverse strength relationship of wood [
24]. The specific parameters are shown in
Table 2.
Ref. [
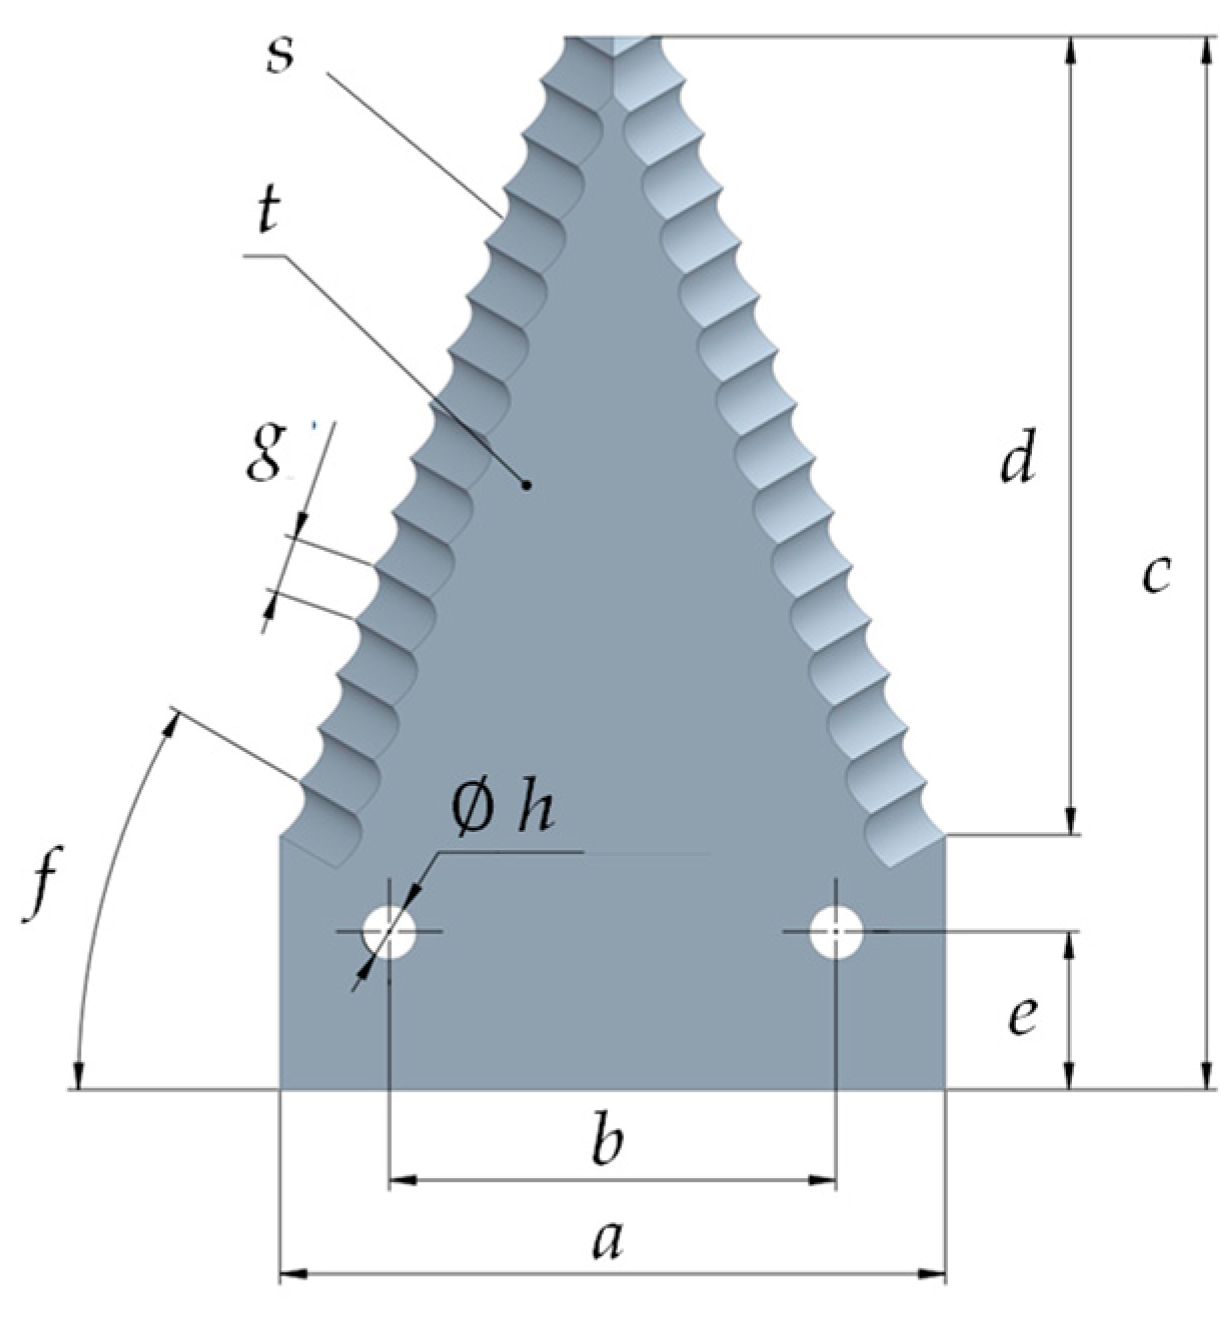
4] conducted experiments and parameter optimization research on the dynamic cutting performance of industrial hemp harvester’s beetle-inspired blades but did not consider the impact of cutting platform vibration on cutting performance. In this study, based on the stalk cutting numerical simulation model constructed in that reference, an additional vertical ground-direction vibration excitation was applied to study the effect of vibration on cutting performance. The model used in this study employed biomimetic blades with a pitch of 6.6 mm and a pitch angle of 30°. The cutting speed was set at 1.5 m/s, and the forward speed was set at 0.93 m/s based on the optimal blade structure and motion parameters obtained in preliminary research. The biomimetic blade structure is illustrated in
Figure 5.
4. Quadratic Orthogonal Rotational Combination Experiment and Analysis
4.1. Evaluation Indicators
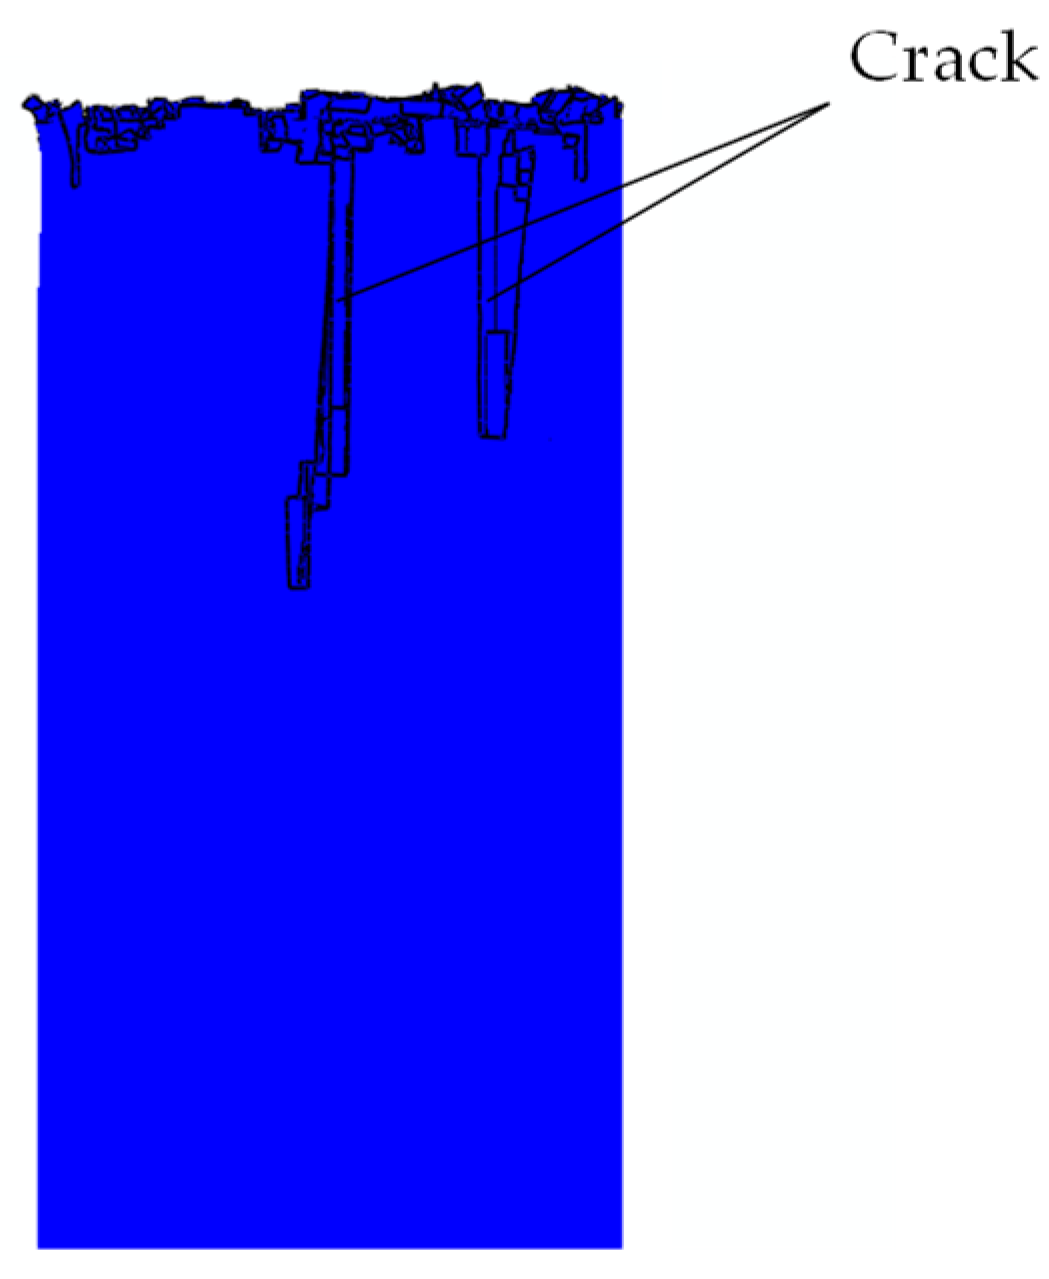
This study primarily investigated the impact of vibration on the cutting performance of blades. The cutting performance of the blades was mainly reflected in the quality of stubble after cutting and the dynamic performance of the blades. Therefore, the evaluation indicators were the stubble quality of industrial hemp and the energy consumption of cutting a single stalk.
The stubble quality of the stalk is characterized by the total length of all cracks on the cut hemp stalks, with a smaller sum indicating a better cutting quality. The numerical simulation results for stalk stubble and cracks are shown in
Figure 6.
The cutting energy consumption is characterized by the energy consumed by the blade in cutting a single stalk under vibration conditions. The method for measuring cutting energy consumption using Abaqus numerical simulation is as follows: Reference points for driving constraints for the left and right blades are separately established as sets set-1 and set-2. In the output of the time history during the analysis steps, forces acting on these two sets are specified for output. After submitting the job and completing the computation, the force time curves and data at the two driving reference points can be obtained in the post-processing ODB file.
The formulas for calculating stubble quality (total crack length) and cutting energy consumption are as follows:
where:
Y1 is the total crack length (stubble quality) in mm.
CP is the length of the p-th crack in mm.
Y2 is the cutting energy consumption in mJ.
FUq and FLq are the cutting forces corresponding to the upper and lower blades at the q-th sampling point in N.
vs is the cutting speed of the blade in mm/s.
Δt is the time interval between sampling frequencies in seconds.
4.2. Determination of Experimental Factor Levels and Coding Table
During the harvester’s field operation, vibration frequency and amplitude occur simultaneously. To investigate the effects of vibration frequency, amplitude, and their interaction on stubble quality and cutting energy consumption, this study employed the method of quadratic orthogonal rotational combination experiments [
25,
26].
According to the principles of quadratic orthogonal rotational combination experiment design, the number of experiments
n satisfies the following formula:
here,
mc is the number of two-level experiments in the orthogonal experiment. If it is fully implemented, then
mc = 2
m; if only a part of the two-level experiments is conducted (1/2 or 1/4 implementation) based on the orthogonal table, then
mc = 2
m−1 or
mc = 2
m−2. In this experiment, full implementation was adopted, so
mc = 4.
p is the number of experimental factors, and in this study, p = 2; 2p is the number of experimental points distributed on a sphere of diameter γ, where γ is the star-arm value. When the experiment is fully implemented, = 1.414.
mo is the number of zero-level experiments. The choice of mo in the quadratic rotation combination design is free. Even if the experiment near the center point is not conducted, it will not affect the rotational properties, but the region near the center point is often the area of interest. As numerical simulation results have uniqueness under the same parameters, mo = 1 was chosen in this experiment.
In summary, n experimental points are distributed on three spheres with unequal radii. Among them, mc points are distributed on a sphere with a radius of p; 2p points are distributed on a sphere with a radius of γ; mo points are concentrated on a sphere with a radius of zero. Thus, it satisfies both rotational and non-degeneracy properties.
When conducting the quadratic orthogonal rotational combination design, the following rules can be used for coding:
Assume that the range of the factors is:
Now, let the coding values of
x1j and
x2j be −
γ and
γ, respectively. Then, the zero level is:
So, the coded values −1 and 1 correspond to: and .
Thus, natural variables with units are transformed into dimensionless normalized variables
xj. As mentioned in
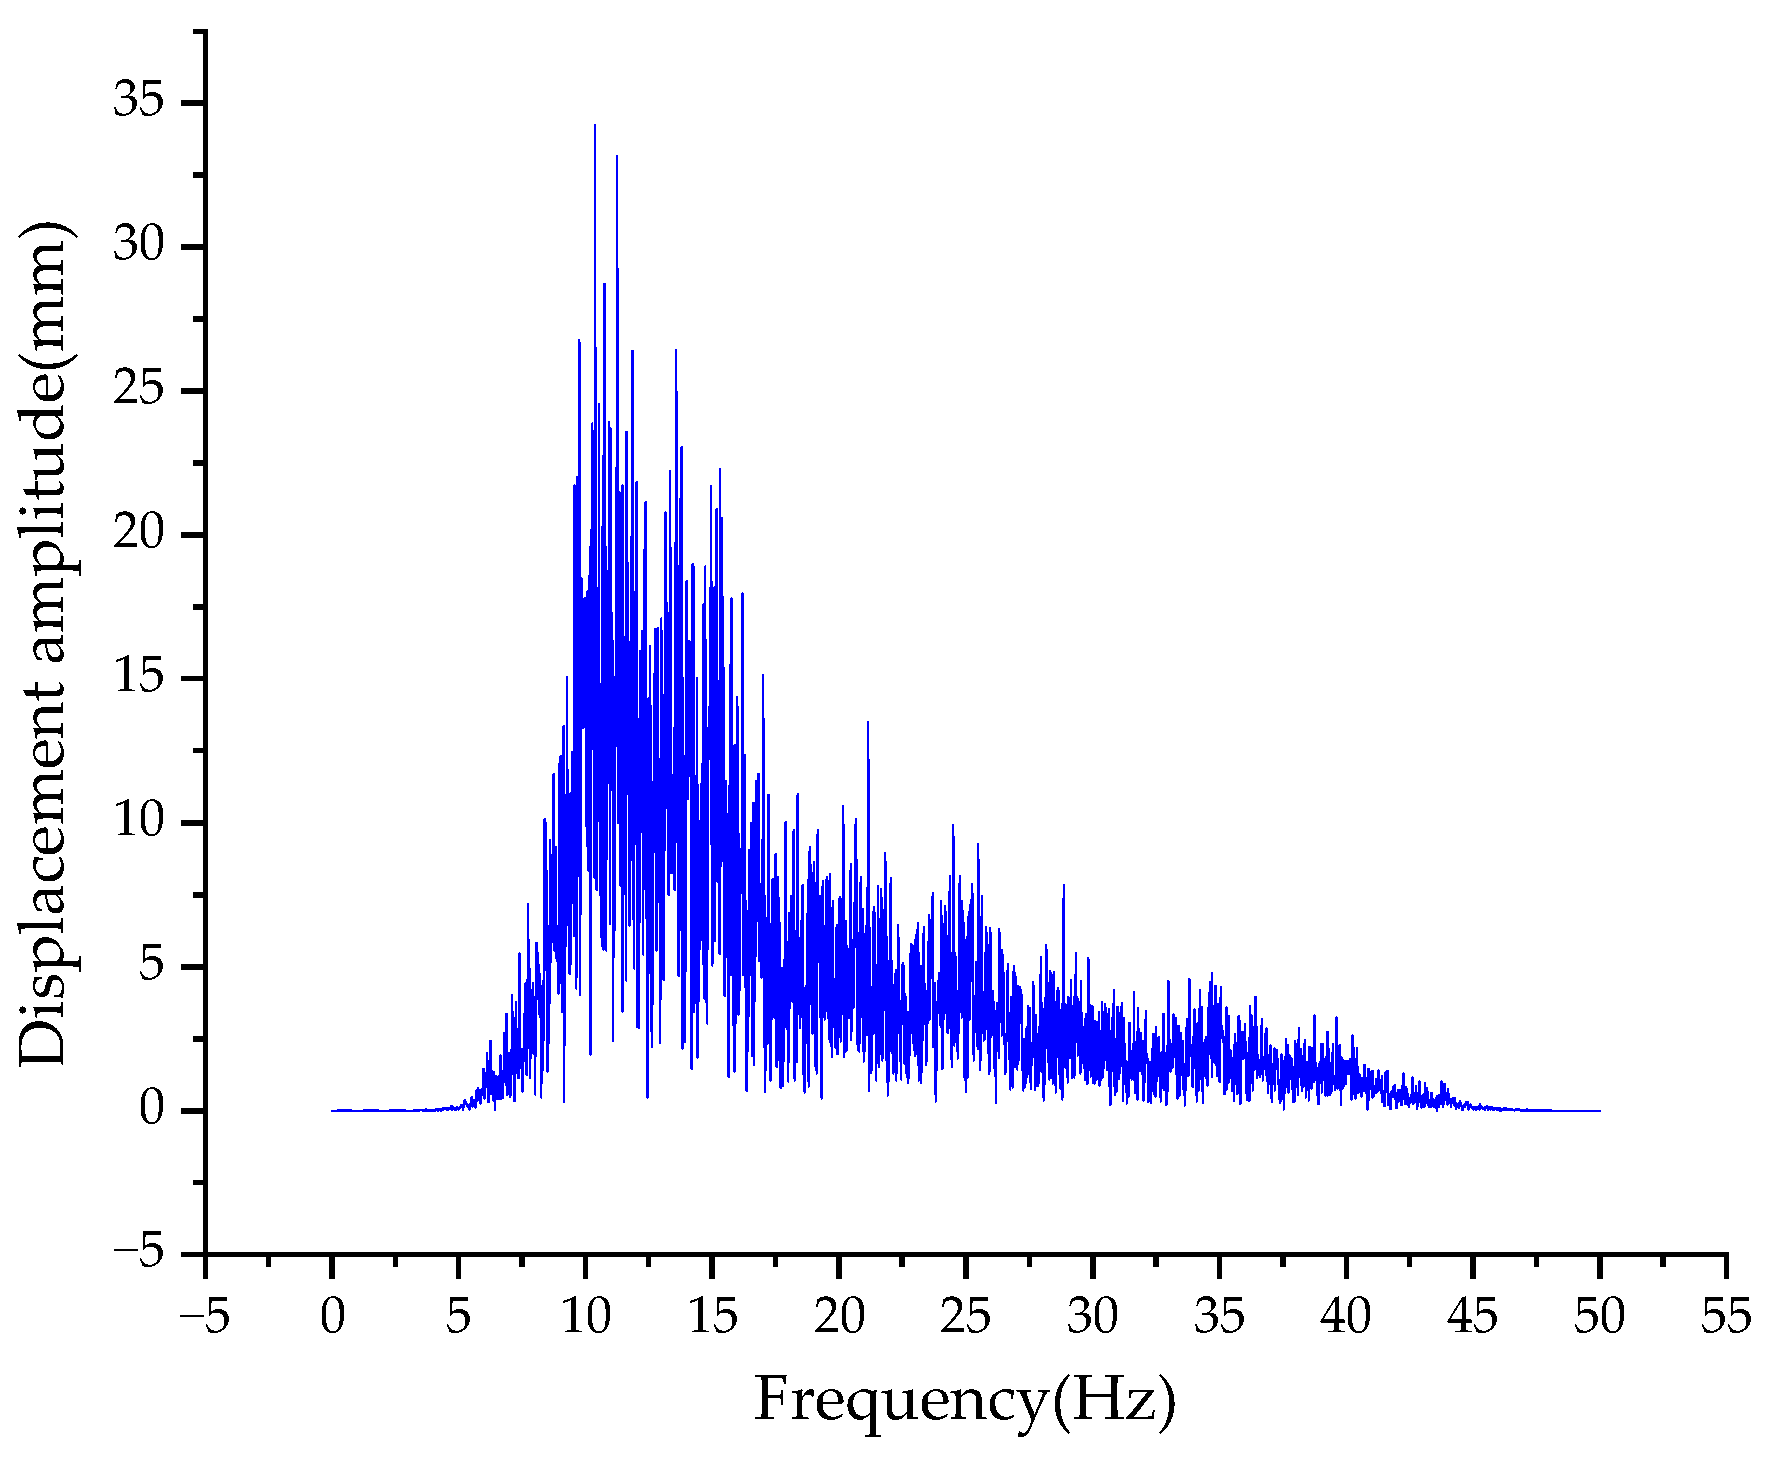
Section 2.2, the excitation frequency of the hemp field is mainly concentrated in the range of 5–45 Hz, and the displacement amplitude range is 0–35 mm. Based on the above range of factor values, the coding values of factor levels for the quadratic orthogonal rotational combination experimental design can be compiled (see
Table 3).
4.3. Experiment and Results Analysis
4.3.1. Experiment and Results
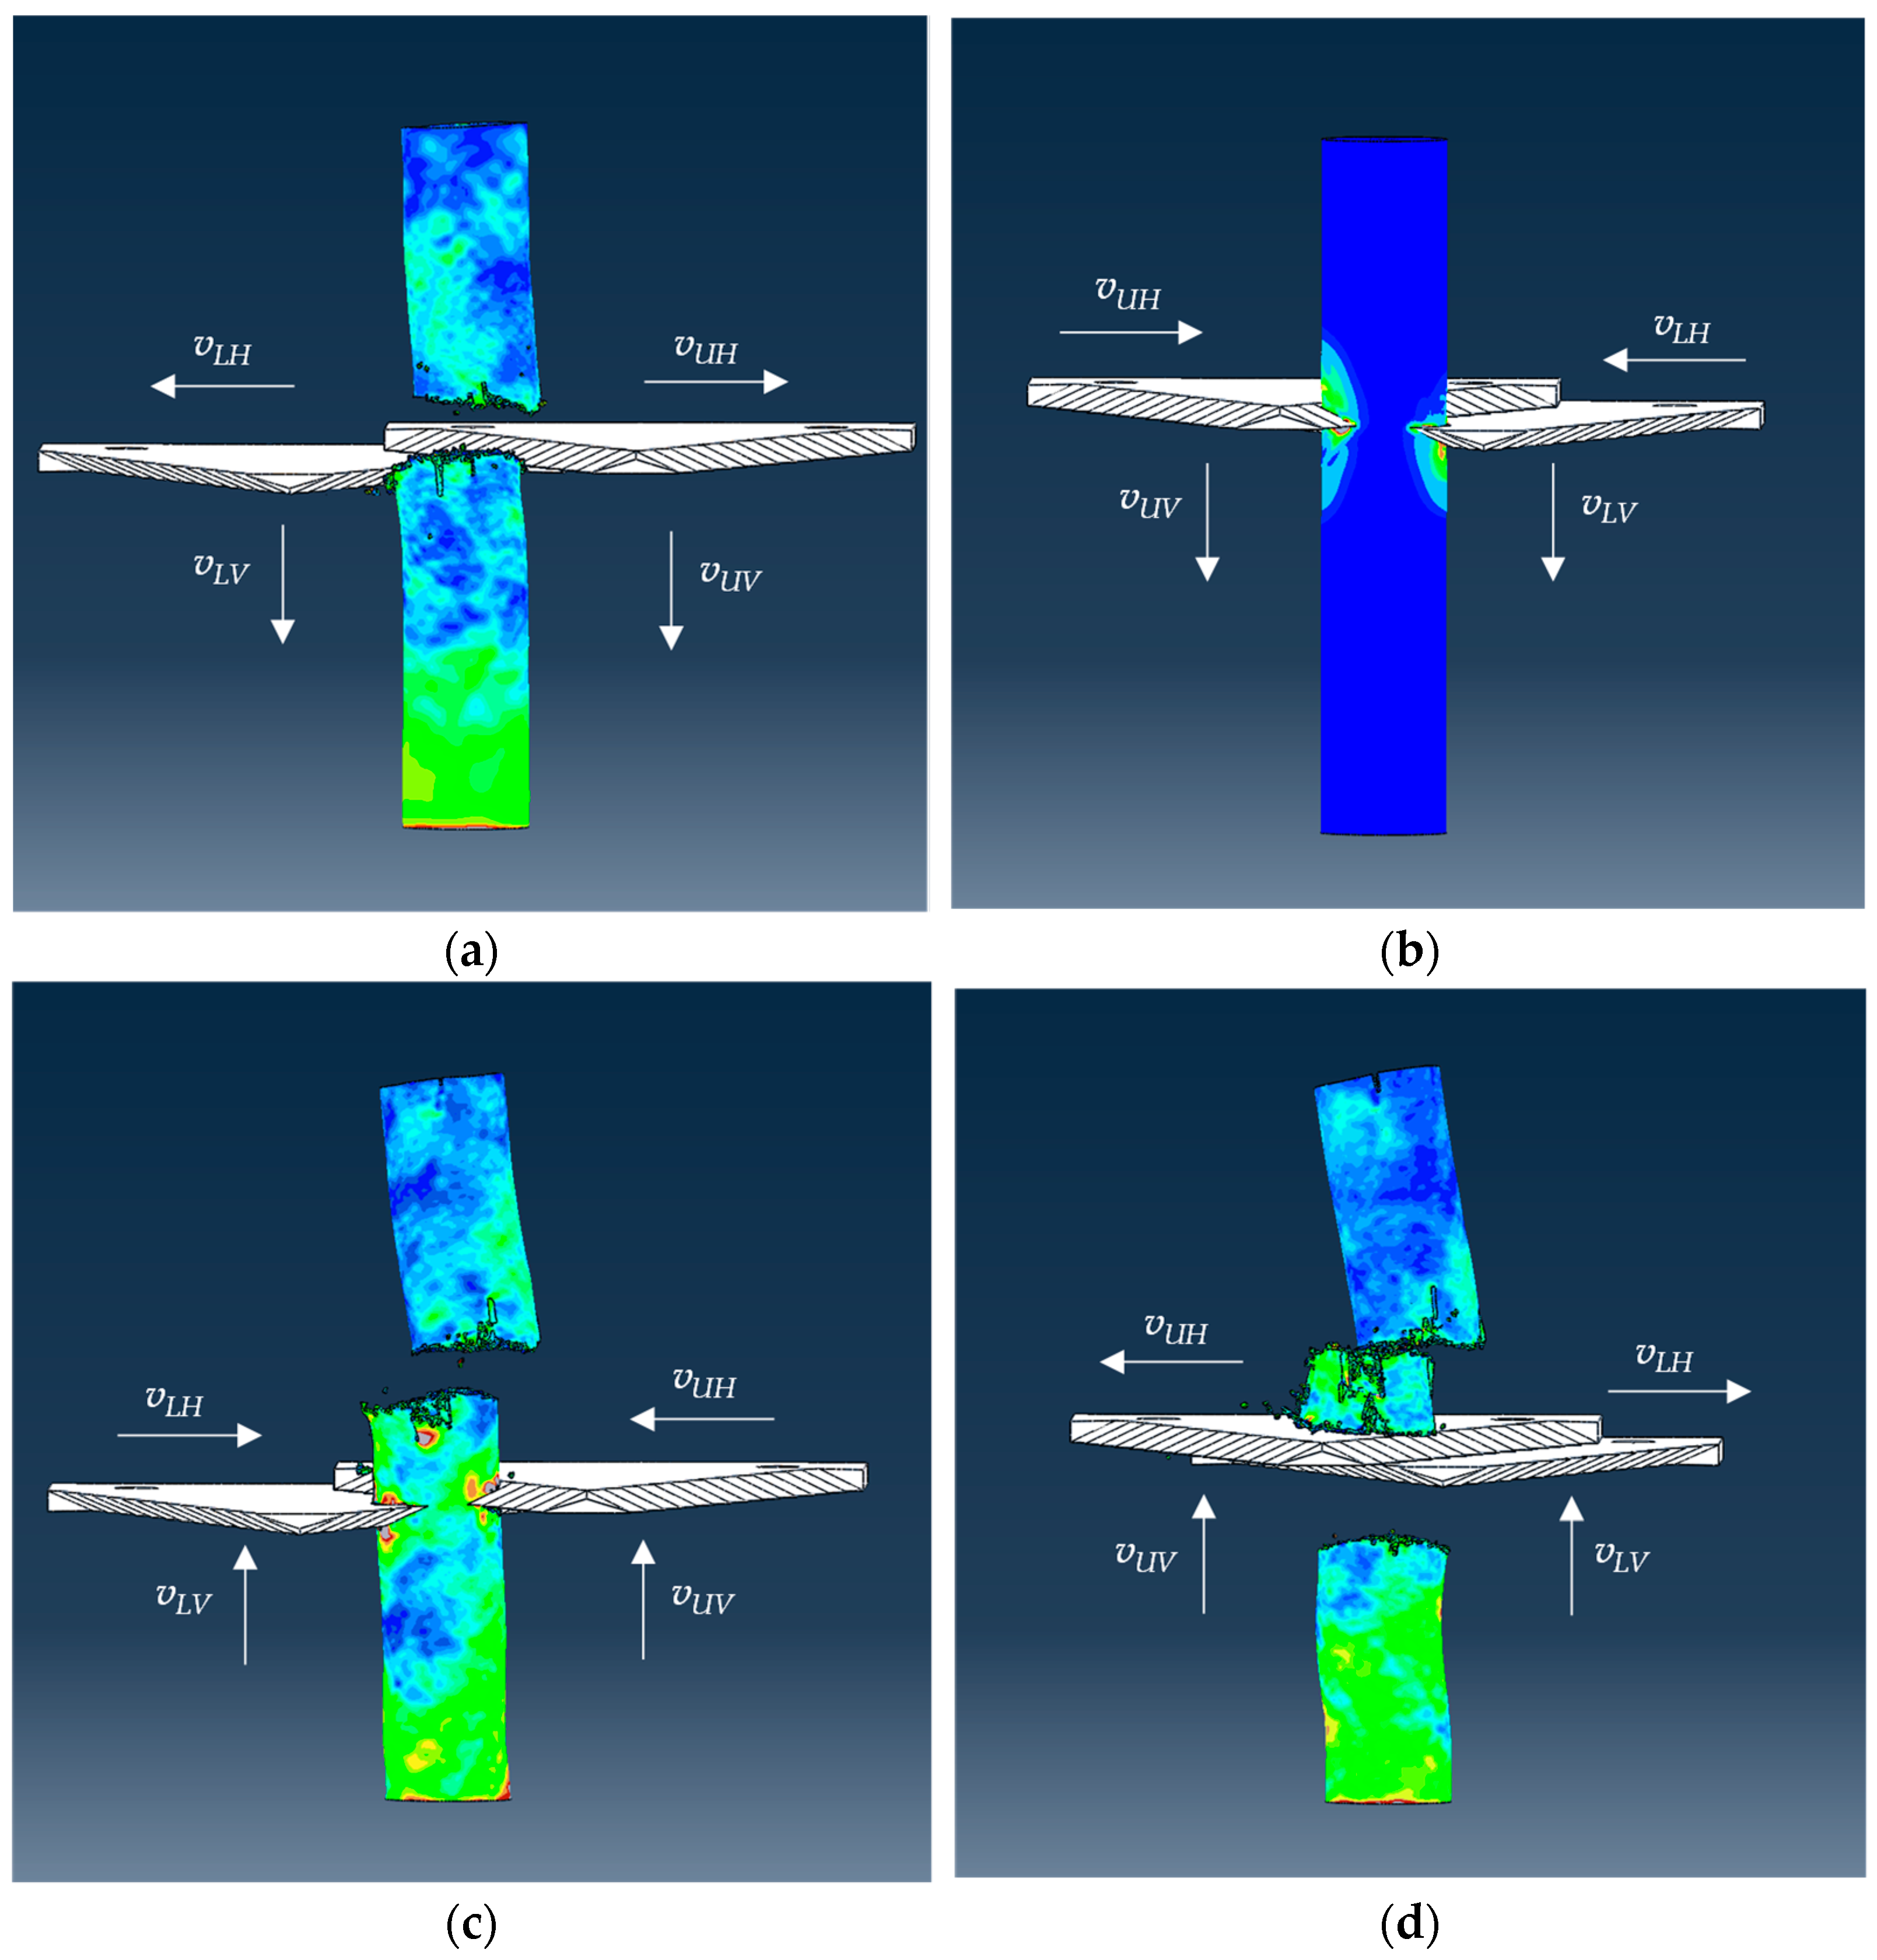
In the cutting process, while considering vibration conditions, the upper and lower blades, in addition to making horizontal reciprocating cutting motions, also underwent vertical reciprocating motions due to vibration excitation. The cutting process is illustrated in
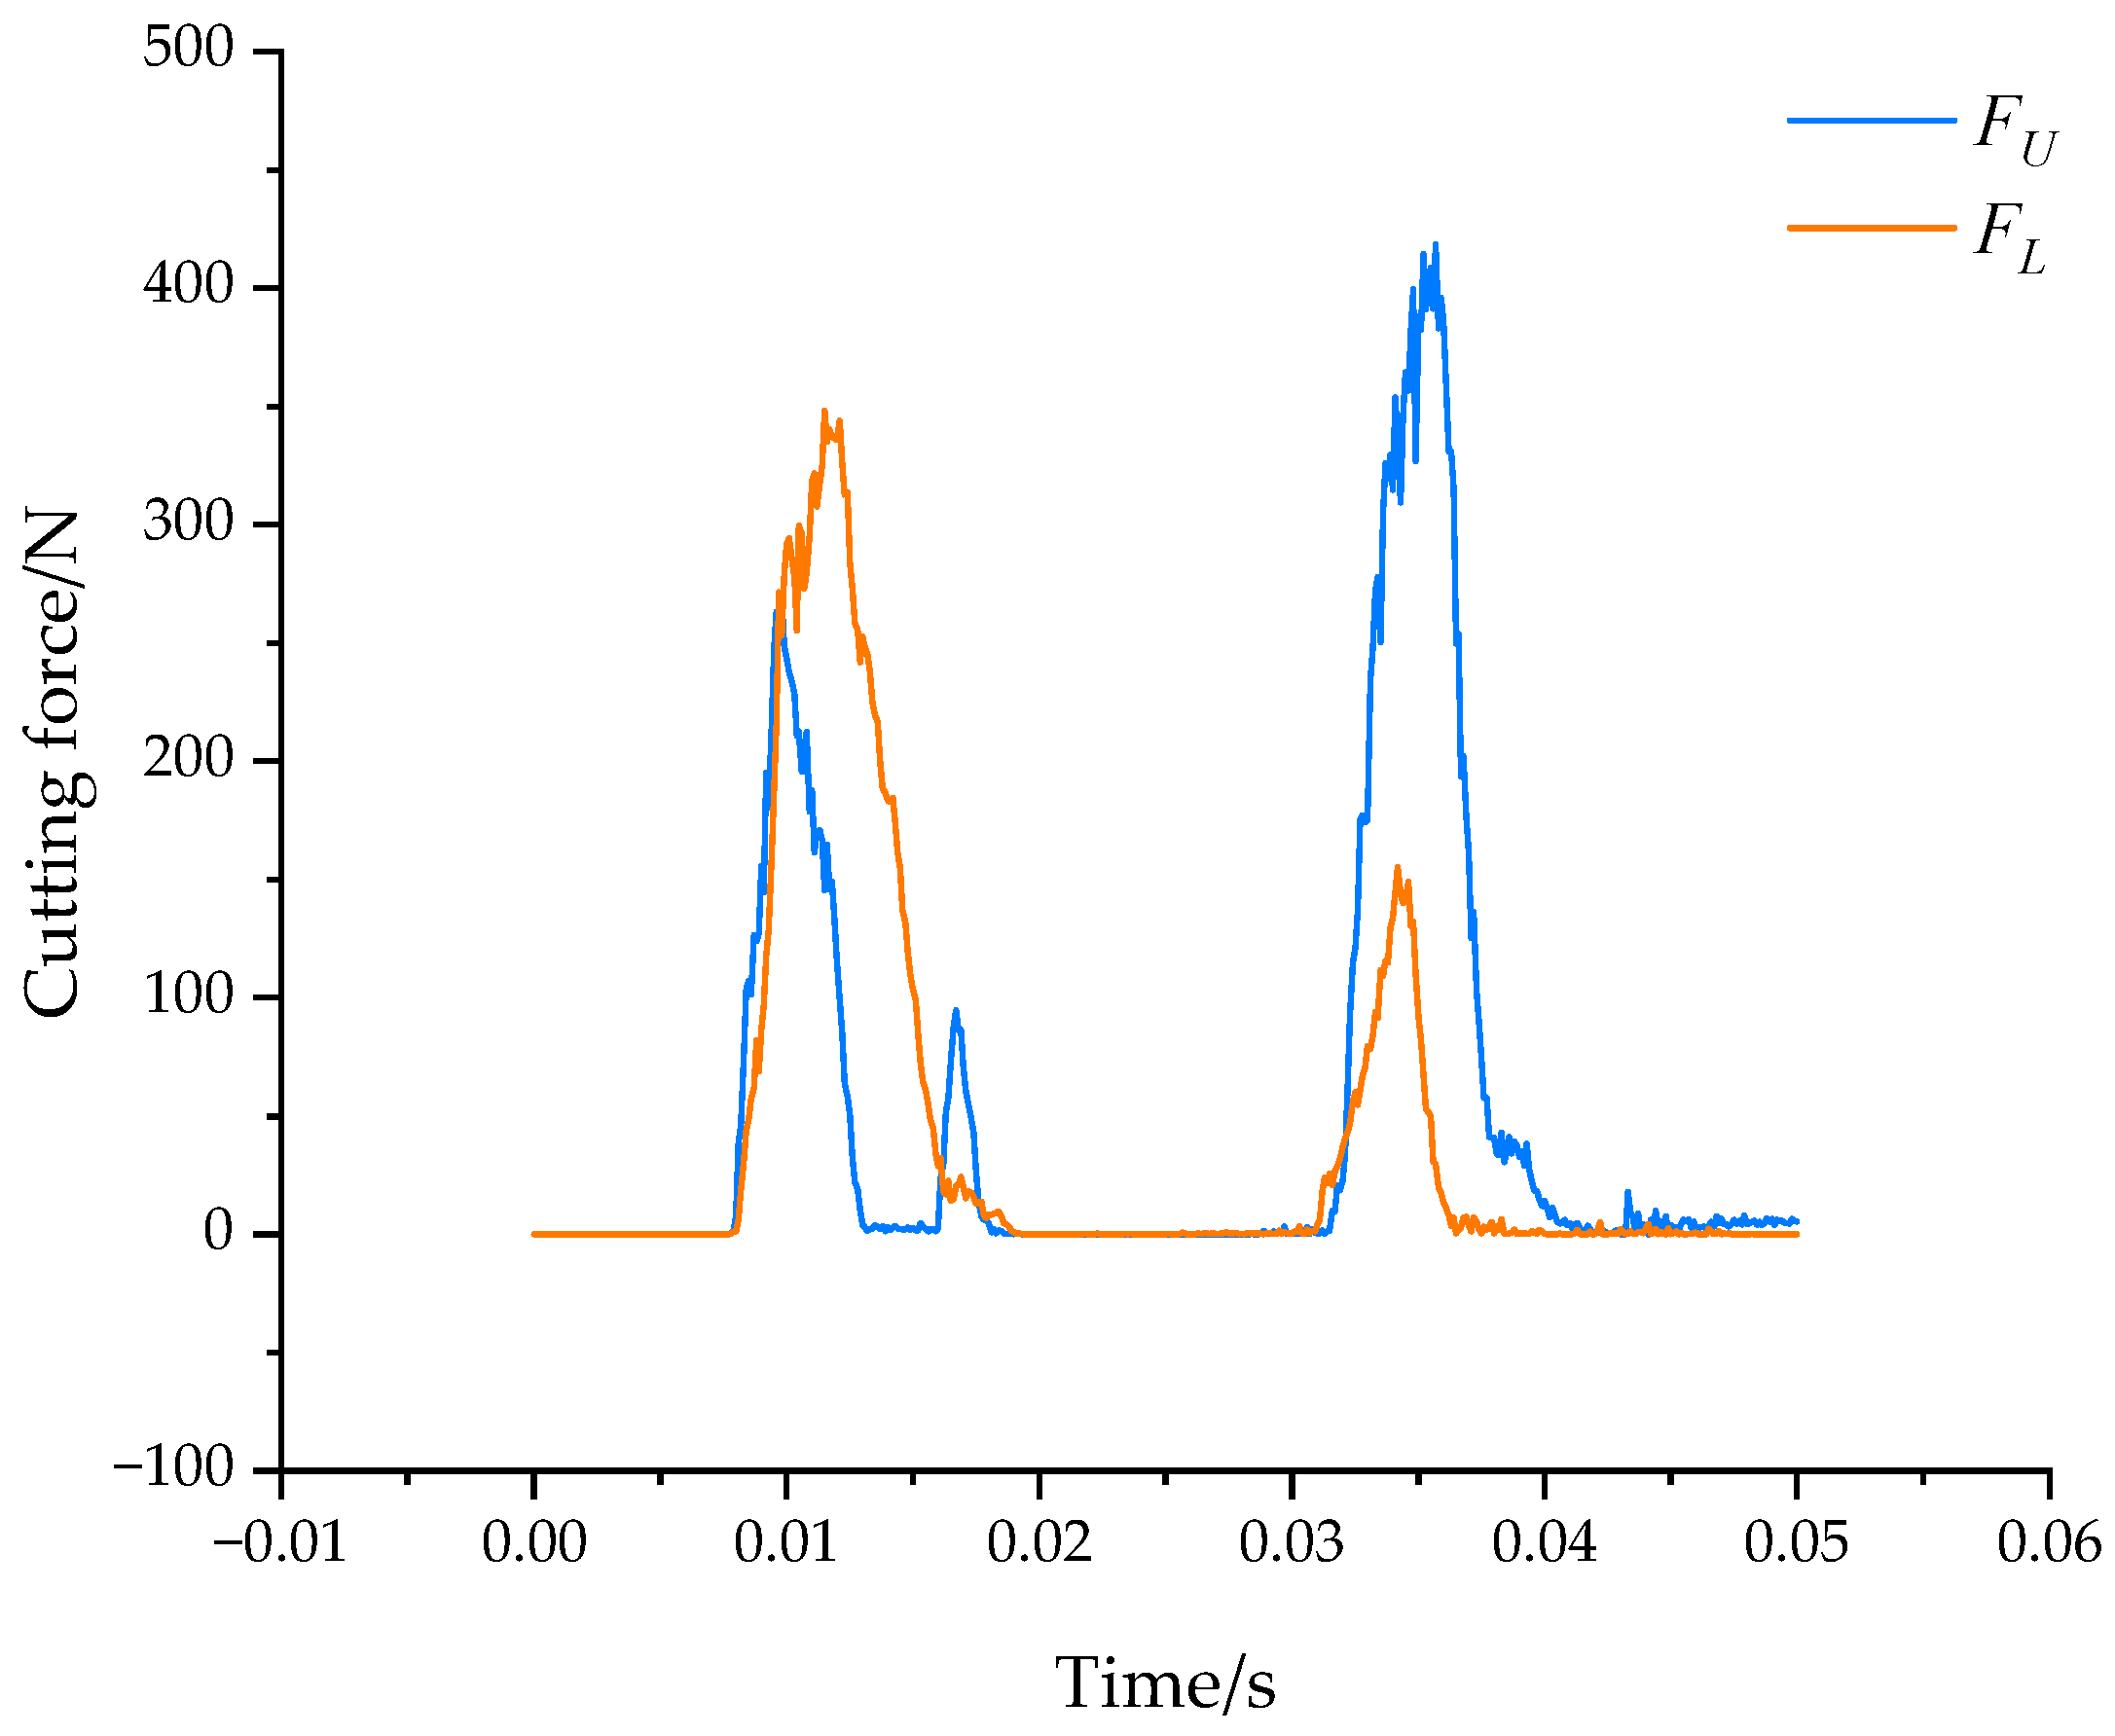
Figure 7. The curve depicting the variation of cutting reaction forces on the upper and lower blades during the cutting of stems by blade is shown in
Figure 8.
The stalk cutting process depicted in
Figure 7 revealed that, while the upper and lower blades were horizontally cutting the stalk, they also underwent simultaneous vertical reciprocating motion under the influence of vibration excitation. As shown in
Figure 7a,b, during the horizontal cutting of the stalk, the blades moved downward, exerting compressive forces on the bottom of the stalk, causing stubble splitting. In the return phase of the horizontal reciprocating cutting and vibration motion, the cutting position of the stalk was located below the previous cutting position. At that point, the upper and lower blades moved upward while cutting, applying upward tensile forces to the bottom of the stalk, as illustrated in
Figure 7c,d.
The variation curve of cutting reaction forces for the upper and lower blades, as shown in
Figure 8, reveals two peaks in the cutting reaction forces of the upper and lower blades. This is attributed to the influence of vibration factors, leading to a secondary cut of the stems by the blades. The cutting energy consumption of the stems can be determined by obtaining the cutting reaction force data and applying Formula (2).
Experimental design and analysis were conducted using Design-Expert Software, and the experimental plan and results are presented in
Table 4.
4.3.2. Regression Model and Analysis of Variance
The response analysis of the experimental results yields regression model equations for crack length (
Y1) and cutting energy consumption (
Y2):
Further variance analysis and fit statistics for the regression models are presented in
Table 5 and
Table 6.
The results in
Table 5 show that the regression models for crack length and cutting energy consumption have significance levels (
p-values) less than 0.05, indicating the models’ significance. Additionally, from
Table 6, the adjusted R
2 values for the models are 0.94 and 0.91, signifying high fitting accuracy. The signal-to-noise ratios (Adeq Precision) for the indicators are 13.52 and 11.27, greater than the critical value of 4, suggesting sufficient model signals. In summary, these regression models are significant, well-fitted, and reliable for predicting variations in crack length and cutting energy consumption.
The analysis of significance for various factors based on the analysis of variance indicates that for crack length (Y1), amplitude (B) has a highly significant effect (p < 0.01), and the interaction effect (AB) has a significant impact (p < 0.05). For cutting energy consumption (Y2), the frequency (A), the interaction effect (AB), and amplitude (B) all have significant impacts (p < 0.05), with amplitude (B) having a highly significant effect (p < 0.01).
At a significance level of
α = 0.01, insignificant terms were eliminated, and the simplified regression model equations are:
4.3.3. Analysis of Factor Interaction Effects on Indicators
From the above analysis of variance, it is evident that the interaction effect between frequency (
A) and amplitude (
B) significantly impacts the model. Therefore, the interaction between factors
A and
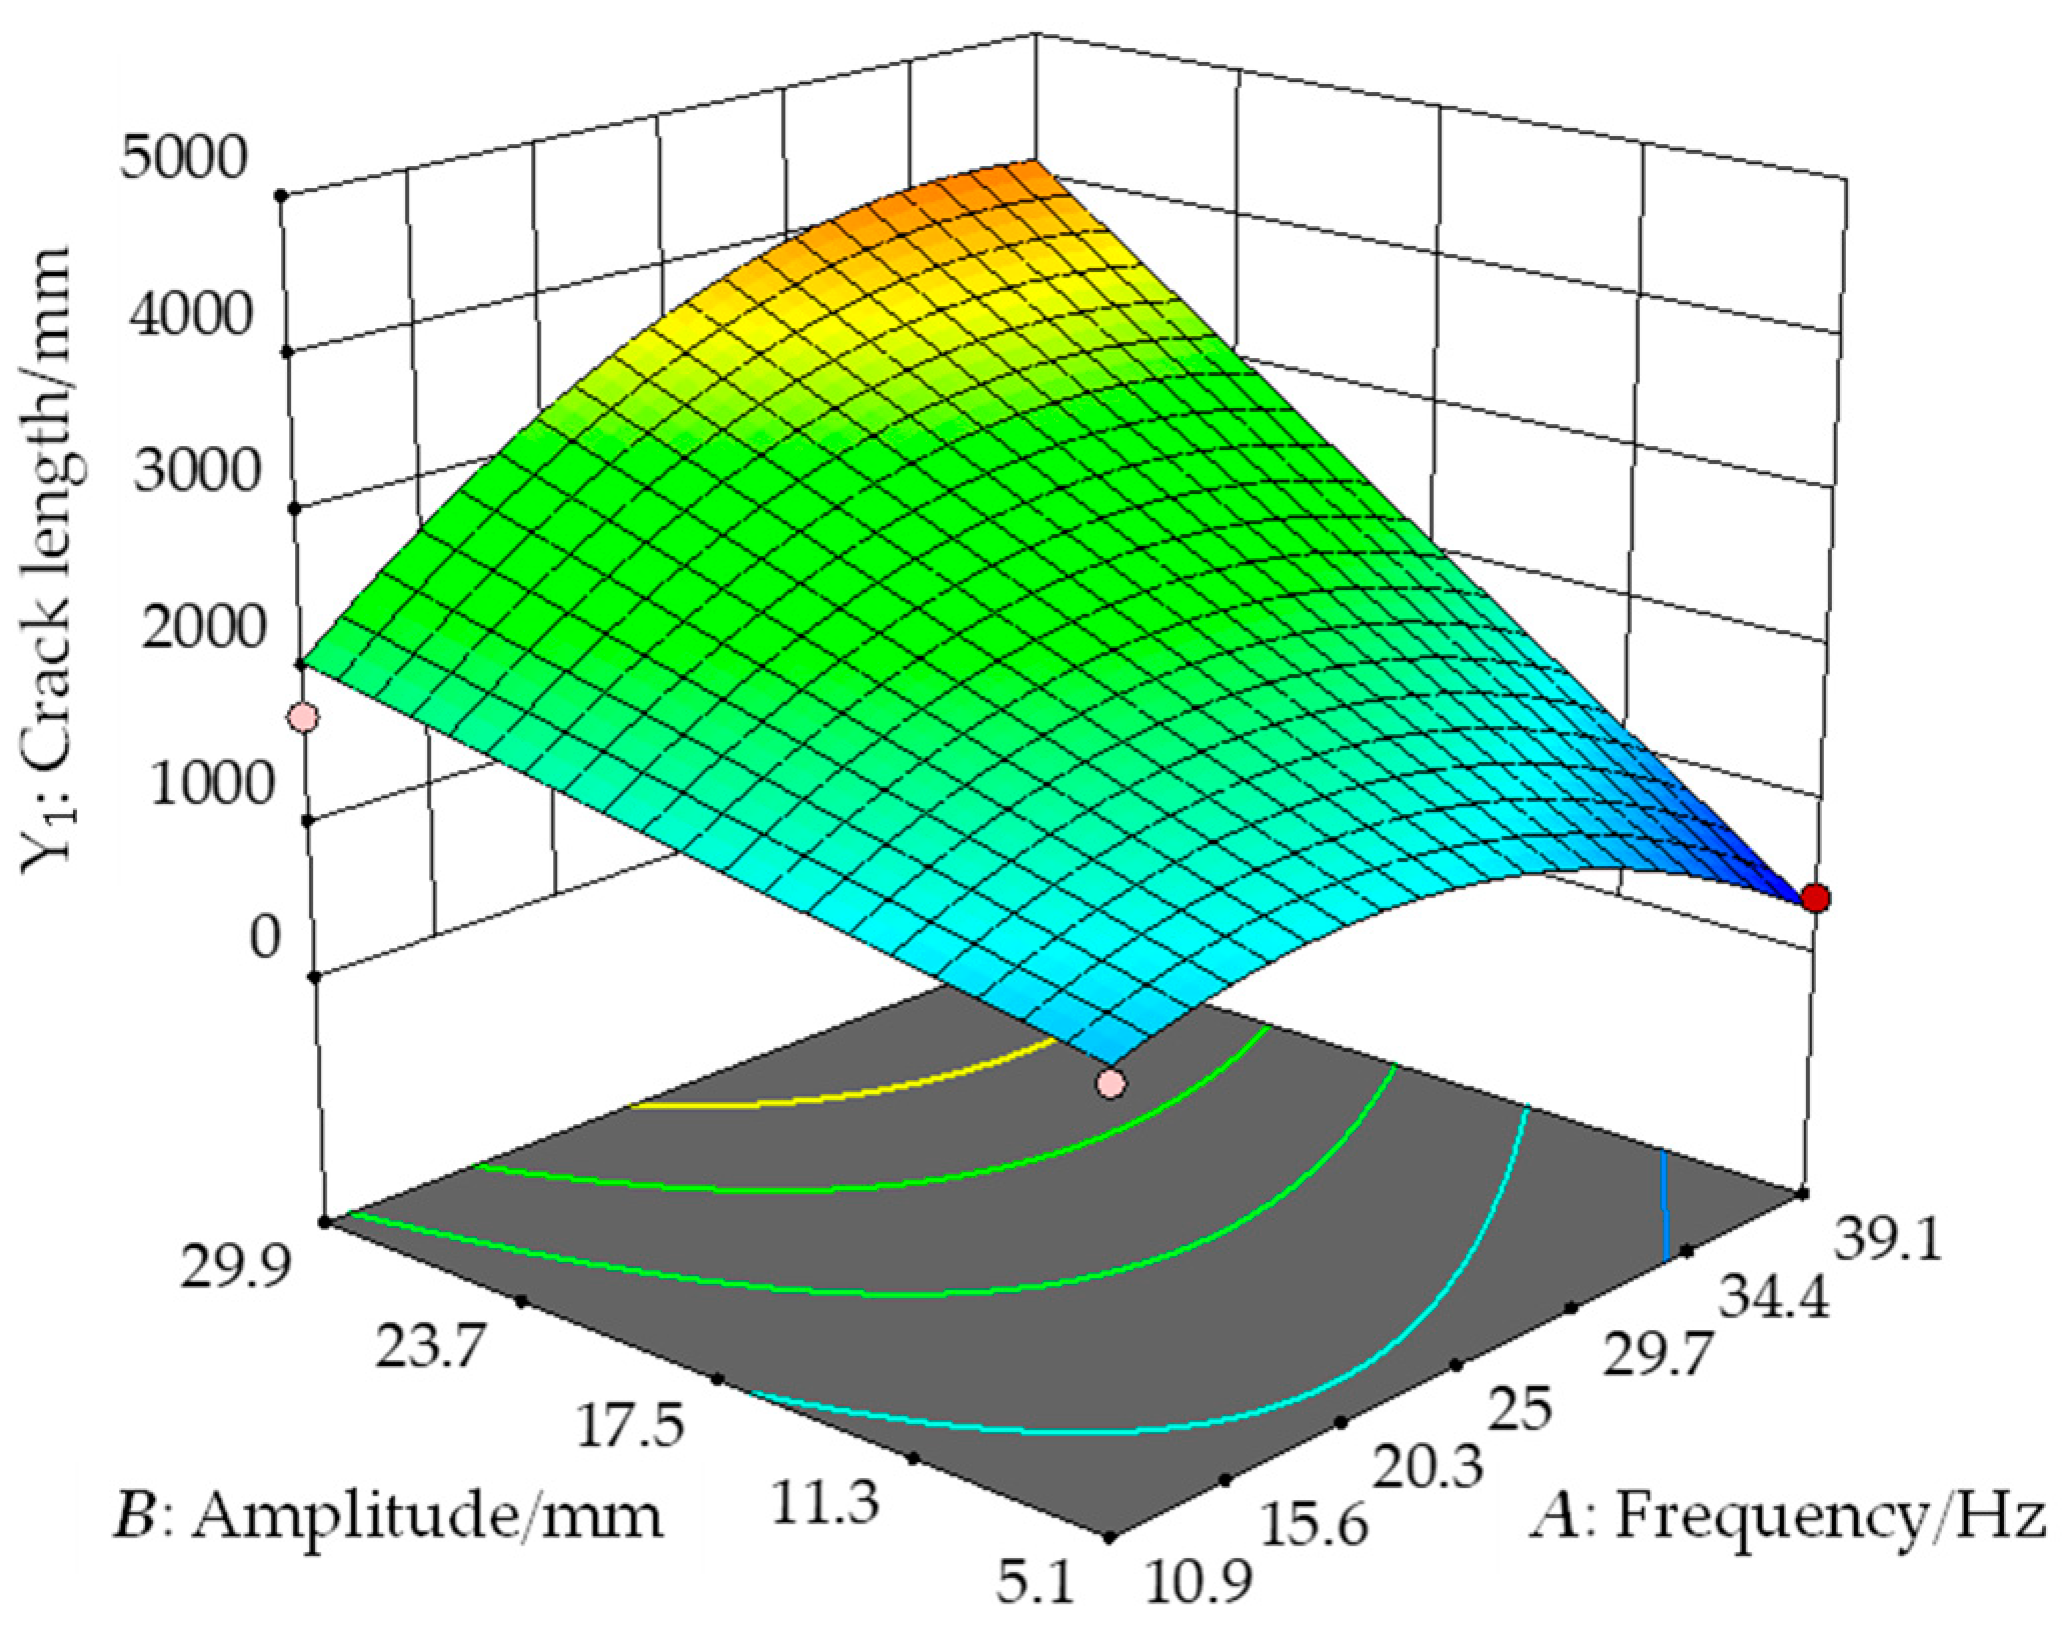
B cannot be ignored. Utilizing Design Expert, response surface plots illustrating the interaction effects of these two factors were created (as shown in
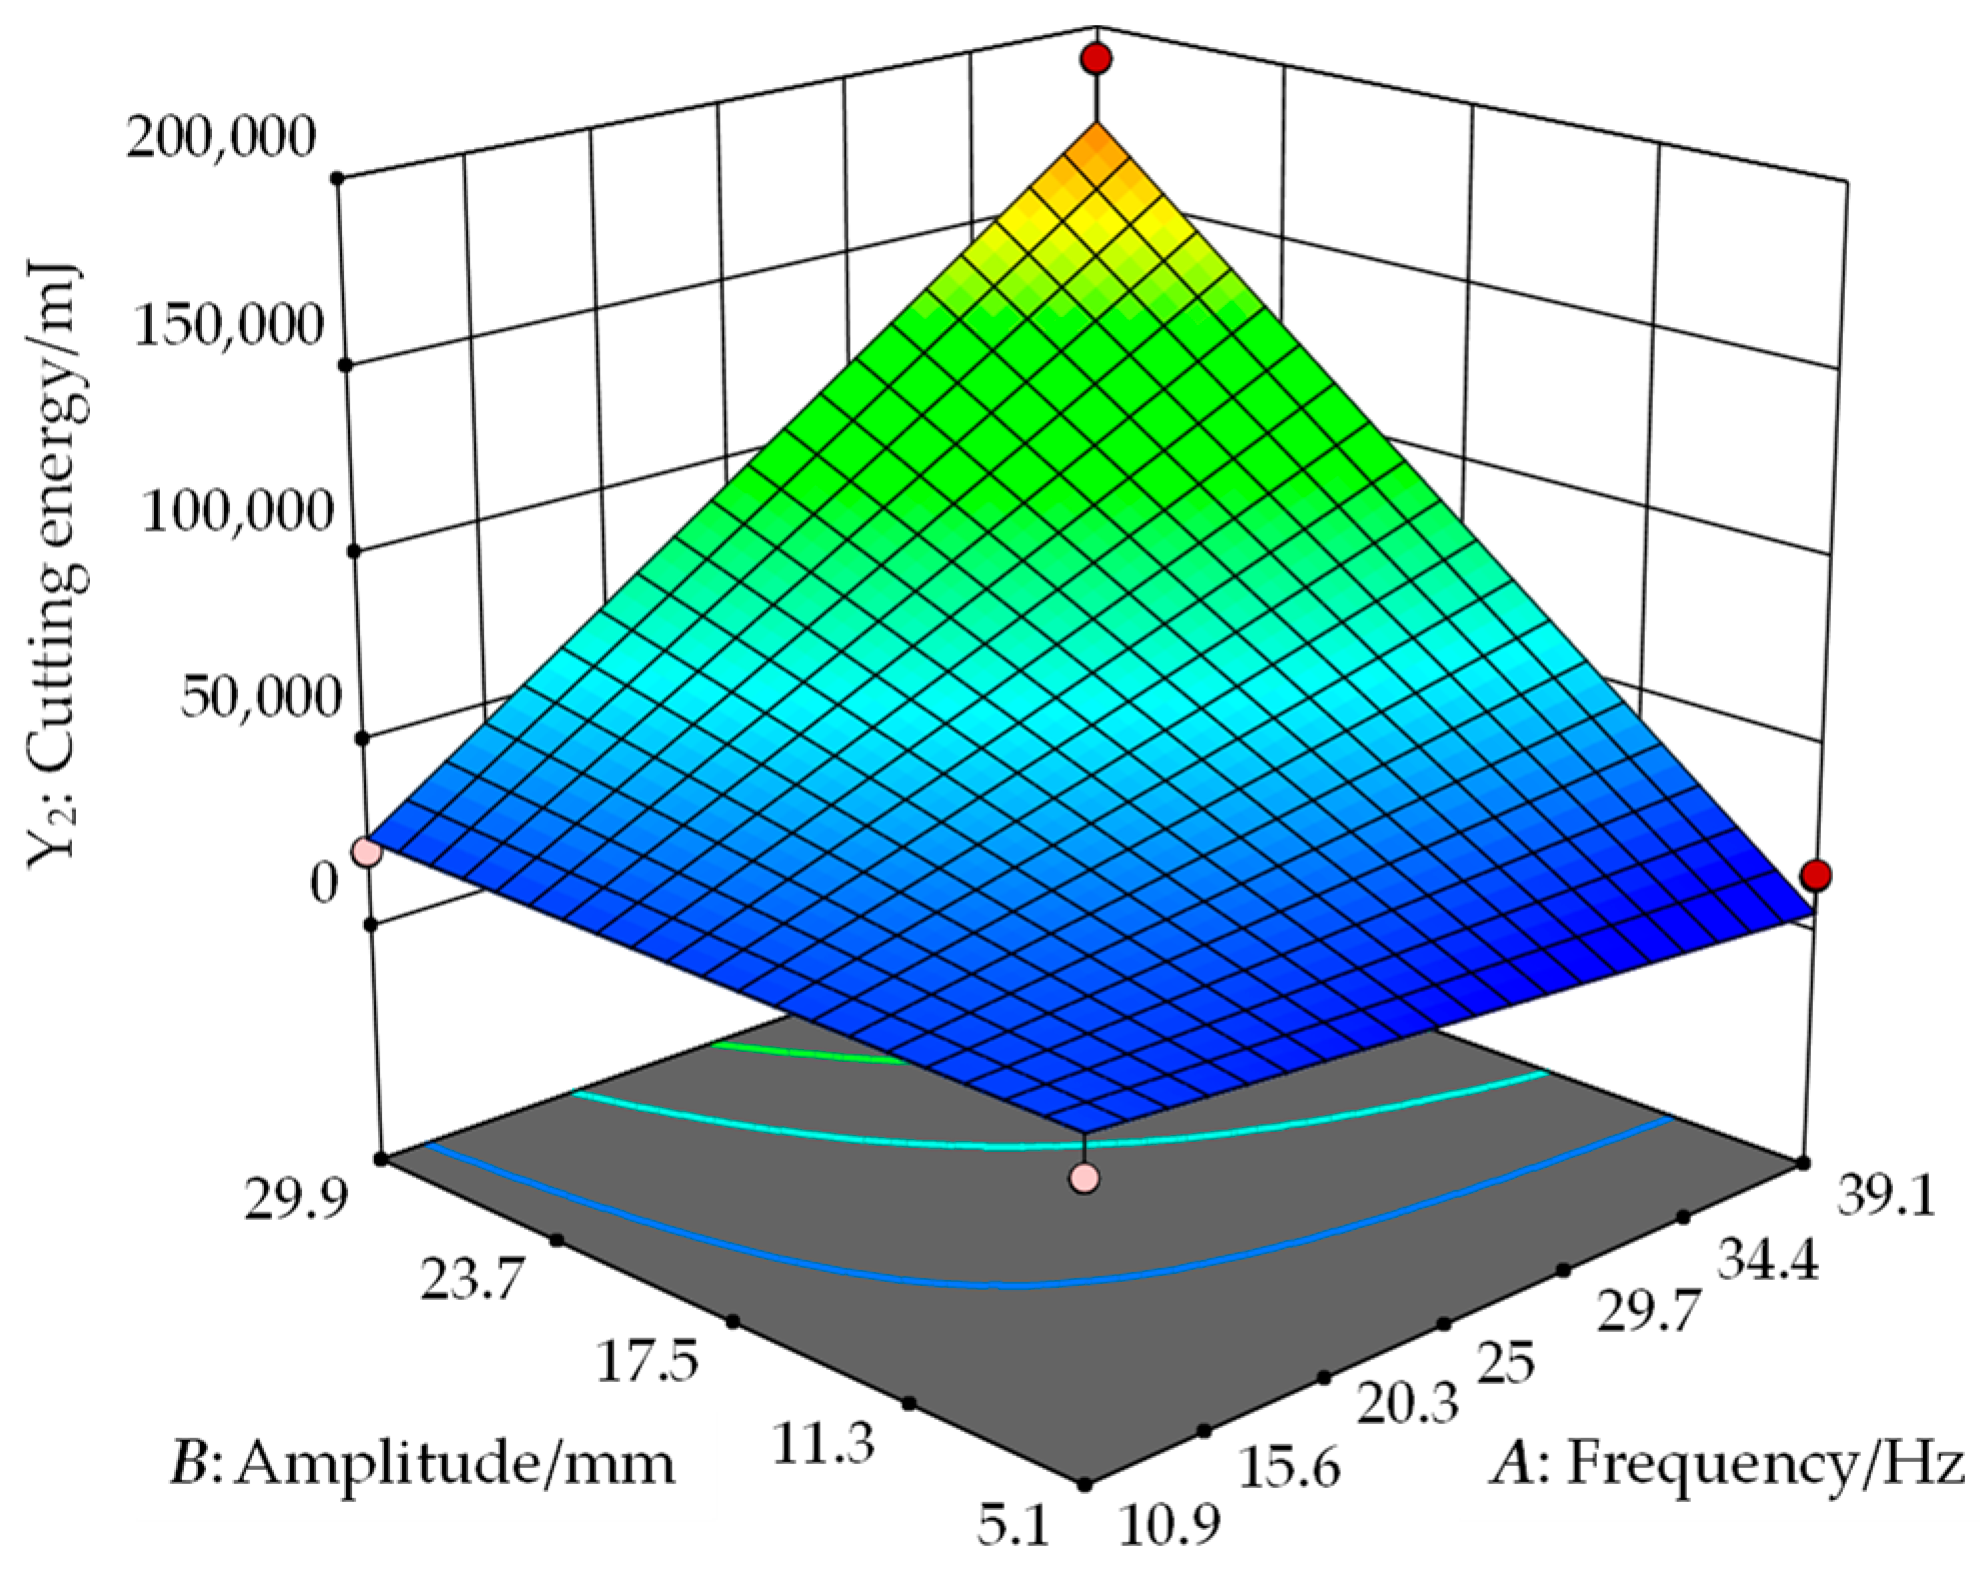
Figure 9 and
Figure 10). The shapes of these surface plots were analyzed to understand their impact patterns.
From
Figure 9, it can be observed that when the amplitude is at a relatively low level, with the increase of vibration frequency, the overall trend of crack length initially increases and then decreases. However, when the amplitude reaches its maximum level, with the increase of vibration frequency, the crack length continuously increases and reaches its maximum value. This indicates that the influence of frequency on crack length varies when the amplitude takes different values, suggesting an interaction between the two factors. When the frequency is constant, crack length increases continuously with the amplitude, and the rate of increase gradually accelerates. This indirectly validates that amplitude is the primary factor influencing crack length. The analysis suggests that an increase in amplitude leads to significant vertical compressive displacement of the cut hemp stalks, causing stubble breakage.
Figure 10 reveals that when vibration frequency and amplitude are in the low range, cutting energy consumption increases slowly with the increasing vibration frequency and amplitude. However, when vibration frequency and amplitude are in the high range, cutting energy consumption sharply increases with increasing vibration frequency and amplitude. This observation indicates a significant influence of vibration frequency, amplitude, and their interaction on cutting energy consumption. The analysis suggests that during the cutting process, an increase in vibration frequency and amplitude subjects the stalks to multiple pulls in the upward and downward directions, leading to a larger cutting area and severe re-cutting phenomena, resulting in an increase in cutting energy consumption.
4.3.4. Optimization of Comprehensive Performance Parameters and Experimental Verification
To achieve ideal cutting performance, the cutter needs to simultaneously ensure the best possible cutting quality and minimize cutting energy consumption. As cutting quality and cutting energy consumption have different dimensional units, they cannot be uniformly evaluated. Meanwhile, the comprehensive fuzzy evaluation method can establish membership degree models for multiple indicators of different types, obtaining membership values with the same order of magnitude and dimensionless. In this study, a comprehensive fuzzy evaluation method is adopted for a comprehensive scoring evaluation of the experimental results [
27,
28]. The specific method is to normalize the two indicators first and then perform weighted comprehensive scoring. The higher the score, the better the cutting performance.
When harvesting industrial hemp, it is essential to prioritize higher cutting quality to avoid hemp bark tearing, which leads to entanglement. Cutting quality has a higher priority than cutting energy consumption. In this experiment, the weight vector
W is set to [0.6 0.4]. Therefore, the comprehensive evaluation index
Q can be expressed as:
We used the Design Expert optimization module, with the objective and constraint conditions set as:
The optimal combination of vibration parameters for achieving the best comprehensive performance index was found to be a blade vibration frequency of 37.86 Hz and an amplitude of 5.34 mm. At this point, the comprehensive performance score is 0.994.
To validate the optimization results, the stalk cutting numerical simulation model was retested with a vibration frequency of 37.86 Hz and an amplitude of 5.34 mm. The resulting comprehensive performance score under these parameters was 0.897, with an error of only 9.76% compared to the optimized result. The experiment demonstrates that the optimization results are highly reliable, further confirming the model’s validity.
5. Conclusions and Discussion
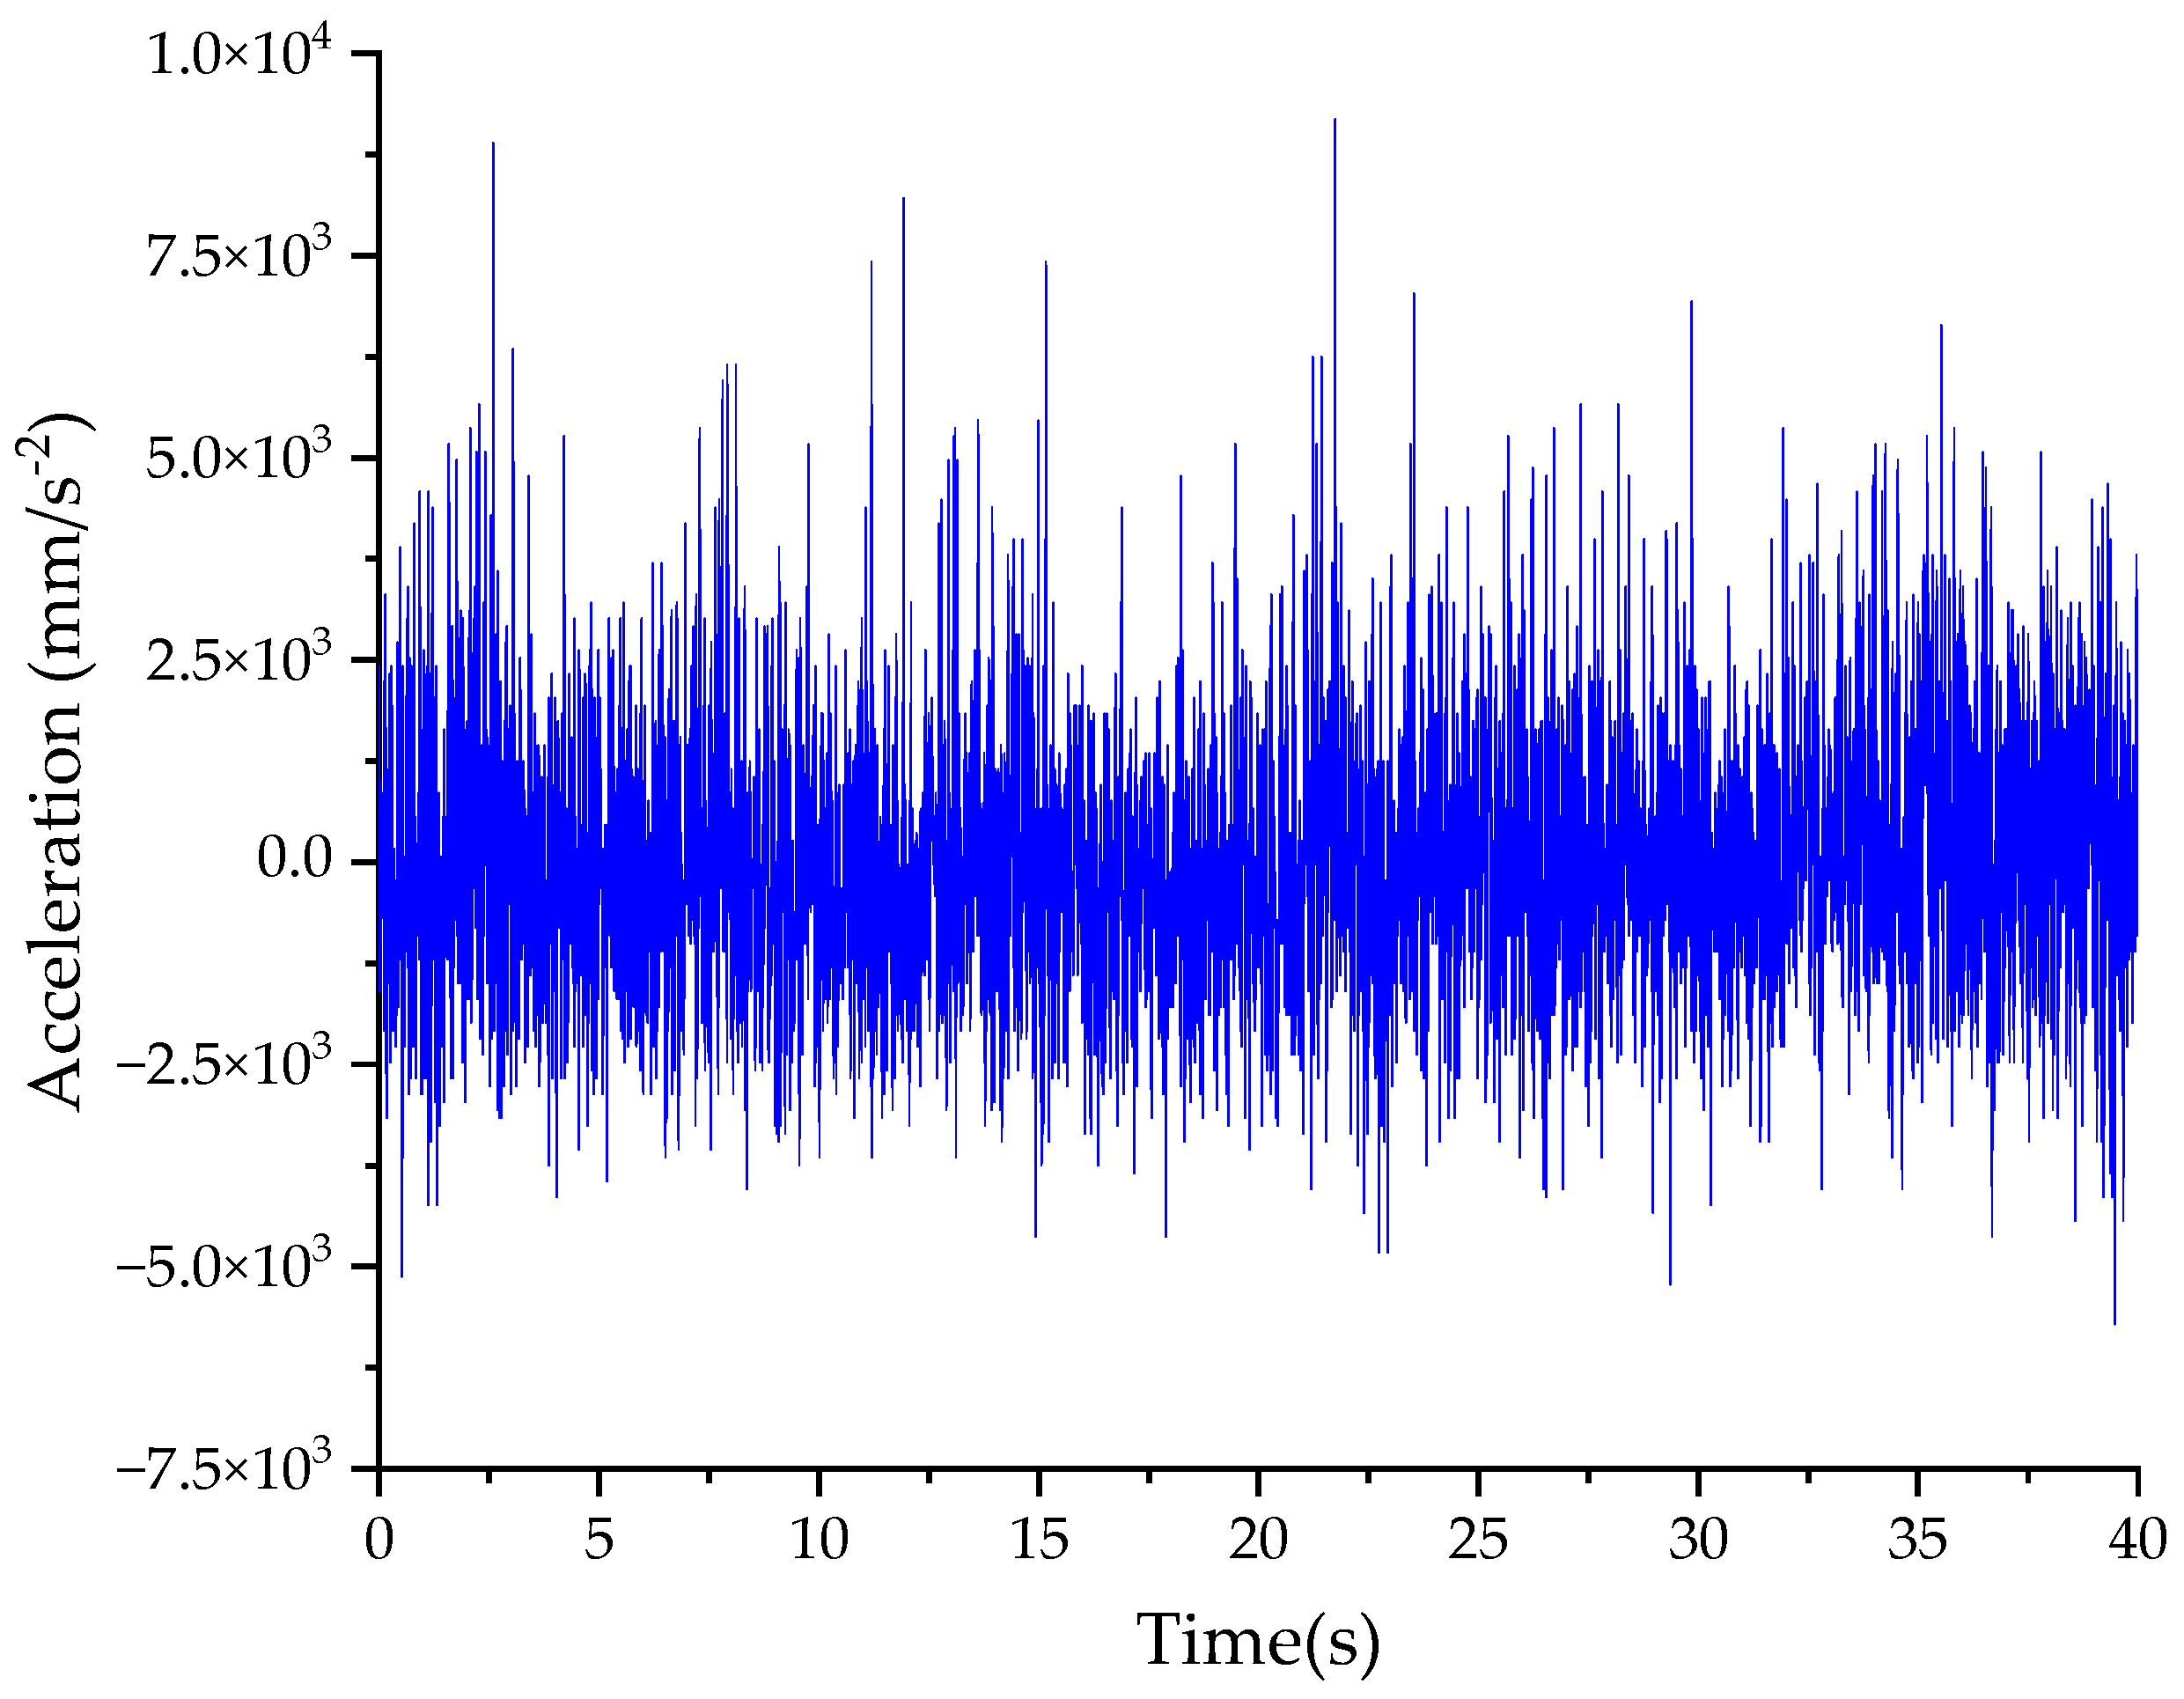
(1) Vibration data of the hemp harvester cutting platform during operation were collected using a vibration recorder. The raw information was processed by eliminating trend components, applying smoothing techniques, performing noise reduction, and implementing high-pass filtering operations. The time acceleration information was consequently transformed into frequency displacement amplitude data. The obtained frequency range of the cutting platform vibration was predominantly concentrated between 5 and 45 Hz, with a displacement amplitude range of 0–35 mm.
(2) To investigate the influence of vibration on cutting performance, a two-factor quadratic rotation combination design experiment was conducted using vibration frequency and amplitude as experimental factors. Crop stubble quality (characterized by crack length) and cutting energy consumption were chosen as performance indicators. The experimental results revealed that, for the crack length indicator, the amplitude significantly affected the model, and the interaction had a significant impact. Regarding the cutting energy consumption indicator and the frequency and the interaction between frequency and amplitude significantly affected the model, and the amplitude had an extremely significant effect. Analysis indicates that under vibration cutting conditions, the crop stalks undergo repeated pulling forces from the blades in the vertical direction, resulting in an increased cutting area and severe re-cutting, leading to increased stubble splitting and cutting energy consumption.
(3) Using the comprehensive fuzzy evaluation method and through analysis and solution, the optimal parameter combination satisfying the comprehensive cutting performance indicators was determined to be a vibration frequency of 37.86 Hz and an amplitude of 5.34 mm. The performance score under these parameters was 0.994, and further verification confirmed the reliability of the model. This indicates that the high-frequency, low-amplitude vibration of the blades will be beneficial for improving the overall cutting performance of the stalks.
(4) This study employs numerical simulation techniques combined with comprehensive fuzzy evaluation methods to investigate the impact of vibration on cutting quality. Due to the fact that the vibration of the header is induced by both the road profile excitation and the vibration of the harvester itself, and the road profile is stochastic in nature, it is not possible to precisely determine the optimal parameters during operation. However, by considering agronomy practices, such as ensuring the ground of the hemp field is as level as possible to reduce the amplitude and avoid resonance, the cutting quality can be improved when harvesting industrial hemp. The findings of this research can serve as a reference for achieving high-quality cutting in industrial hemp and other fiber crops.
(5) Since the vibration cutting test bench is still in the trial stage, this study utilized numerical simulation technology to conduct virtual cutting experiments. Although numerical simulation experiments can replicate the cutting process of stalks under vibration conditions, facilitating the analysis of the influence of vibration on cutting performance trends, there are inevitably some differences between numerical simulation and actual cutting. Subsequent efforts will involve using the vibration test bench to conduct physical experiments under vibration conditions to refine and validate the accuracy of the model.


