Article

Rational Utilization of Sediment Resources Improves Rice Yield and Nitrogen Use Efficiency under Salt Stress

1
Sanya Nanfan Research Institute, Hainan University, Sanya 572025, China
2
National Innovation Center of Saline-Alkali Tolerant Rice in Sanya, Sanya 572000, China
3
Hunan Hybrid Rice Research Center, Changsha 410125, China
*
Author to whom correspondence should be addressed.
These authors contributed equally to this work.
Agriculture 2024, 14(2), 283; https://doi.org/10.3390/agriculture14020283
Submission received: 21 November 2023 / Revised: 8 January 2024 / Accepted: 27 January 2024 / Published: 9 February 2024
(This article belongs to the Special Issue Effects of Salt Stress on Crop Production)

Abstract

:
Soil salinization negatively affects rice growth and yield; however, how different sludge sources regulate rice growth and yield under salt stress was rarely investigated. This study evaluated the performance of two salt-tolerant rice cultivars, Chaoyou 1000 and Longliangyou 506, grown in two sediment sources, pond sediment (PS) and river sludge (RS), under salt stress (56 ds m−1 brine irrigation) with conventional soil (CS) used as the control. The results showed that the rice yield under the PS and RS treatments was enhanced by 51.0% and 43.6% as compared with CS, respectively, owing to an improvement in spikelet per panicle, 1000-grain weight, dry matter accumulation, and the chlorophyll content in both rice cultivars. Compared with CS, the total nitrogen accumulation, nitrogen grain production efficiency, nitrogen harvest index, and nitrogen partial productivity under the PS and RS treatments were increased by 18.9–28.9%, 17.0–20.6%, 7.2–16.6%, and 43.8–50.9%, respectively. Moreover, rice grown in PS and RS showed higher activities of nitrogen metabolism-related enzymes (nitrate reductase, glutamine synthetase, and glutamate synthetase) at the heading stage and higher K+ and K+/Na+ contents in the leaves. Overall, a balanced utilization of sediment resources (especially pond sediment) can effectively alleviate salt stress and improve the yield and nitrogen use efficiency in rice.

1. Introduction

Rice is the most important food crop in the world [1], and the demands are increasing substantially owing to the increase in population and urbanization over the globe [2,3]. On the other hand, more than 900 million hectares of land are affected by salinization, accounting for 20% of the total cultivated land in the world [4]. Therefore, comprehensive development and utilization of saline-alkali land are necessary to ensure food security when it is difficult to increase the yield per unit area of food crops and when the area of cultivated land is limited.
Soil salinity is usually caused by an excessive accumulation of sodium chloride (NaCl) and other soluble salts [5,6]. Higher sodium ion (Na+) concentrations in soil can reduce plant growth and inhibit metabolic activity, leading to plant wilt and eventual death [7]. Salt stress can seriously affect the morphological and agronomic traits of rice, including delayed plant growth, reduced tillers, and decreased above-ground biomass [8]. In addition, salt stress inhibited root growth, nutrient uptake, and utilization, and ultimate rice yield [9]. Salt stress affects crop plants in two ways, i.e., osmotic stress and Na+ ion toxicity, owing to low and high total soluble Na salts, respectively [10]. A high Na+ ion concentration damages membrane structures and photosynthetic machinery [6], whereas a high pH can lead to ion precipitation and nutrient stress, which hinders the uptake and nutrient use efficiency, resulting in lower yields [11].
Previous studies reported that increased nutrient absorption can help regulate plant ion balances and mitigate the adverse effects of salt stress on crop plants [12]. Increased application of nitrogen (50 mg N kg−1) fertilizer in saline soil (100 mM NaCl) can promote the absorption and transport of potassium ion (K+) and reduce the concentration of Na+ [12,13]. The structure of saline soil (1.07 ± 0.55 mS/cm) is poor, which leads to N losses, whereas nitrification, organic N mineralization, and ammonium N adsorption were inhibited with enhanced soil ammonia volatilization under saline conditions [14]. Farmers apply excessive N to obtain a higher yield, which further aggravates ammonia volatilization and N leaching [15]. Under salt stress, enhancing nitrogen (N) assimilation is conducive to plant adaptation to salt stress. Providing ammonium nutrition can significantly enhance rice osmotic adjustment capabilities [16]. N assimilation in rice plants is closely related to root N absorption. After NO3 enters the rice root, it is transformed into NH4+ by nitrate reductase (NR) and nitrite reductase (NiR). NH4+ in rice plants is catalyzed by glutamine synthetase (GS) to glutamine (Gln), then glutamate synthase (GOGAT) catalyzes Gln to glutamate (Glu), and Glu further enters the amino acid cycle [17]. Glutamate dehydrogenase (GDH) can directly catalyze NH4+ to Glu, which can save energy consumption of NH4+ cycling under salt stress. The disordered N metabolism is caused by the changes in expression and activities of enzymes related to N assimilation, including NR, GS, GDH, and transaminase under salt stress, further influencing the growth and development of plants [18,19]. The abundance of nitrogenase and hydroxylamine reductase genes in sediments increases the potential for ammonia production, which promotes the further enrichment of genes related to ammonia assimilation [20].
Sediment keeps the effective storage depth of a pond or river shallower and decreases the water body capacity [16]. The sediment contains a large amount of oxidized and well-decomposed organic matter owing to microbial activity [21]. The organic substances are decomposed and/or oxidized by bacteria, and nutrients such as N, phosphorus, and potassium are released under appropriate conditions [22]. In addition to organic matter and a large amount of available nutrients, sediment is also rich in trace elements such as calcium, iron, manganese, copper, zinc, boron, magnesium, etc. [23]. Some studies have shown that 180 t ha−1 sediment returned to a field can effectively increase soil nutrients and promote the growth and development of rice [21,24]. Sediment application (1500 m3 ha−1) improves the uptake, transportation, and utilization of available nutrients and increases rice yield [24]. Removing sediment can reduce the accumulation of organic matter and nutrients, thereby reducing the risk of eutrophication in water bodies. Additionally, removing sediments not only restores the form and structure of the riverbed but also protects and increases the habitat of aquatic plants and animals, which is essential for maintaining the stability of river ecosystems and restoring damaged biodiversity [25]. In addition, there are a lot of sediment resources in coastal areas that need to be utilized properly in problematic soils, which can not only solve the problem of sediment environmental pollution but also increase grain production. We speculated that suitable sediment resources returning to the field could effectively alleviate the impact of salt stress on rice yield and nitrogen use efficiency. Therefore, this present study was conducted to assess the effects of different sediment sources to improve rice growth and nutrient utilization under salt stress conditions.

2. Materials and Methods

2.1. Experimental Details

The experiment was conducted in 2023 at Leyicun Experimental Station (108.90′ E, 18.44′ N), Ligo Town, Ledong County, Sanya City, Hainan Province, China. Seeds of two salt-tolerant rice cultivars, i.e., Chaoyou 1000 (CY1000) and Longliangyou 506 (LLY506), were sown on 13 January, and seedlings of uniform size were transplanted on 5 February in plastic containers (80 × 40 × 50 cm), with 6 plants per pot, Both cultivars are widely cultivated in Southern China, with 24 pots per treatment. The treatments were arranged in a randomized complete-block design (RCBD) with three replications, which included the treatment of a mixture of pond sediment and conventional soil at the ratio of 1:5 (CS), a mixture of river sediment and conventional soil at the ratio of 1:5 (CS), and the same weight or volume CS as control, where CS is clay. The river sediment came from the freshwater channel, and the pond sediment was the freshwater pond cultured for two years, which was dug by the sediment discharge ship. For the sampling sites, the nutrient content is shown in Table 1. Ten days after the regreening stage, 0.3% (56 ds m−1 brine irrigation) brine irrigation was used to simulate salt stress, which was prepared by using a mixture of seawater and fresh water in a mixing pond, and the brine concentration was measured with a portable conductivity meter (2266FS, Spectrum, Boston, MA, USA). After starting the brine irrigation, the brine concentration of each container was measured every other day using a portable conductivity meter to ensure the brine concentration within each container. The fertilizer was applied at a rate of 180 kg N ha−1 with a 1:1:1 ratio of basal, tillering, and panicle. P at 40 kg ha−1 with a single application of superphosphate, and K at 100 kg ha−1 with basal and panicle fertilizer at a 1:1 ratio.

2.2. Agronomic Traits

Twelve plants were selected at the middle tillering stage (MT), panicle initiation stage (PI), and heading stage (HS) in all treatments, and the number of tillers, plant height, and above-ground dry matter of each stage were determined. The total length (TL), average diameter (AD), root volume (RV), and root surface area (RSA) of rice at HS were analyzed using a WinRhizo-LA1600 (Regeng Instruments Inc., Québec City, QC, Canada).

2.3. Chlorophyll Contents and N-Metabolizing Enzyme Activities

In the MT, PI, and HS treatments, ten plants with uniform growth and leaves were selected and stored at −80 °C.The chlorophyll a, chlorophyll b, and total chlorophyll a + b contents in leaves were determined according to Li et al. [1]. The activities of nitrate reductase (NR), glutamine synthetase (GS), and glutamate synthetase (GOGAT) were determined using kits (source Solarbio Life Sciences, Inc., Beijing, China) numbered BC0080, BC0910, and BC0070, respectively.

2.4. Na+ and K+ Content, Total N Accumulation (TNA), and N Use Efficiency (NUE)

The Na+ and K+ concentrations in each part were determined according to Yan et al. [24]. Leaves of five representative rice plants were collected for each treatment at the HS and maturity stages (MS), and then the leaf samples were dried to a constant weight at 75 °C, after which they were crushed and digested with HNO3 and HClO4 (4:1, v/v) and then concentrated in a microwave oven (Mars, CEM Inc., New York, NY, USA). The final K+ and Na+ concentrations were determined using atomic absorption spectrometry (PinAAcle 900, PerkinElmer Life and Analytical Sciences, Inc., Shelton, CT, USA). The N concentrations in each part were determined according to Pan et al. [26]
At physiological maturity, eight representative plants were sampled and divided into leaf blades, stems plus sheathes, and grains that were over-dried at 70 °C and stored to estimate the total nitrogen concentration. Plant samples (0.20 g) were digested by using the Kjeldahl method to analyze the ammonia concentrations by an Alliance-Futura NP analyzer (Alliance Instruments, Dierre, France), and the N content was measured, whereas the TNA and NUE of each part were calculated according to the following formulae [26]:
N   uptake   in   straw   ( Ns ) / grain   ( Ng ) =   N   ( % ,   kg )   in   straw / grain   ×   straw / grain   dry   mass  
Total   nitrogen   accumulation   ( TNA ,   kg ) = Ng + Ns
Nitrogen   grain   production   efficiency   ( NGPE ,   % ) =   GY / TNA  
Nitrogen   partial   factor   productivity   ( P F P N ,   kg   k g 1 ) = GY
Nitrogen   harvest   index   ( NHI ) =   Ng / TNA  
where GY represents the grain yields in all treatments, respectively; FN is the 180 kg ha−1 N fertilizer applied.

2.5. Yield and Related Attributes

Twelve rice plants were selected at the maturity stage to determine the grain yield and its components, according to Pan et al. [26].

2.6. Data Analysis

Data were analyzed through analysis of variance (ANOVA) using SPSS 19.0 software (SPSS Inc., Chicago, IL, USA). The least significant difference (LSD) test at the probability level of 0.05 was used to separate the differences in the treatment means of each trial. All images were generated by using Origin 9.0 (OriginLab Corp., Northampton, MA, USA).

3. Results

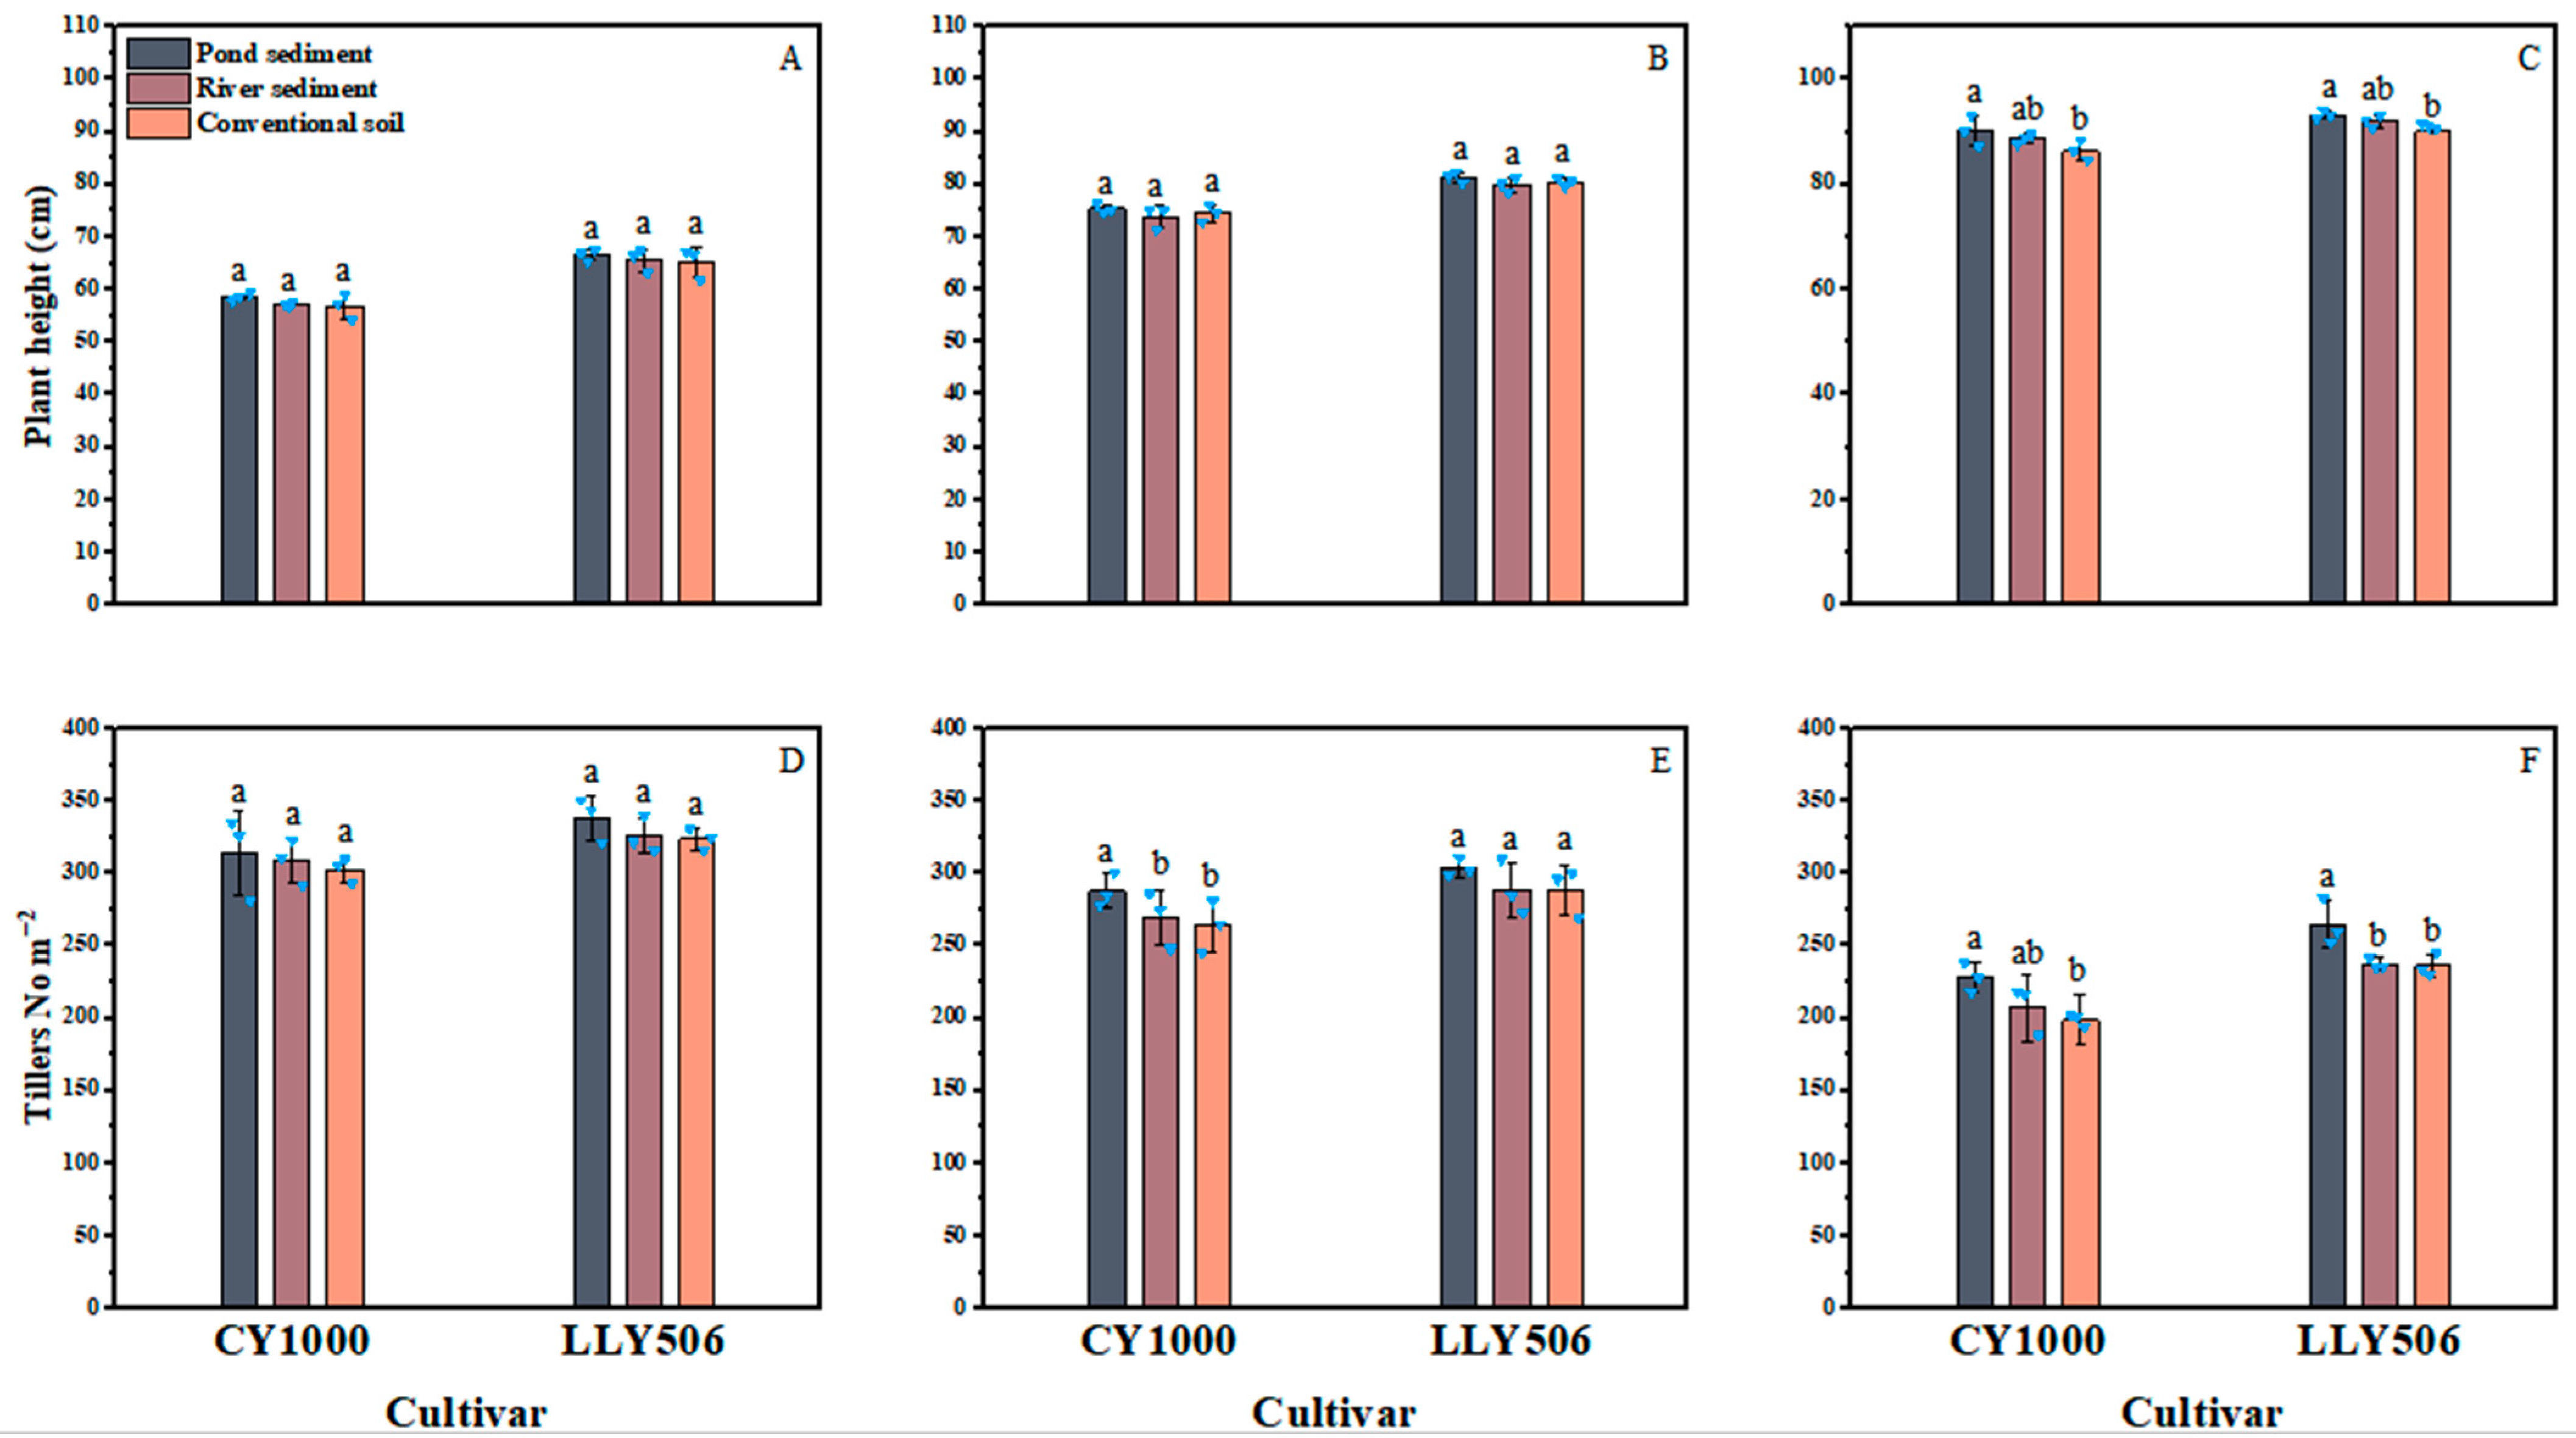
3.1. Agronomic Traits

Under salt stress, different sediment resources had varying effects on the plant height and tillering number per square meter of rice (refer to Figure 1). At the tillering stage, there was no significant difference in the plant heights and tiller number per square meter between the two varieties. However, at PI, the tiller numbers per unit area of CY1000 were significantly higher than the CS and RS under PS treatment, whereas all sediment treatments remained statistically similar for LLY506. The plant heights of CY1000 and LLY506 under PS treatment were higher than those under the RS and CS treatments, and except for PI, other periods showed a trend of PS > RS > CS. In addition, the plant height and tiller number remained 3.63–4.24% and 12.13–14.57% higher than the CS treatment, with the highest at HS.
Different types of sediment resources showed the following trend PS > RS > CS regarding above-ground dry matter accumulation (Figure 2). From the PI to MS stage, the PS treatment was the highest regarding the dry matter accumulation for both rice cultivars, and the LLY506 treatment was significantly higher than the RS and CS treatments. However, there was no significant difference between the PS treatment and RS treatment for CY1000 cultivars from PI to MS, but it was significantly higher than the CS treatment. Simultaneously, the impact of various sediment resources on the root morphology at different growth stages under salt stress was analyzed. The results showed that the total root length, volume, and surface area treated with PS and RS were significantly higher than those treated with CS. However, there was no significant difference between PS and RS (refer to Figure 3). At the full head stage, the TRL of each plant of the two rice varieties treated with PS was 108.01 m and 103.60 m, respectively. This represents an increase of 9.21% and 17.55% compared to the CS treatment. The mean root diameter did not differ significantly between the different treatments, and the results were consistent across both rice varieties.

3.2. Yield and Yield Components

Under salt stress, different types of sediment resources had significant effects on the rice yield and its component factors, and the 1000-grain weight, spikelets per spike, yield, and effective spike number showed PS > RS > CS (Table 2). The 1000-grain weight, spikelets per panicle, yield, and effective panicle number of the two varieties under PS treatment were 14.81–20.51%, 18.18–35.06%, 43.61–64.69%, and 10.24–12.31% higher than CS, respectively. At the same time, there was no significant difference in the 1000-grain weight and yield of the two varieties under the PS and RS treatments, but they were significantly higher than the CS treatment and were 43.61–58.44% and 33.33–47.81% higher than the CS treatment, respectively. In addition, the number of spikelets per spike of the two varieties showed no significant difference between the PS and RS treatments, but they were significantly higher than the CS treatment. The 1000-grain weight and seed-setting rate were the highest under the PS treatment, but there was no significant difference between the PS and RS treatments. The 1000-grain weight of the two rice varieties under the RS treatment was significantly increased by 14.81–20.51% compared with the CS treatment.

3.3. TNA and NUE

Different types of sediment resources substantially affected the TNA and NUE of rice, with PS > RS > CS in TNA, PFPN, and NHI under salt stress (Table 3). Under PS treatment, the TNA, PFPN, and NHI of both rice cultivars remained 26.30–31.59%, 13.77–20.18%, and 13.63–19.51% higher than the CS treatment, respectively. The NGPE remained maximum at RS followed by PS and CS. The RS and PS treatments are significantly higher than the CS treatment, but the RS and PS treatments’ NGPE difference is not significant.

3.4. Chlorophyll a + b Contents and N-Metabolizing Enzyme Activities

The leaf chlorophyll a + b contents were affected by different sediment resources at various growth stages, and the results were inconsistent (see Figure 4). The chlorophyll a + b contents of both rice cultivars at the HS stage were found to be the highest under the PS treatment, which was 7.06–7.45% and 13.08–13.77% higher than that under the RS and CS treatments, respectively. In addition, the RS and PS treatments were significantly higher than CS at the MT stage. However, the chlorophyll a + b contents of CY1000 remained significantly different among different treatments at the PI stage.
In addition, different sediment resources regulated the activities of N-metabolizing enzymes, i.e., NR, GS, and GOGAT in rice under salt stress, whereas the activities of NR, GS, and GOGAT under the PS treatment were the highest at all stages (Figure 5). Furthermore, the GS, GOGAT, and NR under the PS treatment were higher at MT, PI, and HS than the CS treatment, respectively, at 40.47–62.50%, 21.57–22.22% and 37.50–49.64%, 71.76–98.95%, 58.41–127.66% and 65.91–160.00%, and 12.23–30.09%, 8.01–40.78% and 56.25–124.30%. In addition, no significant difference in NR activity was noticed for the PS and RS treatments, as well as the GS activity for the RS and CS treatments at the MT stage, but remained significant at the PI stage. At the tillering stage, there was no significant difference in GS activity between the RS and CS treatments. However, a significant difference was observed at the booting stage. Regarding the GAGOT activity, significant differences were observed among all treatments (except CY1000 in the full ear stage), with PS showing the highest GOGAT activity.

3.5. Na+ and K+ Ions

The effects of different sediment resources on the Na+ and K+ contents and the K+/Na+ ratio were significantly different among different treatments at HS and MS, with the highest occurring for the PS treatment (Figure 6). The leaf K+ contents for the PS treatment at HS and HS were increased by 22.06–31.96% and 30.98–50.42% compared with CS, respectively. Compared with CS, the K+/Na+ ratio was increased by 24.43–38.90% and 38.54–63.34% with the PS treatment, respectively. On the contrary, significant differences were noticed in the leaf Na+ content of both rice cultivars at HS and MS. The Na+ contents in CY1000 under the RS treatment were significantly lower than the PS and CS treatments, while the Na+ content in LLY506 showed no significant difference among different sediment treatments. In addition, the PS and RS treatments were found statistically similar regarding the K+/Na+ ratio at HS but differed significantly at the maturity stage.

3.6. Correlation Analysis of Yield Composition, Root Index, and Nitrogen Use Efficiency of Rice

The study discovered a positive correlation between root morphology and yield composition. Specifically, the study found that TL (total length) and GY (grain yield) were significantly positively correlated. Figure 7 illustrates that root morphological indexes have a positive correlation with nitrogen accumulation and nitrogen use efficiency. Furthermore, TL is significantly positively correlated with NPFP (nitrogen uptake efficiency), NGPE (nitrogen grain production efficiency), TNA (total nitrogen accumulation), and NPFP. Chi was found to be positively correlated with PP (productive panicle), NGPE, and NPFP.

4. Discussion

Salt stress often results in yield reduction, owing to reduced yield contributing traits [14]. In the present study, the PS and RS treatments significantly improved the yield of both rice cultivars, owing to substantial improvements in the spikelet per panicle and 1000-grain weight. The PS treatment also improved rice agronomic traits, i.e., plant height, tillers, and root morphological traits. It was further noticed that mixing pond sediment with the growing medium could improve the soil nutrient content, growth, and yield of rice under saline conditions. In addition, the contents of organic matter and the available nutrients in pond and river sediment were much higher than in conventional soil (Table 1). Salinity affects the availability of soil nutrient contents and their uptake in plants through roots. For example, poor uptake and transport of macro-nutrients such as N and potassium by plants under salt stress led to a significant reduction in rice yield and yield attributes [8,27]. Therefore, improvement in plant nutrient uptake is the most effective way to promote rice performance under saline conditions.
Roots have direct contact with soil water and nutrients; however, salt is not conducive to root development and morphogenesis [28]. It was found that, except for AD, other root morphological indices treated with PS and RS were superior to those treated with CS. In addition, alterations in root morphological indices were consistent with the variations in grain yield, indicating the direct relationship of roots with plant growth and yield formation. However, insufficient nutrient supply under salt stress often leads to abnormal root development in rice, which further affects yield components and significantly reduces rice yields [14]. However, adequate nutrients promote the biosynthesis of chlorophyll content in leaves, thus facilitating the assimilation of photosynthetic products [29], which is consistent with our results, i.e., under the PS and RS conditions, the chlorophyll contents in leaves were higher than that under CS treatment. In addition, delaying leaf senescence has a positive effect on prolonging grain formation and, thus, crop yield improvement. Salt sensitivity in rice is generally associated with Na+ accumulation in leaves [29], whereas an imbalance between K+ and Na+ has been recognized as an important factor in regulating growth and yield under salt conditions (high Na+ ions inhibit, whereas high K+ promotes growth). The authors of [30,31] reported that salt tolerance in rice is linked to higher levels of K+ and lower levels of Na in leaves. This study showed that both rice cultivars maintained high K+ under PS and RS conditions; nevertheless, no significant difference between PS and RS was noticed regarding the Na+ content. Therefore, the K+/Na+ content of rice was higher under the PS and RS conditions, possibly owing to the high availability of potassium content in soil with the same sediment resources as CS (Table 1). Therefore, it can be inferred that the K+ ion content in soil is closely related to the level of K+ content in plant leaves. Increasing the application rate of potassium fertilizer often improves salt tolerance in crop plants [32]. In addition, a high K+ content in plants can facilitate the transport and distribution of nutrients to grains, thereby resulting in bold grain formation [33]. For PS and RS treatments, the improved root morphological traits in rice are also conducive to enhancing the absorption of K+ ions, resulting in a higher K+ content and K+/Na+ ratio in leaves.
Furthermore, it was found that the NHI, PFPN, and NGPE remained the highest in rice applied with PS. The PS conditions improved the N metabolic enzyme activity and N absorption and utilization, which resulted in an improved NUE and source–sink relationship [6]. In higher plants, the NR regulates N assimilation, nitrate reduction, and overall N metabolism [34]. Ammonium ions converted by nitrite reductase are fixed to amino acids by GS and GOGAT enzymes [35]. The GS has been identified as a rate-limiting enzyme for ammonium assimilation, and the GS/GOGAT cycle is a major pathway for NH4+ assimilation in rice [36]. Ashraf et al. [5] showed that NR, GS, and GOGAT are sensitive to salt. In the present study, it was found that the activities of NR, GS, and GOGAT under PS conditions were higher than RS and CS under salt stress. In addition, the PS treatment enhanced the N availability, which was conducive to improving the activity of N-metabolizing enzymes. In addition, N-metabolizing enzymes in the HS stage were lower than those found in other growth stages, which may be due to an insufficient N supply in the soil at the later growth stage. It was also observed that different soil conditions had different effects on N distribution in different plant parts. For example, the proportion of N accumulation in grains under the PS treatment was significantly higher than that under the RS and CS treatments. K+ is conducive to the transport of N from leaves and stems to grains, thereby increasing the N content in grains and overall NUE [37]. Salt stress conditions tend to limit K+ absorption due to insufficient available potassium under CS conditions. In addition, a stronger root system under the PS and RS treatments was found to be beneficial for N uptake. Our results corroborate with Phan et al. [38], who reported a significant positive correlation between root morphological indices and N accumulation. Thus, the N uptake efficiency of the PS treatment was better than that of the RS and CS treatments under salt stress.
The development and utilization of saline–alkali land are crucial for ensuring food security. The experiment demonstrates that rice yields significantly increase when treated with PS and RS under salt stress. This demonstrates that sediment resources can enhance saline–alkali land, reducing crops’ salt stress and increasing their yields. It is crucial to fully utilize silt resources, turning waste into valuable assets to ensure national food security. Overall, the PS treatment was found to alleviate the salt stress. However, sediment may contain excessive heavy metals that could have a certain impact on rice quality, and it also contains a large number of fungi; thus, the effect of changes in the abundance of fungi on the salt tolerance in rice under salt stress needs investigation. Additionally, the experiment with potted plants showed that a mixture of silt and conventional soil in a 1:5 ratio could alleviate salt stress on rice to some extent; however, further verification is needed to determine the optimal mixing ratio under field conditions.

5. Conclusions

This study showed that the highest grain yield of rice under PS treatment was related to an improvement in plant height, tillers, root morphological characteristics, dry biomass, and leaf chlorophyll content in both rice cultivars. On the other hand, the PS treatment substantially improved the N accumulation, N grain production efficiency, N harvest index, and N partial productivity under salt stress. In addition, rice under the PS treatment showed better salt tolerance, which was linked to the higher activities of enzymes related to the N metabolism and higher K+ content and K+/Na+ in leaves. However, it is important to investigate the impact of sediment on rice quality, as well as the correlation between key sediment microbial flora and heavy metal contents in various sediment sources and nutrient supplies.

Author Contributions

Data curation, S.C., J.W. and Y.L.; Formal analysis, R.L., Y.Q., J.J. and Z.A.; Funding acquisition, A.H. and Z.A.; Investigation, P.Z.; Methodology, R.L. and W.T.; Project administration, J.J., A.H. and Z.A.; Resources, Y.Q.; Software, Y.L., J.W., W.T. and T.Z.; Validation, P.Z., T.Z. and Y.L.; Visualization, X.G.; Writing—original draft, S.C., X.G. and Z.A.; Writing—review and editing, S.C. and Z.A. All authors have read and agreed to the published version of the manuscript.

Funding

Research and Demonstration of New Varieties of Tropical Salt-tolerant Rice and Supporting Key Technologies, Major Science and Technology Project of Hainan Province (ZDKJ202001) and The Sanya Yazhou Bay Science and Technology City Administration Project provided funding for the breeding and marketing of new varieties of high-quality hybrid rice that are resistant to saline-alkali and disease (SKJC-2020-02-006).

Institutional Review Board Statement

Not applicable.

Data Availability Statement

Data is contained within the article.

Conflicts of Interest

The authors declare no conflicts of interest.

References

  1. Li, L.; Zhang, Z.; Tian, H.; Ashraf, U.; Hamoud, Y.A.; Alaa, A.A.; Tang, X.; Duan, M.; Wang, Z.; Pan, S. Nitrogen deep placement combined with straw mulch cultivation enhances physiological traits, grain yield and nitrogen use efficiency in mechanical pot-seedling transplanting rice. Rice Sci. 2022, 29, 89–100. [Google Scholar]
  2. Peng, S.; Tang, Q.; Zou, Y. Current status and challenges of rice production in China. Plant Prod. Sci. 2009, 12, 3–8. [Google Scholar] [CrossRef]
  3. Li, L.; Li, Q.; Lin, Z.; Zhang, Z.; Tian, H.; Ashraf, U.; Alhaj Hamoud, Y.; Duan, M.; Tang, X.; Pan, S. Effects of nitrogen deep placement coupled with straw incorporation on grain quality and root traits from paddy fields. Crop Sci. 2021, 61, 3675–3686. [Google Scholar] [CrossRef]
  4. Guo, L.Y.; Lu, Y.Y.; Bao, S.Y.; Zhang, Q.; Geng, Y.Q.; Shao, X.W. Carbon and nitrogen metabolism in rice cultivars affected by salt-alkaline stress. Crop Pasture Sci. 2021, 72, 372–382. [Google Scholar] [CrossRef]
  5. Ashraf, M.; Shahzad, S.M.; Imtiaz, M.; Rizwan, M.S. Salinity effects on nitrogen metabolism in plants—Focusing on the activities of nitrogen metabolizing enzymes: A review. J. Plant Nutr. 2018, 41, 1065–1081. [Google Scholar] [CrossRef]
  6. Fu, X.; Ma, L.; Gui, R.; Ashraf, U.; Li, Y.; Yang, X.; Zhang, J.; Imran, M.; Tang, X.; Tian, H.; et al. Differential response of fragrant rice cultivars to salinity and hydrogen rich water in relation to growth and antioxidative defense mechanisms. Int. J. Phytoremediation 2021, 23, 1203–1211. [Google Scholar] [CrossRef] [PubMed]
  7. Fatima, A.; Hussain, S.; Hussain, S.; Ali, B.; Ashraf, U.; Zulfiqar, U.; Aslam, Z.; Al-Robai, S.A.; Alzahrani, F.O.; Hano, C.; et al. Differential morphophysiological, biochemical, and molecular responses of maize hybrids to salinity and alkalinity stresses. Agronomy 2021, 11, 1150. [Google Scholar] [CrossRef]
  8. Zhang, R.; Wang, Y.; Hussain, S.; Yang, S.; Li, R.; Liu, S. Study on the effect of salt stress on yield and grain quality among different rice varieties. Front. Plant Sci. 2022, 13, 918460. [Google Scholar] [CrossRef]
  9. Ganapati, R.K.; Naveed, S.A.; Zafar, S.; Wensheng, W.; Jianlong, X.U. Saline-Alkali tolerance in rice: Physiological response, molecular mechanism, and QTL identification and application to breeding. Rice Sci. 2022, 29, 412–434. [Google Scholar] [CrossRef]
  10. Hussain, S.; Mehmood, U.; Ashraf, U.; Naseer, M.A. Combined salinity and waterlogging stress in plants: Limitations and tolerance mechanisms. In Climate Change and Crop Stress; Academic Press: Cambridge, MA, USA, 2022; pp. 95–112. [Google Scholar]
  11. Dluzniewska, P.; Gessler, A.; Dietrich, H.; Schnitzler, J.P.; Rennenberg, H. Nitrogen uptake and metabolism in populus canescens as affected by salinity. New Phytol. 2007, 173, 279–293. [Google Scholar] [CrossRef]
  12. Zhu, G.; Wang, Y.; Shi, X.; Lu, H.; Ren, Z.; Shi, Y.; Jiao, X.; Ibrahim, M.E.H.; Irshad, A.; Zhu, W.; et al. Optimum nitrogen management enhances growth, antioxidant ability and yield performance of rice in saline soil of coastal area of China. Chil. J. Agric. Res. 2020, 80, 629–639. [Google Scholar] [CrossRef]
  13. Ahanger, M.A.; Qin, C.; Begum, N.; Maodong, Q.; Dong, X.X.; El-Esawi, M. Nitrogen availability prevents oxidative effects of salinity on wheat growth and photosynthesis by up-regulating the antioxidants and osmolytes metabolism, and secondary metabolite accumulation. BMC Plant Biol. 2019, 19, 479. [Google Scholar] [CrossRef] [PubMed]
  14. Lyu, J.; Wang, X.; Hou, S.; Zeb, A.; Zhu, H.; Xu, Y. Content variation and potential runoff loss risk of nutrients in surface water of saline-alkali paddy in response to the application of different nitrogen fertilizer types. Sustainability 2023, 15, 7040. [Google Scholar] [CrossRef]
  15. Li, L.; Wu, T.; Li, Y.; Hu, X.; Wang, Z.; Liu, J.; Qin, W.; Ashraf, U. Deep fertilization improves rice productivity and reduces ammonia emissions from rice fields in China; a meta-analysis. Field Crops Res. 2022, 289, 108704. [Google Scholar] [CrossRef]
  16. Li, Y.; Gao, Y.; Ding, L.; Shen, Q.; Guo, S. Ammonium enhances the tolerance of rice seedlings (Oryza sativa L.) to drought condition. Agric. Water Manag. 2009, 96, 12. [Google Scholar] [CrossRef]
  17. Zhong, C.; Bai, Z.G.; Zhu, L.F.; Zhang, J.H.; Zhu, C.Q.; Huang, J.L.; Jin, Q.Y.; Cao, X.C. Nitrogen mediated alleviation of photosynthetic inhibition under moderate water deficit stress in rice (Oryza sativa L). Environ. Exp. Bot. 2019, 157, 269–282. [Google Scholar] [CrossRef]
  18. Wang, H.; Zhang, M.S.; Guo, R.; Shi, D.C.; Liu, B.; Lin, X.Y.; Yang, C.W. Effects of salt stress on ion balance and nitrogen metabolism of old and young leaves in rice (Oryza sativa L.). BMC Plant Biol. 2012, 194, 1471–2229. [Google Scholar] [CrossRef]
  19. Qiao, C.; Duan, Y.; Zhang, M.; Hagemann, M.; Luo, Q.; Lu, X. Effects of reduced and enhanced glycogen pools on salt-induced sucrose production in a sucrose-secreting strain of Synechococcus elongatus PCC 7942. Appl. Environ. Microbiol. 2018, 84, e02023-17. [Google Scholar] [CrossRef]
  20. Yang, Z.; Yao, Y.; Sun, M.; Li, G.; Zhu, J. Metagenomics reveal microbial effects of lotus root–fish co-culture on nitrogen cycling in aquaculture pond sediments. Microorganisms 2022, 10, 1740. [Google Scholar] [CrossRef]
  21. Zuo, W.; Bai, Y.; Lv, M. Sustained effects of one-time sewage sludge addition on rice yield and heavy metals accumulation in salt-affected mudflat soil. Environ. Sci. Pollut. Res. 2021, 28, 7476–7490. [Google Scholar] [CrossRef]
  22. Shan, S.P.; Wei, Z.W.; Cheng, W.; Du, D.X.; Zheng, D.F.; Ma, G.H. Biofertilizer based on halotolerant microorganisms promotes the growth of rice plants and alleviates the effects of saline stress. Front. Microbiol. 2023, 14, 1165631. [Google Scholar] [CrossRef]
  23. Singh, R.P.; Agrawal, M. Effect of different sewage sludge applications on growth and yield of Vigina radiate L. Field crop: Metal uptake by plant. Ecol. Eng. 2010, 36, 969–972. [Google Scholar] [CrossRef]
  24. Wu, J.R.; Jin, X.C.; Zhang, L.J. Preliminary report on the test of river sludge return to field. Zhejiang Agric. Sci. 2018, 59, 1617–1618. [Google Scholar]
  25. Drozdz, D.; Malinska, K.; Mazurkiewicz, J.; Kacprzak, M.; Mrowiec, M.; Szczypiór, A.; Stachowiak, T. Fish pond sediment from aquaculture production-Current practices and the potential for nutrient recovery: A Review. Int. Agrophysics 2020, 34, 33–41. [Google Scholar] [CrossRef] [PubMed]
  26. Pan, S.; Wen, X.; Wang, Z.; Ashraf, U.; Tian, H.; Duan, M.; Mo, Z.; Fan, P.; Tang, X. Benefits of mechanized deep placement of nitrogen fertilizer in direct-seeded rice in South China. Field Crops Res. 2017, 203, 139–149. [Google Scholar] [CrossRef]
  27. Li, Y.S.; Ai, Z.Y.; Mu, Y.X.; Zhao, T.C.; Zhang, Y.C.; Li, L.; Huang, Z.; Nie, L.X.; Khan, M.N. Rice yield penalty and quality deterioration is associated with failure of nitrogen uptake from regreening to panicle initiation stage under salinity. Front. Plant Sci. 2023, 14, 1120755. [Google Scholar] [CrossRef] [PubMed]
  28. Chen, Y.; Li, S.; Zhang, Y.; Li, T.; Ge, H.; Xia, S. Rice root morphological and physiological traits interaction with rhizosphere soil and its effect on methane emissions in paddy fields. Soil Biol. Biochem. 2019, 129, 191–200. [Google Scholar] [CrossRef]
  29. Derkx, A.P.; Orford, S.; Griffiths, S.; Foulkes, M.J.; Hawkesford, M.J. Identification of differentially senescing mutants of wheat and impacts on yield, biomass and nitrogen partitioning. J. Integr. Plant Biol. 2012, 54, 555–566. [Google Scholar] [CrossRef]
  30. Pandey, M.; Paladi, R.K.; Srivastava, A.K.; Suprasanna, P. Thiourea and hydrogen peroxide priming improved K+ retention and source-sink relationship for mitigating salt stress in rice. Sci. Rep. 2021, 11, 3000. [Google Scholar] [CrossRef]
  31. Assaha, D.V.M.; Ueda, A.; Saneoka, H.; Al, Y.R.; Yaish, M.W. The role of na+ and k+ transporters in salt stress adaptationin glycophytes. Front. Physiol. 2017, 8, 509. [Google Scholar] [CrossRef]
  32. Shi, X.L.; Zhou, D.Y.; Guo, P.; Zhang, H.; Dong, J.L.; Ren, J.Y.; Jiang, C.J.; Zhong, C.; Zhao, X.H.; Yu, H.Q. External potassium mediates the response and tolerance to salt stress in peanut at the flowering and needling stages. Photosynthetica 2020, 58, 1141–1149. [Google Scholar] [CrossRef]
  33. Yan, F.; Wei, H.; Li, W.; Liu, Z.; Tang, S.; Chen, L.; Ding, C.; Jiang, Y.; Ding, Y.; Li, G. Melatonin improves K+ and Na+ homeostasis in rice under salt stress by mediated nitric oxide. Ecotoxicol. Environ. Saf. 2020, 206, 111358. [Google Scholar] [CrossRef] [PubMed]
  34. Wang, Z.Q.; Yuan, Y.Z.; Ou, J.Q.; Lin, Q.H.; Zhang, C.F. Glutamine synthetase and glutamate dehydrogenase contribute differentially to proline accumulation in leaves of wheat (Triticum aestivum) seedlings exposed to different salinity. J. Plant Physiol. 2007, 164, 695–701. [Google Scholar] [CrossRef] [PubMed]
  35. Cao, Y.; Fan, X.R.; Sun, S.B.; Xu, G.H.; Hu, J.; Shen, Q.R. Effect of nitrate on activities and transcript levels of nitrate reductase and glutamine synthetase in rice. Pedosphere 2008, 18, 664–673. [Google Scholar] [CrossRef]
  36. Gu, J.J.; Zhao, H.W.; Jia, Y.; Hu, B.W.; Wang, Z.Q.; Qu, Z.J. Effect of salt stress on nitrogen assimilation of functional leaves and root system of rice in cold region. J. Northeast Agric. Univ. 2020, 2, 9–16. [Google Scholar]
  37. Duan, Y.H.; Shi, X.J.; Li, S.L.; Sun, X.F.; He, X.H. Nitrogen Use Efficiency as Affected by Phosphorus and Potassium in Long-Term Rice and Wheat Experiments. J. Integr. Agric. 2014, 13, 588–596. [Google Scholar] [CrossRef]
  38. Phan, N.; Heymans, A.; Bonnave, M.; Lutts, S.; Pham, C.V.; Bertin, P. Nitrogen use efficiency of rice cultivars (Oryza sativa L.) under salt stress and low nitrogen conditions. J. Plant Growth Regul. 2023, 42, 1789–1803. [Google Scholar] [CrossRef]
Figure 1. Effects of different types of sediment resources on plant height and tiller number per square meter in different growth stages under salt stress. Within a column, means followed by the same letter are not significantly different at the 0.05 probability level according to the least significant different test (LSD, 0.05). CY1000: Chaoyou1000; LLY506: Longliangyou506. (A,D) represent the mid-tillering stage, (B,E) represent the panicle initiation stage, and (C,F) represent the heading stage.
Agriculture 14 00283 g001
Figure 2. Effects of different types of sediment resources on above-ground dry matter accumulation at different growth stages under salt stress Within a column, means followed by the same letter are not significantly different at the 0.05 probability level according to the least significant different test (LSD, 0.05). CY1000: Chaoyou1000; LLY506: Longliangyou506. (AD) represent the mid–tillering stage, panicle initiation stage, heading stage, and mature stage, respectively.
Agriculture 14 00283 g002
Figure 3. Effects of different types of sediment resources on root morphological indices at panicle stage under salt stress. Note: Within a column, means followed by the same letter are not significantly different at the 0.05 probability level according to the least significant different test (LSD, 0.05). CY1000: Chaoyou1000; LLY506: Longliangyou506.
Agriculture 14 00283 g003
Figure 4. Effects of different types of sediment resources on leaf chlorophyll a + b contents at different growth stages under salt stress. Within a column, means followed by the same letter are not significantly different at the 0.05 probability level according to the least significant different test (LSD, 0.05). CY1000: Chaoyou1000; LLY506: Longliangyou506. (AC) represent the mid-tillering stage, panicle initiation stage, and heading stage, respectively.
Agriculture 14 00283 g004
Figure 5. Effects of different types of sediment resources on leaf nitrogen-metabolizing enzyme activities under salt stress Note: Within a column, means followed by the same letter are not significantly different at the 0.05 probability level according to the least significant different test (LSD, 0.05). CY1000: Chaoyou1000; LLY506: Longliangyou506. (A,D,G) represent the mid-tillering stage; (B,E,H) represent the panicle initiation stage; and (C,F,I) represent the heading stage.
Agriculture 14 00283 g005
Figure 6. The effects of different types of sediment resources on K+ ion, Na+ ion, and K+/Na+ ratio at ear and maturity stage under salt stress. Within a column, means followed by the same letter are not significantly different at the 0.05 probability level according to the least significant different test (LSD, 0.05). CY1000: Chaoyou1000; LLY506: Longliangyou506. (AC) represent the heading stage; (DF) represent the mature stage.
Agriculture 14 00283 g006
Figure 7. Correlation analysis of yield composition, root morphology, and nitrogen use efficiency of rice. TL: Total length; RV: root volume; RSA: root surface area; PP: productive panicle; SPP: spikelets per panicle; GF: grain filling; TGW: 1000-grain weight; GY: grain yield; TNA: total nitrogen accumulation; NGPE: nitrogen grain production efficiency; NPFP: nitrogen partial factor productivity; NHI: nitrogen harvest index. *: Significant at the p < 0.05 level.
Agriculture 14 00283 g007
Table 1. Resource source and physicochemical properties of each type of sediment.
TreatmentLocationpHSOM
g kg−1
TN
g kg−1
AN
mg kg−1
AP
mg kg−1
AK
mg kg−1
Conventional soil109.14′ E 18.35′ N6.968.8440.4474.3418.88663.21
River sediment108.90′ E 18.43′ N5.6218.441.33313.3847.94187.12
Pond sediment108.82′ E 18.47′ N6.8530.992.51470.25122.29220.22
Note: SOM, soil organic matter; TN, total N content; AN, available N content; AP, available P content; AK, available K content.
Table 2. Effects of different types of sediment resources on grain yield and its components salt stress.
CultivarTreatmentsProductive
Panicle (m−2)
Spikelets
Per Panicle
Grain
Filling (%)
1000-grain
Weight (g)
Grain
Yield (t ha−1)
CY1000PS216.67 ± 11.81 a186.33 ± 9.07 a84.47 ± 0.81 a24.57 ± 0.87 a5.27 ± 0.25 a
RS197.92 ± 8.13 ab173.33 ± 11.06 a81.87 ± 0.40 a24.23 ± 1.83 a4.93 ± 0.25 a
CS192.92 ± 10.48 b157.67 ± 6.43 b80.37 ± 1.79 a21.40 ± 0.66 b3.20 ± 0.26 b
LLY506PS255.63 ± 12.91 a182.33 ± 5.13 a83.97 ± 3.80 a22.50 ± 0.70 a5.17 ± 0.31 a
RS233.33 ± 8.32 b158.33 ± 8.50 b77.07 ± 4.48 b20.87 ± 1.29 a4.80 ± 0.26 a
CS231.88 ± 14.13 b135.00 ± 12.77 c82.6 a ± 3.48 ab18.67 ± 2.87 b3.60 ± 0.10 b
Cultivars (C)***ns**ns
Sediment Resources (S)********
C × Snsnsnsnsns
Note: Within a column, means followed by the same letter are not significantly different at the 0.05 probability level according to the least significant different test (LSD, 0.05). ns, not significant (p > 0.05); * significant at 0.01 < p < 0.05; ** significant at p < 0.01; CY1000: Chaoyou1000; LLY506: Longliangyou506; PS: pond sediment; RS: river sediment; CS: conventional soil.
Table 3. Effects of different types of sediment resources on nitrogen accumulation and nitrogen use efficiency under salt stress.
CultivarTreatmentsTNA (kg ha−1)NGPE (kg kg−1)PFPN (kg kg−1)NHI
CY1000PS147.94 ± 1.93 a34.25 ± 1.76 a28.15 ± 1.39 a0.49 ± 0.04 a
RS139.92 ± 7.34 a35.26 ± 0.31 a27.41 ± 1.40 a0.46 ± 0.02 ab
CS112.42 ± 2.41 b28.50 ± 2.92 b17.78 ± 1.47 b0.41 ± 0.01 b
LLY506PS141.92 ± 7.96 a36.52 ± 3.62 a28.70 ± 1.70 a0.50 ± 0.03 a
RS127.34 ± 5.23 b37.68 ± 0.68 a26.67 ± 1.47 a0.45 ± 0.05 b
CS112.37 ± 7.83 c32.10 ± 1.47 b20.00 ± 0.56 b0.44 ± 0.05 b
Cultivars (C)ns*nsns
Sediment Resources (S)*******
C × Snsnsnsns
Note: Within a column, means followed by the same letter are not significantly different at the 0.05 probability level according to the least significant different test (LSD, 0.05). ns: not significant (p > 0.05); * significant at 0.01 < p < 0.05; ** significant at p < 0.01; CY1000: Chaoyou1000; LLY506: Longliangyou506; PS: pond sediment; RS: river sediment; CS: conventional soil; NGPE: nitrogen grain production efficiency; NHI: nitrogen harvest index; PFPN: nitrogen partial factor productivity; TNA: total nitrogen accumulation.
Disclaimer/Publisher’s Note: The statements, opinions and data contained in all publications are solely those of the individual author(s) and contributor(s) and not of MDPI and/or the editor(s). MDPI and/or the editor(s) disclaim responsibility for any injury to people or property resulting from any ideas, methods, instructions or products referred to in the content.

