
Consumer Evaluations of and Attitudes towards New Genome Editing Techniques: An Italian Case Study
Abstract
:1. Introduction
2. Literature Review
3. Materials and Methods
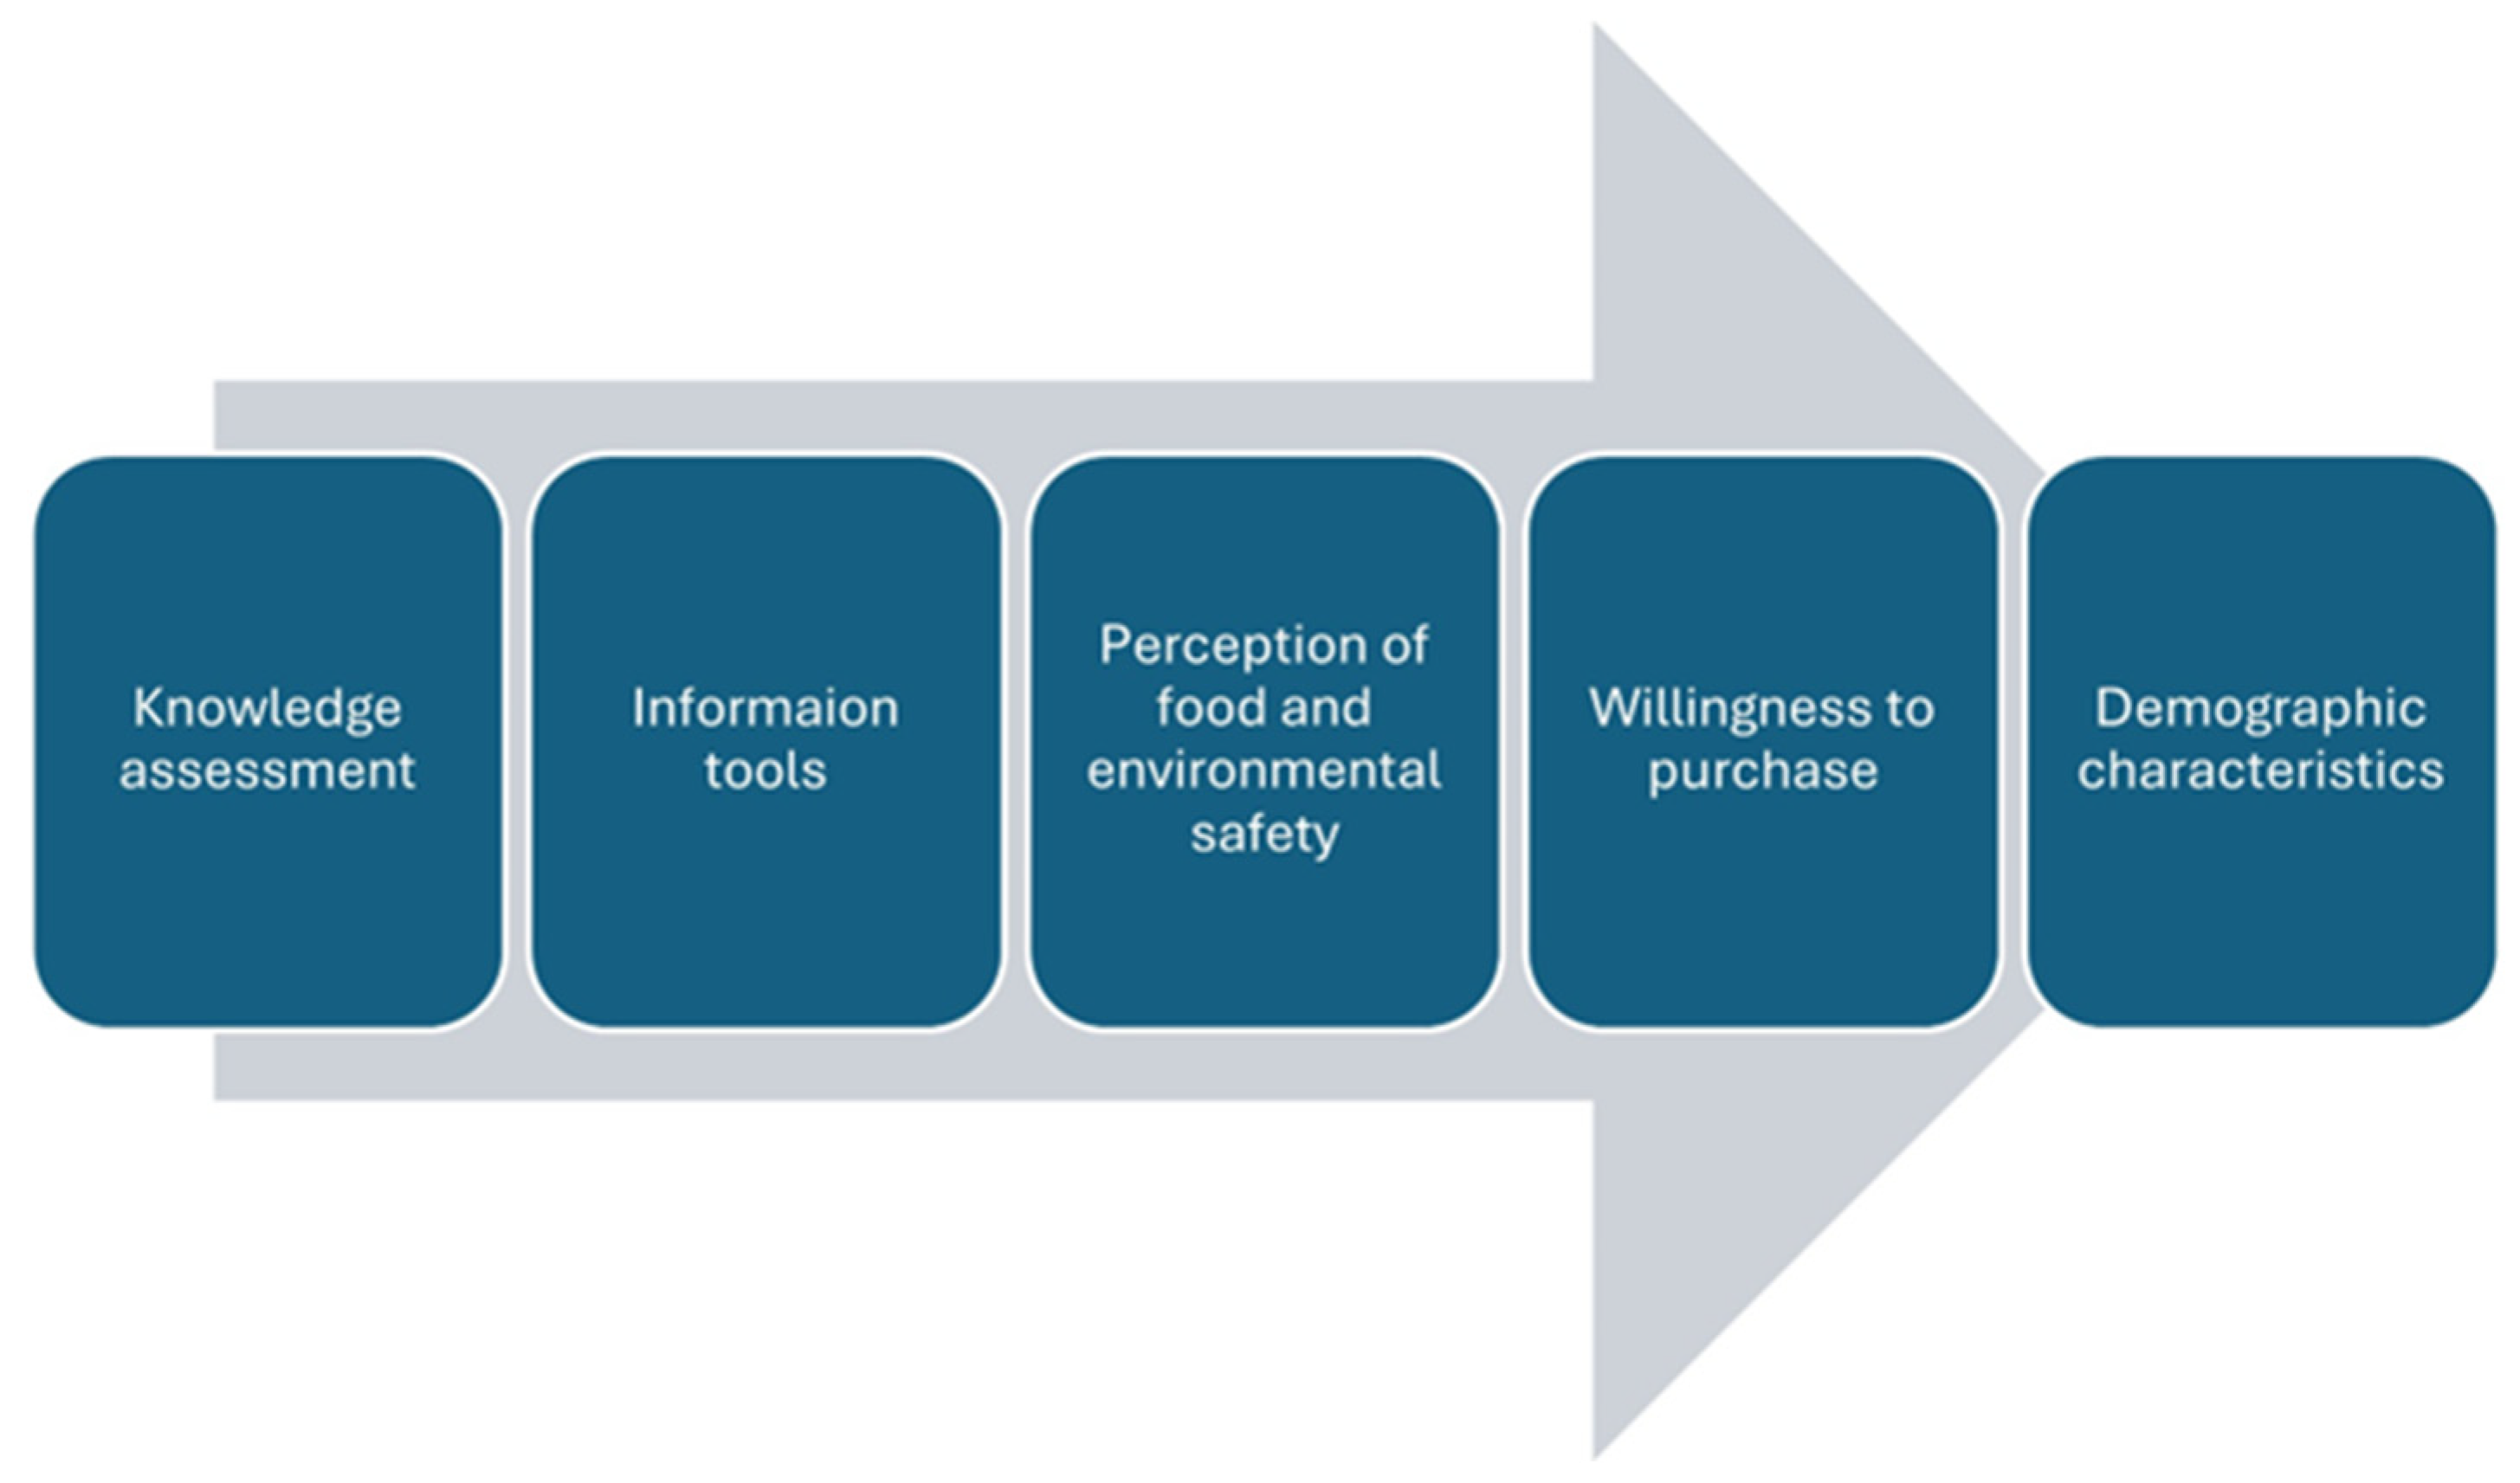
3.1. Survey Description
3.2. Survey Structure
4. Results
4.1. A Preliminary Analysis of the Survey Results
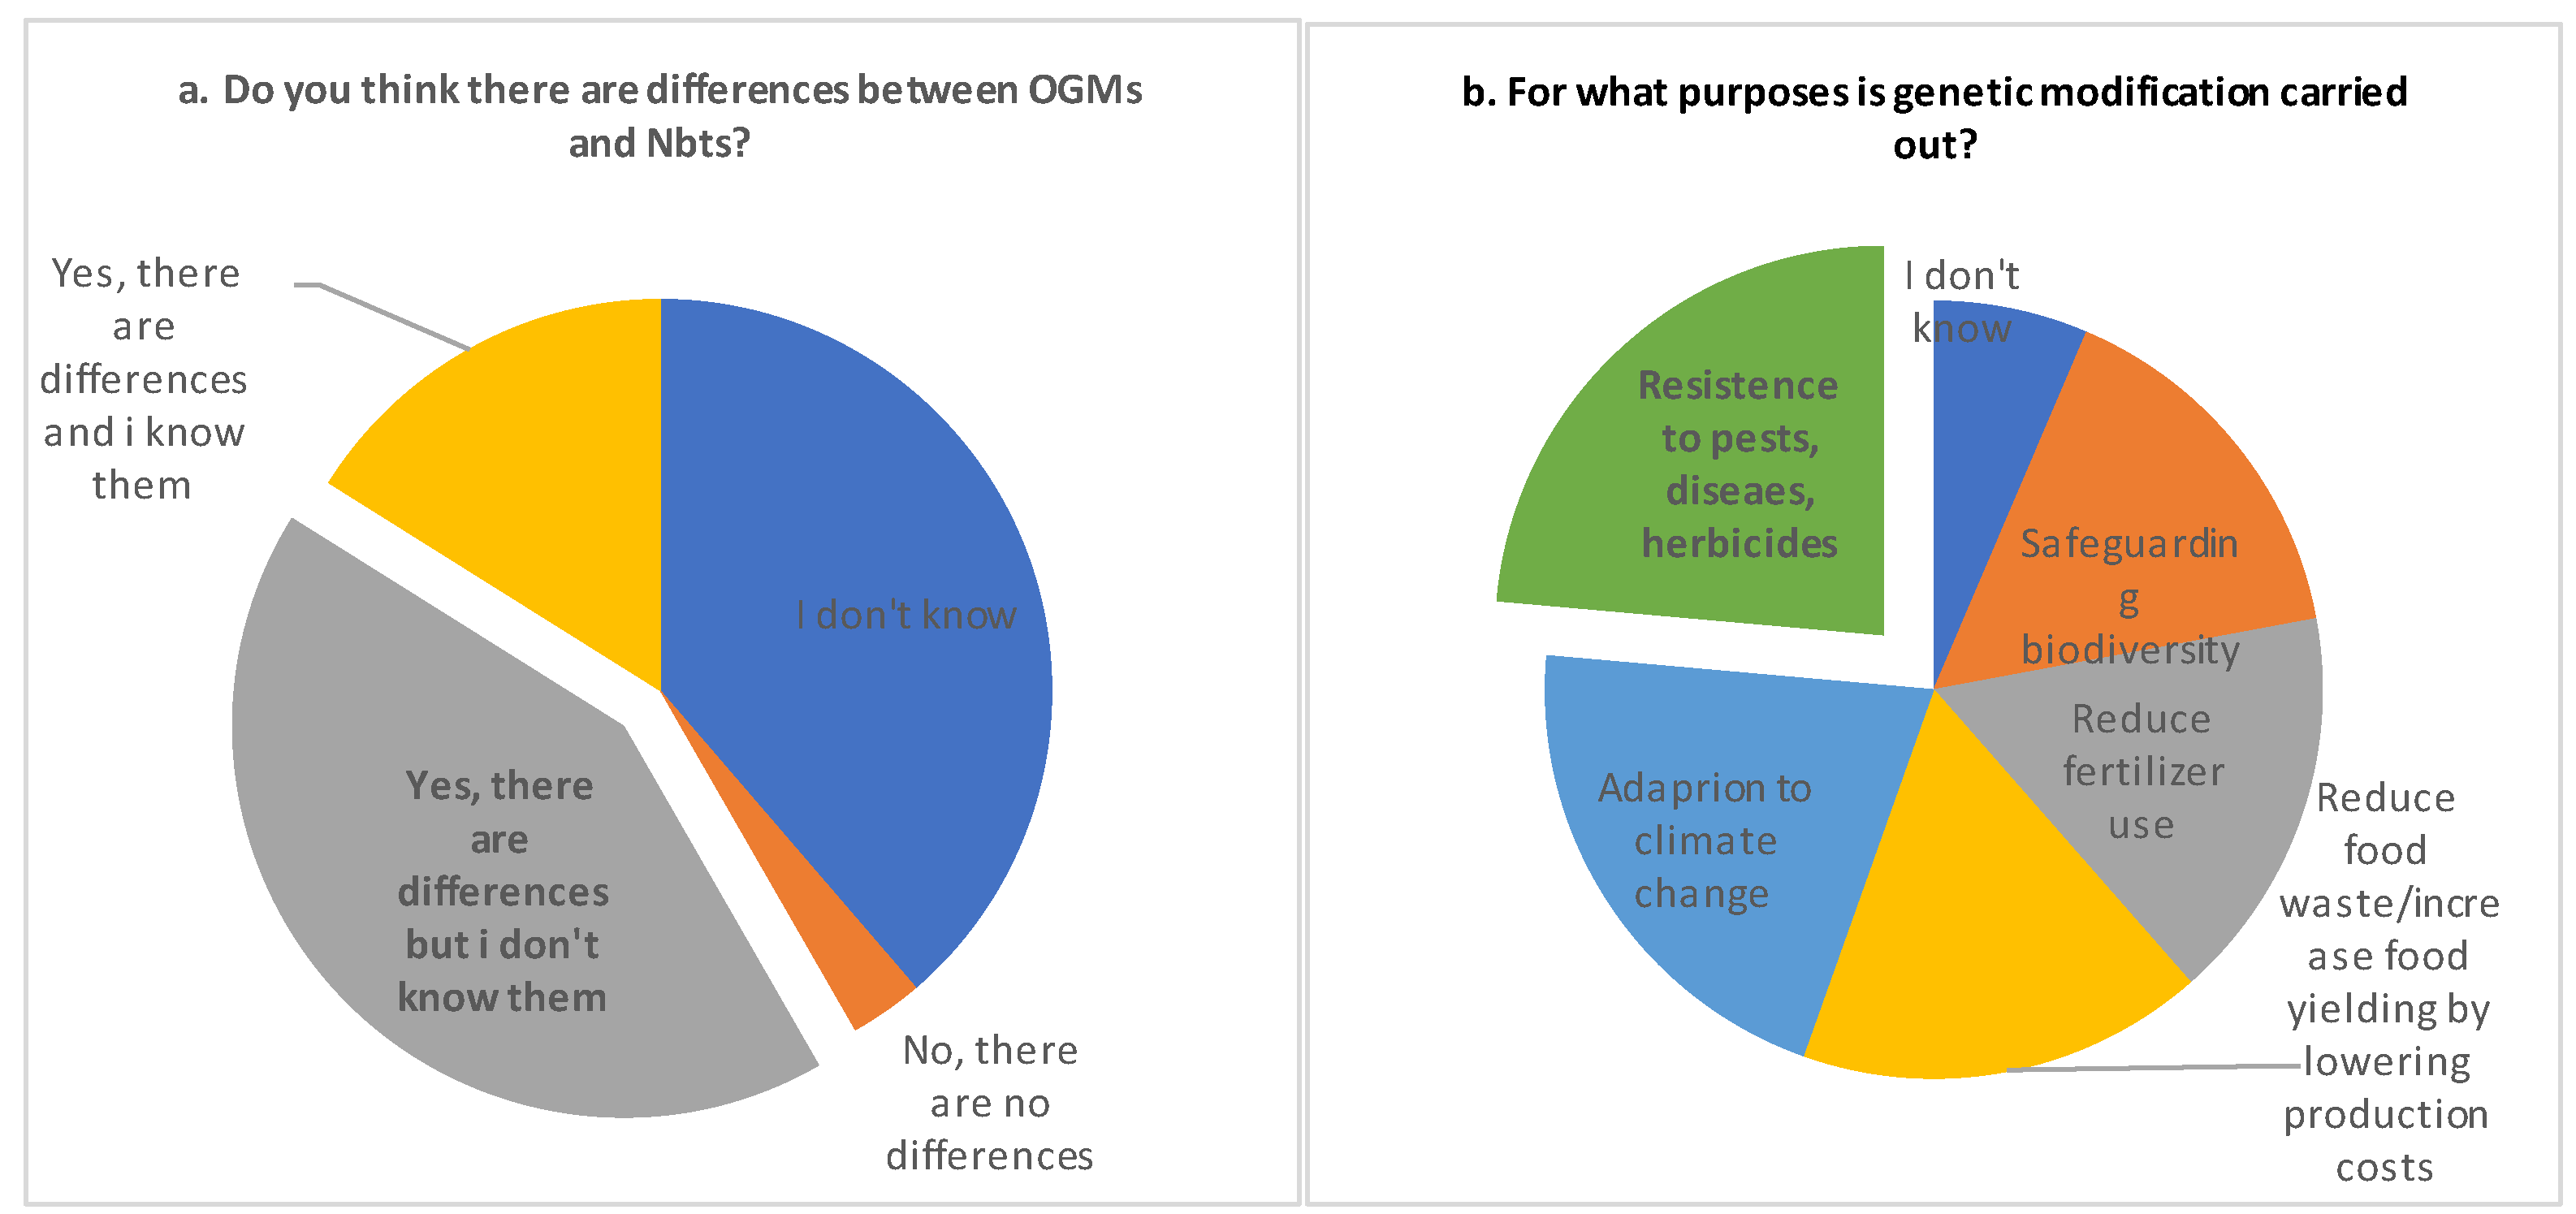
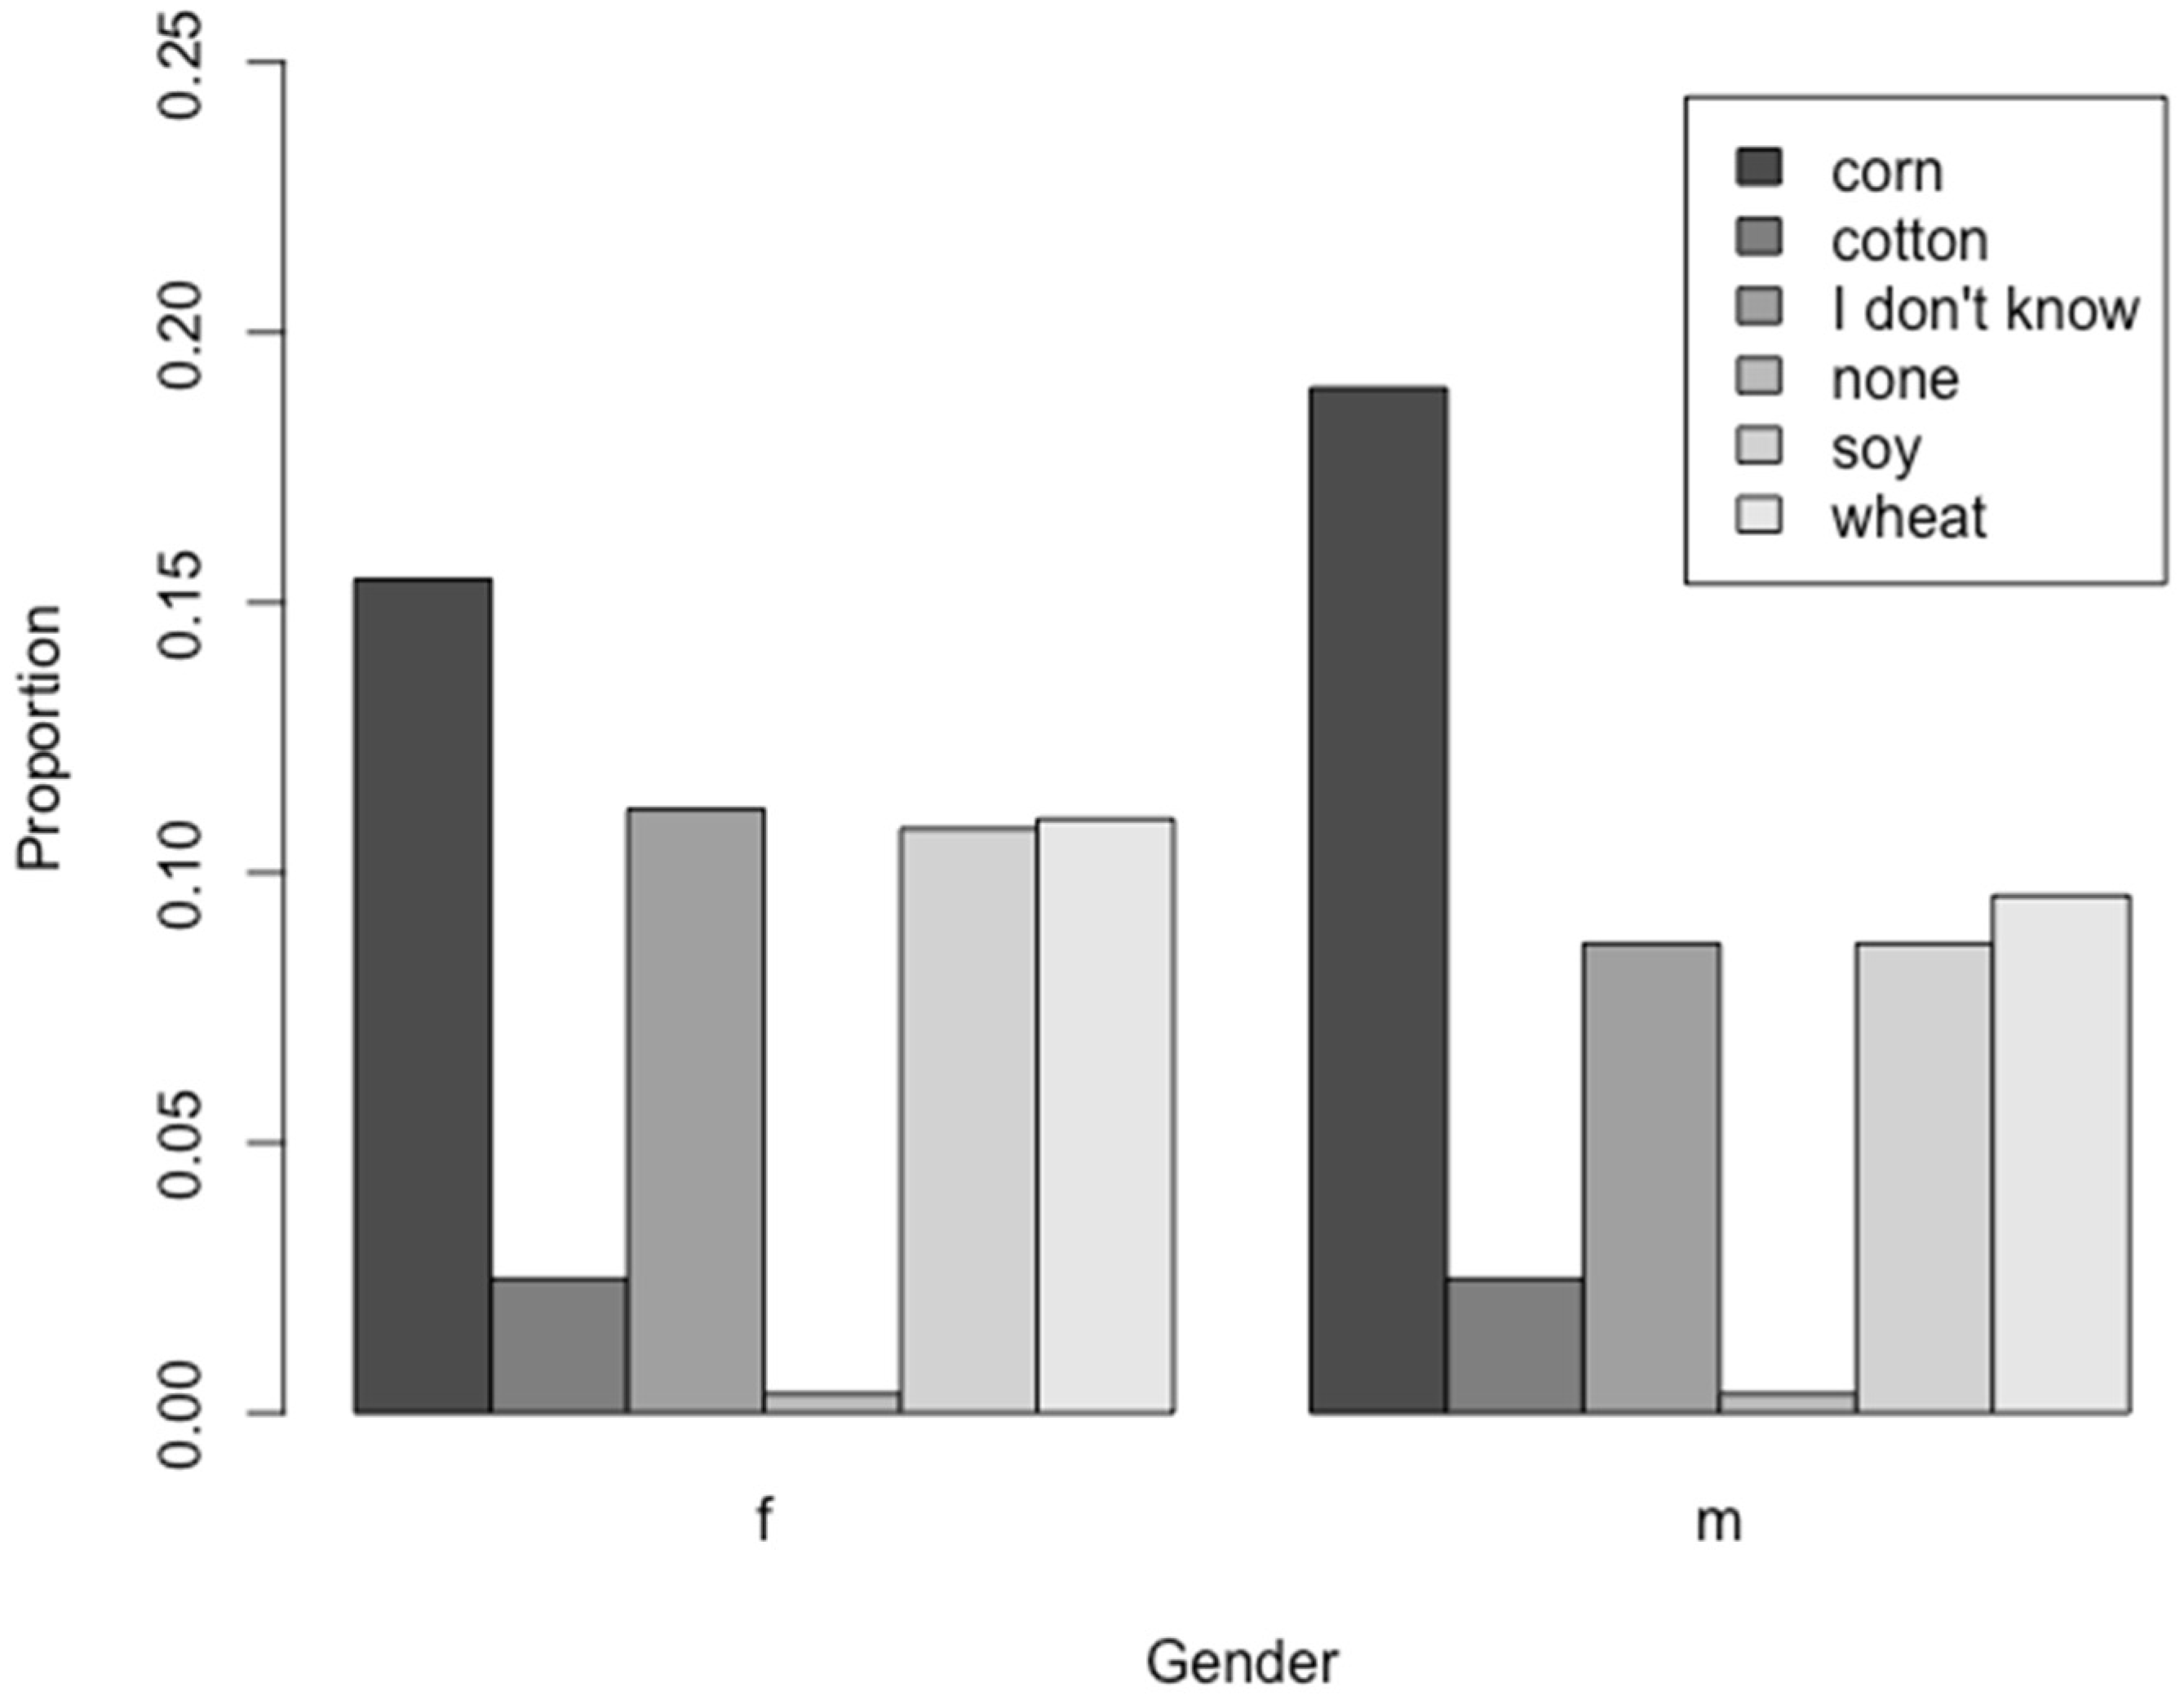
4.1.1. Consumers’ Subjective and Real Knowledge
4.1.2. Consumer Information Tools
4.2. Consumer Behavior
4.3. Descriptive Analysis
4.3.1. Consumer Analysis of Real and Subjective Knowledge
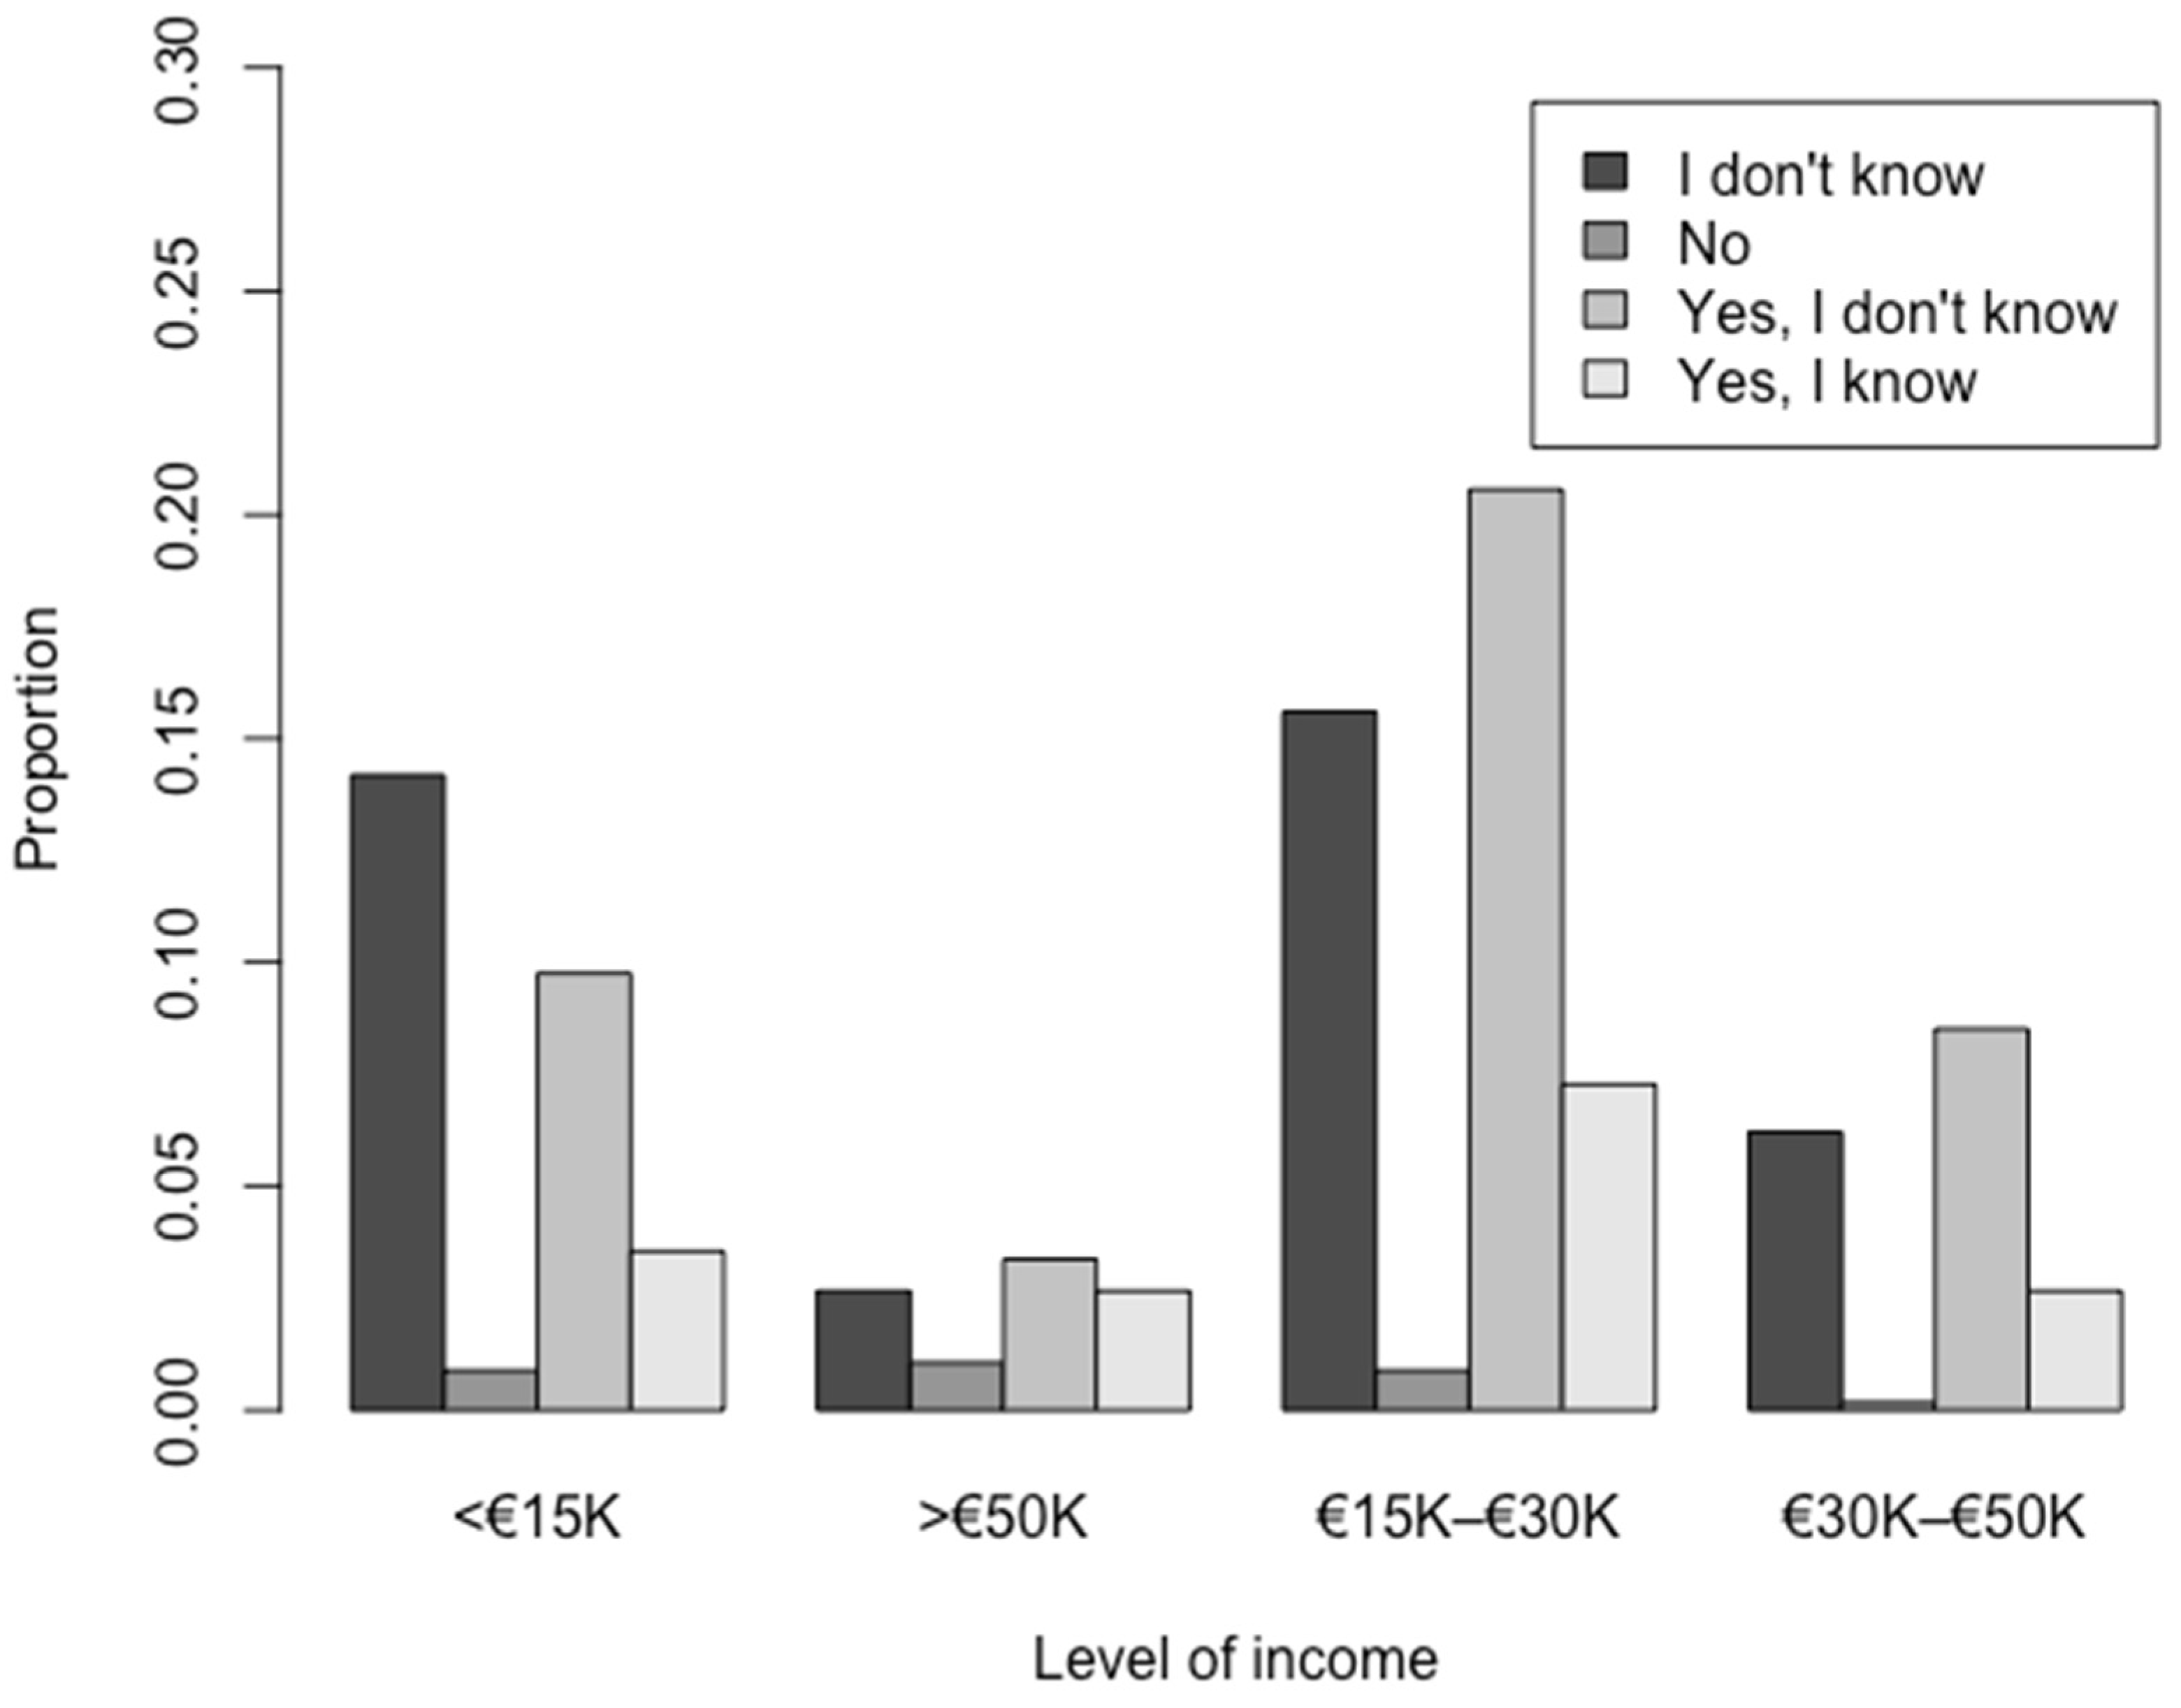
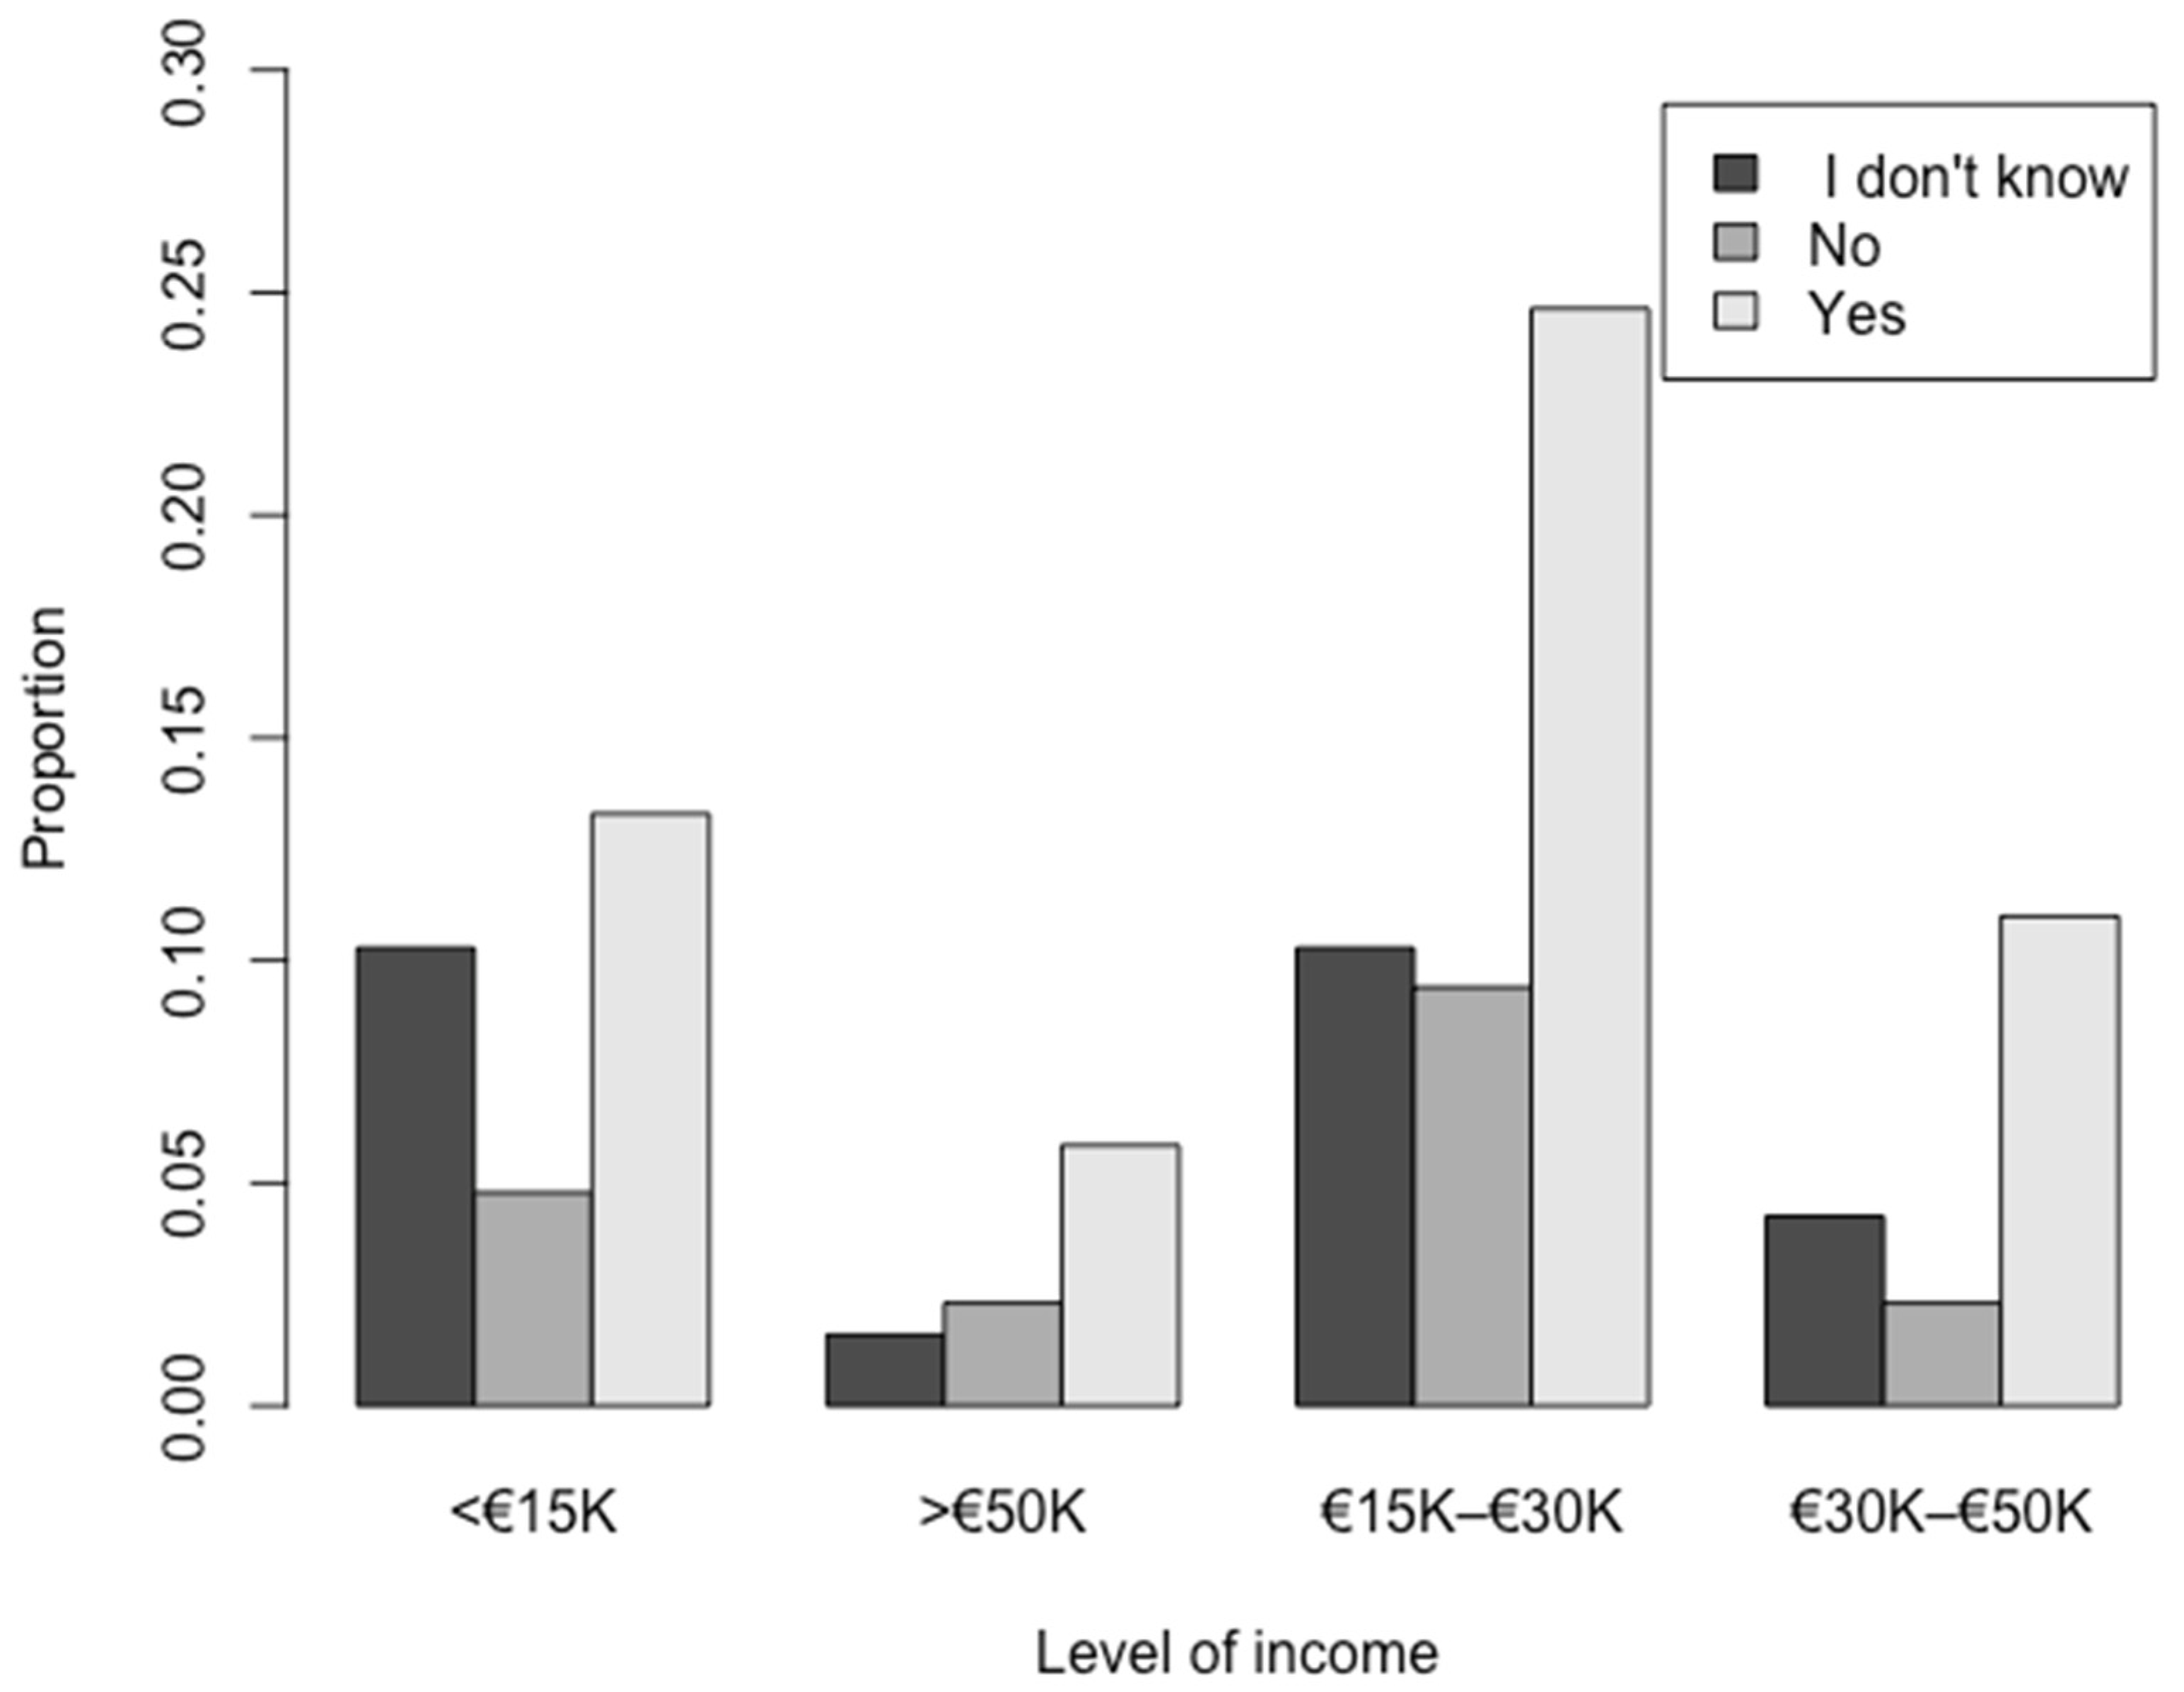
4.3.2. Consumers’ Subjective Knowledge and Environmental Sustainability According to Income Levels
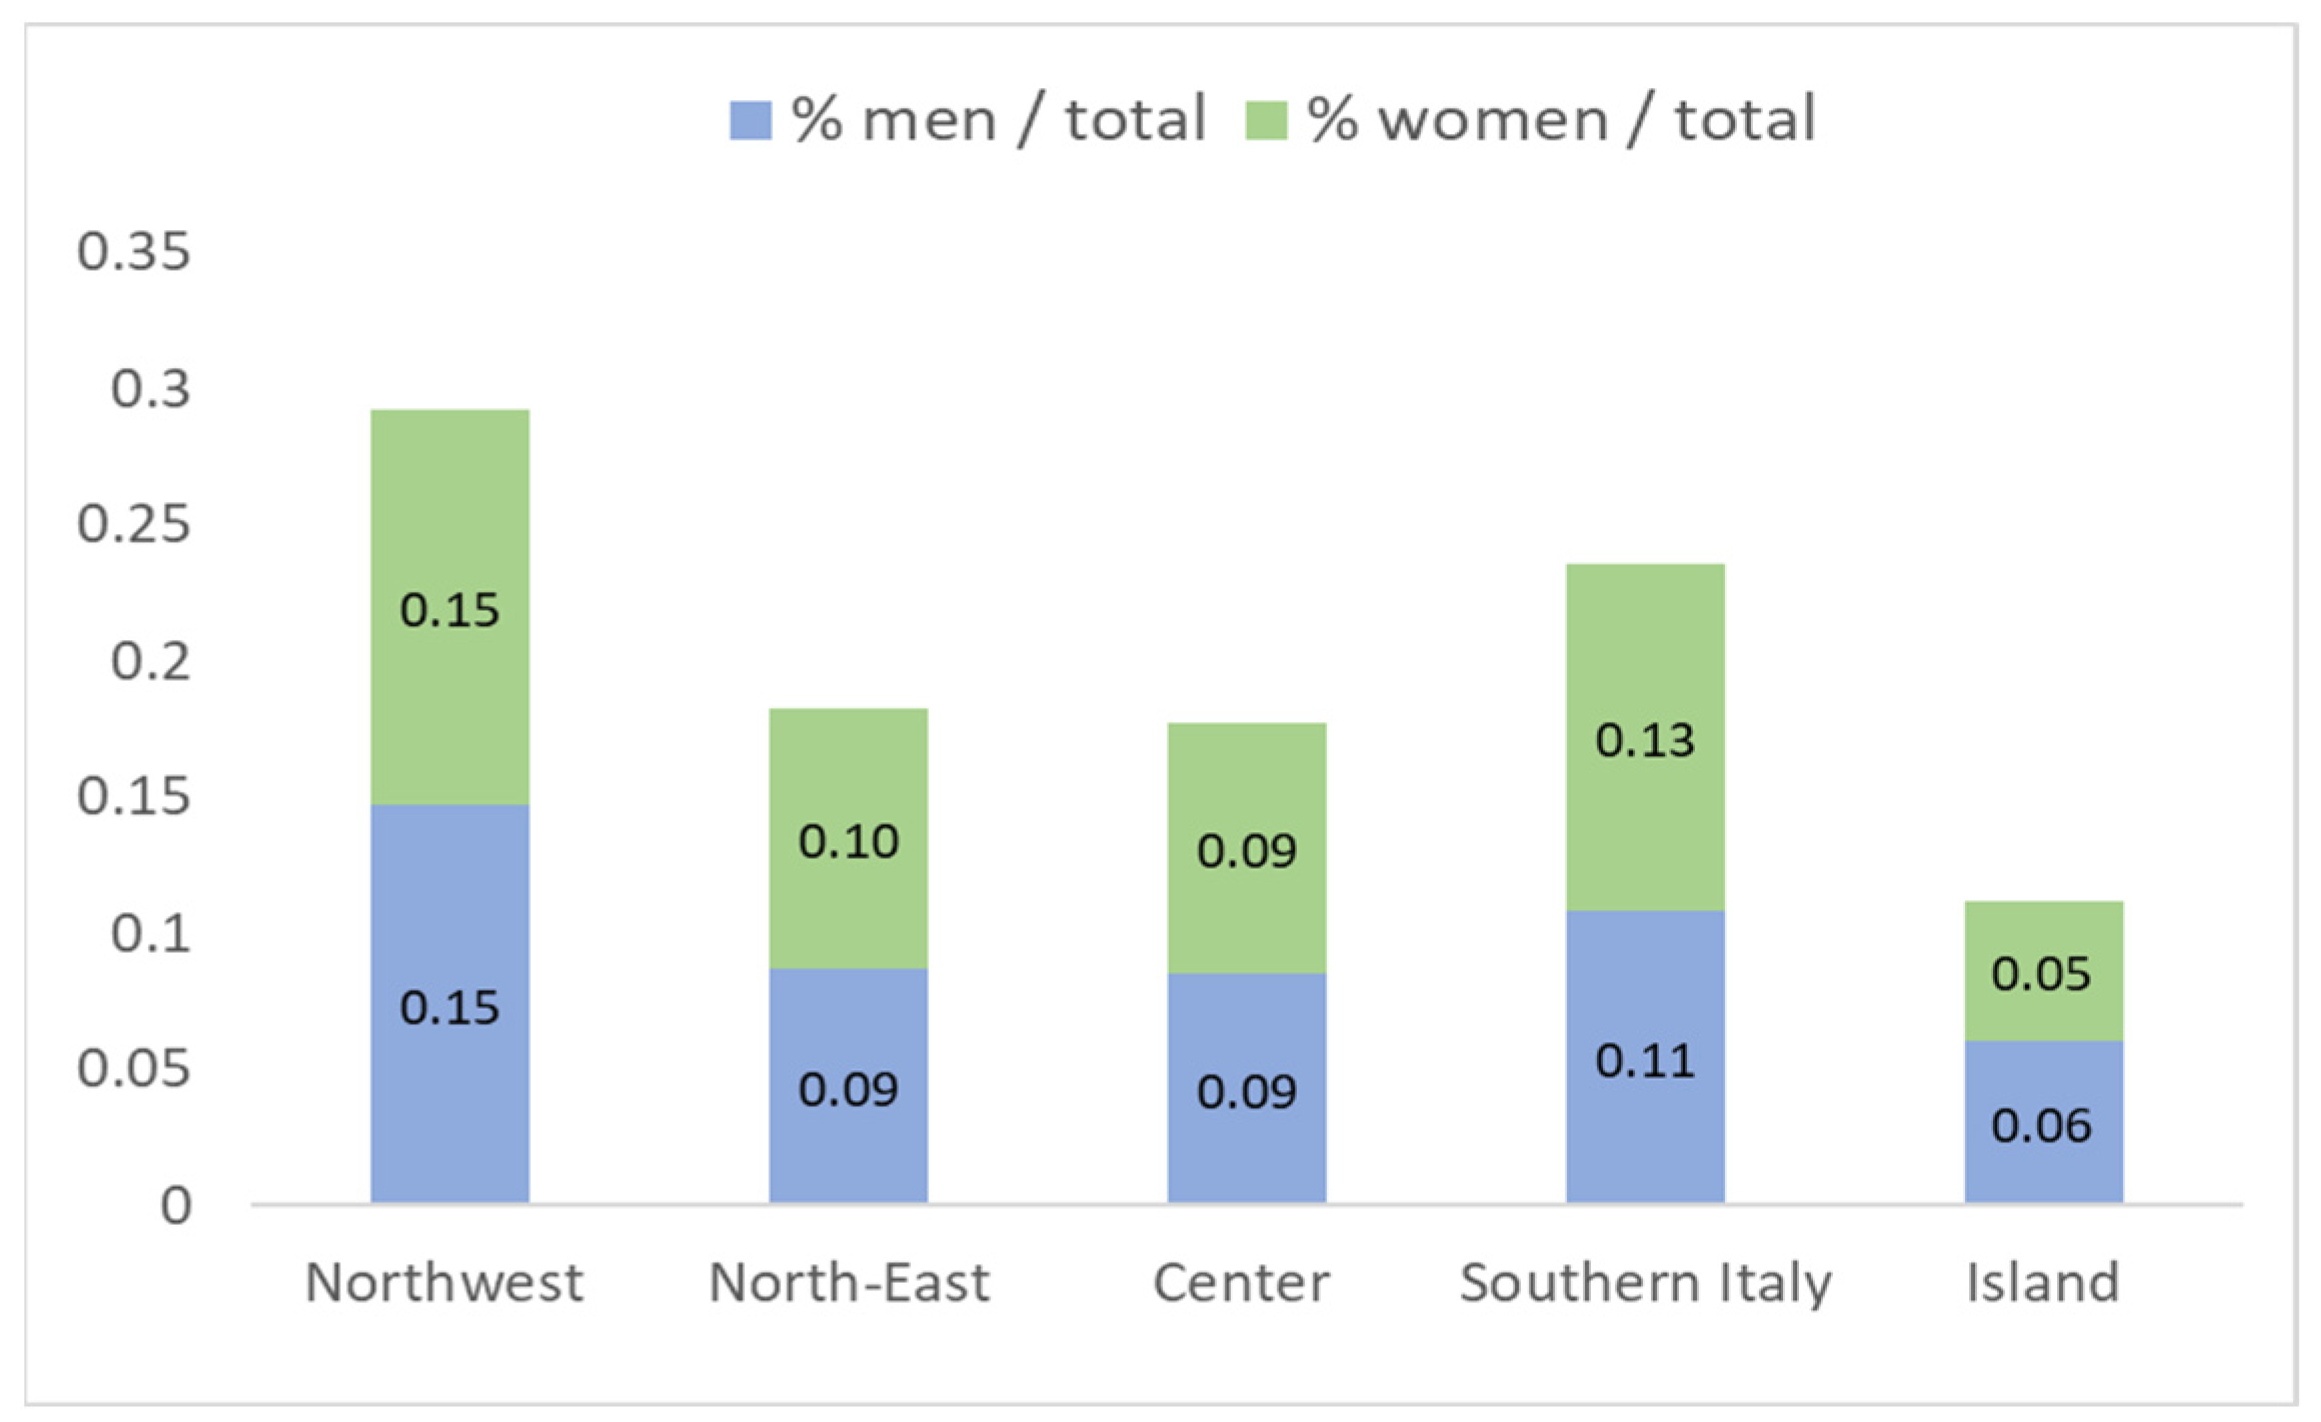
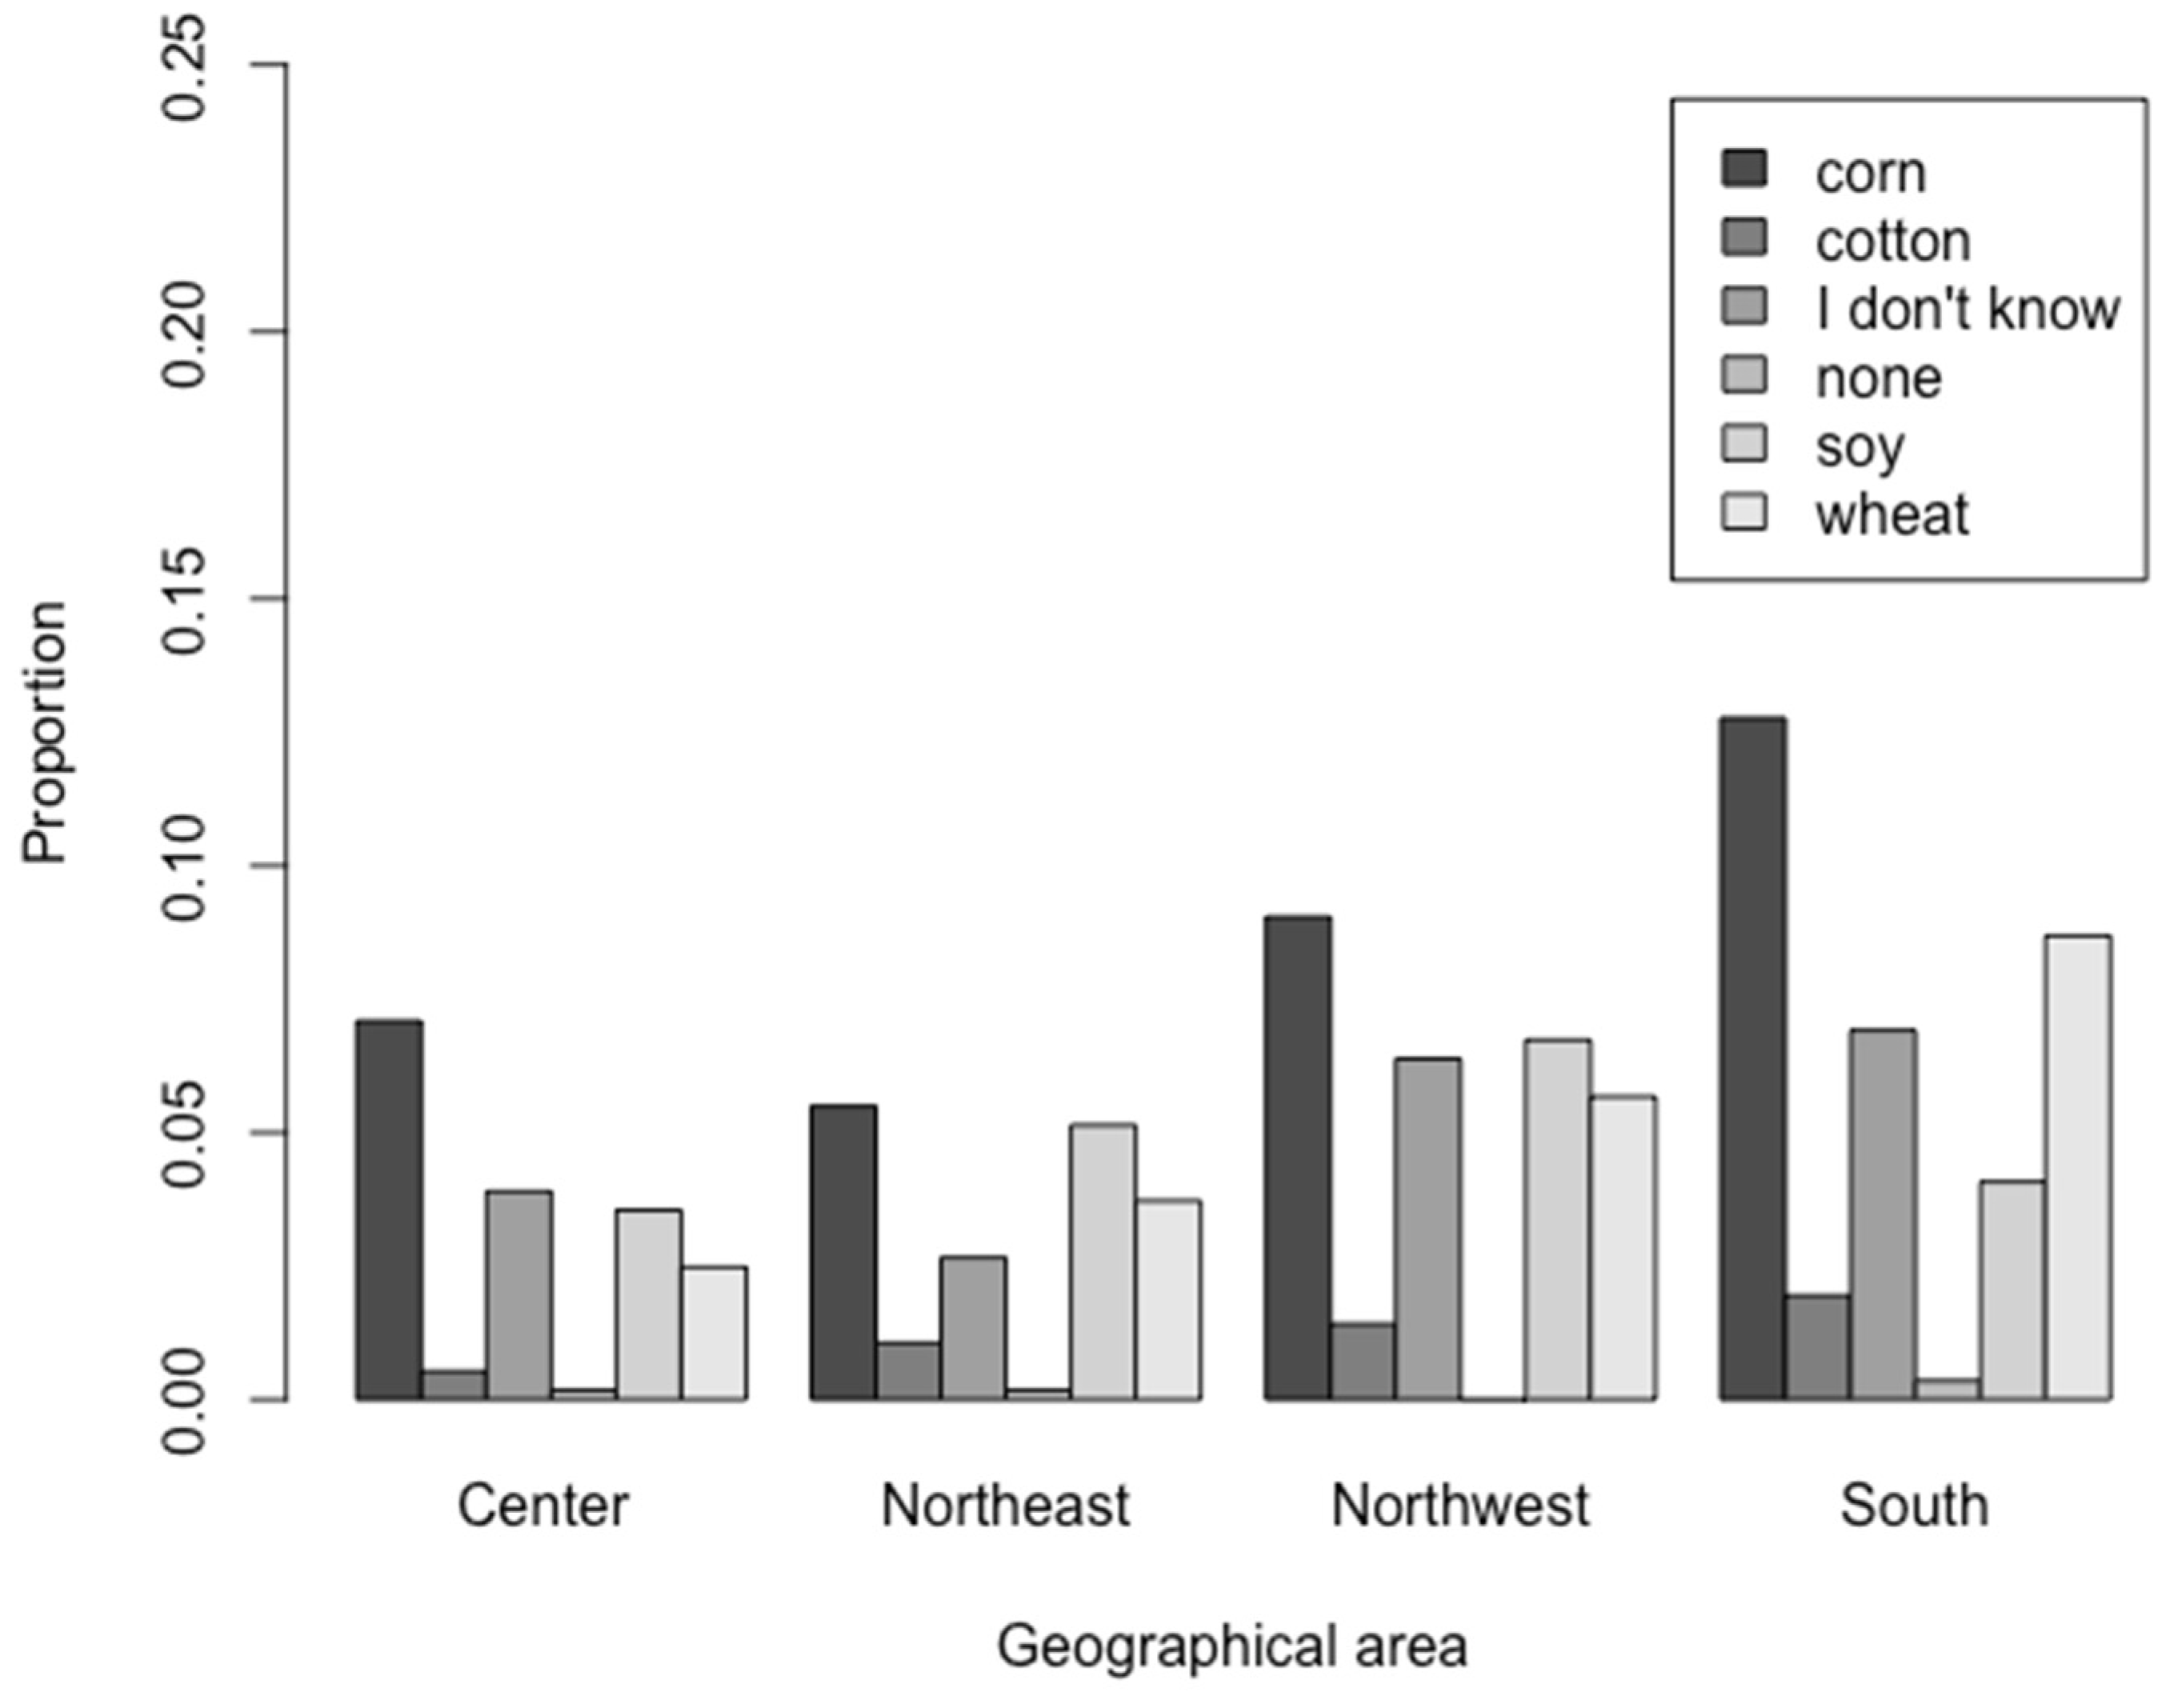
4.3.3. Consumers’ Real Knowledge According to Geographical Area
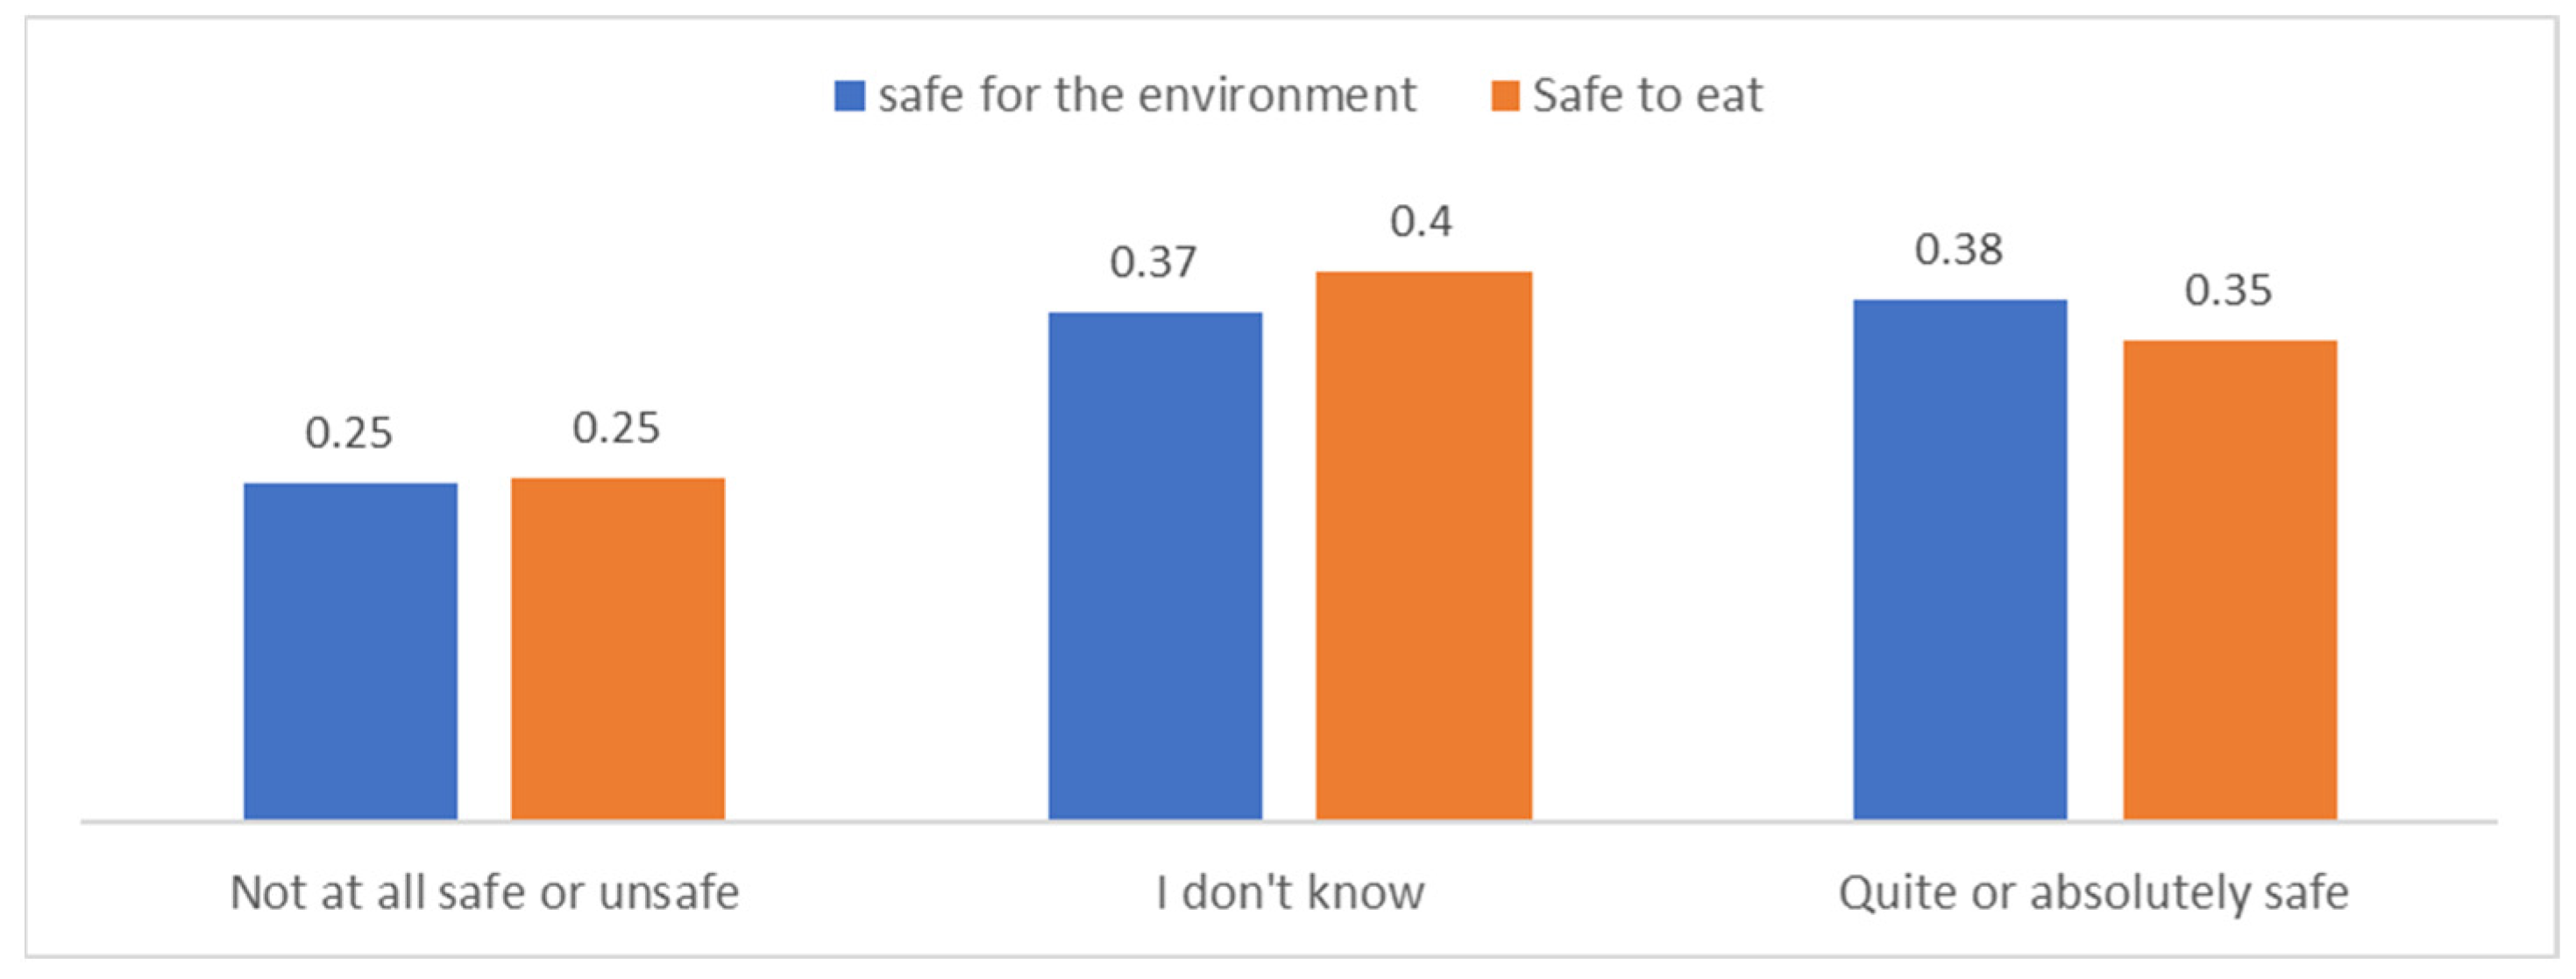
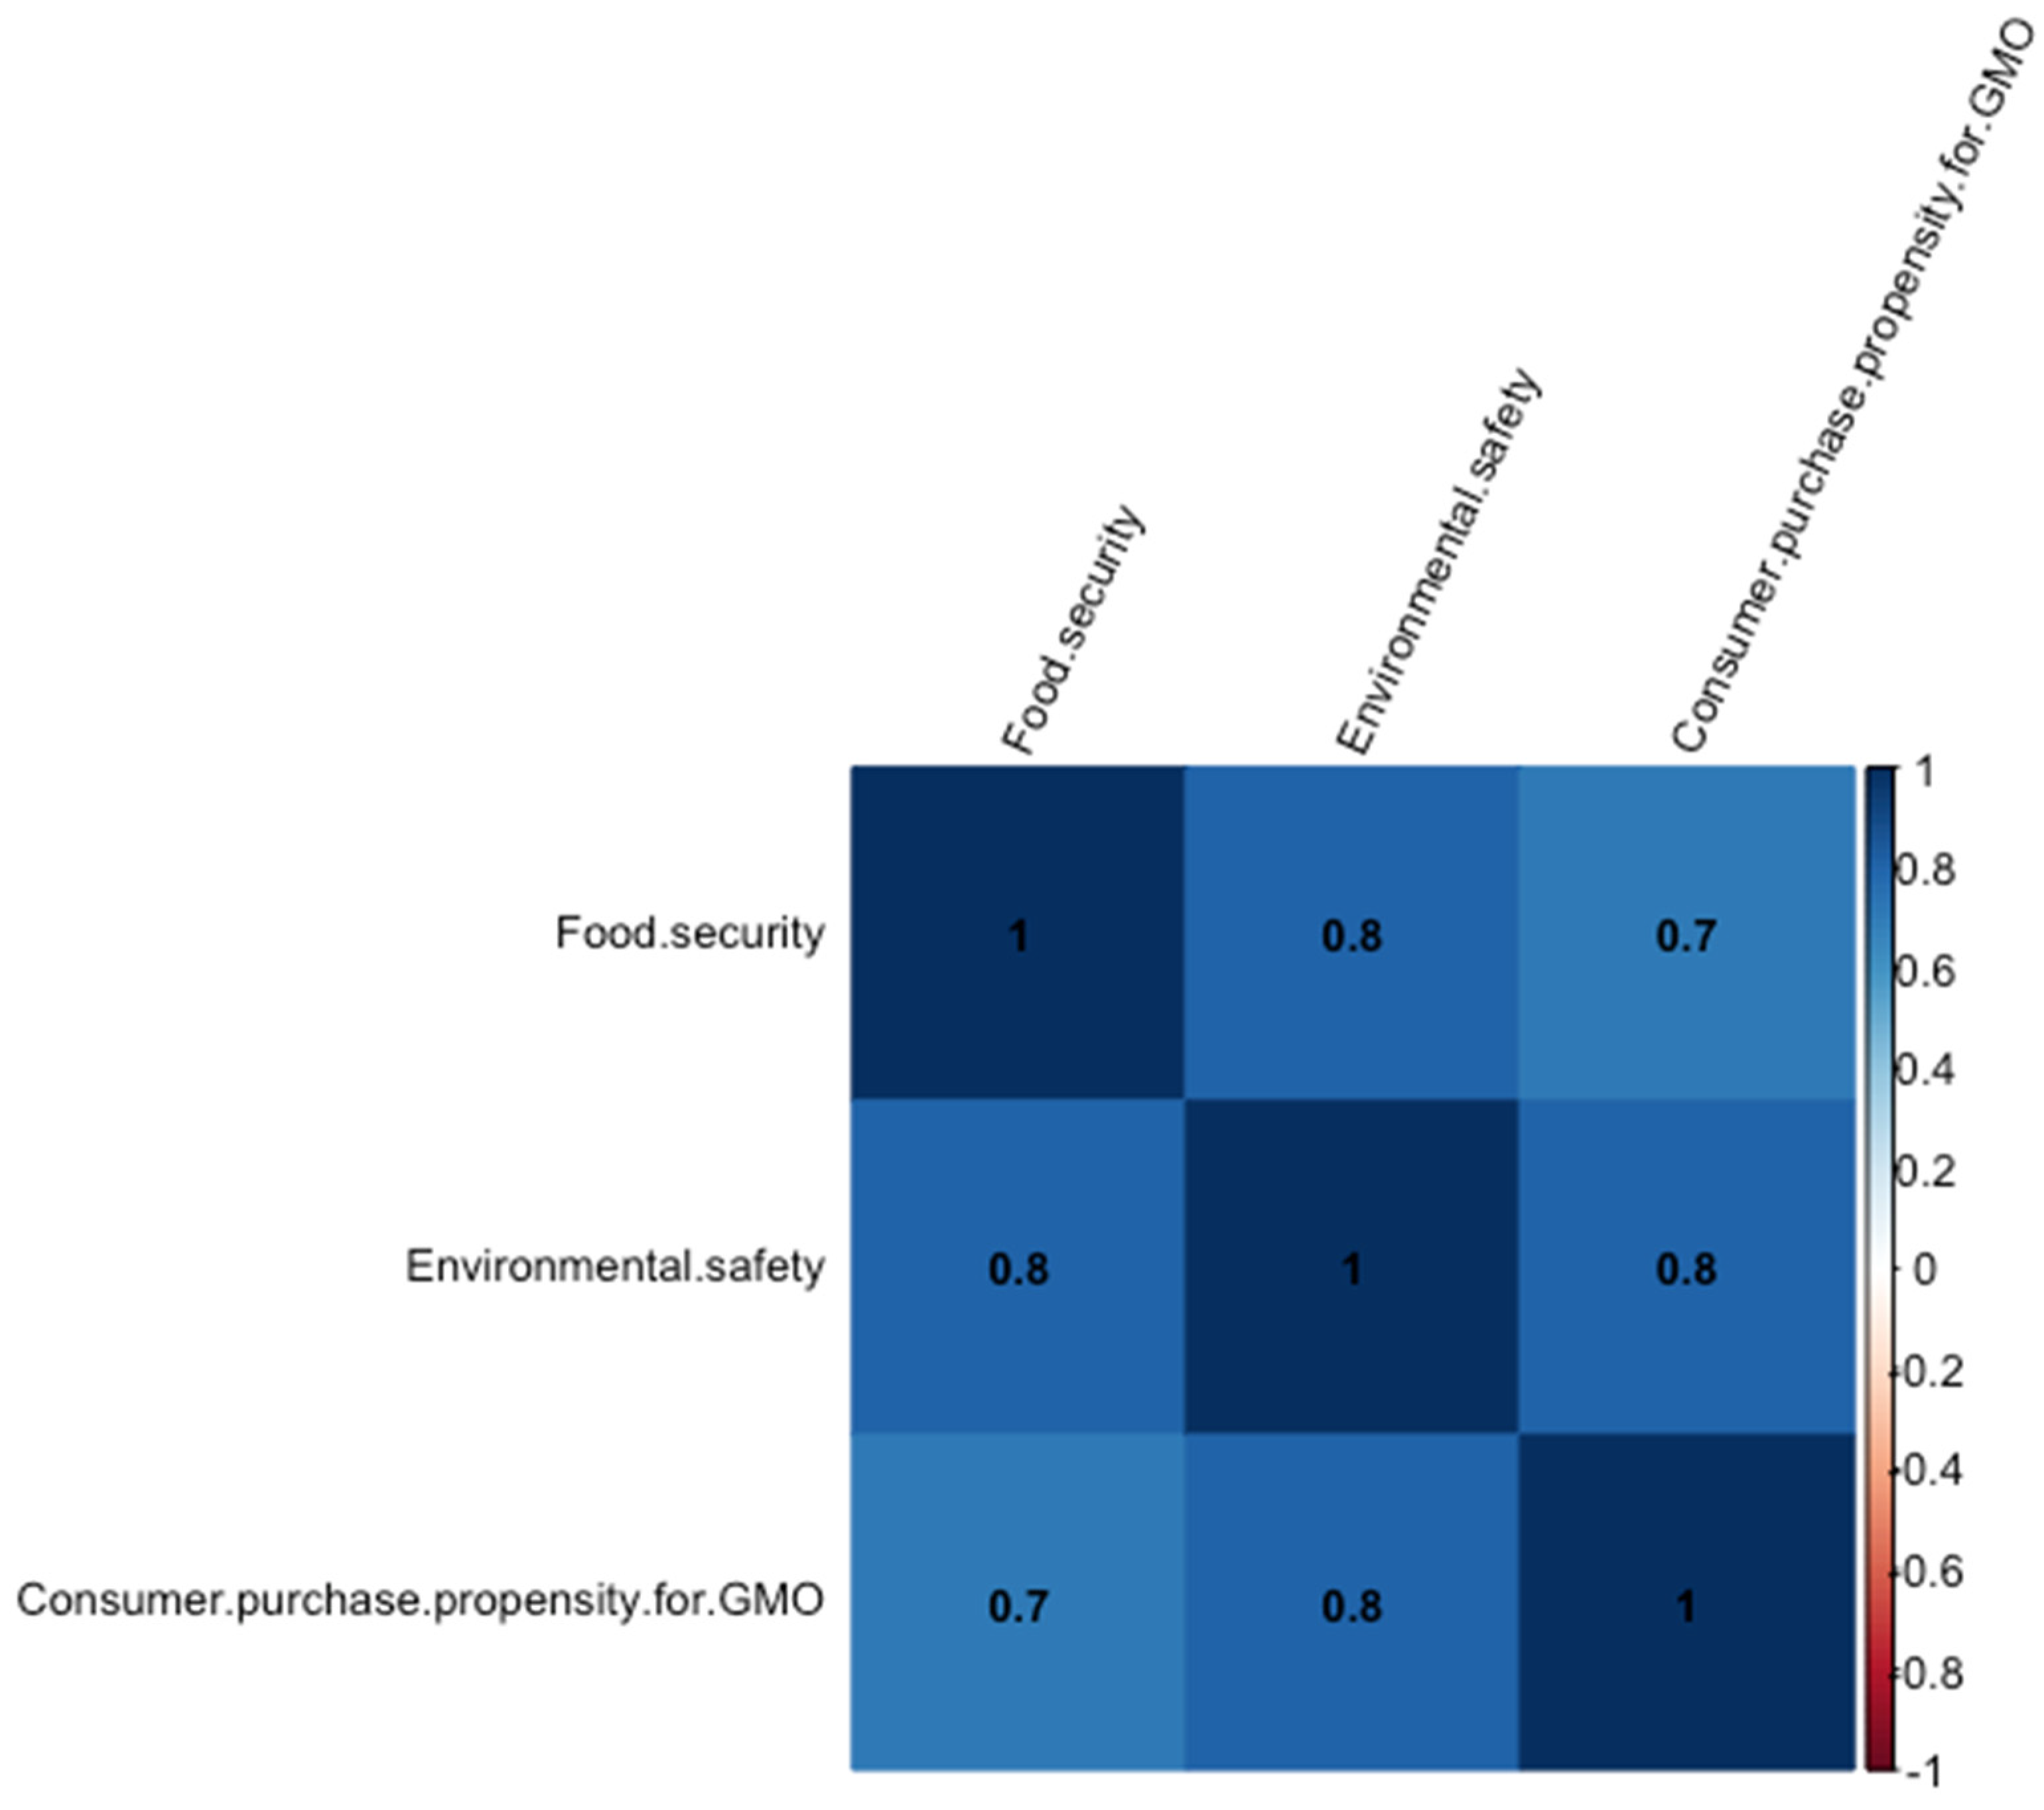
4.3.4. Correlation Analysis: Food Security, Environmental Safety, and Consumer Purchase Propensity for GMOs
5. Discussion and Conclusions
Author Contributions
Funding
Institutional Review Board Statement
Data Availability Statement
Acknowledgments
Conflicts of Interest
Appendix A

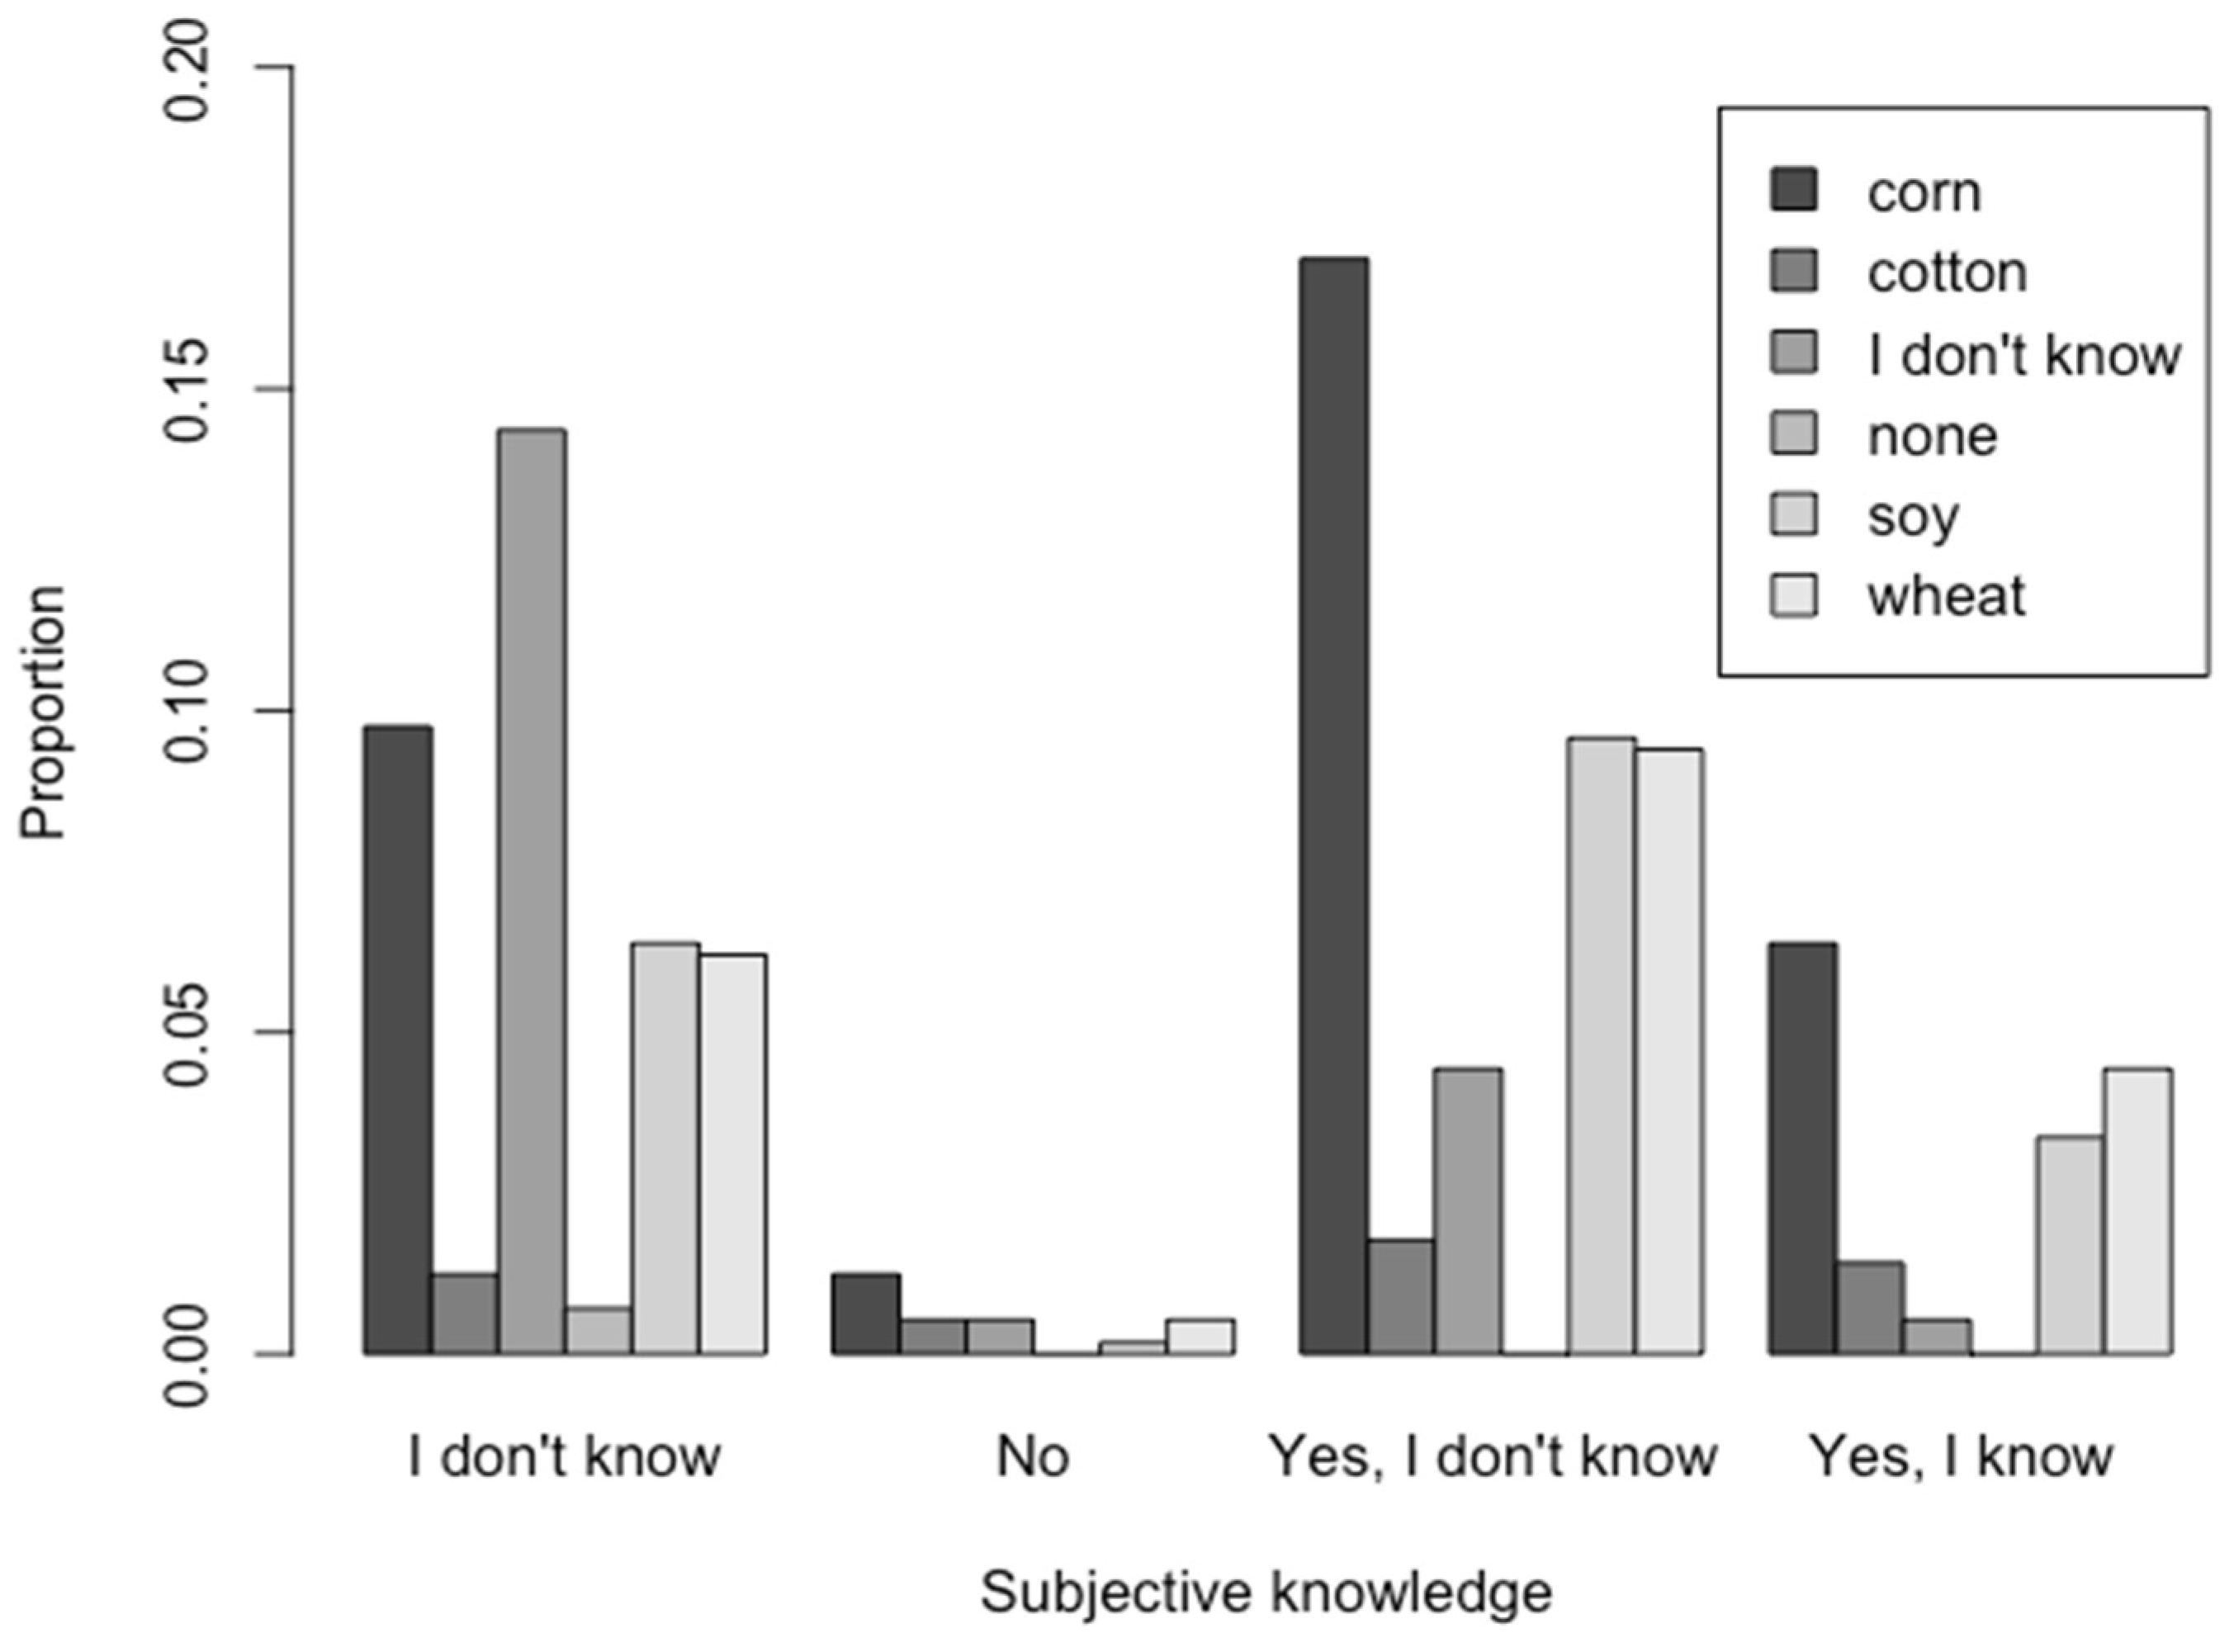
| Subjective Knowledge | ||||||
| I Don’t Know | No | Yes, I Don’t Know | Yes, I Know | Total | ||
| Real knowledge | corn | 25.2 | 41.2 | 40.3 | 39.6 | 34.4 |
| cotton | 3.2 | 17.7 | 4.2 | 8.8 | 5 | |
| I don’t know | 37.2 | 17.7 | 10.5 | 3.3 | 19.9 | |
| none | 1.8 | 0 | 0 | 0 | 0.7 | |
| soy | 16.5 | 5.9 | 22.7 | 20.9 | 19.5 | |
| wheat | 16.1 | 17.7 | 22.7 | 27.5 | 20.6 | |
| Total | 100 | 100 | 100 | 100 | 100 | |
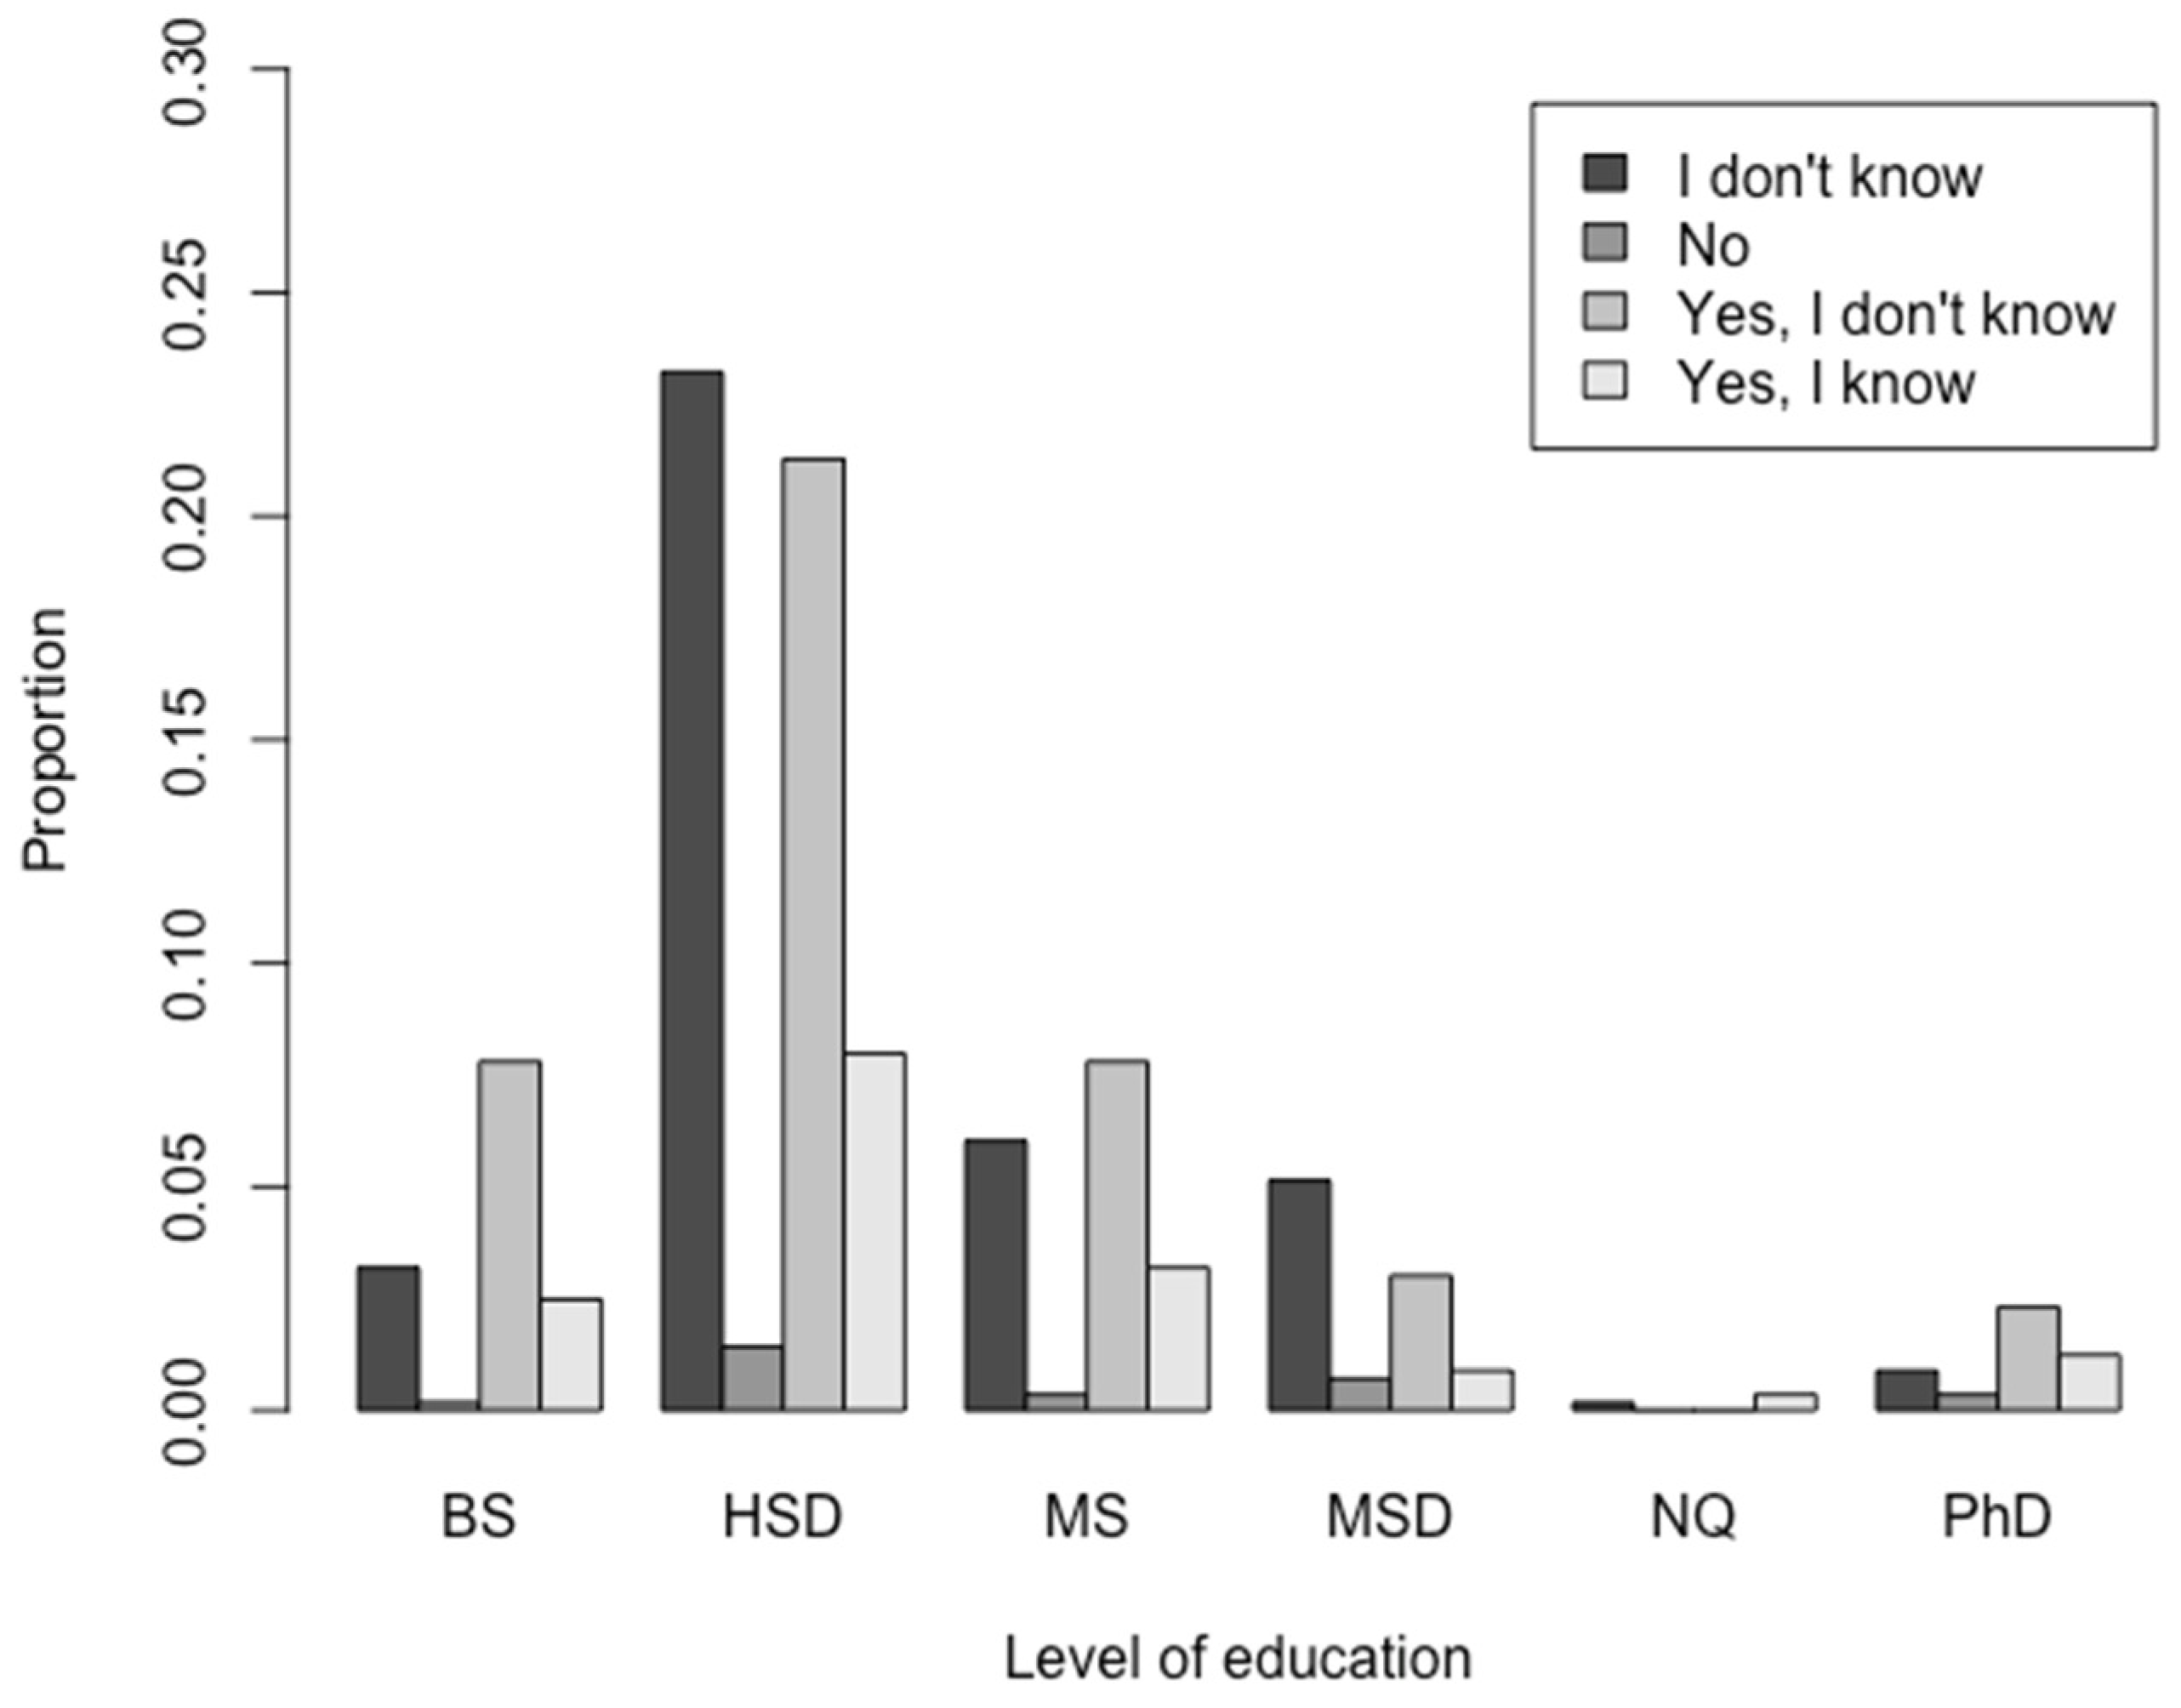
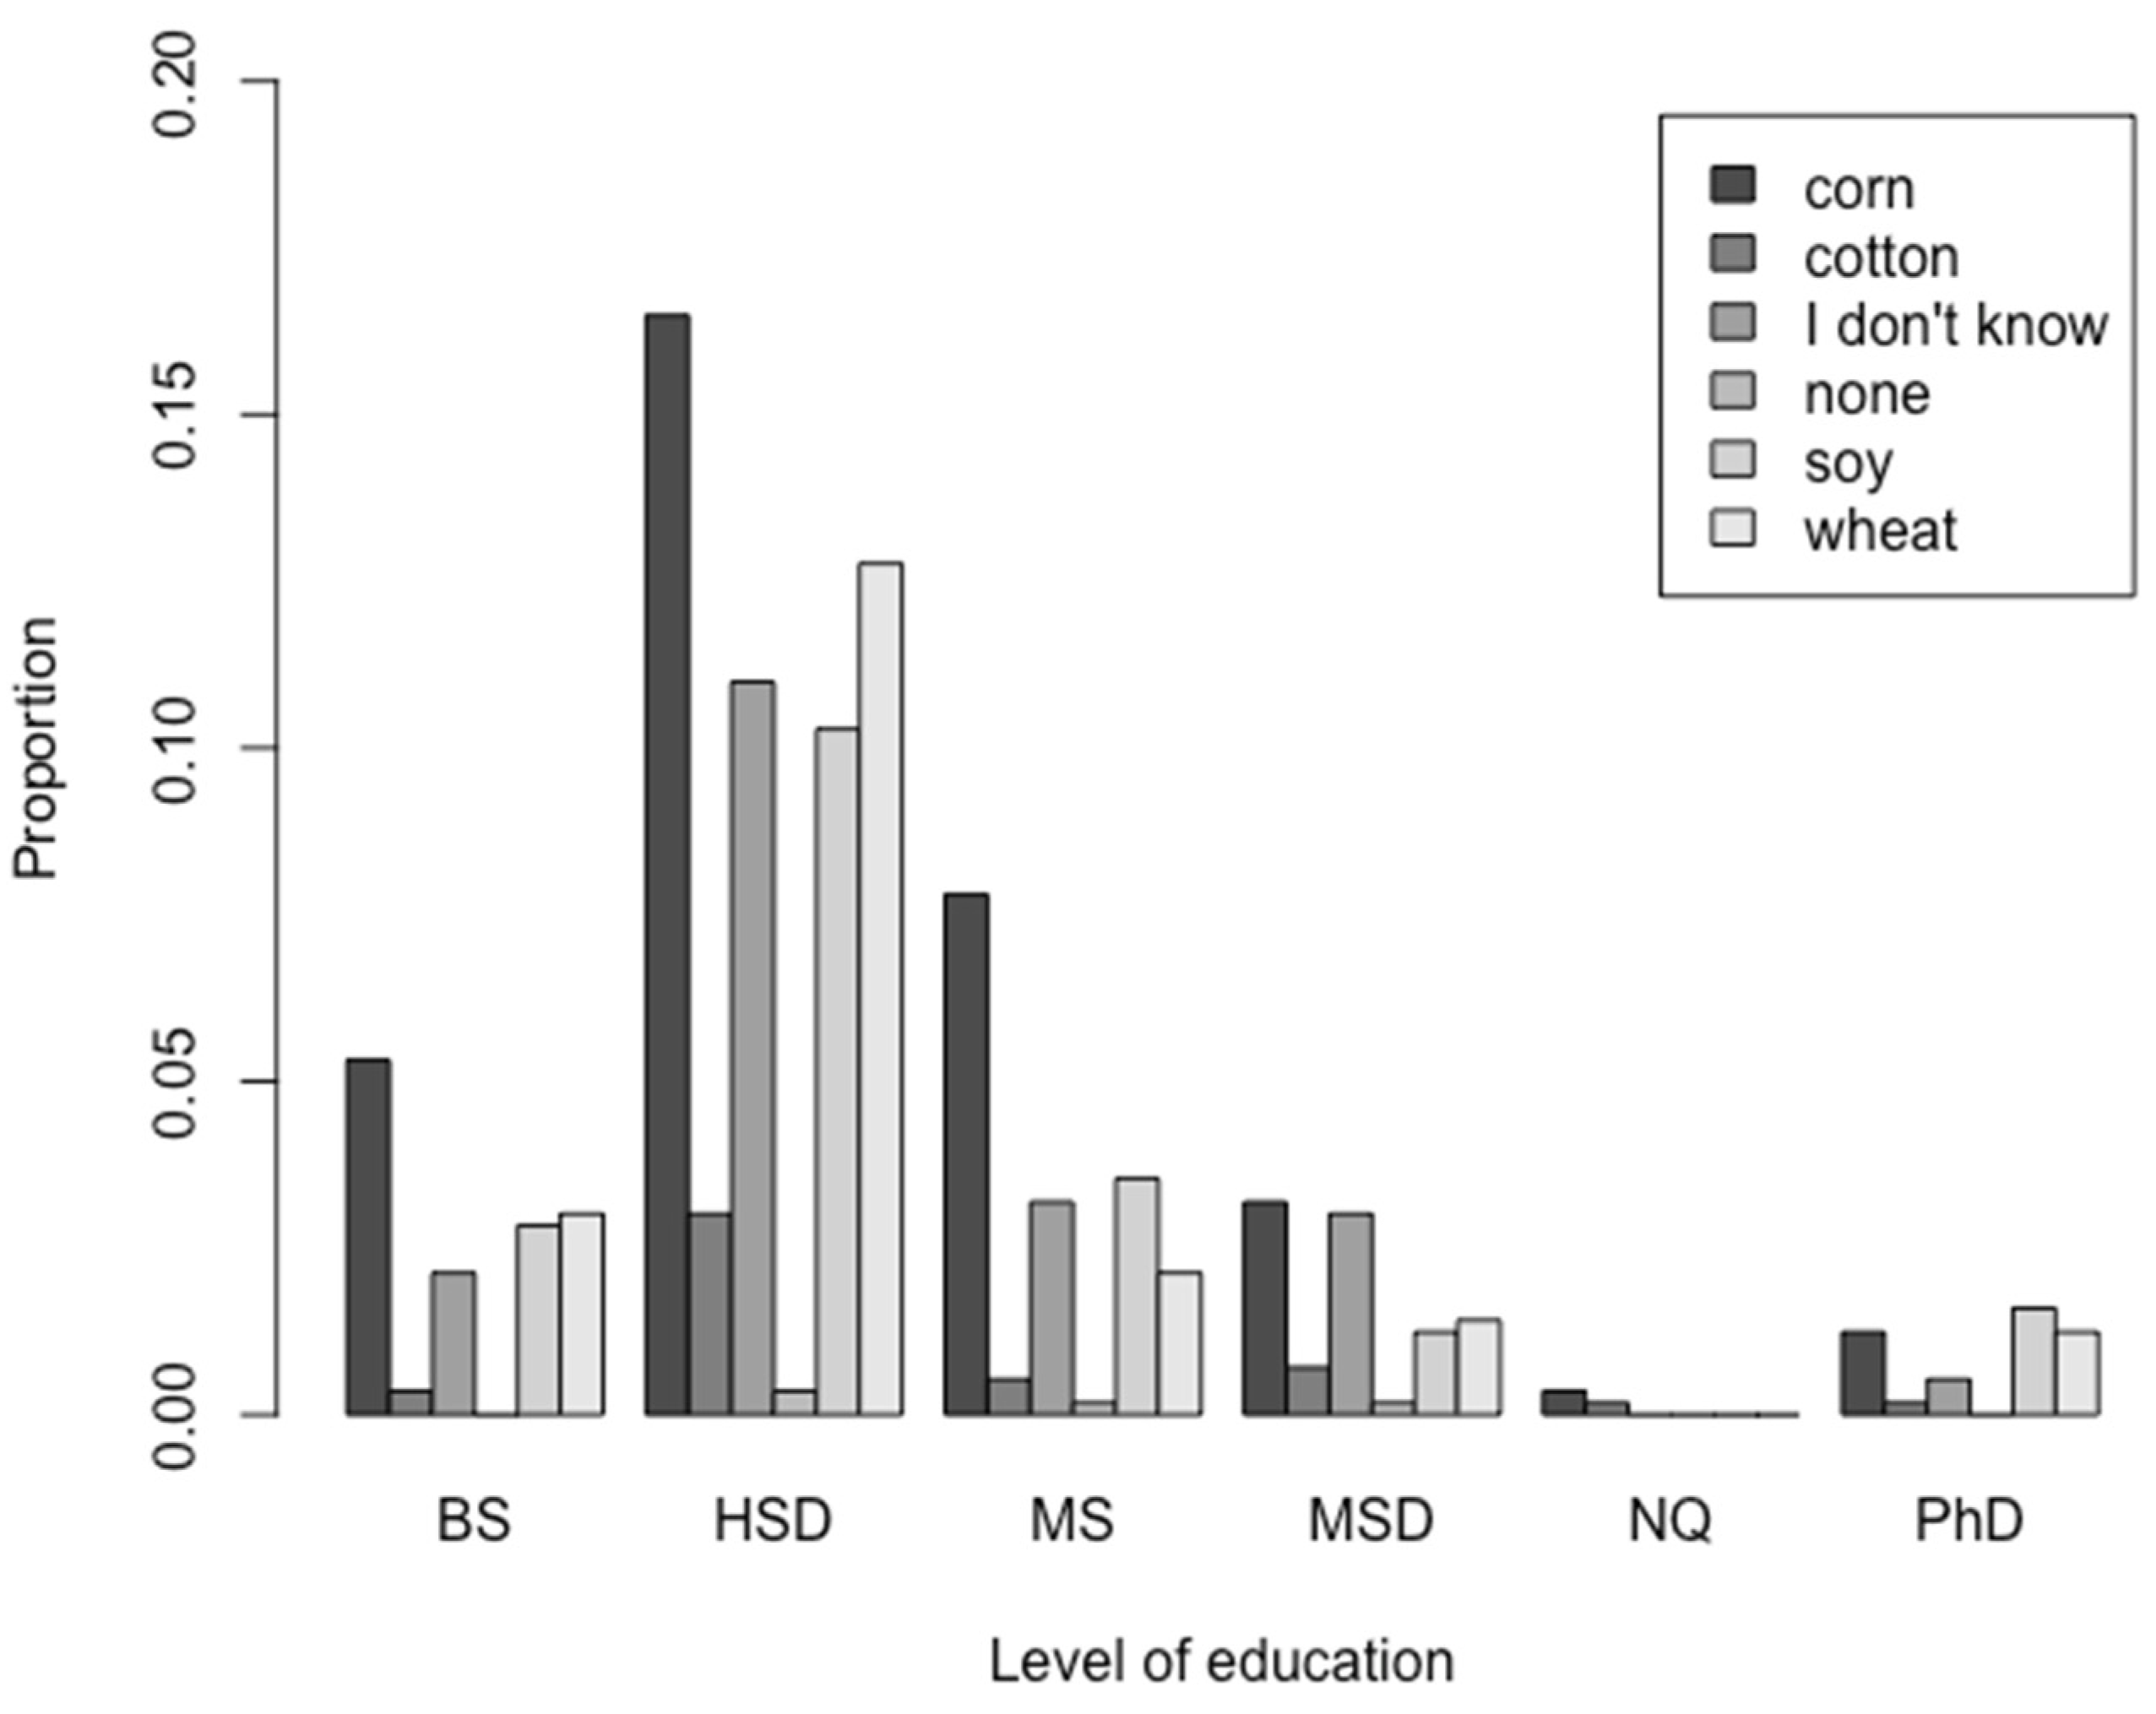
| Level of Education | ||||||||
| Bachelor’s Degree | High School Diploma | Master’s Degree | Middle School Diploma | No Qualification | Doctoral Degree | Total | ||
| Real knowledge | corn | 39 | 30.6 | 44.9 | 32.7 | 66.7 | 25.9 | 34.4 |
| cotton | 2.6 | 5.6 | 3.1 | 7.3 | 33.3 | 3.7 | 5 | |
| I don’t know | 15.6 | 20.4 | 18.4 | 30.9 | 0 | 11.1 | 19.9 | |
| none | 0 | 0.7 | 1 | 1.8 | 0 | 0 | 0.7 | |
| soy | 20.8 | 19.1 | 20.4 | 12.7 | 0 | 33.3 | 19.5 | |
| wheat | 22.1 | 23.7 | 12.2 | 14.5 | 0 | 25.9 | 20.6 | |
| Total | 100 | 100 | 100 | 100 | 100 | 100 | 100 | |
| Gender | ||||
| Female | Male | Total | ||
| Real knowledge | corn | 30.1 | 38.9 | 34.4 |
| cotton | 4.8 | 5.1 | 5 | |
| I don’t know | 21.8 | 17.8 | 19.9 | |
| none | 0.7 | 0.7 | 0.7 | |
| soy | 21.1 | 17.8 | 19.5 | |
| wheat | 21.5 | 19.6 | 20.6 | |
| Total | 100 | 100 | 100 | |
| Level of Income (EUR) | ||||||
| <15K | >50K | 15K–30K | 30K–50K | Total | ||
| Subjective knowledge | I don’t know | 50 | 27.3 | 35.2 | 35.4 | 38.7 |
| No | 3.1 | 10.9 | 2 | 1 | 3 | |
| Yes, I don’t know | 34.7 | 34.6 | 46.4 | 48.5 | 42.2 | |
| Yes, I know | 12.5 | 27.3 | 16.4 | 15.2 | 16.1 | |
| Total | 100 | 100 | 100 | 100 | 100 | |
| Level of Income (EUR) | ||||||
| <15K | >50K | 15K–30K | 30K–50K | Total | ||
| Environmental sustainability | I don’t know | 36.3 | 16.4 | 23.2 | 24.2 | 26.4 |
| No | 16.9 | 23.6 | 21.2 | 13.1 | 18.8 | |
| Yes | 46.9 | 60 | 55.6 | 62.6 | 54.8 | |
| Total | 100 | 100 | 100 | 100 | 100 | |
| Geographical Area | ||||||
| Center | Northeast | Northwest | South | Total | ||
| Real knowledge | corn | 40 | 30.1 | 30.9 | 36.7 | 34.4 |
| cotton | 3 | 5.8 | 4.9 | 5.6 | 5 | |
| I don’t know | 22 | 14.6 | 21.8 | 19.9 | 19.9 | |
| none | 1 | 1 | 0 | 1 | 0.7 | |
| soy | 20 | 28.2 | 23 | 11.7 | 19.5 | |
| wheat | 14 | 20.4 | 19.4 | 25 | 20.6 | |
| Total | 100 | 100 | 100 | 100 | 100 | |
Appendix B
| Hamburg, 05.01.2023 | |
| Knowledge Genetic Improvement |
| Question No. | Survey | Question Type |
| F1 | What genetic improvement methods do you know? Please select all the methods you have heard about. A: Crossing and selection B: Induced genetic mutation C: Assisted selection with molecular markers D: In vitro culture techniques E: New breeding techniques (Nbts) F: GMO G: None of these (not randomized) | Multiple Choice (Answers randomized) |
| F2 | Do you think there are differences between GMO products and products obtained through the use of New breeding techniques (Nbts)? A: Yes, there are differences and I know them B: Yes, there are differences but I don’t know them C: No, there are no differences Q: I don’t know | Single Choice |
| F3 | For what purposes is genetic modification carried out? Select, from the following options, what you think are the purposes of genetic modification. A: Resistance to pests, diseases, herbicides B: Adaptation to climate change C: Reduce food waste/increase food yield by lowering production costs Q: Reduce fertilizer use E: Safeguarding biodiversity F: I don’t know (not randomized) | Multiple Choice (Answers randomized) |
| F4 | Based on your knowledge, which of these agricultural species is the most cultivated as GMO seed? A: Soyabean B: Corn C: Wheat D: Cotton E: I don’t know (not randomized) F: None of the above (not randomized) | Single Choice (Answers randomized) |
| F5 | What information tools do you use to obtain information on GM products? A: Friends and acquaintances B: Press and television C: Social Media D: Scientific and information publications E: None of these (not randomized) Other tools: (Freetext) | Multiple Choice (Answers randomized) |
| F6 | Do you think GM food products are safe to eat? A: Not at all safe B: Not very safe C: I don’t know Q: Quite safe E: Absolutely safe | Likert |
| F7 | In your opinion, could AET contribute to environmental sustainability? A: Yes B: No C: I don’t know | Single Choice |
| F8 | How environmentally safe do you think AETs are? A: Not at all safe B: Unsafe C: I don’t know Q: Quite safe E: Absolutely safe | Likert |
| F9 | How likely would you be to buy a product from GM crops? A: No chance B: Low probability C: I don’t know Q: Some probability E: High probability | Likert |
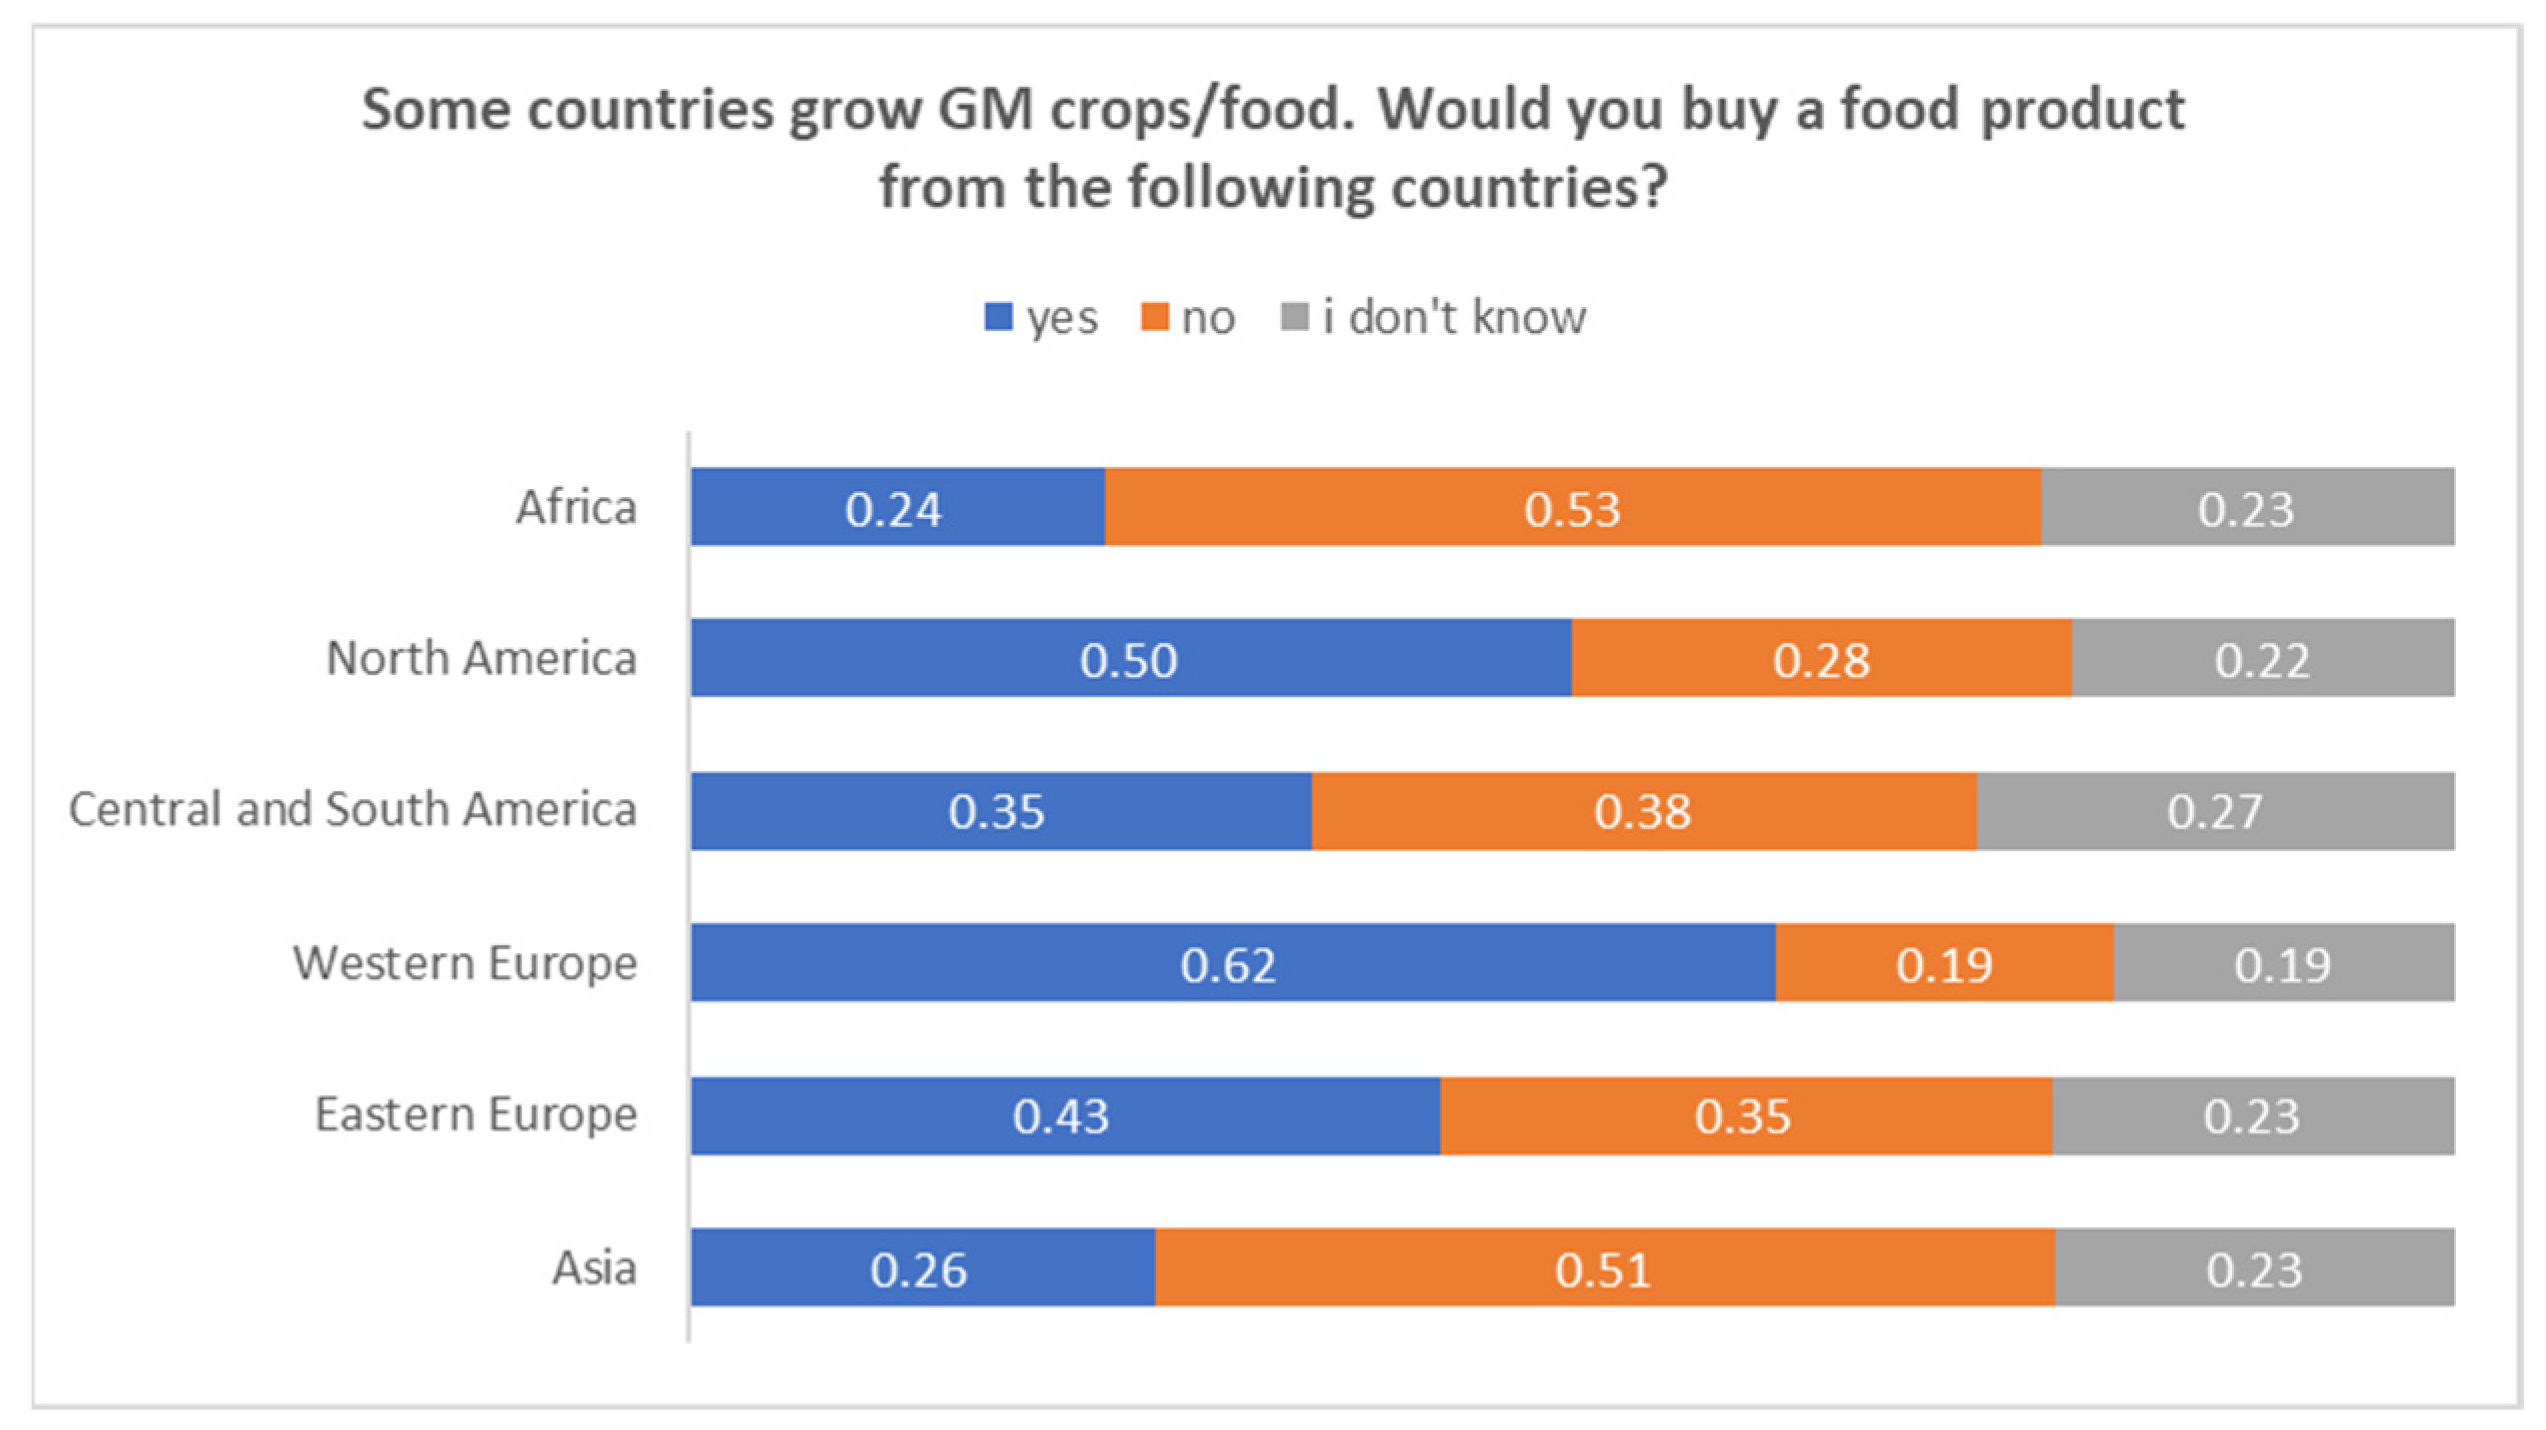
| F10 | Some countries grow GM crops/food. Would you buy a food product from the following countries? Answer: A: yes B: No C: I don’t know Items: A: Africa B: North America C: Central and South America D: Western Europe E: Eastern Europe F: Asia | Matrix (Items randomized) |
| F11 | What region do you live in? A: Valle d’Aosta B: Piedmont C: Liguria D: Lombardy E: Trentino Alto-Adige F: Veneto G: Friuli-Venezia Giulia H: Emilia Romagna I: Tuscany J: Umbria K: Marche L: Abruzzo M: Lazio N: Molise O: Campania P: Basilicata Q: Puglia R: Calabria S: Sardinia T: Sicily | Single Choice |
| F12 | Please indicate the highest degree you have earned (degree you have actually completed—not the degree you are currently studying for). A: No qualification (primary school) B: Secondary school C: High school diploma D: Bachelor’s degree E: Master’s degree F: Doctorate | Single Choice |
| F13 | What is your gross annual income? A: Less than 15,000 euros B: Between 15,000 and 30,000 euros C: Between 30,000 and 50,000 euros Q: More than 50,000 euros | Single Choice |
Appendix C
Appendix C.1. Data Protection at Appinio
Appendix C.2. Data Minimisation and Data Retention
Appendix C.3. Data Security
Appendix C.4. Data Usage and Documents
References
- European Commission. Explanatory Memorandum to COM(2023)411—Plants Obtained by Certain New Genomic Techniques and Their Food and Feed; European Commission: Brussels, Belgium, 2023. [Google Scholar]
- EFSA Annual Activity Report 2022; European Food Safety Authority: Parma, Italy, 2022. [CrossRef]
- EFSA Annual Activity Report 2021; European Food Safety Authority: Parma, Italy, 2021. [CrossRef]
- Turnbull, C.; Lillemo, M.; Hvoslef-Eide, T.A. Global regulation of genetically modified crops amid the gene edited crop boom–a review. Front. Plant Sci. 2021, 12, 630396. [Google Scholar] [CrossRef] [PubMed]
- EPSO. Opinion on the SAM Explanatory Note on New Techniques in Agricultural Biotechnology. 2015. Available online: https://epsoweb.org/ (accessed on 18 September 2023).
- Akbari, M.; Fozouni Ardekani, Z.; Pino, G.; Valizadeh, N.; Karbasioun, M.; Padash, H. Consumer Attitude towards Genetically Modified Foods in Iran: Application of Three-Dimensional Model of Corporate Social Responsibility. Foods 2023, 12, 1553. [Google Scholar] [CrossRef] [PubMed]
- Wunderlich, S.; Smoller, M. Consumer awareness and knowledge about food sources and possible environmental impact. Int. J. Environ. Impacts 2019, 2, 85–96. [Google Scholar] [CrossRef]
- Sendhil, R.; Nyikab, J.; Yadavc, S.; Mackolild, J.; Ge, R.P.; Workief, E.; Ragupathyg, R.; Ramasundaram, P. Genetically modified foods: Bibliometric analysis on consumer perception and preference. GM Crop. Food 2022, 13, 65–85. [Google Scholar] [CrossRef]
- Marangon, F.; Troiano, S.; Carzedda, M.; Nassivera, F. Consumers’ acceptance of genome edited food and the role of information. Ital. Rev. Agric. Econ. 2021, 76, 5–21. [Google Scholar]
- Bellows, A.C.; Alcaraz, G.; Hallman, W.K. Gender and food, a study of attitudes in the USA towards organic, local, U.S. grown, and GM-free foods. Appetite 2010, 55, 540–550. [Google Scholar] [CrossRef]
- McFadden, B.R.; Lusk, J.L. What consumers don’t know about genetically modified food, and how that affects beliefs. FASEB J. 2016, 30, 3091–3096. [Google Scholar] [CrossRef] [PubMed]
- McGarry Wolf, M.; Bertolini, P.; Shikama, I.; Bergerd, A. A Comparison of Attitudes Toward Food and Biotechnology in the U.S., Japan, and Italy. J. Food Distrib. Res. 2012, 43, 103–112. [Google Scholar] [CrossRef]
- Lusk, J.L.; McFadden, B.R.; Wilson, N. Do Consumers Care How a Genetically Food Was Created or Who Created It? Food Policy 2018, 78, 81–90. [Google Scholar] [CrossRef]
- Hwang, H.; Nam, S.-J. The influence of consumers’ knowledge on their responses to genetically modified foods. GM Crop. Food 2021, 12, 146–157. [Google Scholar] [CrossRef]
- Ishii, T.; Araki, M. Consumer acceptance of food crops developed by genome editing. Plant Cell Rep. 2016, 35, 1507–1518. [Google Scholar] [CrossRef] [PubMed]
- Lucht, J.M. Public acceptance of Plant Biotechnology and GM crops. Viruses 2015, 7, 4254–4281. [Google Scholar] [CrossRef] [PubMed]
- Noleppa, S.; Cartsburg, M. The Socio-Economic and Environmental Values of Plant Breeding in the EU and for Selected EU Member States; Hffa Research Paper; HFFA Research GmbH: Berlin, Germany, 2021. [Google Scholar]
- Ferrari, L. Farmers’ attitude toward CRISPR/Cas9: The case of blast resistant rice. Agribusiness 2022, 38, 175–194. [Google Scholar] [CrossRef]
- Ferrari, L.; Baum, C.M.; Banterle, A.; De Steur, H. Attitude and labelling preferences towards gene-edited food: A consumer study amongst millennials and Generation Z. Br. Food J. 2021, 123, 1268–1286. [Google Scholar] [CrossRef]
- Demaria, F.; Zezza, A. Scientific information and cognitive bias in the case of New Breeding Techniques: Exploring Millennials behaviour in Italy. Ital. Rev. Agric. Econ. 2022, 77, 41–60. [Google Scholar] [CrossRef]
- Lassoued, L.; Phillips, P.W.B.; Smyth, S.J.; Hesseln, H. Estimating the cost of regulating genome edited crops: Expert judgment and overconfidence. GM Crop. Food 2019, 10, 44–62. [Google Scholar] [CrossRef]
- Meldolesi, A. Can CRISPR Modify Attitudes on Food Crops? Nature Italy. 2021. Available online: https://www.nature.com/articles/d43978-021-00070-1 (accessed on 18 September 2023).
- Ortega, D.L.; Lusk, J.L.; Lin, W.; Caputo, V. Predicting responsiveness to information: Consumer acceptance of biotechnology in animal products. Eur. Rev. Agric. Econ. 2020, 47, 1644–1667. [Google Scholar] [CrossRef]
- Bain, C.; Lindberg, S.; Selfa, T. Emerging sociotechnical imaginaries for gene edited crops for foods in the United States: Implications for governance. Agric. Hum. Values 2020, 37, 265–279. [Google Scholar] [CrossRef]
- Sheldon, I.M. Regulation of biotechnology: Will we ever ‘freely’ trade GMOs? Eur. Rev. Agric. Econ. 2002, 29, 155–176. [Google Scholar] [CrossRef]
- Qaim, M. Role of New Plant Breeding Technologies for Food Security and Sustainable Agricultural Development. Appl. Econ. Perspect. Policy 2020, 42, 129–150. [Google Scholar] [CrossRef]
- Bunge, J.; Marcus, A.D. Is this tomato engineered? Inside the coming battle over gene-edited food. Wall Str. J. 2018. Available online: https://www.wsj.com/articles/is-this-tomato-engineered-inside-the-coming-battle-over-gene-edited-food-1523814992 (accessed on 18 September 2023).
- De Marchi, E.; Cavaliere, A.; Banterle, A. Consumer Choice Behavior for Cisgenic Food: Exploring the Role of Time Preferences. Appl. Econ. Perspect. Policy 2021, 43, 866–891. [Google Scholar] [CrossRef]
- Martinez-Poveda, A.; Molla-Bauza, M.B.; del Campo Gomis, F.J.; Martinez, L.M. Consumer-perceived risk model for the introduction of genetically modified food in Spain. Food Policy 2009, 34, 519–528. [Google Scholar] [CrossRef]
- Bawa, A.S.; Anilakumar, K.R. Genetically modified foods: Safety, risks and public concerns—A review. J. Food Sci. Technol. 2012, 50, 1035–1046. [Google Scholar] [CrossRef] [PubMed]
- Harfouche, A.L.; Petousi, V.; Meilan, R.; Sweet, J.; Twardowski, T.; Altman, A. Promoting Ethically Responsible Use of Agricultural Biotechnology. Trends Plant Sci. 2021, 26, 546–559. [Google Scholar] [CrossRef] [PubMed]
- Smith, V.; Wesseler, J.H.; Zilberman, D. New Plant Breeding Technologies: An Assessment of the Political Economy of the Regulatory Environment and Implications for Sustainability. Sustainability 2021, 13, 3687. [Google Scholar] [CrossRef]
- Woźniak-Gientka, E.; Agata, T.; Milica, P.; Anna, B.; Dennis, E.; Nick, V.; Godelieve, G.; Selim, C.; Naghmeh, A.; Tomasz, T. Public perception of plant gene technologies worldwide in the light of food security, GM Crop. Food 2022, 13, 218–241. [Google Scholar]
- Fernbach, P.M.; Light, N.; Scott, S.E.; Inbar, Y.; Rozin, P. Extreme opponents of genetically modified foods know the least but think they know the most. Nat. Hum. Behav. 2019, 3, 251–256. [Google Scholar] [CrossRef]
- McFadden, B.R.; Smyth, S.J. Perceptions of Genetically Engineered Technology in Developed Areas. Trends Biotechnol. 2019, 37, 447–451. [Google Scholar] [CrossRef]
- Araki, M.; Ishii, T. Towards social acceptance of plant breeding by genome editing. Trends Plant Sci. 2015, 20, 145–149. [Google Scholar] [CrossRef]
- R Core Team. R: A Language and Environment for Statistical Computing; R Foundation for Statistical Computing: Vienna, Austria, 2023; Available online: https://www.R-project.org/ (accessed on 19 September 2023).
- Kim, B.R. Consumer Attitude of Risk and Benefits toward Genetically Modified (GM) Foods in South Korea: Implications for Food Policy. Inz. Ekon. Eng. Econ. 2012, 23, 189–199. [Google Scholar] [CrossRef]
- Rzymski, P.; Królczyk, A. Attitudes toward genetically modified organisms in Poland: To GMO or not to GMO? Food Sec. 2016, 8, 689–697. [Google Scholar] [CrossRef]


| Gender | N | (%) |
|---|---|---|
| Male | 275 | 48.7 |
| Female | 288 | 51.1 |
| No response | 1 | 0.2 |
| Total | 564 | 100 |
| Income | ||
| 0–15,000 Euros | 160 | 28.3 |
| 15,000–30,000 Euros | 249 | 44.3 |
| 30,000–50,000 Euros | 99 | 17.6 |
| >50,000 Euros | 55 | 9.8 |
| Total | 564 | 100 |
| University Degree | ||
| Doctorate Degree | 27 | 4.8 |
| Master | 98 | 17.4 |
| First Degree | 77 | 13.7 |
| High school diploma | 304 | 53.9 |
| Middle school diploma | 55 | 9.8 |
| No qualification | 3 | 0.4 |
| Total | 564 | 100 |
| Number of family members | ||
| 1 | 85 | 15.1 |
| 2 | 158 | 28.0 |
| 3 | 175 | 31.0 |
| 4 | 115 | 20.4 |
| 5 | 27 | 4.8 |
| +6 | 3 | 0.5 |
| No response | 1 | 0.2 |
| Total | 564 | 100 |
Disclaimer/Publisher’s Note: The statements, opinions and data contained in all publications are solely those of the individual author(s) and contributor(s) and not of MDPI and/or the editor(s). MDPI and/or the editor(s) disclaim responsibility for any injury to people or property resulting from any ideas, methods, instructions or products referred to in the content. |
© 2023 by the authors. Licensee MDPI, Basel, Switzerland. This article is an open access article distributed under the terms and conditions of the Creative Commons Attribution (CC BY) license (https://creativecommons.org/licenses/by/4.0/).
Share and Cite
Romeo Lironcurti, S.; Demaria, F.; D’Annolfo, R.; Sardone, R. Consumer Evaluations of and Attitudes towards New Genome Editing Techniques: An Italian Case Study. Agriculture 2024, 14, 51. https://doi.org/10.3390/agriculture14010051
Romeo Lironcurti S, Demaria F, D’Annolfo R, Sardone R. Consumer Evaluations of and Attitudes towards New Genome Editing Techniques: An Italian Case Study. Agriculture. 2024; 14(1):51. https://doi.org/10.3390/agriculture14010051
Chicago/Turabian StyleRomeo Lironcurti, Simona, Federica Demaria, Raffaele D’Annolfo, and Roberta Sardone. 2024. "Consumer Evaluations of and Attitudes towards New Genome Editing Techniques: An Italian Case Study" Agriculture 14, no. 1: 51. https://doi.org/10.3390/agriculture14010051