Article

Spatial Correlation Network Structure of and Factors Influencing Technological Progress in Citrus-Producing Regions in China

1
College of Economics and Management, Huazhong Agriculture University, Wuhan 430070, China
2
Institute of Horticultural Economics, Huazhong Agriculture University, Wuhan 430070, China
3
Hubei Rural Development Research Center, Wuhan 430070, China
4
Yiling District Administration for Rural Revitalization, Yichang 443100, China
*
Author to whom correspondence should be addressed.
Agriculture 2023, 13(11), 2118; https://doi.org/10.3390/agriculture13112118
Submission received: 27 September 2023 / Revised: 3 November 2023 / Accepted: 7 November 2023 / Published: 8 November 2023

Abstract

:
In this study, the transcendental logarithmic cost function model was used to measure the rate of technological progress in seven major mandarin-producing regions and seven major tangerine-producing regions in China from 2006 to 2021. The modified gravity model was used to establish spatial correlation networks. The social network analysis method was used to analyze the characteristics of the overall network structure and the individual network structure of the spatial correlation networks of citrus-production technology progress, and the quadratic assignment procedure was used to analyze the factors influencing the spatial network. The results show the production of Chinese mandarins and tangerines is in the stage of technological progress in general, but the rate of progress is slowing down gradually, and the rate of mandarin-production technology progress is higher than that of tangerine-production technology progress. In terms of the overall network structure characteristics, the spatial networks of technological progress related to Chinese mandarin and tangerine production are becoming increasingly dense and complex, with obvious spatial spillover effects, but the network structure is relatively loose, and the polarization of the tangerine network is more serious. In terms of individual network structure characteristics, the relatively economically developed eastern regions have a higher status in terms of the spatial correlation network and a stronger role in controlling and dominating the resource elements needed for citrus-production technology progress. Education, informatization, economic development, innovation support, and financial support are important factors influencing the formation of the spatial association network of citrus-production technology progress in China.

1. Introduction

Citrus is one of the most important cash crops in the world and the largest category of fruits in the world [1]; it is the largest category in China in terms of planted area and production [2]. China’s citrus industry ranks first in the world, and production accounts for about one-third of the world’s production [3]. According to the China Rural Statistical Yearbook, in 2021, China’s citrus planting area was 2.922 million ha and the production was 55.956 million tons, accounting for 22.82% of China’s fruit planting area and 25.81% of the production. China’s citrus industry has been developing rapidly, especially in the past 45 years, since the reform and opening up. In China, citrus varieties have been enriched, the spatial layout of citrus production has been optimized, citrus quality has been improved, farmers’ enthusiasm for planting is high [4], and the promotion of the healthy development of the citrus industry has become one of the most important methods for boosting industrial prosperity and realizing the revitalization of the countryside [5]. According to the UN Comtrade Database, China’s citrus export was 917,700 tons in 2021, accounting for only 5.96% of the world’s total citrus exports. So, some scholars say that though China is the world’s major citrus producer, it is not a powerhouse of citrus production and trade [6,7]. Compared with developed countries, China’s citrus-production efficiency is low [8], and citrus production per unit area is lower than the world average [2]. According to FAO data, China’s citrus production per unit area in 2021 was 15.37 t/ha, which is much lower than Indonesia’s production per unit area, which is the highest in the world, with a production rate of 38.53 t/ha. China’s citrus industry urgently needs to accelerate the innovation-driven transformation of the development mode from “extensive” to “intensive” [1] to improve citrus production per unit area, and the improvement of production per unit area is driven by technological progress [9]. Under the role of factor flow and market and government support mechanisms, technological progress among major citrus-producing provinces does not exist independently but shows a certain spatial correlation [10]. At the same time, in plant taxonomy, mandarins and tangerines belong to the same family and the same genus but are different species of woody plants. Mandarins and tangerines are often collectively referred to as “citrus.” There are differences in the mandarin and tangerine planting areas in China, and mandarins and tangerines differ in terms of scientific and technological strength [11]. So, the rates of technological progress [12] and the characteristics of the spatial network structure are also different. Therefore, what is the level of citrus-production technology progress in China? What kind of changing trends exist in mandarin- and tangerine-production technology progress? What are the differences in the technological advances related to mandarins and tangerines? Are they spatially correlated? What are the characteristics of the spatial association network structure? What are the factors affecting the structural formation of citrus spatial association networks? Answering these questions is of great practical significance for optimizing the allocation of resource factors, promoting the technological progress in mandarin and tangerine production, improving production efficiency, and promoting the high-quality development of the citrus industry.

2. Literature Review

Technological progress is the use of a certain amount of input to produce more output, or, conversely, the use of less input to produce a certain amount of output [13]. Theoretical research on technological progress began in the early 19th century. In 1957, Solow created an economic growth accounting model to clarify the contribution of technological progress to economic growth [14]. Scholars at home and abroad began research on economic development and technological progress. Arrow put forward the concept of “learning by doing” and believed that the skills of workers would be continuously improved in production, which led to technological progress, and tried to endogenize technological progress for the first time [15]. Based on the neoclassical investment theory, through the selection of the transcendental logarithmic production function, Christensen et al. concluded that technological progress is the main reason for productivity change [16].
With the continuous progress in agricultural technology, productivity has greatly improved, and a large number of scholars have emerged in the field of agricultural technological progress research. The methods of measuring agricultural technological progress are mainly divided into two categories: the parametric method and the non-parametric method. Tan believes that the overall technological progress in agriculture can be divided into spontaneous technological progress and induced technological progress, and many scholars have followed suit to conduct separate research on spontaneous technological progress and induced technological progress [17]. Mao et al. used data envelopment analysis (DEA) to analyze the total factor productivity of Chinese agriculture in the period 1984–1993 and found it to be the main reason for the change in productivity [18]. Da Silva et al. measured the technological progress in Brazilian agriculture in 1976–2016 and analyzed the efficiency of factor input use in different periods [19]. Tan et al. investigated the relationship between agricultural technological progress, agricultural insurance, and factor input use and concluded that both agricultural technology progress and agricultural insurance have a positive impact on farmers’ income [20]. Chen et al. measured different types of environmentally friendly technological progress in Chinese agriculture from 2000 to 2010 and analyzed the spatial spillover effect [21].
In the study of citrus-production technology progress, He et al. measured citrus technical efficiency and technological progress index in 20 cities in Sichuan, China, from 2009 to 2020 and concluded that it was on the low side, which led to low productivity [22]. Gu et al. measured and decomposed the total factor productivity of citrus in China from 2006 to 2020 using the DEA-Malmquist index method and concluded that technological progress is the main factor affecting the total factor productivity of citrus [2]. Xiang et al. analyzed the technical efficiency of citrus cultivation, the time series development law, and the influencing factors from 2007 to 2015 by using the beyond logarithmic production function and concluded that the overall average technical efficiency of tangerine production is higher than that of citrus, and there are regional differences in the technical efficiency of citrus production and cultivation [23].
As spatial analysis methods have improved, many scholars have used social network analysis to study the spatial correlation network structure and the factors influencing it, i.e., agricultural total factor productivity [24], agricultural green total factor productivity [25], agro-ecological efficiency [26], and green science and technology innovation efficiency [27]. In the study of the spatial correlation network structure of technological progress, Wang et al. concluded that there are obvious spatial correlation and spillover effects in the development of agricultural science and technology innovation in China and presented the shape of the spatial correlation network structure [28]. He et al. concluded that agricultural location centrality and intermediary centrality have a significant positive moderating effect on technological progress [29].
After combing through the literature, we found that there are abundant research results on agricultural technology progress and spatial correlation network structure in academic circles, which are of great reference value for this study, but there are still the following deficiencies: first, the existing studies focus on agricultural technological progress and there is a lack of studies on what kind of change characteristics citrus-production technology progress presents. Second, existing studies have failed to reveal the structural characteristics of the spatial correlation between citrus-production technology progress and the factors affecting the formation of its spatial correlation network structure.
In view of this and taking into account the differences in mandarin and tangerine cultivation and related technological progress, in this paper, based on the panel data of factor prices, inputs, and outputs of seven main mandarin-producing areas and seven main tangerine-producing areas from 2006 to 2021, we adopted the beyond logarithmic cost function to measure the citrus-production technology progress in China’s main citrus-producing areas and construct a modified gravity model to determine the spatial correlation of citrus-production technology progress. Following this, the overall network structure and individual network characteristics of citrus-production technology progress were systematically analyzed using social network analysis (SNA), and the factors driving the spatial correlation of citrus-production technology progress in China were identified using quadratic assignment procedure (QAP) regression analysis with a view to providing certain reference and informative value for further exploration of the potential of citrus production in China and promoting the coordinated sustainable development of China’s citrus industry.

3. Materials and Methods

3.1. Materials

To measure technological progress in citrus production, one output variable and five input variables were selected for this paper, taking into account the availability of data [11], as shown in Table 1. The output variable was the output of the main products per ha of citrus. The selected input variables were: labor price, expressed as labor cost per workday; land price, expressed as the land input cost per ha (including the rent of the transfer land and the folding rent of the self-camp); fertilizer price, obtained by dividing the fertilizer cost per ha by the amount of fertilizer per ha (including nitrogen fertilizer, phosphorus fertilizer, potash fertilizer, and compound fertilizer); and pesticide prices, obtained by dividing the cost of pesticides per ha by the amount of pesticides per mu. Other direct or indirect costs, such as the cost of farm fertilizer, drainage and irrigation, fuel and power, and marketing costs per acre, were used to measure other material and service price inputs, and since data on the volume of other material and service inputs were not available, the index of agricultural production materials was used in place of the other material and service prices.
In order to further explore the factors influencing the spatial correlation network structure of citrus-production technology progress in China, considering that the formation of this network is related to the mechanisms of factor flow, market drive, and government support and with reference to previous studies [24,25], this paper selected seven factors closely related to technological progress as research variables, namely industrial structure (str), level of informatization (inf), level of education (edu), level of economic development (eco), strength of innovation support (inn), strength of financial support (fin), and rate of agricultural disaster (dis), as shown in Table 2. To construct a matrix of regional differences in industrial structure, the proportion of the value added of the primary industry in the regional GDP as a proxy variable for industrial structure was used; to construct a matrix of regional differences in the level of informatization, the number of regional internet broadband access ports to characterize was used; to construct a matrix of regional differences in the level of education, the level of education of the rural workforce in each region was used; to construct a matrix of regional differences in economic development levels, the GDP per capita was used; to construct a matrix of regional differences in innovation support, the proportion of the total fiscal expenditures each region spends on science and technology as a proxy for innovation support was used; to construct a matrix of regional differences in fiscal support, the proportion of expenditure on agriculture, forestry, and water affairs in the total fiscal expenditure in each region as a proxy variable for financial support was used; and to construct a matrix of regional differences in the rate of agricultural disasters, the proportion of the agricultural disaster area in the affected area in each region was used.
Considering the differences in technological progress in mandarin and tangerine production and the availability of data, we divided citrus into two categories (mandarin and tangerine) in the measurement of technological progress. We selected the panel data of the seven major mandarin-producing areas, i.e., Guangdong, Guangxi, Jiangxi, Hubei, Hunan, Fujian, and Chongqing, and the seven major tangerine-producing areas, i.e., Guangdong, Jiangxi, Zhejiang, Hubei, Hunan, Fujian, and Chongqing, from 2006 to 2021. In 2021, the citrus production of these areas accounted for 84.02% of China’s citrus production, making the data highly representative. The data were obtained from the database of the National Bureau of Statistics, the China Population and Employment Statistical Yearbook, and the National Compilation of Cost and Benefit Information of Agricultural Products. Some of the missing data were obtained by consulting the statistical yearbooks of the region for the relevant years and using the moving average method. In order to ensure data consistency and comparability, each value variable was deflated using the corresponding price index, with 2006 as the base period.

3.2. Methods

3.2.1. Transcendental Logarithmic Cost Function

In 1973, the transcendental logarithmic cost function was first proposed by L. Christensen et al. [30] and compared with the commonly used DEA method, the Malmquist index method, and the traditional C-D function. Its functional form is in line with the setting of economic theory, and it allows for the use of dummy and proxy variables according to theoretical and real needs so as to enable accurate economic explanations [31]. So, in this paper, we selected the beyond logarithmic cost function model to measure the technological progress in Chinese citrus production. In general, for the second-order Taylor expansion of the transcendental logarithmic cost function, we do not need to set up a special functional form or define the substitution relationship between elements. However, the method also has two drawbacks: first, the time-varying nature of the estimated coefficients cannot be observed, and second, the correlation between some variables cannot be well verified [9]. Therefore, in this paper, the third-order Taylor expansion of the transcendental logarithmic cost function was chosen in the following form:
ln C t = α 0 + m = 1 k α m ln P m t + α y ln Y t + α T T + 1 2 m = 1 k n = 1 k α m n ln P m t ln P n t + m = 1 k α m y ln P m t ln Y m t + m = 1 k α m T T ln P m t + 1 2 α y y ( ln Y t ) 2 + α y T T ln Y t + 1 2 α y y T ( ln Y ) 2 + 1 2 α T T T 2 + 1 2 m = 1 k n = 1 k α m n T ln P m t ln P n t + m = 1 k α m y T T ln Y t ln P m t
In Equation (1), Ct denotes the total cost of production at time t; Pmt denotes the price of factor m at time t; m = 1, 2,..., k denotes the number of factors; Pnt denotes the price of a factor of production except factor m at time t; n = 1, 2,..., k − 1 denotes the number of factors; Yt denotes the level of output at time t; and T denotes the time trend. Because there are too many independent variables in Equation (1), if direct estimation is carried out, the problem of covariance will arise. Therefore, instead of the cost function being estimated directly, the Shephard lemma is usually used to bias the prices of the factors of production to construct the cost share equation in the following form:
S m t = α m + m = 1 k α m n ln P n t + n = 1 k α m n T T ln P n t + α m y ln Y t + α n y T T ln Y + α m T T
The transcendental logarithmic cost function is quadratically differentiable with respect to the logarithm of input prices, and the Hessian matrix of this function is symmetric. So, the restrictions are as follows:
α m n = α n m , α m n T = α n m T , m n
m = 1 k α m = 1 , m = 1 k α m n = m = 1 k α m y = m = 1 k α m T = 0 , m = 1 k α m n T = n = 1 k α m n T = m = 1 k α m y T = 0
For a known output, progress in production technology is accompanied by a reduction in factor inputs at constant factor prices or a reduction in factor prices at the same factor inputs, all of which lead to a continuous decline in production costs as technology progresses. In this way, the total rate of technological progress (TP) can be obtained by using the total cost of production taken logarithmically and derived for time. If TP > 0, then there is technological progress, and if TP < 0, then there is technological regression. The formula is as follows:
T P = ln C / T = α T m = 1 k α m T ln P m n α y T ln Y t 1 2 α y y T ( ln Y ) 2 α T T T 1 2 m = 1 k n = 1 k α m n T ln P m t ln P n t m = 1 k α m y T ln Y t ln P m t

3.2.2. Modified Gravity Model

The analysis of spatial correlation networks first needs to establish a spatial correlation network matrix, and existing research has mainly adopted two methods to construct a spatial correlation network matrix, namely the VAR model and the gravitational model. Because the VAR model cannot portray the trend of change in the spatial correlation network and is too sensitive to the selection of a lagging order, it will reduce the accuracy of the network structure characterization to a certain extent [32], while the gravitational model is constructed based on the principle of distance decay and the law of gravity, which can combine technological progress and geographical distance to better characterize spatial correlation [27]. Therefore, in this paper, referring to the study of Wang et al. [33], we introduced a modified gravitational model to measure the gravitational strength of the spatial correlation of citrus-production technology progress in the major citrus-producing areas in China and constructed a spatial correlation matrix with the following formula:
S = K T P i T P j ω i j 2 / ( g i g j ) 2 , K = T P i T P i + T P j
In Equation (6), S is the strength of the correlation of citrus-production technology progress between the main citrus-producing areas i and j; TPi and TPj denote the rate of citrus-production technology progress in provinces i and j, respectively; K denotes the contribution of main production area i to S; ωij is the spherical distance between the two main production areas; and gi and gj are the values of the real per capita GDP of the two main production areas, respectively.
By modifying the gravity model to measure the correlation strength of mandarin- and tangerine-production technology progress in each citrus-producing region, a 7 × 7 correlation strength matrix was constructed, and the average value of each row of the matrix was taken as the threshold. If the correlation strength was greater than the threshold, it was recorded as 1, indicating that there is a spatial spillover of citrus-production technology progress from the main production region in that row to the main production region in that column. If the correlation strength was less than the threshold, it was recorded as 0, indicating that there is no spatial spillover of citrus-production technology progress from the main production region in that row to the main production region in that column, and a final 7 × 7 oriented spatial correlation 0–1 type asymmetric matrix was formed.

3.2.3. Social Network Analysis

Social network analysis (SNA) is an important research paradigm that uses graph theoretic tools and algebraic modeling techniques to explore the relationship between members in a network structure and has been widely used in many fields, such as sociology, economics, and management [34,35]. The social network analysis method usually involves research on the overall network association structure and the individual network structure characteristics.
(1)
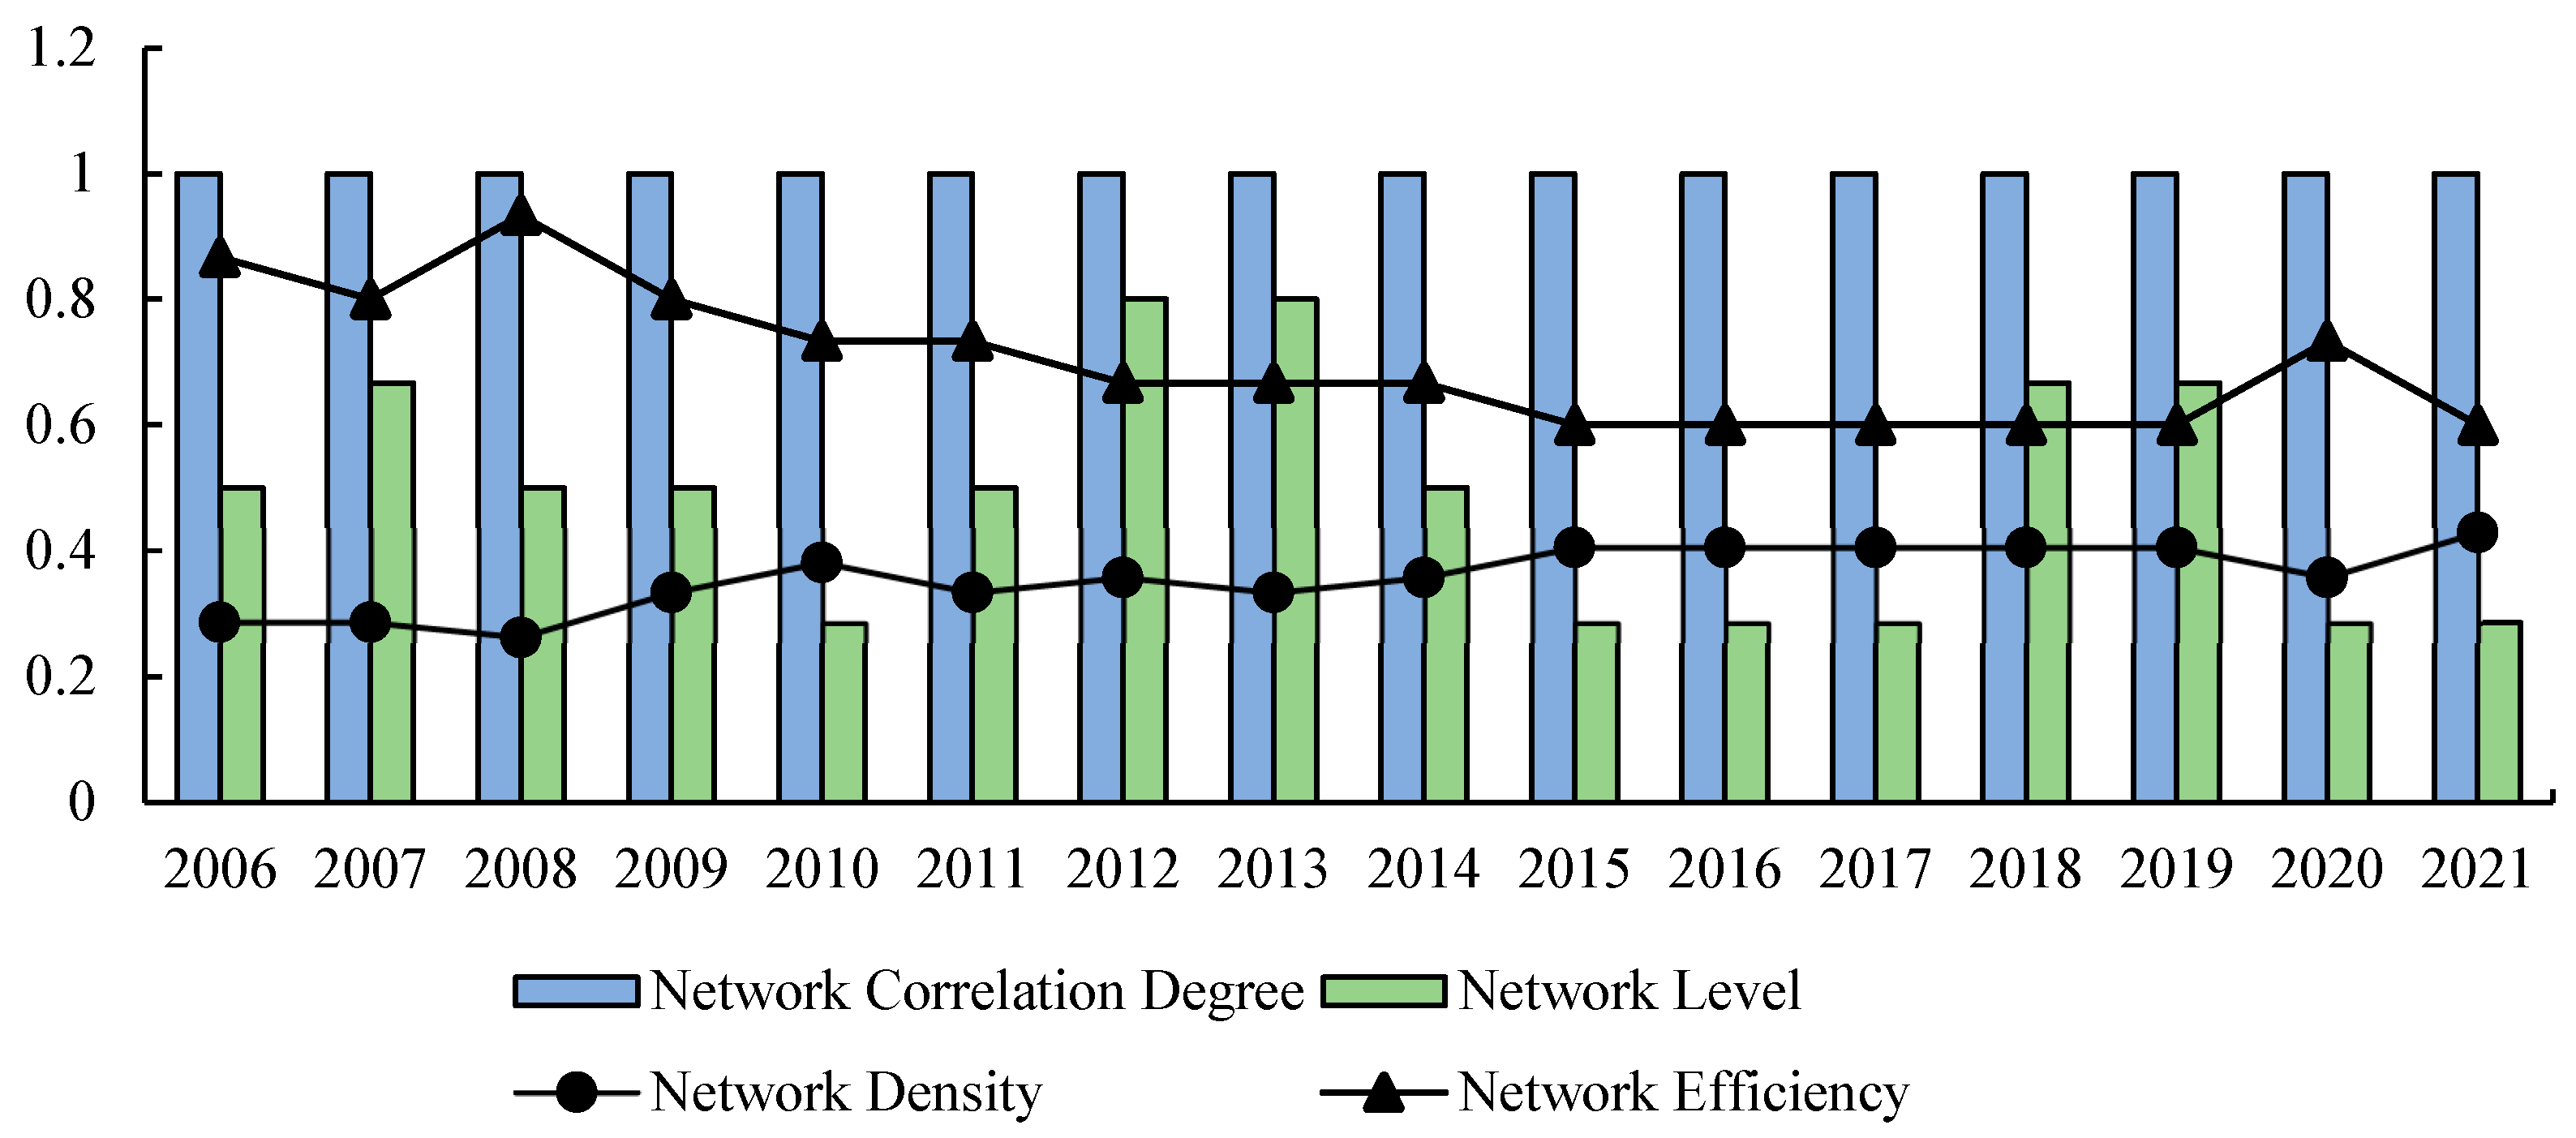
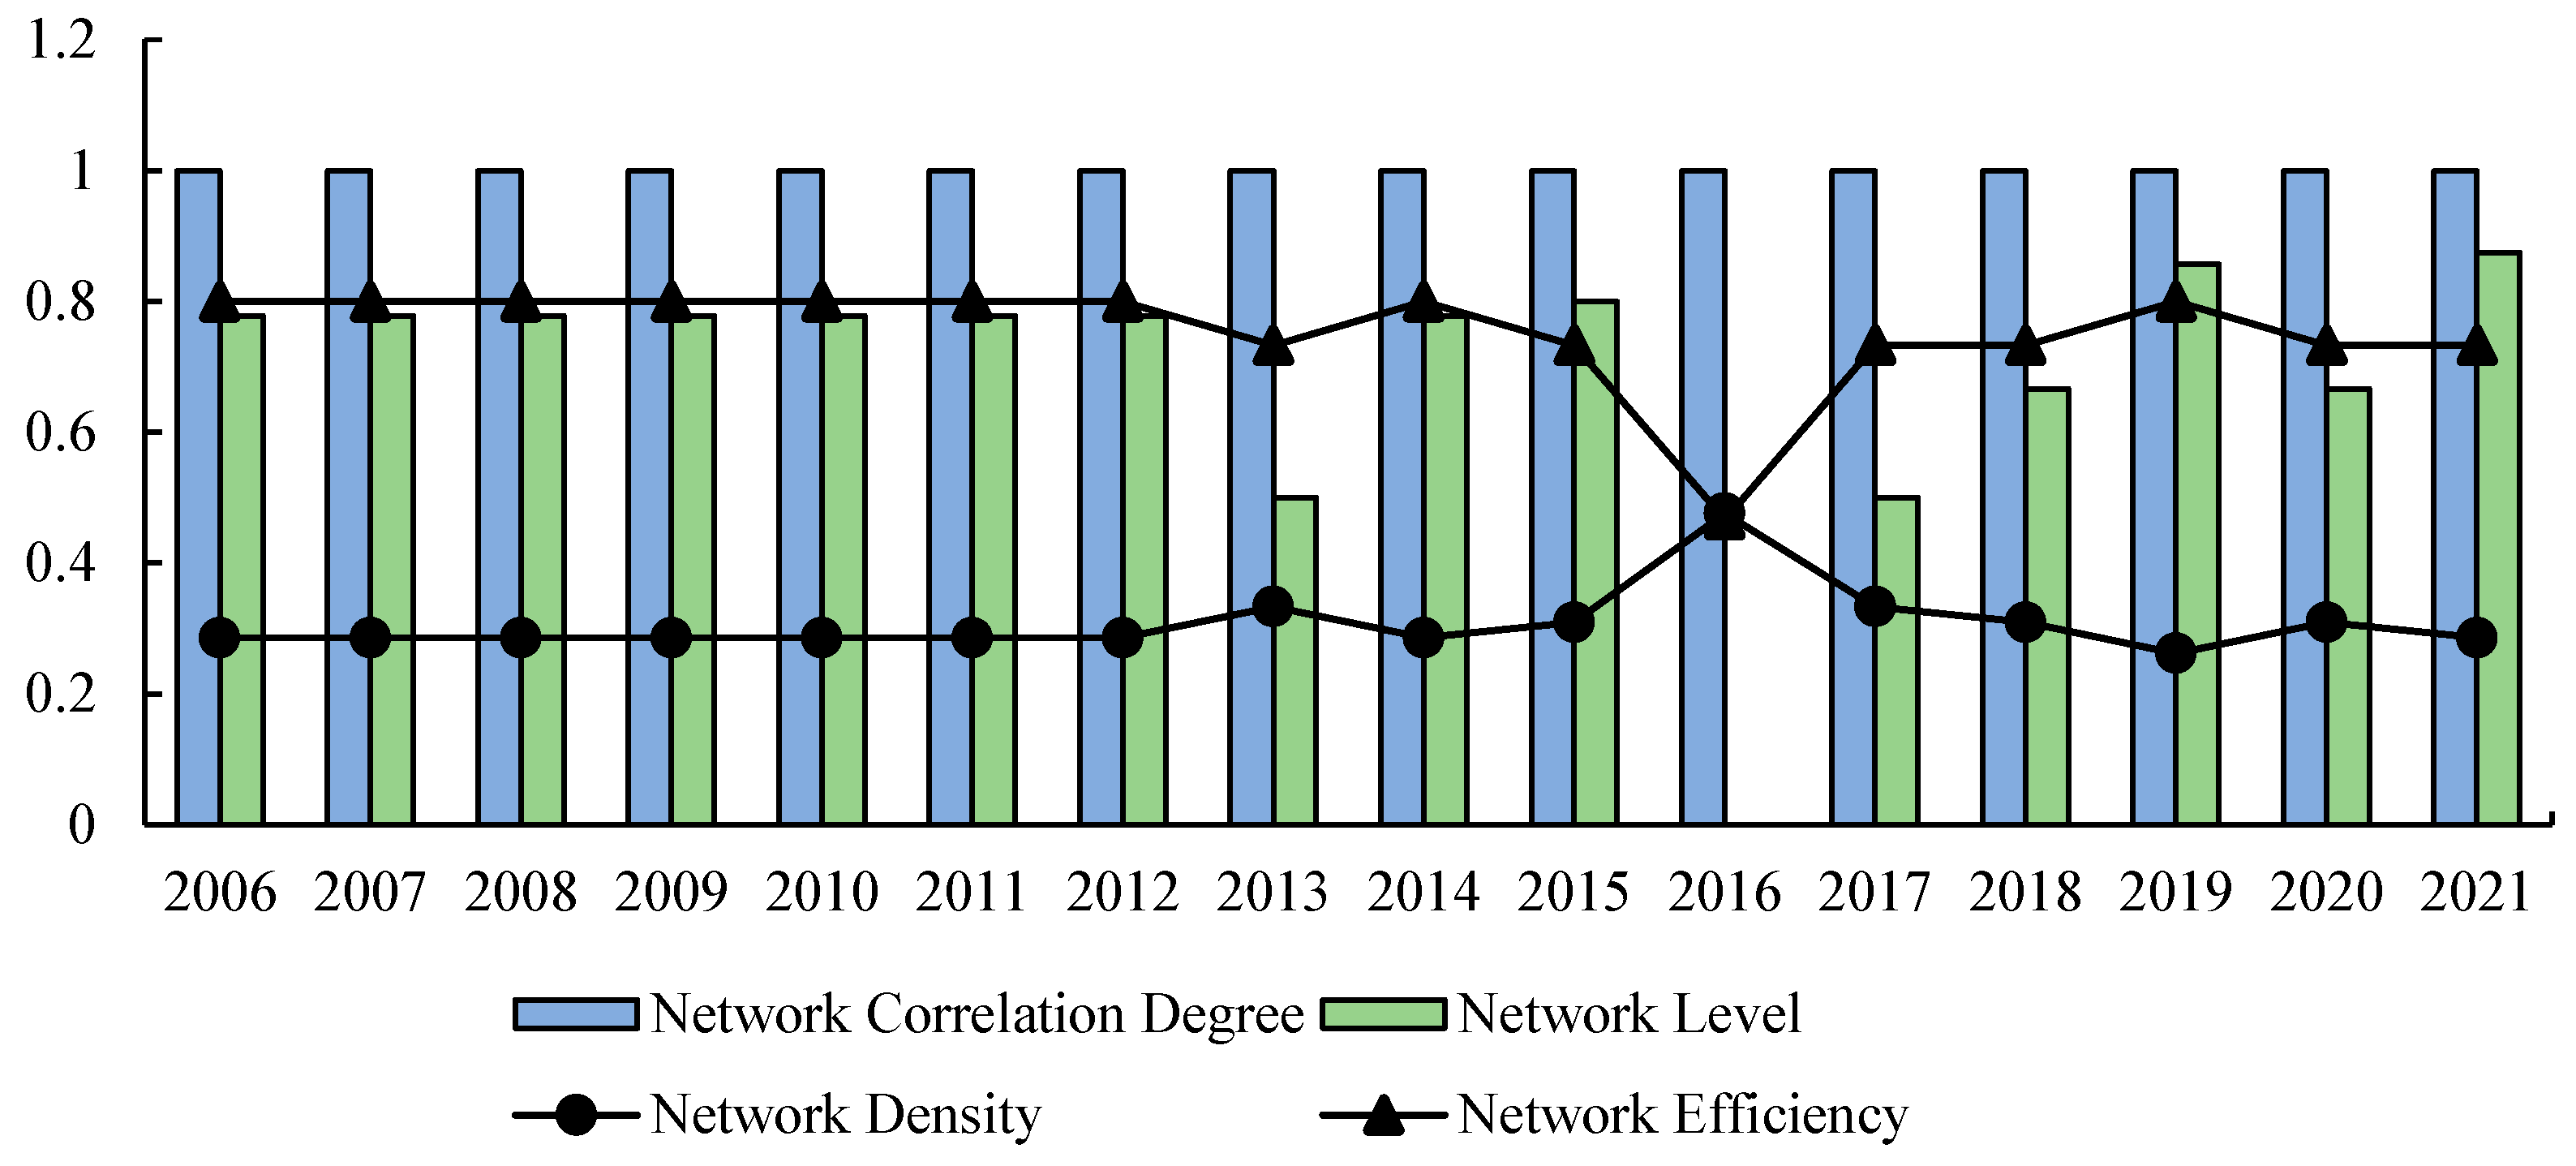
Overall network correlation structure analysis: In this paper, we used four indicators, namely network density, network correlation degree, network level, and network efficiency, as follows:
Network density is measured according to the ratio of the number of real connections in the network to the theoretical maximum number of connections that can be carried in the network, which reflects the closeness of the spatial association network of citrus-production technology progress: the greater the density of the network, the closer the connection between mandarin- and tangerine-production technology progress in each main production area, and the greater the impact of the network on technological progress in citrus production in each main citrus-producing area. The value of network density is between 0 and 1. The specific measurement is shown in Equation (7), where Dn is the network density, n is the number of connections that actually exist, and N is the number of network nodes. So, the maximum number of carrying connections in the directed network graph is N(N − 1).
D n = n / N × N 1
The network correlation degree is an indicator of the robustness and vulnerability of a network structure. If there is a correlation between any two citrus-producing regions in the correlation network, this network structure is robust. When many lines are connected to only one or two citrus-producing regions, then the dependence of the citrus-production technology progress association network on that region is high, and once that region is excluded, the network may collapse, and its network relevance is low. The value of network relevance is between 0 and 1. Measured as shown in Equation (8), R is the network relevance and Z is the number of unreachable nodes in the network.
R = 1 Z N N 1 / 2
The network level reflects the hierarchical structure of each citrus-producing region in the association network, and there is a degree of two-by-two asymmetric arrival between each production region in the network. The value of network level is between 0 and 1. Measured as shown in Equation (9), H is the network level degree, V is the number of pairs of symmetric reachable points in the network, and max(V) is the number of pairs of symmetric reachable points that can be carried by the theoretically existing network.
H = 1 V / max V
Network efficiency reflects the degree of existence of redundant correlations between main production areas in the spatial correlation network of citrus-production technology progress. A lower network efficiency indicates that citrus-production technology progress has more spatial spillover channels and that the correlations between citrus-production technology progress in the main production areas are closer and the spatial correlation network is more stable. The value of network efficiency is between 0 and 1. Measured as shown in Equation (10), E is the network efficiency, M is the number of redundant links in the network, and max(M) is the maximum number of redundant links that can be carried by the theoretically existing network.
E = 1 M / max M
(2)
Individual network structure characterization: This paper adopted three indicators, namely point degree centrality, proximity centrality, and intermediary centrality, to conduct centrality analysis and reveal the role of each citrus-producing region in the network, as follows:
Point degree centrality reflects the degree to which a certain main production area is in the center of the association network structure. The larger the point degree centrality is, the more the main production area is connected with other main production areas in the association network, and the more prominent the center position of the main production area is in the association network. Measured as shown in Equation (11), C is the point degree centrality, q is the number of regions directly associated with a certain main production area in the association network, and Q is the maximum number of directly associated regions that the main production area can carry.
C = q / Q 1
Proximity centrality reflects the ability of citrus-producing regions to be free from the control of other production regions in the correlation network, which is the sum of the shortcut distances between a citrus-producing region and other production regions in the network. The larger the proximity centrality is, the more direct the spatial correlations between the production region and other production regions are, and the easier it is for the region to play the role of a “central actor” in the correlation network. Measured as shown in Equation (12), dij is the shortcut distance between the main production area i and main production area j.
C A P i 1 = j = 1 n d i j
Intermediary centrality reflects the “bridge” and “intermediary” role of each citrus-producing region in the correlation network. The larger the degree of intermediary centrality, the greater the bridge and intermediary role of the citrus-producing region in the correlation network. Assuming that the number of shortcuts between the main citrus-producing areas a and b in the association network is Lab, the number of shortcuts of the third main production area i between the main production areas a and b is Lab(i), and the probability that the main production area i exists between the main production areas a and b is Pab(i) = (Lab(i))⁄Lab. The intermediary centrality measure is given in Equation (13).
C a b i = a N b N P a b i , a b i
(3)
Quadratic assignment procedure (QAP) model: The QAP model is a non-parametric method to explore the relationship between matrices by comparing different matrix data with permutation [34], which usually includes two stages: QAP correlation analysis and QAP regression analysis. This method does not need to assume that the explanatory variables are independent of each other, which can effectively solve the endogeneity problem of relational data, and the regression results are more stable [36]. QAP correlation analysis compares the correlation between two matrices by looking at the matrices as long vectors containing n(n − 1) numbers and then similarly comparing the correlations between the two variables and calculating the correlation coefficients of the two vectors [37,38]. QAP regression analysis is the study of regression relationships between multiple matrices and one matrix by performing a regular regression analysis on the long vector elements corresponding to the independent and dependent variable matrices and then performing a regression on the rows and columns of the dependent variable. The variables are replaced, the regression is repeated, all coefficient values are saved, and the value of R2 is determined [37]. The QAP model is constructed as follows:
T P M = f s t r , inf , e d u , e c o , i n n , f i n , d i s
In Equation (14), TPM is the spatial correlation matrix of citrus-production technology progress, and the independent variables are the regional difference matrix of industrial structure (str), the regional difference matrix of informatization level (inf), the regional difference matrix of education level (edu), the regional difference matrix of economic development level (eco), the regional difference matrix of innovation support (inn), the regional difference matrix of financial support (fin), and the regional difference matrix of agricultural disaster rate (dis).

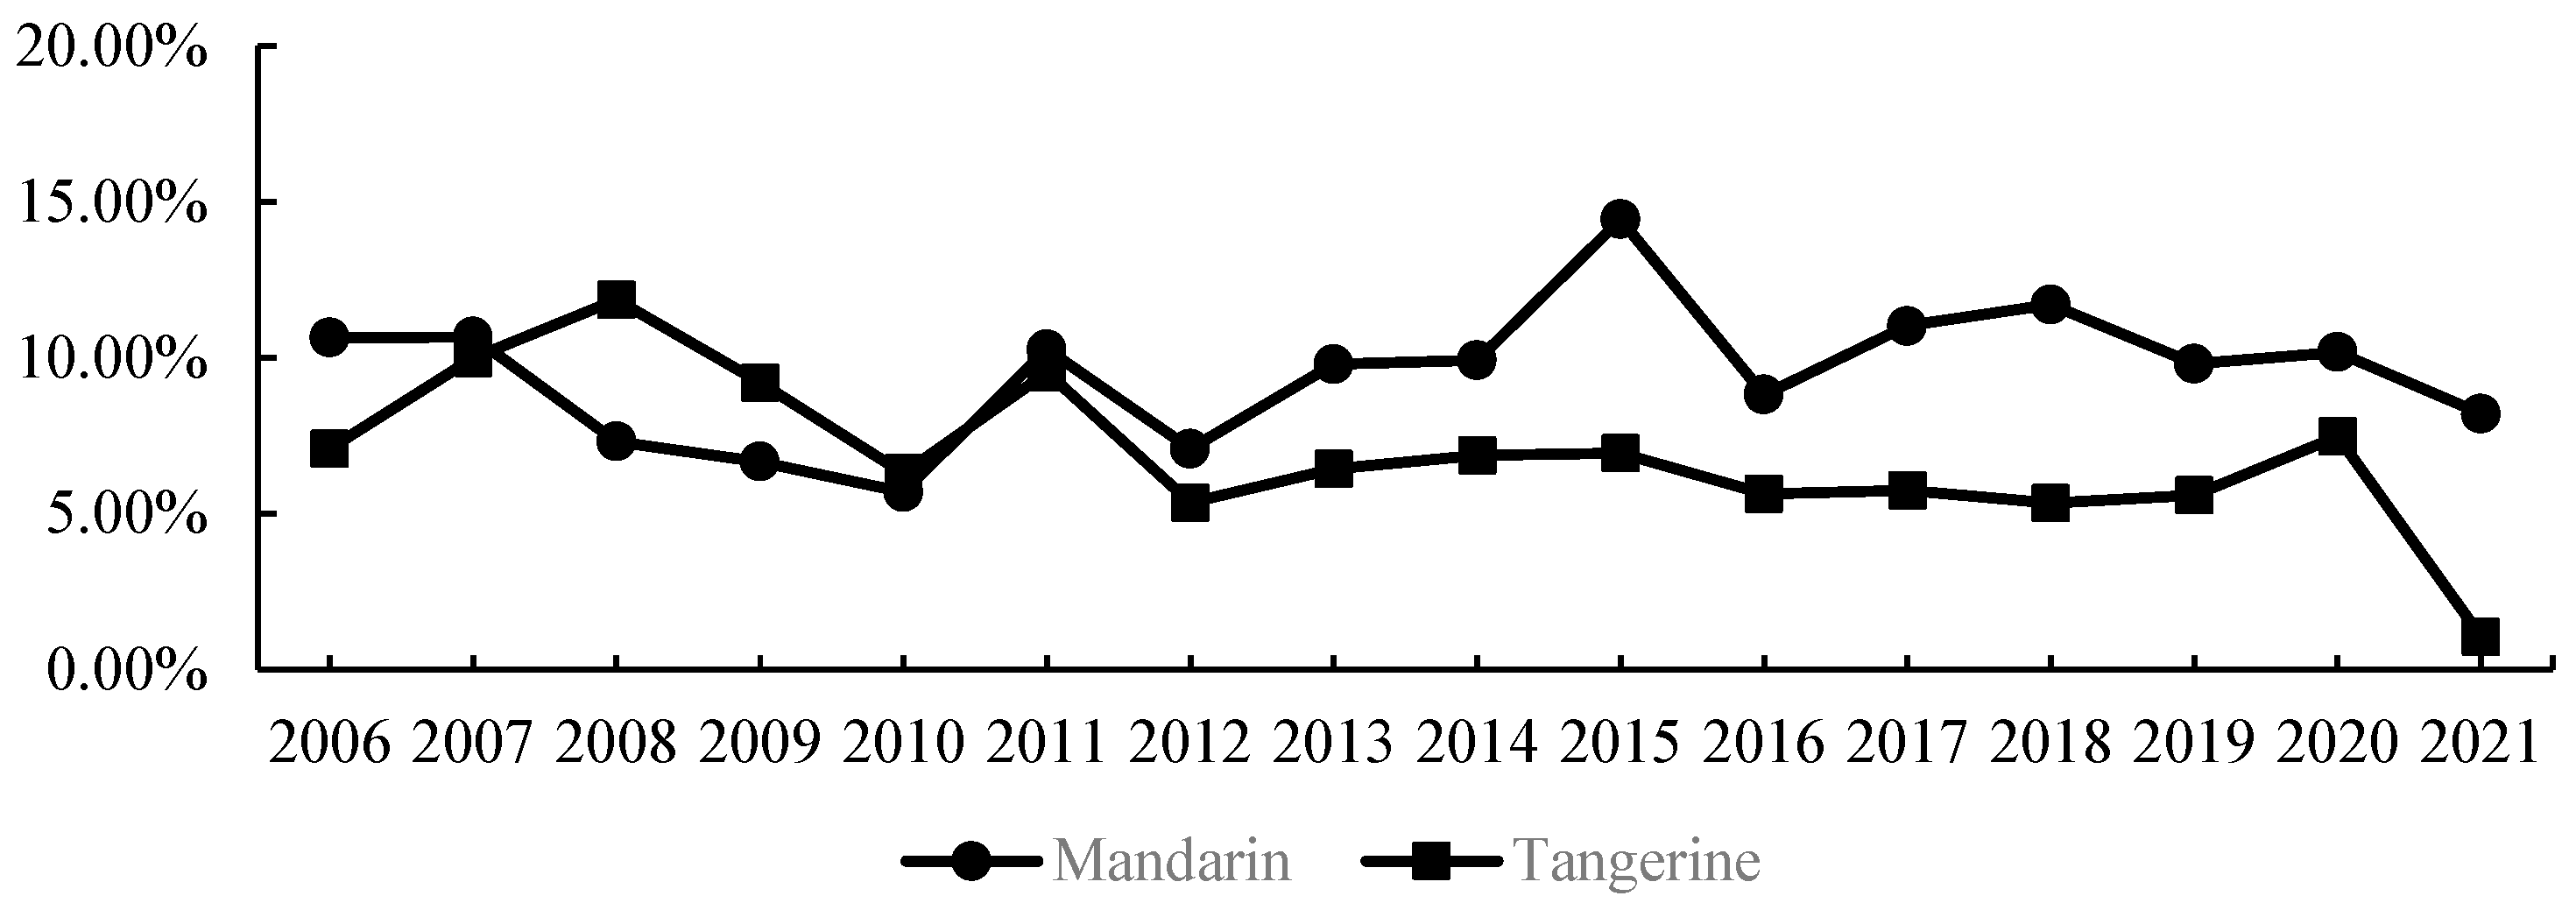
4. Characterization of Changes in Citrus Production Technology Progress

Using stata16 (StataCorp LLC, College Station, TX, USA), based on citrus input and output variables, the technological progress in mandarin and tangerine production in China from 2006 to 2021 was obtained through the transcendental logarithmic cost function, as shown in Figure 1.
As can be seen from Figure 1, the rate of technological progress in mandarin and tangerine production in China was positive from 2006 to 2021, indicating that the production of mandarins and tangerines in China, in general, has been in the stage of technological progress. In terms of the overall level of technological progress, the rate of technological progress in mandarin production has been higher than that in tangerine production since 2011, and the gap was the largest in 2015, with the rate of technological progress in mandarin production being 7.5% higher than that in tangerine production. From the trend of change, the technological progress rate of mandarin and tangerine production fluctuated within the range of 6–12% from 2006 to 2011. The technological progress rate of mandarin production remained stable from 2006 to 2011 and fluctuated from 2011 to 2021, while the technological progress rate of tangerine production showed a fluctuating and decreasing trend and decreased to a minimum of 1.05% in 2021, which may be because tangerine-production technology was internalized and the new technological breakthroughs were difficult [2].
The rate of technological progress in each main mandarin- and tangerine-producing area is shown in Table 3. Regarding the technological progress in mandarin production, the average technological progress rate of Guangdong was the highest, being 11.79% higher than that of Hunan, which was the lowest. The technological progress rate of Fujian tangerine production had the largest increase, which was 9.92% in 2021 compared to 2006. The rate of technological progress in the five main mandarin-producing regions of Guangxi, Chongqing, Hubei, Jiangxi, and Hunan showed a fluctuating downward trend, with the rate of technological progress slowing down. Regarding the technological progress in tangerine production, the average technological progress rate of Hunan was the highest, 11.56% higher than that of Hubei, which was the lowest. Only the technological progress rate of Chongqing showed a rising trend, and the technological progress in the other six main tangerine-producing areas showed different degrees of slowdown, among which, the technological progress rate of Hunan decreased the most, by 21.29%. In summary, it can be seen that, first, the mandarin- and tangerine-production technology progress in both Guangdong and Fujian is at a medium-high level because Fujian and Guangdong have sufficient precipitation, heat, and light and, at the same time, the government has enough financial resources to carry out technological research, development, and diffusion [39]. Second, there are some regional differences in the technological progress in the main production areas of mandarins and tangerines, and the mandarin- and tangerine-production technology progress levels vary in the same area, which may be related to the levels of scientific research in the main production areas of mandarins and tangerines [11]. Third, except for a few years when some of the main production areas may have had negative values for the technological progress rate due to climate and pests and diseases, the rate of citrus-production technology progress in most of the years is still positive, which indicates that all the main production areas are in the stage of technological progress.

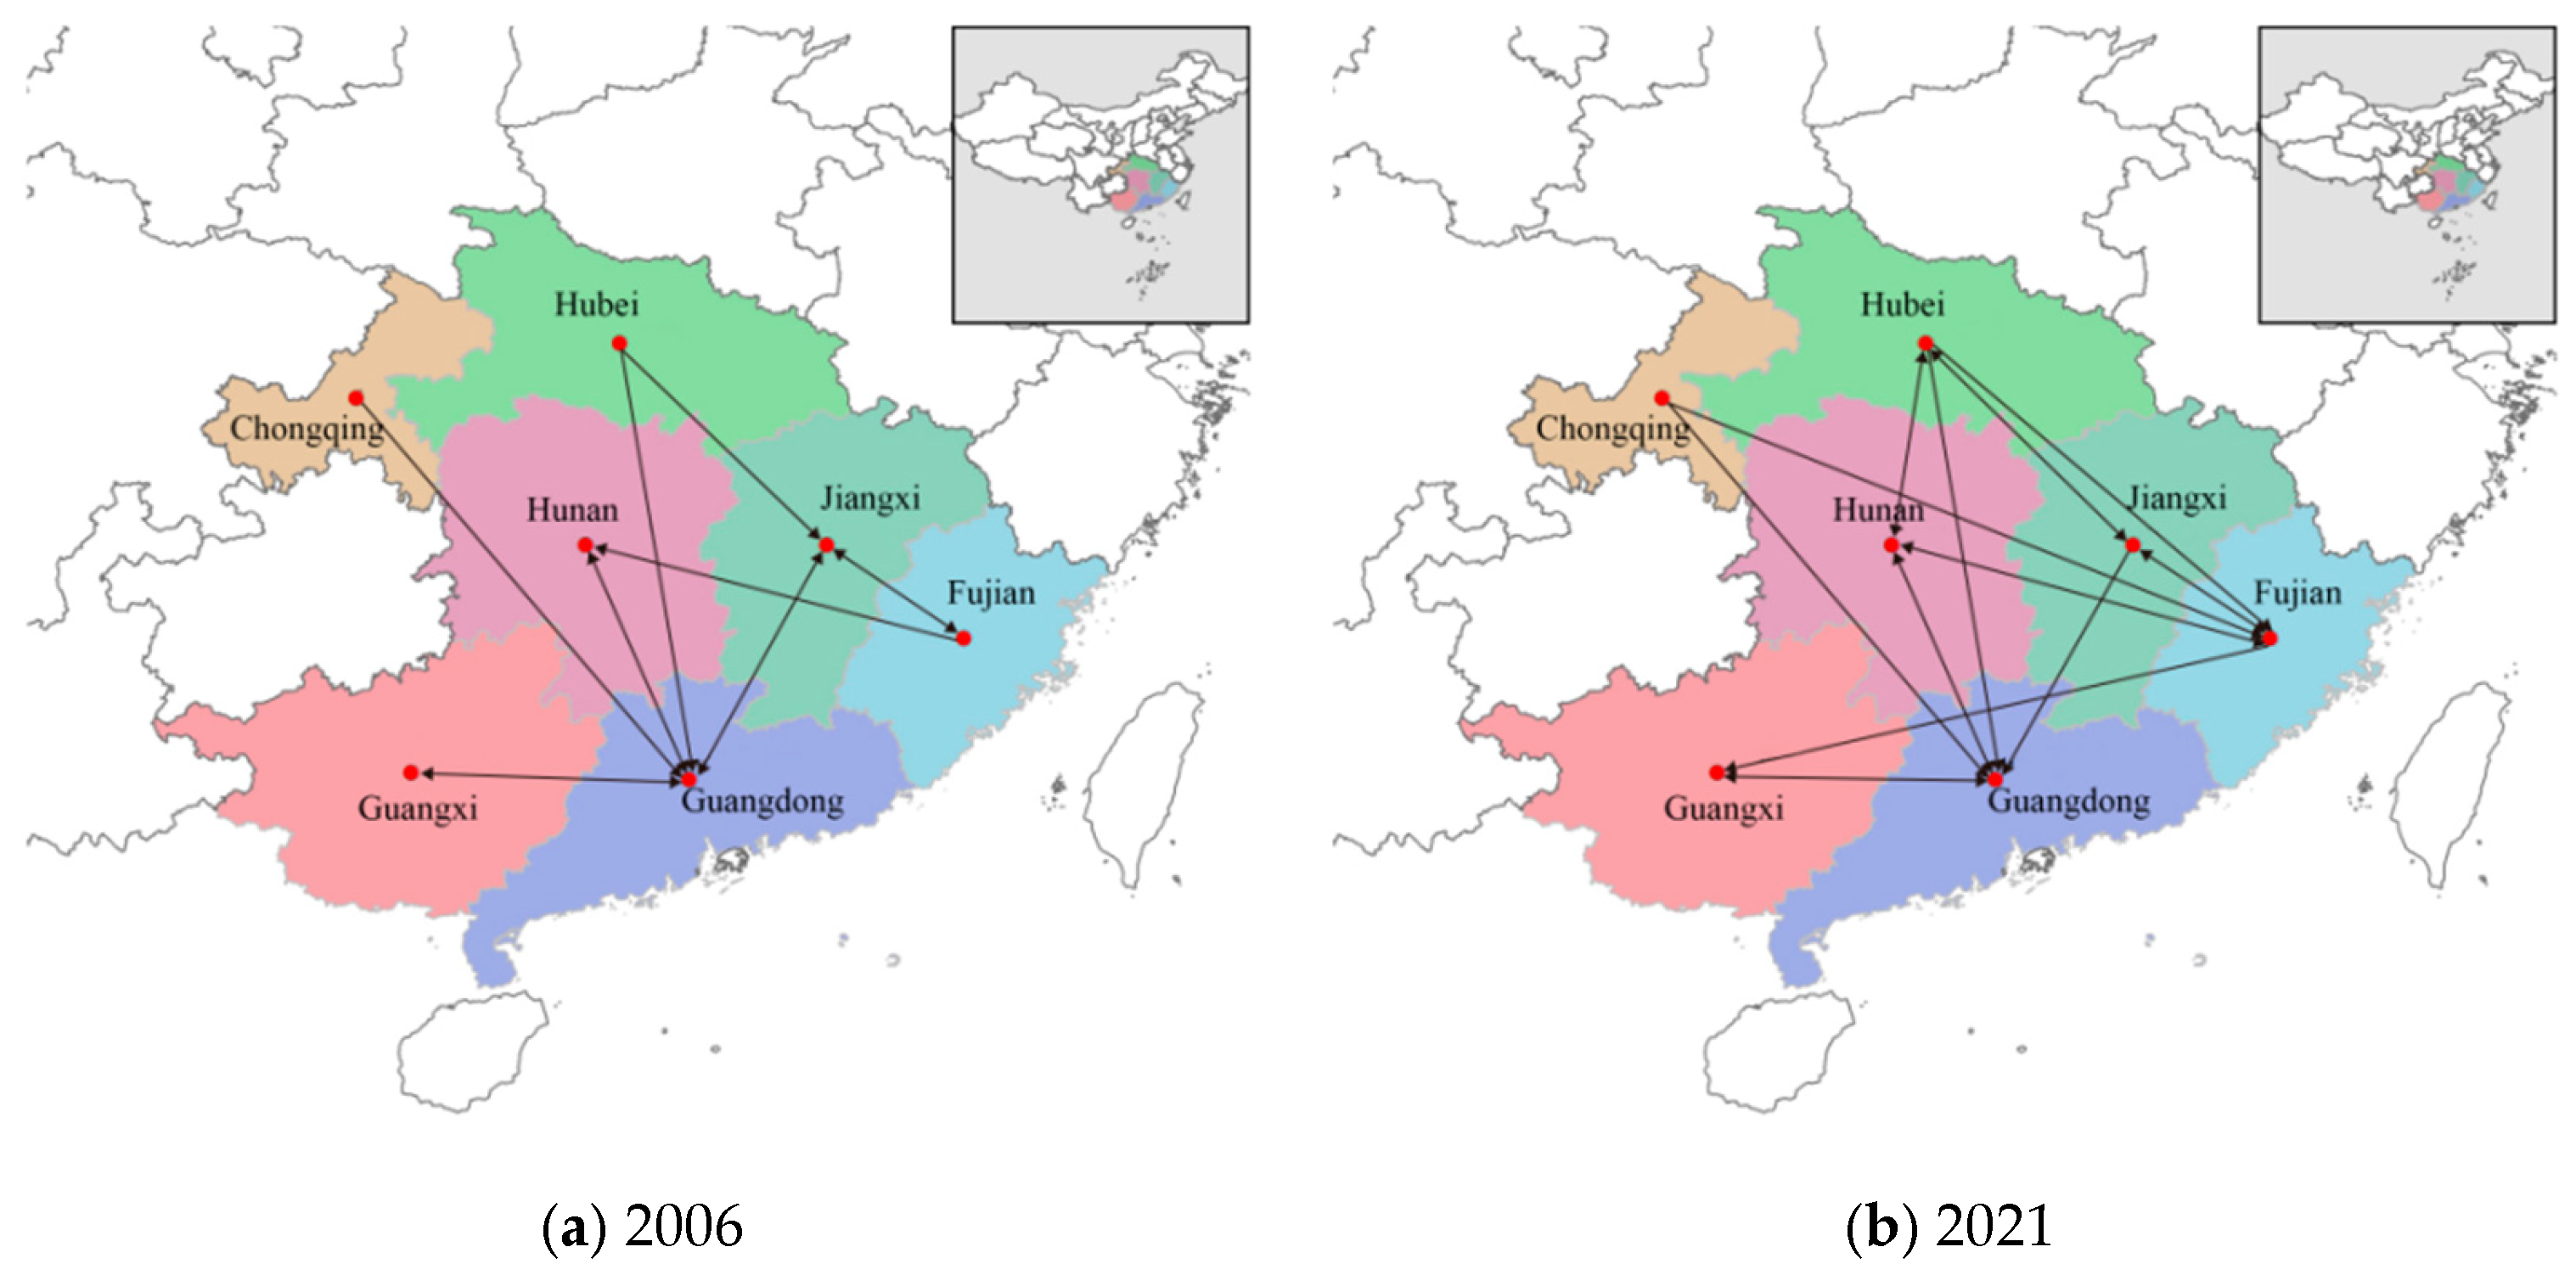
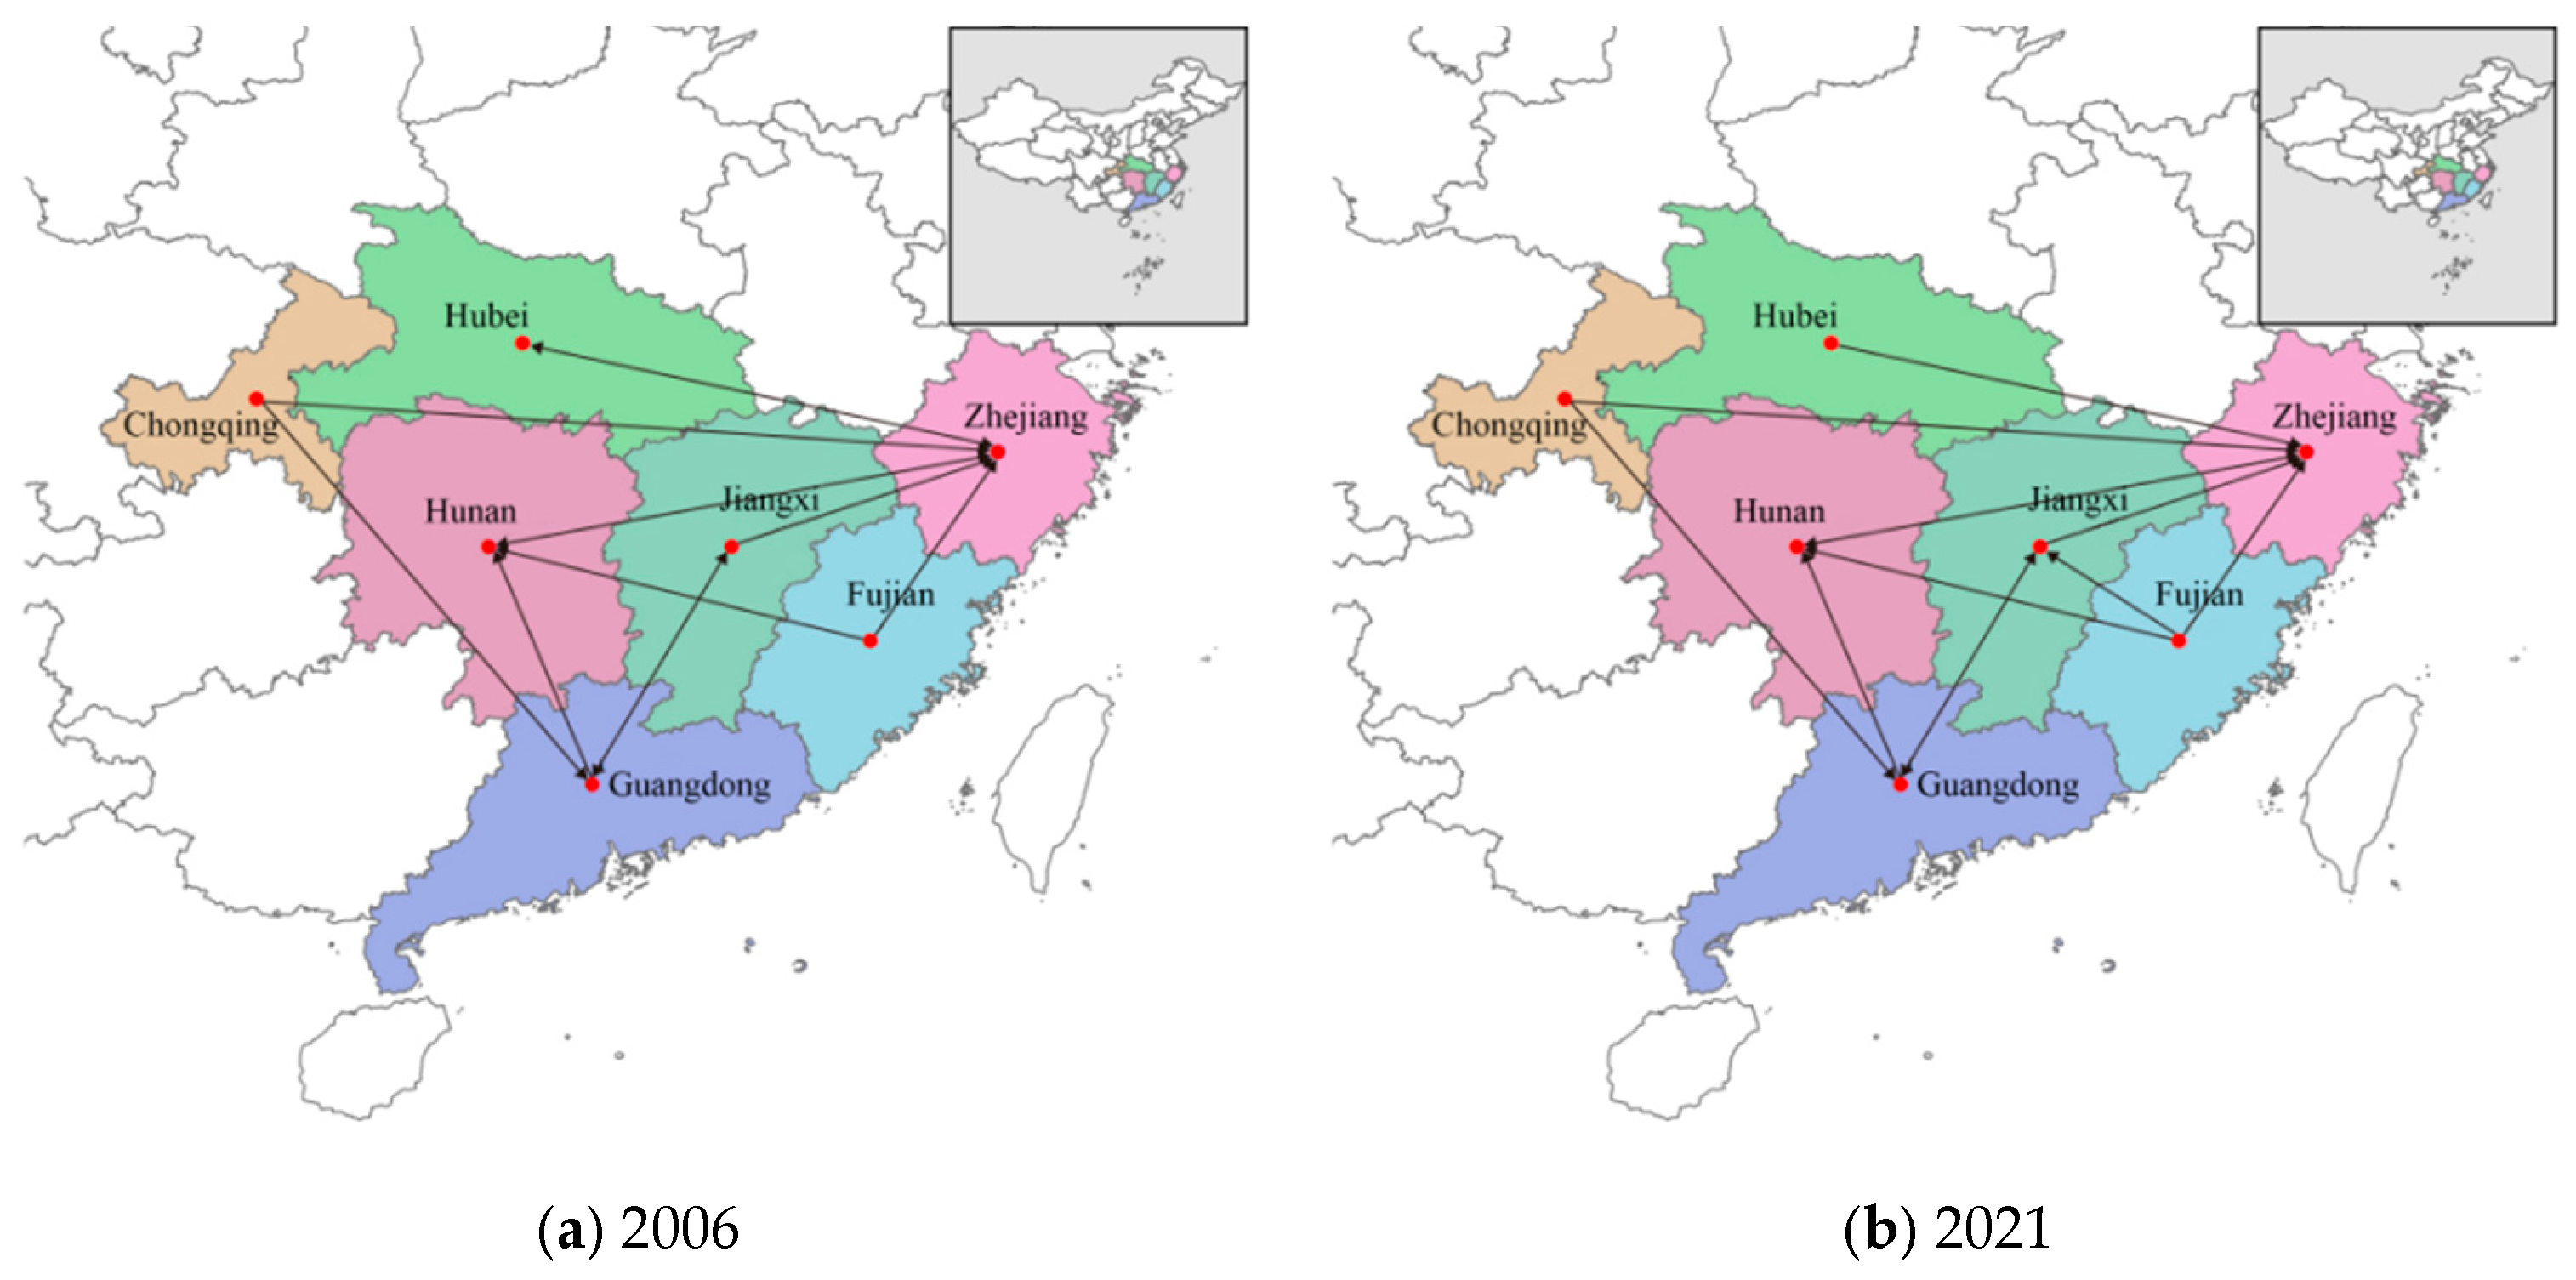
5. Characterization of the Spatial Correlation Network Structure

In order to visualize the structural shape and evolution of the spatial correlation network of citrus-production technology progress in China, this paper maps the structure of the spatial correlation networks of mandarins and tangerines in 2006 and 2021 by using Ucinet6.212 (University of California, Irvine, CA, USA) and ArcGIS10.2.2 (Environmental Systems Research Institute, Redlands, CA, USA) (Figure 2 and Figure 3).
As can be seen from Figure 2 and Figure 3, the citrus-production spatial correlation network of technological progress in China presents the structural characteristics of multi-relationships and multi-directions, and the network correlations are increasingly strengthened. From the structure of the spatial correlation network of mandarin-producing areas, it can be seen that in 2006, Guangdong and Jiangxi had the highest number of correlations and were at the core of the spatial correlation network, forming a dual-core structure, while other mandarin-producing areas also had more correlations and were at the sub-core position. In 2021, the closeness of the technological progress correlation among the main citrus-producing areas was enhanced and the position of Hubei and Fujian in the spatial correlation network was significantly improved, with Guangdong, Hubei, and Fujian occupying the core positions. At the same time, the association links of other main production areas also increased significantly.
From the structure of the tangerine spatial correlation network, it can be seen that in 2006, Zhejiang, Hunan, and Guangdong had the highest number of correlations and were at the core of the spatial correlation network, forming a triple-core structure, and the other tangerine-producing regions were in the sub-core positions. In 2021, the positions of Jiangxi and Fujian in the spatial correlation network gradually improved, because of which the spatial correlation network of the tangerine-production technology progress presents a multi-core structure characteristic. The main reason is that with the implementation of the strategy of agricultural power and regional coordinated development, under the dual roles of market mechanism and government macro-control, the mobility of inter-regional citrus-production factors has been enhanced, mutual exchanges and cooperation among main citrus-producing areas have been strengthened, the frequency of interaction has increased, the spatial interaction of citrus-production technology progress has been strengthened, and the stability of the spatial network has improved.

5.1. Characteristics of the Overall Network Structure

In order to grasp the overall structure of the spatial correlation network of China’s mandarin- and tangerine-production technology progress in more depth, Ucinet6.212 (University of California, Irvine, CA, USA) was used to examine and analyze the overall network structure in four aspects, namely network density, network correlation degree, network level, and network efficiency, and the results are shown in Figure 4 and Figure 5.
First, with regard to network density, the spatial network density of mandarin-production technology progress showed a fluctuating upward trend, and the spatial network density of citrus-production technology progress reached the maximum value of 0.4286 in 2021. The spatial association network density of tangerine-production technology progress reached the maximum value of 0.4762 in 2016 and then gradually declined. However, the overall mandarin and tangerine network densities were not large, indicating that at present, the degree of closeness of the spatial correlation relationship of citrus-production technology progress in China is not high, the network structure is relatively loose, and the spatial cooperation and interaction of technological progress need to be strengthened. Second, regarding the network correlation degree, the network correlation degree of both mandarins and tangerines was 1, which indicates that the network correlation structure of technological progress related to mandarin and tangerine production in China has good connectivity and robustness, all the main production areas of mandarins and tangerines are in the spatial association network of citrus-production technology progress, there is no isolated main production area detached from the network, and the spatial spillover effect of the network is obvious. Third, regarding the network level, except for 2016, when the network level of tangerines was 0, the spatial network level of technological progress related to both mandarin and tangerine production in other years was not 0. Therefore, the spatial association network of technological progress related to both mandarin and tangerine production needs to be further optimized. In contrast, the spatial network rank of technological progress related to mandarin production was lower than that related to tangerine production, indicating that the gradient characteristics of the spatial network of technological progress related to tangerine production is stronger than that related to mandarin production, and the spatial network of technological progress related to tangerine production is more polarized, with more main tangerine-producing areas at the edge of the network. Fourth, regarding network efficiency, the spatial network efficiency of technological progress in relation to both mandarin and tangerine production showed a decreasing trend, indicating that there is an increase in the number of connecting lines in the technological progress correlation network, an increase in the stability of the network, and the existence of multiple superimposed spillover channels.
Overall, through the overall network structure characterization, there are significant spatial correlation and spillover paths in the spatial association network of technological progress related to Chinese citrus production, the phenomenon of synergistic development is obvious, and a more stable spatial association network of technological progress has been formed; however, the network structure is relatively loose and there are strong gradient characteristics. Thus, improving the tightness of the network and decreasing the degree of the network level are the key points for promoting technological progress in citrus production in China.

5.2. Characteristics of the Individual Network Structure

In order to examine the position and role of each main citrus-producing area in the spatial correlation network of technological progress in a more detailed way and to grasp the characteristics of its individual network structure, this paper measured the centrality of the main mandarin- and tangerine-producing areas, and the results are shown in Table 4.
In terms of the point degree centrality, in the spatial correlation network of technological progress in Chinese-mandarin-producing areas, the point degree centrality rankings in decreasing order were Guangdong, Fujian, Hubei, Jiangxi, Hunan, Guangxi, and Chongqing, among which Guangdong and Fujian ranked first, which indicates that these two main production areas are in the “core position” of the spatial correlation network of technological progress in mandarin-producing areas and play an important role in the network. The rankings of the point-out degree in decreasing order were Hubei, Jiangxi, Hunan, Fujian, Guangdong, Chongqing, and Guangxi, indicating that the technological progress related to mandarin production in Hubei has a greater influence on other main mandarin-producing regions. The rankings of the point-entry degree in decreasing order were Guangdong, Fujian, Hunan, Guangxi, Jiangxi, Hubei, and Fujian, indicating that the technological progress in Guangdong mandarin production is more influenced by other main mandarin-producing areas, among which the point-entry degree of Chongqing was 0, which indicates that Chongqing belongs to the technological spillover main production areas in the spatial correlation network of technological progress in China’s mandarin production and is influenced to a limited extent in the overall network. In terms of the spatial correlation network of the technological progress in the major Chinese mandarin-producing areas, the rankings for the point degree of centrality in decreasing order were Zhejiang, Guangdong, Jiangxi, Hunan, Fujian, Chongqing, and Hubei, of which Zhejiang ranked first, indicating that it has the highest correlation relationship with other major mandarin-producing areas and is in the “core position” of the spatial correlation network of technological progress in major mandarin-producing areas. The rankings of the point-out degree in decreasing order were Fujian, Guangdong, Jiangxi, Chongqing, Zhejiang, Hubei, and Hunan, indicating that the technological progress in Fujian tangerine production has a greater influence on other tangerine-producing regions. The rankings of the point-entry degree in decreasing order were Zhejiang, Hunan, Guangdong, Jiangxi, Hubei, Fujian, and Chongqing, indicating that the technological progress in Zhejiang tangerine production is greatly influenced by other tangerine-producing regions, and the point-entry degree of Hubei, Fujian, and Chongqing was 0, which indicates that these three tangerine-producing regions belong to the technological spillover type of the spatial correlation network of the technological progress in tangerine production, and the degree of their influence in the overall network is limited.
In terms of proximity centrality, the average value of proximity centrality in the spatial correlation network of the technological advancement of major mandarin-producing regions in China was 71.39, and there were two major mandarin-producing regions for which the values of proximity centrality were higher than this average value, namely Guangdong and Fujian, which indicates that Guangdong and Fujian can more quickly generate intrinsic connections with other major production regions in the spatial correlation network of technological advancement of major mandarin-producing regions. In other words, Guangdong and Fujian play the role of central actors in the network. In the spatial correlation network of technological progress in Chinese-tangerine-producing regions, the average value of the proximity centrality of tangerine-producing regions was 65.10, and there were four tangerine-producing regions that had higher proximity centrality than this average value, namely Zhejiang, Jiangxi, Hunan, and Fujian, indicating that these four regions are able to connect with other tangerine-producing regions more quickly in the spatial correlation network of technological progress and they play the role of a central actor.
In terms of intermediary centrality, the average value of intermediary centrality in the spatial correlation network of technological advancement of major mandarin-producing regions in China was 8.57, and the major mandarin-producing regions with intermediary centrality values higher than this average value were Guangdong and Fujian, which indicates that Guangdong and Fujian have a stronger ability to control the technological exchange among other major mandarin-producing regions in the spatial correlation network of technological advancement, are at the core of the network, and play the role of intermediary and bridge. In the spatial correlation network of technological progress in major tangerine-producing areas in China, the average value of the intermediary centrality of major tangerine-producing areas was 11.43, and the major tangerine-producing area with a higher average intermediary centrality value was Zhejiang, which indicates that Zhejiang has a stronger ability to control technological exchanges among other major tangerine-producing areas in the spatial correlation network of technological progress in these areas, is at the core of the network, and plays the role of intermediary and bridge. The degree of intermediary centrality of Guangdong, Fujian and Zhejiang was much higher than that of other mandarin-producing regions because these three production regions belong to the eastern developed region, which has a strong driving ability and plays a controlling and dominating role over other production regions.
Taken together, the analysis results of point centrality, proximity centrality, and mediation centrality are similar. The spatial network structure of China’s citrus-production technology progress shows an obvious Matthew effect, with the relatively economically developed eastern provinces of Guangdong, Fujian, and Zhejiang having a higher status in the spatial network and a stronger dominant role in controlling the resource elements needed for progress in citrus-production technology. However, Chongqing, in the western part of the country, is in a passive position in citrus-production technology exchanges and cooperation.

6. Analysis of Factors Influencing the Spatial Correlation Network

6.1. QAP Correlation Analysis

Clarifying the factors influencing the spatial correlation network of citrus-production technology progress in China and its functioning mechanism is an important foundation for optimizing and regulating the structure of the correlation network of regional citrus-production technology progress. Therefore, the spatial correlation matrices of mandarin and tangerine production were combined, and correlation analysis was carried out using the quadratic assignment procedure (QAP) model based on the influencing factors selected above. As shown in Table 3, differences in education levels and economic development levels passed the 1% significant level test, differences in innovation support passed the 5% significant level test, and differences in informatization levels and financial support passed the 10% significant level test, indicating that these five factors significantly affect the formation of the spatial correlation network structure of citrus-production technology progress in China. Among them, the correlation coefficient of differences in education levels was negative, indicating that similar education levels are an important factor in generating spatial association and spatial spillover of citrus-production technology progress. The correlation coefficients of four variables, namely differences in informatization levels, differences in economic development levels, differences in innovation support, and differences in financial support, were positive, indicating that regional differences in these four variables are conducive to the formation of the spatial correlation network of citrus-production technology progress. The correlation coefficients of differences in industrial structure and differences in agricultural disaster rates were positive, but their significance levels were higher than 10%, indicating that their effects on the spatial correlation of citrus-production technology progress in China are not significant.

6.2. QAP Regression Analysis

In order to avoid multicollinearity between independent variables causing bias in the regression results, this paper set the number of random permutations to times to conduct QAP regression analysis on the model of factors influencing the spatial correlation of the technological progress in citrus production in China.
As can be seen from Table 5, Adj R2 = 0.983, indicating that seven factors (i.e., industrial structure differences, informatization level differences, education level differences, economic development level differences, innovation support differences, financial support differences, and agricultural disaster rate differences) can explain approximately 98.3% of the spatial correlation effect of citrus-production technology progress in China. Among them, the regression coefficient of the differences in education levels was significantly negative at the 1% level, indicating that the differences in rural education levels significantly hinder the formation of the spatial correlation of citrus technological advancement in China. This is mainly because similar rural education levels mean that growers in these main production areas have similar abilities to learn the technology, which can help in the mutual exchange of citrus-production technology between the main production areas and thus promote the formation of the spatial correlation of technological advancement. The differences in informatization levels, economic development levels, innovation support, and financial support were significantly positive, at 10%, 1%, 5%, and 10%, respectively, indicating that the spatial correlation of technological advancement is more likely to occur among citrus-producing regions with higher differences in informatization levels, economic development levels, innovation support, and financial support. The higher the level of informatization and economic development, coupled with an increase in government support for innovation and finance, the greater the potential and opportunity for technological innovation in the main citrus-producing areas and the stronger the attraction of talent and capital to the main production areas that are lagging behind in development, making it easier for the resource elements needed for technological progress to flow across regions between the main production areas, thus facilitating the formation of spatial correlation relationships. The regression coefficients of the differences in industrial structure and the differences in the rates of agricultural disasters were positive but not significant (p > 0.1), indicating that the regional differences in industrial structure cannot significantly affect the spatial correlation of citrus-production technology progress, the impact of meteorological disasters on the technological progress in citrus production is limited, and Huanglong disease is usually the main reason affecting the production of citrus [40].

7. Conclusions and Policy Implications

7.1. Conclusions

Based on the cost–benefit data of China’s main mandarin- and tangerine-producing areas from 2006 to 2021, this paper measured the rate of technological progress in China’s mandarin and tangerine production using the transcendental logarithmic cost function model and analyzed its changing characteristics. The paper constructed a modified gravity model to determine the spatial correlation relationship of technological progress in the main areas producing mandarins and tangerines and established spatial correlation networks, based on which, it explored the characteristics of the overall network structure and the individual network structure by applying the social network analysis method. The paper further investigated the factors influencing the spatial correlation networks using the QAP regression analysis method and arrived at the following conclusions:
First, regarding the changing characteristics of the technological progress in Chinese citrus production, in general, the production of Chinese mandarins and tangerines is in the stage of technological progress, and the rate of technological progress related to mandarins is higher and more stable than that related to tangerines. In terms of spatial distribution, the average rate of technological progress in mandarin production is the highest in Guangdong, and that in tangerine production is the highest in Hunan. There are obvious inter-regional and intra-regional differences in technological progress in mandarin and tangerine production. In terms of time series development, except for Fujian and Guangdong, the technological progress rates of other major mandarin-producing regions show a fluctuating downward trend and a slowdown. In addition, except for Chongqing, the technological progress rates of other tangerine-producing areas show a slowdown.
Second, in terms of the overall network structure, China’s citrus-production technology progress spatial network is becoming denser and more complex, and the stability of the spatial network is constantly improving, presenting a multi-core structure in space. The spatial network density of the technological progress in mandarin and tangerine production is not high, and the network structure is relatively loose. The network correlation degree is 1, there is no isolated main production area outside the network, and the network spatial spillover effect is obvious. Differences in the characteristics of mandarin and tangerine network levels are more obvious, with the mandarin-production technology progress space-network level being overall lower than that of tangerines, and the tangerine-production technology progress space-correlation-network polarization phenomenon is more serious. The spatial network efficiency of technological progress in both mandarin production and tangerine production shows a decreasing trend, the network stability is increasing, and there are multiple superimposed spillover channels.
Third, in terms of individual network characteristics, the point degree centrality of Guangdong and Fujian, the two main production areas, is the highest among the main mandarin-producing areas; that of Zhejiang is the highest among the main tangerine-producing areas; and they are in the core positions in the spatial correlation networks of technological progress in the main mandarin- and tangerine-producing areas, respectively. At the same time, the proximity centrality of Guangdong and Fujian is higher than the national average of mandarin-producing regions, and the proximity centrality of Zhejiang, Jiangxi, Hunan, and Fujian is higher than the national average of tangerine-producing regions. These main regions play the role of central actors in the spatial association network of technological progress. The intermediary centrality of Guangdong and Fujian is also higher than the national average for mandarin-producing regions, and the intermediary centrality of Zhejiang is higher than the national average for tangerine-producing regions, and they play the roles of intermediary and bridge in the spatial correlation network of technological progress. The spatial network of the technological progress in citrus production in China shows a significant Matthew effect, with the relatively economically developed eastern provinces of Guangdong, Fujian, and Zhejiang having a higher status in the spatial network, while Chongqing, in the western part of the country, is in a passive position in citrus-production-related technological exchanges and cooperation.
Fourth, the QAP analysis results show that the differences in education levels have a significant negative impact on the structure of the spatial correlation network of citrus-production technology progress in China. Differences in the levels of information technology, economic development, innovation support, and financial support have a significant positive effect on the spatial network structure of citrus-production technology progress in China. Differences in the industrial structure and agricultural disaster rates do not have a significant effect on the spatial network structure of citrus-production technology progress in China.

7.2. Policy Implications

First, a modern citrus industry science and technology innovation system should be built, increasing citrus-specific scientific research input, innovating and developing citrus-production technologies, and promoting new technologies through demonstration projects to provide a new driving force for China’s citrus-production technology progress.
Second, there is a need to grasp the structure of the overall linkage network, implement the strategy of coordinated regional development of citrus science and technology innovation, and promote the construction of spatial spillover channels of citrus technological advancement. For the marginal production regions in the spatial linkage network of citrus technological advancement, the role of the government is necessary in seeking technical assistance, obtaining a guaranteed supply of citrus-production technology in terms of citrus breeding and planting, and promoting the balanced development of China’s citrus-production technology in the region.
Third, with regard to the positioning of the network roles of the main production regions, differentiated policy regulation should be implemented to accurately identify the central actors in the spatially linked network and the main production regions that act as intermediaries and bridges in the spatial transmission paths, so as to provide an accurate idea of their vital driving roles.
Finally, there is a need to speed up the development of rural education in the production regions that are trailing behind and reduce the disparity in the quality of rural education between the production regions. To increase the likelihood of forming correlations with other production regions, each production region needs to pay more attention to the effects of information technology, economic development, support for innovation, and financial support.
This study used the cost–benefit panel data of seven main mandarin-producing regions and seven main tangerine-producing regions from 2006 to 2021. Although the data of each production factor of each main production region were collected and processed, the data of other production regions could not be obtained. Thus, to some extent, this study could not accurately reflect the actual level of technological progress in citrus production in China. In the future, with better data information, it is hoped that the data related to the production of all mandarin- and tangerine-producing areas will be collected, with a sufficiently large sample size to make the research conclusions more accurate and representative. Meanwhile, in the future, research can also be conducted on how to optimize the factor allocation of land, labor, and capital to promote citrus-production technology progress; how to introduce technology-embedded governance to promote citrus-production technology progress; and how to implement institutional-embedded governance to innovate institutional mechanisms.
This article belongs to the same series of research as the author’s previous article published in this Special Issue, entitled “Spatiotemporal Evolution and Spatial Convergence Analysis of Total Factor Productivity of Citrus in China”. The previous article’s research concluded that technological progress is the main factor affecting the total factor productivity of citrus. This article further measured the technological progress in citrus production in China by using the transcendental logarithmic cost function model and analyzed the spatial correlation network structure and its influencing factors, which expands on the previous article.

Author Contributions

Conceptualization, Y.G.; methodology, Y.G. and B.L.; software, Y.H.; validation, F.L.; formal analysis, Y.H.; resources, Y.G.; data curation, Y.H. and F.L.; writing—original draft preparation, Y.G.; writing—review and editing, Y.G. and F.L.; visualization, Y.G. and B.L.; supervision, C.Q.; project administration, C.Q.; funding acquisition, C.Q. All authors have read and agreed to the published version of the manuscript.

Funding

This research was funded by the China Agriculture Research System-National Citrus Industry Technology System (CARS-26-06BY), the National Social Science Fund of China (23BJY155), and the Major Consulting Project of Jiangxi Research Institute for the Development Strategy of China Engineering Science and Technology (2022-DFZD-37).

Institutional Review Board Statement

Not applicable.

Data Availability Statement

The data presented in this study are available from the first author upon request.

Conflicts of Interest

The authors declare no conflict of interest.

References

  1. Qi, C.J.; Gu, Y.M.; Zeng, Y. Progress of citrus industry economy in China. J. Huazhong Agric. Univ. 2020, 31, 1–4. (In Chinese) [Google Scholar]
  2. Gu, Y.M.; Qi, C.J.; Liu, F.X.; Lei, Q.Y.; Ding, Y.C. Spatiotemporal Evolution and Spatial Convergence Analysis of Total Factor Productivity of Citrus in China. Agriculture 2023, 13, 1258. [Google Scholar] [CrossRef]
  3. Deng, X.X. Review and Prospect of 60 Years of Citrus Breeding in China. J. Hortic. 2022, 49, 2063–2074. (In Chinese) [Google Scholar]
  4. Guo, W.W.; Ye, J.L.; Deng, X.X. Fruit scientific research in New China in the past 70 years: Citrus. J. Fruit Sci. 2019, 36, 1264–1272. (In Chinese) [Google Scholar]
  5. Huang, W.H.; Qi, C.J. Study on the evolution of spatial layout and driving factors of citrus production in China. J. Huazhong Agric. Univ. (Soc. Sci. Ed.) 2022, 4, 90–103. (In Chinese) [Google Scholar]
  6. Zhang, Y.; Zhao, Y.; Qi, C. Analysis of world citrus trade pattern. World Agric. 2007, 12, 26–29. (In Chinese) [Google Scholar]
  7. He, J.; Qi, C. Comparison and reference of Chinese and foreign citrus industry development mode. Economy 2010, 2, 110–113. (In Chinese) [Google Scholar]
  8. Wu, Y. Assessment of technical efficiency and analysis of influencing factors in Chinese citrus plantation. China Agric. Resour. Zoning 2018, 39, 94–102. (In Chinese) [Google Scholar]
  9. Chen, S.; Hu, H.; Fu, S. Impacts of factor price changes on agricultural technology progress and factor substitution—Taking corn production as an example. J. Hunan Agric. Univ. (Soc. Sci. Ed.) 2018, 19, 24–31. (In Chinese) [Google Scholar]
  10. Zhou, H.Y. Research on the Spatial Correlation of Agricultural Technology Progress and Its Influencing Factors in Xinjiang. Master’s Thesis, Shihezi University, Shihezi, China, 2022. [Google Scholar]
  11. Fang, G.Z.; Qi, C.J.; Lei, Q.Y. Calculation of total factor productivity of citrus in China and the difference of region—Based on the DEA-Malmquist index method. Chin. J. Agric. Resour. Reg. Plan. 2019, 40, 29–34. (In Chinese) [Google Scholar]
  12. Li, D.H.; Guo, J.Y.; Zhu, S.B. Total factor productivity, technological progress and efficiency changes in China’s citrus industry. J. Jiangxi Agric. Univ. 2010, 9, 43–47. (In Chinese) [Google Scholar]
  13. Xu, J.C. Research on Technological Progress and Its Causal Factors of Wheat Production in China. Master’s Thesis, Huazhong Agricultural University, Wuhan, China, 2020. [Google Scholar]
  14. Solow, R.M. Technical change and the aggregate production function. Rev. Econ. Stat. 1957, 39, 312–320. [Google Scholar] [CrossRef]
  15. Arrow, K.J. The economic implications of learning by doing. Rev. Econ. Stud. 1962, 29, 155–173. [Google Scholar] [CrossRef]
  16. Christensen, L.R.; Jorgenson, D.W.; Lau, L.J. Transcendental logarithmic utility functions. Am. Econ. Rev. 1975, 65, 367–383. [Google Scholar]
  17. Tan, C. Introduction to Development Economics; Wuhan University Press: Wuhan, China, 2009. (In Chinese) [Google Scholar]
  18. Mao, W.; Koo, W.W. Productivity growth, technological progress, and efficiency change in Chinese agriculture after rural economic reforms: A DEA approach. China Econ. Rev. 1997, 8, 157–174. [Google Scholar] [CrossRef]
  19. Da Silva, G.; Gomes, E.G.; de Andrade Alves, E.R.; Garcia Gasques, J. Technological progress in the Brazilian agriculture. Socio-Econ. Plan. Sci. 2020, 72, 100879. [Google Scholar]
  20. Tan, C.; Tao, J.; Yi, L.; He, J.; Huang, Q. Dynamic Relationship between Agricultural Technology Progress, Agricultural Insurance and Farmers’ Income. Agriculture 2022, 12, 1331. [Google Scholar] [CrossRef]
  21. Chen, G.; Deng, Y.; Sarkar, A.; Wang, Z. An Integrated Assessment of Different Types of Environment-Friendly Technological Progress and Their Spatial Spillover Effects in the Chinese Agriculture Sector. Agriculture 2022, 12, 1043. [Google Scholar] [CrossRef]
  22. He, Y.; Chen, W. Evaluation of Sustainable Development Policy of Sichuan Citrus Industry in China Based on DEA-Malmquist Index and DID Model. Sustainability 2023, 15, 4260. [Google Scholar] [CrossRef]
  23. Xiang, Y.; Qi, C.J.; Wang, W.X. Research on factor substitution relationship and growth path of citrus production—An empirical analysis based on panel data of main production areas. J. China Agric. Univ. 2017, 22, 200–209. (In Chinese) [Google Scholar]
  24. Zhang, F.; Wu, L.; Wang, F.L. Research on the spatial correlation network structure and driving factors of agricultural total factor productivity in China. Res. Agric. Mod. 2020, 41, 587–598. (In Chinese) [Google Scholar]
  25. Tan, R.H.; Liu, H.M. Evolution of spatial correlation network characteristics and influencing factors of green total factor productivity in Chinese agriculture. Chin. J. Ecol. Agric. 2022, 30, 2011–2026. (In Chinese) [Google Scholar]
  26. Qu, H.; Yin, Y.; Li, J.; Xing, W.; Wang, W.; Zhou, C.; Hang, Y. Spatio-temporal Evolution of the Agricultural Eco-efficiency Network and Its Multidimensional Proximity Analysis in China. Chin. Geogr. Sci. 2022, 32, 724–744. [Google Scholar] [CrossRef]
  27. Sun, Z.R.; Fan, J.; Sun, Y. Characteristics of spatial correlation network structure and influencing factors of green technology innovation efficiency in China. Econ. Geogr. 2022, 42, 33–43. (In Chinese) [Google Scholar]
  28. Wang, F.; Wu, L.; Zhang, F. Network structure and influencing factors of agricultural science and technology innovation spatial correlation network—A study based on data from 30 provinces in China. Symmetry 2020, 12, 1773. [Google Scholar] [CrossRef]
  29. He, H.; Ding, R. Spatiotemporal heterogeneity effect of technological progress and agricultural centrality on agricultural carbon emissions in China. Front. Environ. Sci. 2023, 10, 1078357. [Google Scholar] [CrossRef]
  30. Christensen, L.R.; Jorgenson, D.W.; Lau, L.J. Transcendental logarithmic production frontiers. Rev. Econ. Stat. 1973, 55, 28–45. [Google Scholar] [CrossRef]
  31. Jiang, Q.J.; Wu, M.M. Analysis of the contribution rate of technological progress to China’s fishery economic growth—A study based on the beyond logarithmic production function method. China Fish. Econ. 2023, 41, 1–11. (In Chinese) [Google Scholar]
  32. Wang, X.H.; Yang, Y.Q.; Luo, X.Y.; Wen, T. Spatial correlation network and its mechanism for high-quality economic development in China. J. Geogr. 2022, 77, 1920–1936. (In Chinese) [Google Scholar]
  33. Wang, M.H.; Su, M.M. Network structure and influencing factors of livelihood capital of interprovincial residents in China. Econ. Geogr. 2022, 42, 36–44+94. (In Chinese) [Google Scholar]
  34. Shao, H.Q.; Wang, Z.F. Network structure of spatial correlation of habitat environment and its driving factors in city clusters in the middle reaches of the Yangtze River. Yangtze River Basin Resour. Environ. 2022, 31, 983–994. (In Chinese) [Google Scholar]
  35. Liu, H.J.; Liu, C.M.; Sun, Y.N. Research on the structural characteristics of spatial correlation network of energy consumption and its effects in China. China Ind. Econ. 2015, 5, 83–95. (In Chinese) [Google Scholar]
  36. Doreian, P.; Conti, N. Social context, spatial structure and social network structure. Soc. Netw. 2012, 34, 32–46. [Google Scholar] [CrossRef]
  37. Liu, J. Lectures on Whole Network Approach: A Practical Guide to UCINET; Truth & Wisdom Press: Beijing, China, 2009. [Google Scholar]
  38. Krackardt, D. QAP partialling as a test of spuriousness. Soc. Netw. 1987, 9, 171–186. [Google Scholar] [CrossRef]
  39. Jiang, S.Y.; Liu, Y.; Wang, M.M. Research on the dynamic evolution and regional differences of total factor productivity of cereals in China. Agric. Technol. Econ. 2016, 6, 13–20. (In Chinese) [Google Scholar]
  40. Cheng, C.Z.; Zeng, J.W.; Zhong, Y. Research progress on citrus yellow dragon disease. J. Hortic. 2013, 40, 1656–1668. (In Chinese) [Google Scholar]
Figure 1. Changes in TP in China’s mandarin and tangerine production from 2006 to 2021.
Agriculture 13 02118 g001
Figure 2. Spatial correlation network of the TP in China’s mandarin production.
Agriculture 13 02118 g002
Figure 3. Spatial correlation network of the TP in China’s tangerine production.
Agriculture 13 02118 g003
Figure 4. Overall network structure characteristics of the TP in China’s mandarin production from 2006 to 2021.
Agriculture 13 02118 g004
Figure 5. Overall network structure characteristics of the TP in China’s tangerine production from 2006 to 2021.
Agriculture 13 02118 g005
Table 1. Descriptive statistics of input and output variables.
VariableObserved
Value
UnitMinimum
Value
Maximum
Value
Average
Value
Standard
Deviation
OutputOutput of main products224kg498.564633.701834.93690.56
InputLabor prices224CNY/workday17.4685.1343.1215.38
Land prices224CNY/ha387.506642.201965.7869.18
Fertilizer prices224CNY/kg3.0443.215.663.06
Pesticide prices224CNY/kg16.371441.29273.51238.37
Other prices224100.00184.97147.0722.48
Table 2. Influencing factors and variables of spatial correlation network of citrus-production technology progress.
Influencing FactorsVariable CodeCalculation Methods and ExplanationsData Sources
Industrial structurestrValue added of primary sector/GDPDatabase of the National Bureau of Statistics
Informatization levelinfNumber of internet broadband access portsDatabase of the National Bureau of Statistics
Education leveleduEducational level of the rural labor forceChina Population and Employment Statistical Yearbook
Economic development levelecoGDP per capitaDatabase of the National Bureau of Statistics
Innovation supportinnScience and technology expenditure/Total fiscal expenditureDatabase of the National Bureau of Statistics
Financial supportfinExpenditure on agriculture, forestry, and water affairs/Total fiscal expenditureDatabase of the National Bureau of Statistics
Agricultural disaster ratedisArea damaged/Area affectedDatabase of the National Bureau of Statistics
Table 3. TP for the major mandarin- and tangerine-producing areas in China from 2006 to 2021.
ClassificationAreas200620092012201520182021Average Value
MandarinGuangdong12.57%14.76%12.77%16.75%15.26%21.96%15.99%
Fujian3.62%6.85%10.58%20.52%17.06%13.54%12.66%
Guangxi10.80%8.62%7.88%15.51%11.84%8.45%10.69%
Chongqing12.59%8.50%7.36%10.10%10.57%6.76%9.55%
Hubei18.72%8.97%6.64%4.87%6.48%8.98%8.15%
Jiangxi17.08%3.97%2.17%2.85%3.09%3.39%6.46%
Hunan10.33%3.57%1.64%6.26%3.03%3.82%4.20%
TangerineHunan29.61%20.98%16.79%6.78%14.18%8.32%15.22%
Zhejiang13.35%14.60%4.84%8.62%4.31%6.51%9.90%
Guangdong10.42%8.06%4.45%7.28%11.21%6.57%9.05%
Jiangxi14.77%9.09%5.14%12.94%6.99%5.56%8.59%
Fujian6.59%5.13%3.16%8.09%5.52%0.61%6.18%
Chongqing3.34%1.68%0.97%3.79%6.80%7.42%4.25%
Hubei6.61%6.72%5.38%4.00%−0.28%0.49%3.66%
Note: Due to space constraints, results for other years are not reported and are available from the authors upon request.
Table 4. Network centrality of China’s mandarin- and tangerine-production technology progress in 2021.
ClassificationAreasPoint Degree CentralityProximity
Centrality
Intermediary
Centrality
Degree of Point-OutDegree of Point-EntryDegree of Centrality
MandarinGuangdong2583.33385.71425.556
Guangxi1233.333601.333
Jiangxi325066.6671.333
Hubei4266.667753.556
Hunan335066.6671.333
Fujian3483.33385.71425.556
Chongqing2033.333601.333
TangerineGuangdong2250608.889
Jiangxi225066.6677.778
Zhejiang1583.33385.71448.889
Hubei1016.667500
Hunan135066.6677.778
Fujian305066.6672.222
Chongqing2033.333604.444
Table 5. Factors driving the spatial correlation network of citrus-production technology progress in China.
Influencing FactorsQAP Correlation AnalysisQAP Regression Analysis
Correlation
Coefficient
p-Value of
Significance
Coefficient of
Regression
p-Value of
Significance
Industrial structure0.2390.1840.3650.179
Informatization level0.467 *0.0850.614 *0.078
Educational level−0.460 ***0.002−0.877 ***0.004
Economic development0.932 ***0.0002.012 ***0.001
Innovation support0.612 **0.0191.137 **0.024
Financial support0.386 *0.0820.865 *0.081
Agricultural disaster rate0.1270.3330.3210.323
Note: R2 = 0.989; Adj R2 = 0.983; “*”, “**”, and “***” indicate statistical significance at the 10%, 5%, and 1% levels, respectively.
Disclaimer/Publisher’s Note: The statements, opinions and data contained in all publications are solely those of the individual author(s) and contributor(s) and not of MDPI and/or the editor(s). MDPI and/or the editor(s) disclaim responsibility for any injury to people or property resulting from any ideas, methods, instructions or products referred to in the content.

