Article

Effects of Inoculation with Plant Growth-Promoting Rhizobacteria on Chemical Composition of the Substrate and Nutrient Content in Strawberry Plants Growing in Different Water Conditions

1
Department of Horticulture, Faculty of Environmental Management and Agriculture, West Pomeranian University of Technology in Szczecin, Słowackiego 17, 71-434 Szczecin, Poland
2
Department of Environmental Management, Faculty of Environmental Management and Agriculture, West Pomeranian University of Technology in Szczecin, Słowackiego 17, 71-434 Szczecin, Poland
3
Institute of Marine and Environmental Sciences, University of Szczecin, Wąska 13, 71-415 Szczecin, Poland
4
Polish Society of Bioinformatics and Data Science BIODATA, Popiełuszki 4c, 71-214 Szczecin, Poland
5
Department of Bioengineering, Faculty of Environmental Management and Agriculture, West Pomeranian University of Technology in Szczecin, Słowackiego 17, 71-434 Szczecin, Poland
6
Department of Microbiology and Rhizosphere, The National Institute of Horticultural Research, Konstytucji 3 Maja 1/3, 96-100 Skierniewice, Poland
*
Author to whom correspondence should be addressed.
Agriculture 2024, 14(1), 46; https://doi.org/10.3390/agriculture14010046
Submission received: 24 November 2023 / Revised: 19 December 2023 / Accepted: 26 December 2023 / Published: 26 December 2023

Abstract

:
Drought presents a critical challenge to global crop production, exacerbated by the effects of global warming. This study explores the role of rhizospheric bacteria (Bacillus, Pantoea, and Pseudomonas) in enhancing the drought resistance and nutrient absorption of strawberry plants. The experimental approach involved inoculating plant roots with various strains of rhizobacteria and assessing their impact under different water potential conditions in two substrates: optimal moisture and water deficit. The results showed significant changes in the nutrient content of strawberry plants, influenced by the type of bacterial strain and moisture conditions. Phosphorus and potassium content in the leaves varied considerably, with the highest levels observed in plants inoculated with specific bacterial strains under both optimal and water-deficit conditions. Similarly, calcium and magnesium content in the leaves also changed notably, depending on the bacterial strain and moisture level. The water deficit cluster, featuring the PJ1.1, DKB63, and DKB65 strains, showed PGPR’s role in maintaining nutrient availability and plant resilience. The study demonstrates that inoculation with PGPR can markedly influence the nutrient profile of strawberry plants. These findings underscore the potential of using rhizobacteria to enhance crop resilience and nutritional status, especially in the context of increasing drought conditions due to climate change.

1. Introduction

Plants experience many environmental stresses that can affect their vital functions at every stage of development. Such stressors include, for example, salinity, drought, excessively high or low temperatures, and contamination with toxic compounds because of natural or anthropogenic activities [1].
Drought is an example of acute abiotic stress that plants suffer over their lifetime due to insufficient water supply. This stress negatively affects the physiological, morphological, and biochemical characteristics of plants, and limits the quantity and quality of yields [2]. It is estimated that by 2052, about half of cultivated areas will be severely affected by drought, which will significantly affect plant growth and development [3].
One of the plants of temperate climate, of global importance, being at the same time especially sensitive to high levels of drought stresses due to its herbaceous nature and shallow root system [4], is the strawberry (Fragaria × ananassa Duch.) This is the most popular berry plant, grown worldwide and extremely profitable from an economic point of view. Among strawberry producers, Poland ranks 9th in the world and 2nd in the European Union with 185.4 thousand tonnes in 2022 [5]. It is highly regarded for the health, quality, and taste benefits of fruits [6,7]. Many authors have shown that both the leaves and fruits of strawberries possess a rich chemical profile, including readily absorbable sugars, dietary fibers, vitamins (especially vitamin C), and a range of bioactive compounds with antioxidant properties [8,9,10,11]. A prospective option for improving plant growth and drought tolerance is the application of plant growth-promoting rhizobacteria (PGPR) as inocules. Over the last decade, the use of such microorganisms has repeatedly been shown to increase plant tolerance to environmental stresses [12]. Consequently, employing these bacteria presents an efficient and economical method to bolster food security under drought conditions [13].
PGPR has been proven to be an environmentally friendly way to increase yields by promoting plant growth and development through various direct and indirect mechanisms. These mechanisms encompass soil nutrient mobilization through nitrogen fixation, facilitating nutrient solubilization for easier plant absorption, regulating plant hormones, and providing biological control, including the induction of resistance against plant pathogens [14,15]. Mineral nutrients play a crucial role in plant growth and differentiation throughout all developmental stages. The water deficit reduces the absorption, extraction, and redistribution of nutrients [16,17].
Biofertilization and phytostimulation are two direct mechanisms in which PGPR increases soil fertility by binding atmospheric nitrogen, dissolving inaccessible nutrients (such as phosphates, zinc, potassium, and iron), and synthesizing phytohormones. Nutrient uptake by plants is enhanced by siderophores, and phytohormone production assists in the sequestration of microelements [18,19,20].
Although phosphorus (P) is present in large quantities in agricultural soils, a significant proportion (30–65%) is present in insoluble organic form. To compensate for this, a significant amount of phosphorus is often added to soils in the form of fertilizers. Phosphate-solubilizing bacteria, including species from the genera Pseudomonas, Alcaligenes, Bacillus, Corynebacterium, and others, are capable of transforming these non-absorbable forms into ones that plants can readily uptake [21]. The bacteria use one of two mechanisms: acidification of the external environment by releasing low molecular weight organic acids, which causes chelation of cations bound to phosphates, or production of phosphatases/phytases that hydrolyze organic forms of phosphorus compounds [22]. In soils experiencing drought stress, the mobility of phosphorus is diminished as it predominantly moves through diffusion. Thus, adequate soil moisture is a critical factor in enhancing the mobility and uptake of this nutrient [23,24].
Potassium (K) plays a key role in water relations, osmotic regulation, and the movements of the stomatal apparatus, so in the end—the resistance of plants to drought. Plants reported reduced K+ content under water stress, mainly due to membrane changes and ion imbalance [25]. Plants with low K+ concentrations are less tolerant to water deficiency [26]. Rhizospheric microorganisms, especially bacteria—potassium-solubilizing microorganisms (KSM), have the potential to solubilize potassium, for easy uptake by the plant [27]. Among others, K-solubilizing rhizobacteria include Bacillus, Agrobacterium, Burkholderia, Enterobacter, Myroides, Pseudomonas, and Pantoea [28,29]. Some bacteria, by improving the bioavailability of this element, caused an increase in the potassium content in plants [30].
Many experiments have indicated that drought stress inhibits active transports of Mg2+, Ca2+, and K+ ions by changing the membrane permeability and limiting the absorption of these nutrients by roots [31]. Water stress results not only in a deficiency of macronutrients but also in some micronutrients (Zn, Cu, Fe Mn, and B) [32], more soluble and available for plants in conditions of optimal soil moisture. PGPR can increase their mobility and availability through the production of siderophores [33,34]. Considering the above aspects, our studies were carried out to identify such strains of rhizospheric bacteria that, while improving the plant’s resistance to drought, allow them to increase the absorption of nutrients necessary for the growth and development of strawberry plants.

2. Materials and Methods

2.1. Location of the Experiment and Plant Material and Growth Conditions Employed

The research was conducted in a greenhouse at the Department of Horticulture of West Pomeranian University of Technology in Szczecin (Poland). The study was conducted as a detailed two-factor experiment using a completely randomized design, which included four replicates. This experiment focused on assessing the effects of plant growth-promoting rhizobacteria (PGPR) and different moisture levels of the growth substrate on the macro- and micro-nutrient levels in the leaves of the ‘Polka’ strawberry.
The experiment began on 5 October 2020 and the plants were grown until 20 April 2021 at 17–20 °C (under natural day/night conditions). The strawberry plantlets were cultivated in a peat substrate (Substral Osmocote, Evergreen Garden Care Poland Sp. z o.o., Warsaw, Poland) mixed with perlite (in a ratio 15:1) in black PVC pots with a diameter of 19 cm (capacity of 3.0 dm3). The substrate was enriched with a 2 g mixture of Osmocote NPK 15-09-09 and Plant Starter NPK 10-52-10 fertilizer (Evergreen Garden Care Poland Sp. z o.o., Warsaw, Poland), no additional fertilization was used in the vegetative growth phase.

2.2. Experimental Factors

The first experimental factor was the inoculation of plant roots with rhizospheric bacteria. Among the tested strains of bacteria in this study, Pantoea sp. DKB64, P. sp. DKB65, P. sp. DKB70, P. sp. DKB63, P. sp. DKB68, and Pseudomonas sp. PJ1.1. showed the ability to convert insoluble inorganic phosphorus compounds, such as tricalcium phosphate, to bioavailable forms. Some Bacillus strains such as B. sp. DLGB2, B. sp. DLGB3, B. sp. DKB26, B. sp. DKB58, B. sp. DKB84, and Pseudomonas sp. PJ1.1. showed very promising to produce siderophores, and iron chelating compounds, thus increasing its availability. Detailed characteristics of the bacterial strains used in the experiment were described in our earlier studies [35]. The inoculum was applied, in the amount of 40 cm3/plant and minimum bacterial density of 107 CFU/g, to the substrate near the root system of strawberry plantlets. The inoculation was applied seven weeks after planting the plants.
The following variants of the first factor were applied: plants not inoculated with rhizospheric bacteria (variant CO), application of solution that was used to prepare a bacterial suspension—10 mM MgSO4 without bacteria in the amount of 40 cm3/plant (variant CMg), inoculation with Bacillus sp. strains: DLGB2 (variant DLGB2), DLGB3 (variant DLGB3), DKB26 (variant DKB26), DKB58 (variant DKB58), DKB84 (variant DKB84), inoculation with Pantoea sp. strains: DKB63 (variant DKB63), DKB64 (variant DKB64), DKB65 (variant DKB65), DKB68 (variant DKB68), DKB70 (variant DKB70), and inoculation with Pseudomonas sp. strain P.J1.1 (variant P.J1.1). Bacillus sp. and Pantoea sp. strains were isolated from the sandy soil of the United Arab Emirates, near Dubai. The soil is light yellow in colour, very low in organic matter content, and has low water holding and run-off capacity, high infiltration, and extremely low fertility. The isolated microorganisms from sandy, non-fertile soil are adapted to water shortage, and drought stress and tolerant to salinity and acidity. The applied beneficial microorganisms can survive in dry environments due to their biochemical properties in enhancing the phosphorus content under water deficit conditions and their potential to mitigate the impacts of environmental stressors. Pseudomonas sp. strain was isolated from the rhizosphere of wheat grown in Poland, Western Pomerania. The soil was medium-heavy with an average organic matter content.
The second experimental factor was the different levels of water potential in the substrate. The water potential was maintained at −10 to −15 kPa under optimal soil moisture (control water potential, variant CWP), and at −40 to −45 kPa under conditions of water deficit in the substrate (deficit water potential, variant DWP). Each pot was watered using individual drippers when the water potential in the substrate increased above −15 kPa under optimal conditions or above −45 kPa under water deficit conditions. Irrigation was carried out to a value of −10 kPa in the control variant and to −40 kPa under water deficit conditions. The water potential in the substrate was determined using contact soil tensiometers.

2.3. Measurement Methods

Samples of the substrate and strawberry leaves were collected on April 20, at the end of the experiment.
The peat substrate samples were dried to an air-dry state and then ground. In the substrate, the samples were determined percentage loss on ignition (LOI) of soil material at 550 °C, taken as content of organic matter (CWP), in accordance with PN-EN 15935:2022-01 standard [36], by weight method in three repetitions for each sample. The pH in H2O and pH in potassium chloride solution with a concentration of 1 mol·dm−3 (pH in KCl) were determined by potentiometric method in accordance with PN-EN ISO 10390:2022-09 standard [37] using an Orion Star A 211 pH meter. Electrical conductivity (EC), taken as salinity, in accordance with the PN-ISO 11265:1997 standard [38] was determined using the Orion 3Star conductivity meter.
The content of available plant forms of elements (K, Mg, Fe, Mn, Zn, and Cu) was determined using an IC 3000 Thermo Scientific Series AAS Spectrophotometer (Waltham, MA, USA). The content of Mg, Fe, Mn, Zn, and Cu was determined by the AAS method and the content of available forms of K by the AES method. The content of available forms of P was determined by the vanadium–molybdenum method (using Metertech UV-WIS SP 8001 Spectrophotometer, Nangang, Taipei, Taiwan). The elements were extracted using 0.5 mol HCl·dm−3 in accordance with the PN-R-04024:1997 standard [39].
The plant samples (leaves of strawberries), after drying to an air-dry state, were ground and hot mineralized. Samples of 1 g of plant material were mineralized with the addition of 10 mL of a mixture of concentrated nitric and perchloric acids (in 3:1 ratio). The total content of P was determined using a spectrophotometer by the vanadium-molybdenum method. The total content of K and Na in the leaves of strawberries was determined by the ESA method, and the total Fe, Mn, Mg, Ca, Zn, and Cu were determined by the ASA method.

2.4. Statistical Methods

Data analysis commenced with the computation of descriptive statistics for a suite of soil parameters, utilizing the Python programming language (Python Software Foundation, version 3.9). The mean values and standard deviations were calculated to provide insights into the central tendencies and dispersion of data, respectively. Data distribution was assessed via histograms, and potential outliers were identified through box plots, created using the Matplotlib library (version 3.8.2.) [40] and Seaborn library (version 0.13.0) [41], which are powerful tools for generating a wide range of static, animated, and interactive visualizations in Python.
An analysis of variance (ANOVA) was conducted to detect significant differences across soil moisture variants and combinations. This analysis was performed using the stats module from the SciPy library [42], a Python-based ecosystem of open-source software for mathematics, science, and engineering. Subsequent post hoc pairwise comparisons were facilitated by Tukey’s honest significant difference (HSD) test, implemented via the StatsModels (version 0.14.1) library [43], which is designed for estimating and testing statistical models.
Eta squared (η2η2) values were calculated to quantify the magnitude of the observed differences, using functionalities provided by the NumPy (version 1.23.1) library [44], which adds support for large, multi-dimensional arrays and matrices, along with a collection of mathematical functions to operate on these arrays.
Hierarchical clustering was performed with Ward’s method, using the linkage and cluster functions from the SciPy library, which provides algorithms for hierarchical and agglomerative clustering. The results were visualized in a dendrogram using the Matplotlib library, elucidating the clustering structure of the dataset.
For outlier detection, interquartile range (IQR) criteria and Z-scores were used, employing methods from the NumPy and SciPy libraries. The identification and handling of outliers were integral to maintaining the integrity and robustness of our analysis.

3. Results

3.1. Physicochemical Parameters of the Substrate

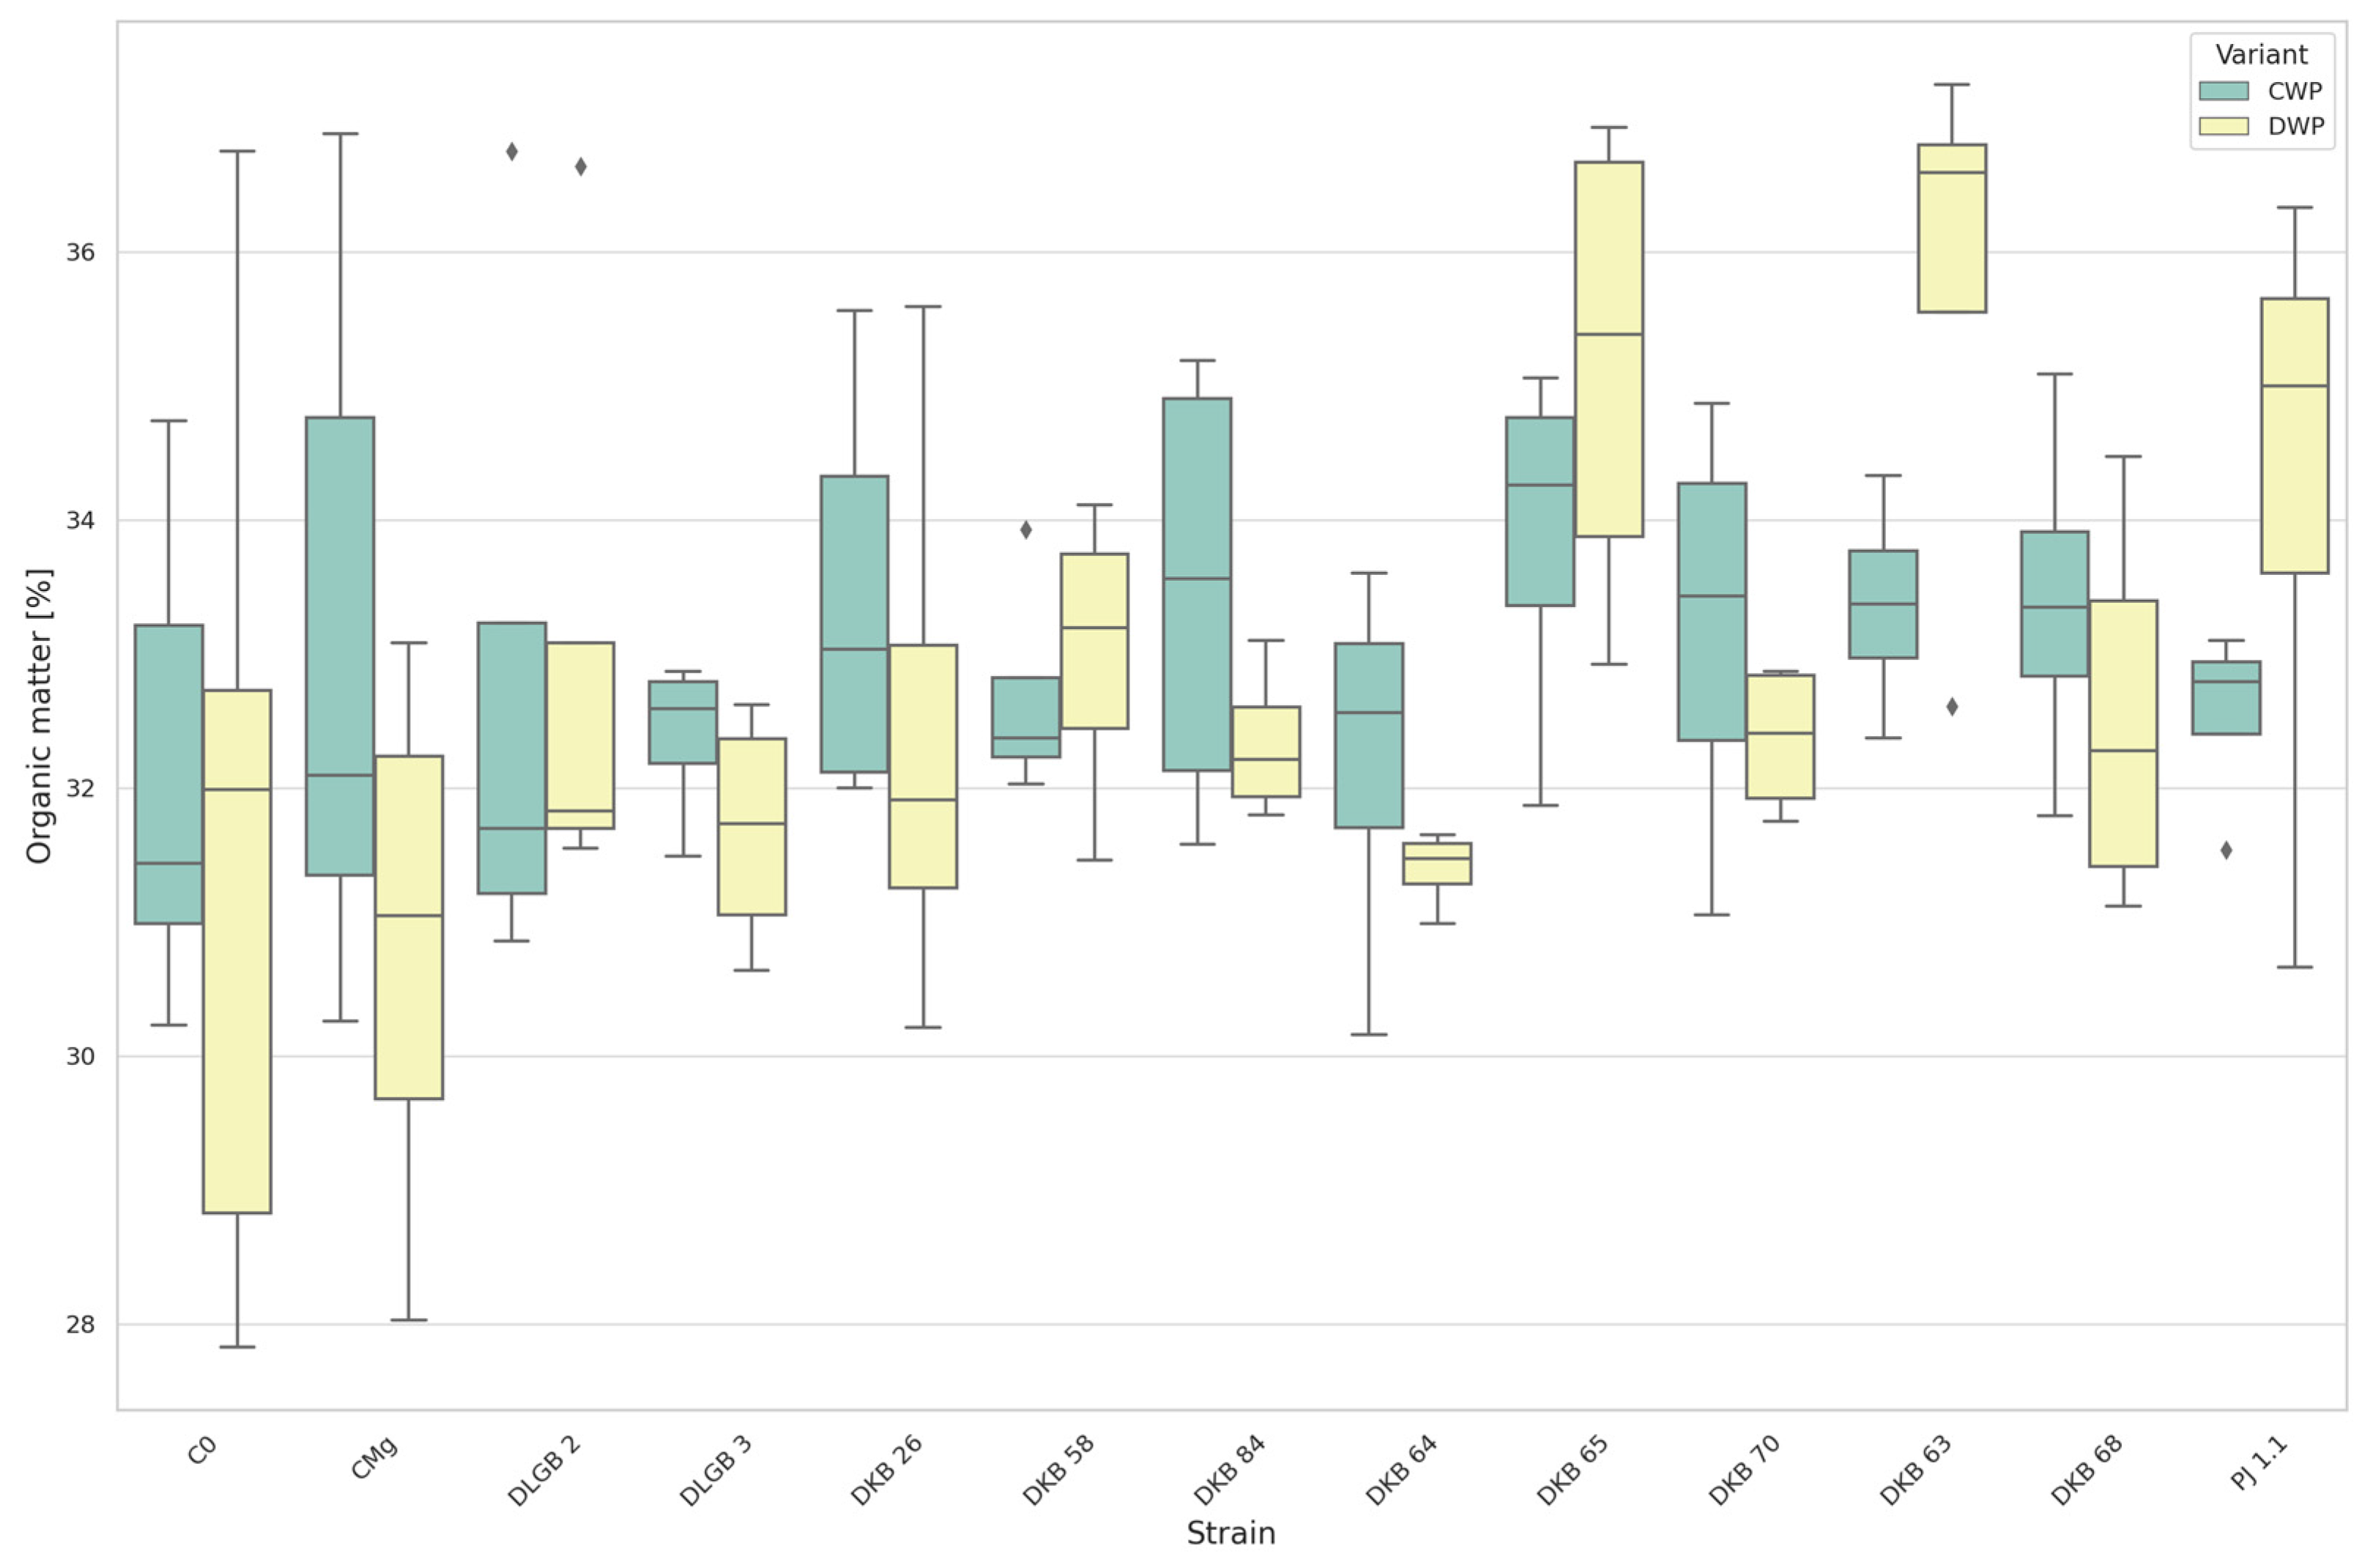
3.1.1. The Content of Organic Matter in Substrate

For the organic matter content, the mean value in optimal moisture conditions (CWP) was 32.87% with SD 1.62 and CV 4.92%, while under the water deficiency conditions (DWP), the mean value was recorded at 32.56% with SD 2.23 and CV 6.85%. The maximum value was observed in CWP for the CMg variant and DWP at inoculation with the DKB63 strain. The minimum value was observed in CWP for the DKB64 strain and DWP in the C0 variant (Figure 1).

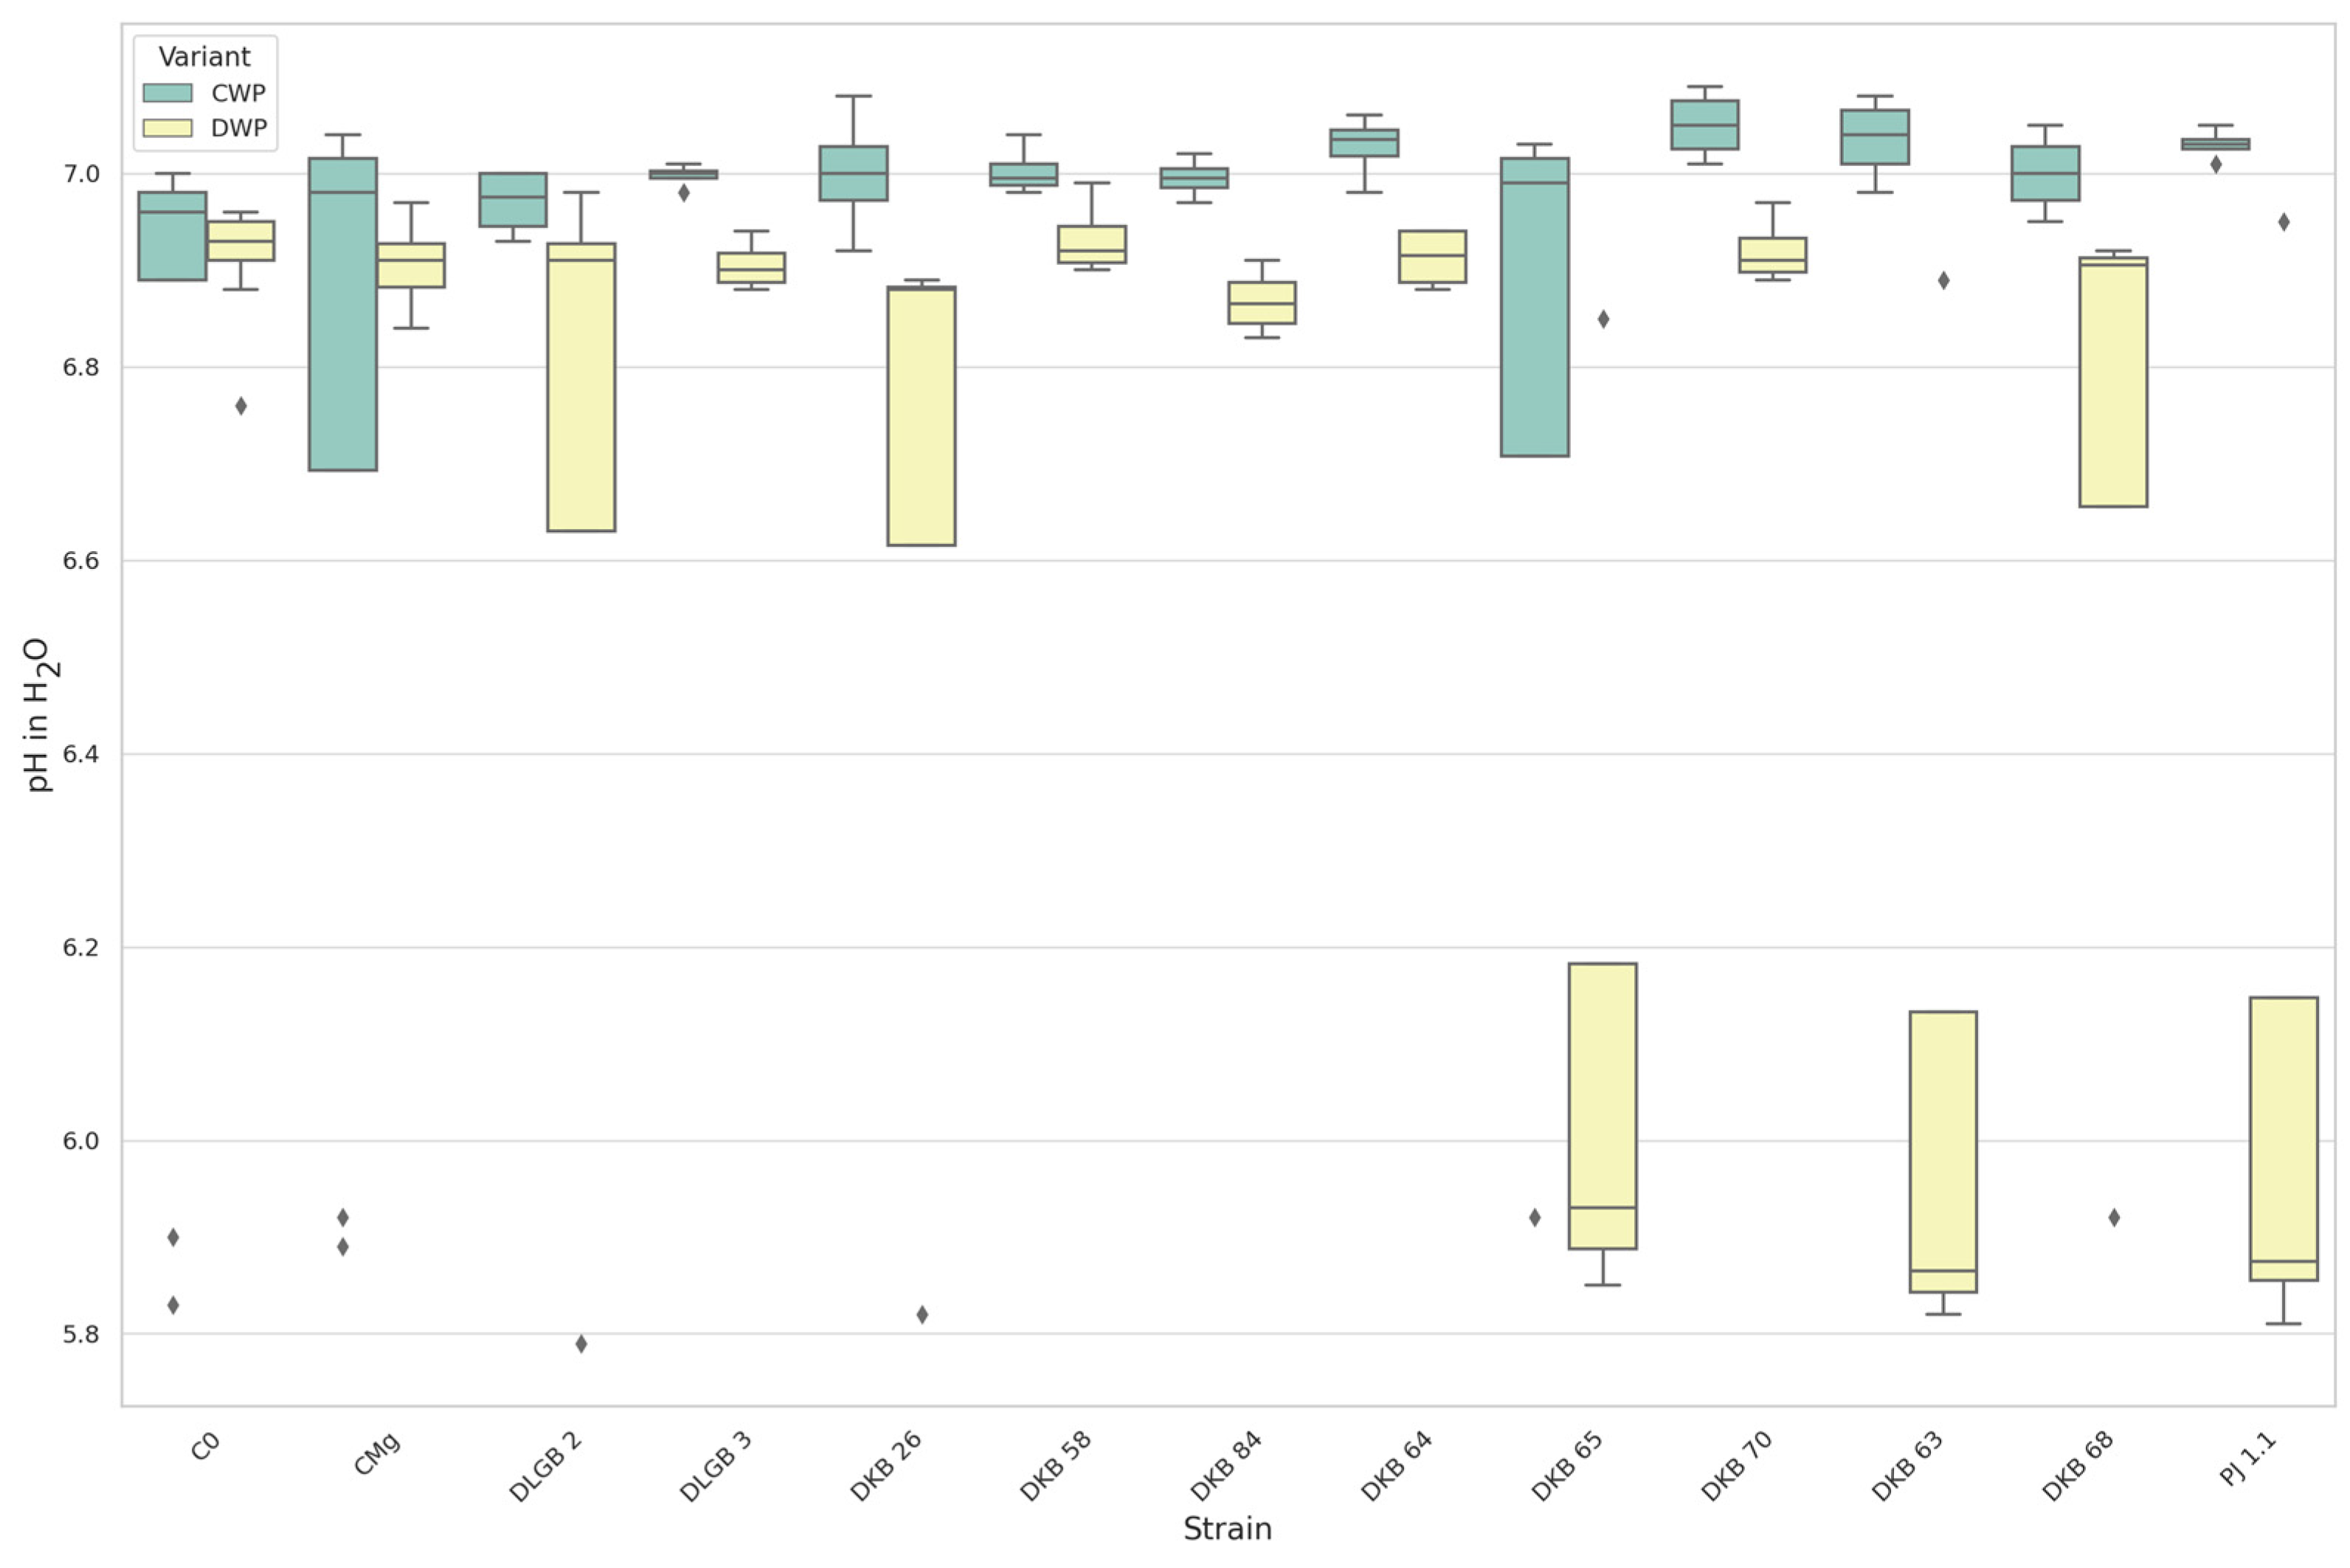
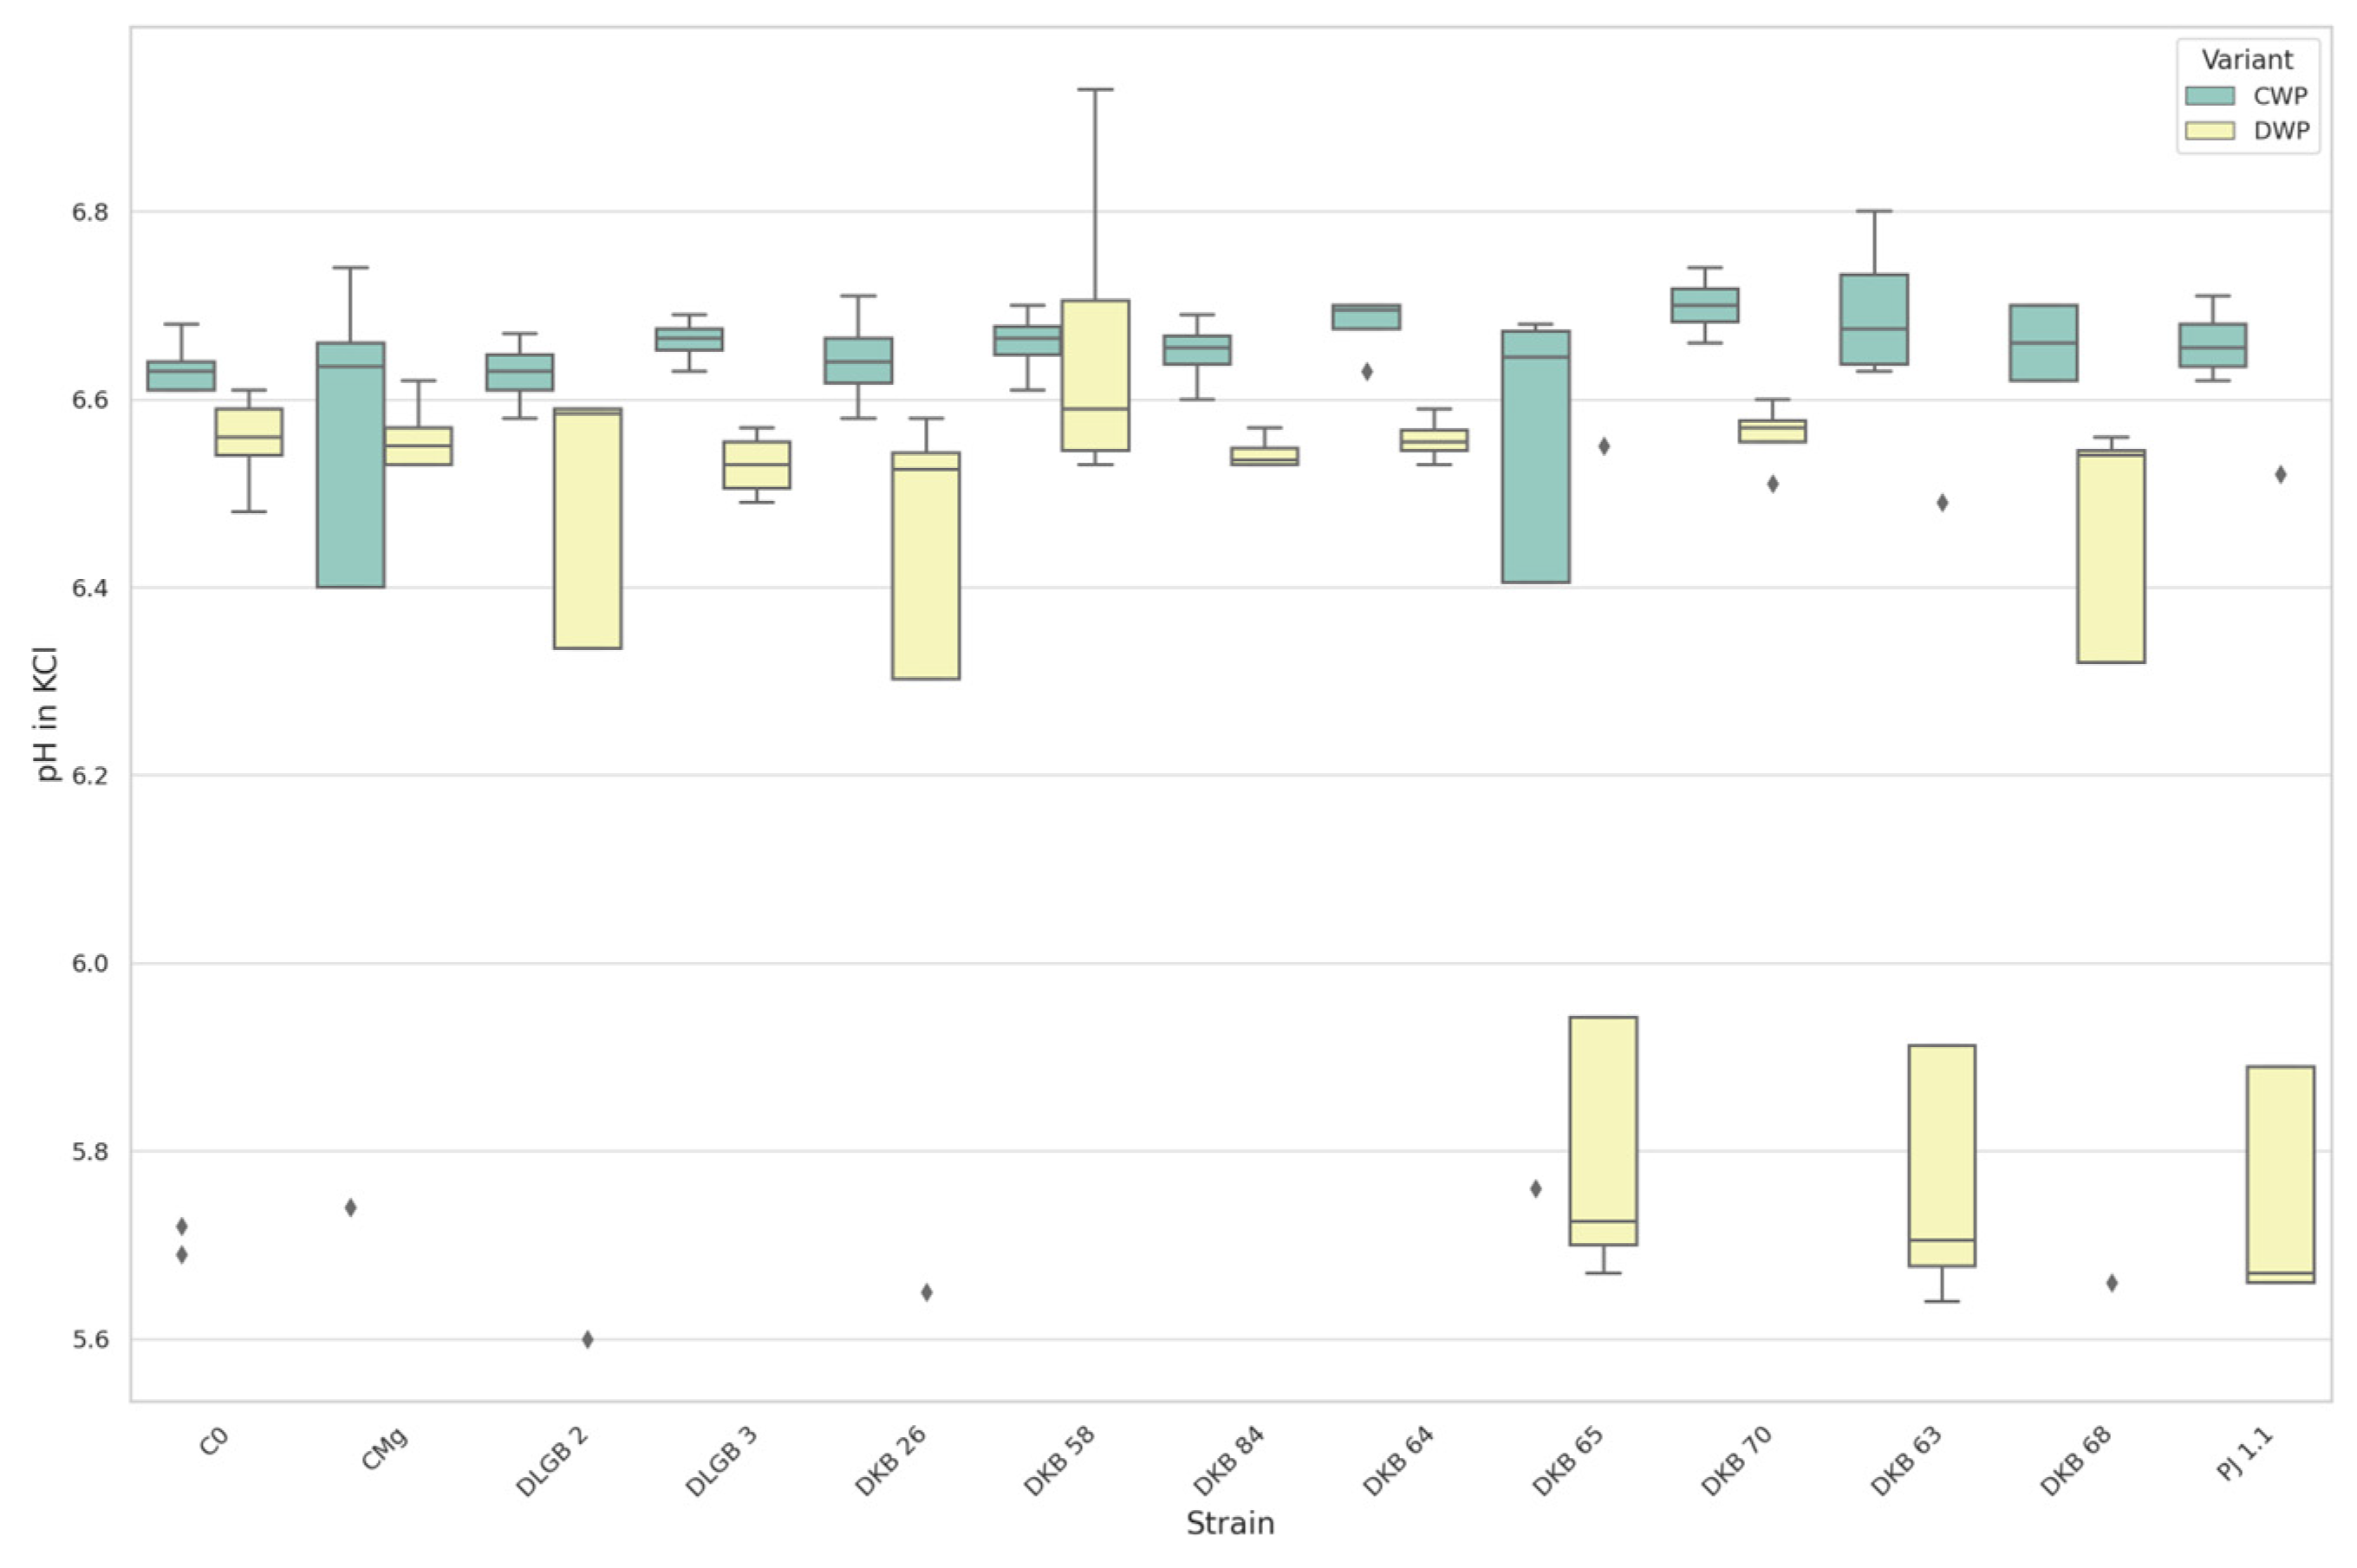
3.1.2. The pH of the Substrate

The pHH2O mean value in the optimal moisture conditions of substrate (CWP) was 6.91 with SD 0.31 and CV 4.48%. In the water deficit conditions (DWP), we observed 6.70 with SD 0.42 and CV 6.28%. The maximum value was observed in CWP after inoculation with the DKB70 strain and for DWP at the DKB58 strain. The minimum value was observed in CWP for the C0 variant, and DWP at inoculation with DLGB2 strain (Figure 2, Table 1).
For pH in KCl, the mean value in the optimal moisture conditions of the substrate (CWP) was 6.58 with SD 0.26 and CV 3.96%. The maximum value was observed in CWP after inoculation with the DKB63 strain, and the minimum value was observed in CWP for the C0 variant. In the water deficit conditions (DWP), we observed a mean value of 6.39 with SD 0.36 and CV 5.65%. The maximum value was observed in DWP after inoculation with the DKB58 strain, and the minimum value was observed in DWP for the DLGB2 variant (Figure 3, Table 1).

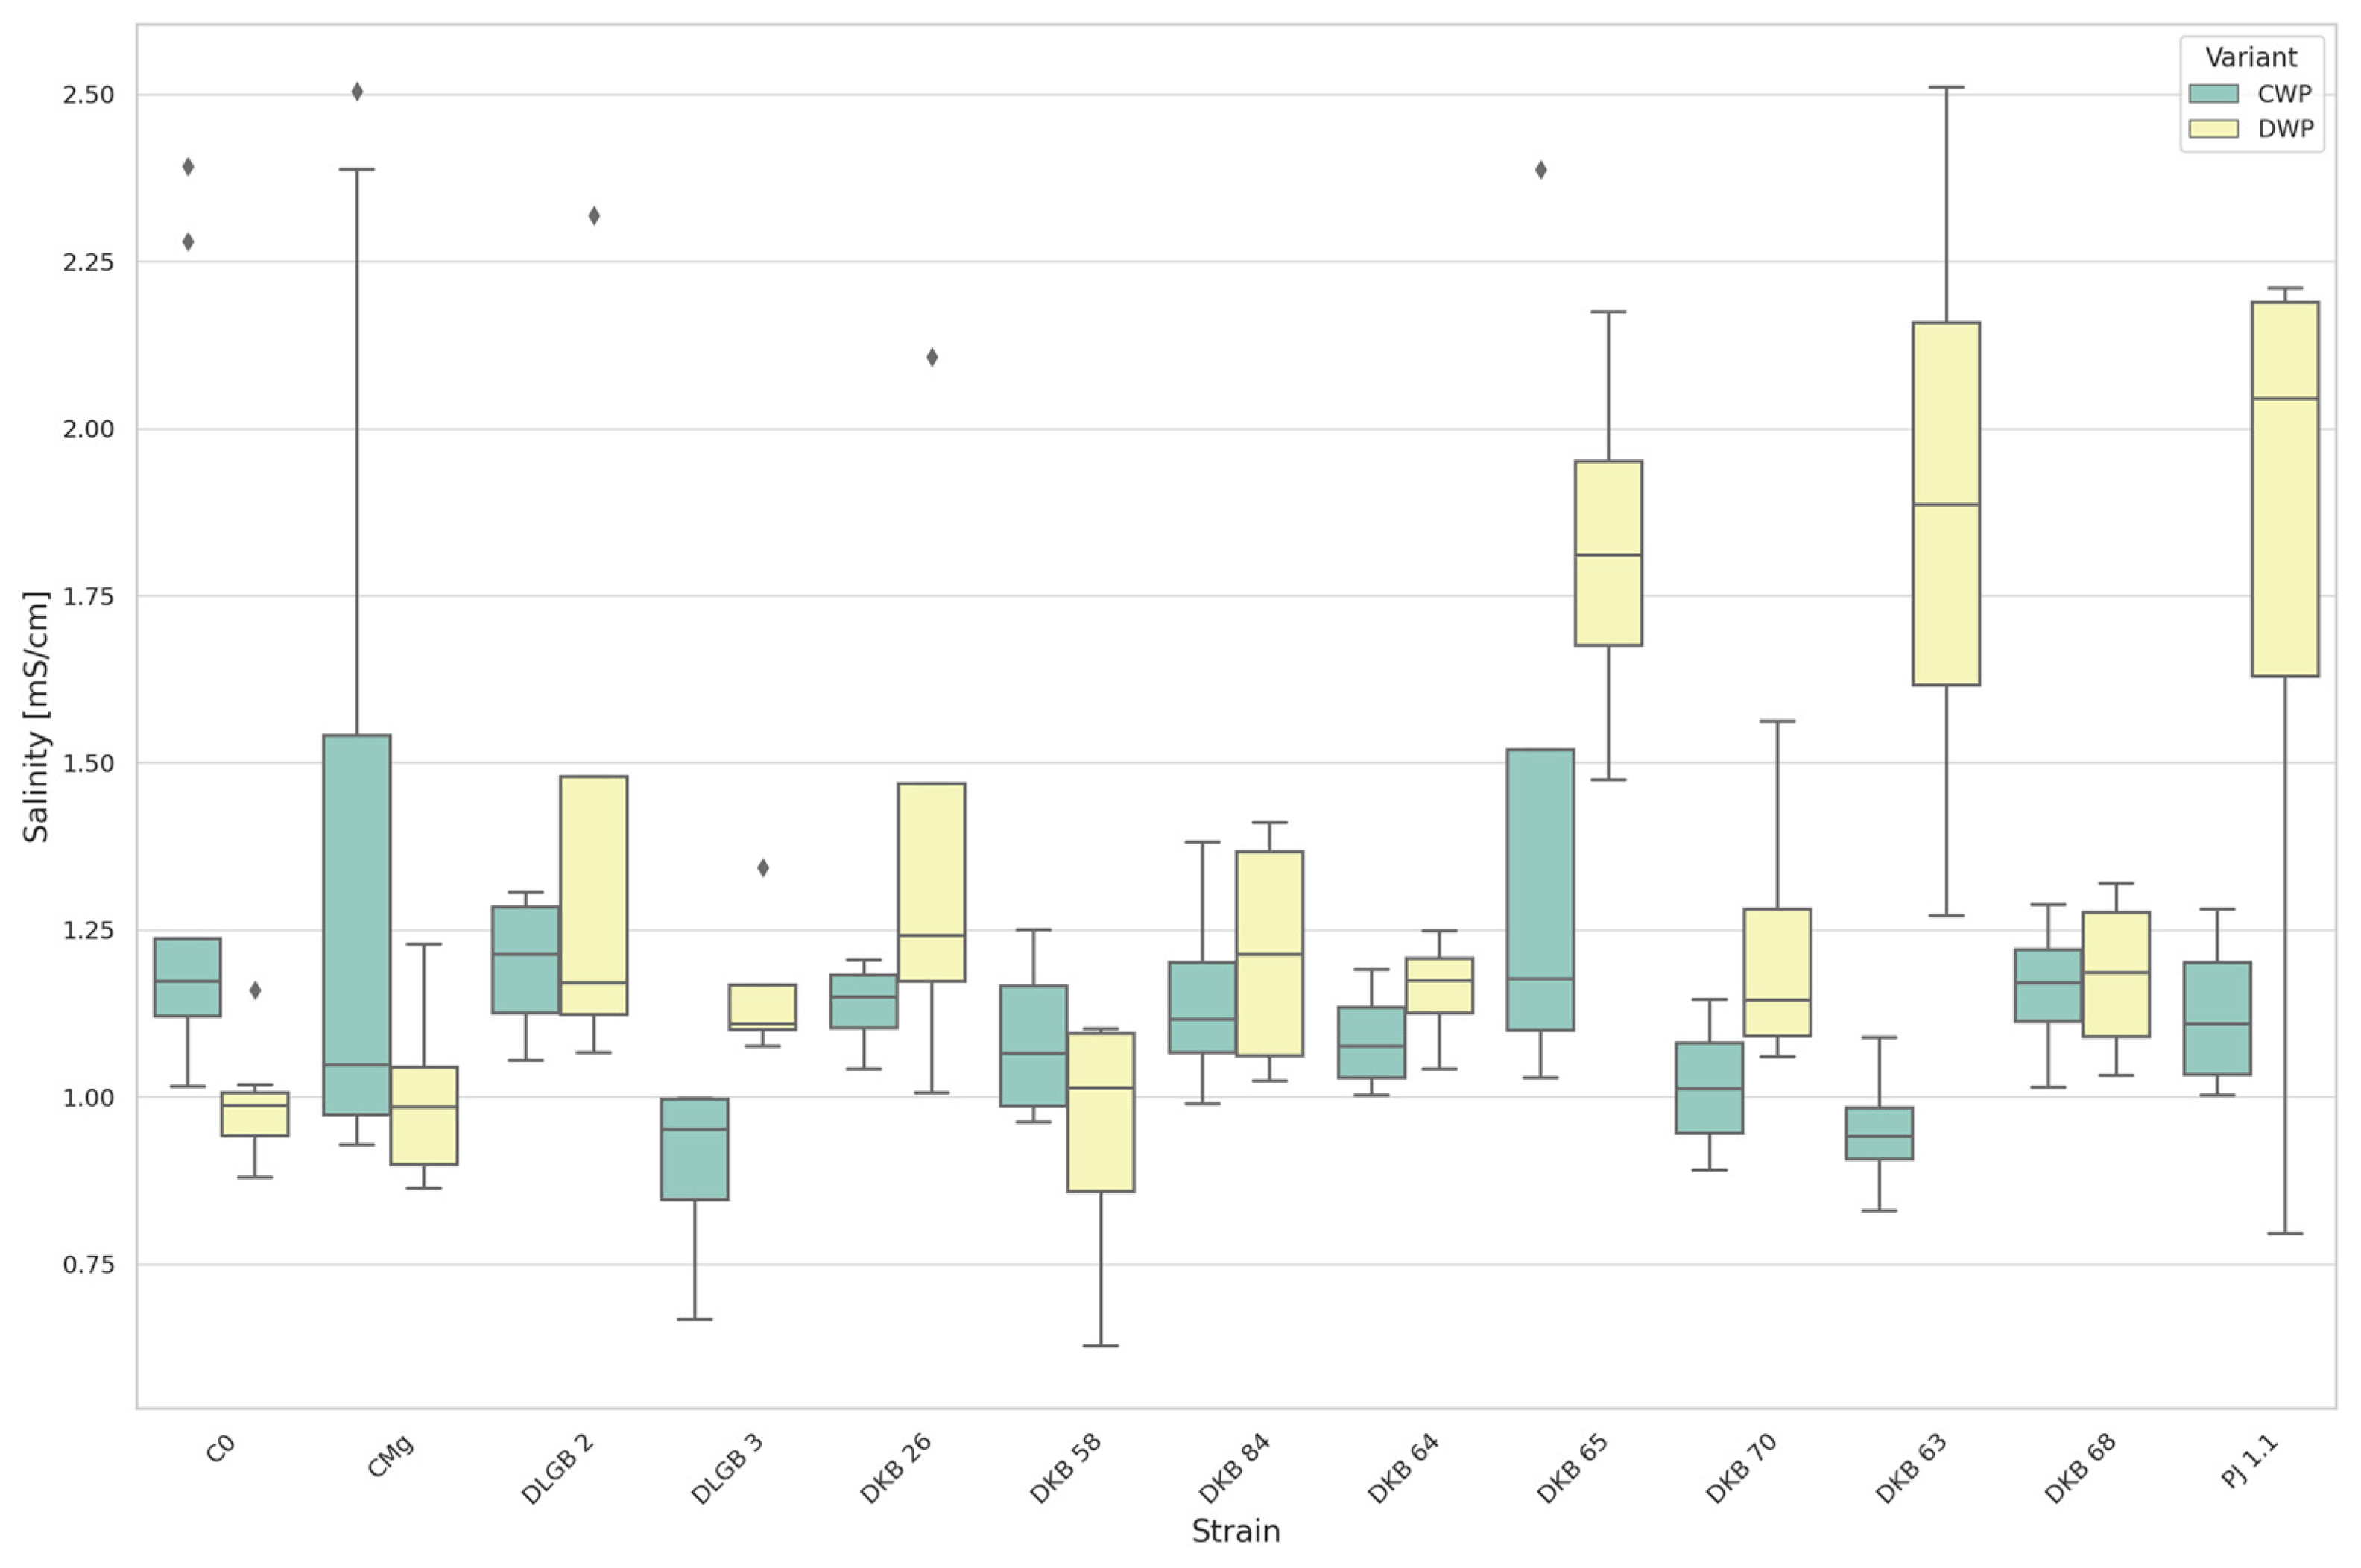
3.1.3. The Salinity of Substrate

The substrate salinity mean value in the optimal moisture conditions (CWP) was 1.19 mS∙cm−1 with SD 0.38 and CV 32.2%. In the water deficit conditions (DWP), we recorded a mean of 1.27 mS∙cm−1 with SD 0.42 and CV 33.2%. The maximum value was observed in CWP for the CMg variant, and DWP after inoculation with DKB63 strain. The minimum value was observed in CWP at the DLGB3 strain, and for DWP when inoculated with the DKB58 strain (Figure 4, Table 1).

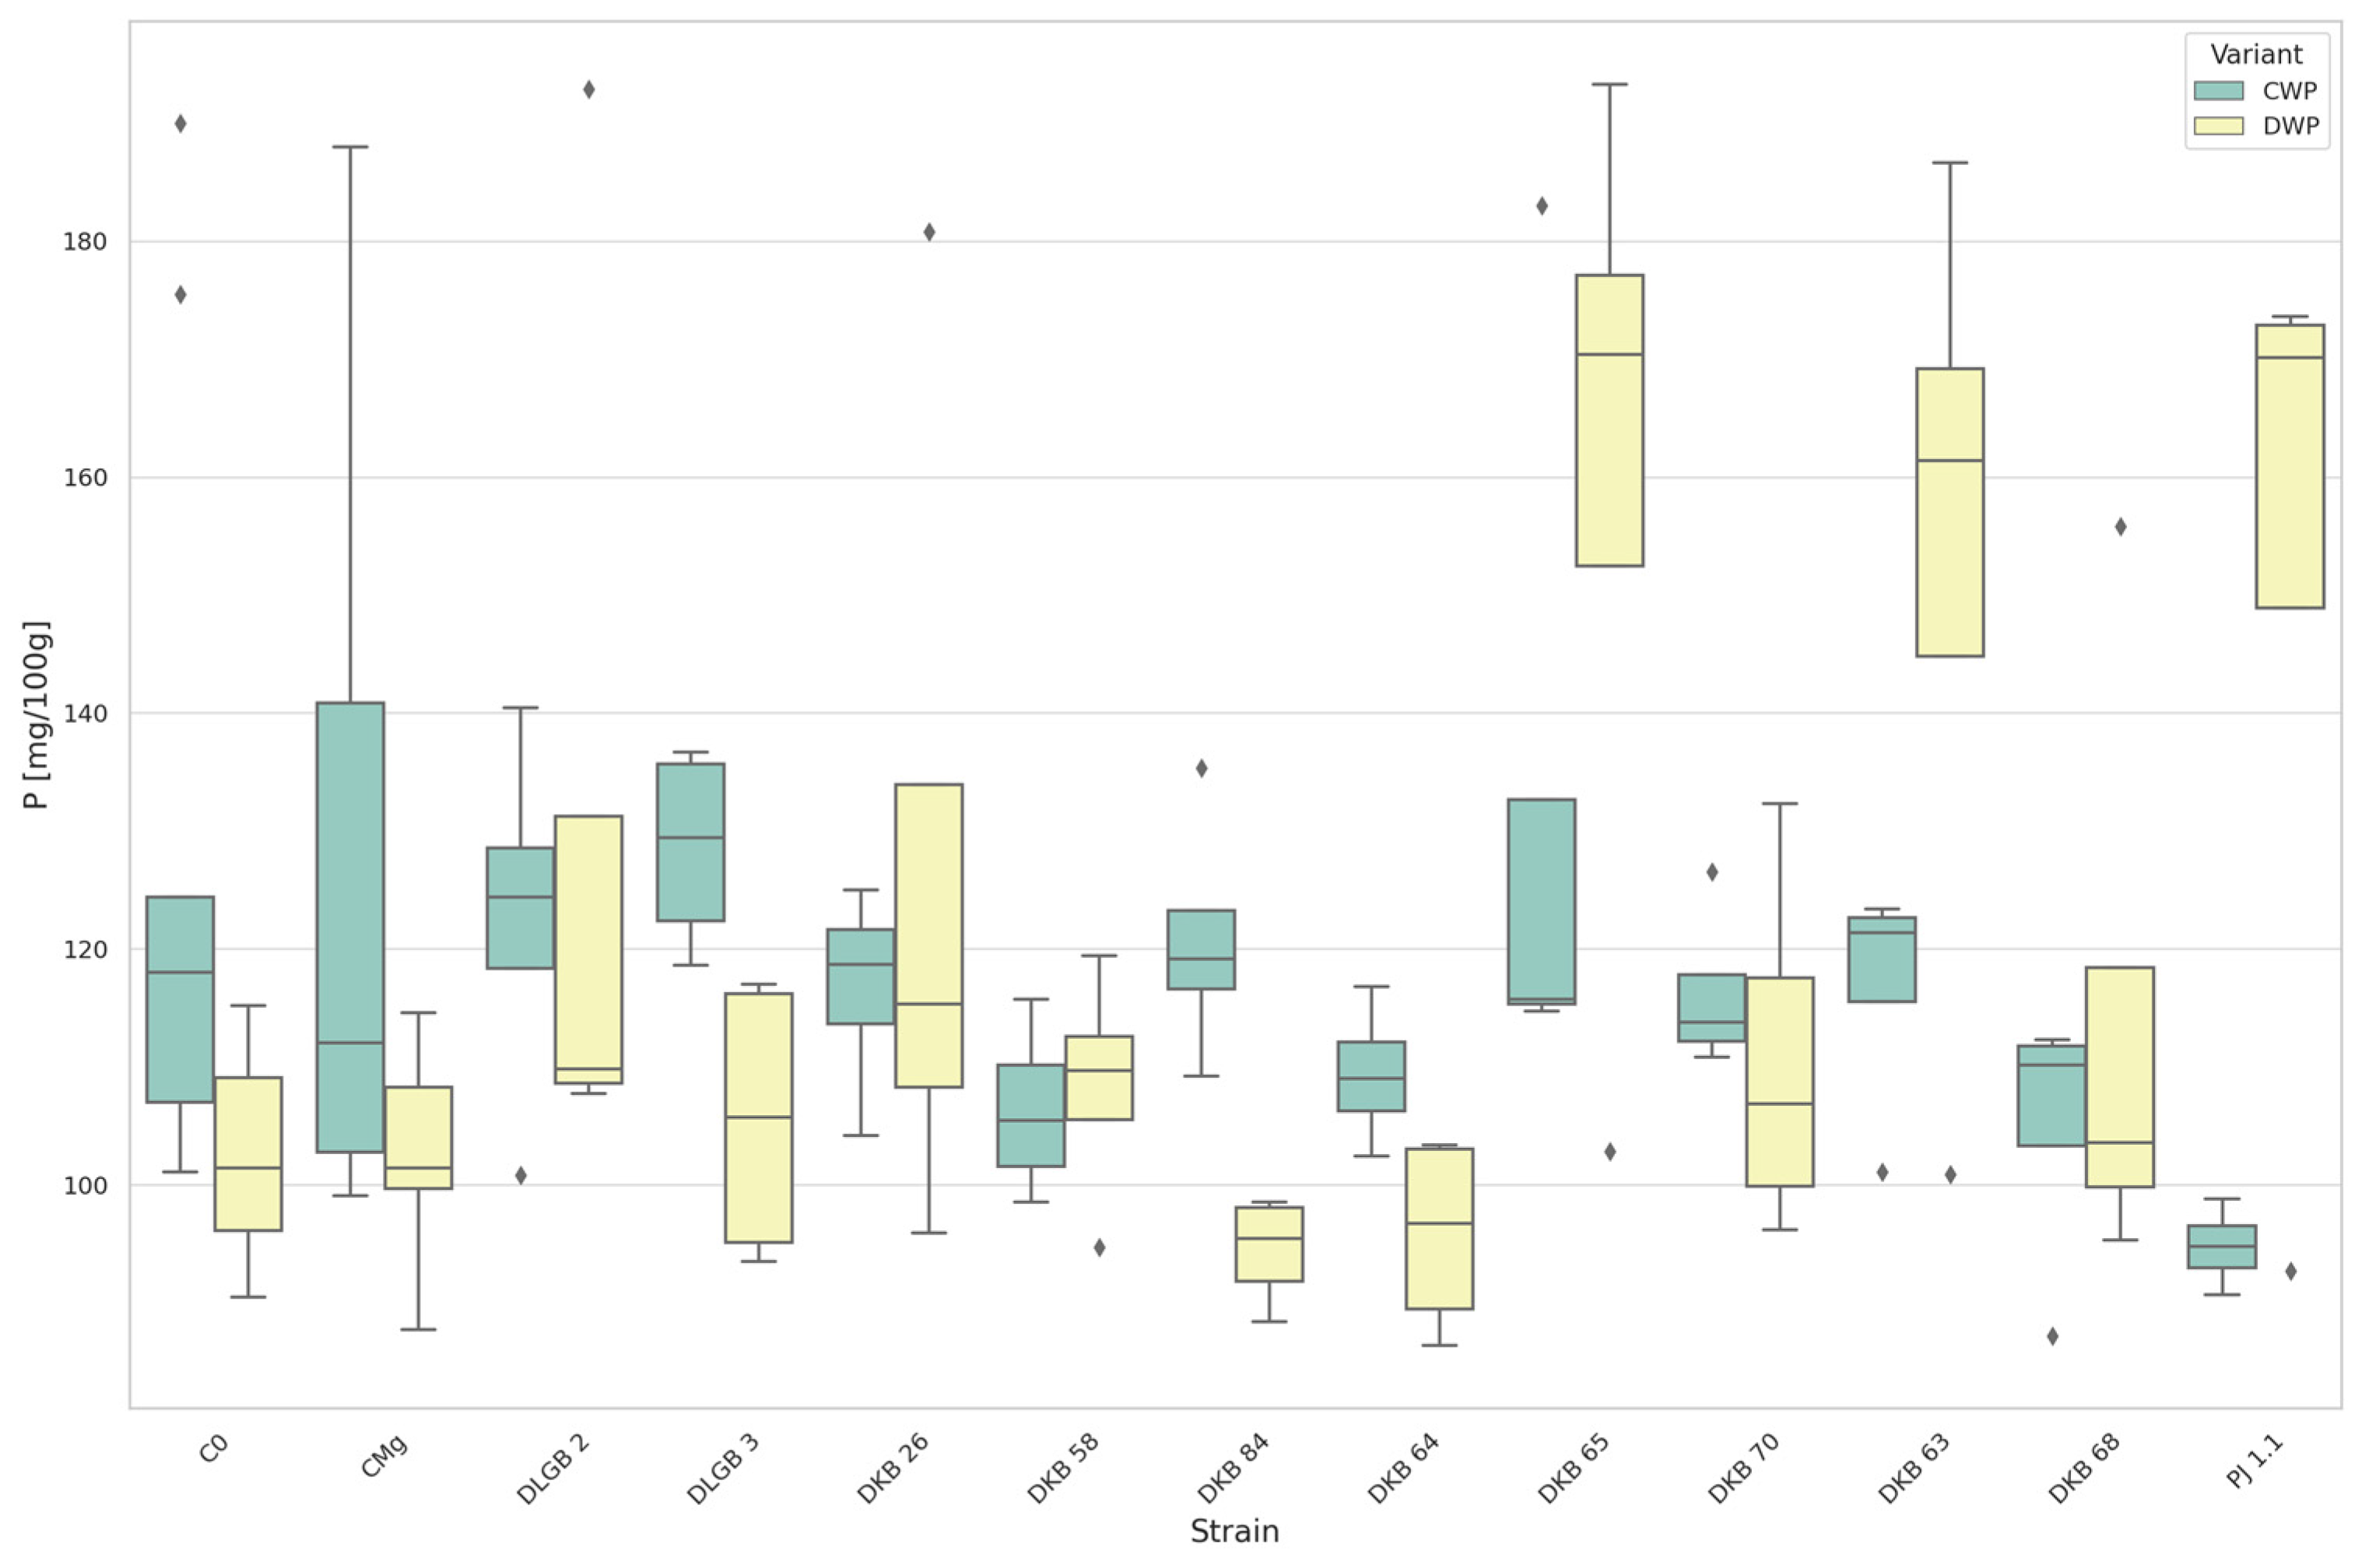
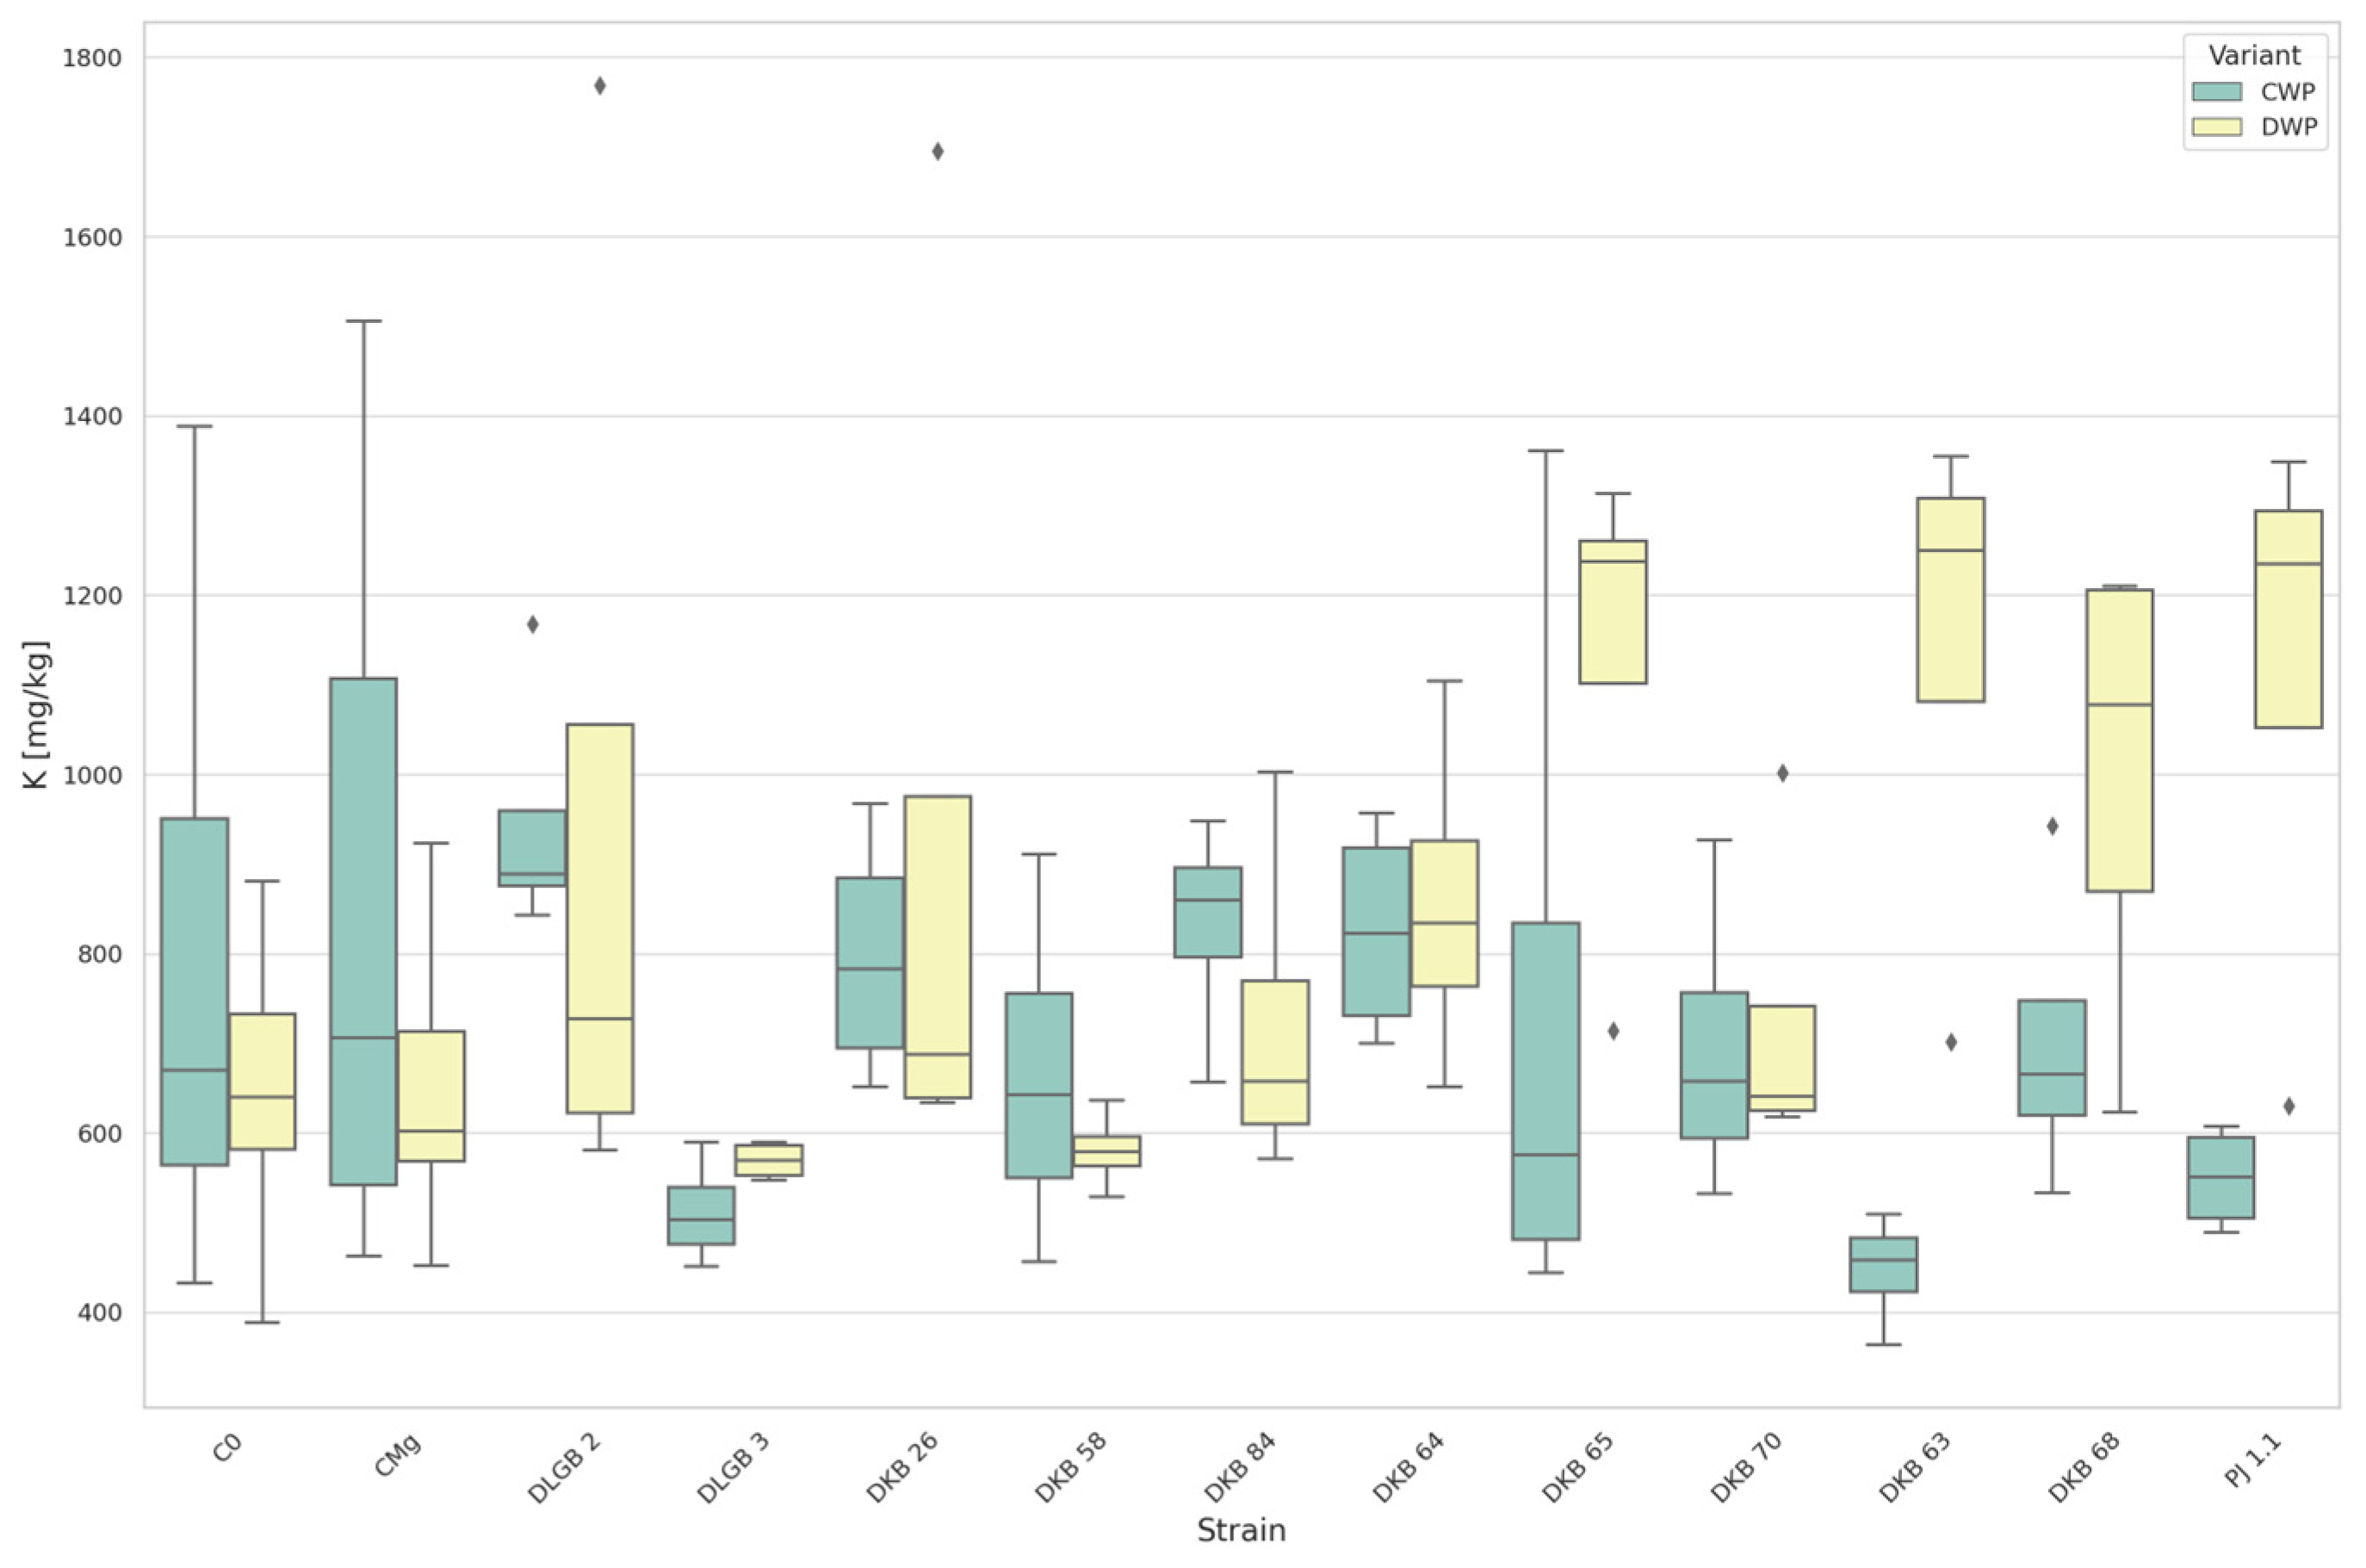
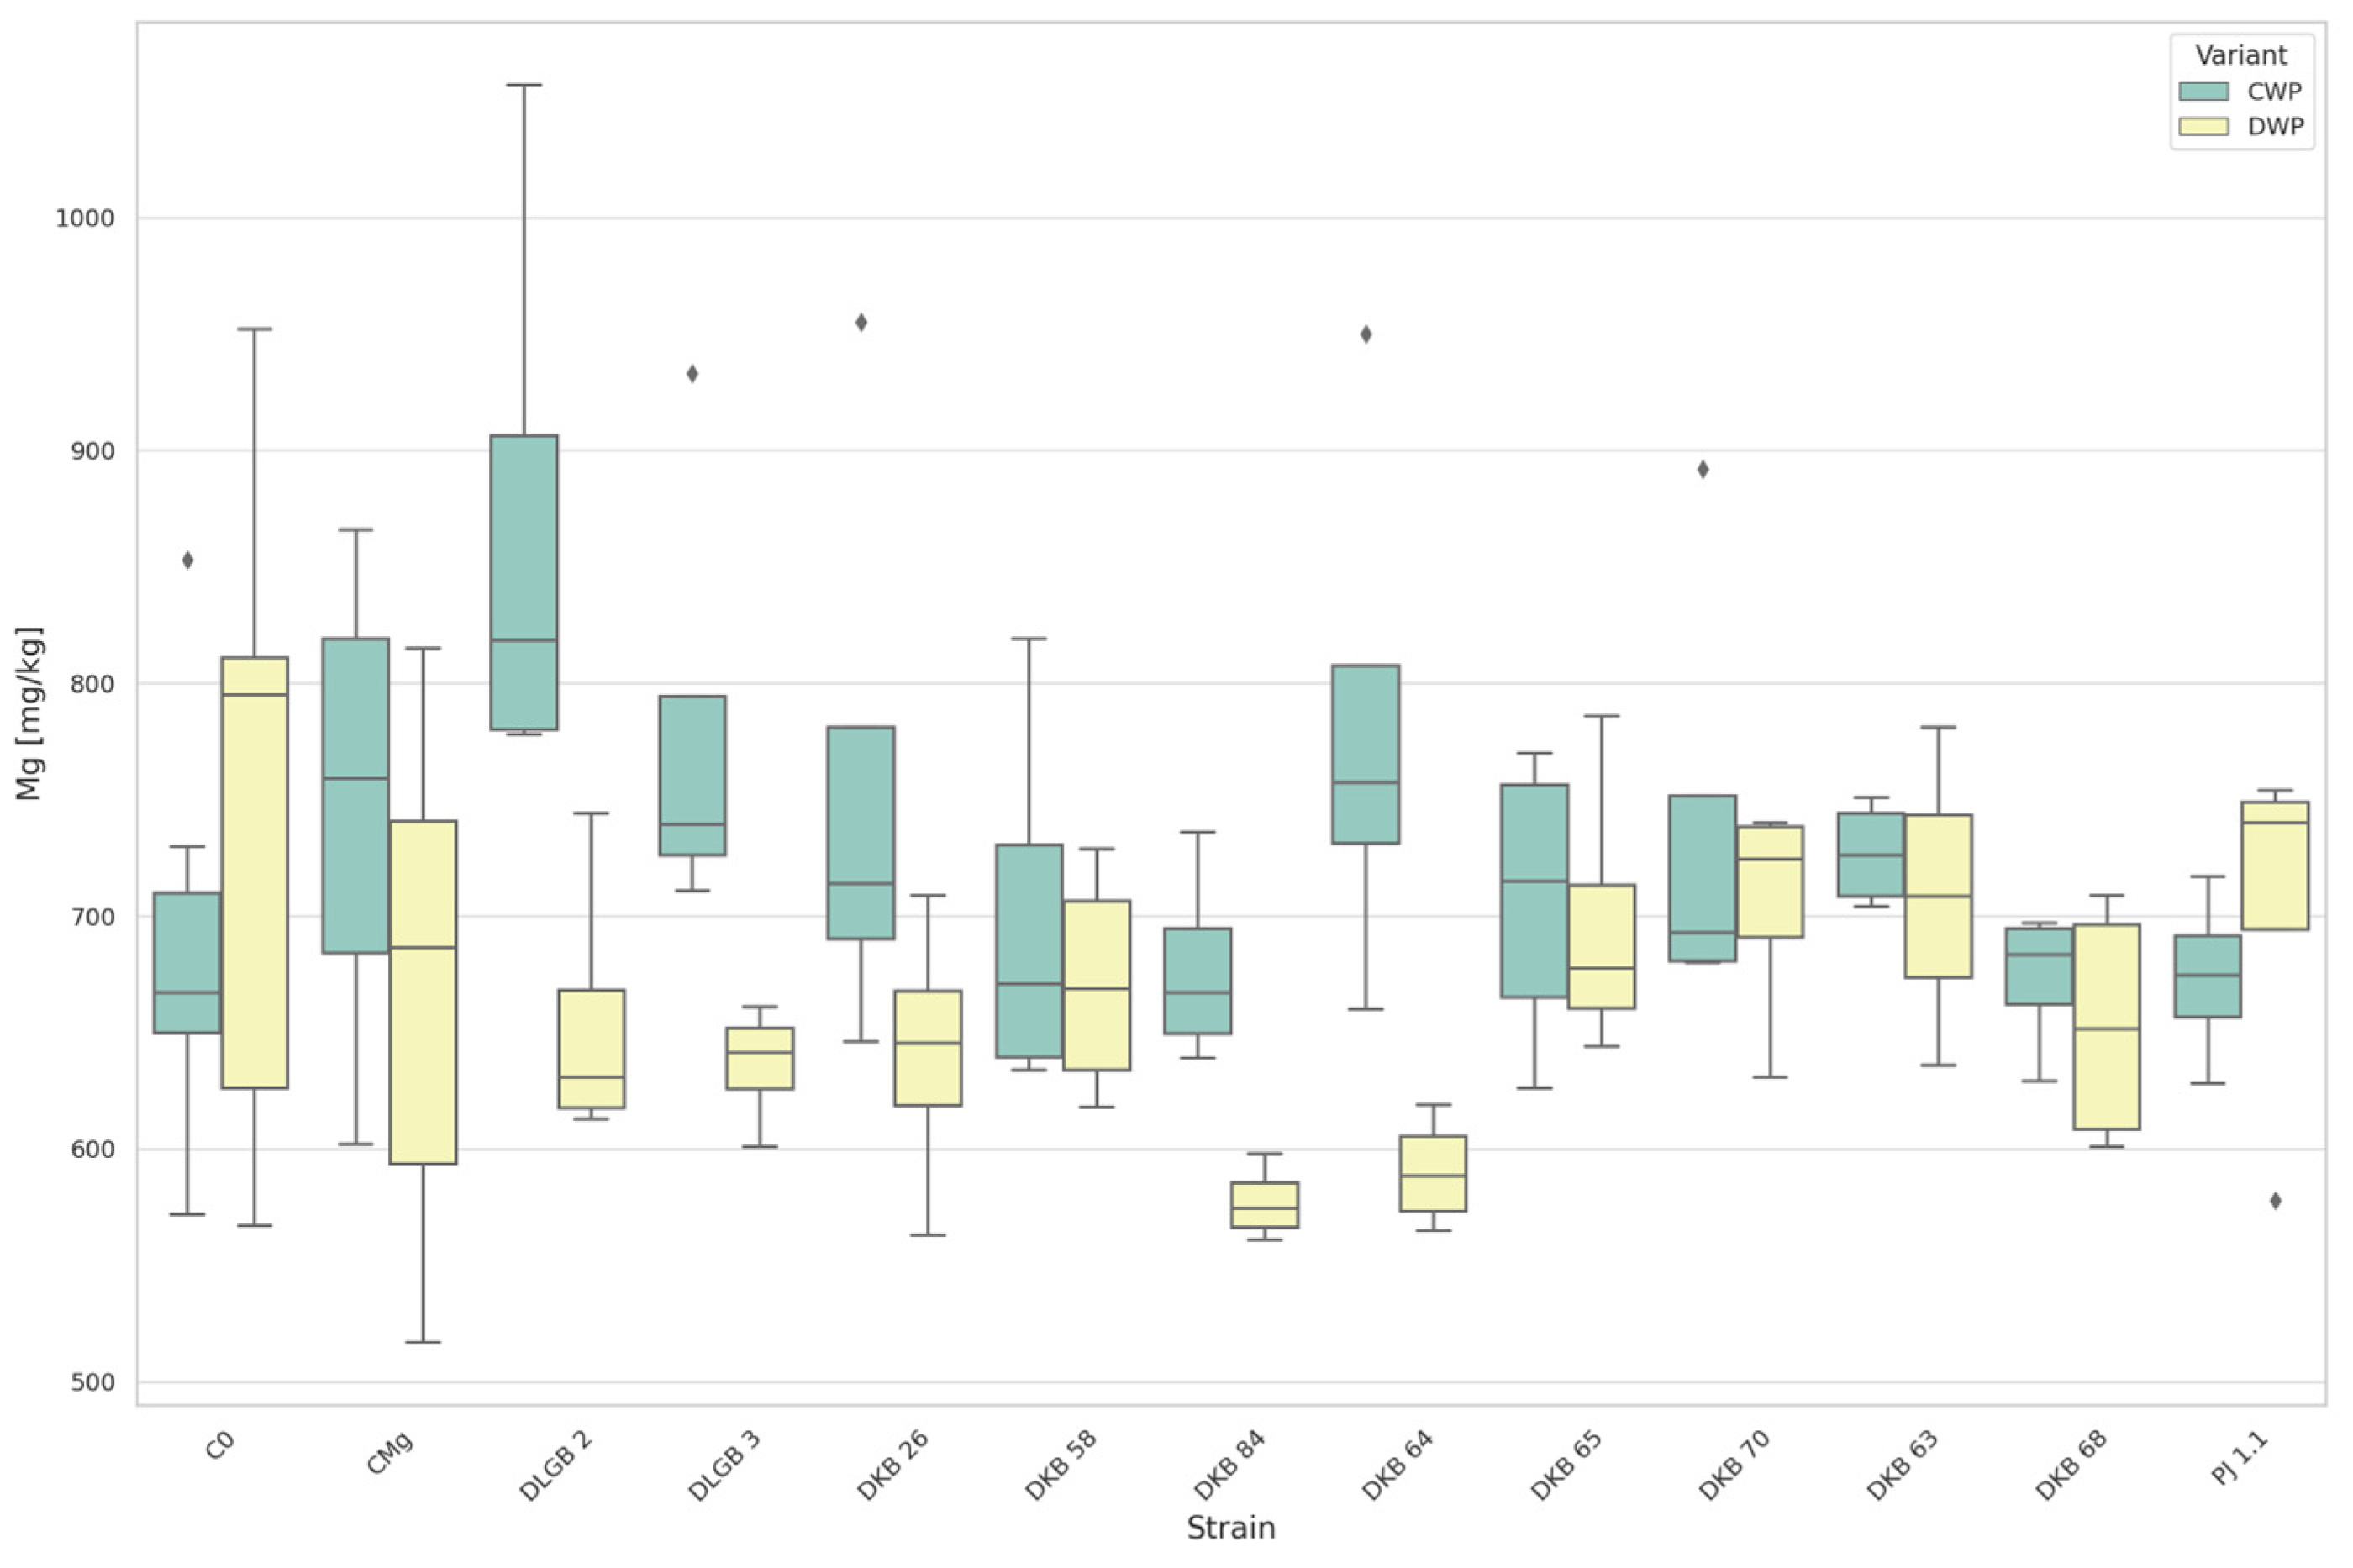
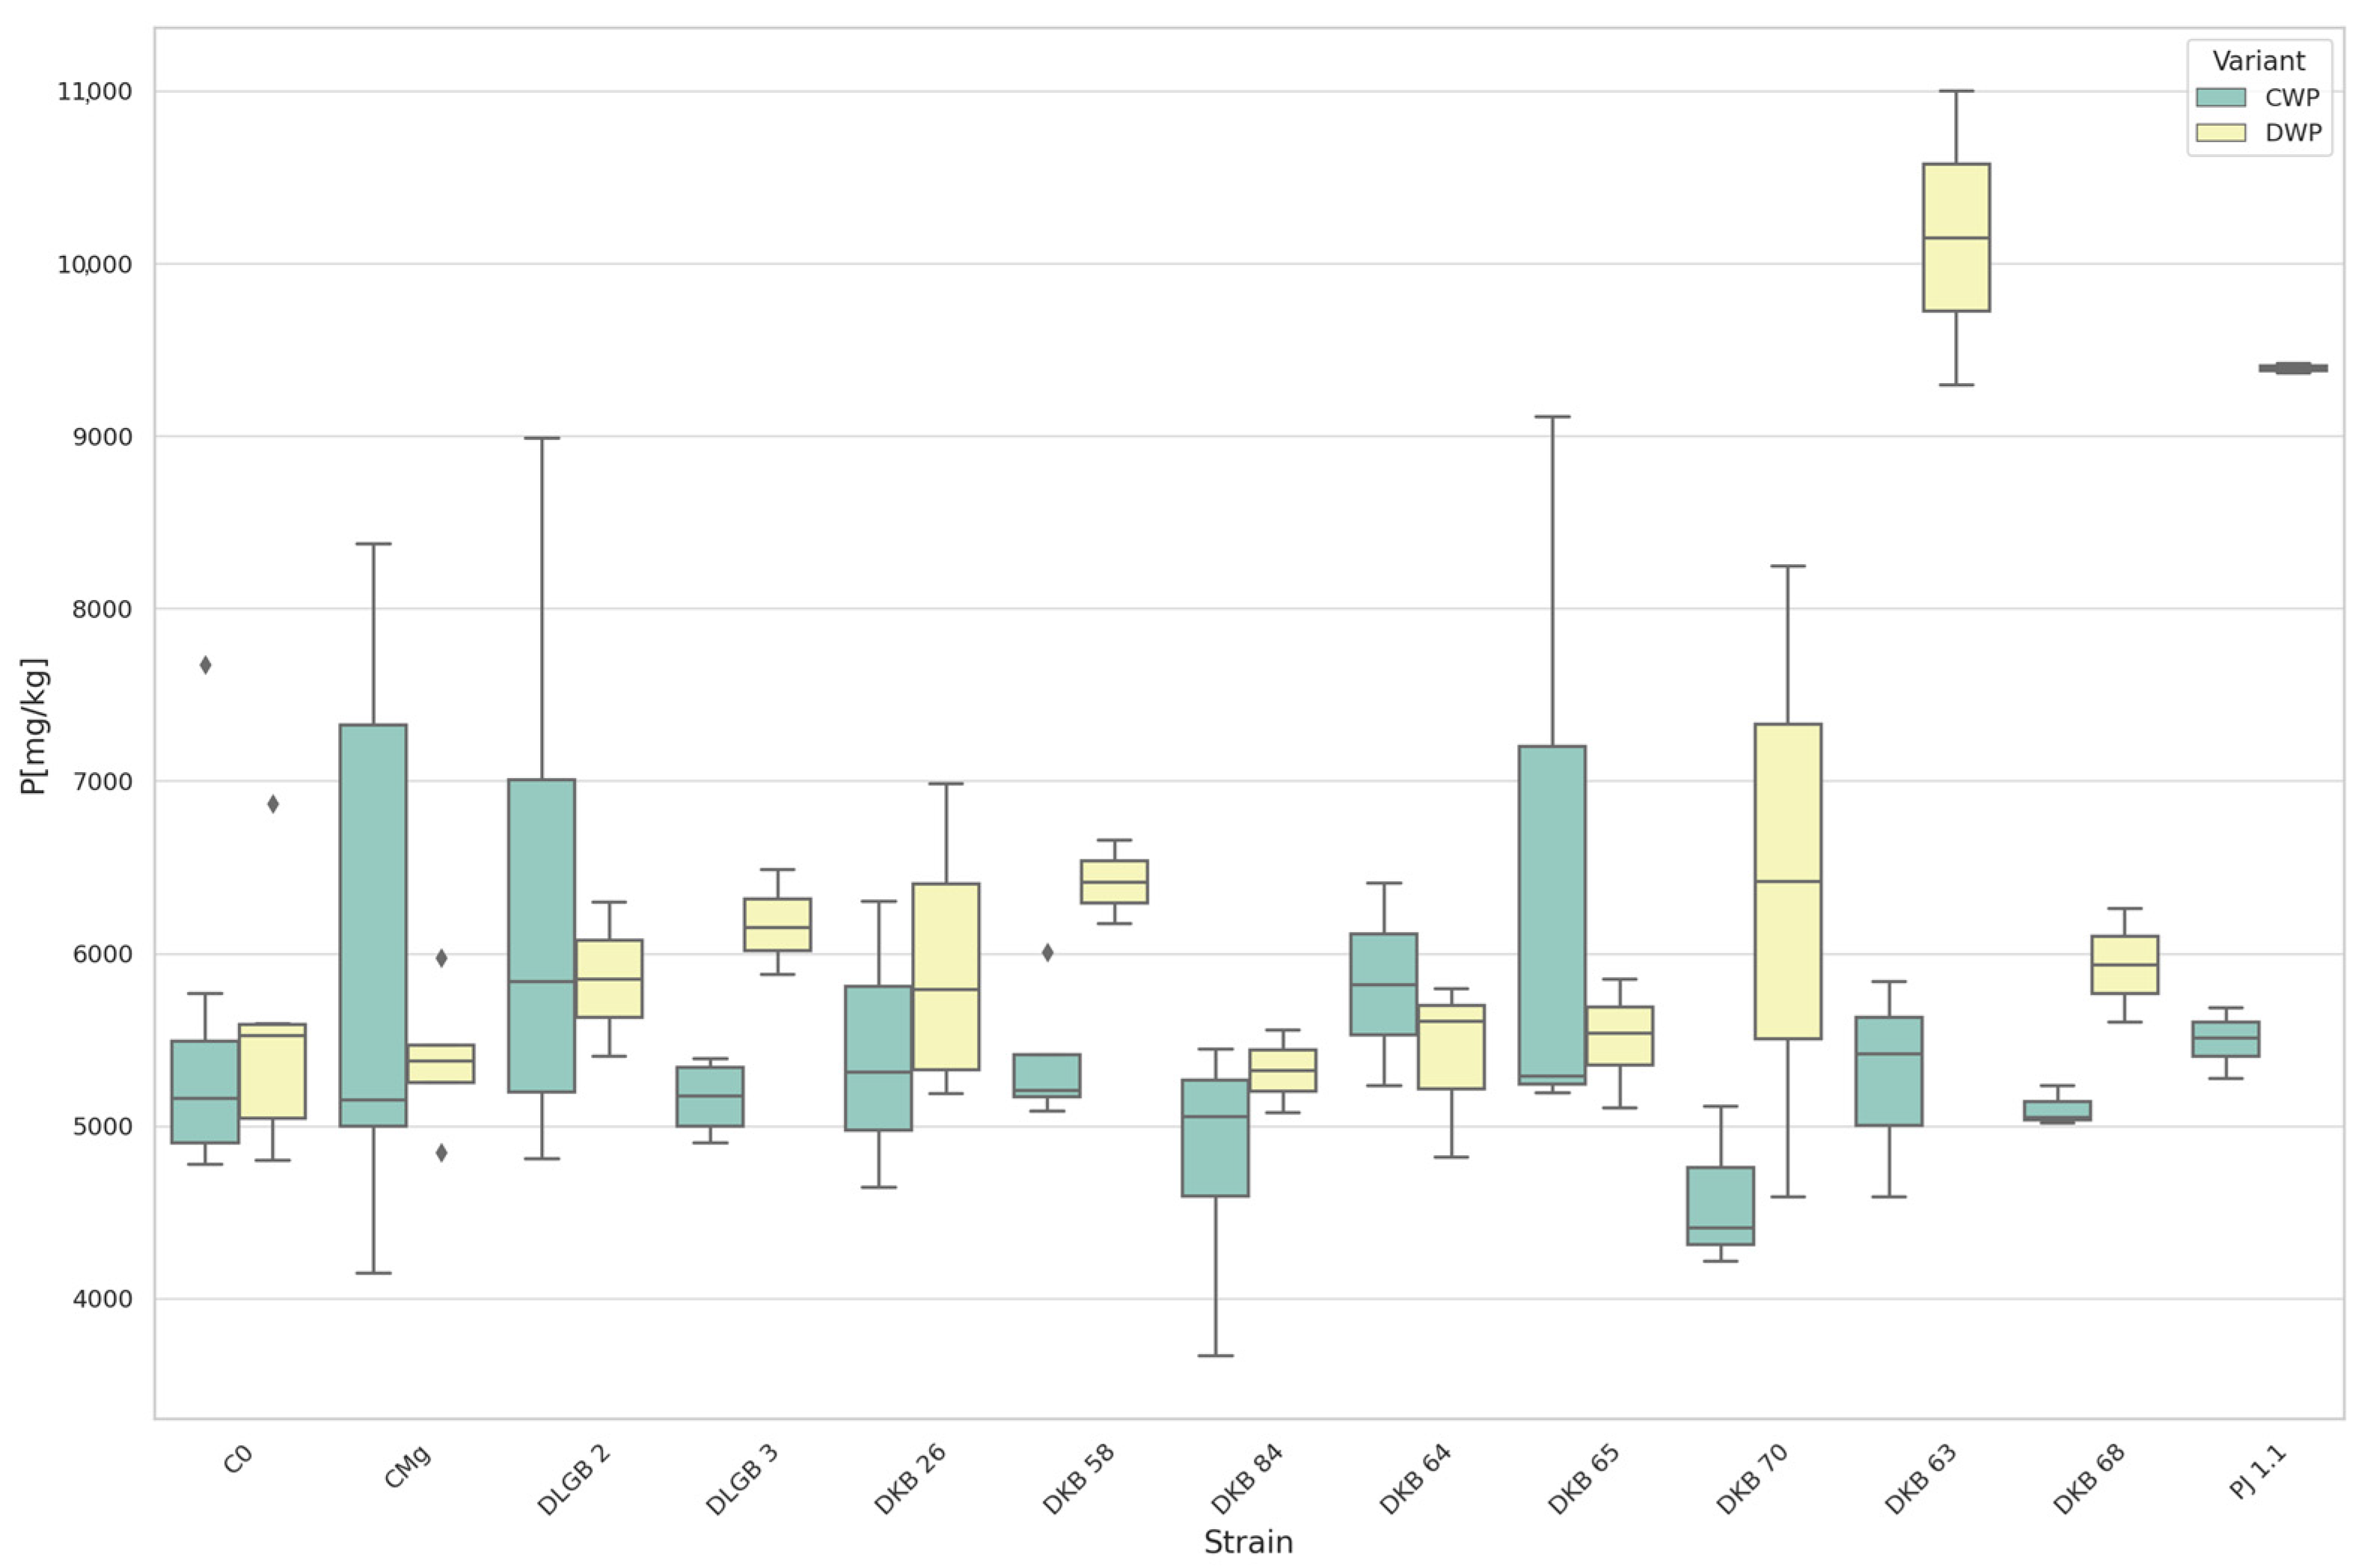
3.2. The Content of Macronutrients in the Substrate

The mean value of the content available for plant forms of phosphorus in the optimal moisture conditions (CWP) was 119.0 mg·100 g−1 with SD 22.6 and CV 19.0%, while under the water deficiency conditions (DWP), it was recorded at 117.1 mg·100 g−1 with SD 30.1 and CV 25.7%. The maximum value was observed in CWP for the C0 variant, and DWP at DKB65 strain. The minimum value was observed in CWP at inoculation with the DKB68 strain and for DWP at the DKB64 strain (Figure 5, Table 1).
The mean value of the content available for plant forms of potassium in the optimal moisture conditions (CWP) was 740.7 mg·kg−1 with SD 274.2 and CV 37.0%. In the water deficit conditions (DWP), the mean value was observed at 818.03 mg·kg−1 with SD 312.07 and CV 38.15%. The maximum value in CWP was found for the CMg variant, and for DWP when inoculated with the DLGB2 strain. The lowest value was observed in CWP at the DKB63 strain, and for DWP in the C0 variant (Figure 6).
The mean value content of available forms of magnesium in the optimal moisture conditions (CWP) was 728.7 mg·kg−1 with SD 95.6 and CV 13.1%. In the water deficit conditions (DWP), the mean value was 673.0 mg·kg−1 with SD 86.8 and CV 12.9%. The maximum value of this macronutrient was observed in CWP at inoculation with the DLGB2 strain and for DWP in the C0 variant. The minimum value was observed in CWP for the C0 variant, and DWP in the CMg variant (Figure 7).

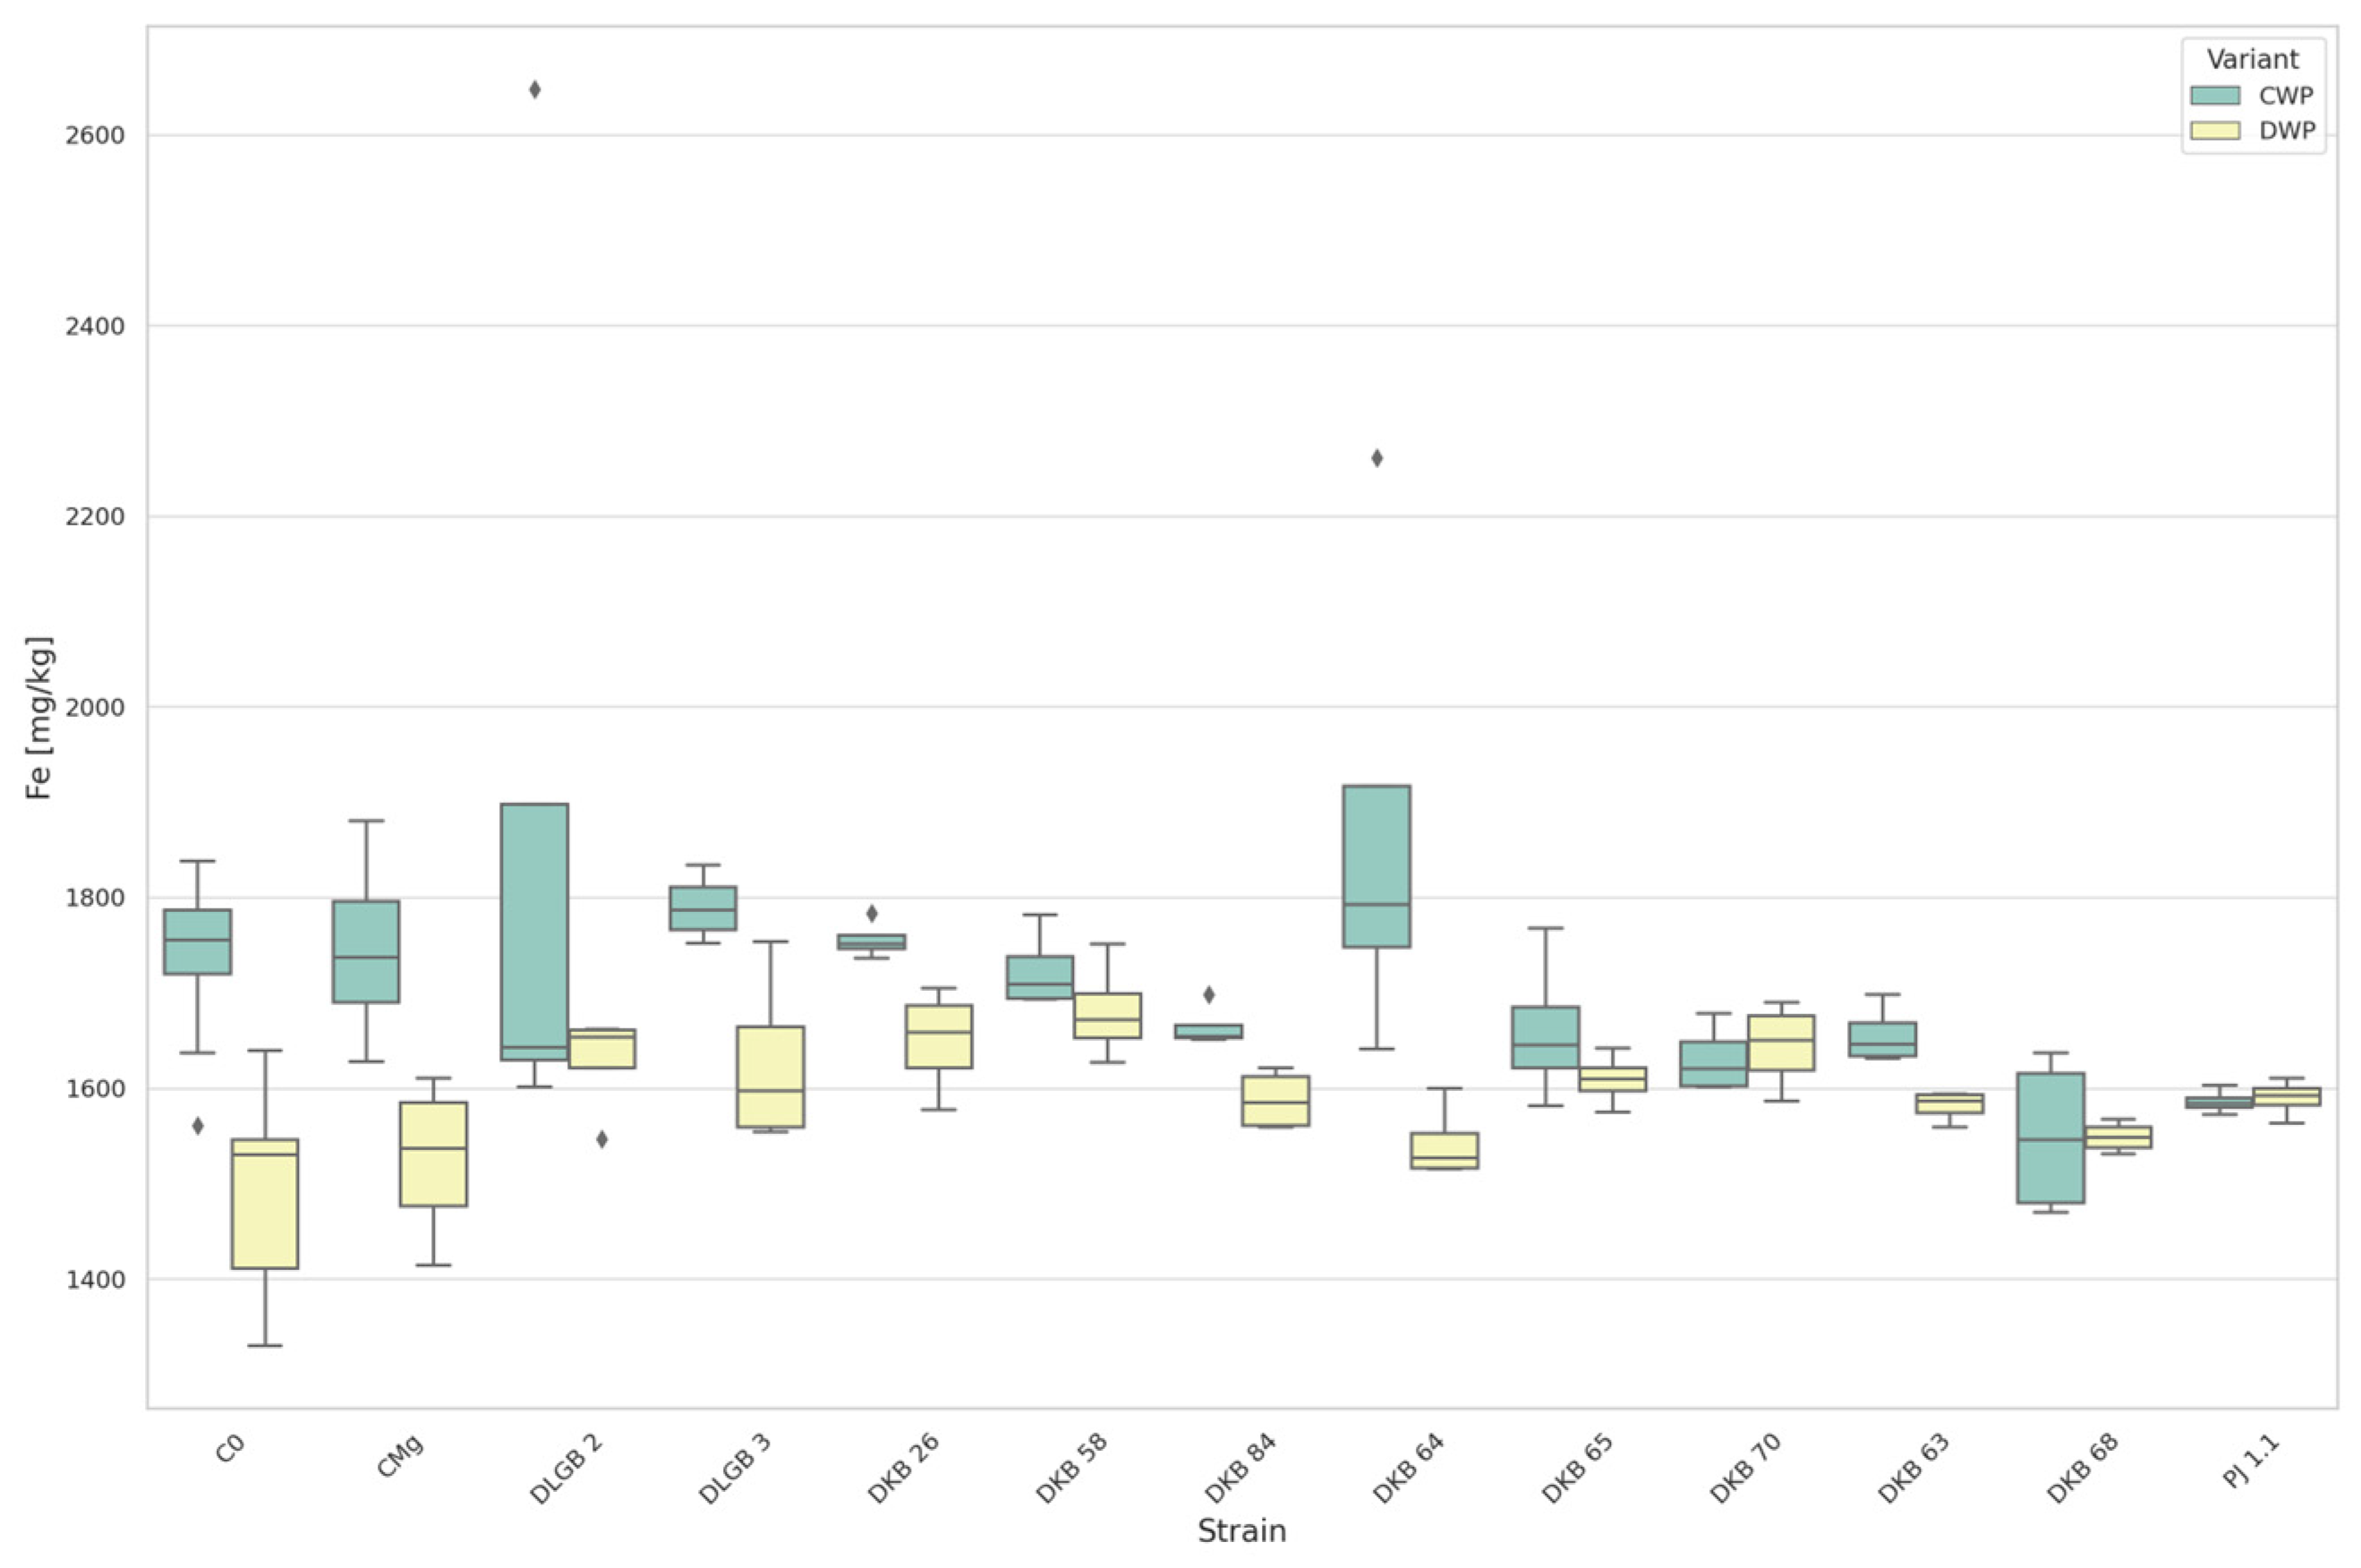
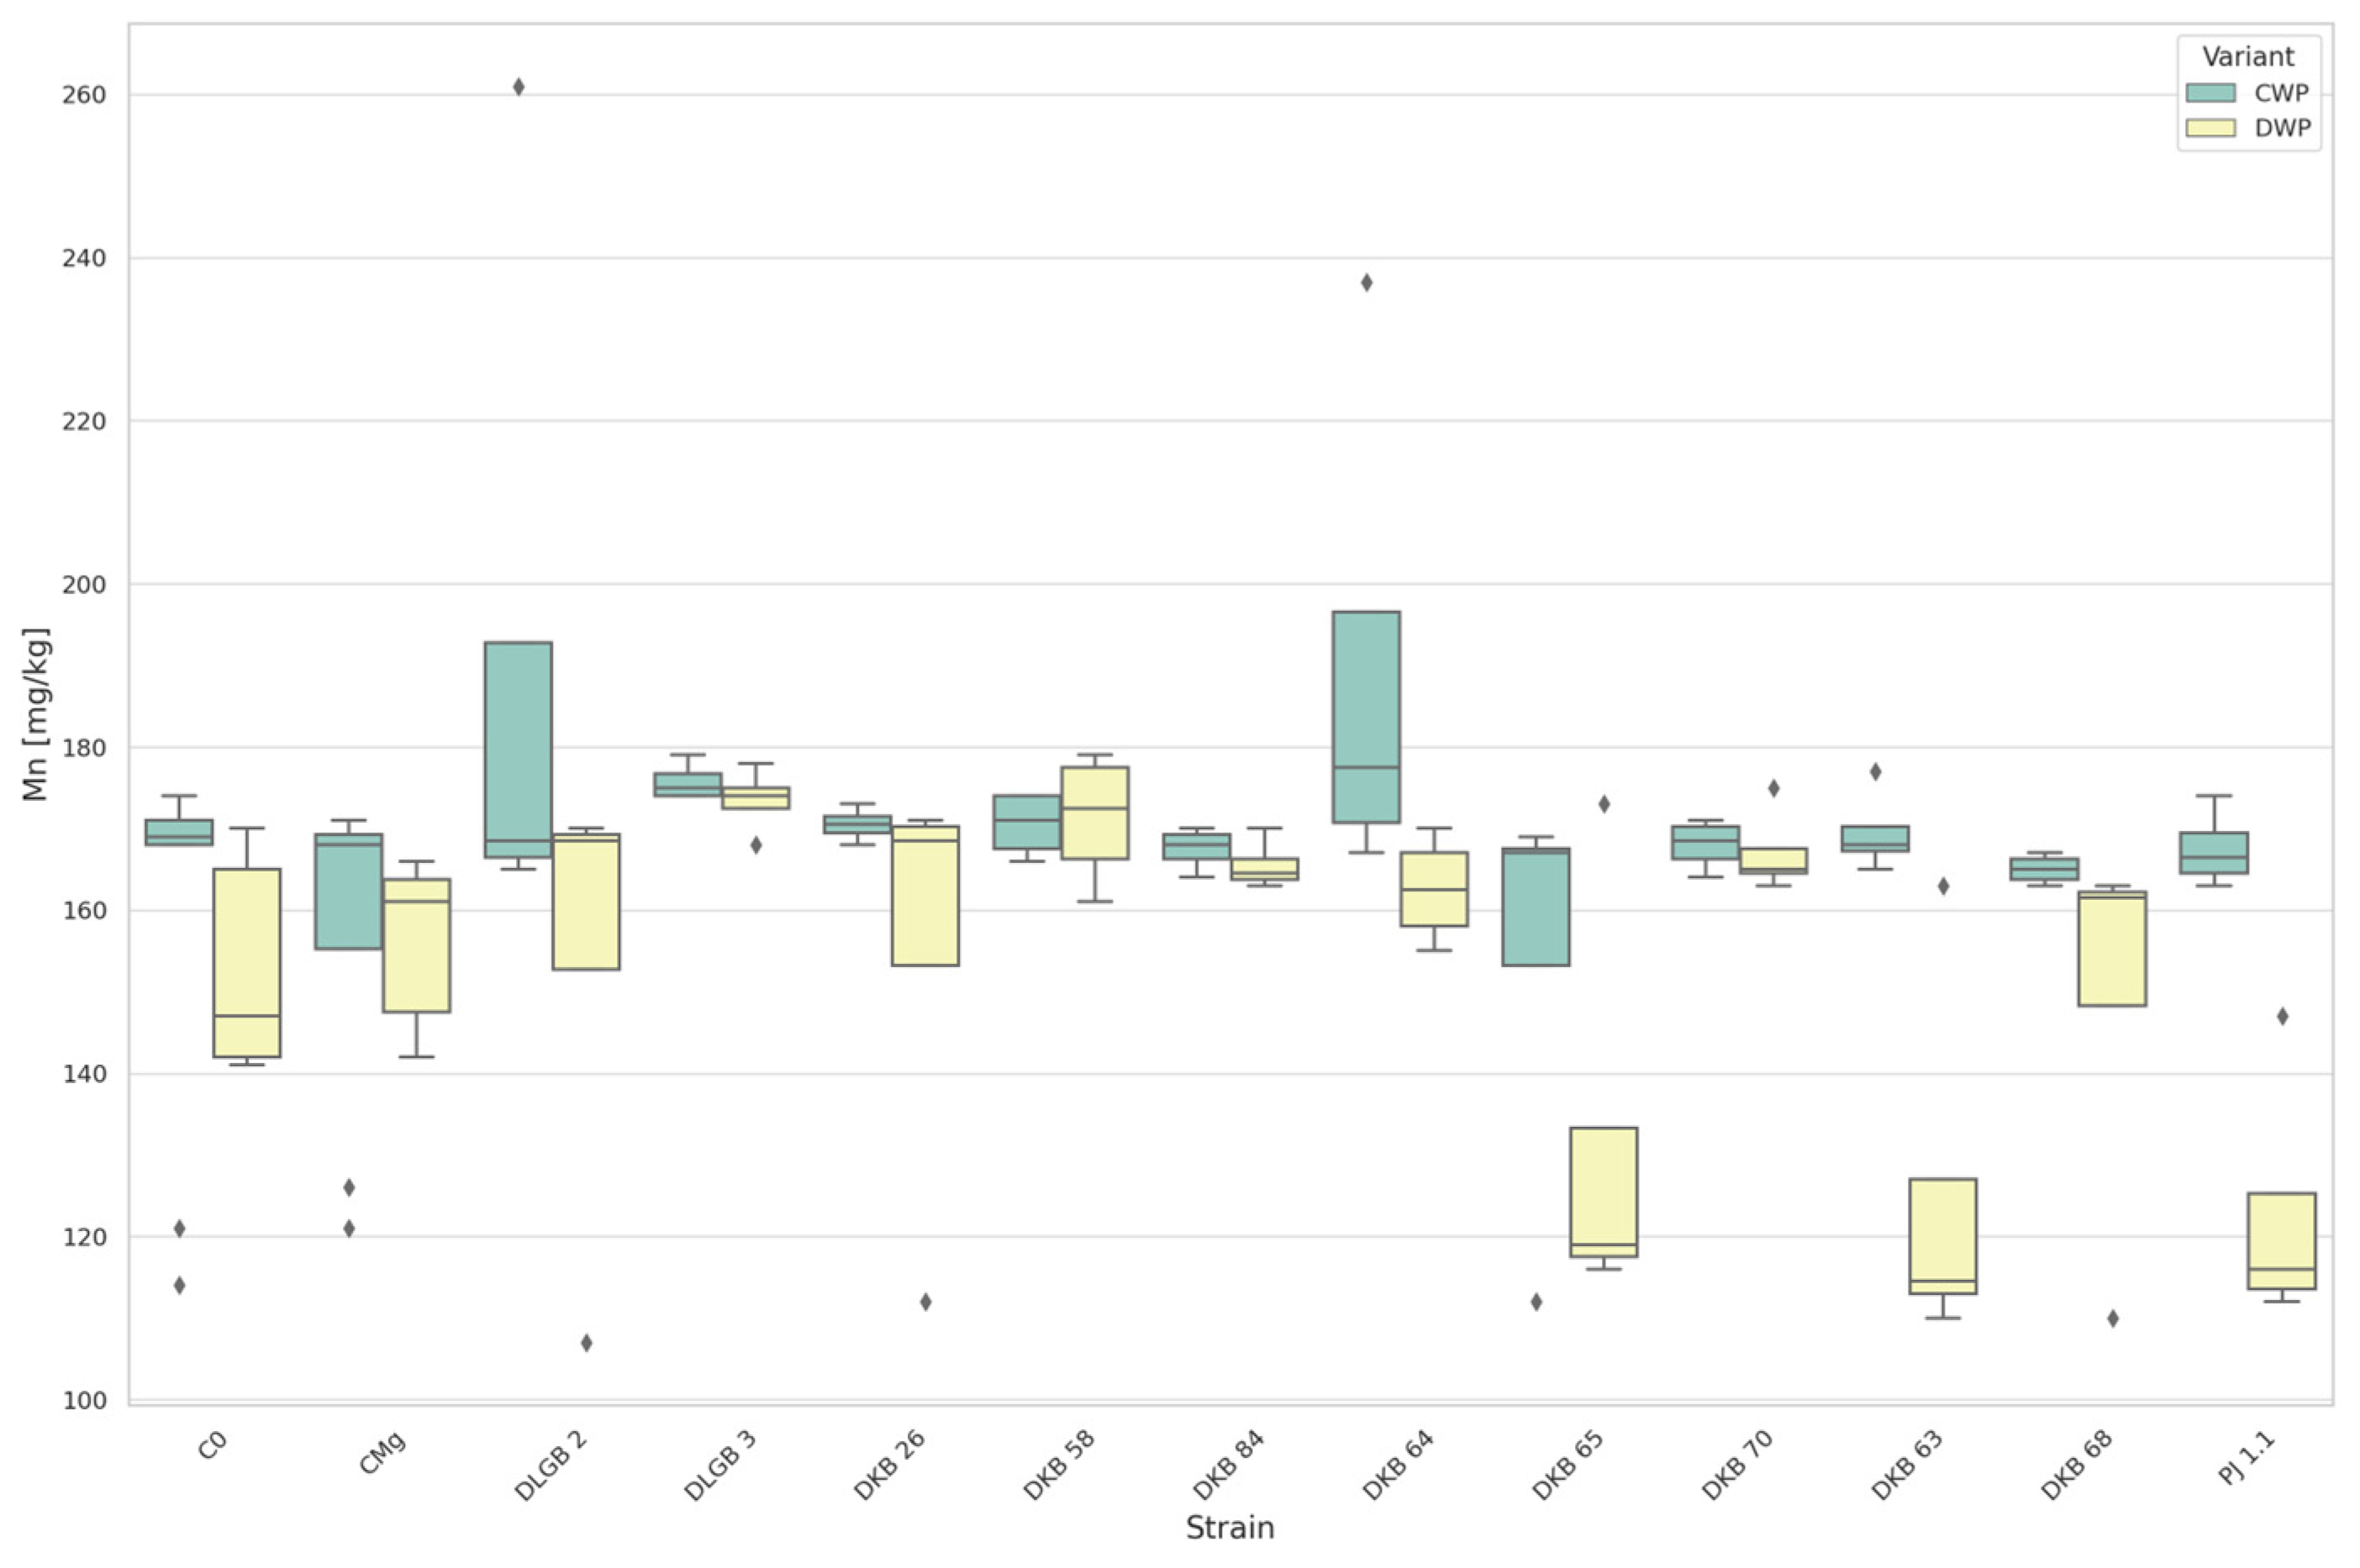
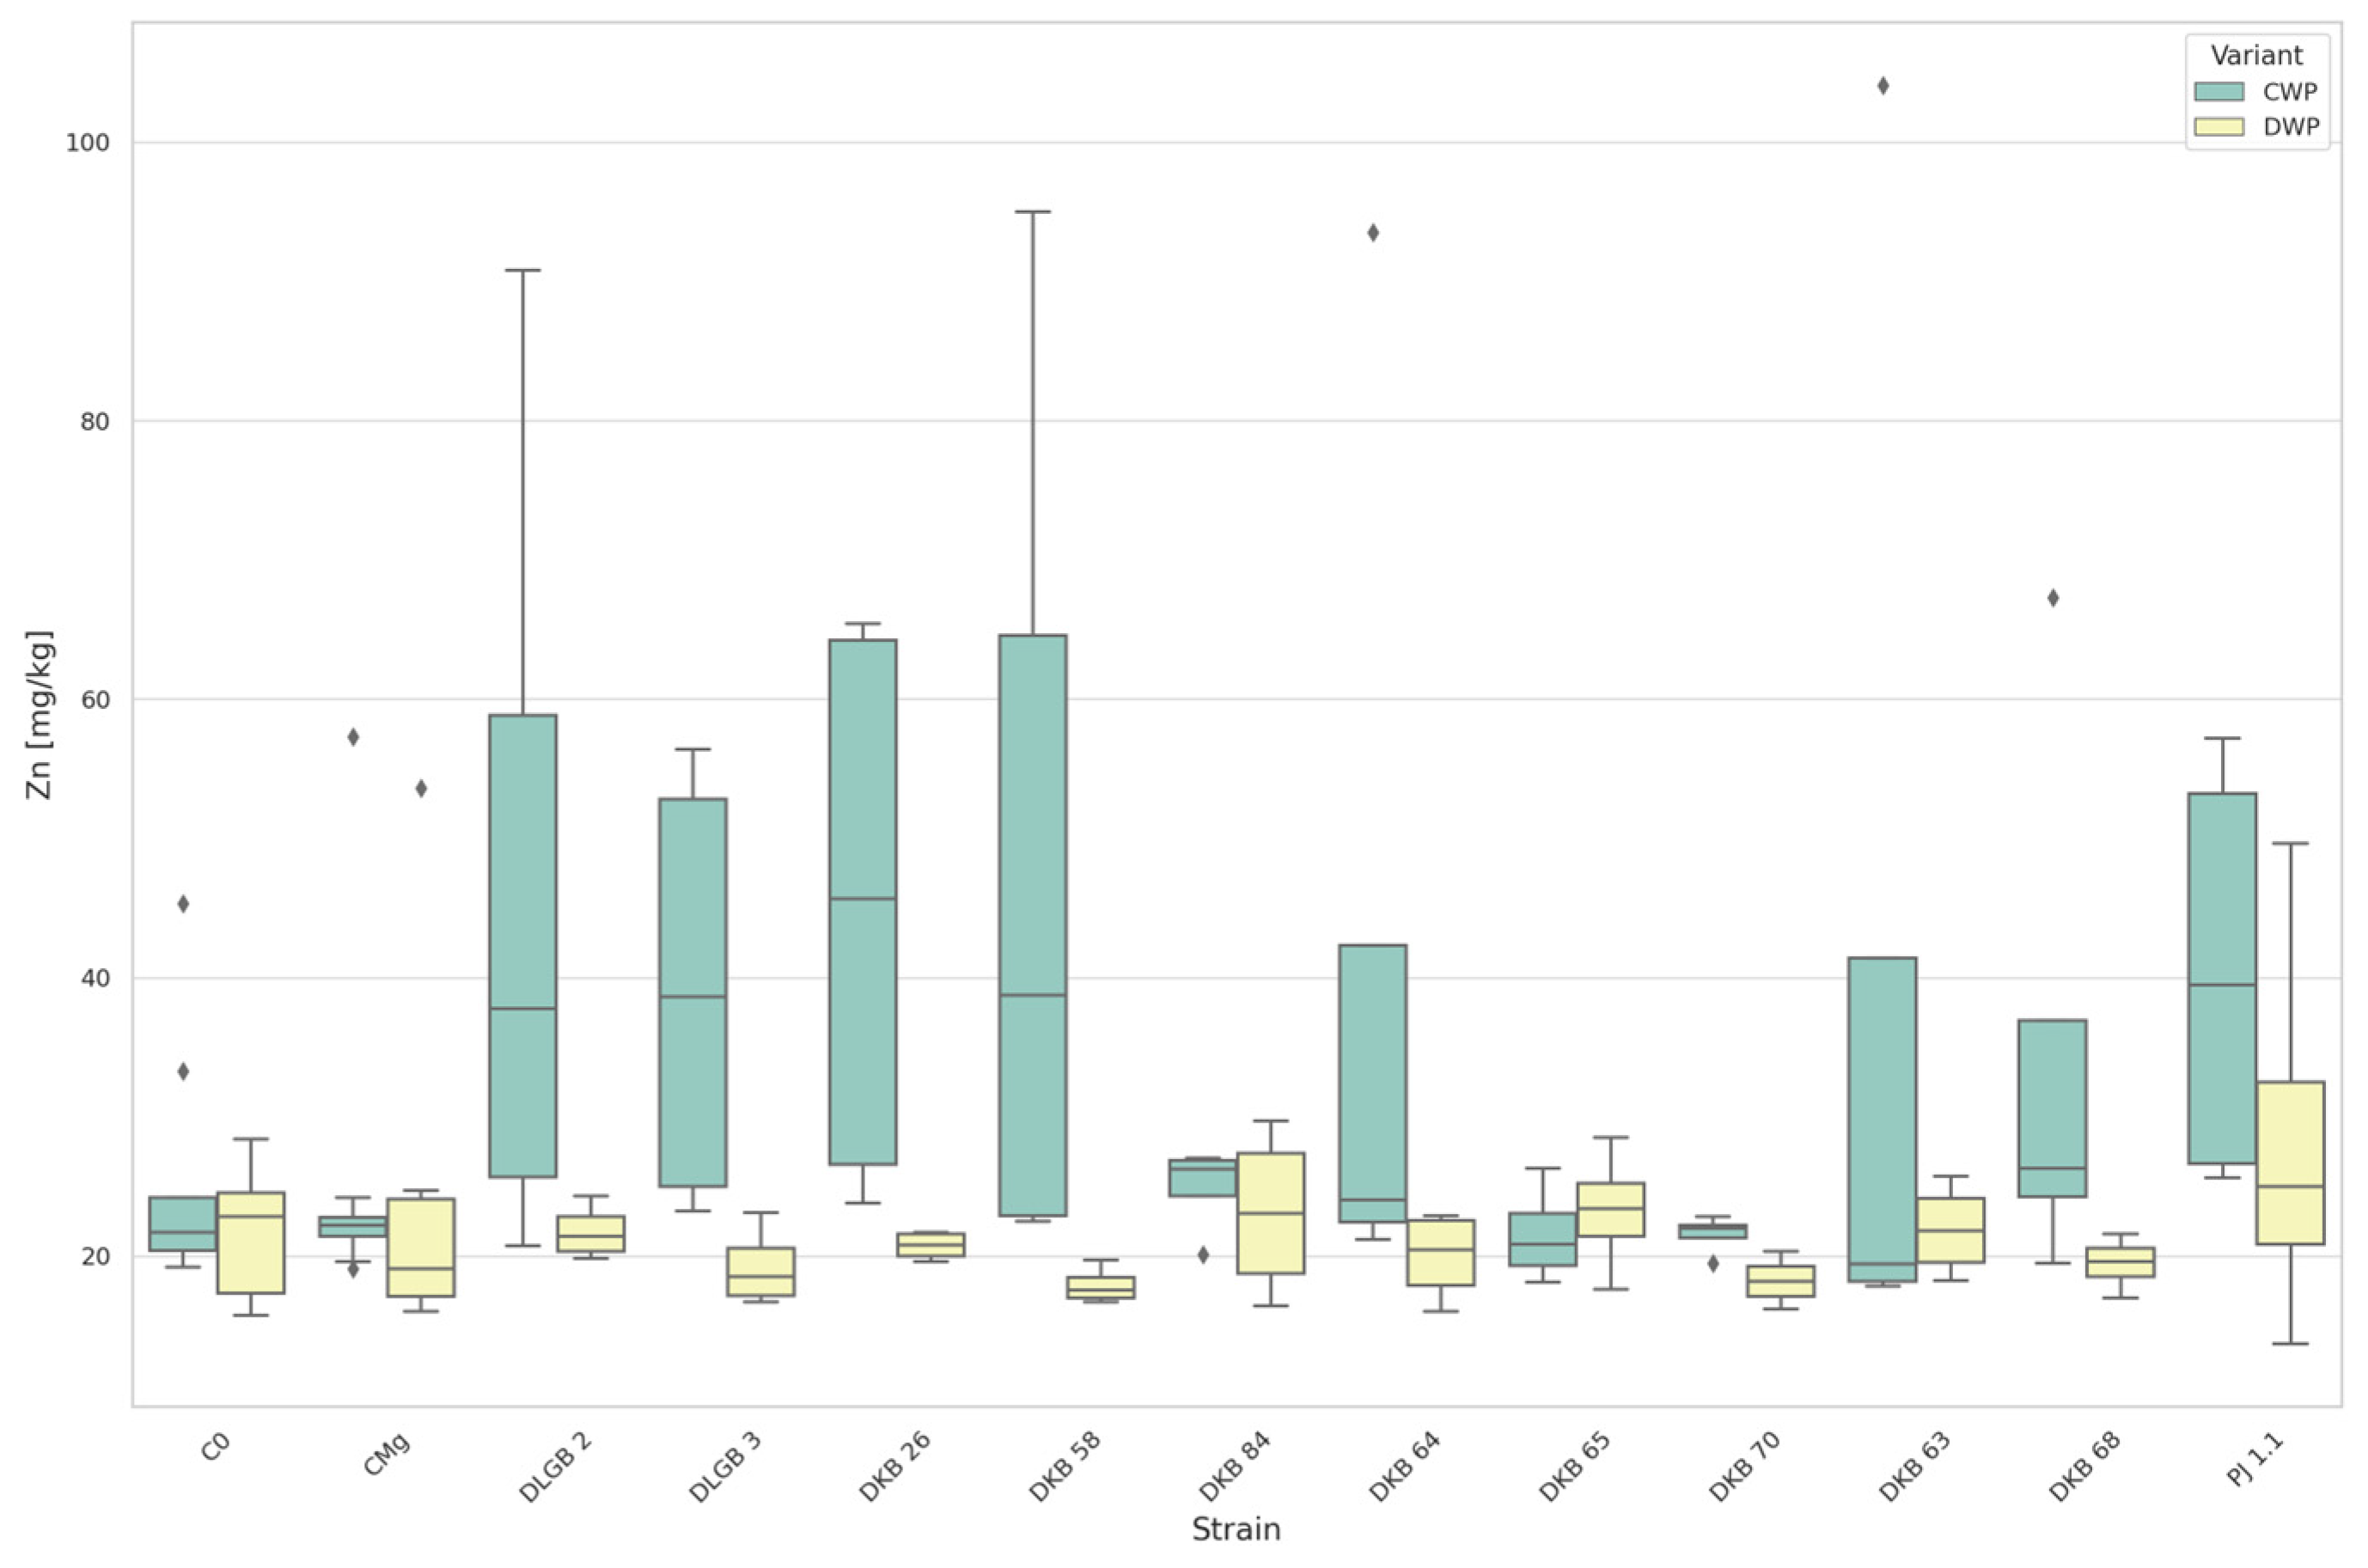
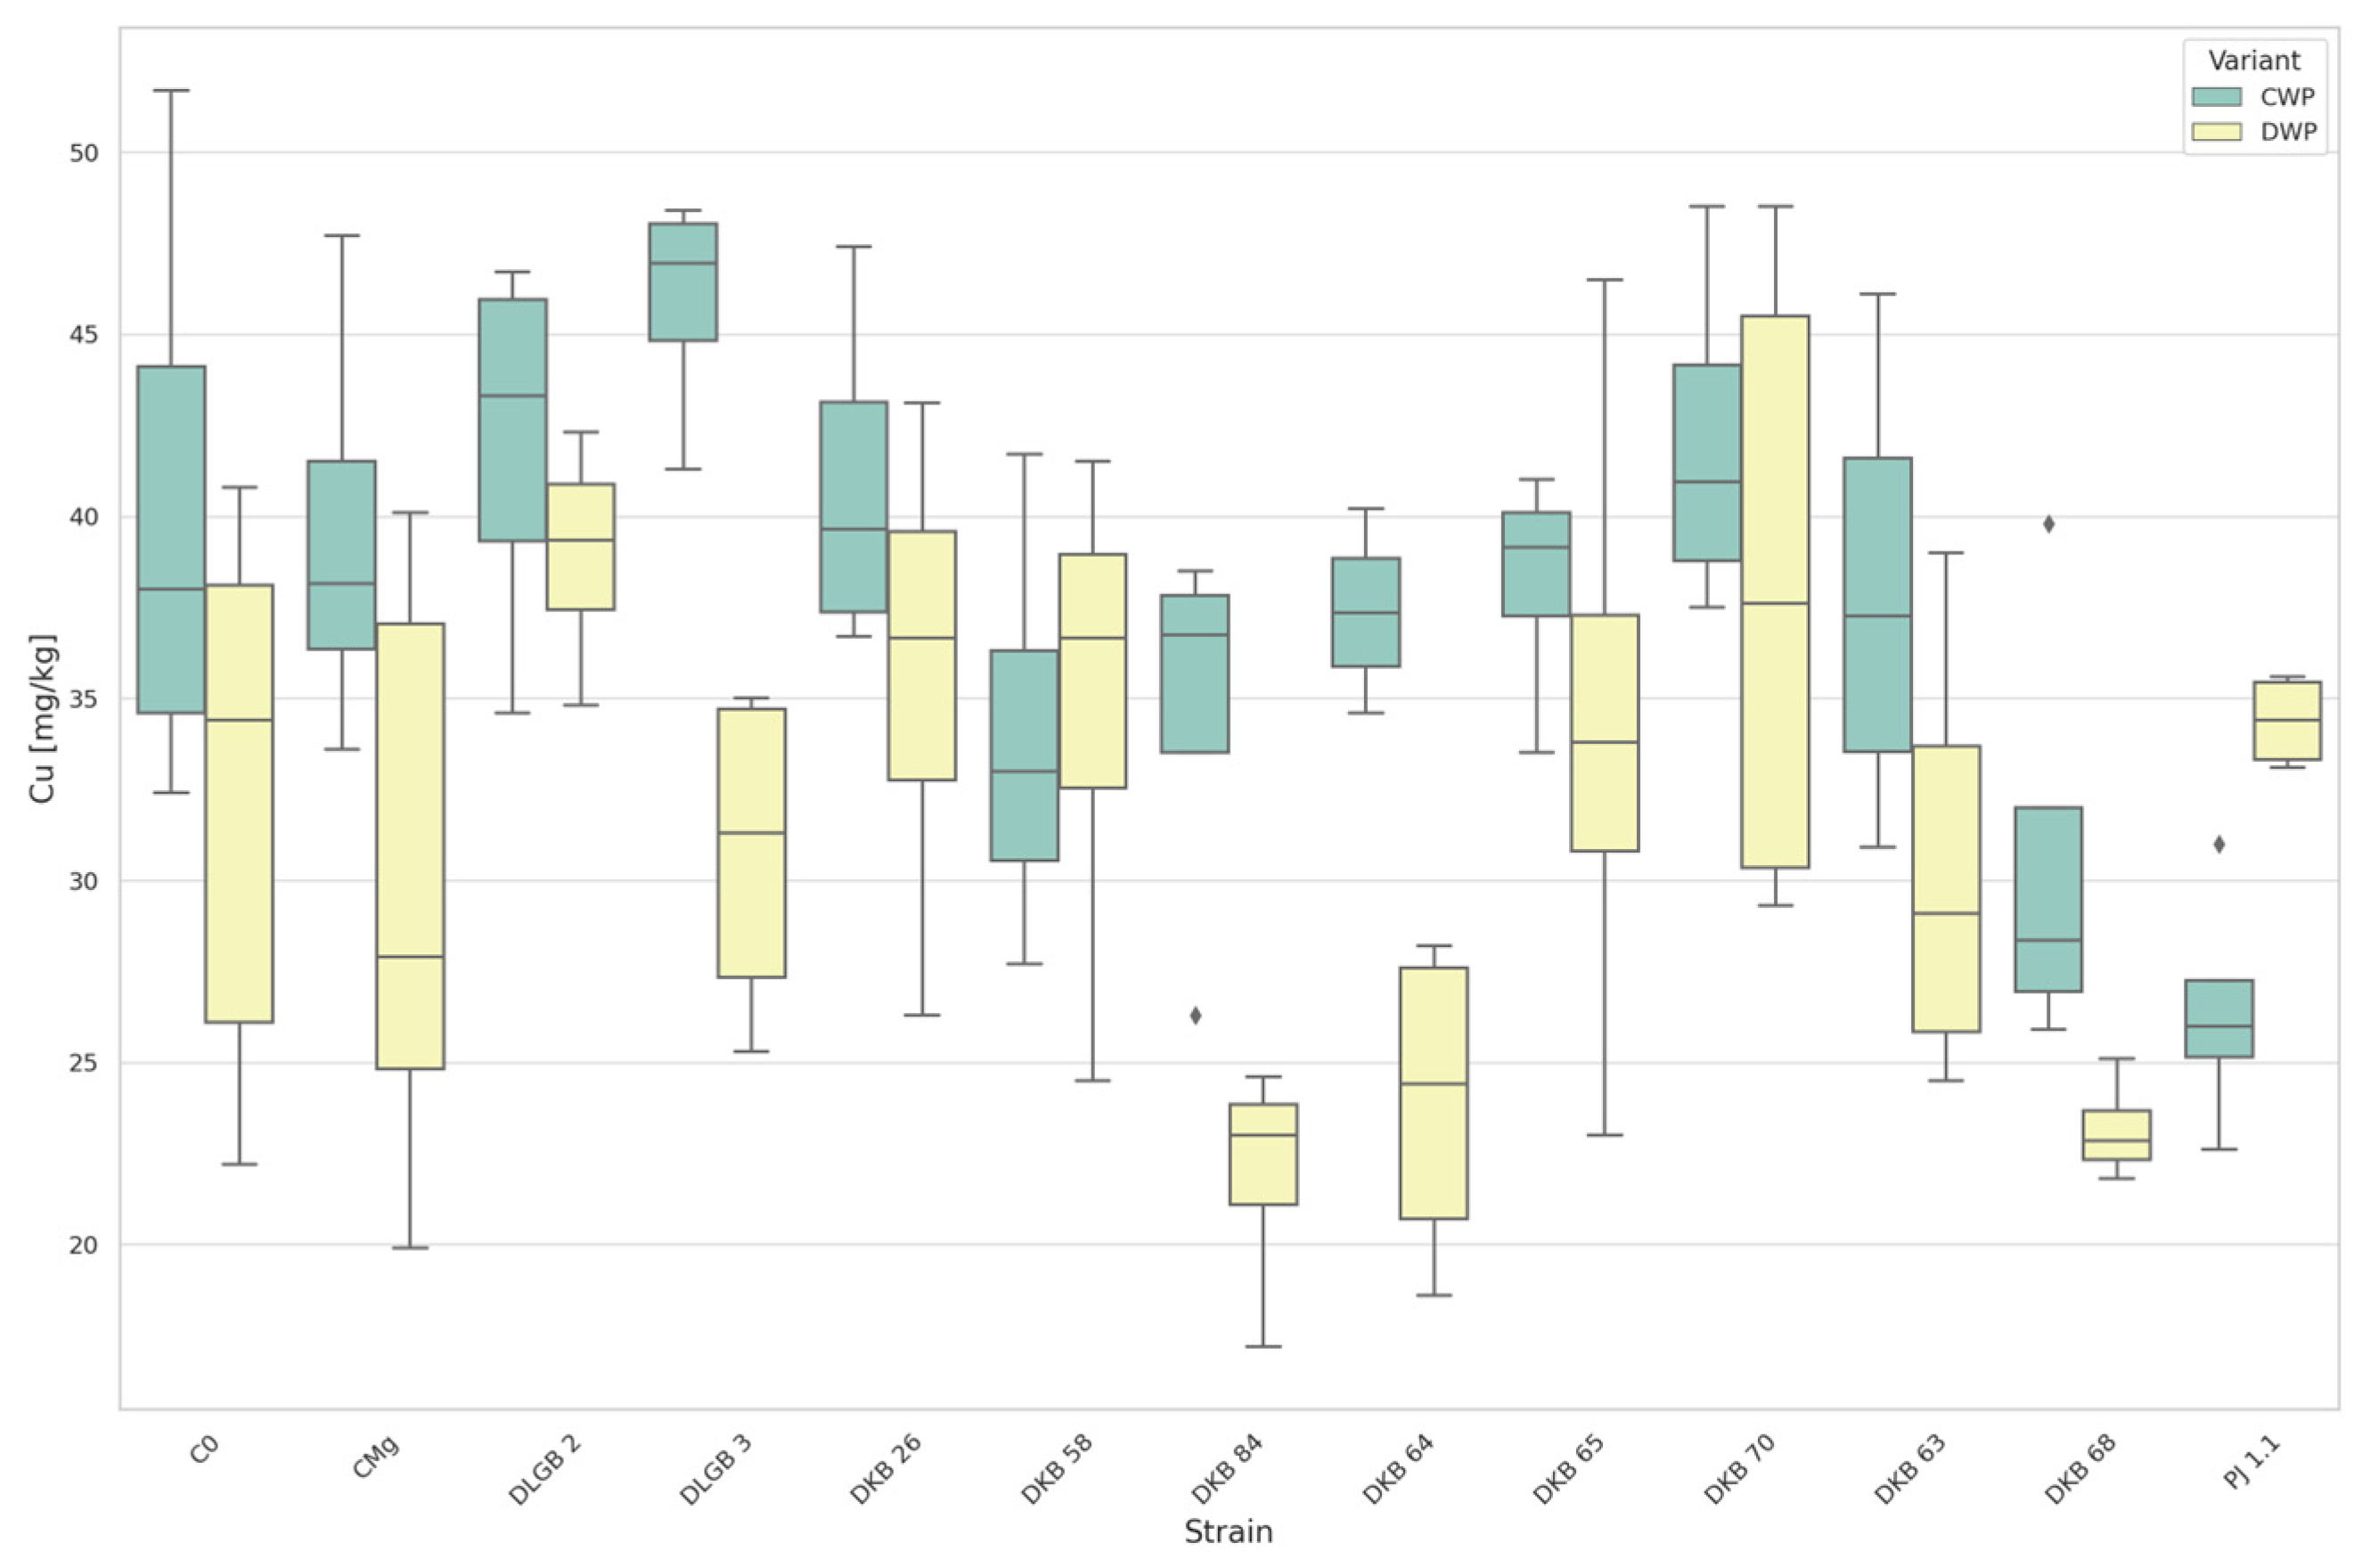
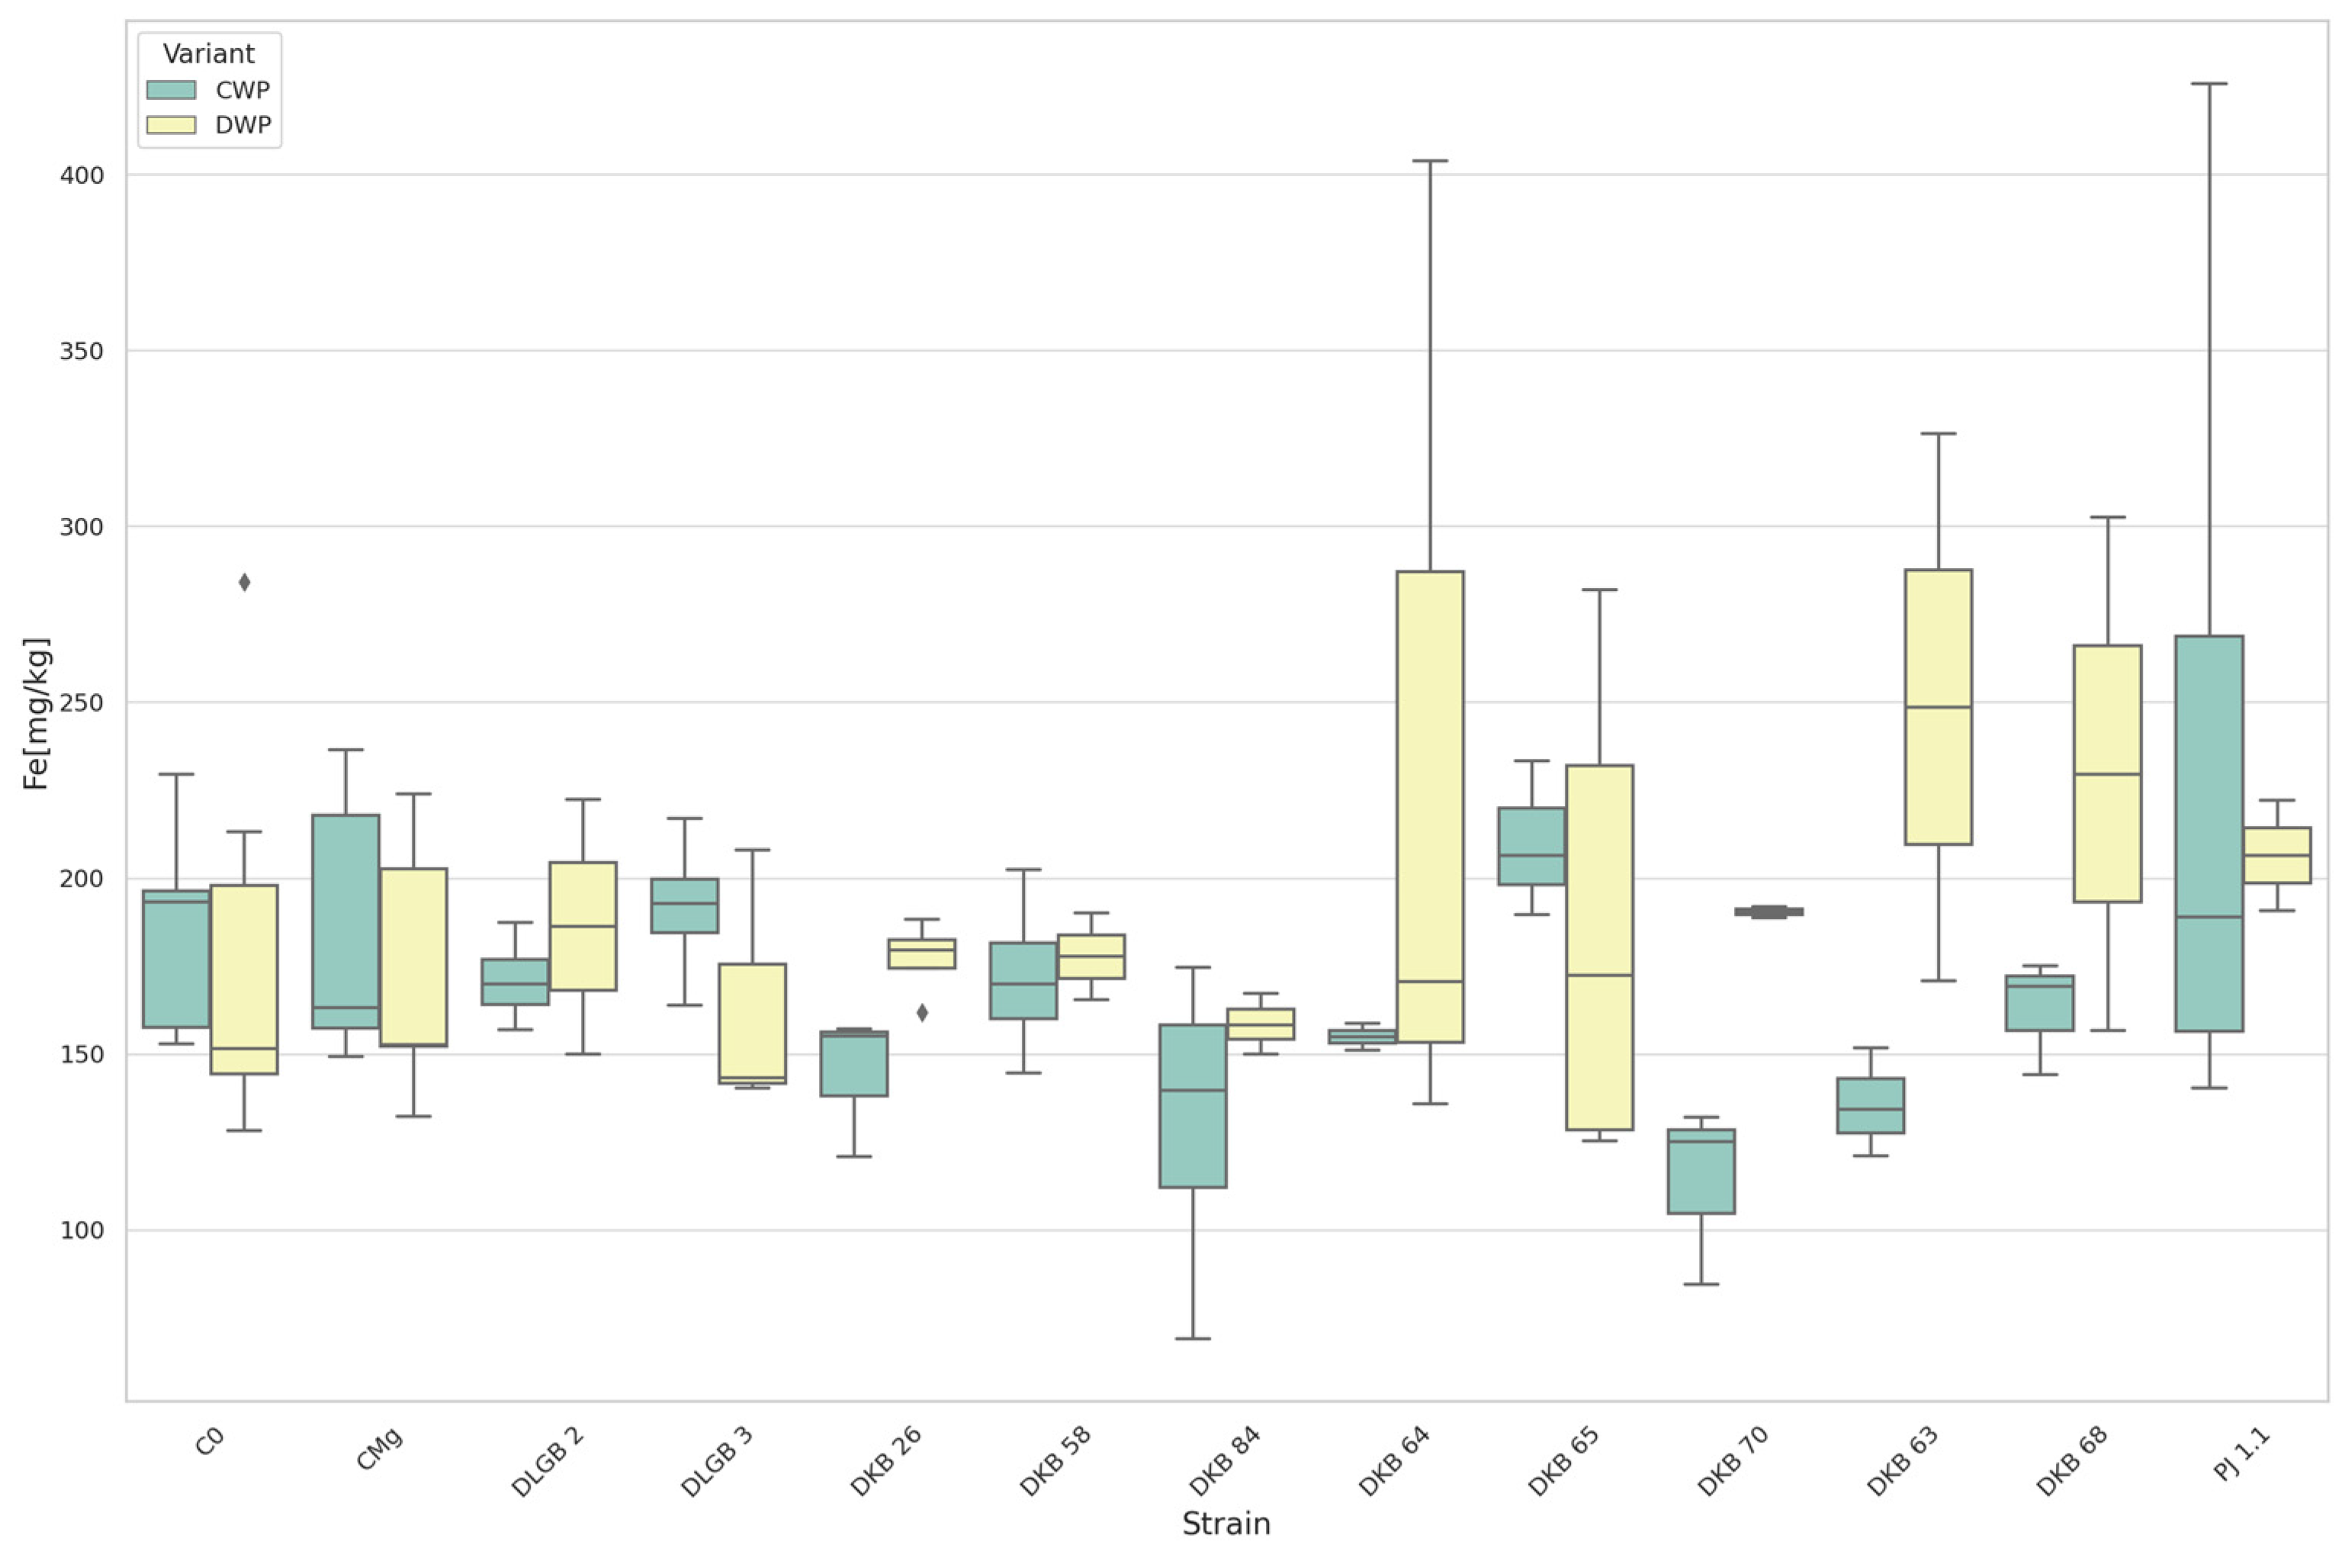
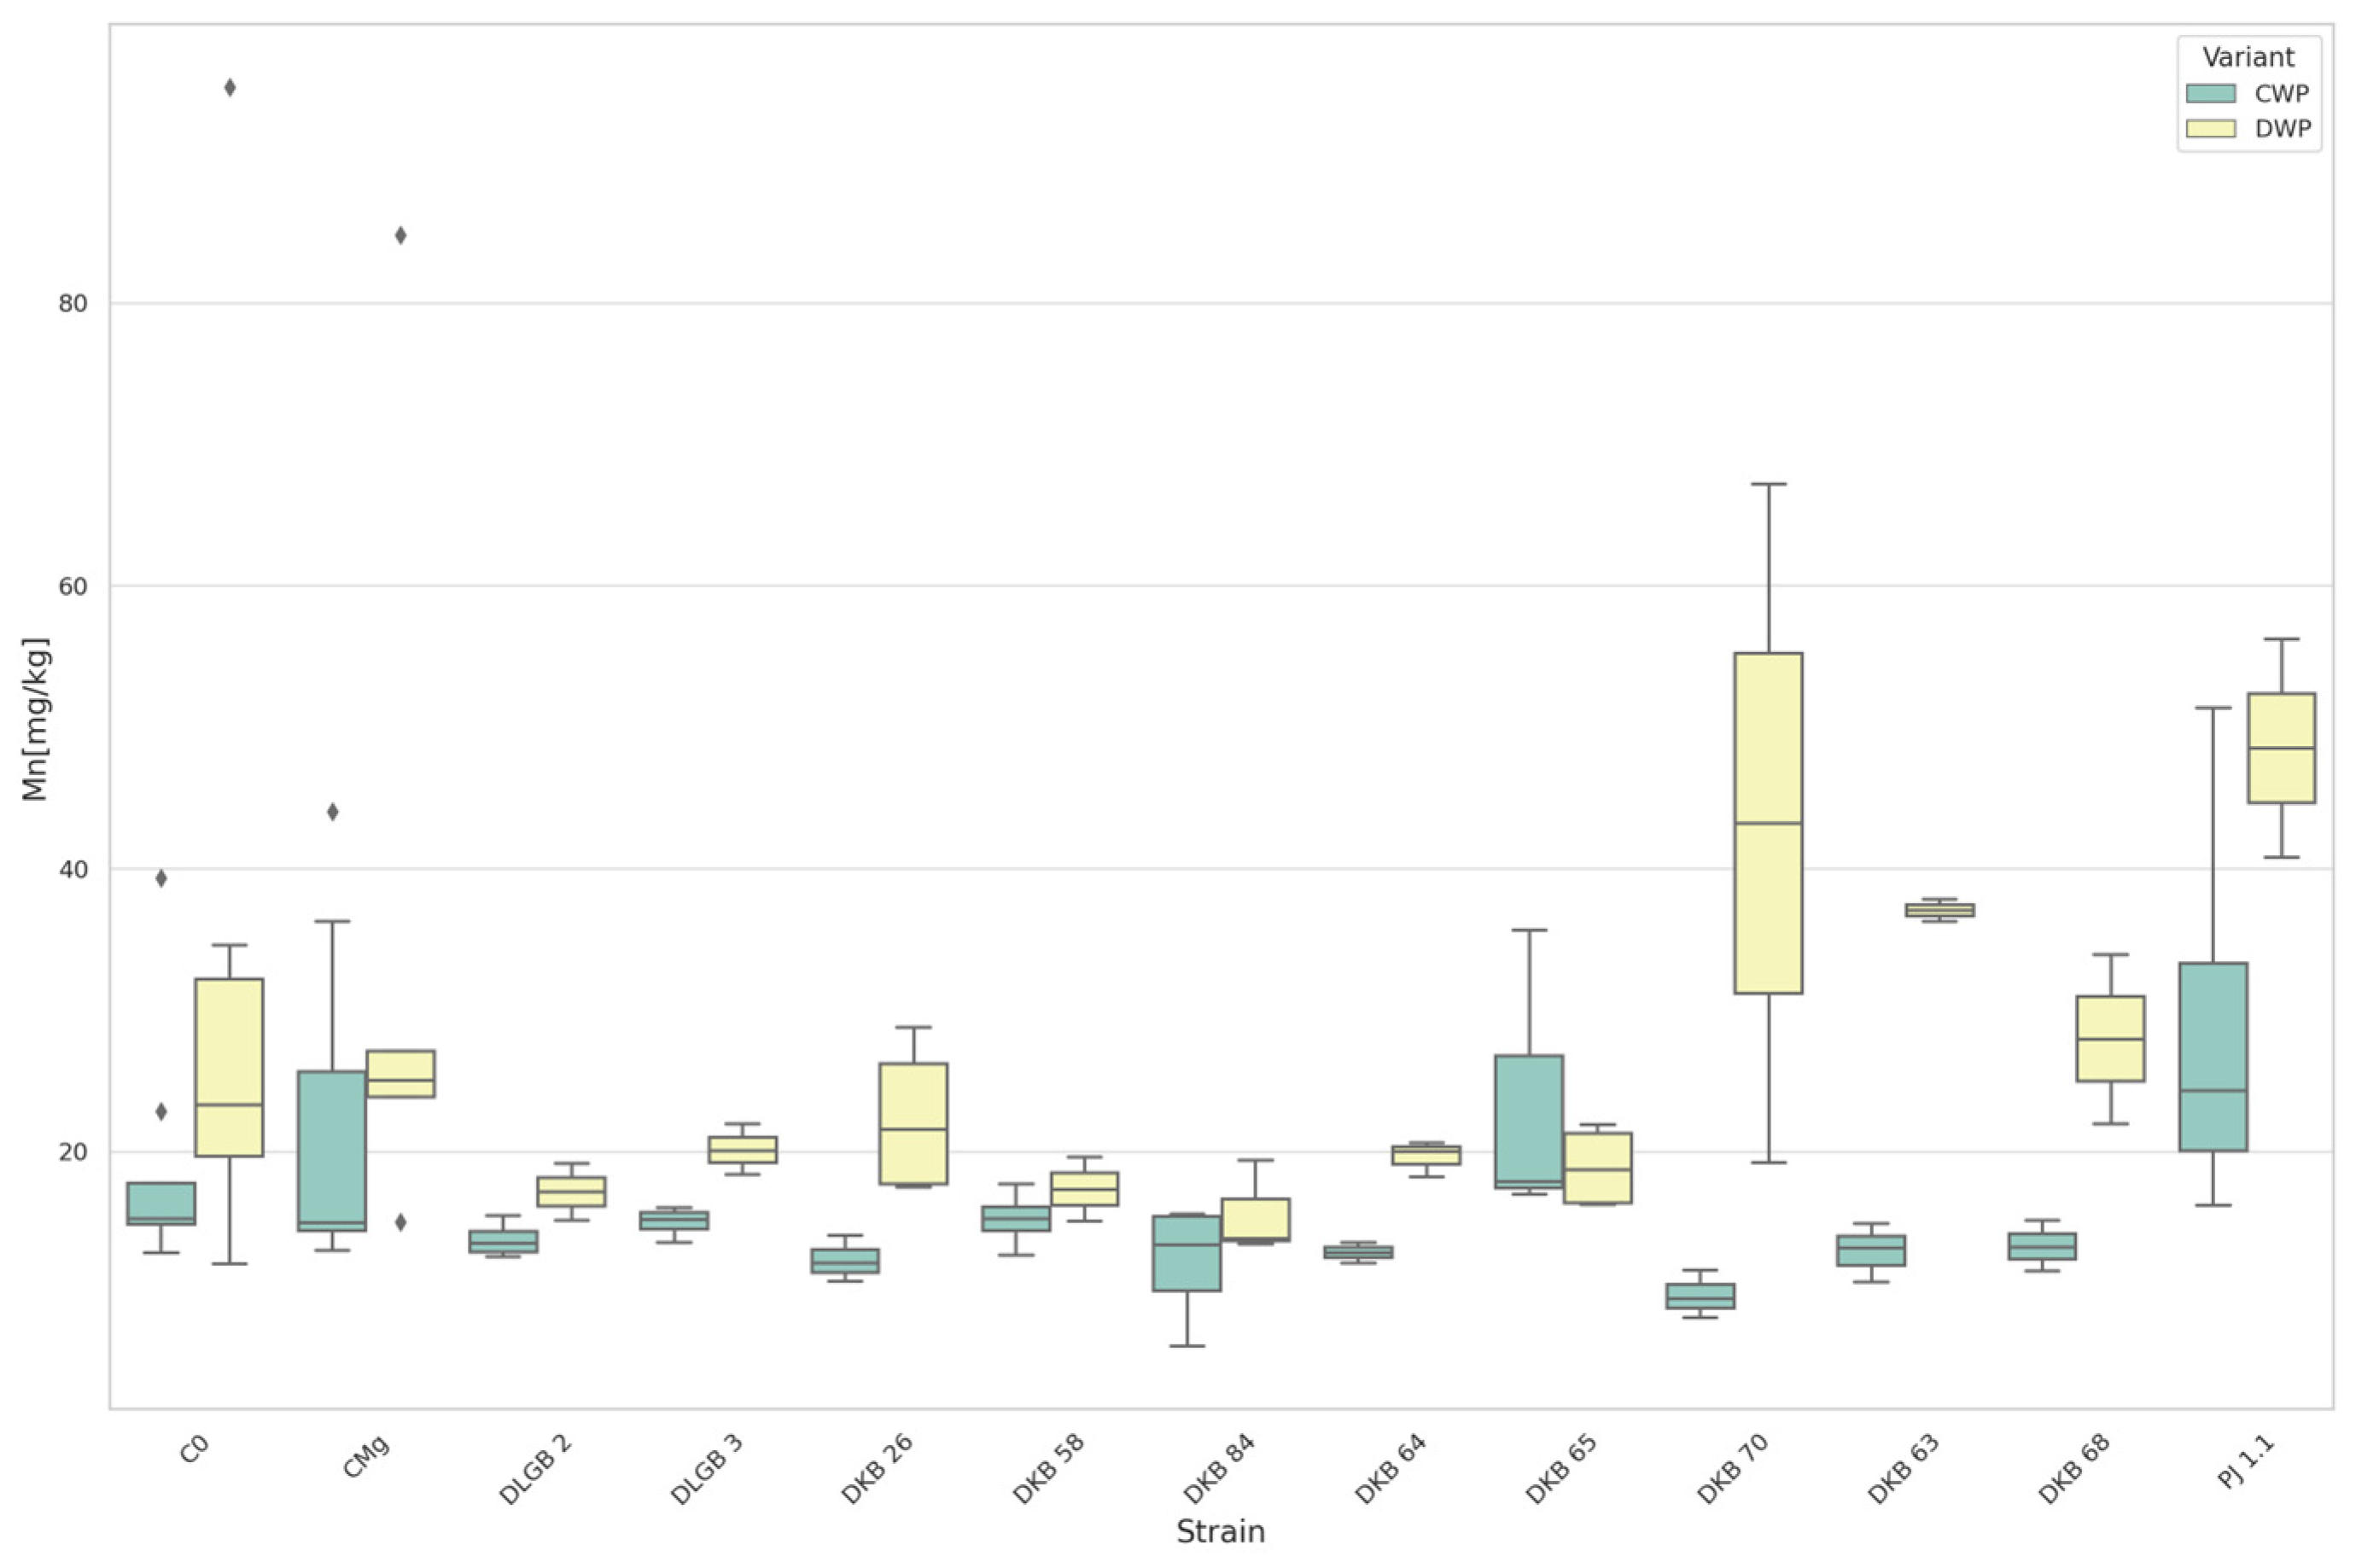
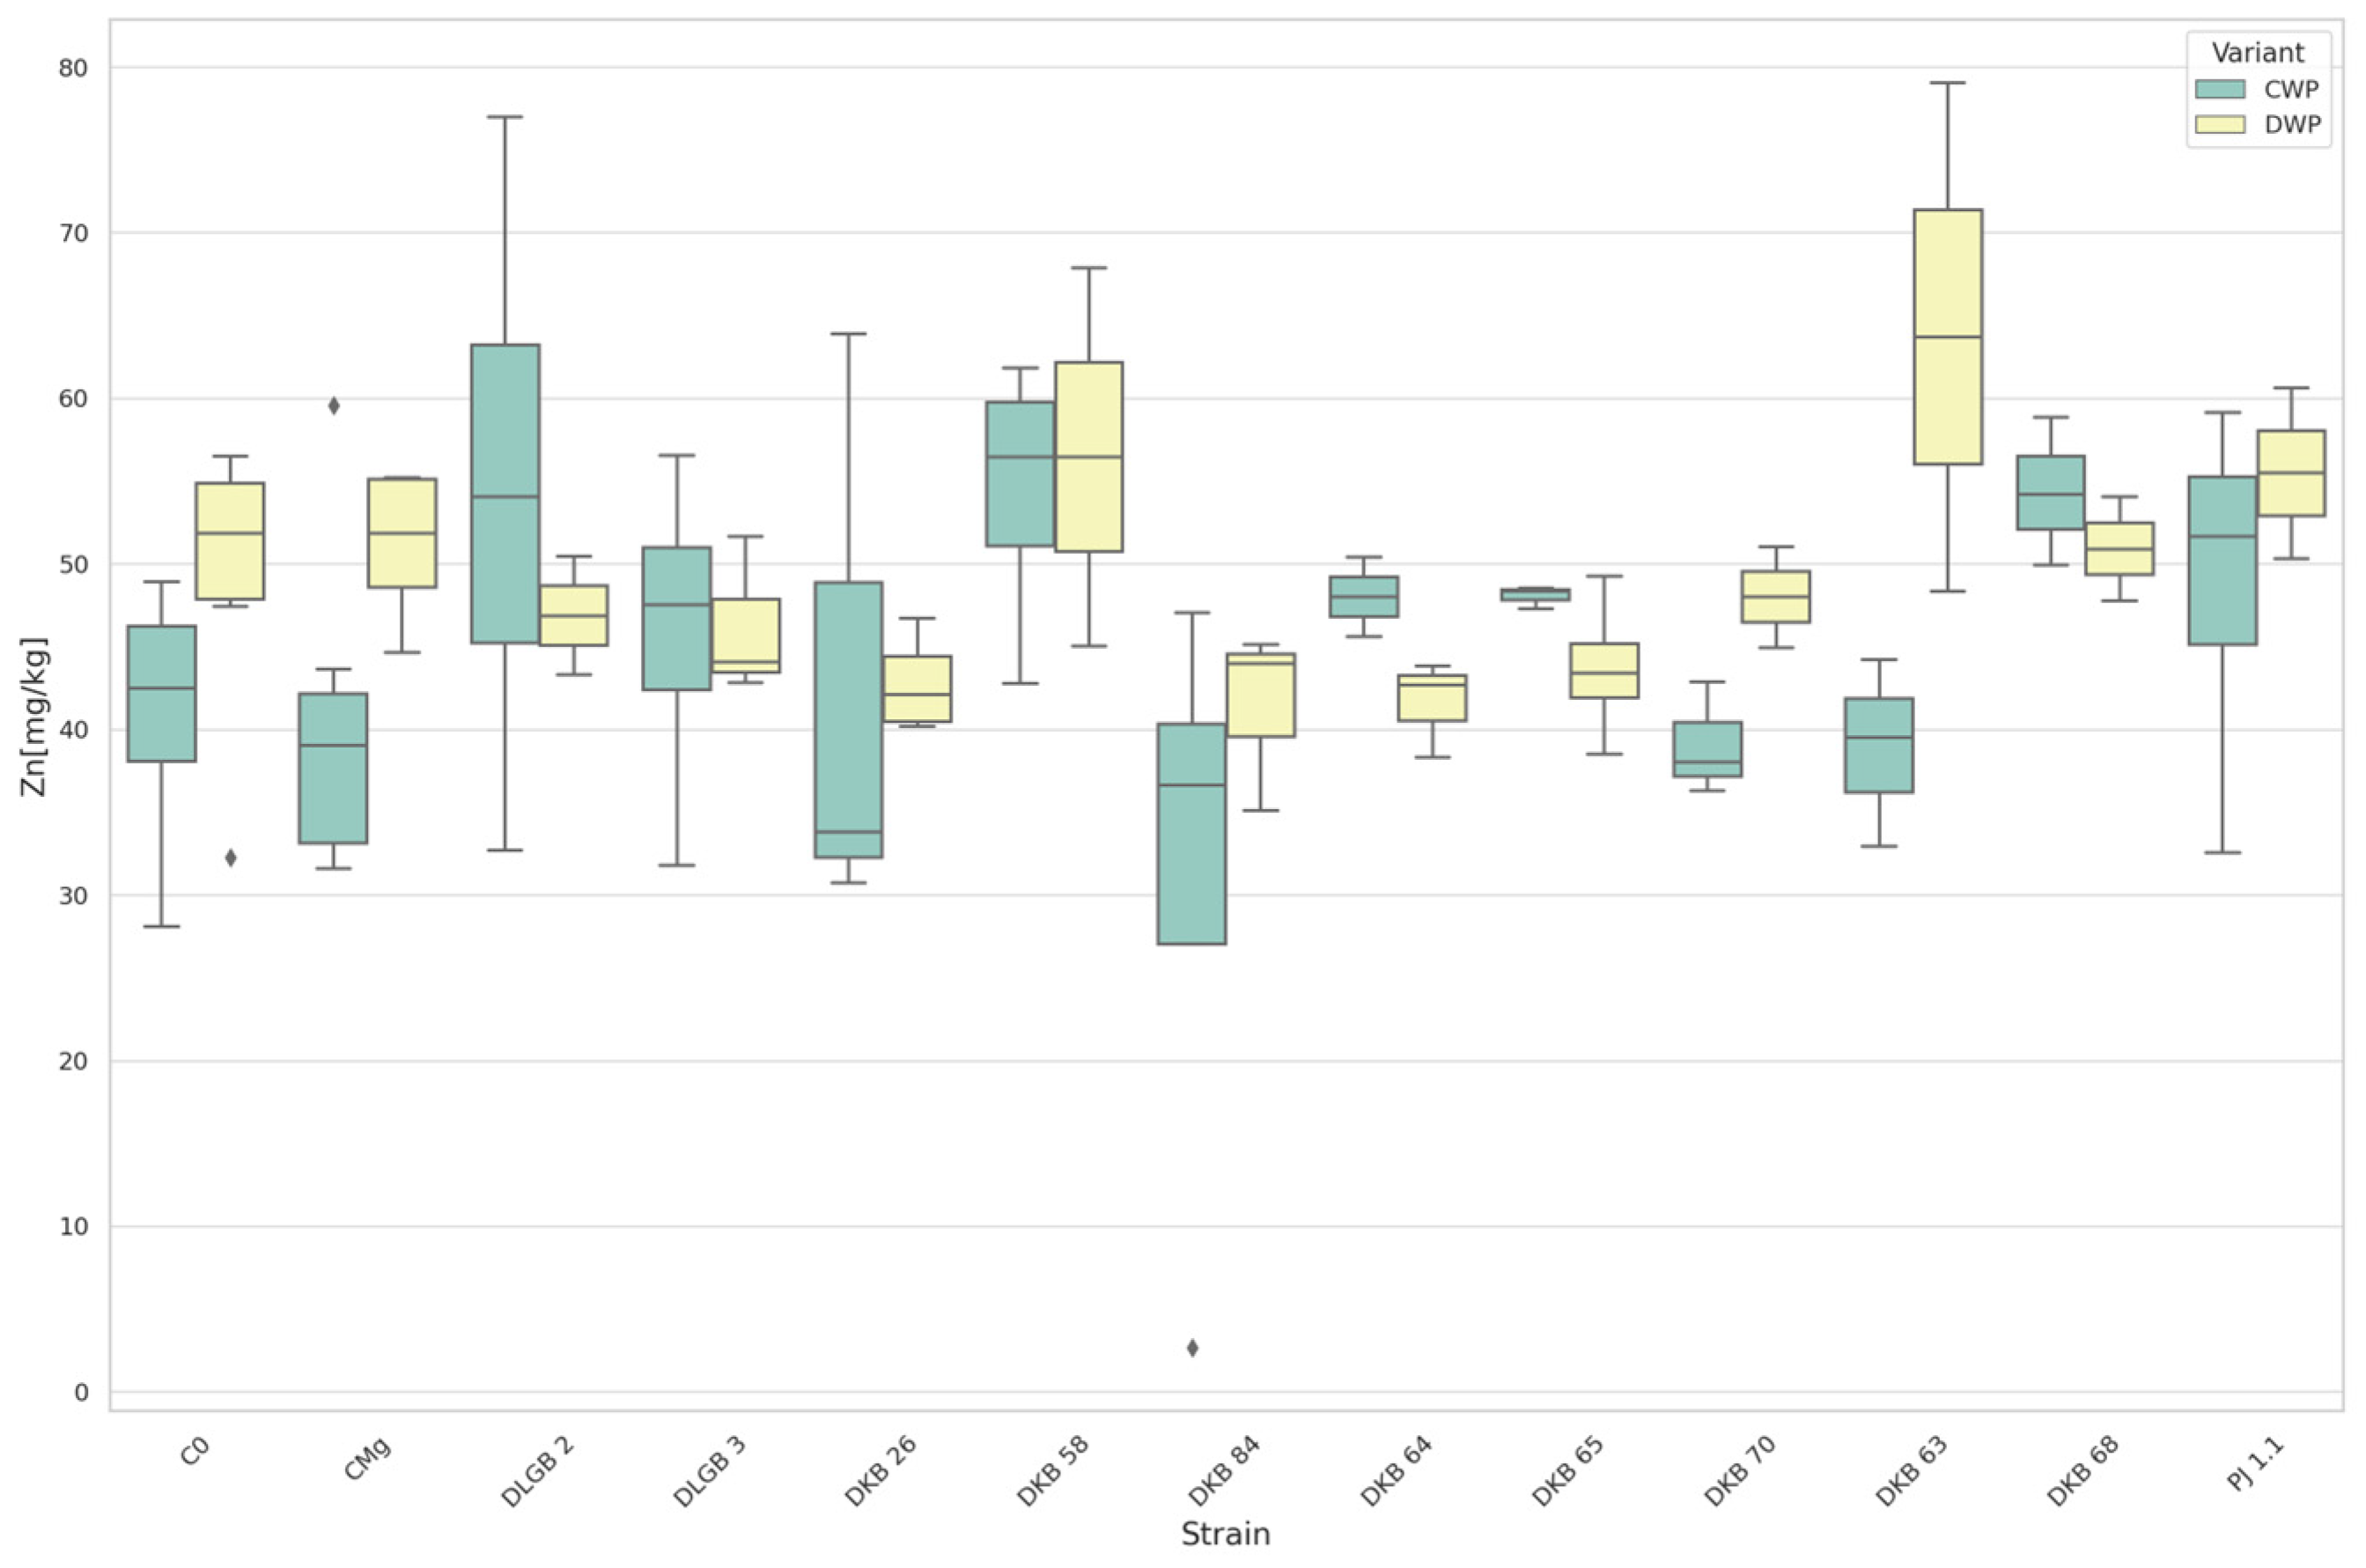
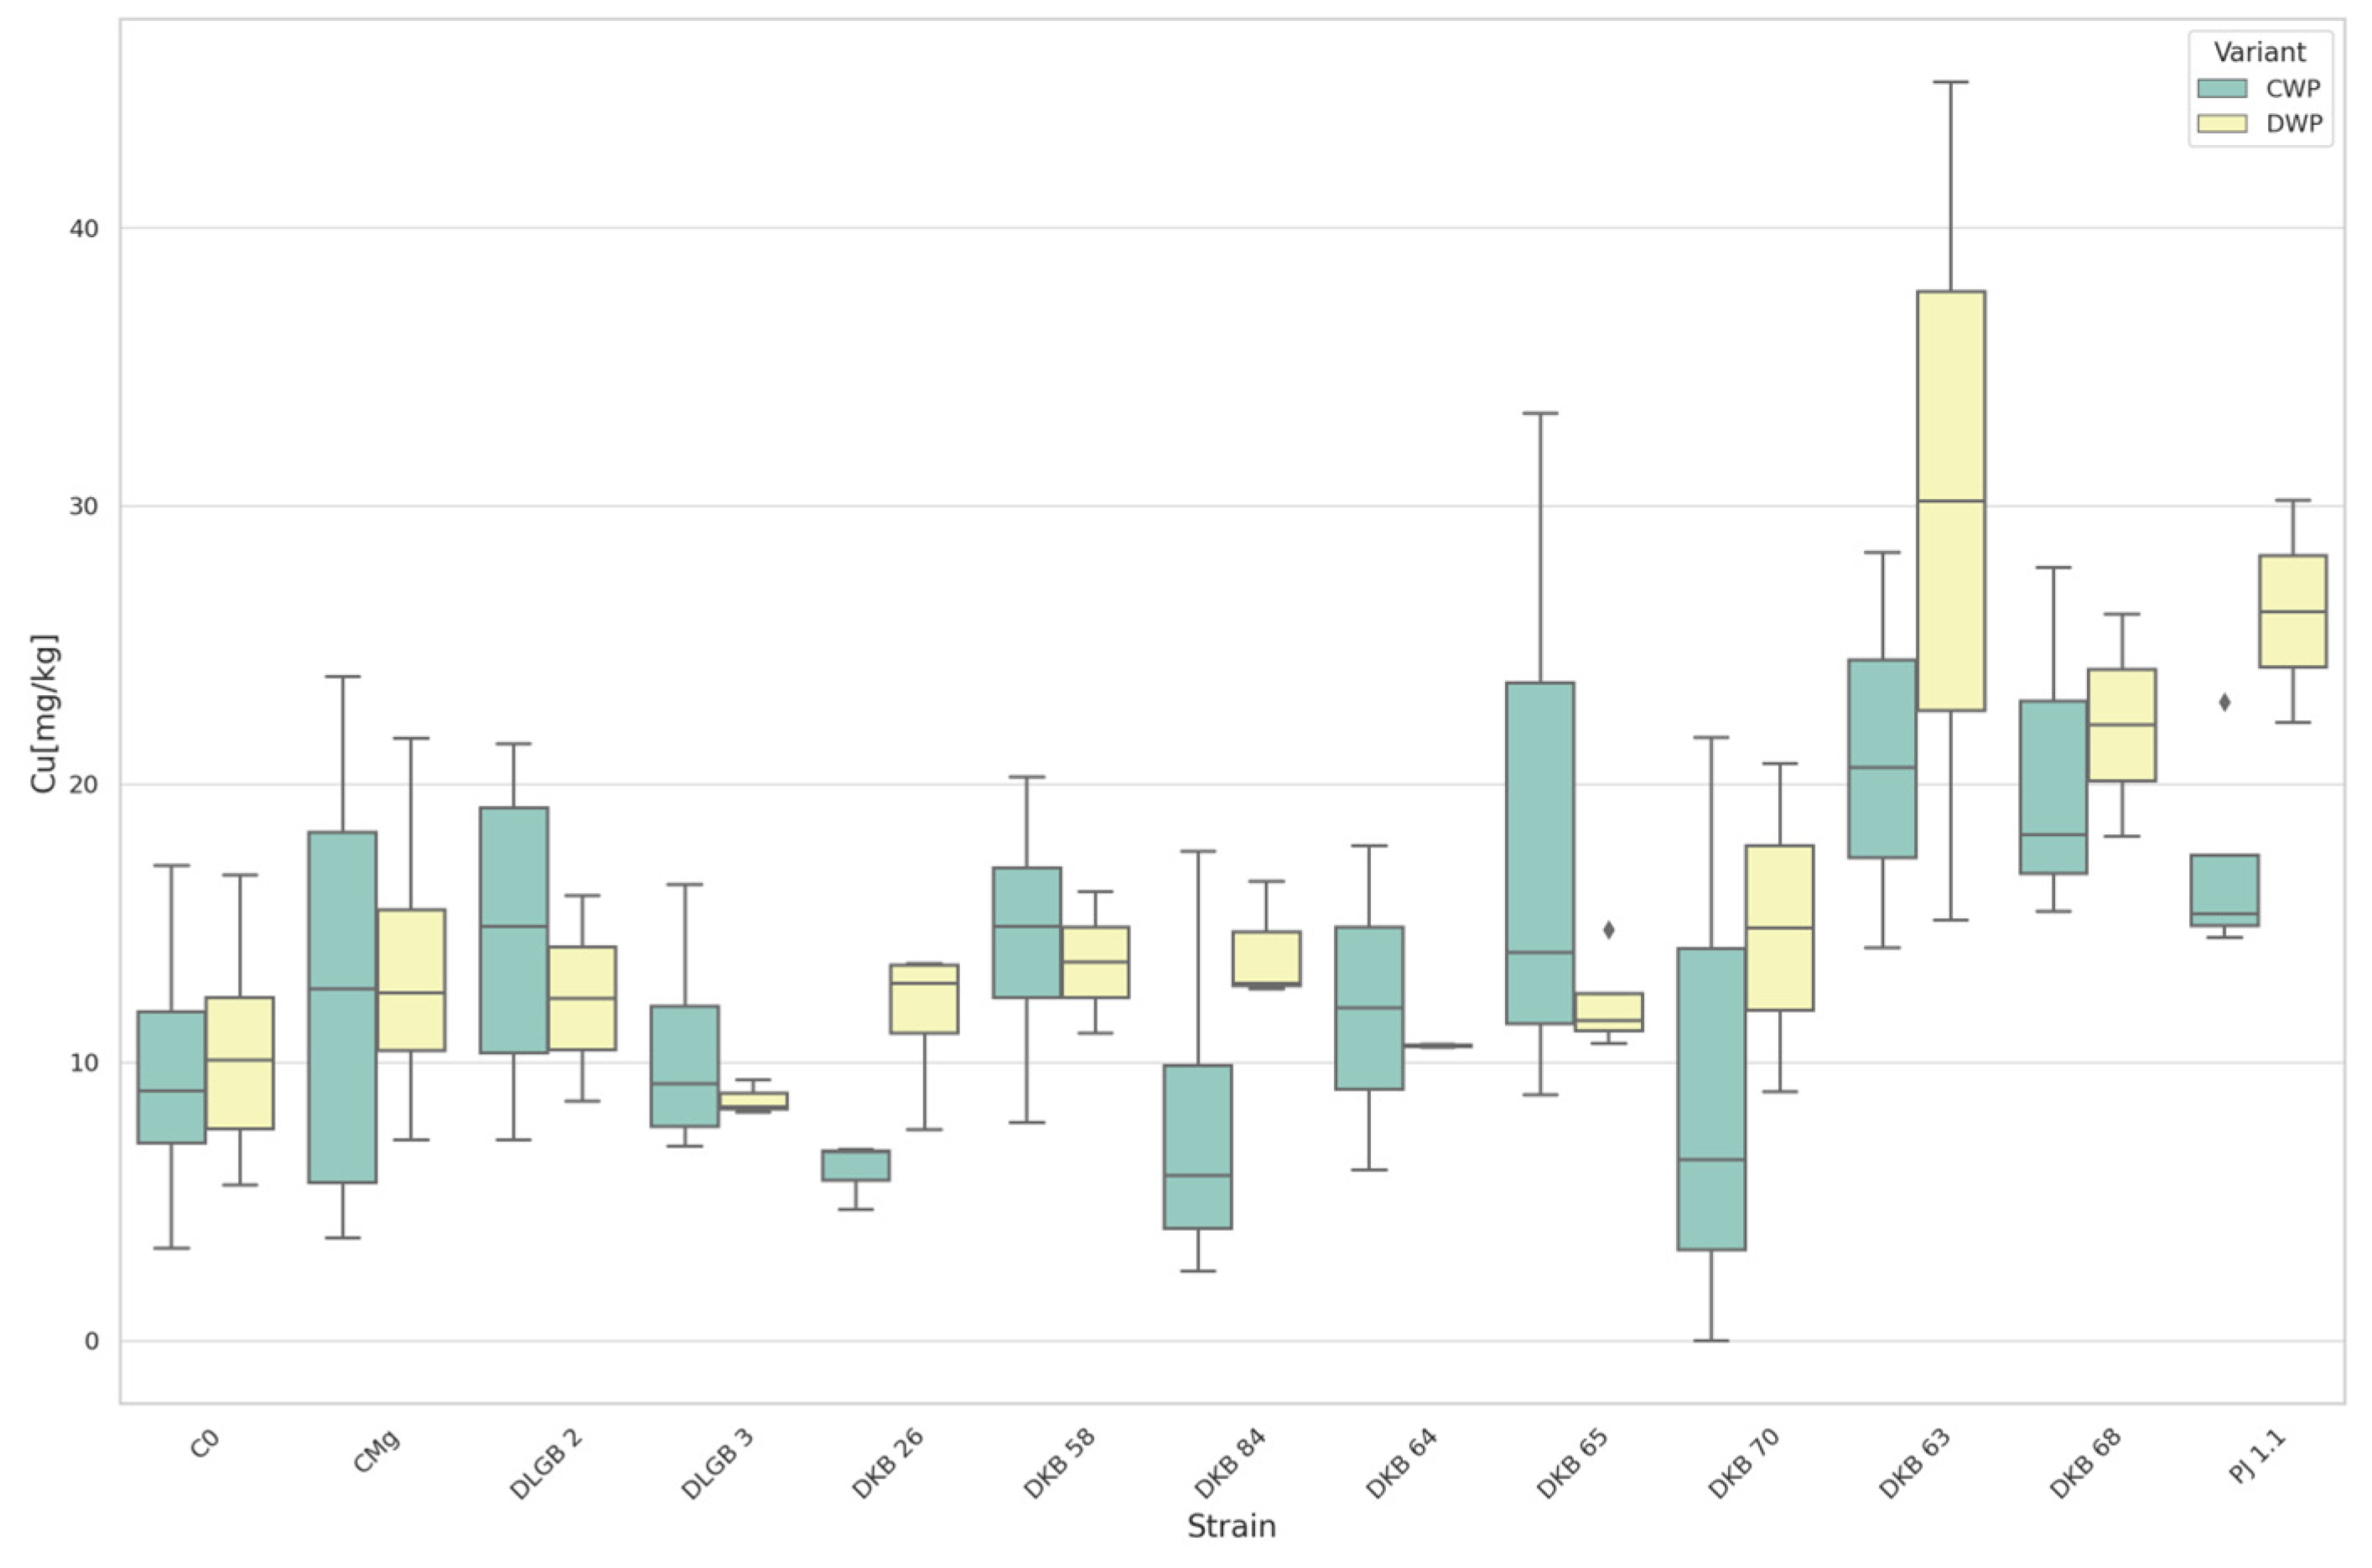
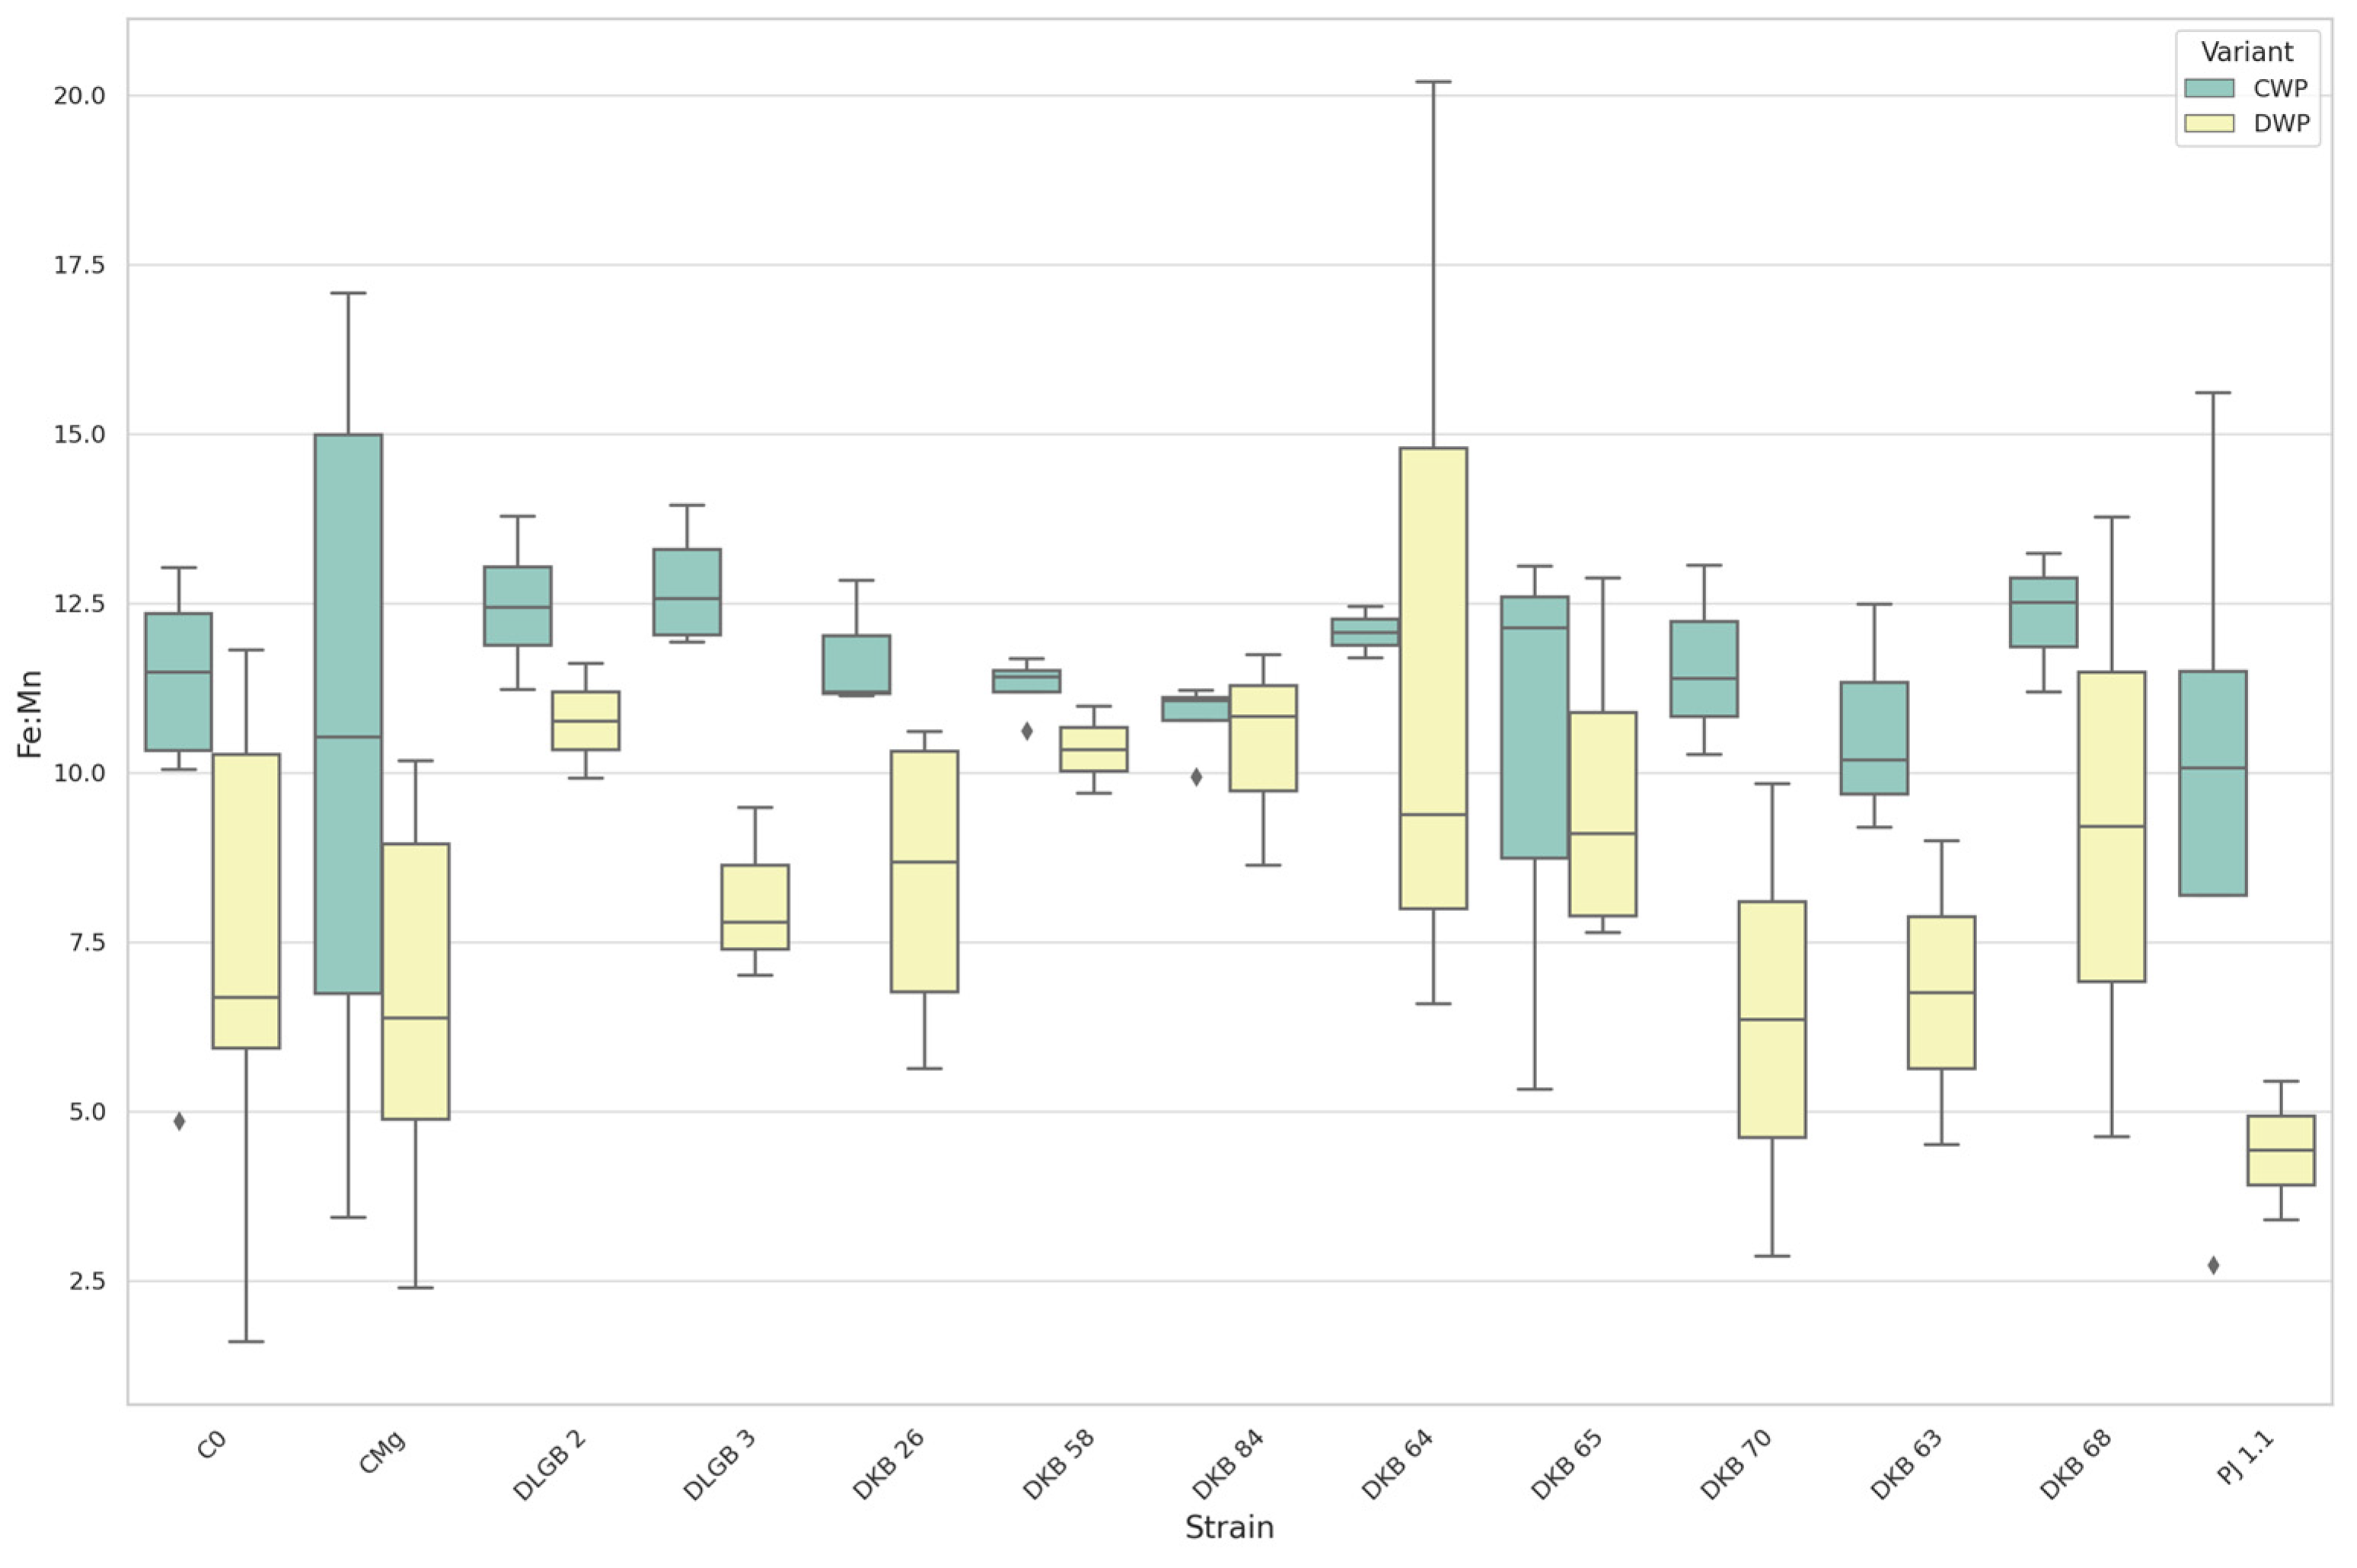
3.3. The Content of Micronutrients in the Substrate

The iron mean value in the optimal moisture conditions (CWP) was 1715 mg·kg−1 with SD 166.1 and CV 9.68%. In the water deficit conditions (DWP), we observed a mean of 1579 mg·kg−1 with SD 82.8 and CV 5.25%. The maximum value was observed in CWP for the DLGB2 strain and DWP at inoculation with the DLGB3 strain. The minimum value was observed in CWP for the DKB68 strain, and DWP in the C0 variant (Figure 8, Table 1).
For the available forms of manganese, the mean value in the optimal moisture conditions (CWP) was 167.9 mg·kg−1 with SD 21.07 and CV 12.55%. In the water deficiency conditions (DWP), it was recorded at 153.2 mg·kg−1 with SD 21.73 and CV 14.18%. The highest value in the CWP variant was recorded after inoculation with the DLGB2 strain and for DWP with the DKB58 strain. The minimum value was observed in CWP after inoculation with the DKB65 strain and for DWP with the DLGB2 strain (Figure 9).
The mean value of zinc content in the CWP variant was 33.6 mg·kg−1 with SD 21.4 and CV 63.64%. In the DWP variant, we recorded a mean of 21.6 mg·kg−1 with SD 6.7 and CV 30.80%. The maximum value was observed in the CWP variant after inoculation with the DKB63 strain and for DWP in the CMg variant. The lowest value was observed in the CWP variant with the DKB63 strain and for the DWP variant with the PJ1.1 strain (Figure 10).
For the available forms of copper, the mean value in the optimal moisture conditions (CWP) was 37.9 mg·kg−1 with SD 6.65 and CV 17.52%. Under the water deficiency conditions (DWP), we recorded a mean of 31.4 mg·kg−1 with SD 7.64 and CV 24.33%. The highest value in the CWP variant was recorded for the C0 variant, and DWP after inoculation with the DKB70 strain. The lowest value was observed in CWP with the PJ1.1 strain and for DWP with the DKB84 strain (Figure 11, Table 1).

3.4. Summary Analysis Effect Substrate

In our comprehensive analysis of the soil’s response to various treatments, ANOVA has unveiled distinct dependencies between the treatments and soil characteristics. Notably, the last column of our dataset, which denotes the direction of the effect, illustrates these relationships in detail (Table 1).

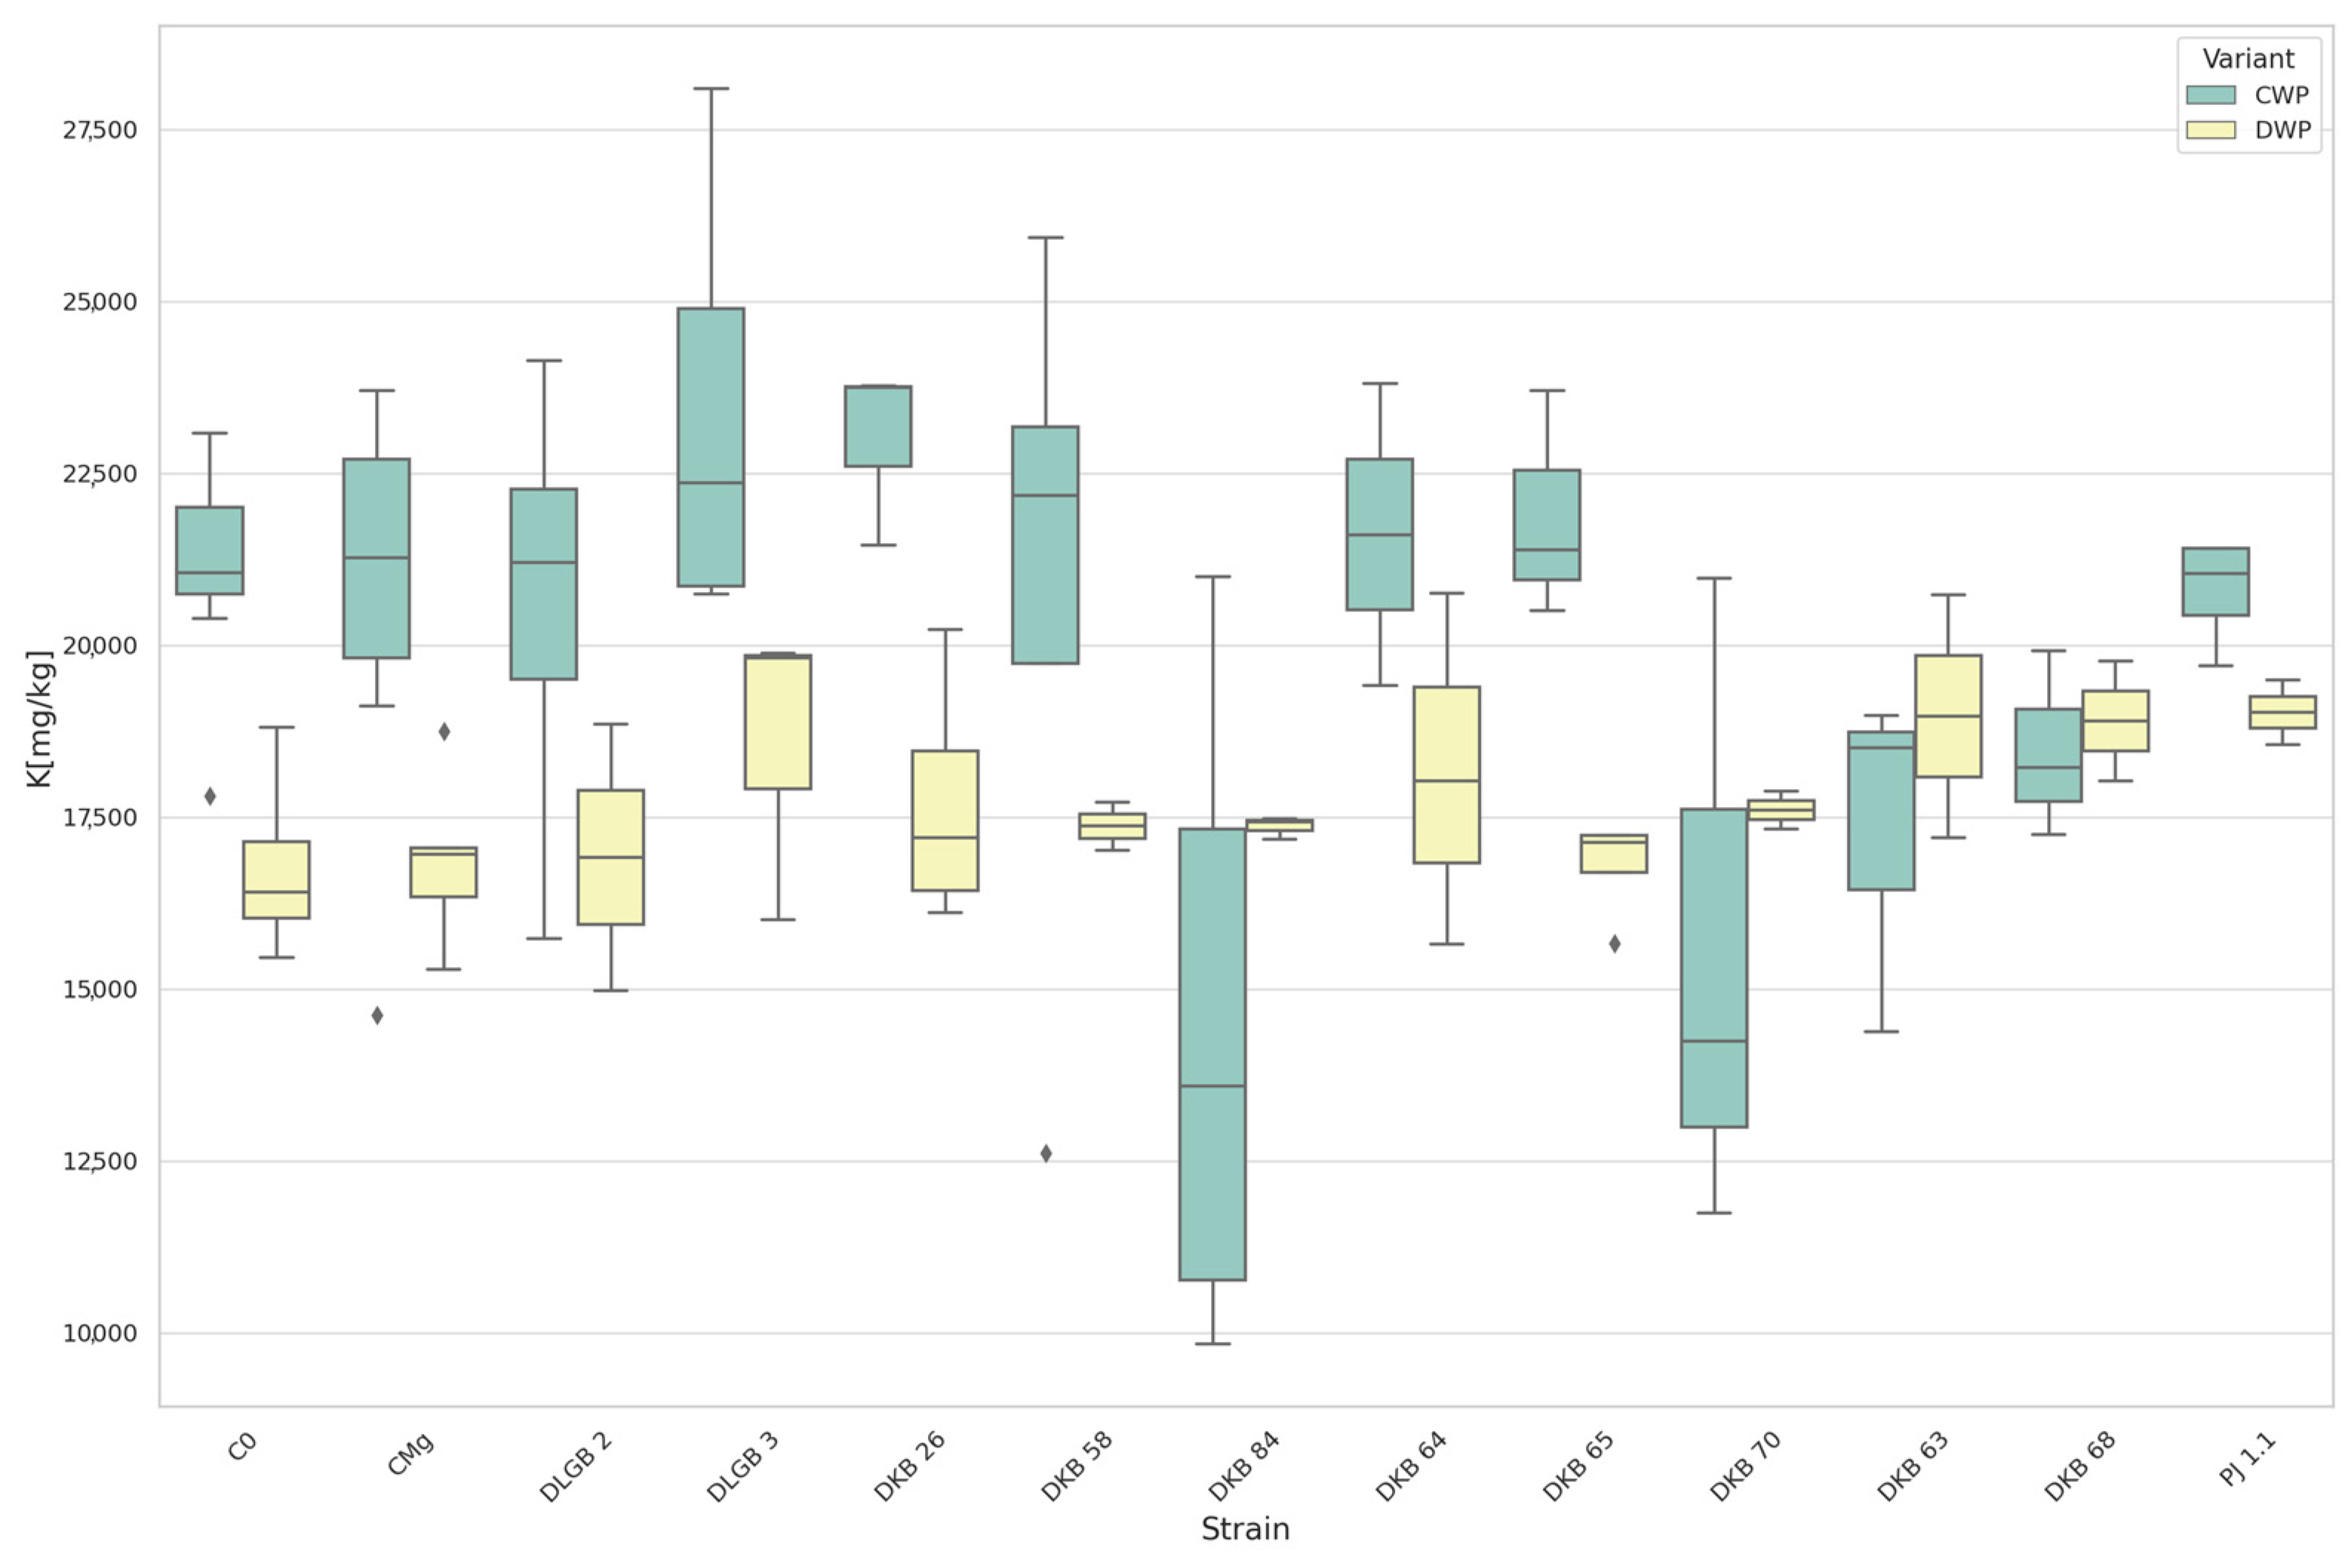
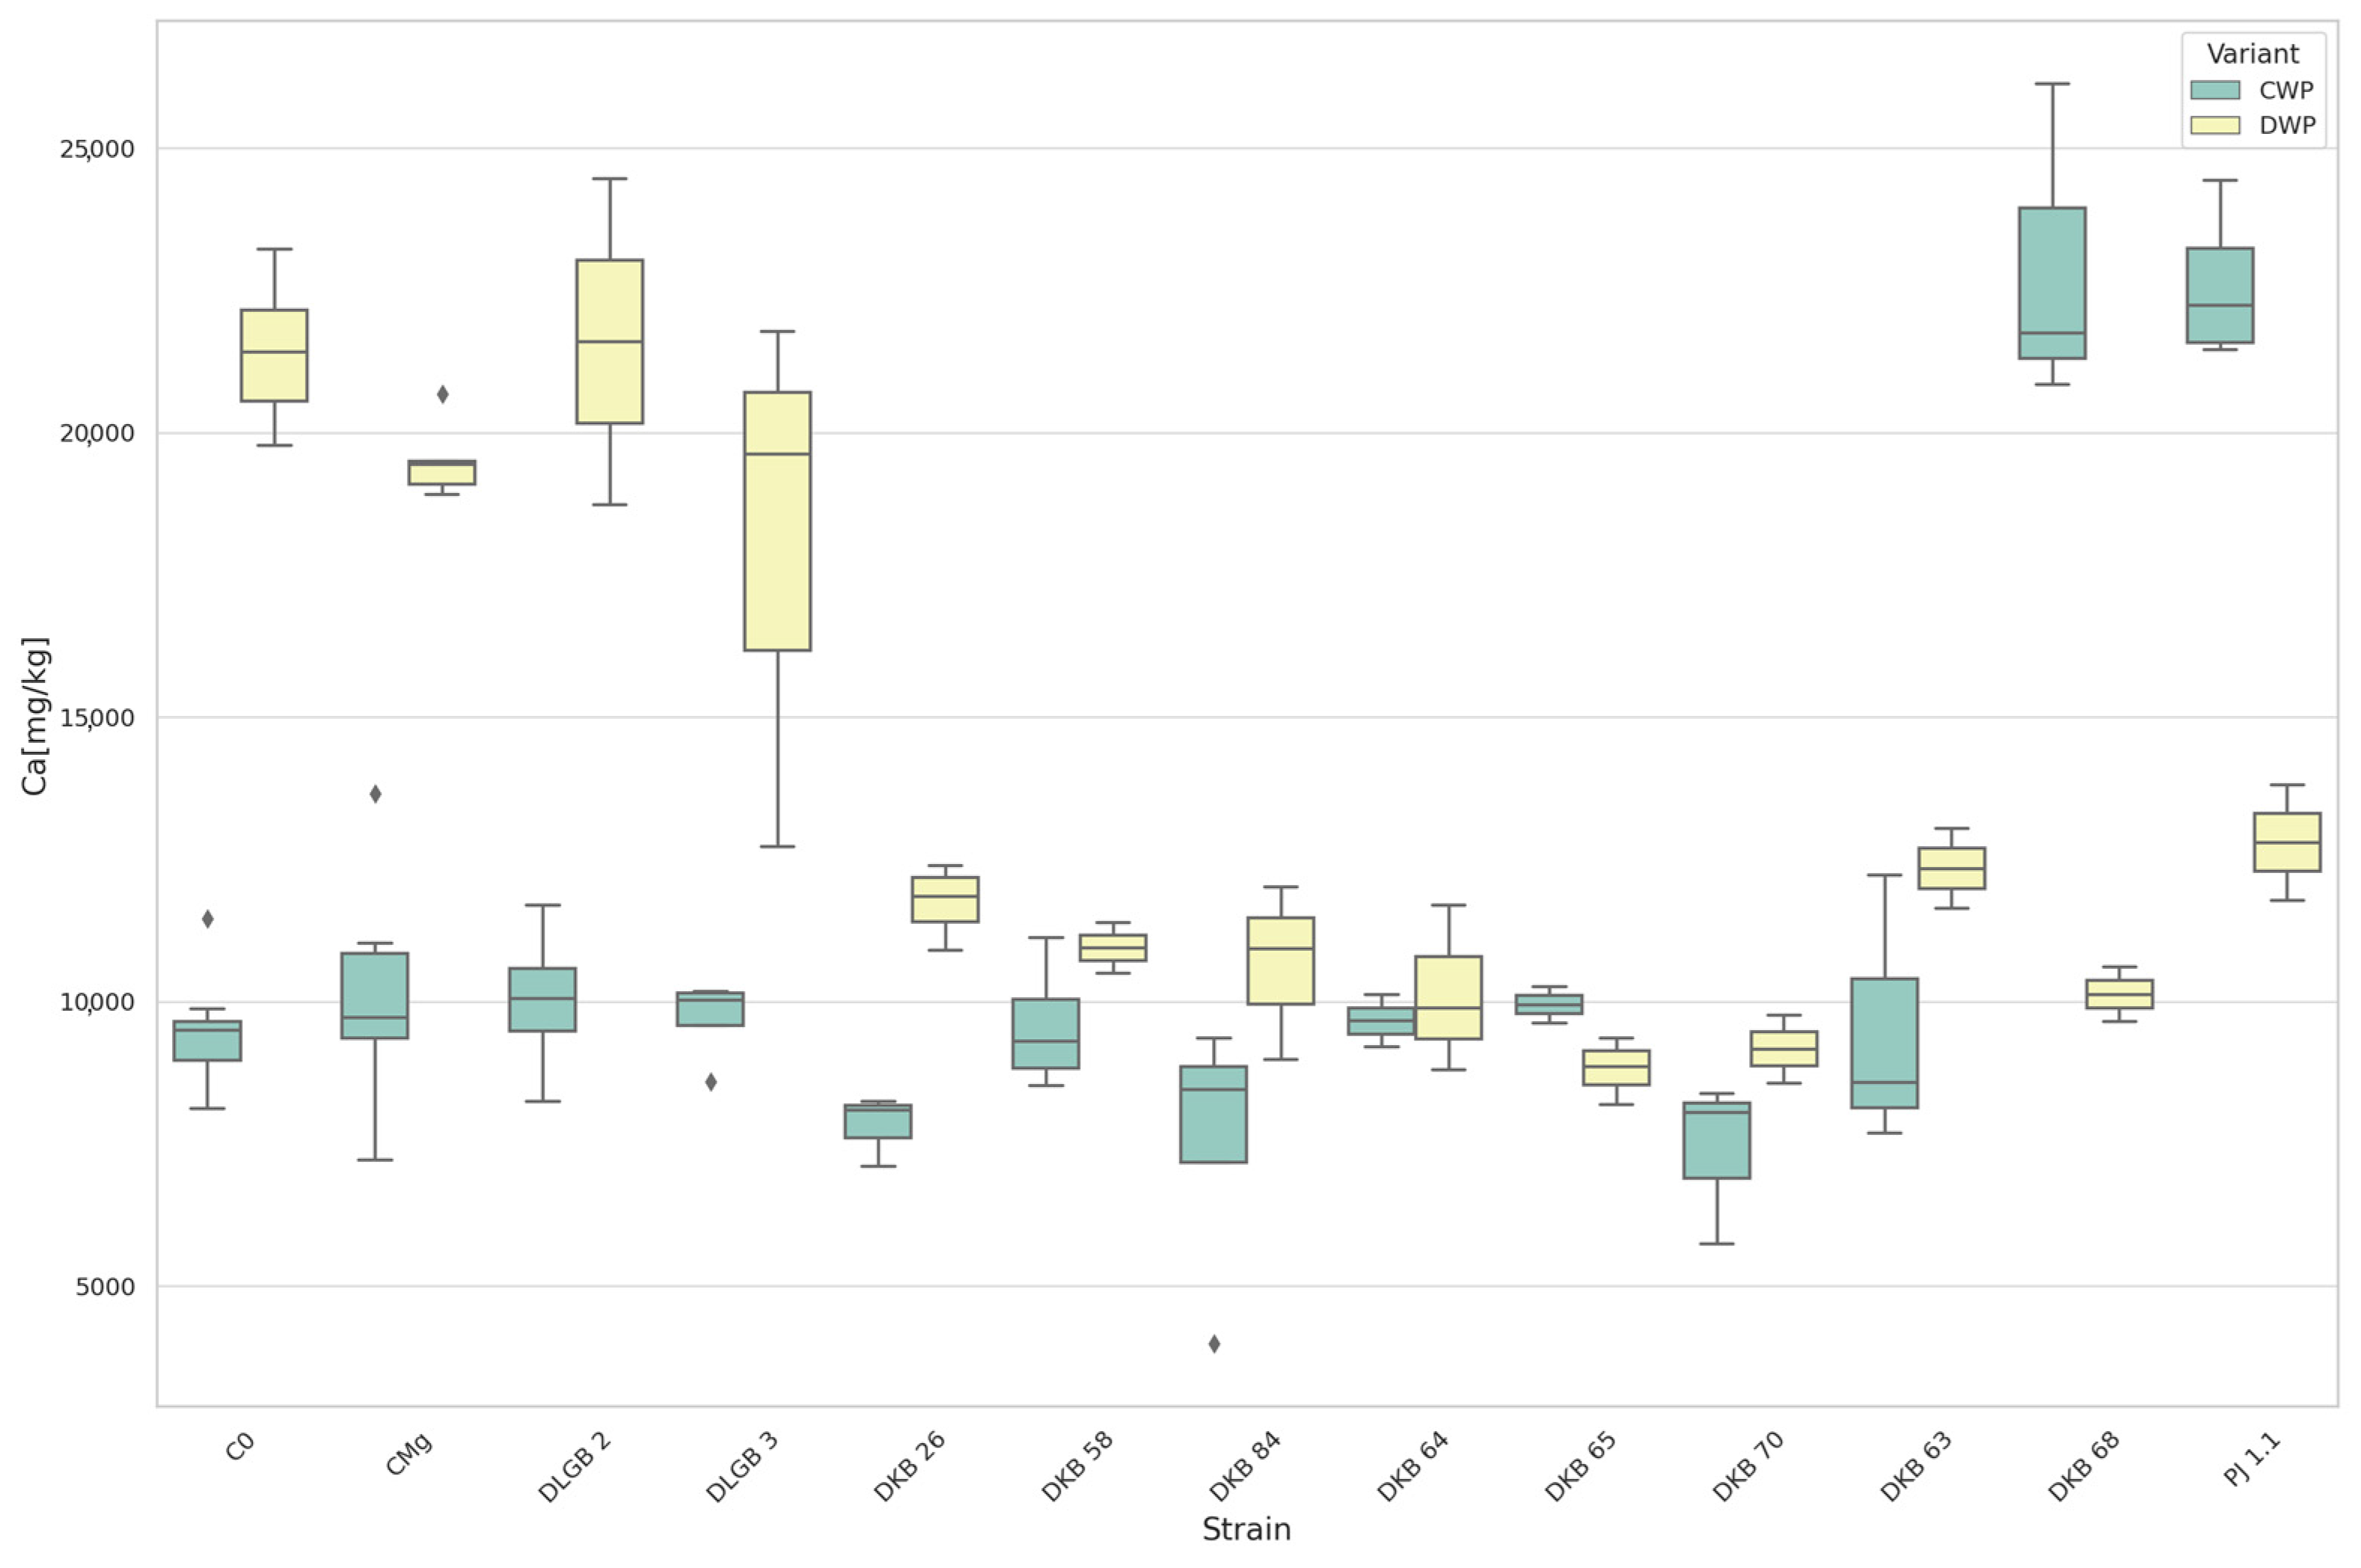
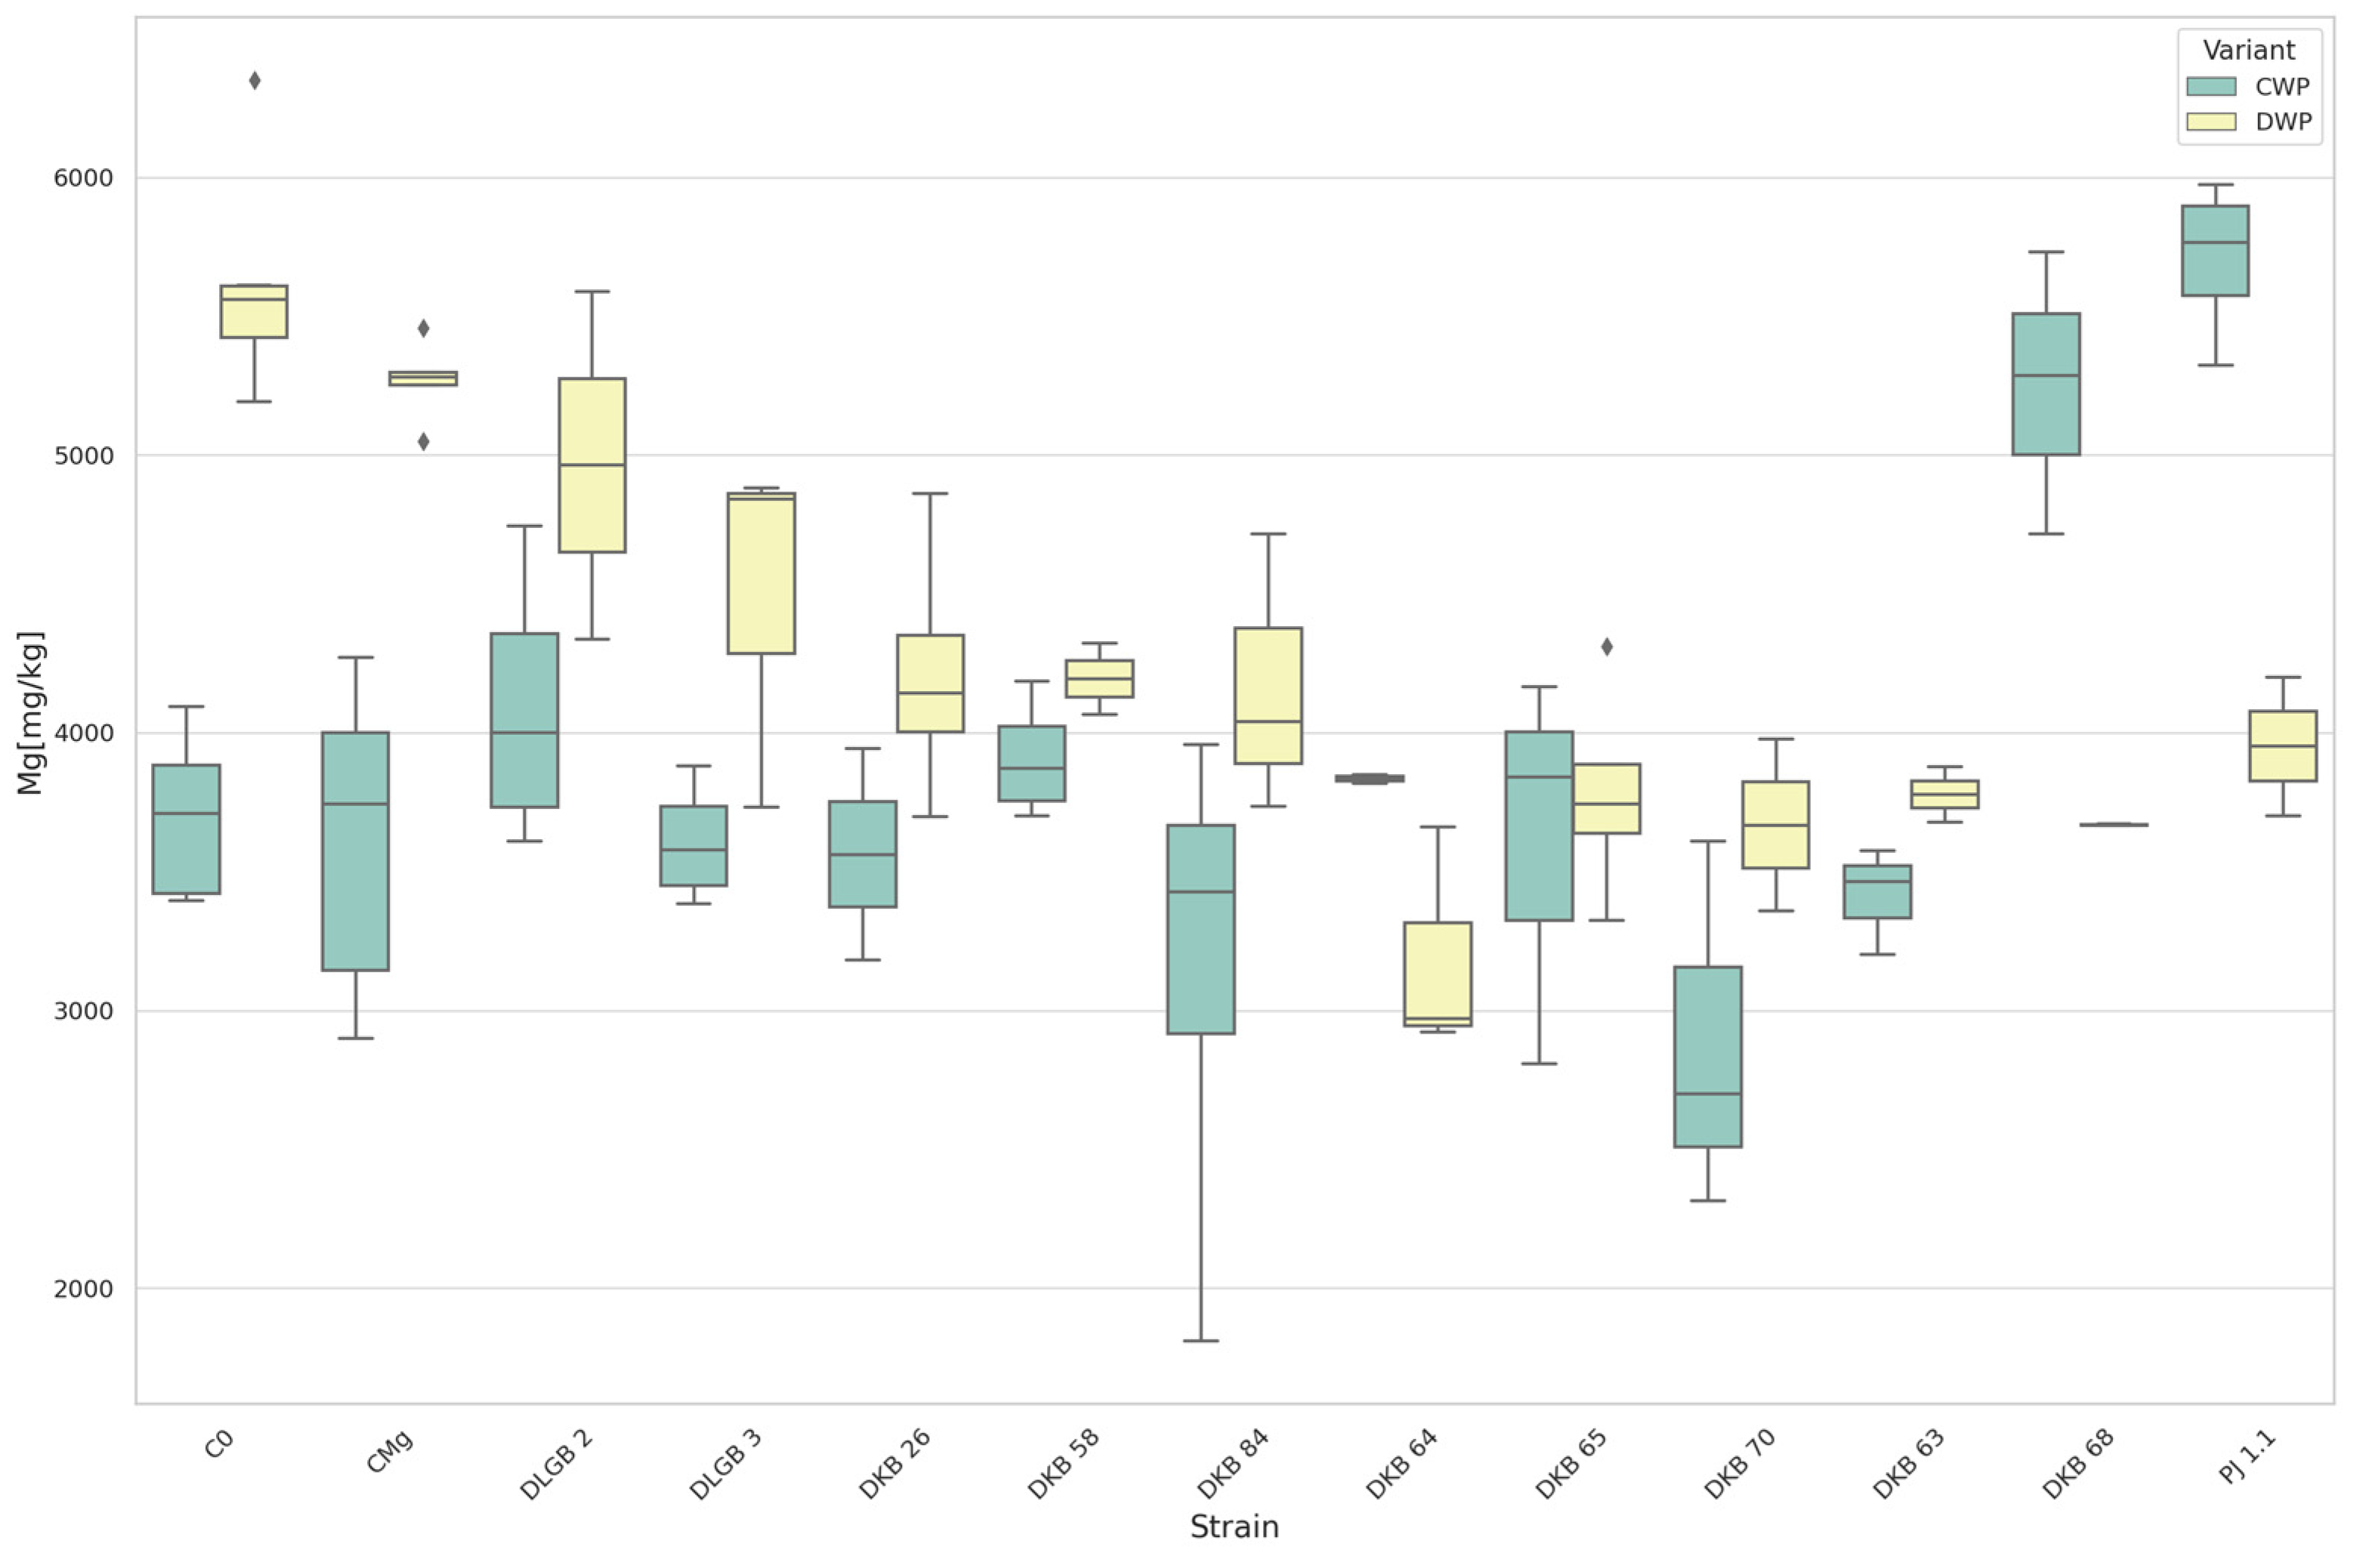
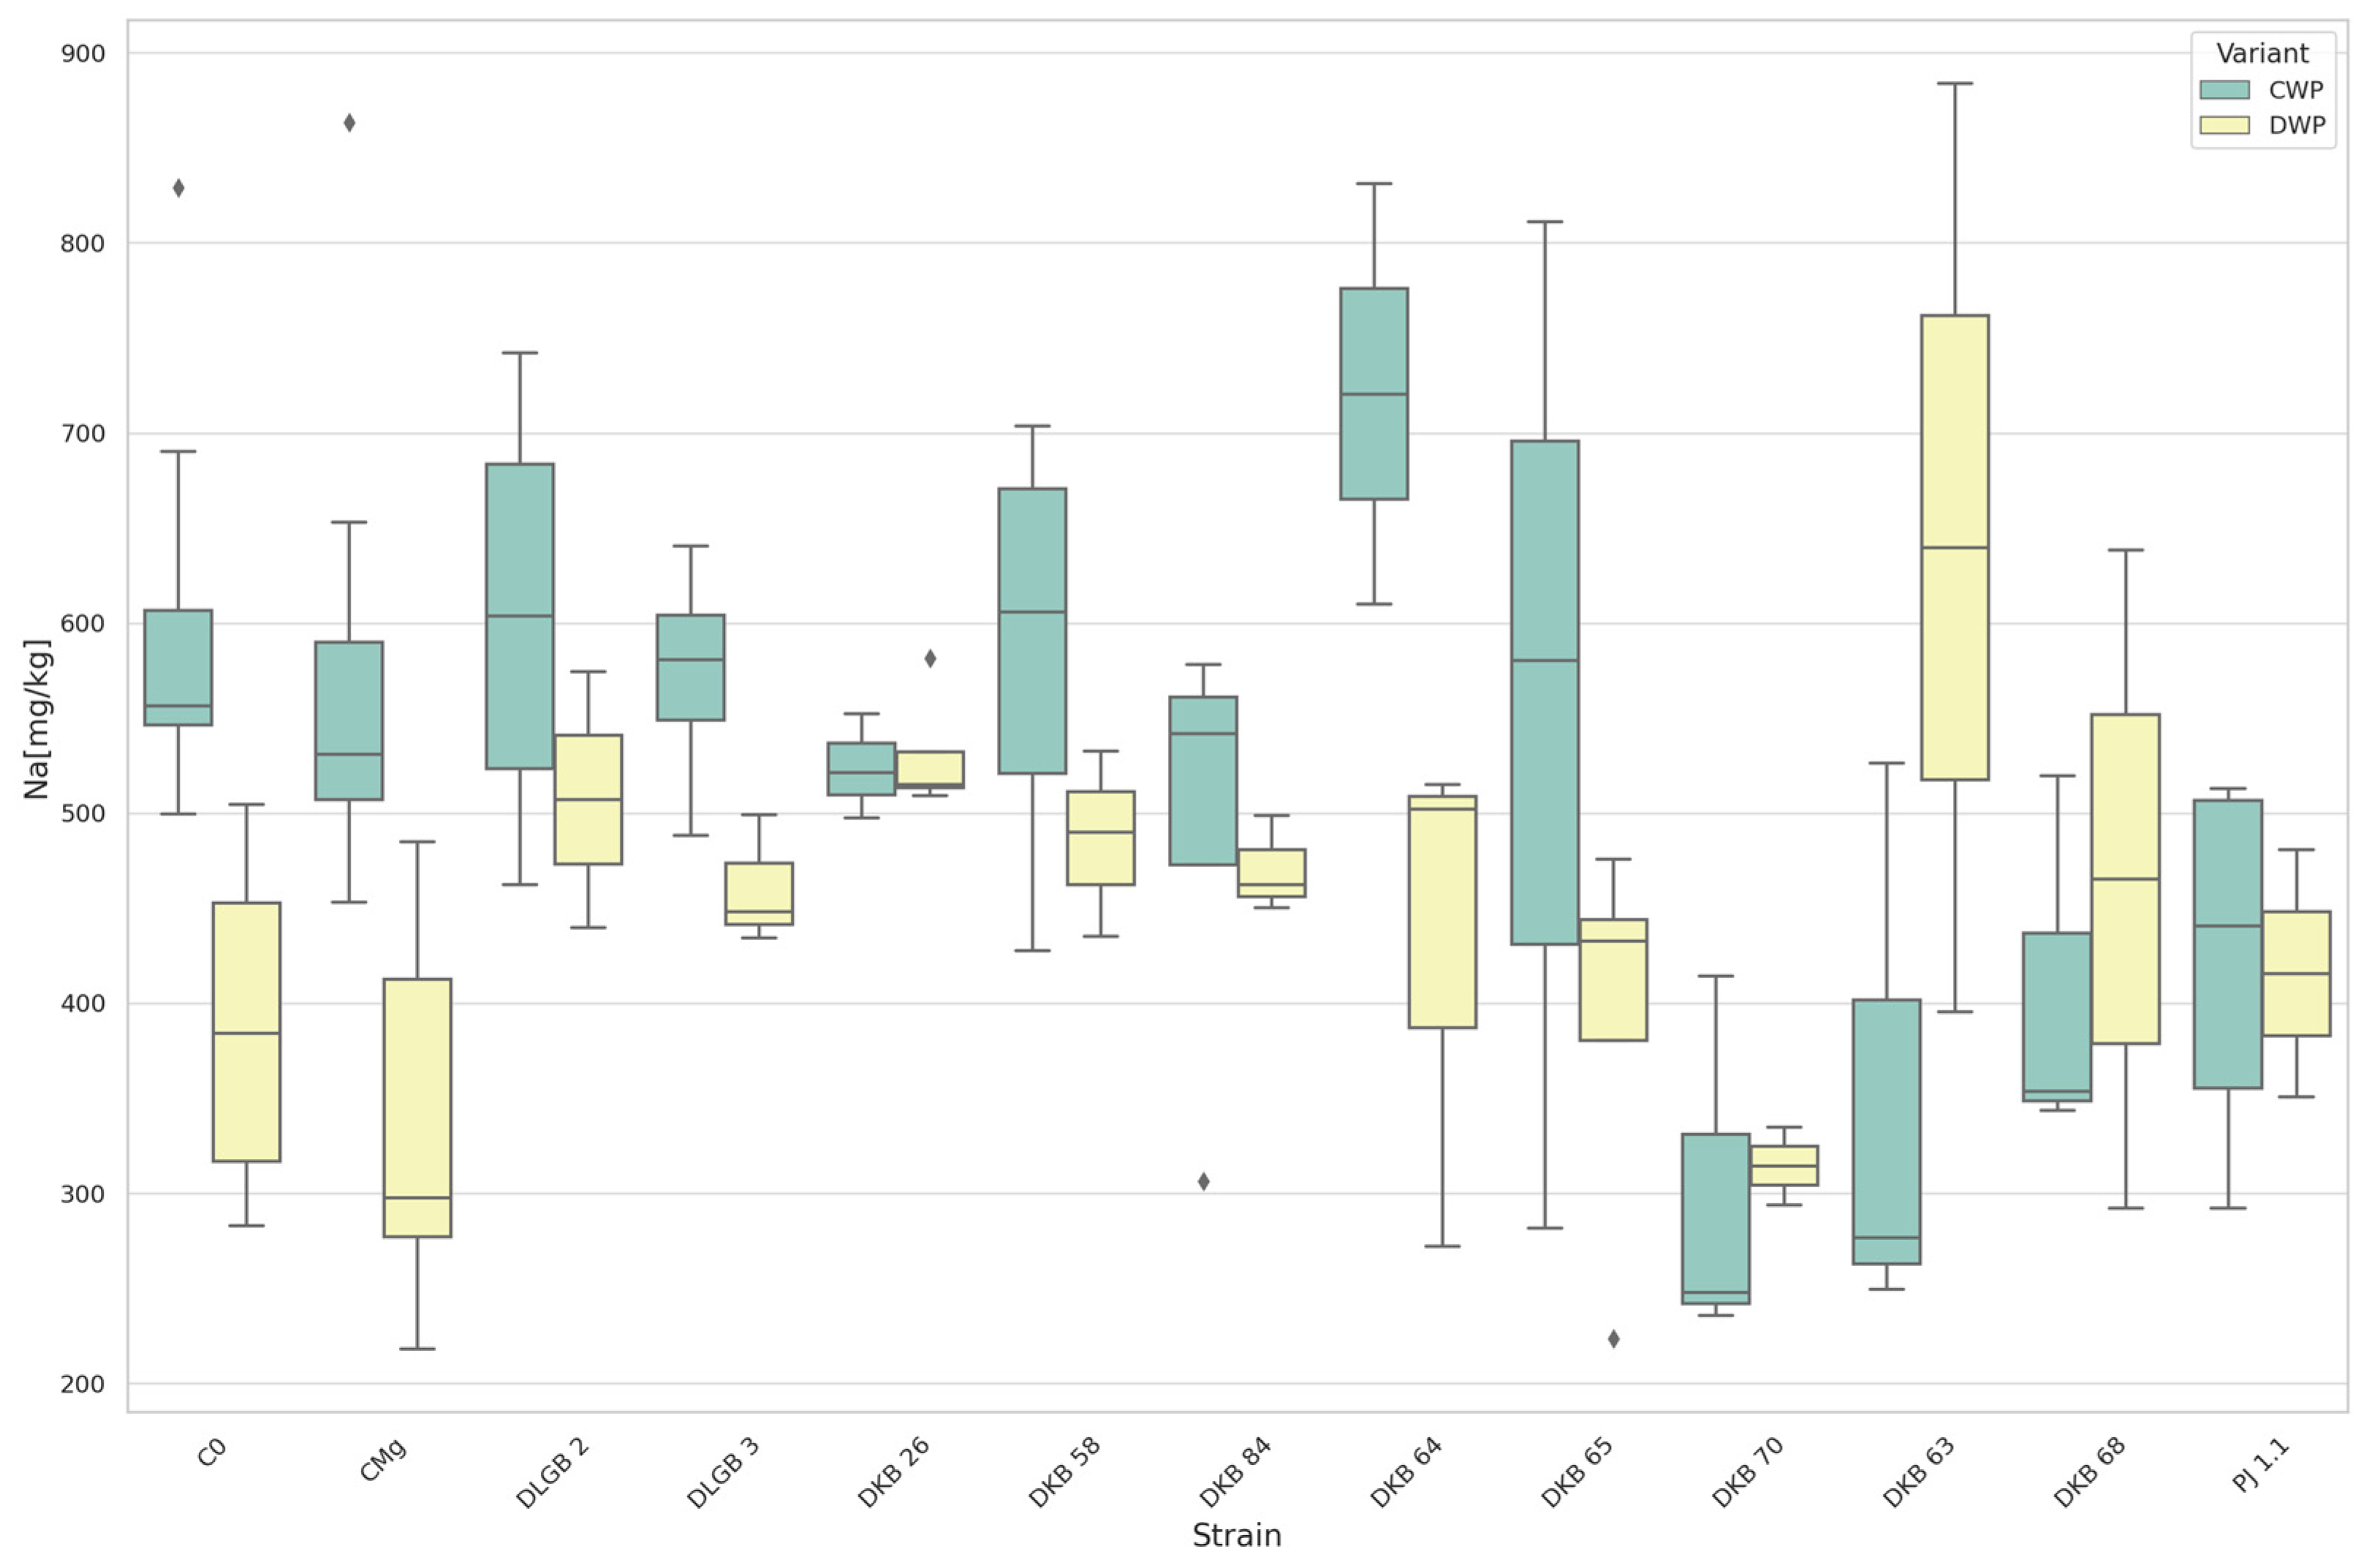
3.5. The Content of Macronutrients and Sodium in Strawberry Leaves

The average level of phosphorus content in leaves of strawberries in optimal moisture conditions (CWP) was 6530 mg·kg−1 with SD 2235 and CV 34.23%, and under water deficit, it was a mean of 10,149 mg·kg−1 with SD 853 and CV 8.40%. The maximum value was observed in CWP after inoculation with the DKB65 strain, and for DWP after inoculation with the DKB63 strain. The minimum value was observed in CWP for the DKB70 strain, and DWP in the DKB84 variant (Figure 12, Table 1).
For the potassium content in the leaves, the mean value in optimum moisture conditions (CWP) was 23,390 mg·kg−1 with SD 3445 and CV 14.73%. In water deficit conditions (DWP) we observed a mean of 19,022 mg·kg−1 with SD 466 and CV 2.45%. The highest value was recorded in CWP after inoculation with the DLGB3 strain and for DWP with the PJ1.1 strain. The minimum value was observed in CWP for the DKB84 strain, and DWP in the C0 variant (Figure 13).
The average level of content for the calcium mean value in the optimal moisture conditions (CWP) was 22,911 mg·kg−1 with SD 2827 and CV 12.34%, and under water deficit (DWP) it was a mean of 21,596 mg·kg−1 with SD 2864 and CV 13.26%. The maximum value was observed in CWP for the DKB68 strain, and DWP in the DLGB2 variant. The minimum value was observed in CWP after inoculation with DKB70 stain, and for DWP after inoculation with the DKB65 strain (Figure 14, Table 1).
For the magnesium content in the leaves of strawberries, the mean value in the optimal moisture conditions (CWP) was 5707 mg·kg−1 with SD 286.6 and CV 5.02%. In water deficit conditions (DWP), we observed a mean of 5610 mg·kg−1 with SD 395.1 and CV 7.04%. The maximum value was observed in CWP after inoculation with the PJ1.1 strain and for DWP in the C0 variant. The minimum value was observed in CWP for the DKB70 strain, and DWP after inoculation with the DKB64 strain (Figure 15, Table 1).
The average level of sodium content in leaves of strawberries in the optimal moisture conditions (CWP) was 720.5 mg·kg−1 with SD 110.7 and CV 15.37%. In the water deficit conditions (DWP), we recorded a mean of 639.8 mg·kg−1 with SD 244.25 and CV 38.18%. The maximum value was observed in CWP for the DKB64 strain, and in DWP for the DKB63 strain. The lowest values, both for the CWP variant and DWP variant, were observed after inoculation with the DKB70 strain (Figure 16, Table 1).

3.6. The Content of Micronutrients in Strawberry Leaves

For the iron content in leaves, the mean value in the optimal moisture conditions (CWP) was 236.0 mg·kg−1 with SD 130.58 and CV 55.33%. In water deficit conditions (DWP), we observed a mean of 248.6 mg·kg−1 with SD 77.85 and CV 31.32%. The maximum value was recorded in CWP after inoculation with the PJ1.1 strain and for DWP in the DKB63 variant. The minimum value was observed in CWP for the DKB70 strain, and in DWP for the DKB84 variant (Figure 17).
For the manganese content in leaves, the mean value in the optimal moisture conditions (CWP) was 29.05 mg·kg−1 with SD 15.56 and CV 53.58%. In the water deficit conditions (DWP), it was recorded at 48.52 mg·kg−1 with SD 7.72 and CV 15.90%. The maximum values, both for the CWP variant and the DWP variant, were observed after inoculation with the PJ1.1 strain. The minimum value was observed in CWP for the DKB70 strain, and in DWP for the DKB84 strain (Figure 18).
The average level of zinc content in the leaves of strawberries in the optimal moisture conditions (CWP) was 54.43 mg·kg−1 with SD 18.47 and CV 33.92%. In the water deficit conditions (DWP), it was recorded at 63.70 mg·kg−1 with SD 15.36 and CV 24.11%. The maximum value was observed in CWP for the DLGB2 strain, and in DWP for the DKB63 strain. The minimum values, both for the CWP and DWP variants, were observed after inoculation with the DKB84 strain (Figure 19).
The average level of content for the copper mean value in the optimal moisture conditions (CWP) was 21.00 mg·kg−1 with SD 7.12 and CV 33.92%. Under water deficit (DWP), the mean was 30.18 mg·kg−1 with SD 15.06 and CV 49.90%. The maximum value was observed in CWP for the DKB63 strain, and in DWP for the DKB63 strain. The minimum value was observed in CWP for the DKB26 strain, and DWP after inoculation with the DLGB3 strain (Figure 20, Table 1).

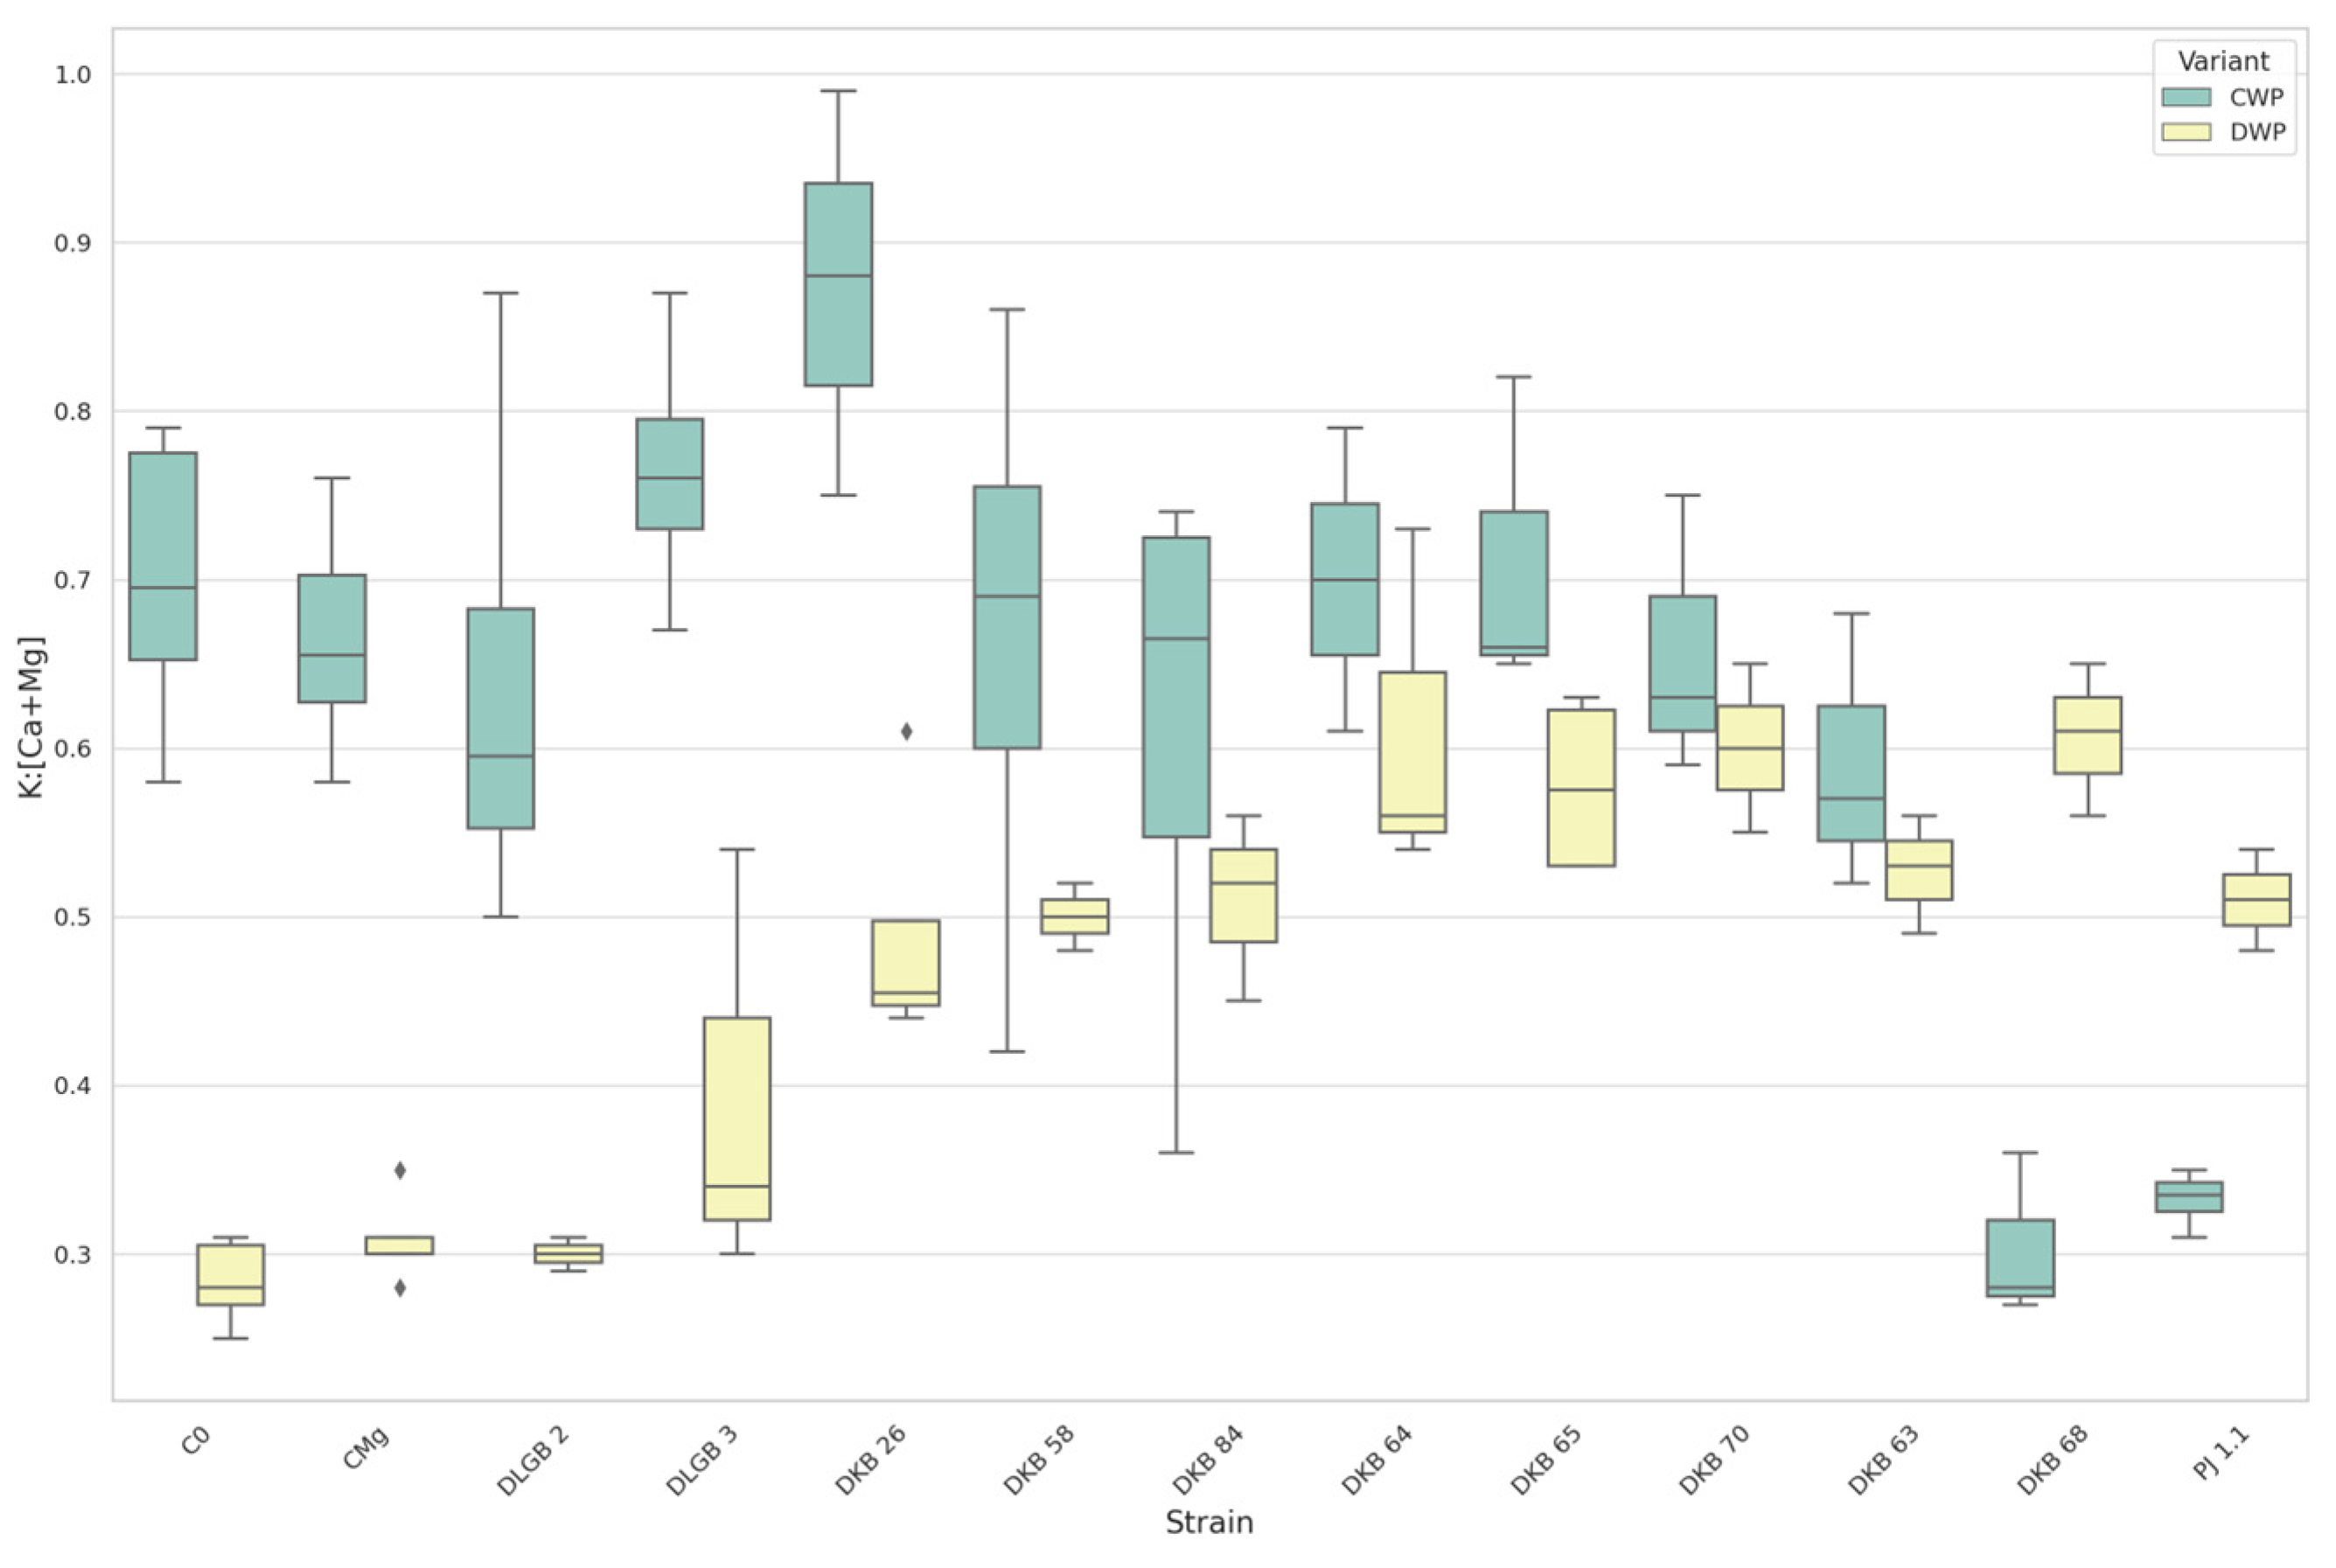
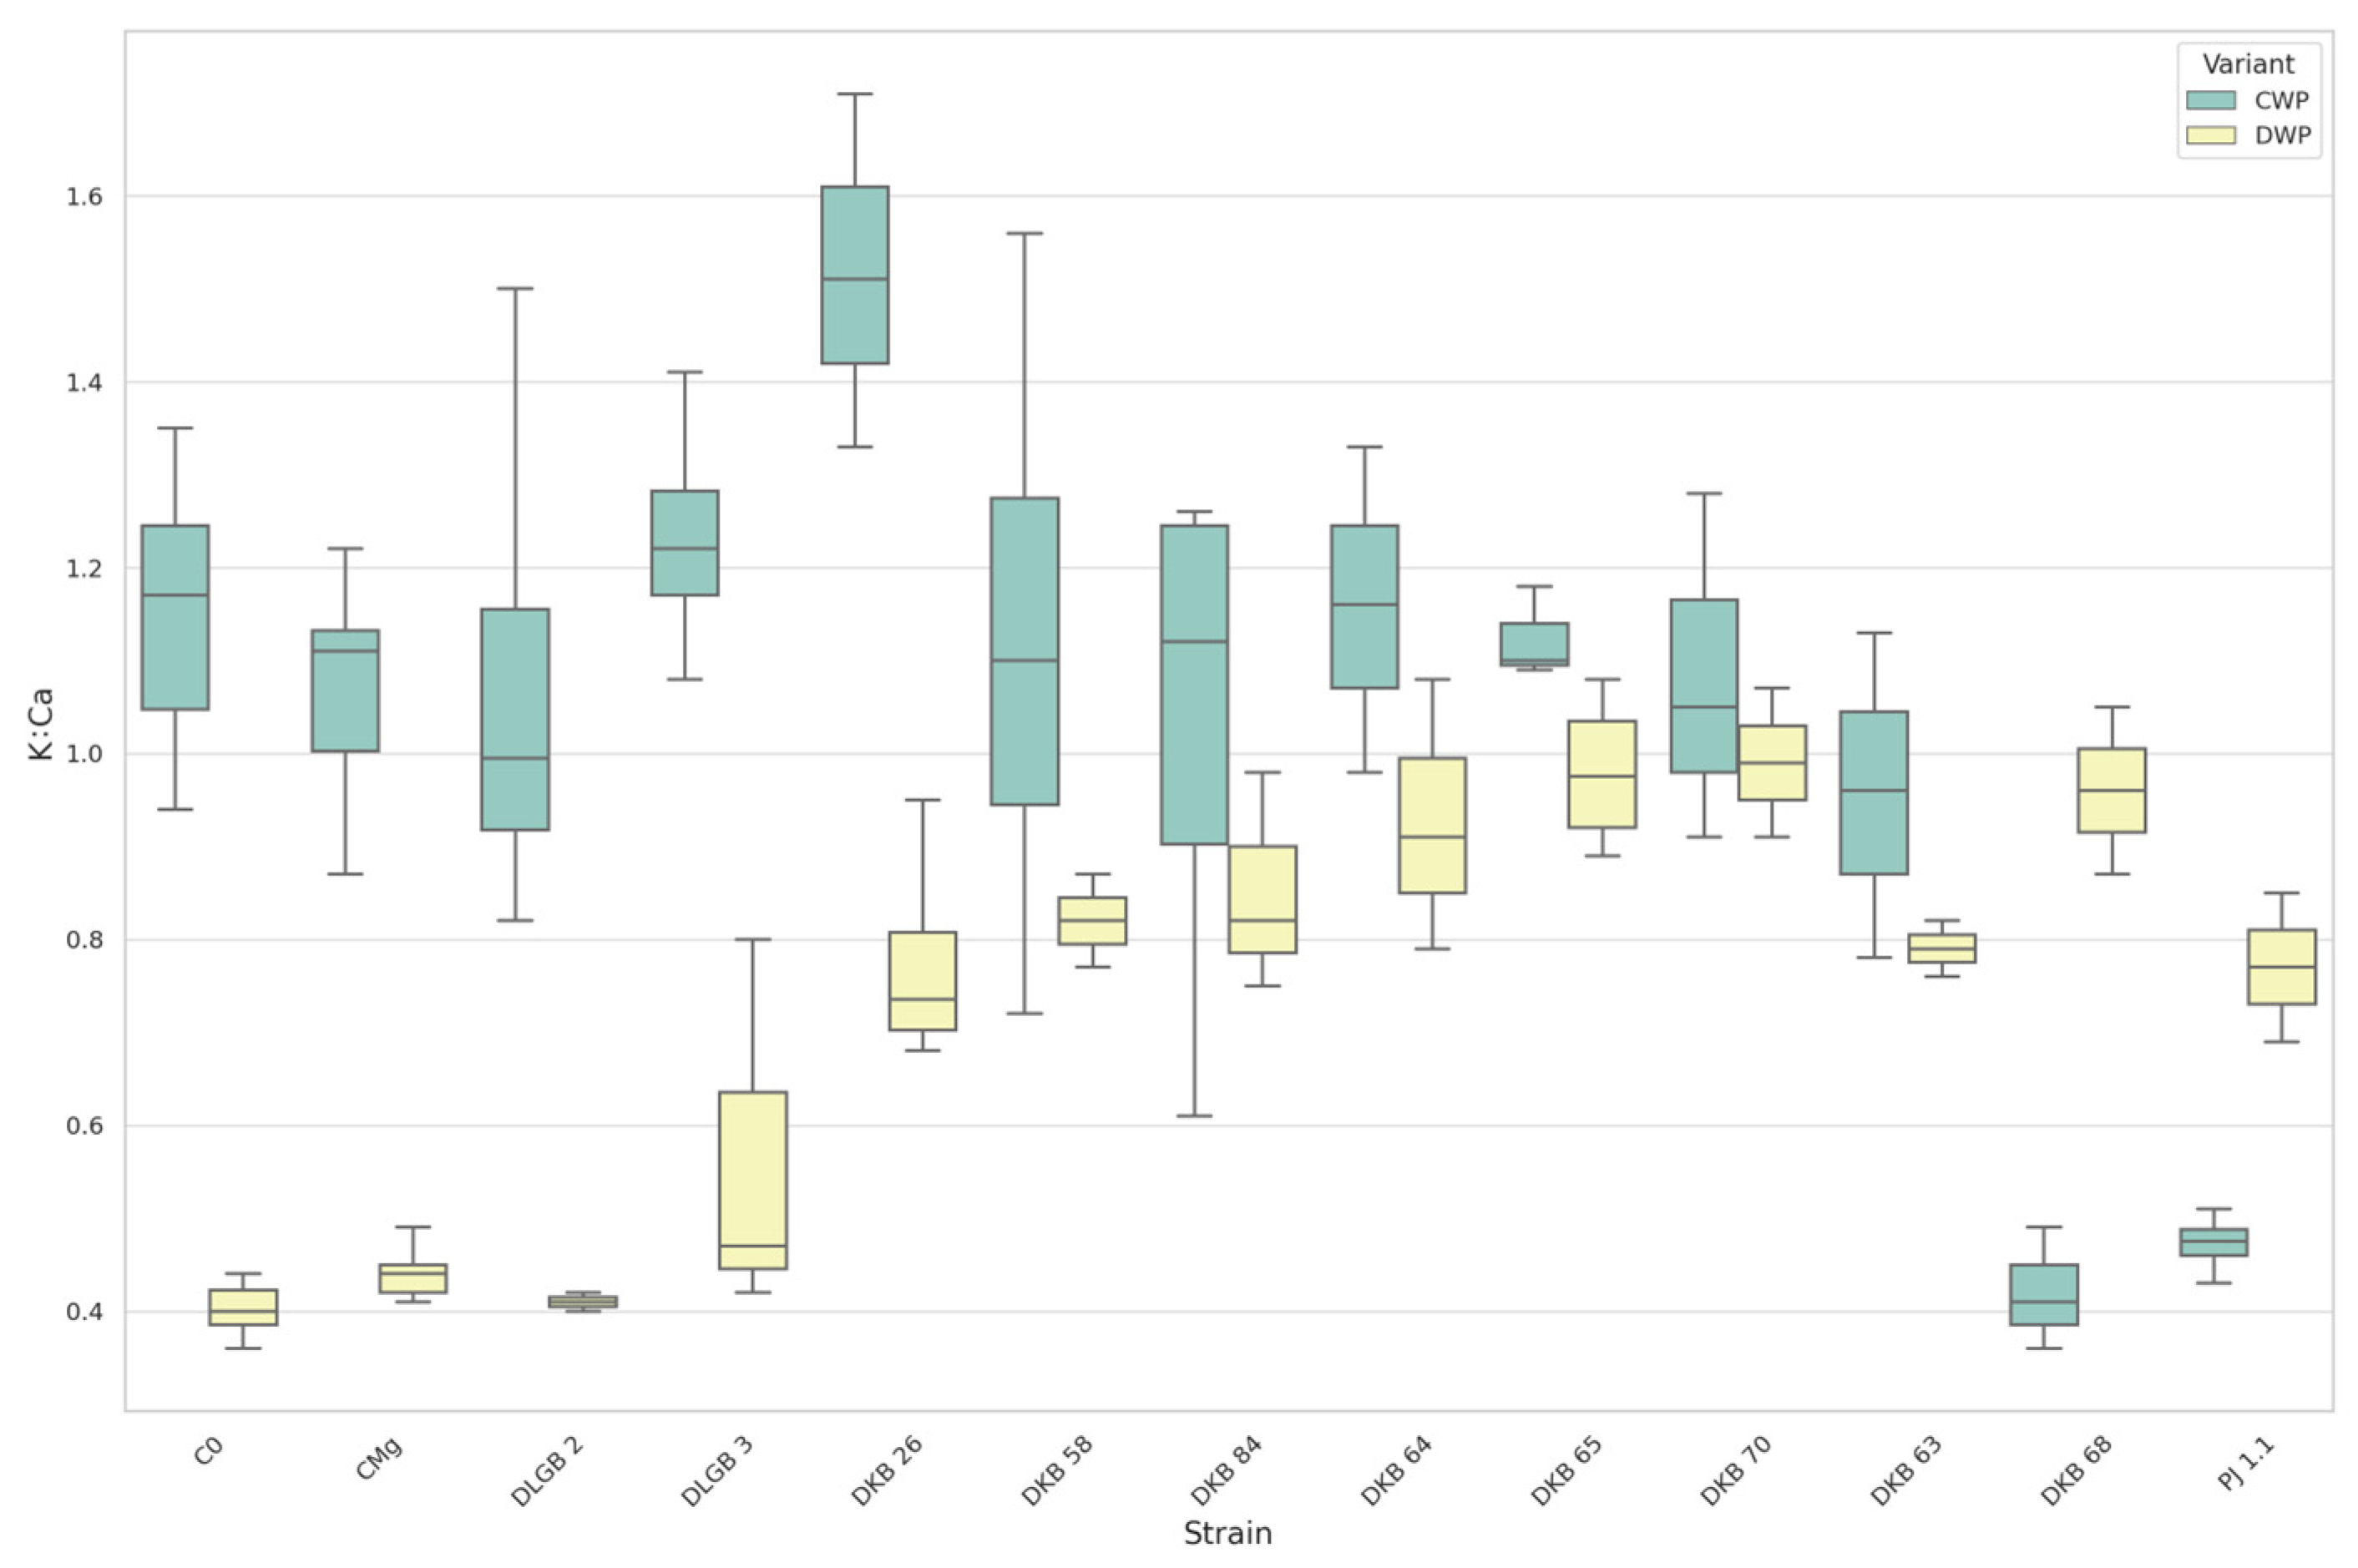
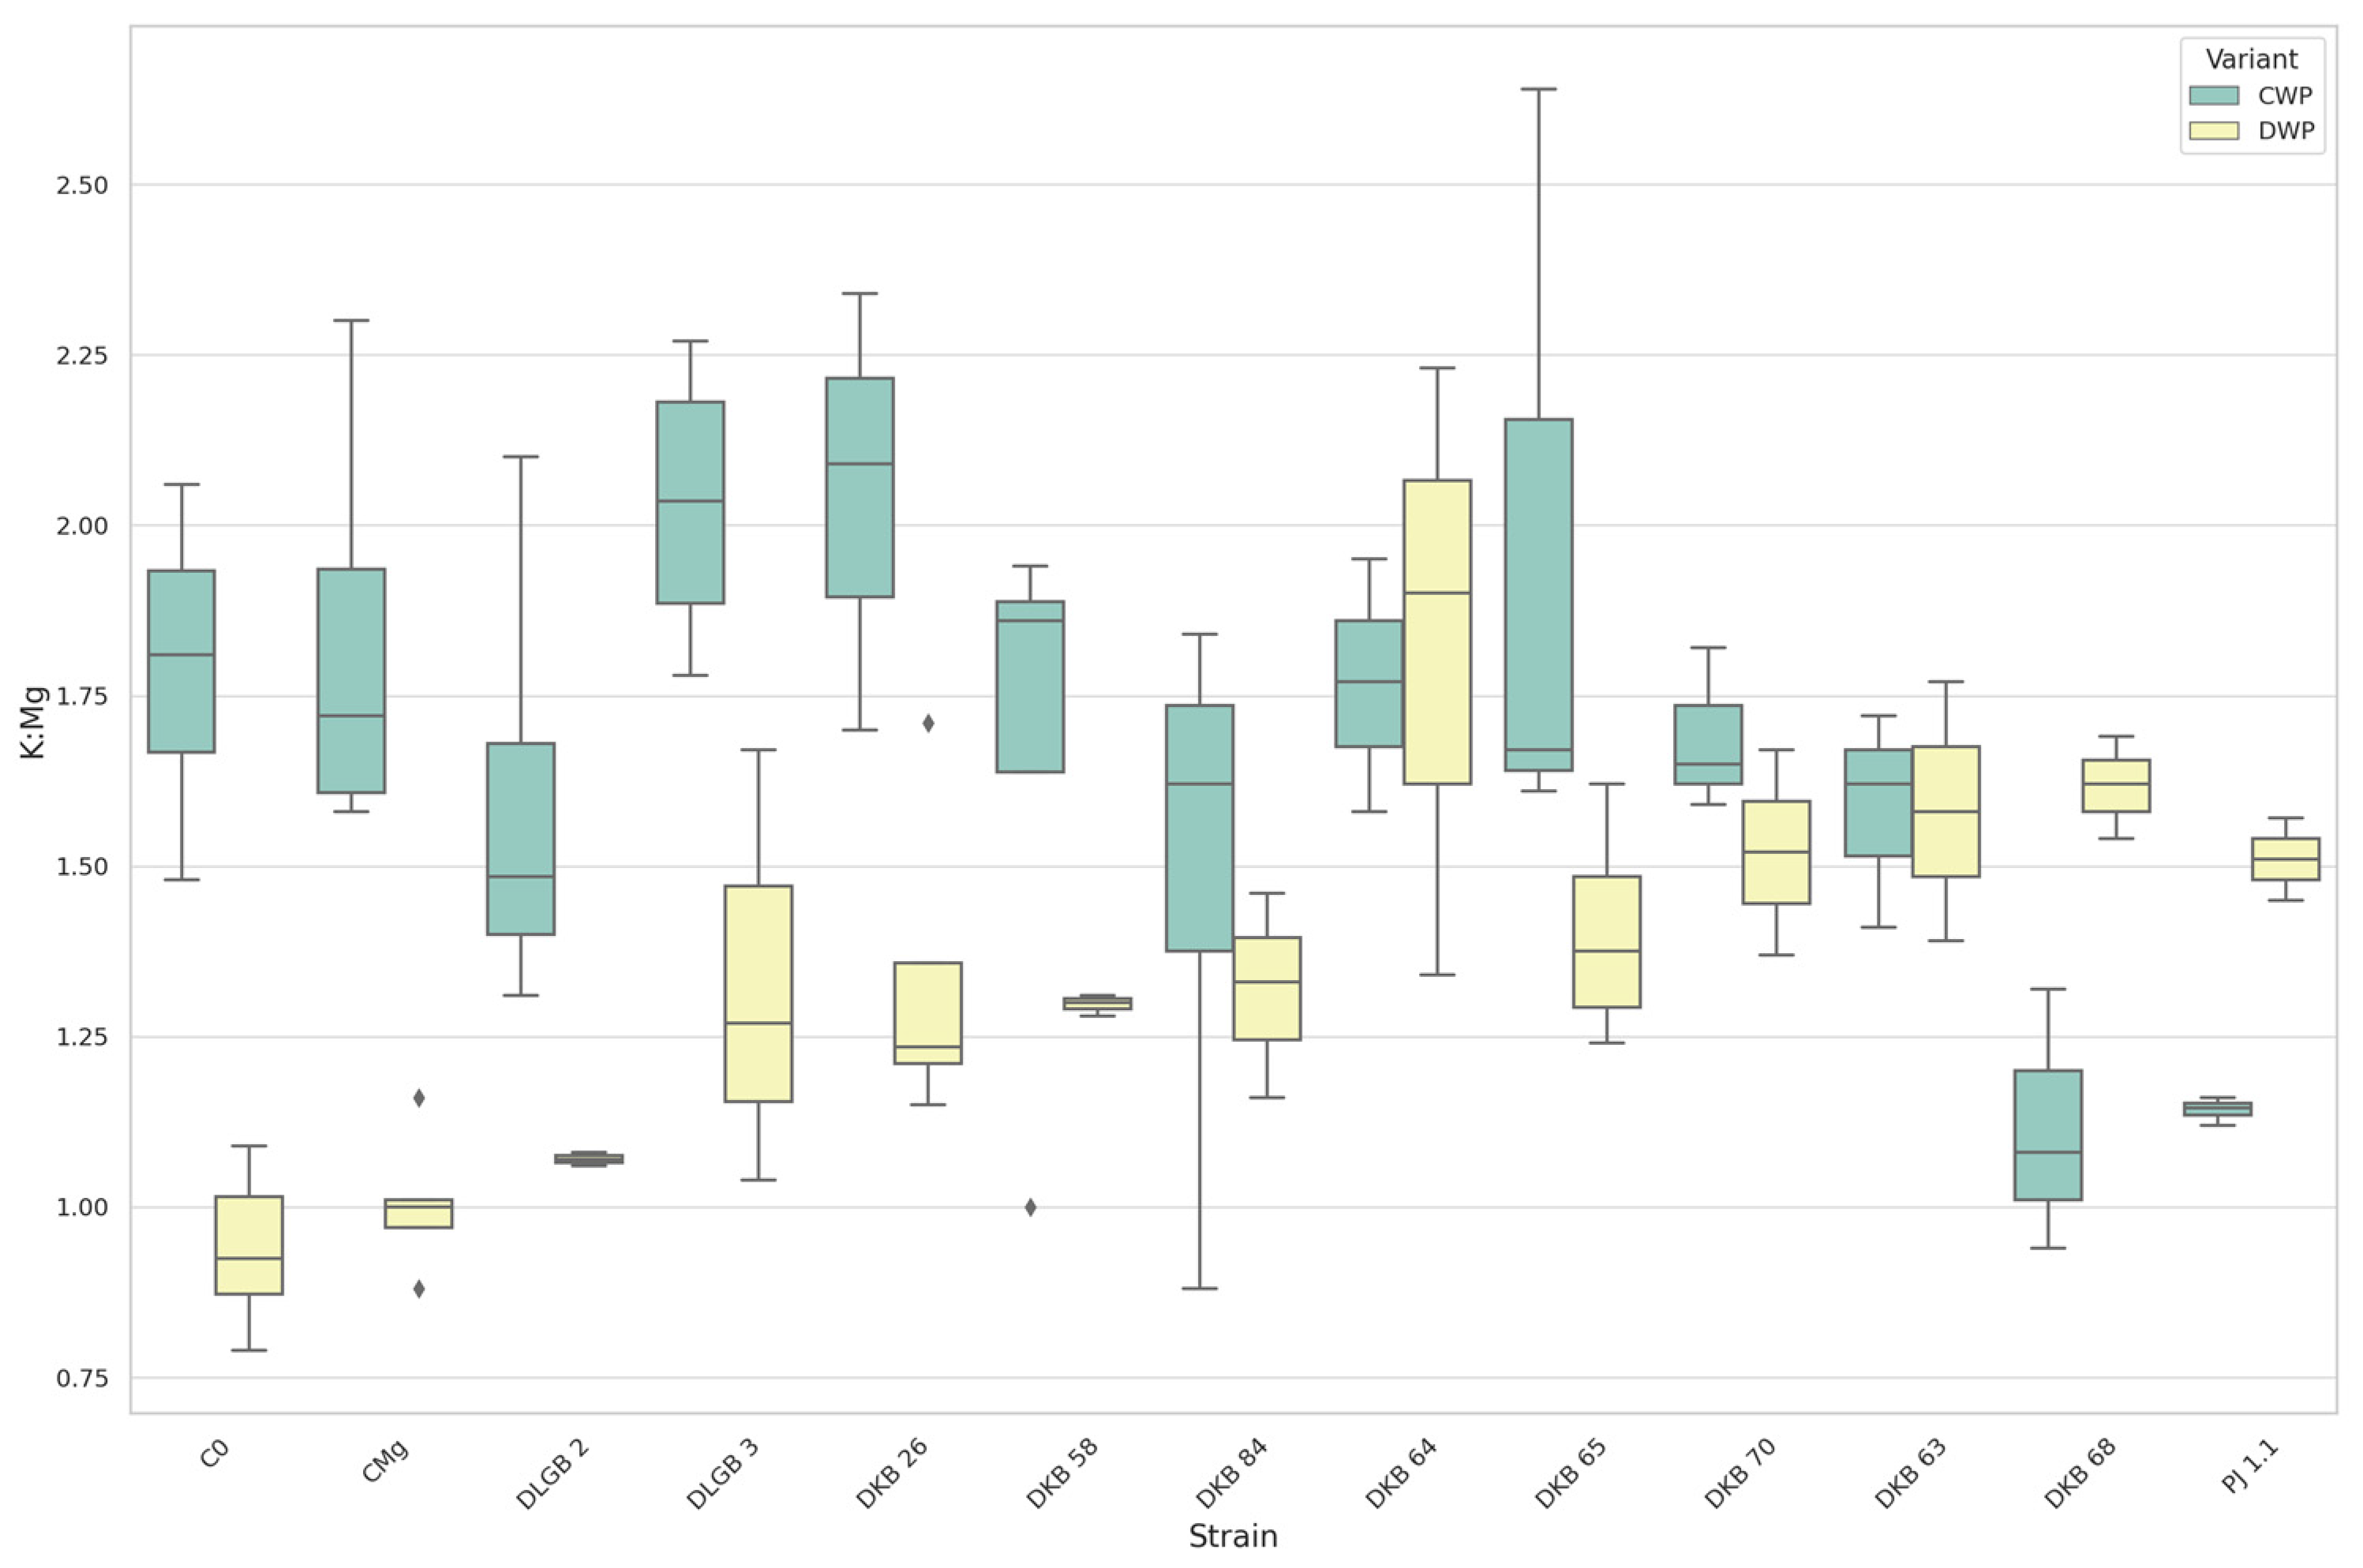
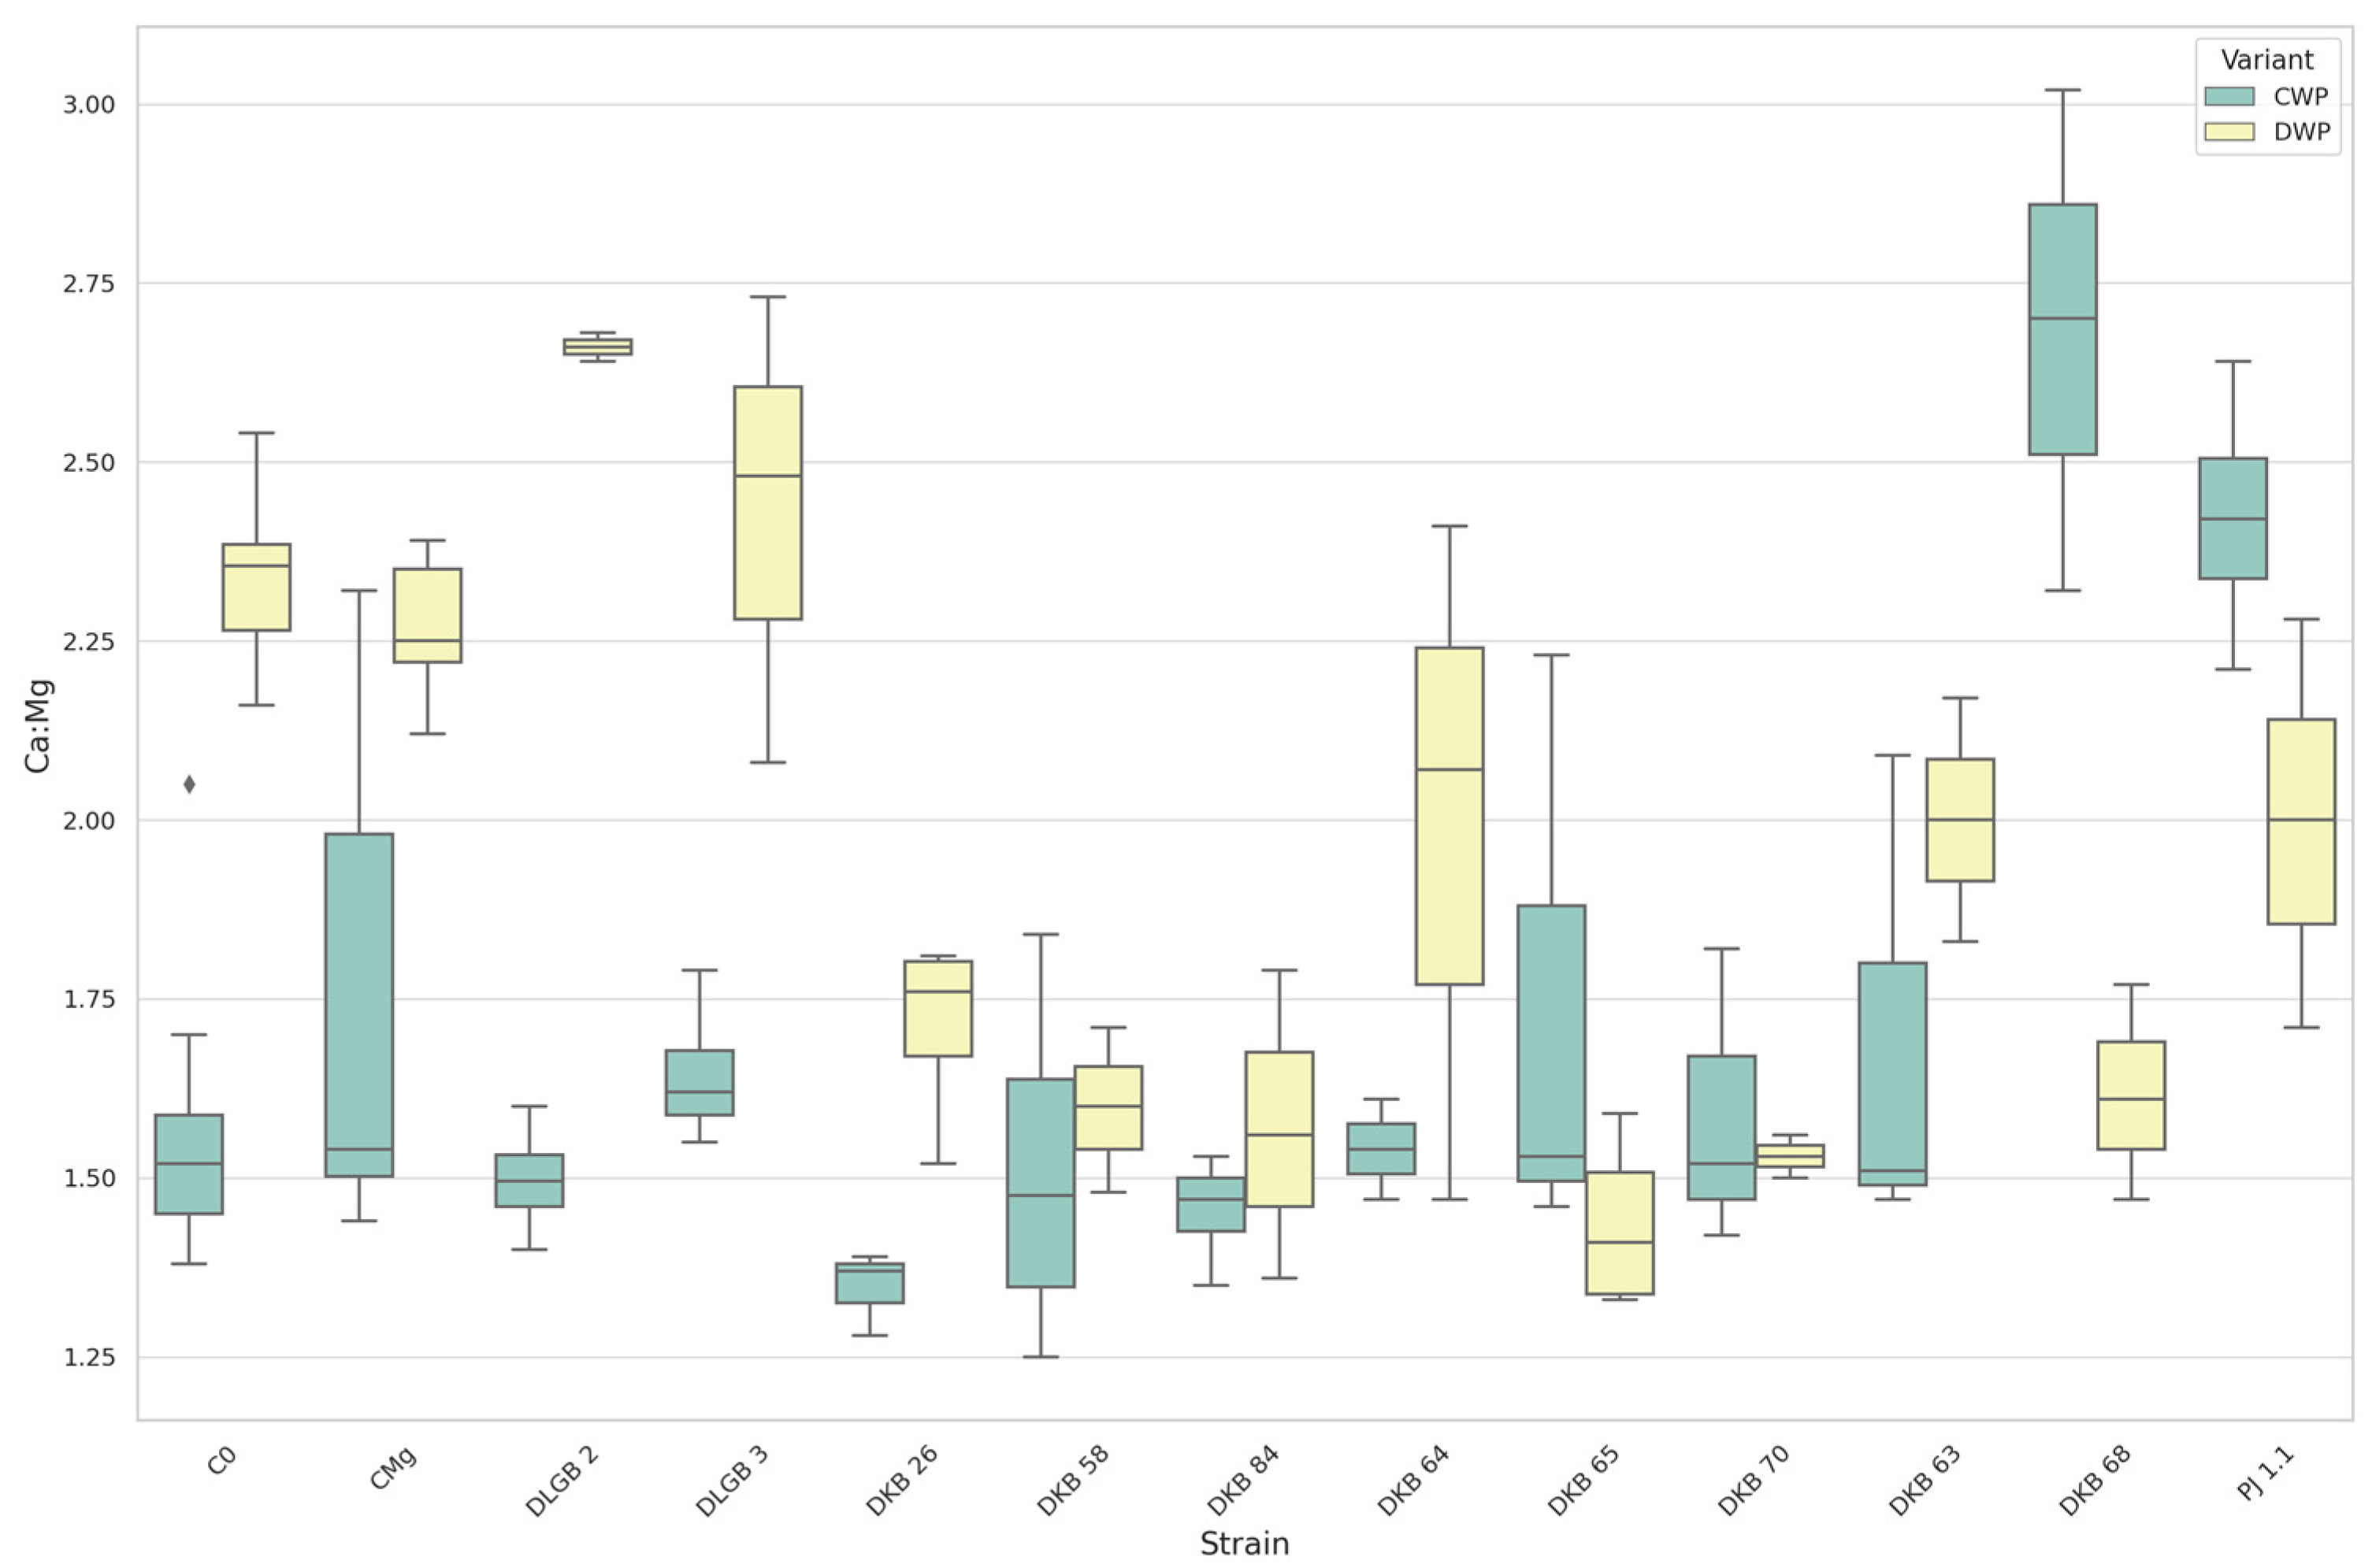
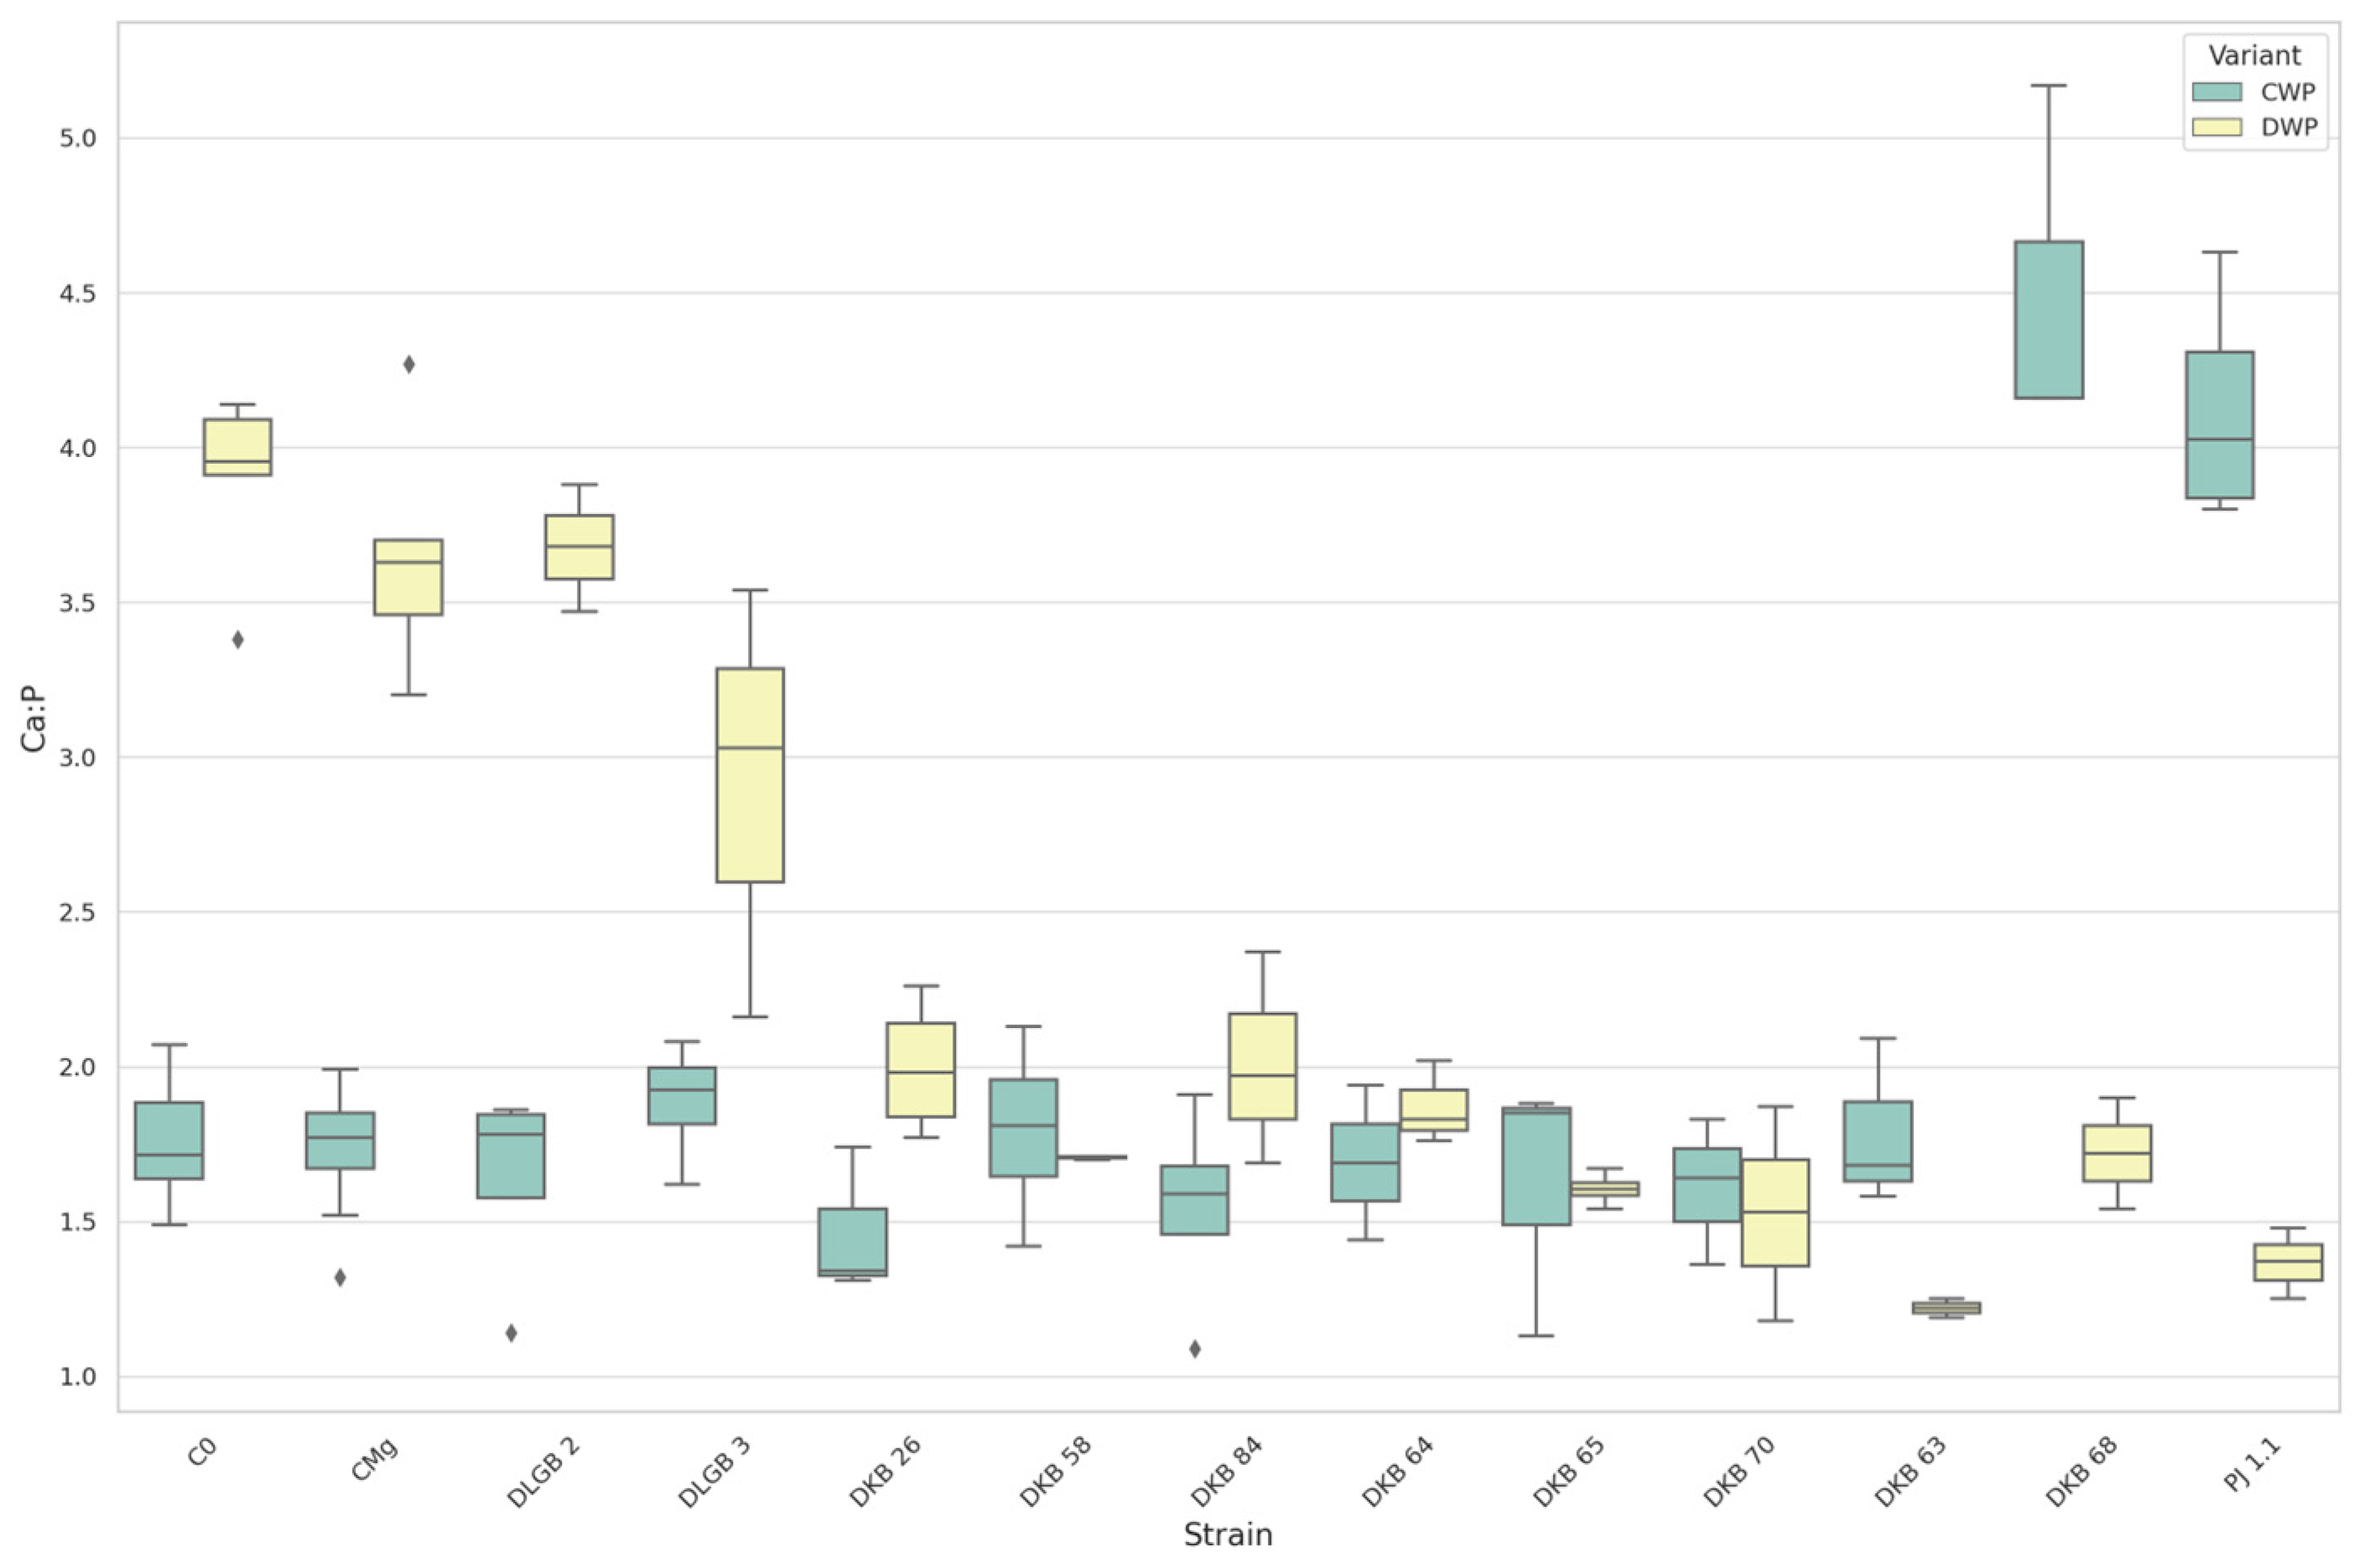
3.7. The Leaf Nutrients Ratios

For the K:[Ca+Mg] ratio in the leaves of strawberries, the mean value in the optimal moisture conditions (CWP) was 0.87 with SD 0.12 and CV 13.76%, and under water deficit (DWP), it was 0.61 with SD 0.10 and CV 17.12%. The maximum value was observed in CWP for the DKB26 strain, and in DWP for the DKB64 strain. The minimum value was observed in CWP for the DKB68 strain, and DWP in the C0 variant (Figure 21).
For the K:Ca ratio in the leaves, the mean value in optimal moisture conditions (CWP) was 1.52 with SD 0.19 and CV 12.53%. Under the conditions of water deficit in the substrate (DWP), we observed a mean of 0.99 with SD 0.08 and CV 8.08%. The maximum value was recorded in CWP for the DKB26 strain, and DWP in the DKB70 variant. The minimum value was observed in CWP for the DKB68 strain, and DWP in the C0 variant (Figure 22, Table 1).
The average K:Mg ratio mean value in the optimal moisture conditions (CWP) was 2.04 with SD 0.32 and CV 15.79%. Under the conditions of water deficit (DWP), we observed a 1.82 mean with SD 0.45 and CV 24.68%. The maximum value was observed in CWP for the DKB26 strain, and DWP after inoculation with the DKB64 strain. The minimum value was observed in CWP for the DKB68 strain, and DWP in the C0 variant (Figure 23, Table 1).
For the Ca:Mg ratio mean value in the optimal moisture conditions (CWP) was 2.68 with SD 0.35 and CV 13.08%, and under water deficit (DWP), it was 2.66 with SD 0.02 and CV 0.75%. The highest value was recorded in CWP for the DKB68 strain, and DWP in the DLGB2 strain. The lowest value was observed in CWP for the DKB26 strain, and DWP after inoculation with the DKB65 strain (Figure 24, Table 1).
For the Ca:P ratio, the mean value in the optimal moisture conditions (CWP) was 4.50 with SD 0.58 and CV 12.97%. In the conditions of water deficit in the substrate (DWP), we observed a 3.91 mean with SD 0.28 and CV 7.11%. The maximum value was observed in CWP for the DKB68 strain, and DWP in C0 variant. The minimum value was observed in CWP for the DKB26 strain, and in DWP for the DKB63 strain (Figure 25, Table 1).
For the Fe:Mn ratio mean value in CWP was 12.75 with SD 0.95 and CV 7.43%. In DWP we observed a 12.06 mean with SD 7.19 and CV 59.63%. The maximum value was observed in CWP for the DLGB3 strain, and in DWP for the DKB64 strain. The minimum values, both for the CWP and DWP variants, were observed after inoculation with the PJ1.1 strain (Figure 26, Table 1).

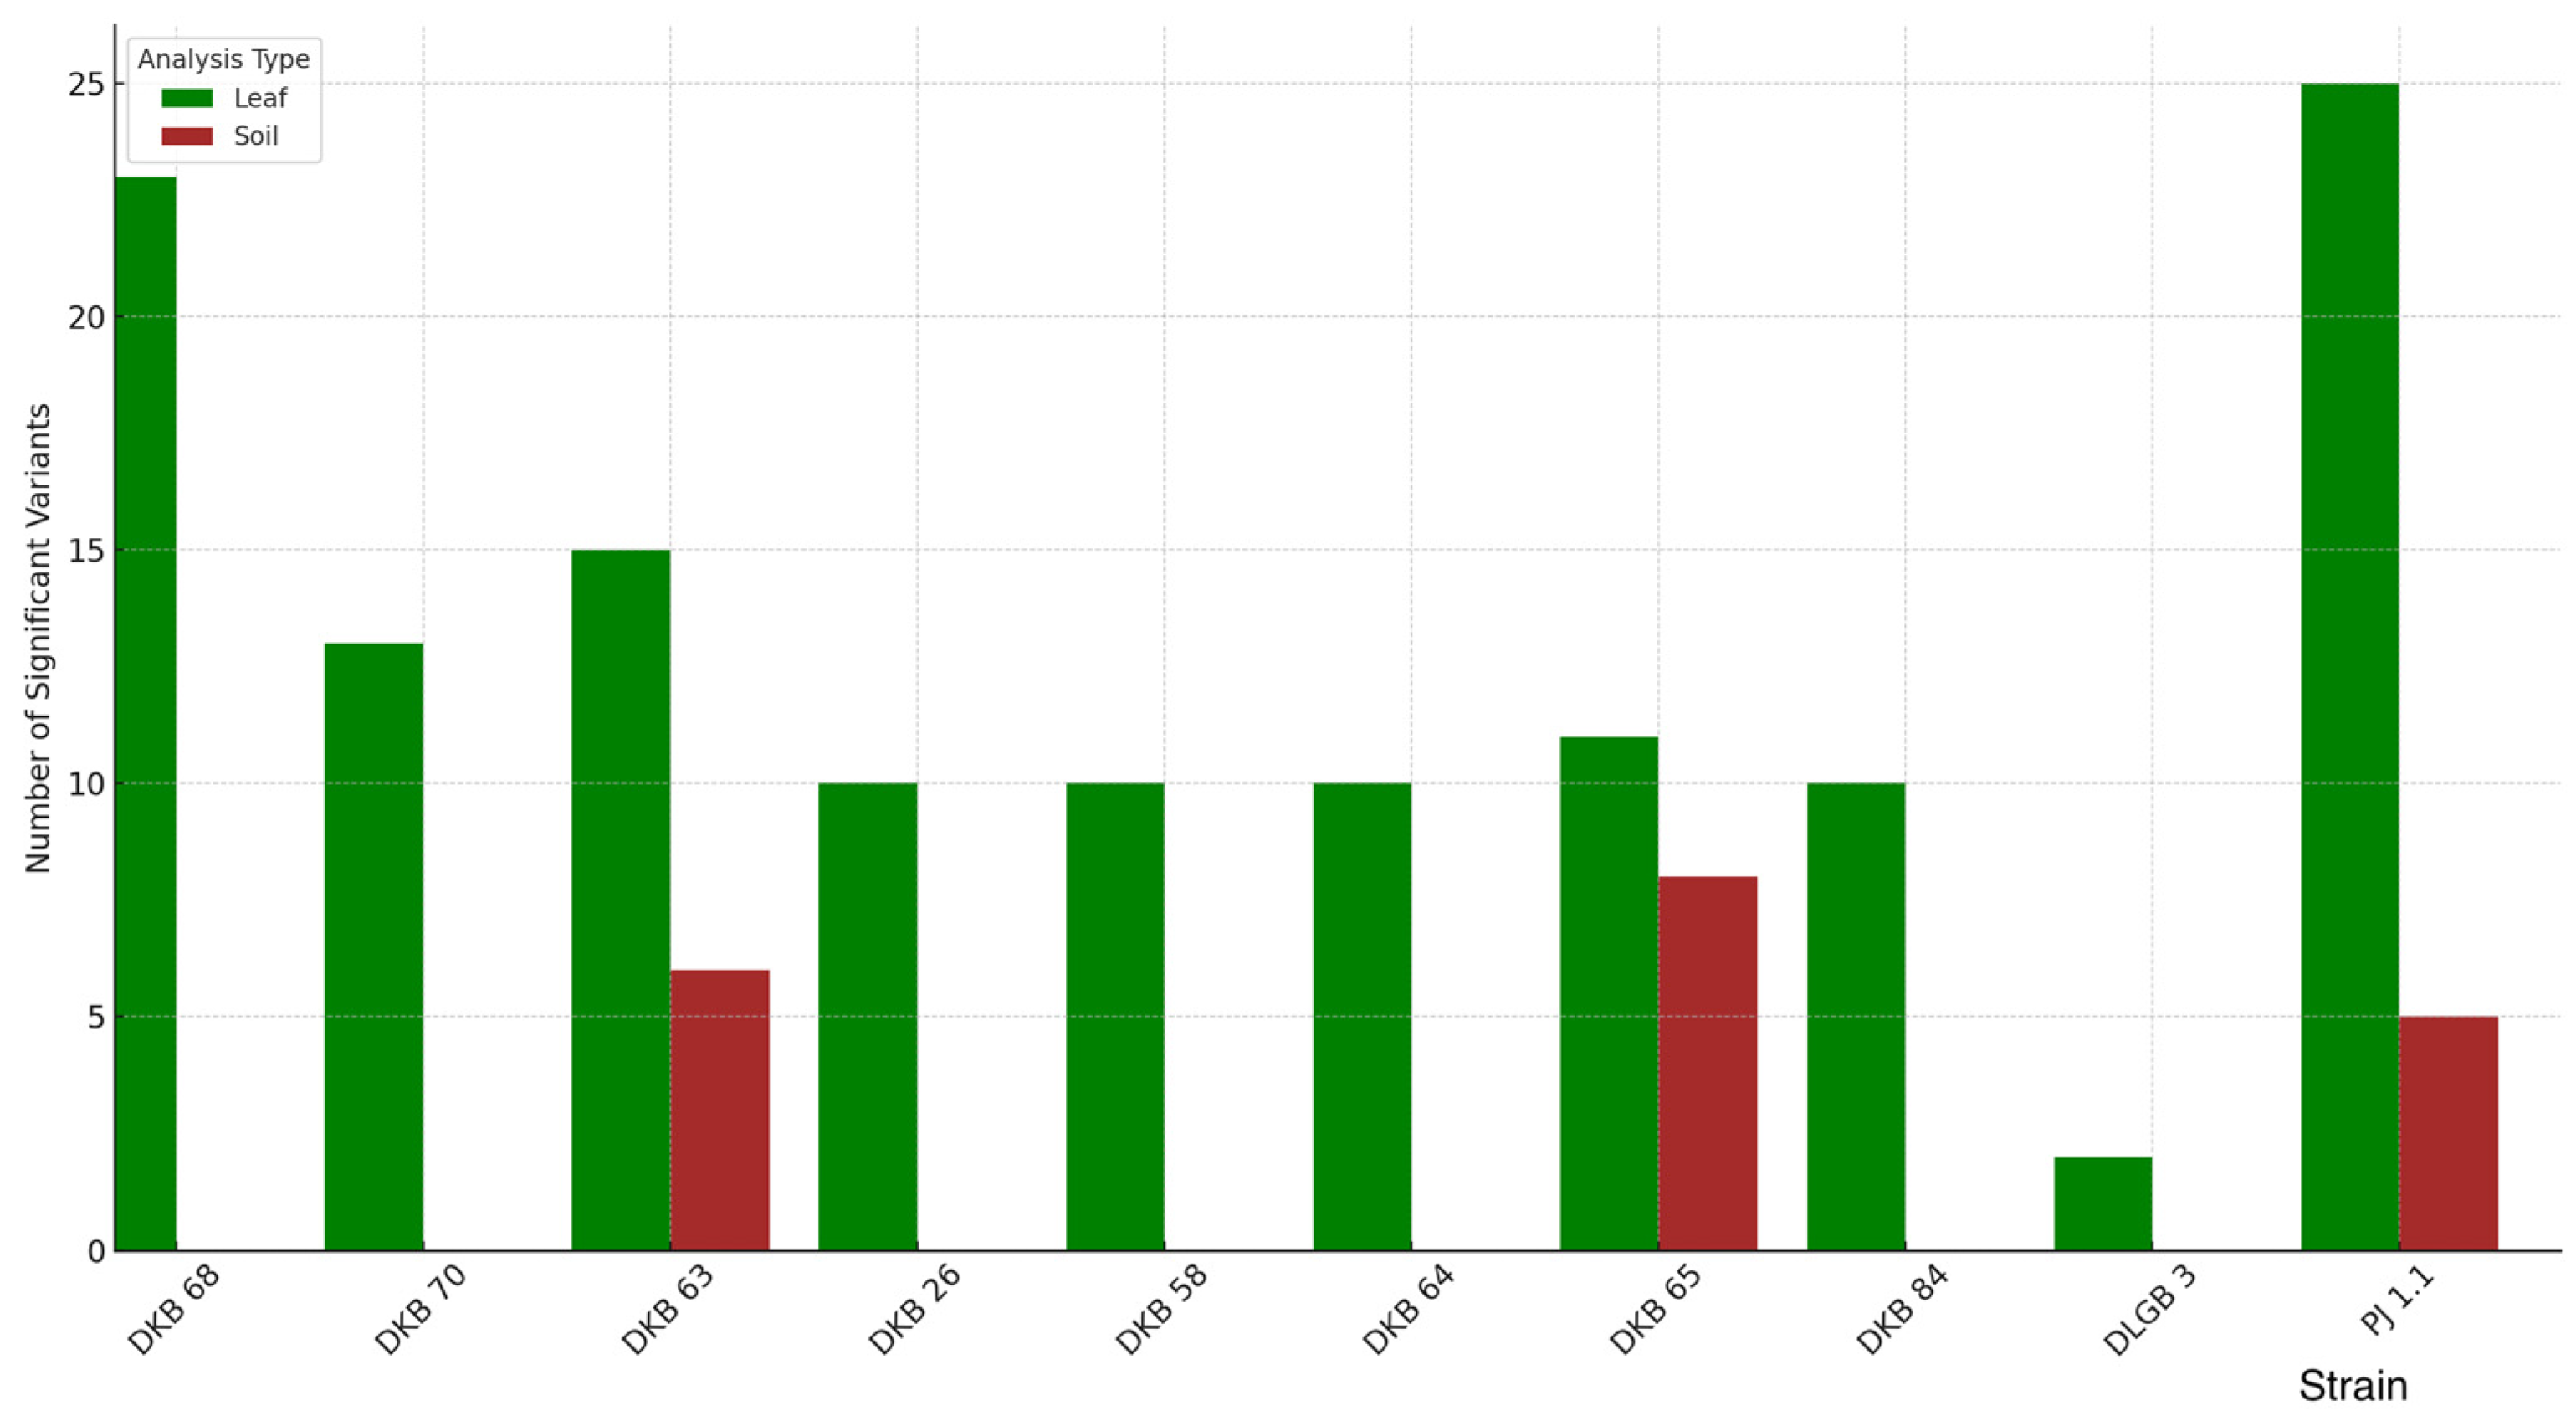
3.8. Leaf Analysis Effect Summary

In the leaf analysis of the nutrient content in leaves, certain treatments stood out due to their pronounced and frequent effects. Notably, ‘PJ1.1’, ‘DKB68’, ‘DKB65’, and ‘DKB63’ were treatments that consistently showed a significant impact the last column of our dataset, which denotes the direction of the effect and illustrates these relationships in detail (Table 2).

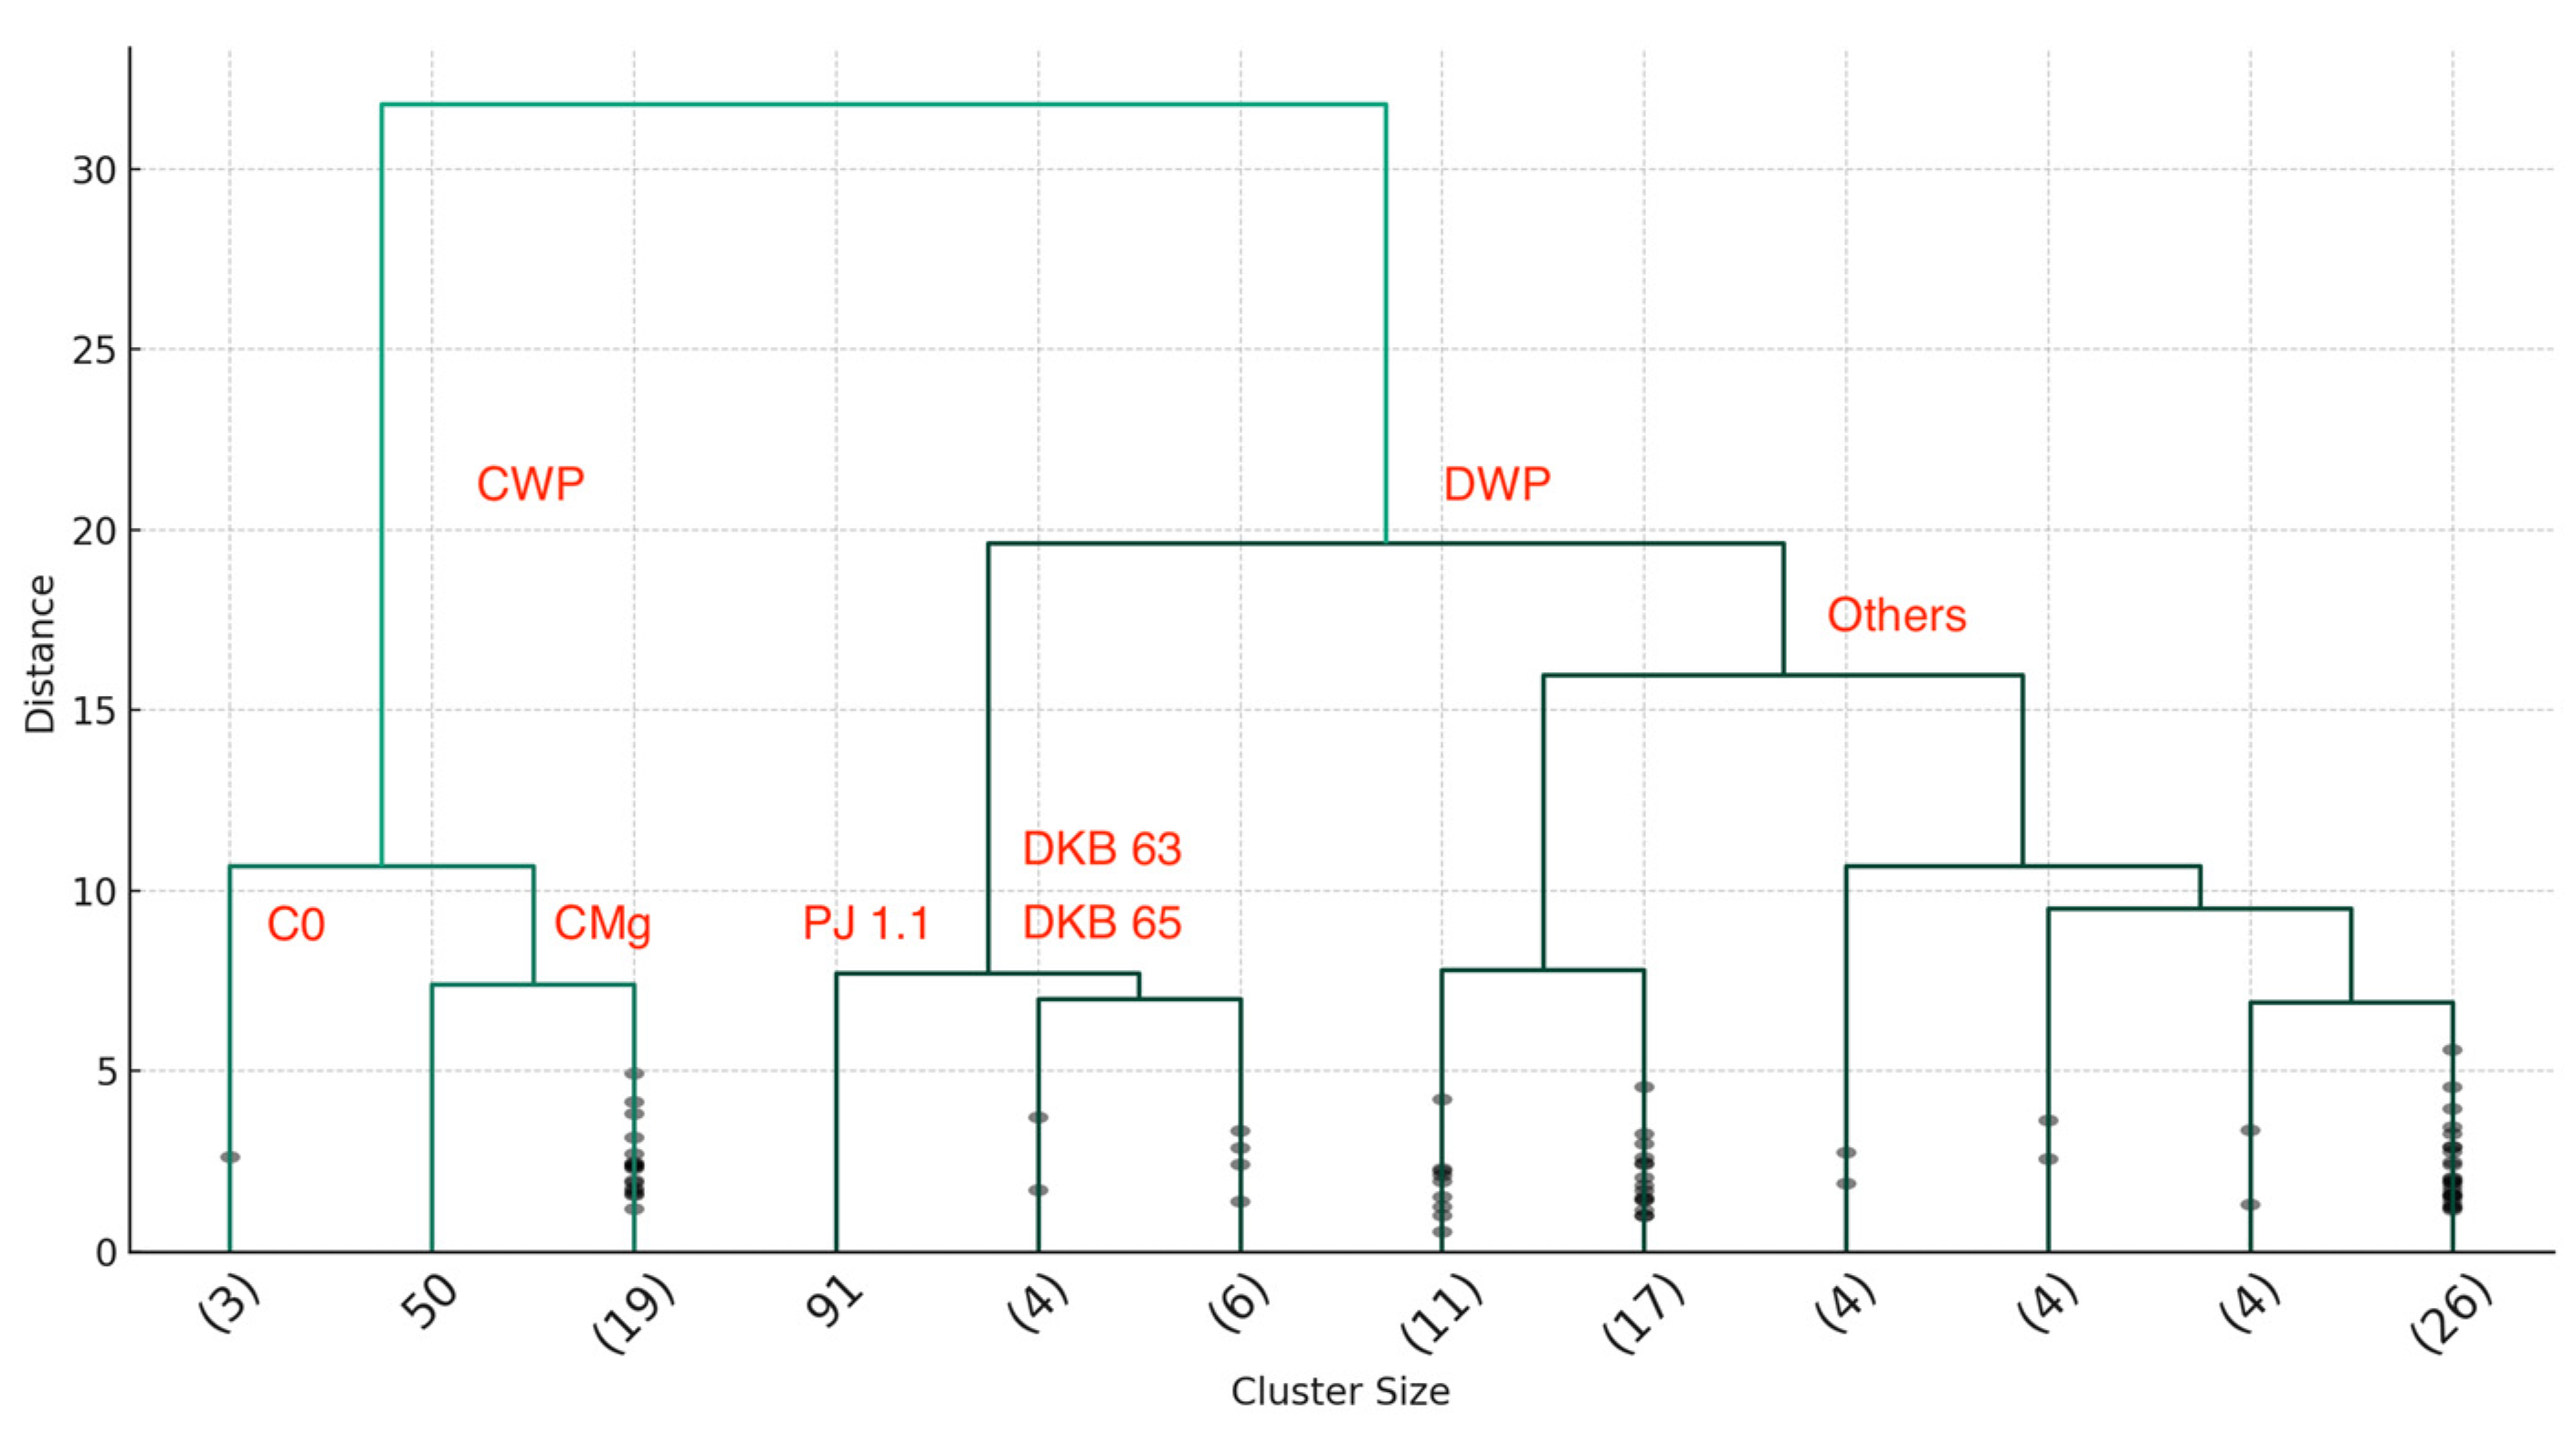
3.9. Cluster Analysis

3.9.1. Substrate Composition Clusters

The cluster analysis revealed two main clusters which were defined as the optimal condition cluster and the water deficit cluster (Figure 27).
  • Optimal Condition Cluster
The grouping of the control (C0) and magnesium-supplemented control (CMg) within the ‘Optimal’ cluster indicates a baseline soil mineral profile conducive to the healthy growth of strawberry plants. This cluster signifies soil conditions where essential nutrients are likely in balance, and the addition of magnesium does not dramatically alter this equilibrium.
The obtained results suggest that under non-stress conditions, the soil’s capacity to support strawberry cultivation is robust, with or without the solution of MgSO4 that was used to prepare a bacterial suspension. The cluster shows the potential homogeneity in nutrient uptake by the plants in these two fundamental groups, serving as a reference point for the rest of the treatments.
2.
Water Deficit Clusters
In contrast, the ‘Water Deficit’ cluster, comprising specific bacterial strains such as PJ1.1, DKB63, and DKB65, reflects the soil’s response to microbial intervention under water scarcity. This cluster is vital in demonstrating how certain PGPR strains may influence mineral availability and plant resilience under stress.
The clustering of these treatments suggests a pattern where PGPR may aid in maintaining or enhancing nutrient availability or uptake, potentially mitigating the adverse effects of water deficit on plant nutrition and stress response.
3.
Diverse Response Clusters (‘Others’):
The ‘Others’ cluster, which encapsulates a range of other treatments, shows the variability in substrate and plant response to different PGPR strains. This diversity highlights the complex interplay between bacterial inoculants and substrate mineral content, emphasizing that not all PGPR strains influence the soil and plant systems uniformly.
Through the lens of the dendrogram, was unraveled critical interactions between soil composition, bacterial inoculation, and plant nutrition. The distinct clustering of treatments provides insights into which PGPR strains may be beneficial in specific environmental contexts. For example, under optimal conditions, the necessity of magnesium supplementation is brought into question, whereas under water-limited conditions, certain PGPR treatments emerge as potential allies in sustaining plant health.
Moreover, the dendrogram elucidates the nuanced role of bacterial inoculants in influencing soil nutrient dynamics. By correlating clusters with precise atomic spectroscopy data, we have illuminated the potential of PGPR to either maintain nutrient homeostasis or shift the nutrient profile in a manner that supports plant growth under varying conditions (Figure 27).

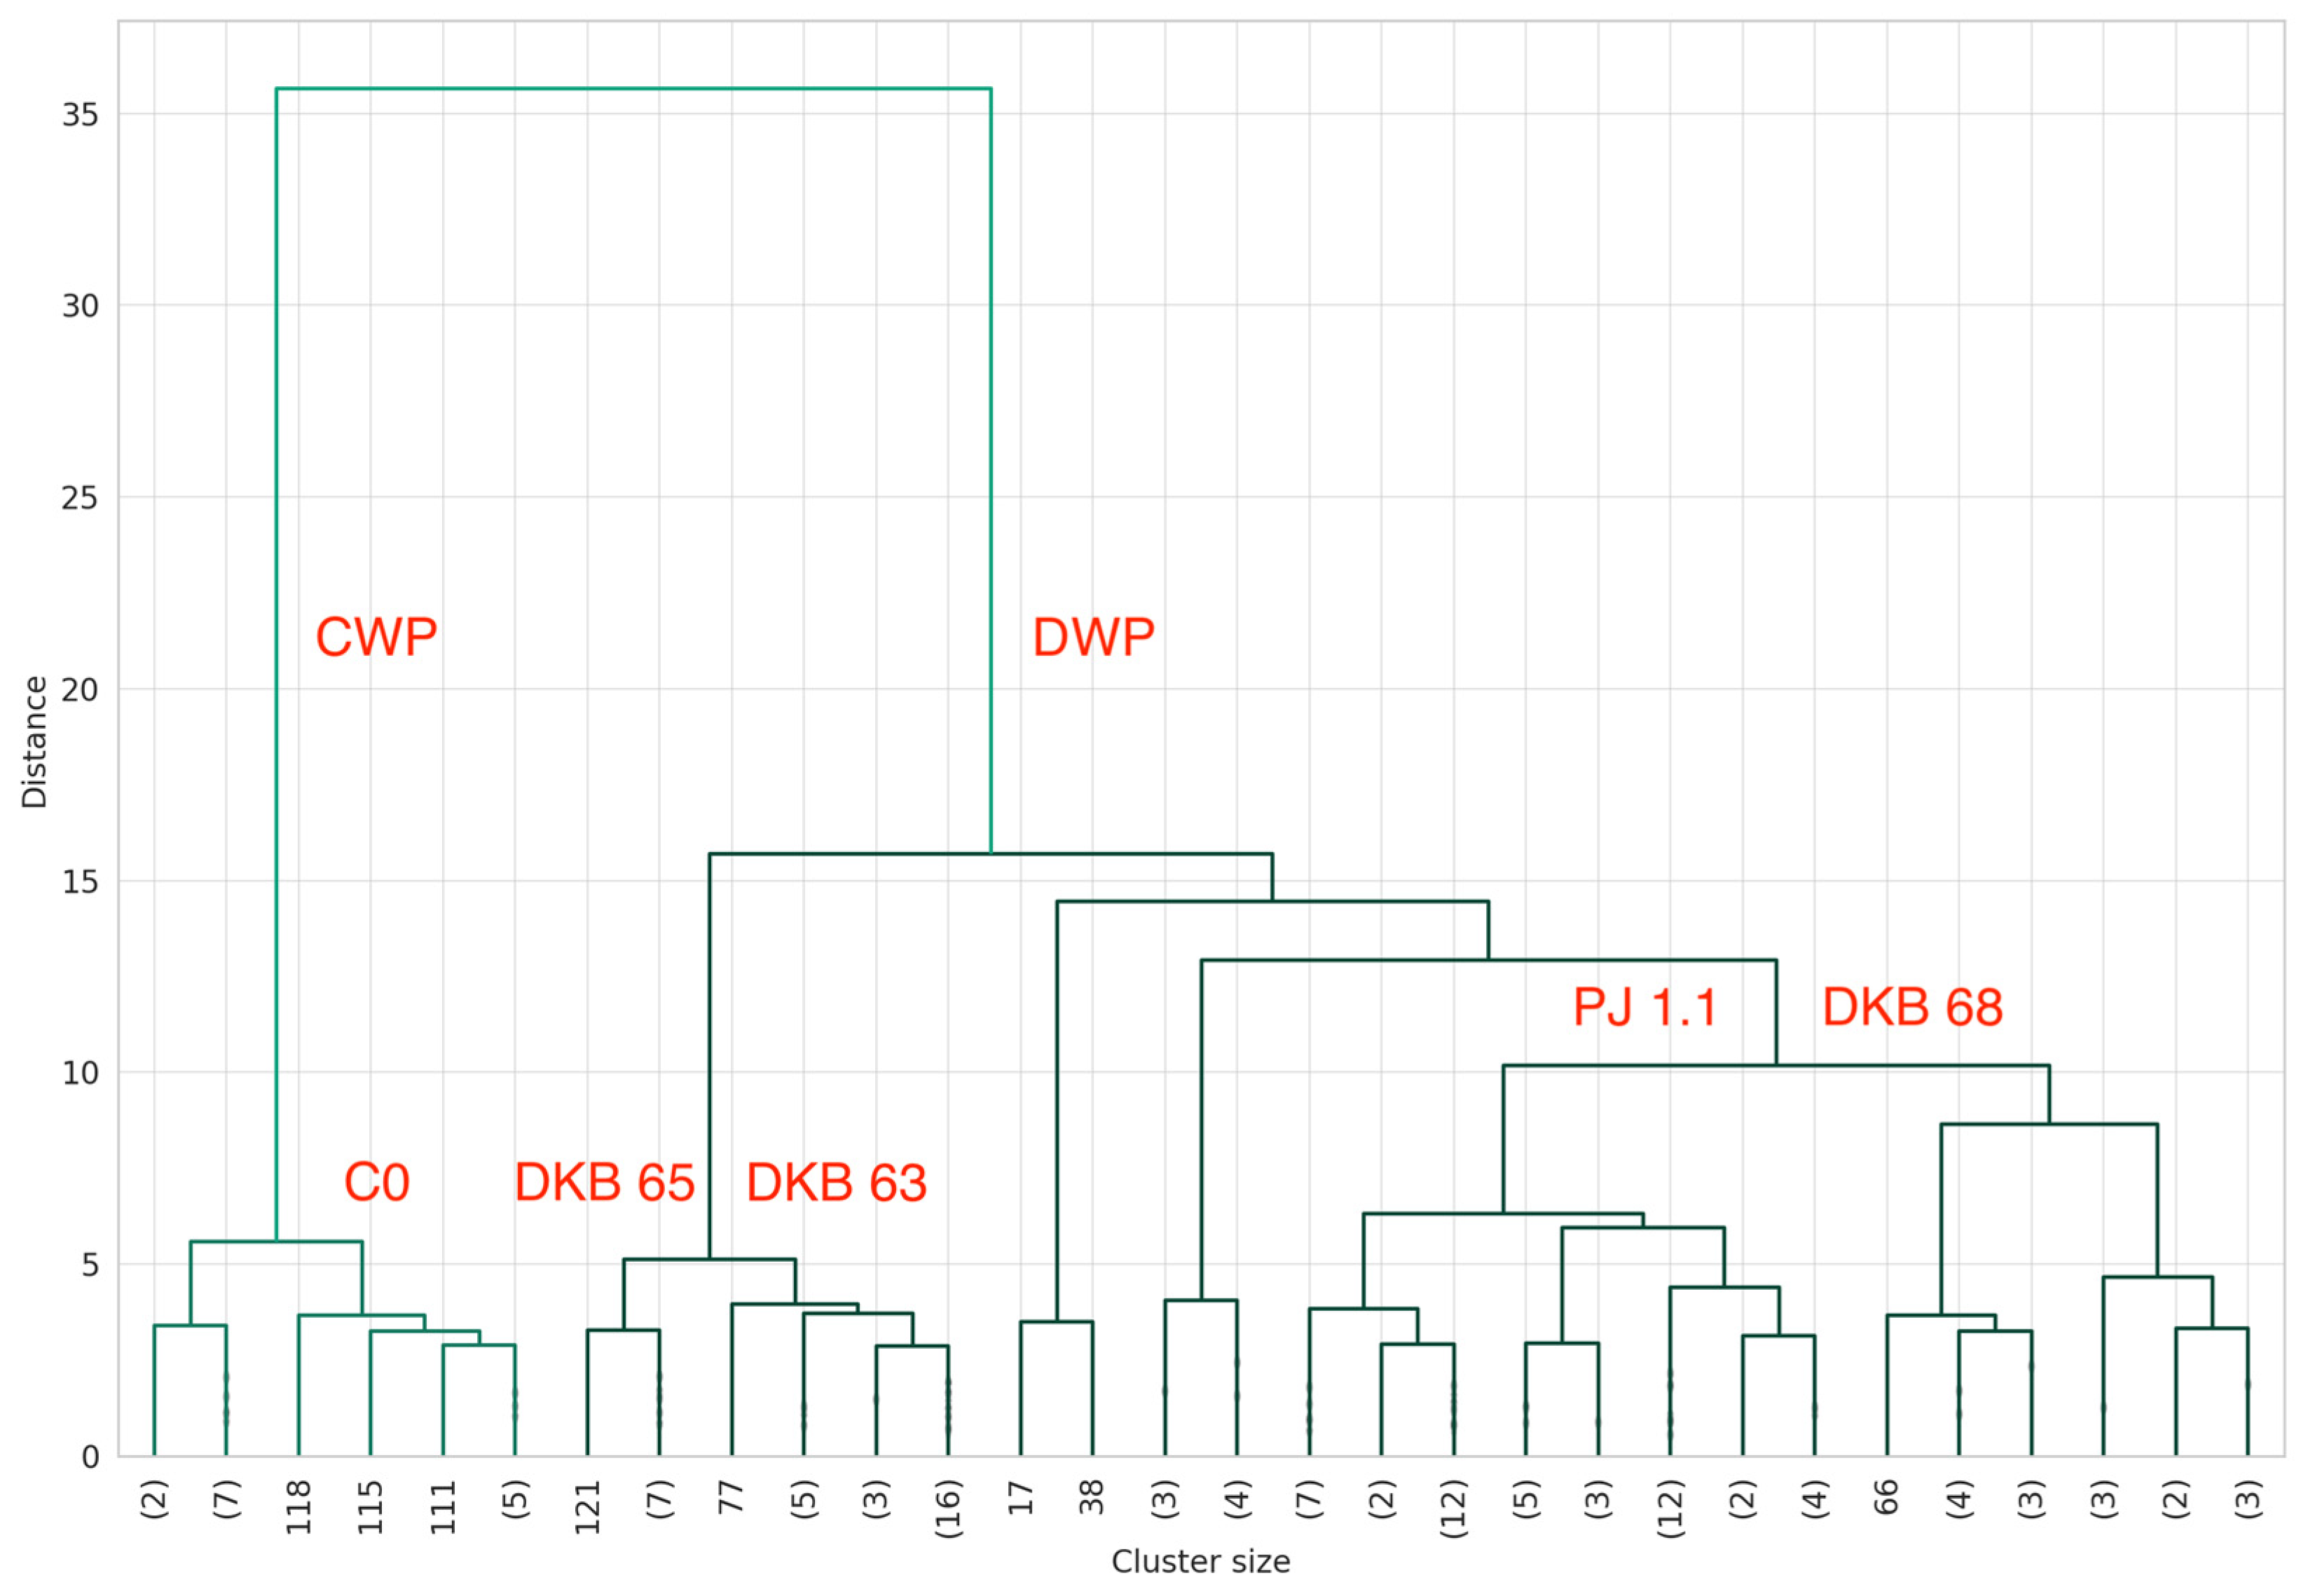
3.9.2. Ward Dendrogram Interpretation for Plant Tissue Analysis

The dendrogram for leaf tissue analysis, structured with two principal branches, encapsulates the nutritional status and elemental composition of ‘Polka’ strawberry leaves under different treatment conditions (Figure 28).
  • Optimal Branch:
Predominantly characterized by the control group ‘C0’, this branch signifies plant samples that most likely exhibit a nutritional profile considered standard or ideal under non-stressful conditions.
The clustering of ‘C0’ within the ‘Optimal’ branch suggests that the leaves under control conditions maintain a nutrient composition that could be deemed as a reference for healthy growth.
2.
Water Deficit Branch:
This branch is distinctively marked by treatments experiencing water stress, specifically highlighting ‘DKB65’, ‘DKB63’, ‘PJ1.1’, and ‘DKB68’. These labels represent leaf samples from plants inoculated with selected bacterial strains known for their growth-promoting and stress-resilience qualities.
The clustering of these treatments indicates a shared response to water deficit, potentially showcasing the effectiveness of these PGPR strains in altering leaf nutrient content to cope with stress. It may imply that these bacterial strains help in maintaining essential mineral levels or in optimizing nutrient ratios, which are crucial for plant survival and stress tolerance.
Through this dendrogram, we gain valuable insights into how different PGPR treatments affect the mineral nutrition of strawberry leaves, particularly under varying environmental conditions. It reveals patterns and relationships between treatments that are not immediately apparent without such hierarchical clustering analysis.
The optimal branch reflects the baseline nutritional status of the leaves, which serves as a crucial comparison against which the impact of water deficit and PGPR treatments can be measured.
The water deficit branch highlights the potential of specific bacterial strains to support plant health in less-than-ideal conditions, suggesting strategies for mitigating adverse effects through microbial intervention.

3.9.3. Scientific Importance

Within the ambit of our study, was instituted a robust significance analysis protocol, pivotal in enumerating the scientifically salient discrepancies manifest between control cohorts—untreated ‘C0’ and magnesium-augmented ‘CMg’—and the myriad bacterial treatments under scrutiny. This analytical apparatus has been engineered to provide a stringent statistical appraisal, delineating the extent of variability attributable to microbial intervention versus stochastic fluctuation.
In the vanguard of significant findings stand strains ‘PJ1.1’, ‘DKB65’, and ‘DKB63’, each exhibiting a pronounced influence on the nutritional milieu of both soil and foliar domains. The strain ‘PJ1.1’ emerges as a preeminent agent, engendering the greatest number of significant alterations within the leaf analysis, indicative of its potent efficacy in modulating nutrient assimilation under variegated environmental conditions.
Similarly, ‘DKB65’ has demonstrated a paramount impact, with its pronounced presence in soil analysis resonating with a capacity to effectuate meaningful alterations in soil chemistry, potentially redefining the nutrient bioavailability for ‘Polka’ strawberry cultivars.
Figure 29 presents an infographic synthesis that crystallizes the comparative potency of each PGPR strain, as adjudicated by our significance analysis. The delineation of impacts, portrayed through gradations of verdant and umber hues, imparts a visual quantification of the scientific import ascribed to each bacterial agent.
The concordance of multifaceted analyses coalesces to form a scientific edifice, substantiating the hypothesis that select PGPR strains wield a considerable influence on plant mineral nutrition. The preeminence of ‘PJ1.1’, ‘DKB65’, and ‘DKB63’ within our findings foregrounds their potential as bio-ameliorators, capable of ushering in an era of microbial-augmented agronomy.
The elucidated significance through the present analysis serves as a beacon, illuminating the path towards deploying PGPR strains with targeted precision to enhance plant resilience and nutritional equanimity, thereby fostering the development of more sustainable agricultural paradigms.

4. Discussion

Microbes associated with the plant roots are crucial for plant nutrition. The rhizosphere bacteria participate in the geochemical cycling of nutrients and determine their availability for plants and soil microbial communities [45]. The influence of PGPR inoculation on the mineral metabolism of plants may therefore be an element of increasing resistance to water deficit. Plant nutrition and development are strictly influenced by drought [46]. Drought stress exhibits efflux effects on soil nutrient availability and soil nutrient adsorption [47]. In dry soils with a low-soil solution phase, nutrient mobility and plant uptake are impeded [48]. Hinsinger et al. [49] reported that drought stress conditions significantly reduce the content of macro- and micronutrients available for plants such as N, P, K, B, Fe, Mn, and Zn. Our study showed a significant decrease in the content of the available forms of Mg, Fe, Mn, Zn, and Cu in the substrate due to water deficiency. The non-decrease of available phosphorus levels under drought conditions can be explained by the traits of the microorganisms used for inoculation. Pantoea sp. DKB64, P. sp. DKB65, P. sp. DKB70, P. sp. DKB63, P. sp. DKB68, and Pseudomonas sp. PJ1.1. showed the ability to convert insoluble inorganic phosphorus compounds to bioavailable forms. Drought conditions also reduced the pHH2O and pHKcCl but did not significantly affect the salinity of the substrate. Ahluwalia et al. [50] demonstrated that drought stress in plants is intensified by higher salt concentrations because salt-related solutes limit water uptake, which affects its content in leaves.
PGPR colonizes the plant’s rhizosphere, adheres to the root surface, and forms stable aggregates that maintain moisture and help plants absorb nutrients [51,52,53]. The PGPR not only produces phytohormones but also sequesters iron-chelators (siderophores), and by solubilizing insoluble minerals such as P, K, and Zn into the availability form for plants, alleviates the negative effects of water deficit and salinity [15,54,55]. In our studies, inoculation with the Pantoea sp. DKB 65 strain increased the available phosphorus content in conditions of deficit water in the substrate, compared to the control variant, which was due to the high tendency of the tested strain to effectively secrete phosphatases and P chelation. Under conditions of optimal substrate moisture, inoculation with the Pseudomonas sp. PJ1.1 strain reduced the available copper content in the substrate compared to the control variant. In the present study, there was no unambiguous influence of the experimental factors on salinity and the content of organic matter in the substrate. Only in the substrate at inoculation with the DKB65 and DKB63 strains did we find a higher organic matter content compared to the C0 variant. Phosphate solubilizing rhizobacteria (PSRB), residing in the plant rhizosphere, are recognized as effective bio-inoculants due to their capability to enhance the availability of phosphates like HPO4−2 or dihydrogen phosphate (H2PO4−1) in the soil. These microorganisms are particularly beneficial for plants under stress conditions. Notable PSRB species include Azotobacter, Agrobacterium, Bacillus, Flavobacterium, Pseudomonas, Microbacterium, Enterobacter, Rhizobium, Serratia, Arthrobacter, and Burkholderia [21,56,57,58,59].
According to Karlidag et al. [60], inoculation with rhizobacteria (Bacillus M3, B. OSU-142, and Microbacterium FS01) significantly increases the content of N, P, K, Ca, Fe, Mn, and Zn in the leaves of apples. However, inoculation with these microorganisms did not affect the magnesium content in the leaves of this species. The authors also reported that apple leaves inoculated with Burkholderia gladioli OSU-7 had the highest Mn content. There is evidence that plants can acquire Mn in much the same way as iron, either via acidification of the rhizosphere or the release of phytosiderophores [61]. Similar results of research on the impact of PGR such as Bacillus simplex, B. megaterium, B. amyloliquefaciens, B. velezensis, B. licheniformis, B. subtilis, and Paenibacillus castaneae on the oregano nutrition in N, P, K, Ca, Mg, S, Fe, Cu, Mn, Zn, B, and Mo had been reported by Çakmakçı et al. [62]. In our study, inoculation with the Pantoea sp. DKB63 and Pseudomonas sp. PJ1.1 strains increased the phosphorus content in the leaves of strawberries growing in water deficit. According to Adedeji et al. [63], the Pseudomonas strains have been identified as phosphorus solubilizers due to the production of organic acids and phosphatases, thereby facilitating the solubilization of phosphorus and other nutrients. In our study, the effect of inoculation with rhizosphere bacteria on the nutrient content in strawberry leaves depended on both the soil moisture level and the strain. Under water deficit conditions, after inoculation with Bacillus sp.: DKB26, DKB58, DKB84, DLGB3, Pantoea sp.: DKB63, DKB64, DKB65, DKB68, DKB70, and Pseudomonas sp., PJ1.1 caused a reduction in the content of magnesium and calcium in the leaves of the tested strawberry cultivar, compared to the plants from the control variants (C0 and CMg). There was also evidence of a beneficial effect of inoculation with the Pantoea sp. strains DKB68 and Pseudomonas sp. PJ1.1., on the increase the content of these nutrients, relative to the control, in the strawberry leaves growing under the conditions of water optimal moisture in the substrate. Creus et al. [64] and Naveed et. al. [65] stated the potential of such PGPR strains as Azospirillum brasilense Sp 245 and Burkholderia phytofirmans PsJN, used for inoculation in drought, to increase the content of Mg, K, Ca, and P in Triticum aestivum. According to Fonseca et al. [66], Bacillus subtilis inoculation increased concentrations of P and Mg in sugarcane leaves, even growing under water restriction. However, these authors did not demonstrate the effect of inoculation with this microorganism on the concentrations of Ca and K in the leaves. Similarly, in our study, there was no effect of inoculation with each strain, including Bacillus sp., on the potassium content in the strawberry leaves. Perin et al. [67] demonstrated that water deficit was not affected by Mg and P content in the leaves of strawberries. However, cited authors also proved an increase in Mn and K content. Siderophores increase the uptake of nutrients by plants, they can affect directly by improving the nutritional status of plants, or indirectly by limiting the growth of phytopathogen by chelation of iron from the surrounding environment [68,69,70]. According to Dotaniya and Meena [71] and Aketi et al. [72], the availability of zinc in soil and its concentration in plant tissues is determined by the abundance and microbiological composition of the rhizosphere therefore, PGPR inoculation may increase Zn availability in soil and uptake by plants. Perin et al. [67] showed a decrease in copper content in strawberry leaves exposed to water stress. In our studies, under water deficit conditions, the strains of Pantoea sp. DKB63 and Pseudomonas sp. PJ 1.1 increased the copper content in the leaves. Under the same substrate moisture conditions, the Pantoea sp. DKB63 strain also increased the sodium content in the leaves compared to the plants from the CMg variant. There was no effect of PGPR inoculation in different water conditions of the substrate on the content of micronutrients such as iron, manganese, and zinc. The lack of effect of inoculation with Bacillus thuringiensis strains on the iron content and Bacillus sp. on the iron and zinc content in Lavandula dentata growing in drought conditions was also demonstrated by Armanda et al. [73]. The lack of change of some elements after inoculation may be due to the lack of disturbance of these elements by the water deficit.
In our study, a significant effect of inoculation on the ratios of nutrient content in leaves was also proven. In water deficit, inoculation with the Bacillus sp. strains DKB26, DKB58, DKB84, and DLGB3 and Pantoea sp. strains DKB63, DKB64, DKB65, DKB68, and DKB70 and Pseudomonas sp. PJ1.1 decreased the ratio of calcium to phosphorus content compared to the C0 and CMg variants. In the case of plants growing in conditions of optimal substrate moisture, the strains Pantoea sp. DKB68 and Pseudomonas sp. PJ1.1 increased the value of this ratio. A reduction in the ratio of calcium to magnesium in water deficit was demonstrated after inoculation with Bacillus sp. strains DKB26, DKB58, DKB84, and Pantoea sp. DKB65, DKB68, DKB70. Under the conditions of optimal substrate moisture, inoculation with the Pantoea sp. DKB68 and Pseudomonas sp. PJ1.1 strains increased the ratio of the content of these nutrients. There was also evidence, under water deficit conditions, that inoculation with Bacillus sp. strains DKB26, DKB58, DKB84, and Pantoea sp. strains DKB63, DKB64, DKB65, DKB68, DKB70 and Pseudomonas sp. strain PJ1.1 increased the ratio of potassium to calcium in leaves. In the case of plants growing in optimal substrate moisture, inoculation with the Pseudomonas sp. PJ1.1 strain decreased the value of this ratio. In water deficit, an increase in the potassium-to-magnesium content ratio was demonstrated after inoculation with Pantoea sp. strains DKB63, DKB64, DKB65, DKB68, DKB70, and Pseudomonas sp. PJ1.1. In the case of plants growing in the optimal substrate moisture, inoculation with the Pseudomonas sp. PJ1.1 strain decreased the value of this ratio. The optimal proportions of nutrients in plants for the K:Ca ratio should be from 2 to 4, for K:Mg, from 2 to 6, for K:(Ca+Mg), from 1.62 to 2.2, for Ca:P, the ratio should be 2, and for Fe:Mn, it should range from 1.5 to 2.5 [74]. The K:Ca ratio recorded in the strawberry leaves was less than 2 in all experimental combinations. Similar values were found for the K:Mg ratio. Only in the leaves of plants from the DLGB3 CWP and DKB26 CWP combination did it observe a value above 2. Lower values than those reported in the literature were also found in the case of the K:(Ca+Mg) ratio. The optimal Ca:P ratio was found in the leaves of plants from the experimental combination of DKB26 DWP and DKB84 DWP.
Furthermore, the application of the cluster analysis (CA) in the present study, particularly involving strains like Pantoea sp. DKB63, Pseudomonas sp. PJ1.1, and Bacillus sp. strains, offered profound insights into the interaction dynamics between different soil conditions and PGPR strains. By categorizing treatments into distinct clusters, patterns in environmental factors, and specific strains such as Pantoea sp. DKB65 and Pseudomonas sp. PJ1.1 influences plant nutrition. This methodological approach enhanced the clarity of our findings, highlighting the utility of advanced data analysis techniques in understanding complex agricultural ecosystems.
The scientific importance of present findings, particularly regarding the strains Pantoea sp. DKB65, Pseudomonas sp. PJ1.1, and Bacillus sp. DKB26 is significant. These results underscore the critical role of specific microorganisms in agricultural systems, especially under the challenging conditions of climate change and environmental stress. By demonstrating the potential of these PGPR strains to improve plant nutrition and resilience to water deficit, the present study contributes vital knowledge towards the development of sustainable agricultural practices. It underscores the necessity of an integrated approach in agriculture, where traditional methods are complemented by modern microbiological insights and data analysis techniques, to optimize crop performance and uphold environmental sustainability.

5. Conclusions

Faced with a growing population and ongoing climate change, which expose plants to environmental stress, global food producers face enormous challenges in increasing crop productivity and quality, as well as making them resilient to stress. Given the above, more targeted studies are required to determine the interactions of rhizospheric strains with plants and soil and to identify potential candidates for field testing, which may increase their widespread use in agriculture and horticulture on a large scale.
As we confront the dual challenges of a rapidly growing global population and escalating climate change, the urgency to enhance crop productivity and resilience under environmental stress intensifies. The present study contributes significantly to this endeavor by highlighting the potential of rhizospheric strains, such as Pantoea sp. DKB63, Pseudomonas sp. PJ1.1, and Bacillus sp. strains, in bolstering plant nutrition and stress tolerance.
The application of the cluster analysis in the present study has provided a deeper understanding of how these strains interact with varying soil conditions, elucidating patterns that are critical for developing more efficient agricultural practices. Particularly, the significant role of strains like Pantoea sp. DKB65 and Pseudomonas sp. PJ1.1 in enhancing the phosphorus content under water deficit conditions underscores the potential of targeted microbial inoculation in mitigating the impacts of environmental stressors.
Obtained results advocate for more nuanced and targeted studies to explore the interactions between specific rhizospheric strains and plant-soil systems. This approach is vital for identifying promising candidates for large-scale agricultural and horticultural applications. The strategic use of beneficial microbial strains could be a game-changer in enhancing crop resilience and productivity, especially in the face of climate change-induced stresses such as drought and nutrient imbalances.
Furthermore, the present study underscores the need for a paradigm shift in agricultural practices. Incorporating microbial technology into conventional farming methods could lead to the development of more sustainable, efficient, and environmentally friendly agricultural systems. This is not just a matter of enhancing crop yields; it is also about ensuring food security and sustainability in an era of unpredictable climatic conditions.
In conclusion, the integration of advanced microbiological research with practical agricultural applications offers a promising pathway toward meeting the twin goals of food security and environmental sustainability. The insights gleaned from the present study pave the way for more comprehensive field trials and the potential large-scale adoption of microbial interventions, marking a significant step forward in the quest for resilient and productive agricultural systems in the face of global challenges.

Author Contributions

Conceptualization, D.P., G.M. and M.M.; methodology, D.P., G.M., M.M., A.K., L.S.-P., T.M., J.C. and T.T.; validation, D.P., G.M., M.M., A.K. and T.M.; formal analysis, D.P., G.M., M.M., A.K. and T.M.; investigation, D.P., G.M., M.M., A.K., J.C. and T.T.; data curation, D.P., G.M., M.M., A.K., T.M., J.C. and T.T.; writing—original draft preparation, D.P., G.M., M.M., T.M., J.C., A.K., T.T. and L.S.-P.; writing—review and editing, D.P., G.M., M.M., T.M., J.C., A.K., T.T. and L.S.-P.; visualization, D.P. and T.M.; supervision, G.M. All authors have read and agreed to the published version of the manuscript.

Funding

This research received no external funding.

Institutional Review Board Statement

Not applicable.

Data Availability Statement

Data are stored on the PTBD BIODATA server and in the public repository: https://github.com/TyMill/publi1 (accessed on 22 November 2023).

Conflicts of Interest

The authors declare no conflicts of interest.

References

  1. Ozturk, M.; Turkyilmaz Unal, B.; García-Caparrós, P.; Khursheed, A.; Gul, A.; Hasanuzzaman, M. Osmoregulation and its actions during the drought stress in plants. Physiol. Plantarum. 2021, 172, 1321–1335. [Google Scholar] [CrossRef] [PubMed]
  2. Seleiman, M.F.; Al-Suhaibani, N.; Ali, N.; Akmal, M.; Alotaibi, M.; Refay, Y.; Dindaroglu, T.; Abdul-Wajid, H.H.; Battaglia, M.L. Drought stress impacts on plants and different approaches to alleviate its adverse effects. Plants 2021, 10, 259. [Google Scholar] [CrossRef] [PubMed]
  3. Ramakrishna, W.; Yadav, R.; Li, K. Plant growth promoting bacteria in agriculture: Two sides of a coin. Appl. Soil Ecol. 2019, 138, 10–18. [Google Scholar] [CrossRef]
  4. Faaek, M.F.; Pirlak, L. Morphological and physiological effects of drought stress on some strawberry cultivars. Selcuk J. Agric. Food Sci. 2021, 35, 194–201. [Google Scholar] [CrossRef]
  5. World Strawberry Production by Country. Available online: https://www.atlasbig.com/en-us/countries-strawberry-production (accessed on 13 November 2023).
  6. Rutkowski, K.P.; Kruczyńska, D.E.; Żurawicz, E. Quality and shelf life of strawberry cultivars in Poland. Acta Hortic. 2006, 708, 329–332. [Google Scholar] [CrossRef]
  7. Chaves, V.C.; Calvete, E.; Reginatto, F.H. Quality properties and antioxidant activity of seven strawberry (Fragaria × ananassa Duch.) cultivars. Sci. Horticult. 2017, 225, 293–298. [Google Scholar] [CrossRef]
  8. Unal, N.; Okatan, V.; Bilgin, J.; Kahramanoğlu, I.; Hajizadeh, H.S. Impacts of different planting times on fruit quality and some bioactive contents of different strawberry cultivars. Folia Hortic. 2023, 35, 221–231. [Google Scholar] [CrossRef]
  9. Gondek, K.; Mierzwa-Hersztek, M.; Kopeć, M.; Zaleski, T.; Bogdał, S.; Bieniasz, M.; Błaszczyk, J.; Kaczmarczyk, E.; Kowalczyk, B.; Knaga, J.; et al. Mineral composition of fruits and leaves of San Andreas® everbearing strawberry in soilless cultivation. J. Elem. 2020, 25, 1333–1347. [Google Scholar] [CrossRef]
  10. Wysocki, K.; Kopytowski, J.; Bieniek, A.; Bojarska, J. The effect of substrates on yield and quality of strawberry fruits cultivated in a heated foil tunnel. Zemdirbyste 2017, 104, 283–286. [Google Scholar] [CrossRef]
  11. Mikiciuk, G.; Mikiciuk, M.; Hawrot-Paw, M. Influence of superabsorbent polymers on the chemical composition of strawberry (Fragaria × ananassa Duch.) and biological activity in the soil. Folia Hortic. 2015, 27, 63–69. [Google Scholar] [CrossRef]
  12. Kour, D.; Yadav, A.N. Bacterial mitigation of drought stress in plants: Current perspectives and future challenges. Curr. Microbiol. 2022, 79, 248. [Google Scholar] [CrossRef] [PubMed]
  13. Azeem, M.; Haider, M.Z.; Javed, S.; Saleem, M.H.; Alatawi, A. Drought stress amelioration in maize (Zea mays L.) by inoculation of Bacillus spp. strains under sterile soil conditions. Agriculture 2022, 12, 50. [Google Scholar] [CrossRef]
  14. Goswami, M.; Suresh, D. Plant growth-promoting rhizobacteria—Alleviators of abiotic stresses in soil: A review. Pedosphere 2020, 30, 40–61. [Google Scholar] [CrossRef]
  15. Vejan, P.; Abdullah, R.; Khadiran, T.; Ismail, S.; Nasrulhaq Boyce, A. Role of plant growth promoting rhizobacteria in agricultural sustainability—A review. Molecules 2016, 21, 573. [Google Scholar] [CrossRef] [PubMed]
  16. García-Caparrós, P.; Romero, M.J.; Llanderal, A.; Cermeño, P.; Lao, M.T.; Segura, M.L. Effects of drought stress on biomass, essential oil content, nutritional parameters, and costs of production in six Lamiaceae species. Water 2019, 11, 573. [Google Scholar] [CrossRef]
  17. Vandana, U.K.; Singha, B.; Gulzar, A.B.M.; Mazumder, P.B. Molecular mechanisms in plant growth promoting bacteria (PGPR) to resist environmental stress in plants. In Molecular Aspects of Plant Beneficial Microbes in Agriculture; Sharma, V., Salwan, R., Tawfeeq, L., Eds.; Academic Press: Cambridge, MA, USA; Elsevier Inc.: Hoboken, NJ, USA, 2020; pp. 221–233. [Google Scholar] [CrossRef]
  18. Kaur, H.; Kaur, J.; Gera, R. Plant growth promoting rhizobacteria: A boon to agriculture. Int. J. Cell Sci. Biotechnol. 2016, 5, 17–22. [Google Scholar]
  19. Mustafa, S.; Kabir, S.; Shabbir, U.; Batool, R. Plant growth promoting rhizobacteria in sustainable agriculture: From theoretical to pragmatic approach. Symbiosis 2019, 78, 115–123. [Google Scholar] [CrossRef]
  20. Khan, N.; Bano, A.; Ali, S.; Babar, M.A. Crosstalk amongst phytohormones from planta and PGPR under biotic and abiotic stresses. Plant Growth Regul. 2020, 90, 189–203. [Google Scholar] [CrossRef]
  21. Sindhu, S.S.; Dua, S.; Verma, M.K.; Khandelwal, A. Growth promotion of legumes by inoculation of rhizosphere bacteria. In Microbes for Legume Improvement; Khan, M.S., Musarrat, J., Zaidi, A., Eds.; Springer: Vienna, Austria, 2010; pp. 195–235. [Google Scholar] [CrossRef]
  22. Miller, S.H.; Browne, P.; Prigent-Combaret, C.; Combes-Meynet, E.; Morrissey, J.P.; O’Gara, F. Biochemical and genomic comparison of inorganic phosphate solubilisation in Pseudomonas species. Environ. Microbiol. Rep. 2009, 2, 403–411. [Google Scholar] [CrossRef]
  23. Ahanger, M.A.; Morad-Talab, N.; Abd-Allah, E.F.; Ahmad, P.; Hajiboland, R. Plant growth under drought stress: Significance of mineral nutrients. In Water Stress and Crop Plants: A Sustainable Approach; Ahmad, P., Ed.; Wiley Blackwell: Weinheim, Germany, 2016; pp. 649–668. [Google Scholar] [CrossRef]
  24. Etesami, H.; Adl, S.M. Plant growth-promoting rhizobacteria (PGPR) and their action mechanisms in availability of nutrients to plants. In Phyto-Microbiome in Stress Regulation; Kumar, M., Kumar, V., Prasad, R., Eds.; Springer: Singapore, 2020; pp. 147–203. [Google Scholar] [CrossRef]
  25. Salehi-Lisar, S.Y.; Bakhshayeshan-Agdam, H. Drought stress in plants: Causes, consequences, and tolerance. In Drought Stress Tolerance in Plants; Hossain, M., Wani, S., Bhattacharjee, S., Burritt, D., Tran, L.S., Eds.; Springer: Cham, Switzerland, 2016; pp. 1–16. [Google Scholar] [CrossRef]
  26. Tadayyon, A.; Nikneshan, P.; Pessarakli, M. Effects of drought stress on concentration of macro-and micro-nutrients in castor (Ricinus communis L.) plant. J. Plant Nutr. 2018, 41, 304–310. [Google Scholar] [CrossRef]
  27. Sun, F.; Ou, Q.; Wang, N.; Guo, Z.X.; Ou, Y.; Li, N.; Peng, C. Isolation and identification of potassium-solubilizing bacteria from Mikania micrantha rhizospheric soil and their effect on M. micrantha plants. Glob. Ecol. Conser. 2020, 23, e01141. [Google Scholar] [CrossRef]
  28. Kaur, T.; Devi, R.; Kour, D.; Yadav, A.; Yadav, A.N. Plant growth promotion of barley (Hordeum vulgare L.) by potassium solubilizing bacteria with multifarious plant growth promoting attributes. Plant Sci. Today 2021, 8, 17–24. [Google Scholar] [CrossRef]
  29. Verma, P.; Yadav, A.N.; Khannam, K.S.; Saxena, A.K.; Suman, A. Potassium-solubilizing microbes: Diversity, distribution, and role in plant growth promotion. In Microorganisms for Green Revolution. Volume 1: Microbes for Sustainable Crop Production; Panpatte, D.G., Jhala, Y.K., Vyas, R.V., Shelat, H.N., Eds.; Springer: Singapore, 2017; pp. 125–149. [Google Scholar] [CrossRef]
  30. Singh, G.; Biswas, D.R.; Marwaha, T.S. Mobilization of potassium from waste mica by plant growth promoting rhizobacteria and its assimilation by maize (Zea mays) and wheat (Triticum aestivum): A hydroponics study under phytotron growth chamber. J. Plant Nutr. 2010, 33, 236–1251. [Google Scholar] [CrossRef]
  31. Hussain, H.A.; Hussain, S.; Khaliq, A.; Ashraf, U.; Anjum, S.A.; Men, S.; Wang, L. Chilling and drought stresses in crop plants: Implications, cross talk, and potential management opportunities. Front. Plant Sci. 2018, 9, 393. [Google Scholar] [CrossRef] [PubMed]
  32. D’Oria, A.; Courbet, G.; Billiot, B.; Jing, L.; Pluchon, S.; Arkoun, M.; Maillard, A.; Roux, C.P.; Trouverie, J.; Etienne, P.; et al. Drought specifically downregulates mineral nutrition: Plant ionomic content and associated gene expression. Plant Direct 2022, 6, e402. [Google Scholar] [CrossRef] [PubMed]
  33. Ghavami, N.; Alikhani, H.A.; Pourbabaee, A.A.; Besharati, H. Study the effects of siderophore-producing bacteria on zinc and phosphorous nutrition of canola and maize plants. Commun. Soil Sci. Plant Anal. 2016, 47, 1517–1527. [Google Scholar] [CrossRef]
  34. Radzki, W.; Manero, F.G.; Algar, E.; García, J.L.; García-Villaraco, A.; Solano, B.R. Bacterial siderophores efficiently provide iron to iron-starved tomato plants in hydroponics culture. Antonie Van Leeuwenhoek 2013, 104, 321–330. [Google Scholar] [CrossRef]
  35. Paliwoda, D.; Mikiciuk, G.; Mikiciuk, M.; Kisiel, A.; Sas-Paszt, L.; Miller, T. Effects of rhizosphere bacteria on strawberry plants (Fragaria × ananassa Duch.) under water deficit. Int. J. Mol. Sci. 2022, 23, 10449. [Google Scholar] [CrossRef] [PubMed]
  36. PN-EN 15935:2022-01; Soil, Waste, Treated Bio-Waste and Sewage Sludge—Determination of Loss on Ignition (LOI). Polish Committee for Standardization: Warszawa, Poland, 2022.
  37. PN-EN ISO 10390:2022-09; Soil, Treated Bio-Waste and Sewage Sludge—Determination of pH. Polish Committee for Standardization: Warszawa, Poland, 2022.
  38. PN-ISO 11265:1997; Soil Quality—Determination of the Specific Electrical Conductivity. Polish Committee for Standardization: Warszawa, Poland, 1997.
  39. PN-R-04024:1997; Analysis of the Chemical-Agricultural Soil—Determination of the Content of Available Phosphorus, Potassium, Magnesium and Manganese in Organic Soils. Polish Committee for Standardization: Warszawa, Poland, 1997. (In Polish)
  40. Hunter, J.D. Matplotlib: A 2D graphics environment. Comput. Sci. Eng. 2007, 9, 90–95. [Google Scholar] [CrossRef]
  41. Waskom, M.L. Seaborn: Statistical data visualization. J. Open Source Softw. 2021, 6, 3021. [Google Scholar] [CrossRef]
  42. Virtanen, P.; Gommers, R.; Oliphant, T.E.; Haberland, M.; Reddy, T.; Cournapeau, D.; Burovski, E.; Peterson, P.; Weckesser, W.; Bright, J.; et al. SciPy 1.0: Fundamental algorithms for scientific computing in Python. Nat. Methods 2020, 17, 261–272. [Google Scholar] [CrossRef] [PubMed]
  43. Seabold, S.; Perktold, J. Statsmodels: Econometric and statistical modeling with Python. In Proceedings of the 9th Python in Science Conference, SciPy, Austin, TX, USA, 28 June–3 July 2010; Volume 57, p. 61. [Google Scholar] [CrossRef]
  44. Harris, C.R.; Millman, K.J.; van der Walt, S.J.; Gommers, R.; Virtanen, P.; Cournapeau, D.; Wieser, E.; Taylor, J.; Berg, S.; Smith, N.J.; et al. Array programming with NumPy. Nature 2020, 585, 357–362. [Google Scholar] [CrossRef] [PubMed]
  45. Suleiman, B.; Muhammad, B.L.; Jakada, B.H.; Vyas, N.L. Rhizosphere microbiome and plant nutrition. IJETST 2015, 2, 3208–3216. [Google Scholar] [CrossRef]
  46. Gupta, A.; Mishra, R.; Rai, S.; Bano, A.; Pathak, N.; Fujita, M.; Kumar, M.; Hasanuzzaman, M. Mechanistic insights of Plant Growth Promoting Bacteria mediated drought and salt stress tolerance in plants for sustainable agriculture. Int. J. Mol. Sci. 2022, 23, 3741. [Google Scholar] [CrossRef] [PubMed]
  47. Batool, M.; El-Badri, A.M.; Hassan, M.U.; Haiyun, Y.; Chunyun, W.; Zhenkun, Y.; Jie, K.; Wang, B.; Zhou, G. Drought stress in Brassica napus: Effects, tolerance mechanisms, and management strategies. J. Plant Growth Regul. 2022, 42, 1–25. [Google Scholar] [CrossRef]
  48. Al-Kaisi, M.M.; Elmore, R.W.; Guzman, J.G.; Hanna, H.M.; Hart, C.E.; Helmers, M.J.; Hodgson, E.W.; Lenssen, A.W.; Mallarino, A.P.; Robertson, A.E.; et al. Drought impact on crop production and the soil environment: 2012 experiences from Iowa. J. Soil Water Conserv. 2013, 68, 19A–24A. [Google Scholar] [CrossRef]
  49. Hinsinger, P.; Bengough, A.G.; Vetterlein, D.; Young, I.M. Rhizosphere: Biophysics, biogeochemistry, and ecological relevance. Plant Soil 2009, 321, 117–152. [Google Scholar] [CrossRef]
  50. Ahluwalia, O.; Singh, P.C.; Bhatia, R. A review on drought stress in plants: Implications, mitigation and the role of plant growth promoting rhizobacteria. Resour. Environ. Sustain. 2021, 5, 100032. [Google Scholar] [CrossRef]
  51. Babu, A.N.; Jogaiah, S.; Ito, S.-I.; Nagaraj, A.K.; Tran, L.-S. Improvement of growth, fruit weight and early blight disease protection of tomato plants by rhizosphere bacteria is correlated with their beneficial traits and induced biosynthesis of antioxidant peroxidase and polyphenol oxidase. Plant Sci. 2015, 231, 62–73. [Google Scholar] [CrossRef]
  52. Kalam, S.; Basu, A.; Ahmad, I.; Sayyed, R.Z.; El Enshasy, H.A.; Dailin, D.J.; Suriani, N. Recent understanding of soil Acidobacteria and their ecological significance: A critical review. Front. Microbiol. 2020, 11, 580024. [Google Scholar] [CrossRef]
  53. Tewari, S.; Arora, N.K. Multifunctional exopolysaccharides from Pseudomonas aeruginosa PF23 involved in plant growth stimulation, biocontrol and stress amelioration in sunflower under saline conditions. Curr. Microbiol. 2014, 69, 484–494. [Google Scholar] [CrossRef] [PubMed]
  54. Raheem, A.; Shaposhnikov, A.; Belimov, A.A.; Dodd, I.C.; Ali, B. Auxin production by rhizobacteria was associated with improved yield of wheat (Triticum aestivum L.) under drought stress. Arch. Agron. Soil Sci. 2018, 64, 574–587. [Google Scholar] [CrossRef]
  55. Gontia-Mishra, I.; Sapre, S.; Deshmukh, R.; Sikdar, S.; Tiwari, S. Microbe-mediated drought tolerance in plants: Current developments and future challenges. In Plant Microbiomes for Sustainable Agriculture; Yadav, A.N., Singh, J., Rastegari, A.A., Yadav, N., Eds.; Springer: Cham, Switzerland, 2020; pp. 351–379. [Google Scholar] [CrossRef]
  56. Zhao, K.; Penttinen, P.; Zhang, X.; Ao, X.; Liu, M.; Yu, X.; Chen, Q. Maize rhizosphere in Sichuan, China, hosts plant growth promoting Burkholderia cepacia with phosphate solubilizing and antifungal abilities. Microbiol. Res. 2014, 169, 76–82. [Google Scholar] [CrossRef] [PubMed]
  57. Alori, E.T.; Glick, B.R.; Babalola, O.O. Microbial phosphorus solubilization and its potential for use in sustainable agriculture. Front. Microbiol. 2017, 8, 971. [Google Scholar] [CrossRef] [PubMed]
  58. Billah, M.; Khan, M.; Bano, A.; Ul Hassan, T.; Munir, A.; Gurmani, A. Phosphorus and phosphate solubilizing bacteria: Keys for sustainable agriculture. Geomicrobiol. J. 2019, 36, 904–916. [Google Scholar] [CrossRef]
  59. Singha, K.M.; Singh, B.; Pandey, P. Host specific endophytic microbiome diversity and associated functions in three varieties of scented black rice are dependent on growth stage. Sci. Rep. 2021, 11, 12259. [Google Scholar] [CrossRef] [PubMed]
  60. Karlidag, H.; Esitken, A.; Turan, M.; Sahin, F. Effects of root inoculation of plant growth promoting rhizobacteria (PGPR) on yield, growth and nutrient element contents of leaves of apple. Sci. Hortic. 2007, 114, 16–20. [Google Scholar] [CrossRef]
  61. Terzano, R.; Cuccovillo, G.; Gattullo, C.E.; Medici, L.; Tomasi, N.; Pinton, R.; Mimmo, T.; Cesco, S. Combined effect of soil organic acids and flavonoids on the mobilization of major and trace elements from soil. Biol. Fertil. Soils 2015, 51, 685–695. [Google Scholar] [CrossRef]
  62. Çakmakçı, R.; Haliloglu, K.; Türkoğlu, A.; Özkan, G.; Kutlu, M.; Varmazyari, A.; Molnar, Z.; Jamshidi, B.; Pour-Aboughadareh, A.; Bocianowski, J. Effect of different Plant Growth-Promoting Rhizobacteria on biological soil properties, growth, yield and quality of oregano (Origanum onites L.). Agronomy 2023, 13, 2511. [Google Scholar] [CrossRef]
  63. Adedeji, A.A.; Häggblom, M.M.; Babalola, O.O. Sustainable agriculture in Africa: Plant growth-promoting rhizobacteria (PGPR) to the rescue. Sci. Afr. 2020, 9, e00492. [Google Scholar] [CrossRef]
  64. Creus, C.M.; Pereyra, M.A.; Casanovas, E.M.; Sueldo, R.J.; Barassi, C.A. Plant growth-promoting effects of rhizobacteria on abiotic stressed plants. Azospirillum-grasses model. Am. J. Plant Sci. Biotech. 2010, 4, 49–59. [Google Scholar]
  65. Naveed, M.; Hussain, M.B.; Zahir, Z.A.; Mitter, B.; Sessitsch, A. Drought stress amelioration in wheat through inoculation with Burkholderia phytofirmans strain PsJN. Plant Growth Regul. 2014, 73, 121–131. [Google Scholar] [CrossRef]
  66. Fonseca, M.d.C.d.; Bossolani, J.W.; de Oliveira, S.L.; Moretti, L.G.; Portugal, J.R.; Scudeletti, D.; de Oliveira, E.F.; Crusciol, C.A.C. Bacillus subtilis inoculation improves nutrient uptake and physiological activity in sugarcane under drought stress. Microorganisms 2022, 10, 809. [Google Scholar] [CrossRef] [PubMed]
  67. Perin, E.C.; Messias, R.D.S.; Galli, V.; Borowski, J.M.; Souza, E.R.D.; Avila, L.O.D.; Bamberg, A.L.; Rombaldi, C.V. Mineral content and antioxidant compounds in strawberry fruit submitted to drough stress. Food Sci. Technol. 2019, 39, 245–254. [Google Scholar] [CrossRef]
  68. Backer, R.; Rokem, J.S.; Ilangumaran, G.; Lamont, J.; Praslickova, D.; Ricci, E.; Subramanian, S.; Smith, D.L. Plant growth-promoting rhizobacteria: Context, mechanisms of action, and roadmap to commercialization of biostimulants for sustainable agriculture. Front. Plant Sci. 2018, 9, 1473. [Google Scholar] [CrossRef] [PubMed]
  69. Dos Lopes, M.J.S.; Dias-Filho, M.B.; Gurgel, E.S.C. Successful Plant Growth-Promoting Microbes: Inoculation methods and abiotic factors. Front. Sustain. Food Syst. 2021, 5, 606454. [Google Scholar] [CrossRef]
  70. Omar, A.F.; Rehan, M.; AL-Turki, A. Alleviating the adverse effects of plant pathogens, drought and salinity stress factors using plant growth promoting bacteria. Not. Bot. Horti Agrobot. Cluj-Napoca 2022, 50, 12911. [Google Scholar] [CrossRef]
  71. Dotaniya, M.L.; Meena, V.D. Rhizosphere effect on nutrient availability in soil and its uptake by plants: A review. Proc. Natl. Acad. Sci. India Sect. B Biol. Sci. 2015, 85, 1–12. [Google Scholar] [CrossRef]
  72. Aketi, R.; Sharma, S.K.; Sharma, M.P.; Namrata, Y.; Joshi, O.P. Inoculation of zinc solubilizing Bacillus aryabhattai strains for improved growth, mobilization and biofortification of zinc in soybean and wheat cultivated in vertisols of central India. Appl. Soil Ecol. 2014, 73, 87–96. [Google Scholar] [CrossRef]
  73. Armada, E.; Roldán, A.; Azcon, R. Differential activity of autochthonous bacteria in controlling drought stress in native Lavandula and Salvia plants species under drought conditions in natural arid soil. Microb. Ecol. 2014, 67, 410–420. [Google Scholar] [CrossRef]
  74. Pitura, K.; Michałojć, Z. Influence of nitrogen doses on the chemical composition and proportions of nutrients in selected vegetable species. J. Elem. 2015, 20, 667–676. [Google Scholar] [CrossRef]
Figure 1. The content of organic matter in the substrate where CWP is the optimal moisture and DWP is the water deficit. ♦—minimum and/or maximum values.
Agriculture 14 00046 g001
Figure 2. The pHH2O of the substrate where CWP is the optimal moisture and DWP is the water deficit. ♦—minimum and/or maximum values.
Agriculture 14 00046 g002
Figure 3. The pHKCl of the substrate where CWP is the optimal moisture and DWP is the water deficit. ♦—minimum and/or maximum values.
Agriculture 14 00046 g003
Figure 4. The salinity of substrate where CWP is the optimal moisture and DWP is the water deficit. ♦—minimum and/or maximum values.
Agriculture 14 00046 g004
Figure 5. The content of available form of phosphorus (P) in the substrate where CWP is the optimal moisture and DWP is the water deficit. ♦—minimum and/or maximum values.
Agriculture 14 00046 g005
Figure 6. The content of the available form of potassium (K) in the substrate where CWP is the optimal moisture and DWP is the water deficit. ♦—minimum and/or maximum values.
Agriculture 14 00046 g006
Figure 7. The content of the available form of magnesium (Mg) in the substrate where CWP is the optimal moisture and DWP is the water deficit. ♦—minimum and/or maximum values.
Agriculture 14 00046 g007
Figure 8. The content of the available form of iron (Fe) in the substrate where CWP is the optimal moisture and DWP is the water deficit. ♦—minimum and/or maximum values.
Agriculture 14 00046 g008
Figure 9. The content of the available form of manganese (Mn) in the substrate where CWP is the optimal moisture and DWP is the water deficit. ♦—minimum and/or maximum values.
Agriculture 14 00046 g009
Figure 10. The content of the available form of zinc (Zn) in the substrate where CWP is the optimal moisture and DWP is the water deficit. ♦—minimum and/or maximum values.
Agriculture 14 00046 g010
Figure 11. The content of the available form of copper (Cu) in the substrate where CWP is the optimal moisture and DWP is the water deficit. ♦—minimum and/or maximum values.
Agriculture 14 00046 g011
Figure 12. The content of the total form of phosphorus (P) in the leaves of strawberries where CWP is the optimal moisture and DWP is the water deficit. ♦—minimum and/or maximum values.
Agriculture 14 00046 g012
Figure 13. The content of the total form of potassium (K) in the leaves of strawberries where CWP is the optimal moisture and DWP is the water deficit. ♦—minimum and/or maximum values.
Agriculture 14 00046 g013
Figure 14. The content of the total form of calcium (Ca) in the leaves of strawberries where CWP is the optimal moisture and DWP is the water deficit. ♦—minimum and/or maximum values.
Agriculture 14 00046 g014
Figure 15. The content of the total form of magnesium (Mg) in the leaves of strawberries where CWP is the optimal moisture and DWP is the water deficit. ♦—minimum and/or maximum values.
Agriculture 14 00046 g015
Figure 16. The content of the total form of sodium (Na) in the leaves of strawberries where CWP is the optimal moisture and DWP is the water deficit. ♦—minimum and/or maximum values.
Agriculture 14 00046 g016
Figure 17. The content of the total form of iron (Fe) in the leaves of strawberries where CWP is the optimal moisture and DWP is the water deficit. ♦—minimum and/or maximum values.
Agriculture 14 00046 g017
Figure 18. The content of the total form of manganese (Mn) in the leaves of strawberries where CWP is the optimal moisture and DWP is the water deficit. ♦—minimum and/or maximum values.
Agriculture 14 00046 g018
Figure 19. The content of the total form of zinc (Zn) in the leaves of strawberries where CWP is the optimal moisture and DWP is the water deficit. ♦—minimum and/or maximum values.
Agriculture 14 00046 g019
Figure 20. The content of the total form of copper (Cu) in the leaves of strawberries where CWP is the optimal moisture and DWP is the water deficit. ♦—minimum and/or maximum values.
Agriculture 14 00046 g020
Figure 21. K:[Ca+Mg] ratio in the leaves of strawberries where CWP is the optimal moisture and DWP is the water deficit. ♦—minimum and/or maximum values.
Agriculture 14 00046 g021
Figure 22. K:Ca ratio in the leaves of strawberries where CWP is the optimal moisture and DWP is the water deficit. ♦—minimum and/or maximum values.
Agriculture 14 00046 g022
Figure 23. K:Mg ratio in the leaves of strawberries where CWP is the optimal moisture and DWP is the water deficit. ♦—minimum and/or maximum values.
Agriculture 14 00046 g023
Figure 24. Ca:Mg ratio in the leaves of strawberries where CWP is the optimal moisture and DWP is the water deficit. ♦—minimum and/or maximum values.
Agriculture 14 00046 g024
Figure 25. Ca:P ratio in the leaves of strawberries where CWP is the optimal moisture and DWP is the water deficit. ♦—minimum and/or maximum values.
Agriculture 14 00046 g025
Figure 26. Fe:Mn ratio in the leaves of strawberries where CWP is the optimal moisture and DWP is the water deficit. ♦—minimum and/or maximum values.
Agriculture 14 00046 g026
Figure 27. Hierarchical clustering dendrogram for substrate where CWP is the optimal moisture and DWP is the water deficit.
Agriculture 14 00046 g027
Figure 28. Hierarchical clustering dendrogram for plants where CWP is the optimal moisture and DWP is the water deficit.
Agriculture 14 00046 g028
Figure 29. Scientific Importance.
Agriculture 14 00046 g029
Table 1. ANOVA results for the substrate.
VariableVariantStrain 1Strain 2Mean 1Mean 2Effect
pH in KClDWP *DKB63C05.8856.561DOWN
DKB63CMg5.8856.559
DKB65C05.9186.561
DKB65CMg5.9186.559
C0PJ1.16.5615.880
CMgPJ1.16.5595.880
pH in H2ODWPDKB63C06.1106.911DOWN
DKB63CMg6.1106.906
DKB65C06.1406.911
DKB65CMg6.1406.906
C0PJ1.16.9116.127
CMgPJ1.16.9066.127
Salinity [mS∙cm−1]DWPDKB63C01888.250986.222UP
DKB63CMg1888.250996.125
DKB65C01817.500986.222
DKB65CMg1817.500996.125
Fe [mg·kg−1]CWP *CMgC01743.6251732.444DOWN
Cu [mg·kg−1]CWPC0PJ1.140.17826.400DOWN
P [mg·100 g−1]DWPDKB65C0159.200102.811UP
DKB65CMg159.200102.538
* CWP—optimal moisture; DWP—water deficit.
Table 2. ANOVA for the leaves of strawberries.
VariableVariantStrain 1Strain 2Mean Value 1Mean Value 2Effect
MgCWP *DKB68C05244.403693.88UP
DKB68CMg5244.403617.79
C0PJ1.13693.885706.55
CMgPJ1.13617.795706.55
CaCWPDKB68C022,911.279477.90UP
DKB68CMg22,911.2710,103.08
C0PJ1.19477.9022,587.73
CMgPJ1.110,103.0822,587.73
NaCWPDKB70C0299.19600.02DOWN
Ca:PCWPDKB68C04.501.76UP
DKB68CMg4.501.73
C0PJ1.11.764.12
CMgPJ1.11.734.12
K:CaCWPDKB68C00.421.15UP
DKB68CMg0.421.06DOWN
C0PJ1.11.150.47DOWN
K:MgCWPCMgPJ1.11.060.47DOWN
DKB68CMg1.111.81
C0PJ1.11.801.14
CMgPJ1.11.811.14
Ca:MgCWPDKB68C02.681.58UP
DKB68CMg2.681.73
C0PJ1.11.582.42
CMgPJ1.11.732.42
CuDWP *DKB63C030.1810.39UP
DKB63CMg30.1813.44
C0PJ1.110.3926.20
MgDWPDKB26C04210.685610.40DOWN
DKB26CMg4210.685267.34
DKB58C04193.805610.40
DKB58CMg4193.805267.34
DKB63C03777.405610.40
DKB63CMg3777.405267.34
DKB64C03183.375610.40
DKB64CMg3183.375267.34
DKB65C03780.705610.40
DKB65CMg3780.705267.34
DKB68C03668.175610.40
DKB68CMg3668.175267.34
DKB70C03667.005610.40
DKB70CMg3667.005267.34
DKB84C04163.435610.40
DKB84CMg4163.435267.34
DLGB3C04484.605610.40
C0PJ1.15610.403950.80
CMgPJ1.15267.343950.80
CaDWPDKB26C011,745.1521,415.13DOWN
DKB26CMg11,745.1519,522.86
DKB58C010,942.1021,415.13
DKB58CMg10,942.1019,522.86
DKB63C012,337.8021,415.13
DKB63CMg12,337.8019,522.86
DKB64C010,129.5021,415.13
DKB64CMg10,129.5019,522.86
DKB65C08819.9021,415.13
DKB65CMg8819.9019,522.86
CaDWPDKB68C010,129.4021,415.13DOWN
DKB68CMg10,129.4019,522.86
DKB70C09166.8021,415.13
DKB70CMg9166.8019,522.86
DKB84C010,643.6021,415.13
DKB84CMg10,643.6019,522.86
C0PJ1.121,415.1312,796.30
CMgPJ1.119,522.8612,796.30
NaDWPDKB63CMg639.75338.09UP
PDWPDKB63C010,149.005534.48UP
DKB63CMg10,149.005383.28
C0PJ1.15534.489392.40
CMgPJ1.15383.289392.40
Ca:PDWPDKB26C02.003.91DOWN
DKB26CMg2.003.65
DKB58C01.713.91
DKB58CMg1.713.65
DKB63C01.223.91
DKB63CMg1.223.65
DKB64C01.873.91
DKB64CMg1.873.65
DKB65C01.613.91
DKB65CMg1.613.65
DKB68C01.723.91
DKB68CMg1.723.65
DKB70C01.533.91
DKB70CMg1.533.65
DKB84C02.013.91
DKB84CMg2.013.65
DLGB3C02.913.91
C0PJ1.13.911.37
CMgPJ1.13.651.37
K:CaDWPDKB26C00.780.40UP
DKB26CMg0.780.44
DKB58C00.820.40
DKB58CMg0.820.44
DKB63C00.790.40
DKB63CMg0.790.44
DKB64C00.930.40
DKB64CMg0.930.44
K:CaDWPDKB65C00.980.40UP
DKB65CMg0.980.44
DKB68C00.960.40
DKB68CMg0.960.44
DKB70C00.990.40
DKB70CMg0.990.44
DKB84C00.850.40
DKB84CMg0.850.44
C0PJ1.10.400.77
CMgPJ1.10.440.77
K:MgDWPDKB63C01.580.94UP
DKB63CMg1.581.00
DKB64C01.820.94
DKB64CMg1.821.00
DKB65C01.400.94
DKB68C01.620.94
DKB68CMg1.621.00
DKB70C01.520.94
DKB70CMg1.521.00
C0PJ1.10.941.51
CMgPJ1.11.001.51
Ca:MgDWPDKB26C01.712.34DOWN
DKB26CMg1.712.27
DKB58C01.602.34
DKB58CMg1.602.27
DKB65C01.442.34
DKB65CMg1.442.27
DKB68C01.622.34
DKB68CMg1.622.27
DKB70C01.532.34
DKB70CMg1.532.27
DKB84C01.572.34
DKB84CMg1.572.27
* CWP—optimal moisture; DWP—water deficit.
Disclaimer/Publisher’s Note: The statements, opinions and data contained in all publications are solely those of the individual author(s) and contributor(s) and not of MDPI and/or the editor(s). MDPI and/or the editor(s) disclaim responsibility for any injury to people or property resulting from any ideas, methods, instructions or products referred to in the content.

