
Agricultural Land Suitability Assessment at the County Scale in Taiyuan, China

Abstract
:1. Introduction
2. Materials and Methods
2.1. Study Area and Data Sources and Preprocessing
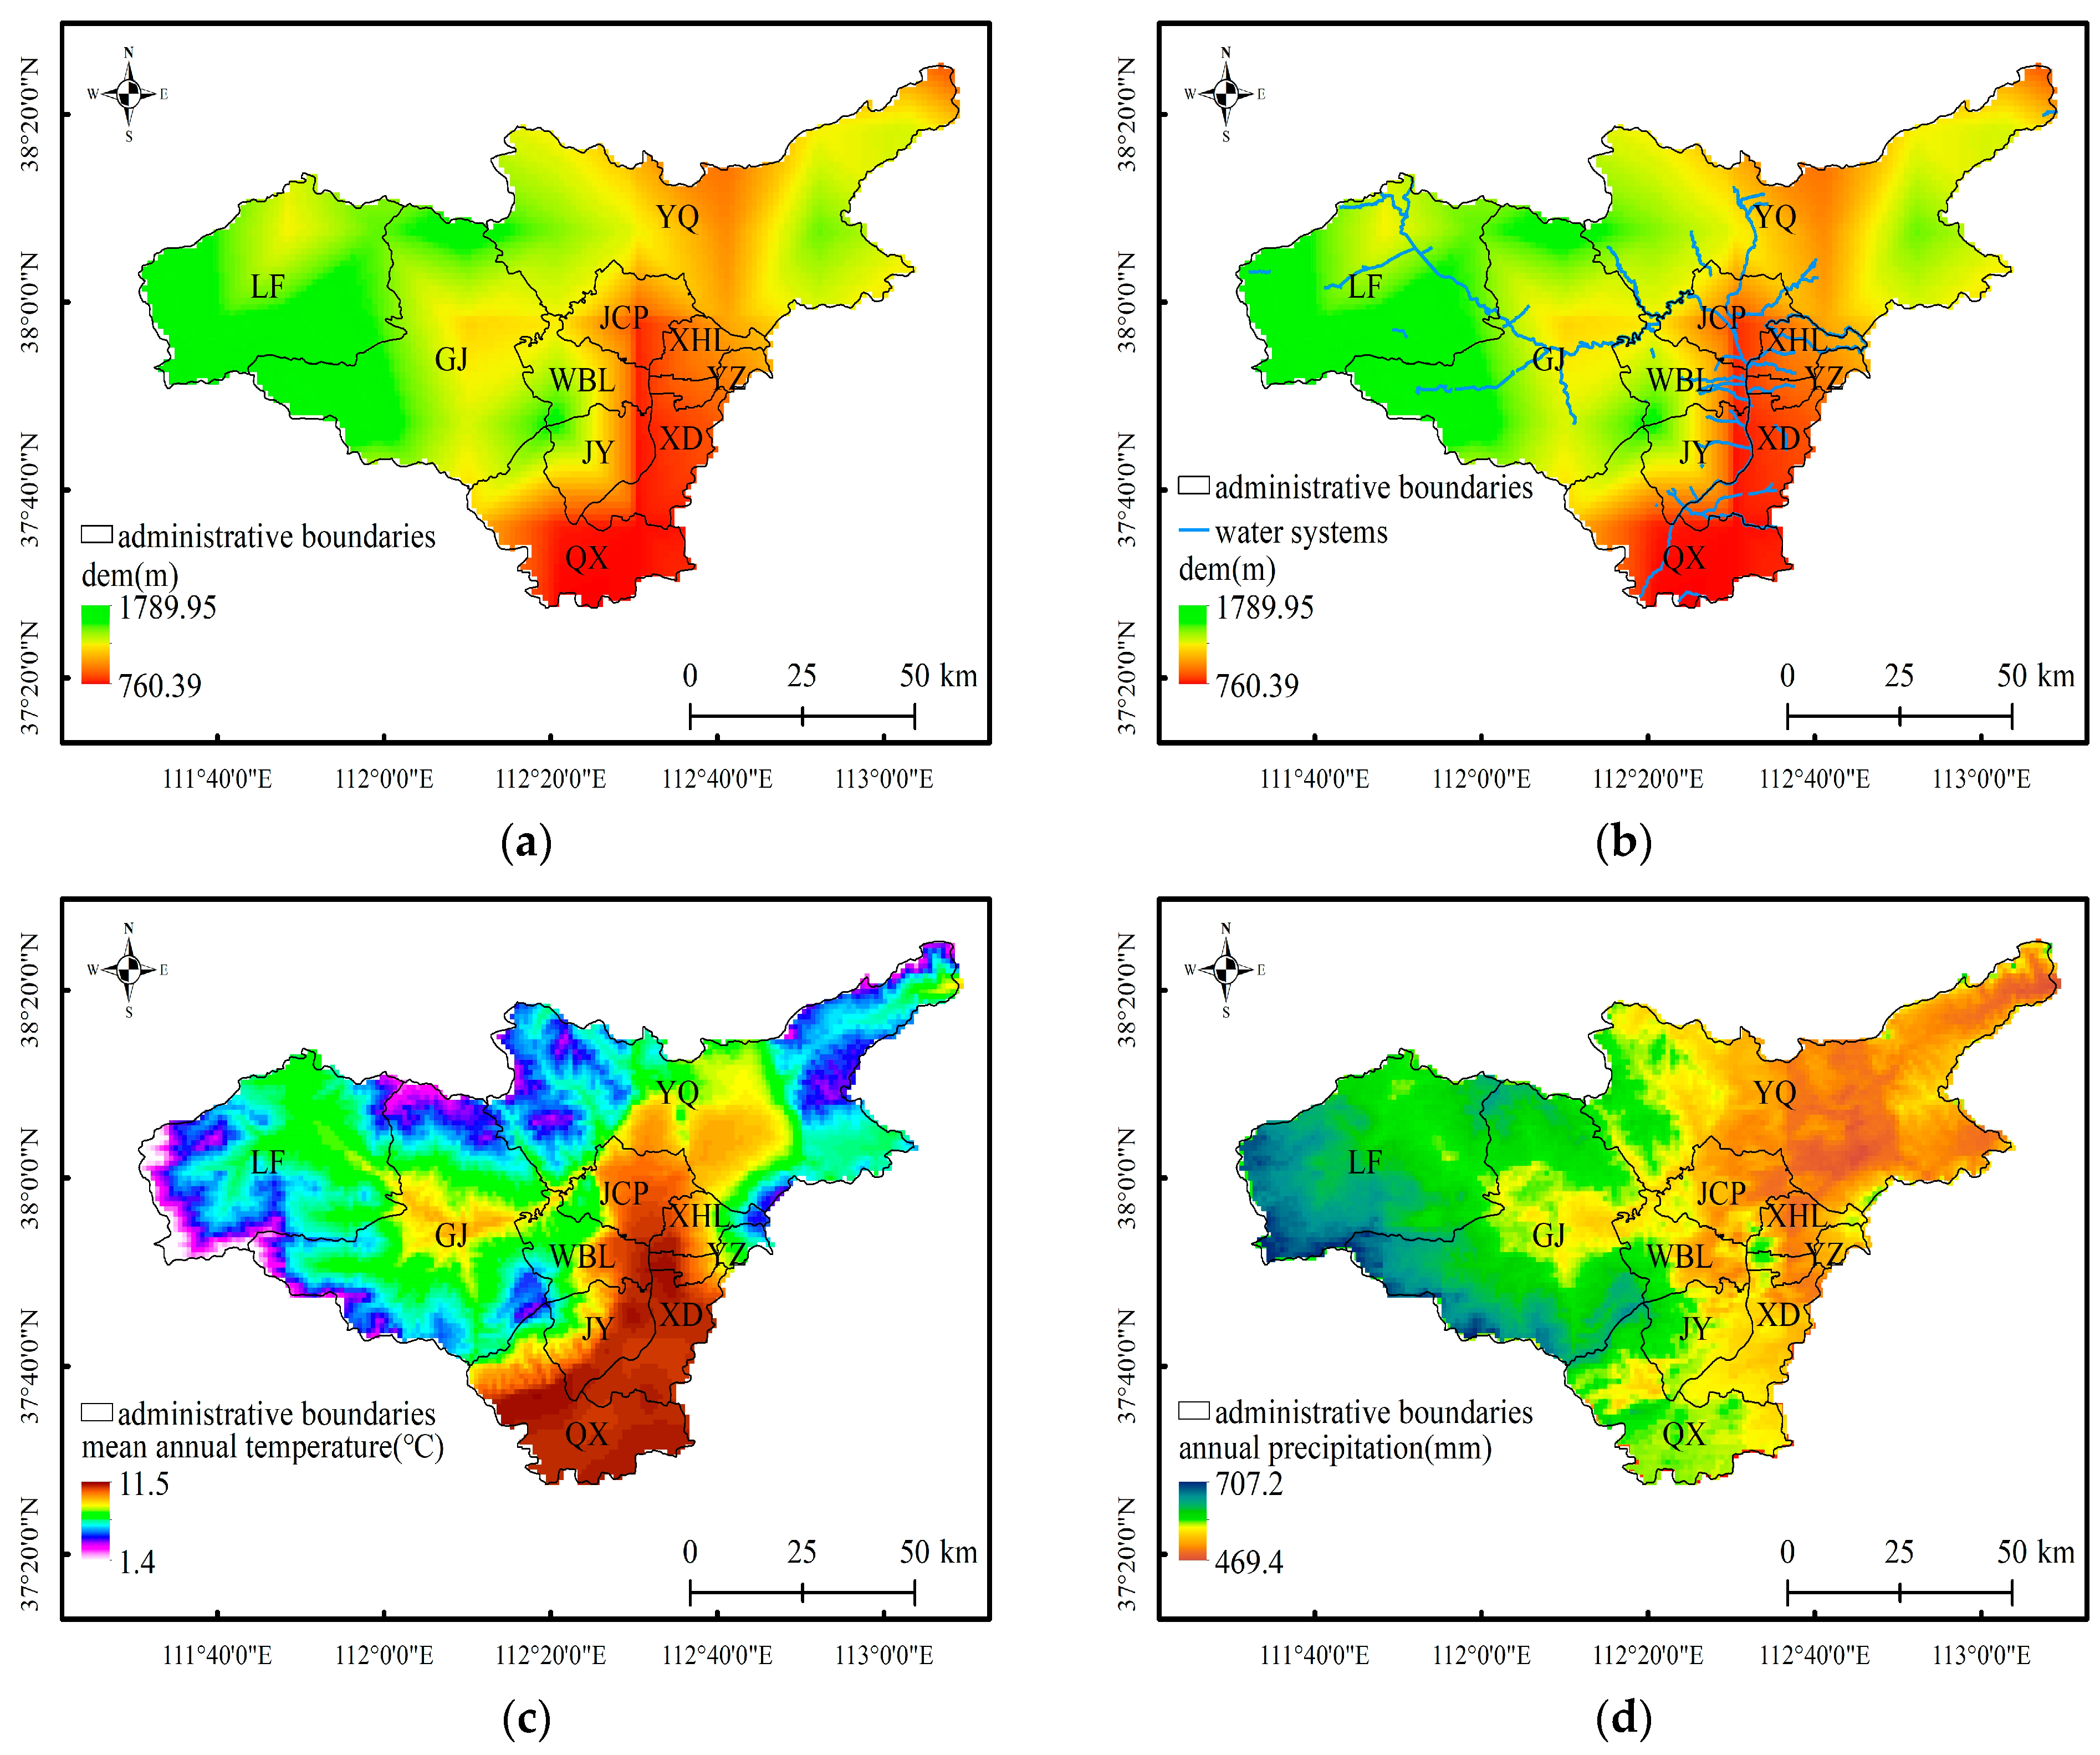
2.1.1. Study Area
2.1.2. Data Sources and Preprocessing
2.2. Methods
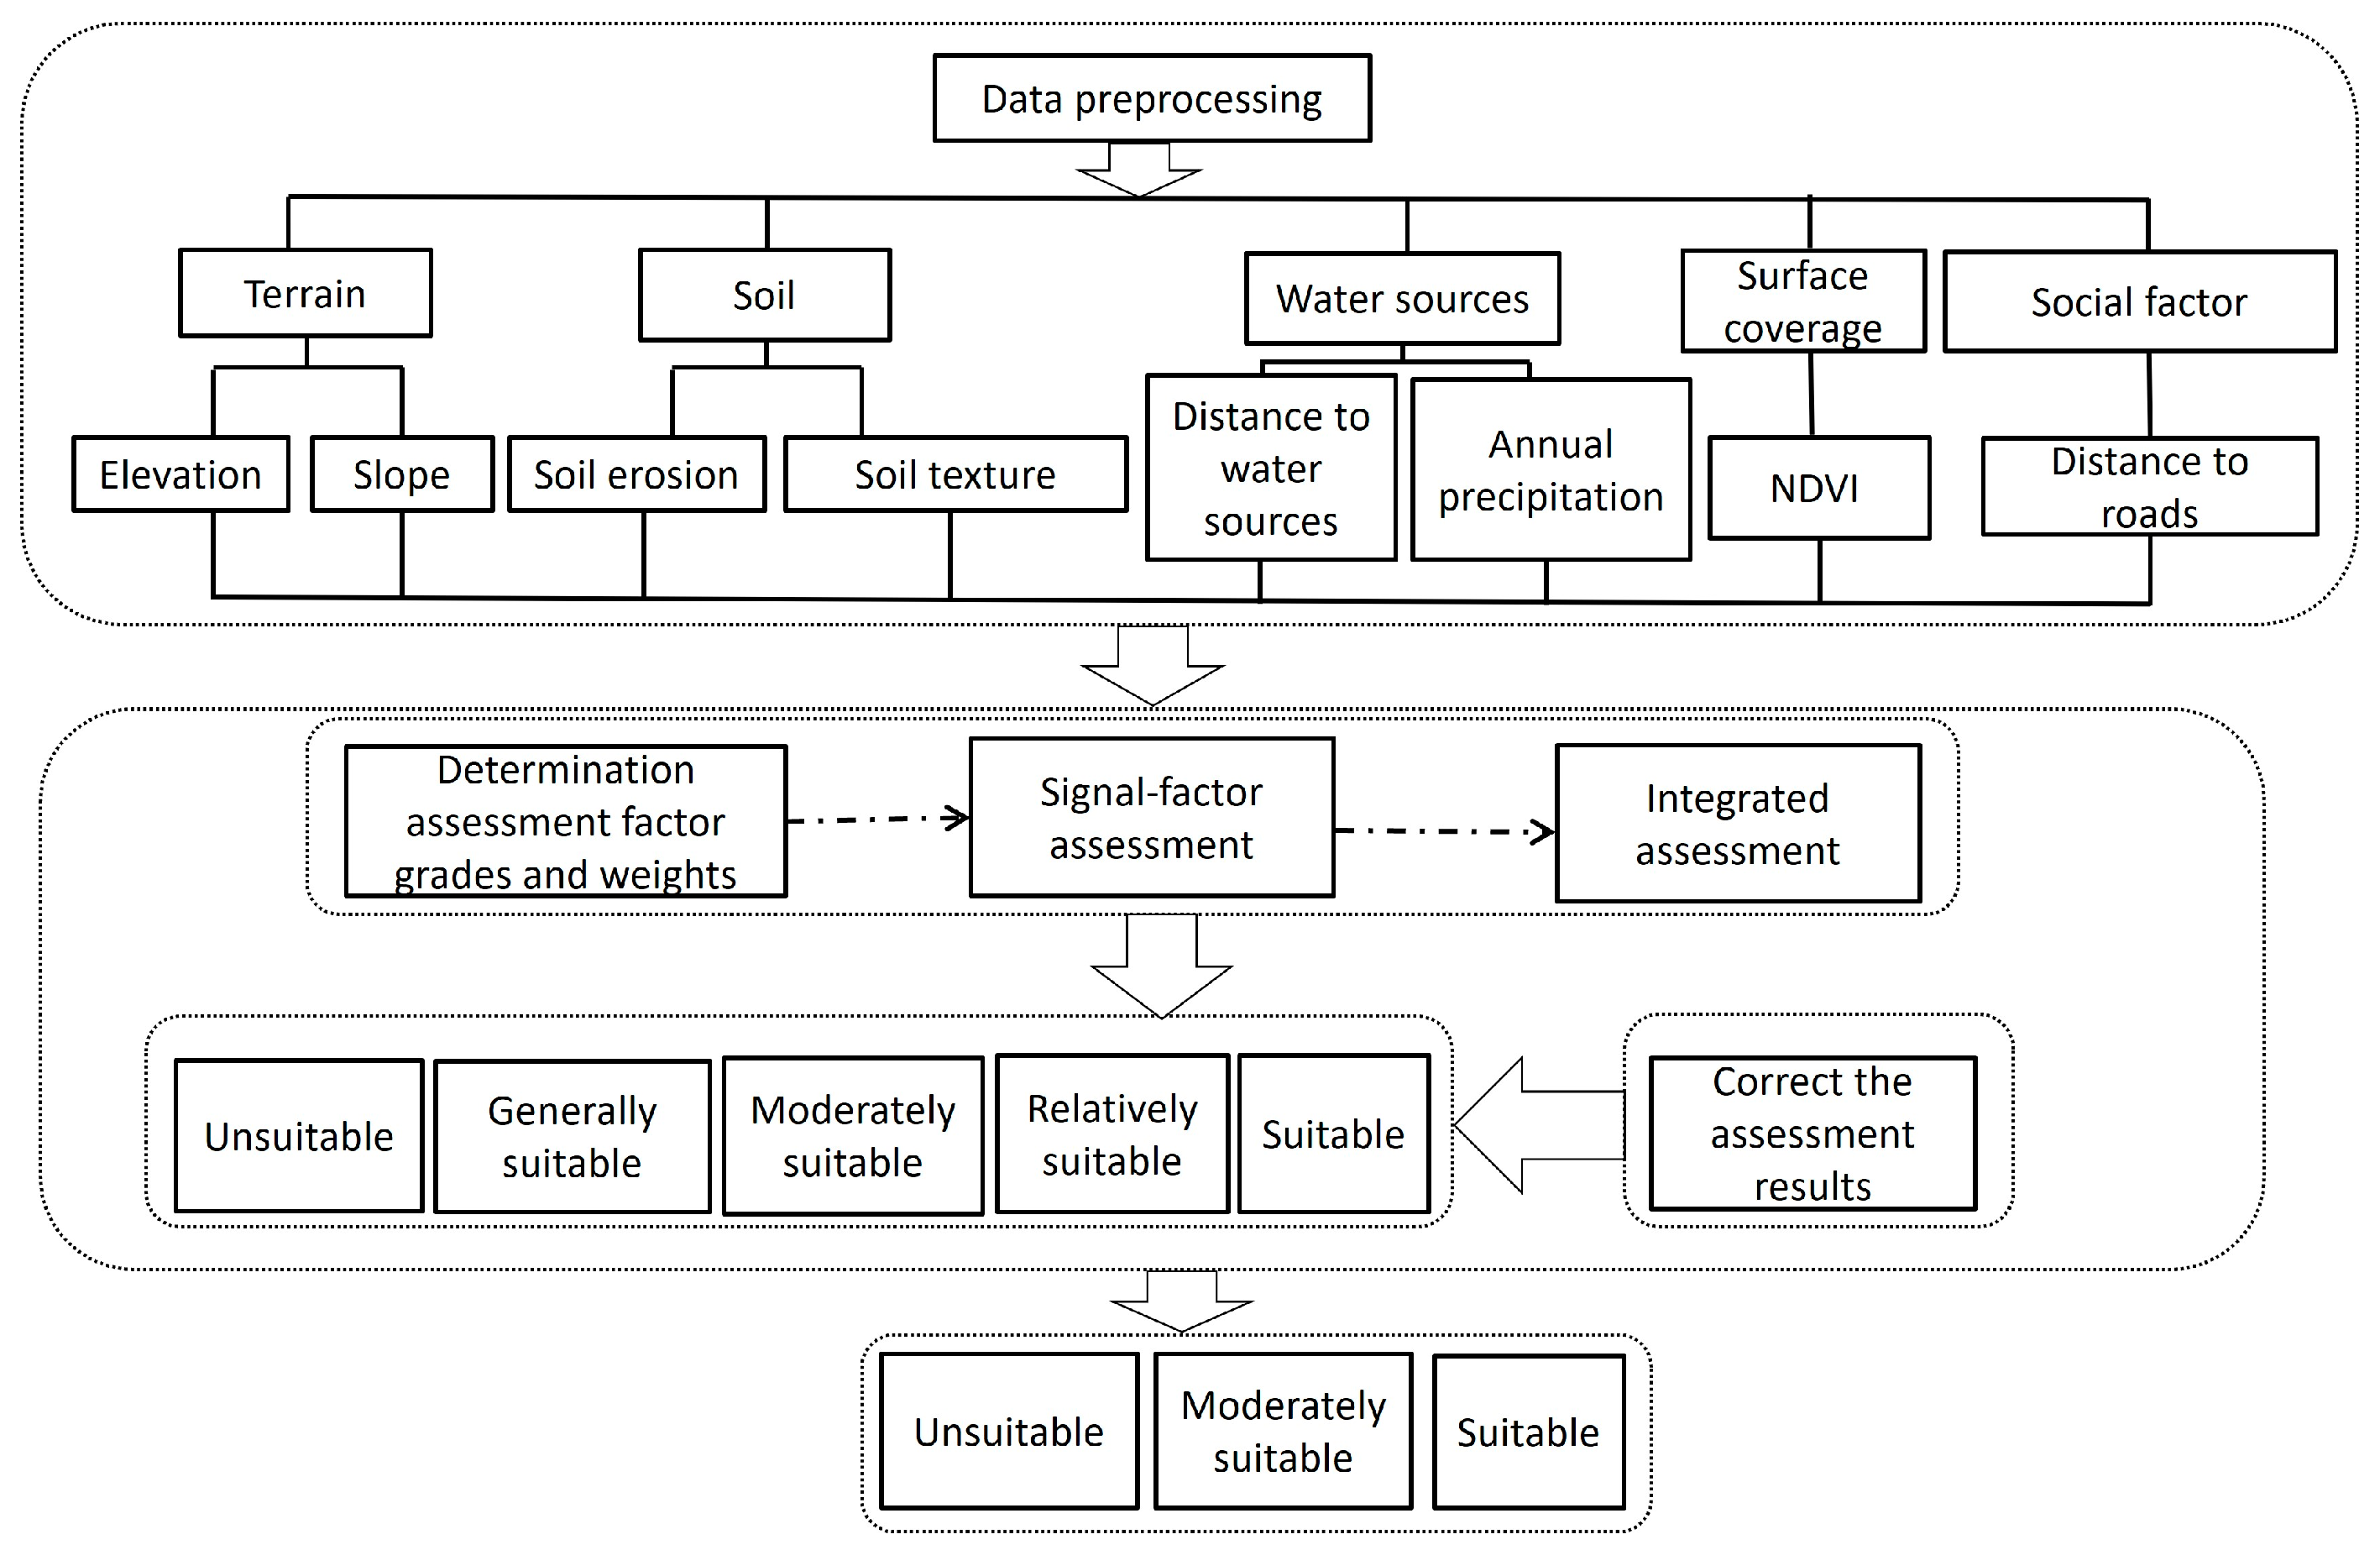
2.2.1. The Construction of the Index System
2.2.2. Classification of Assessment Factor Levels
- DEM
- 2.
- Slope
- 3.
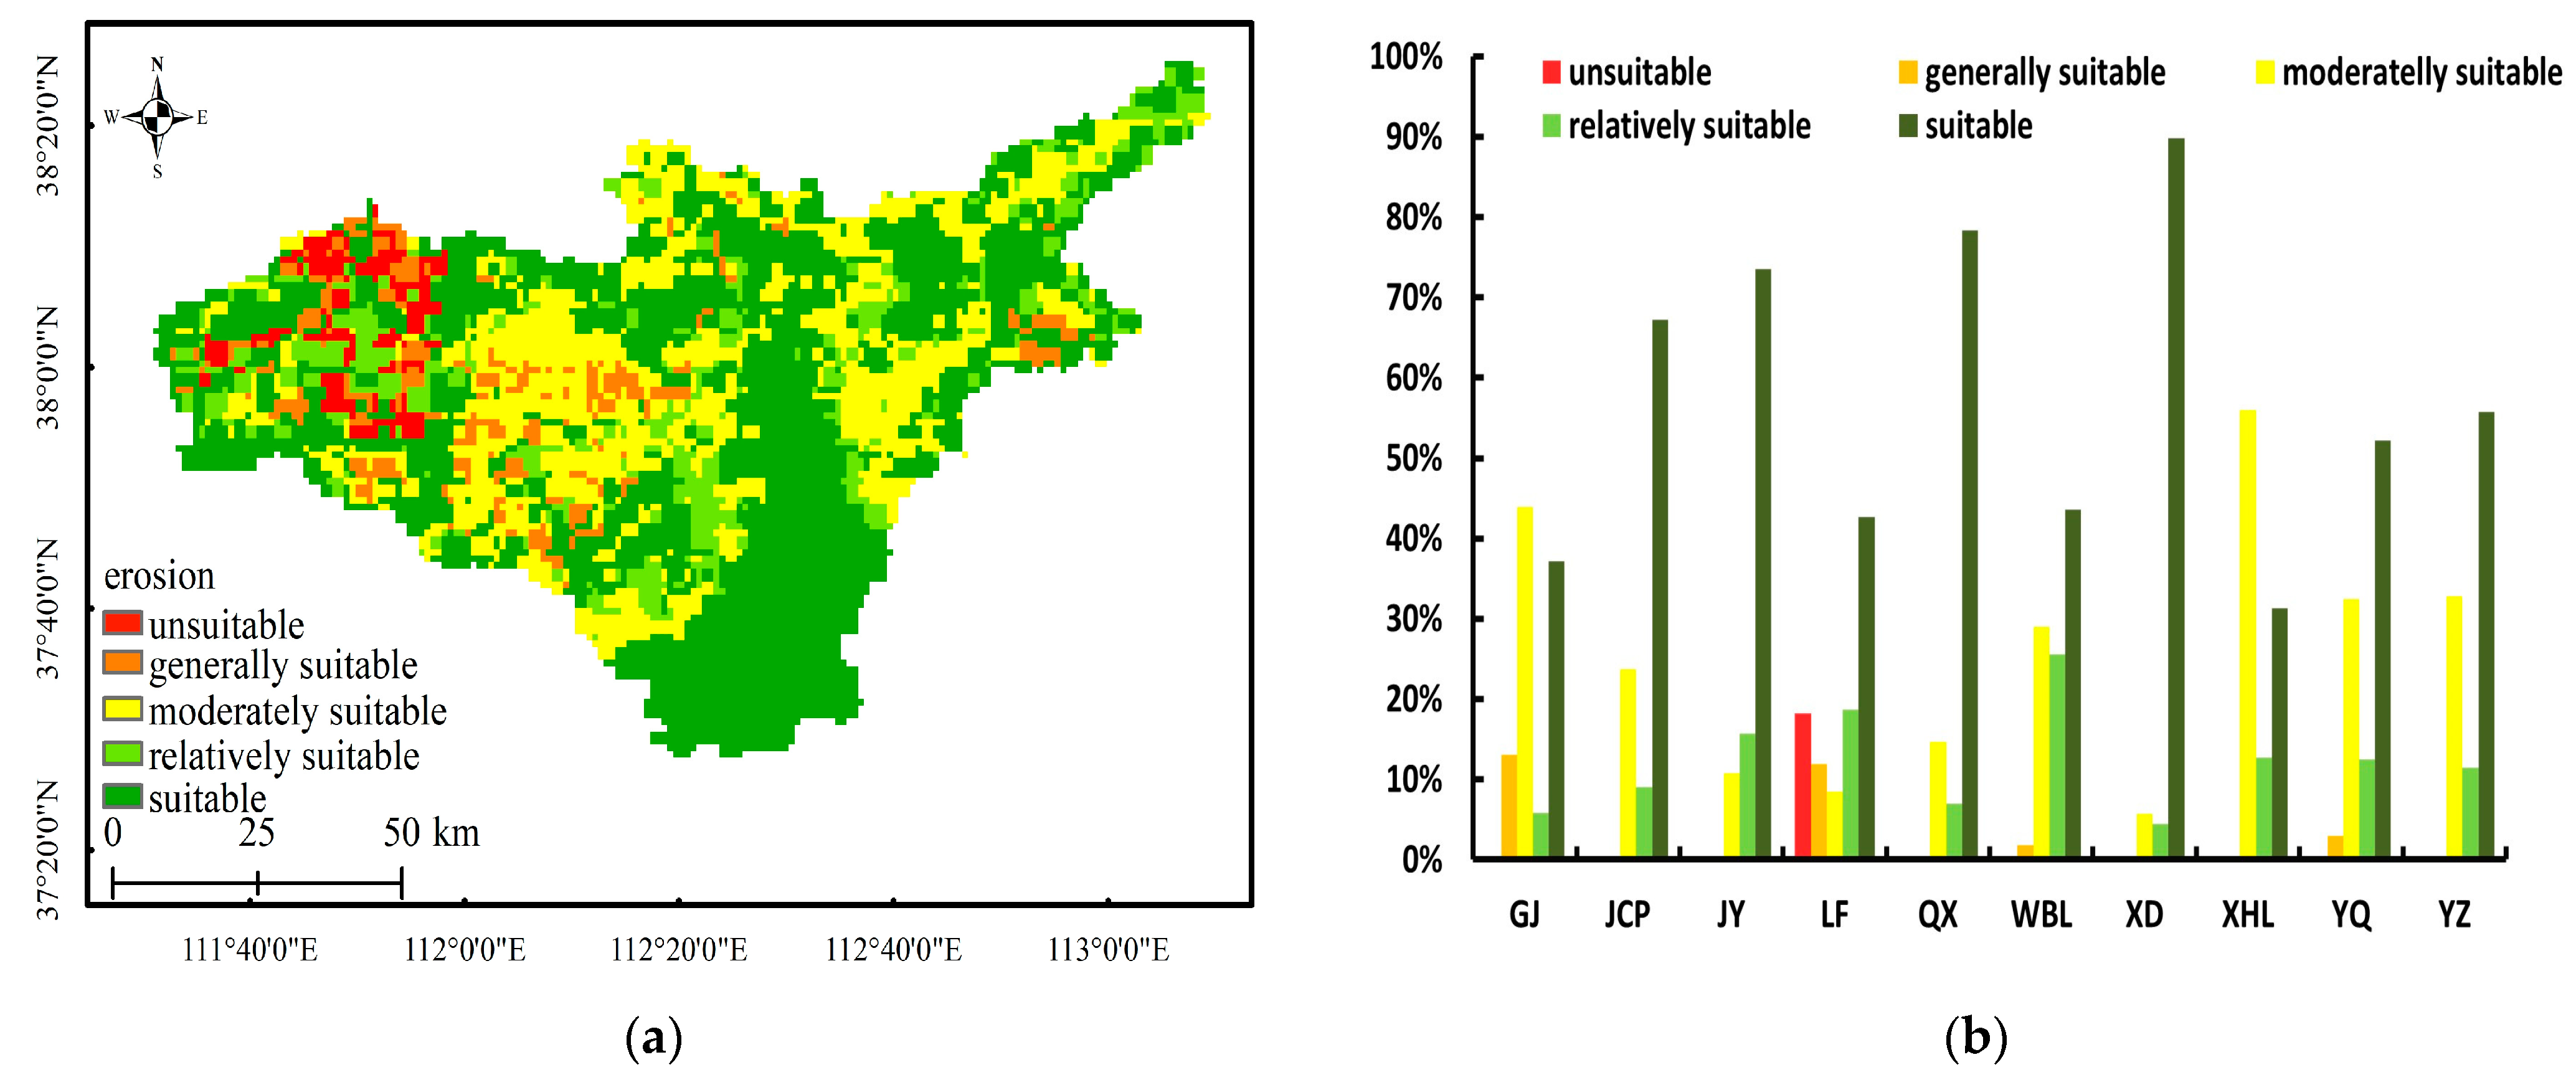
- Soil erosion
- 4.
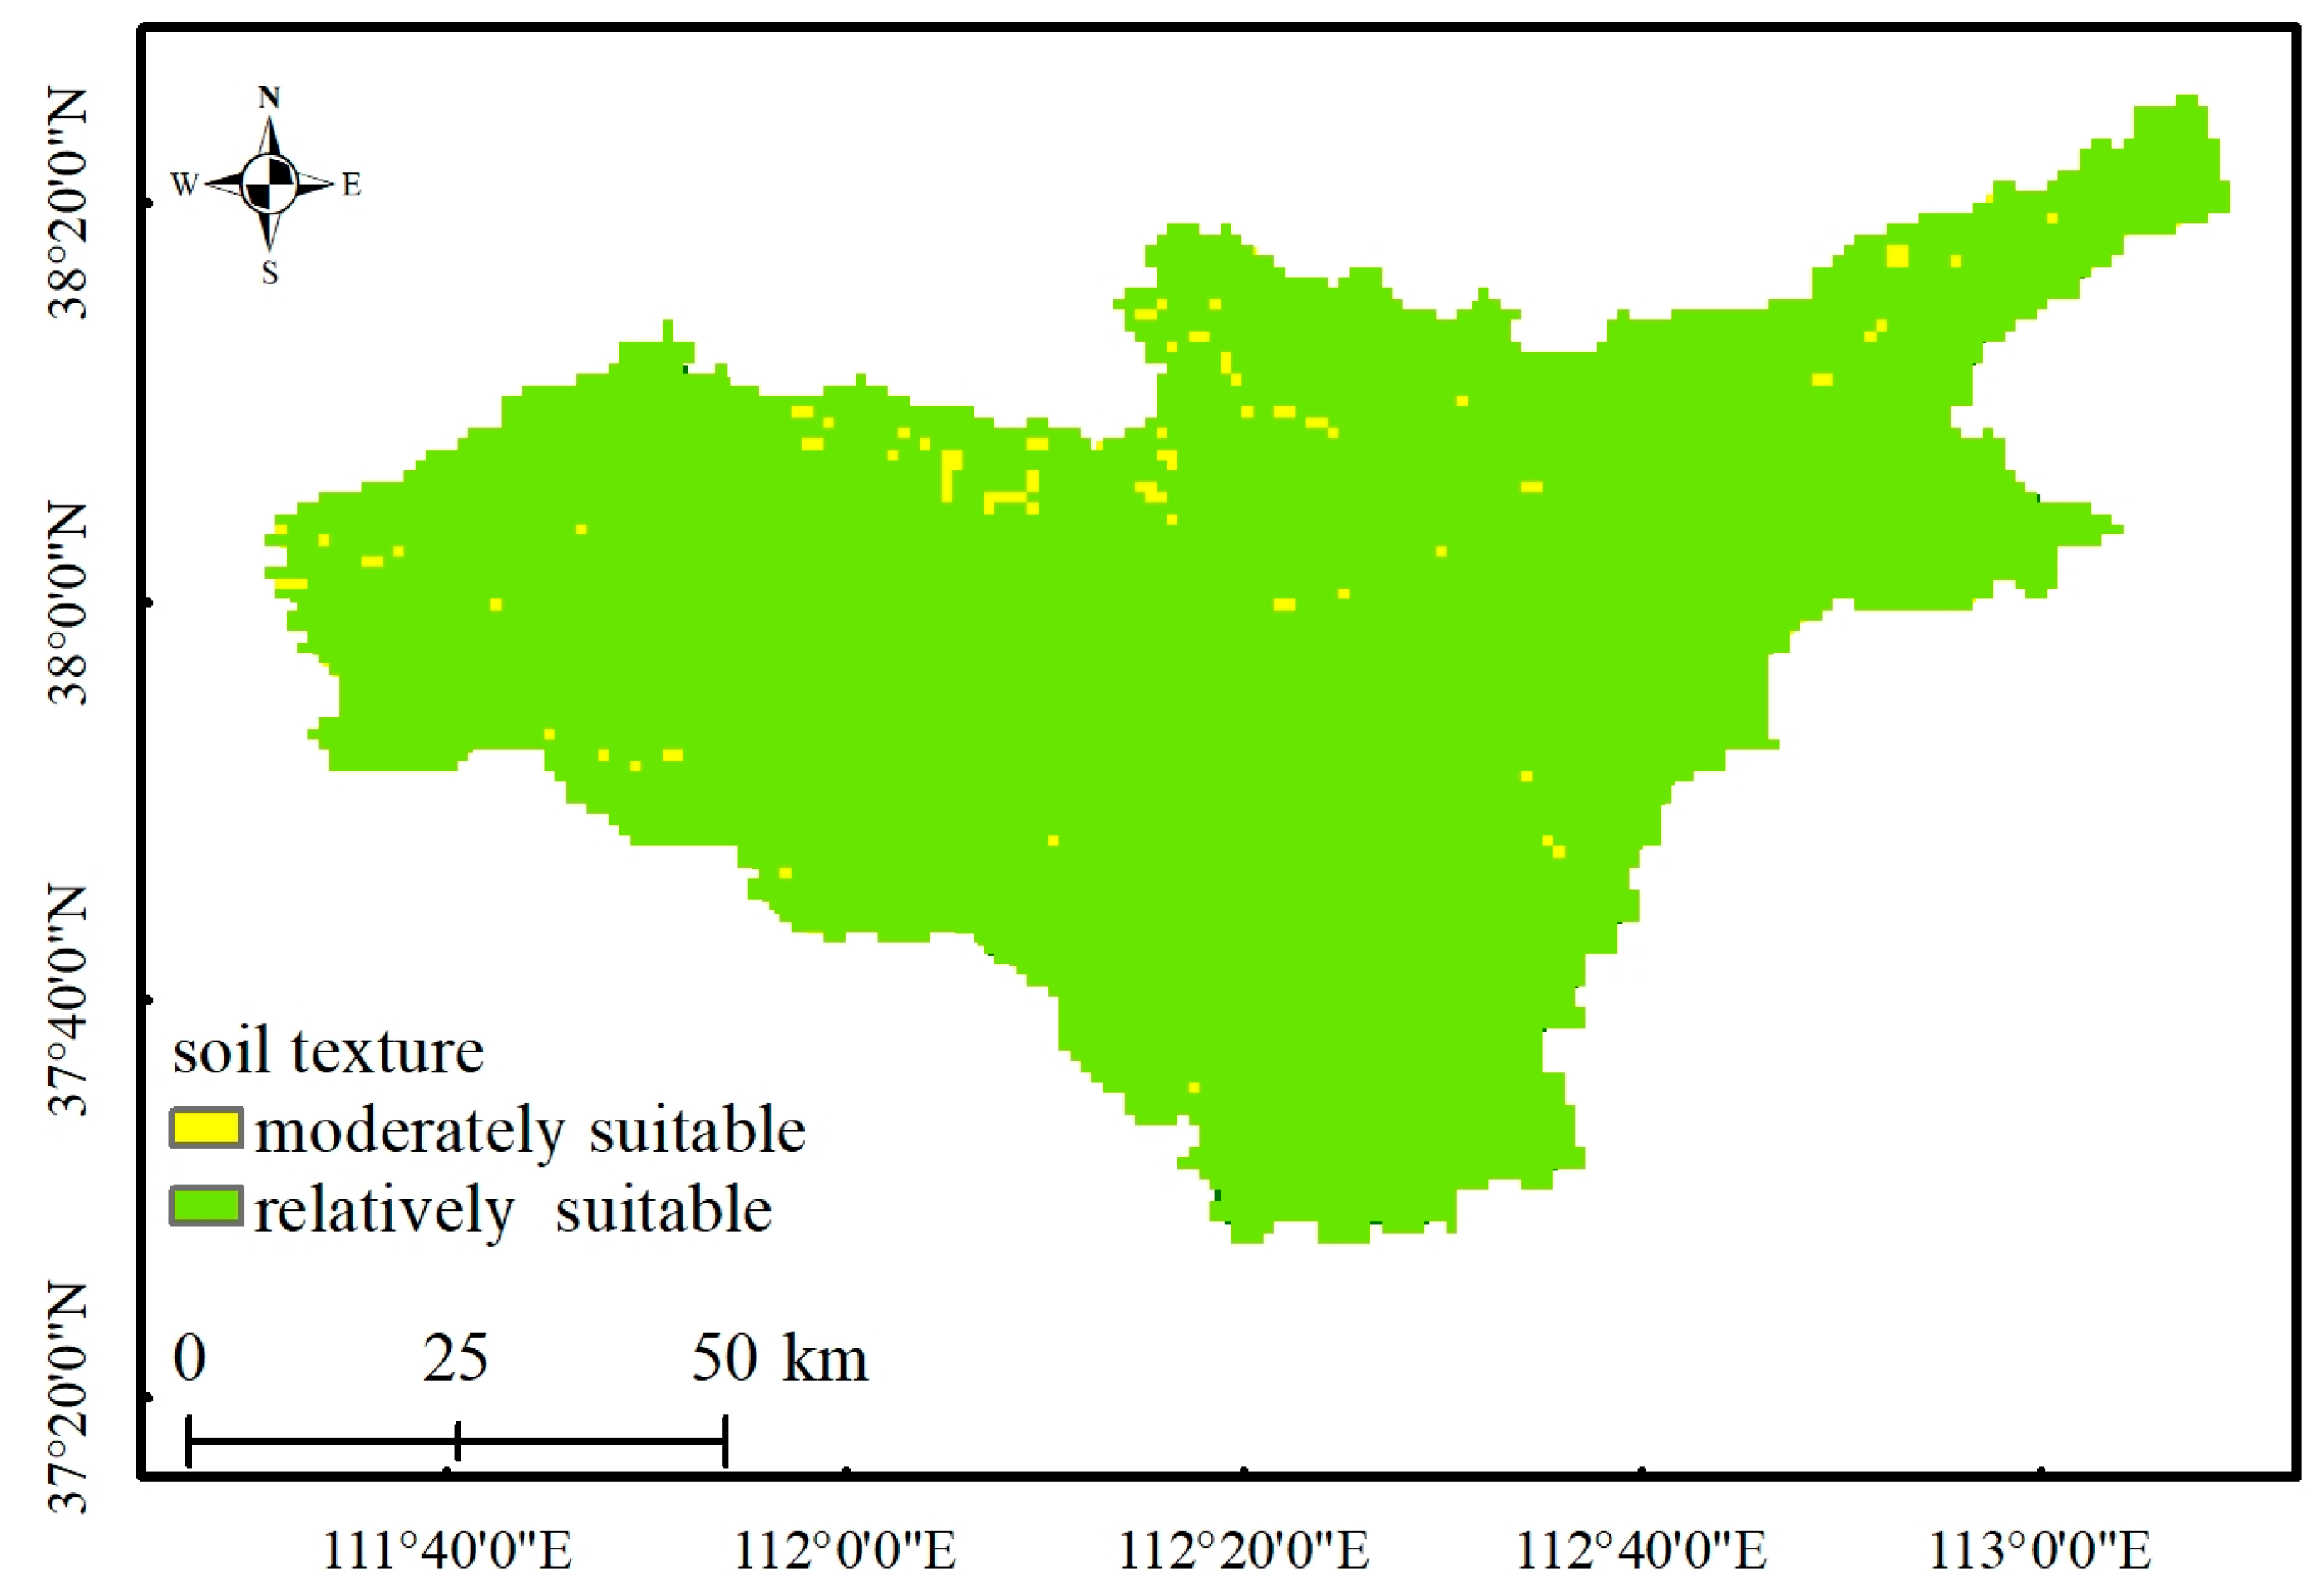
- Soil texture
- 5.
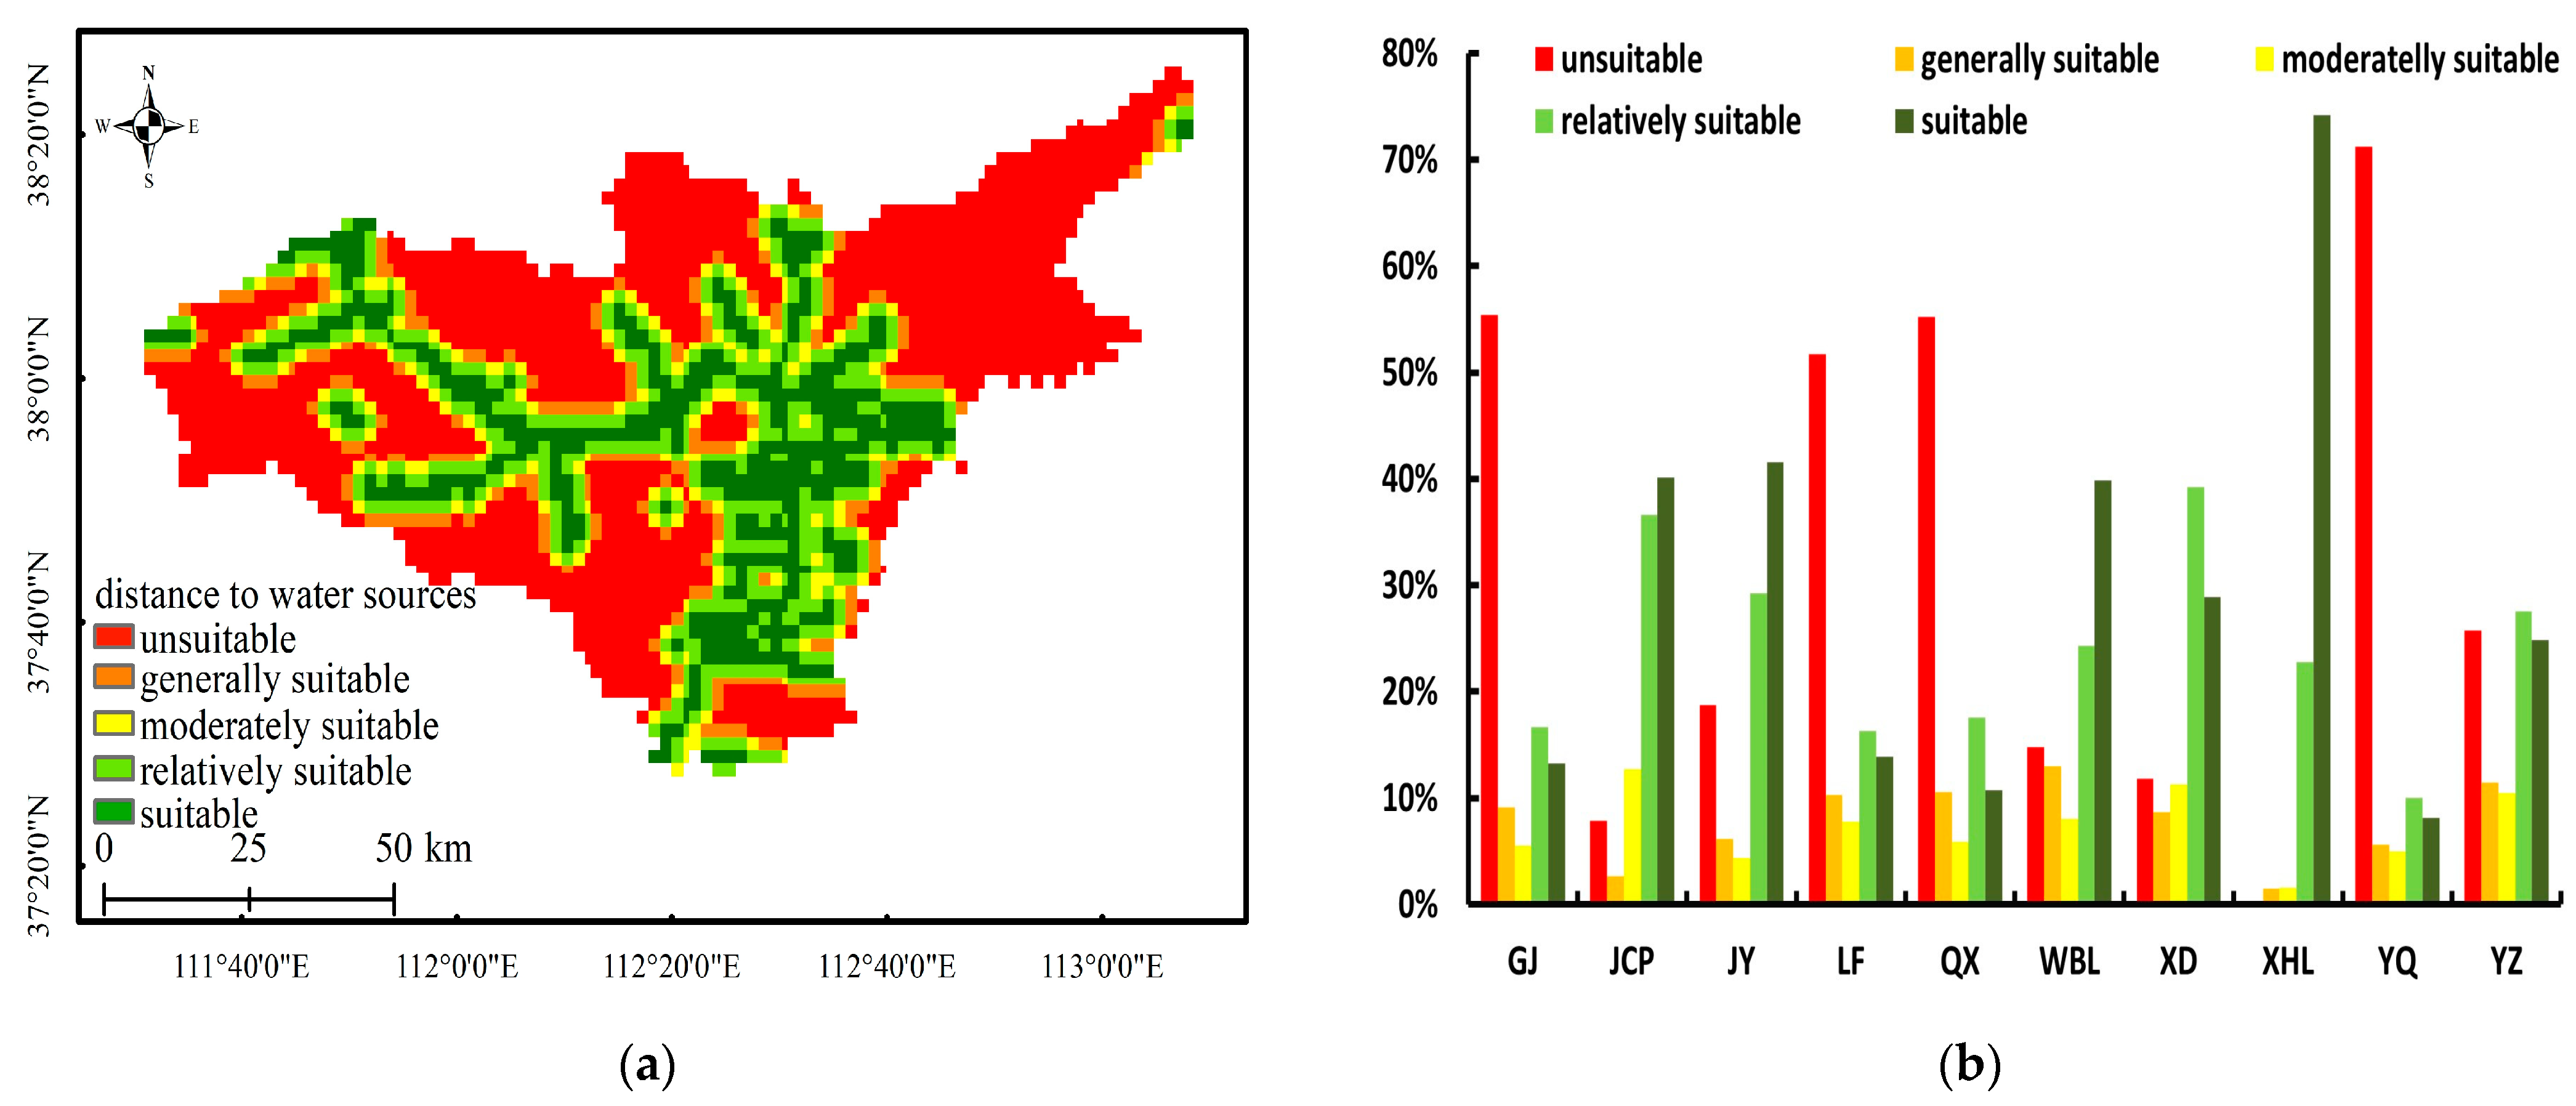
- Distance to water sources
- 6.
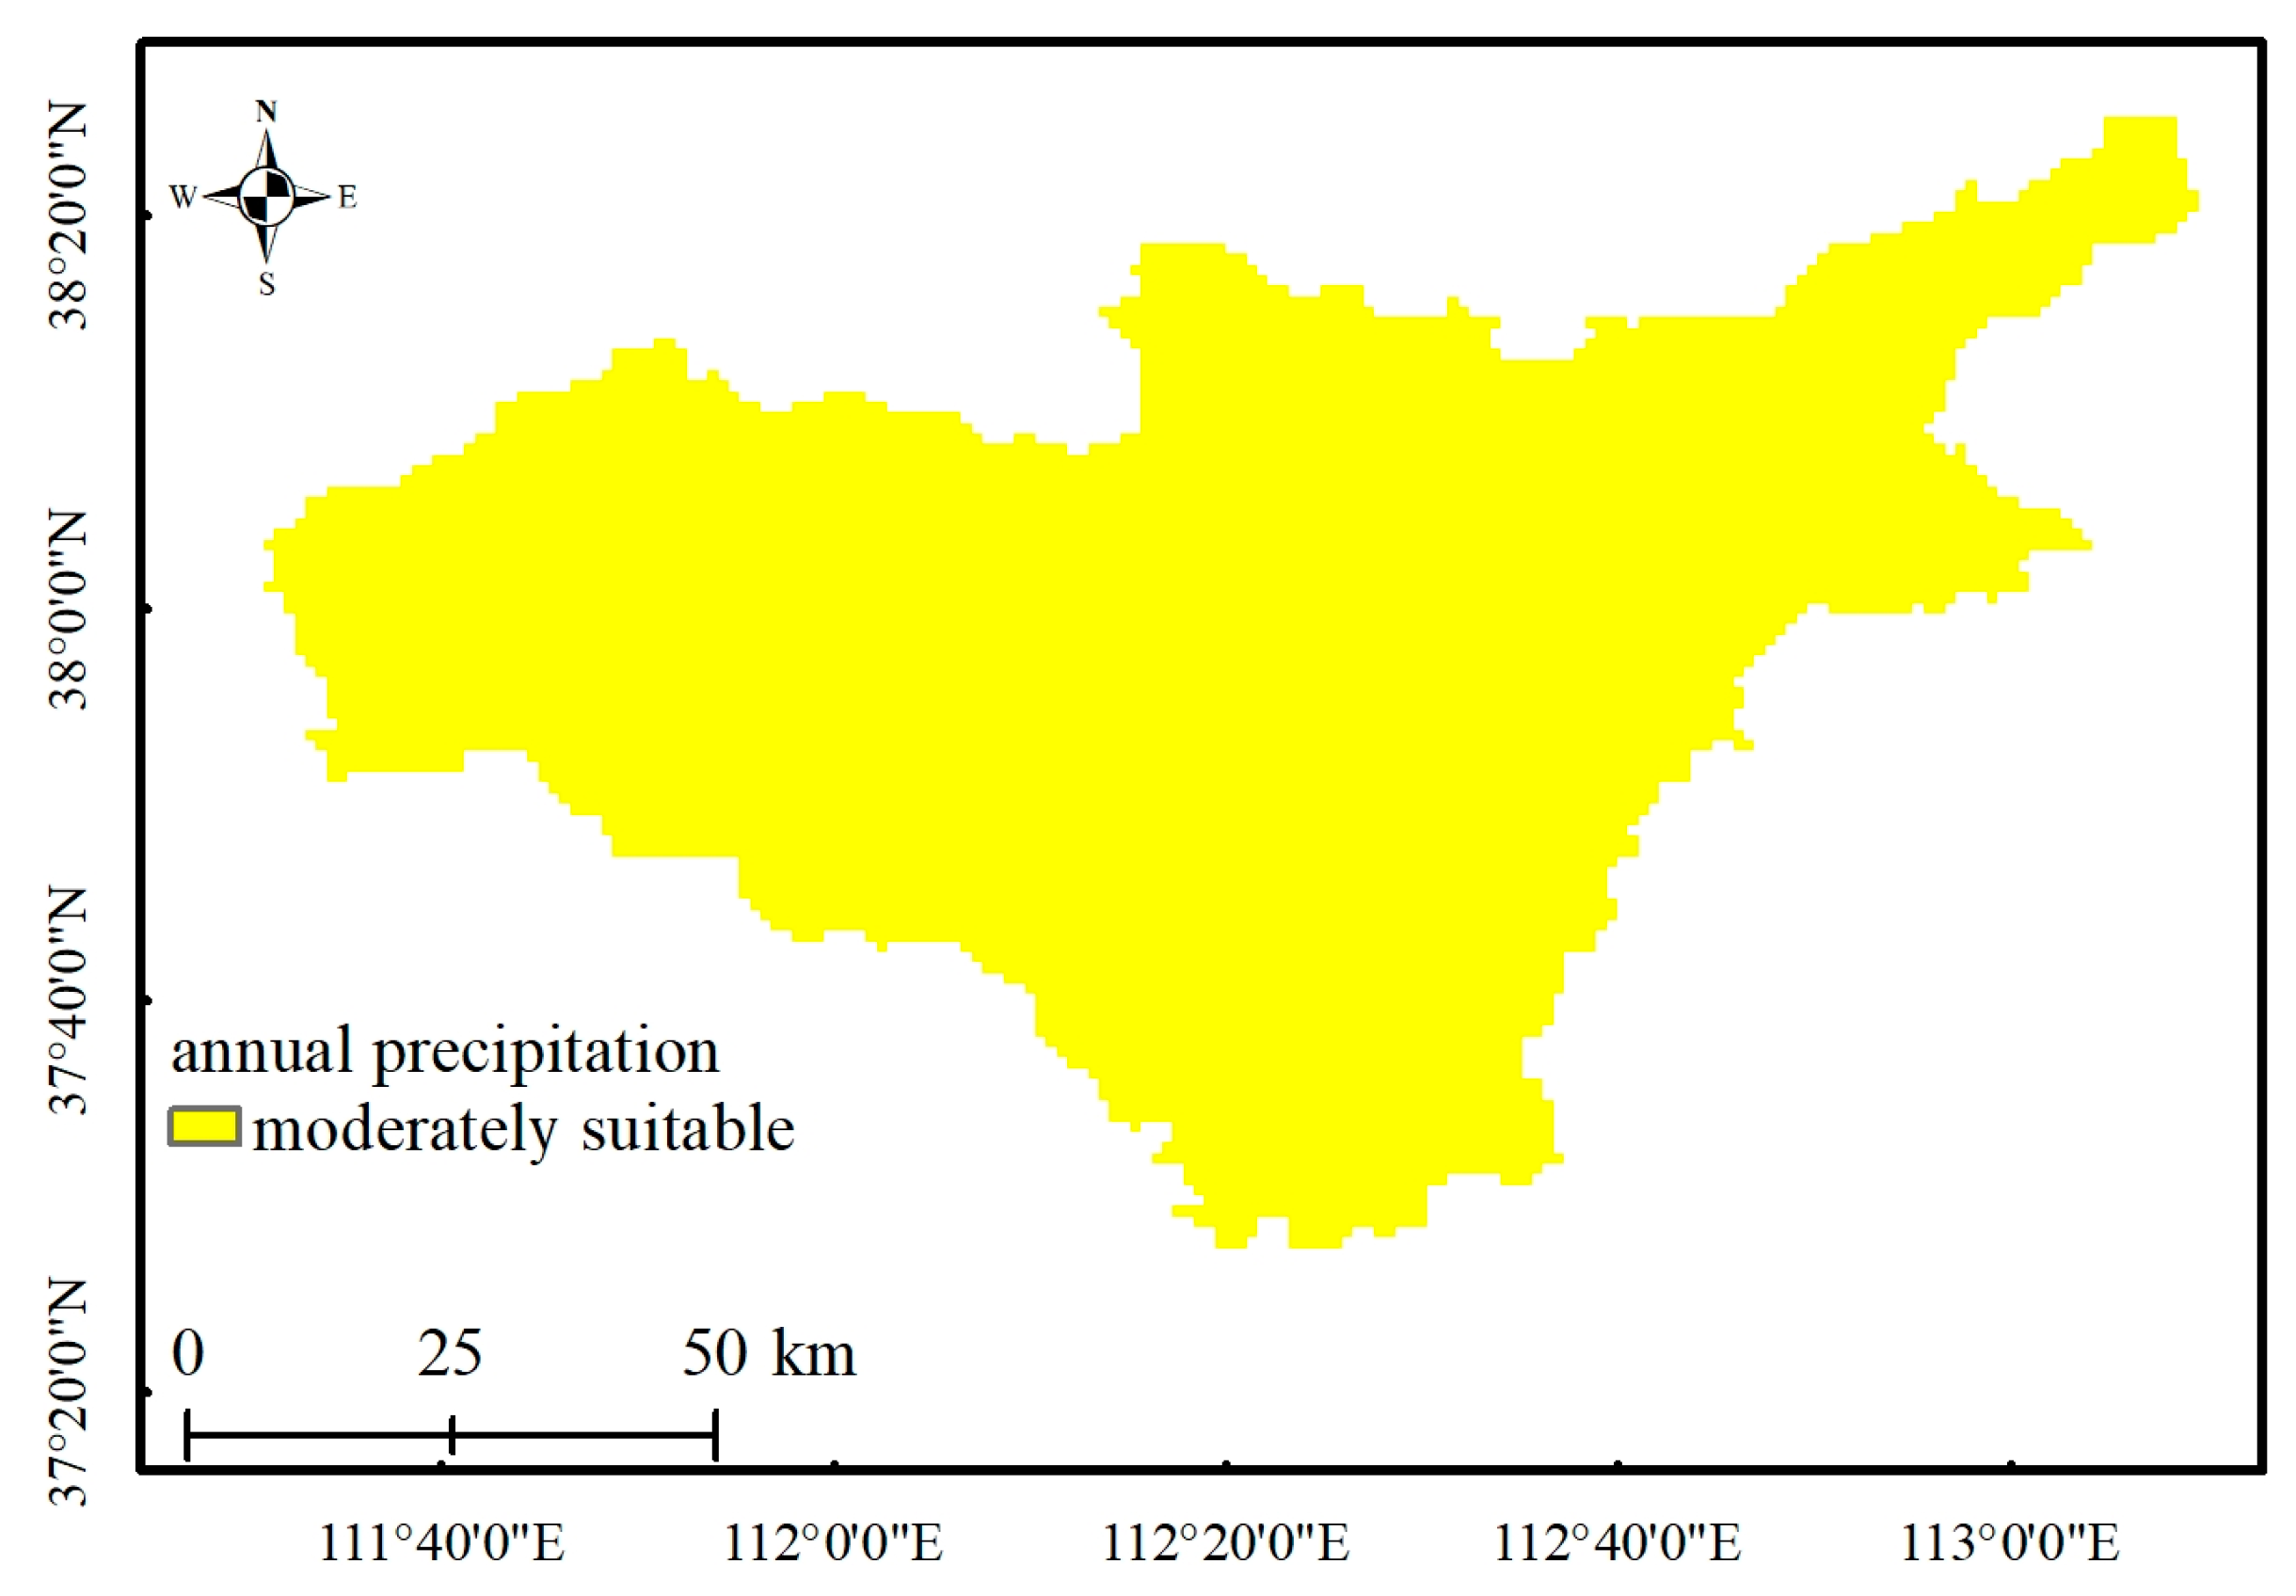
- Annual precipitation
- 7.
- NDVI
- 8.
- Distance to roads
2.2.3. Determination of Assessment Factor Weights
2.2.4. Integrated Assessment Model
3. Results
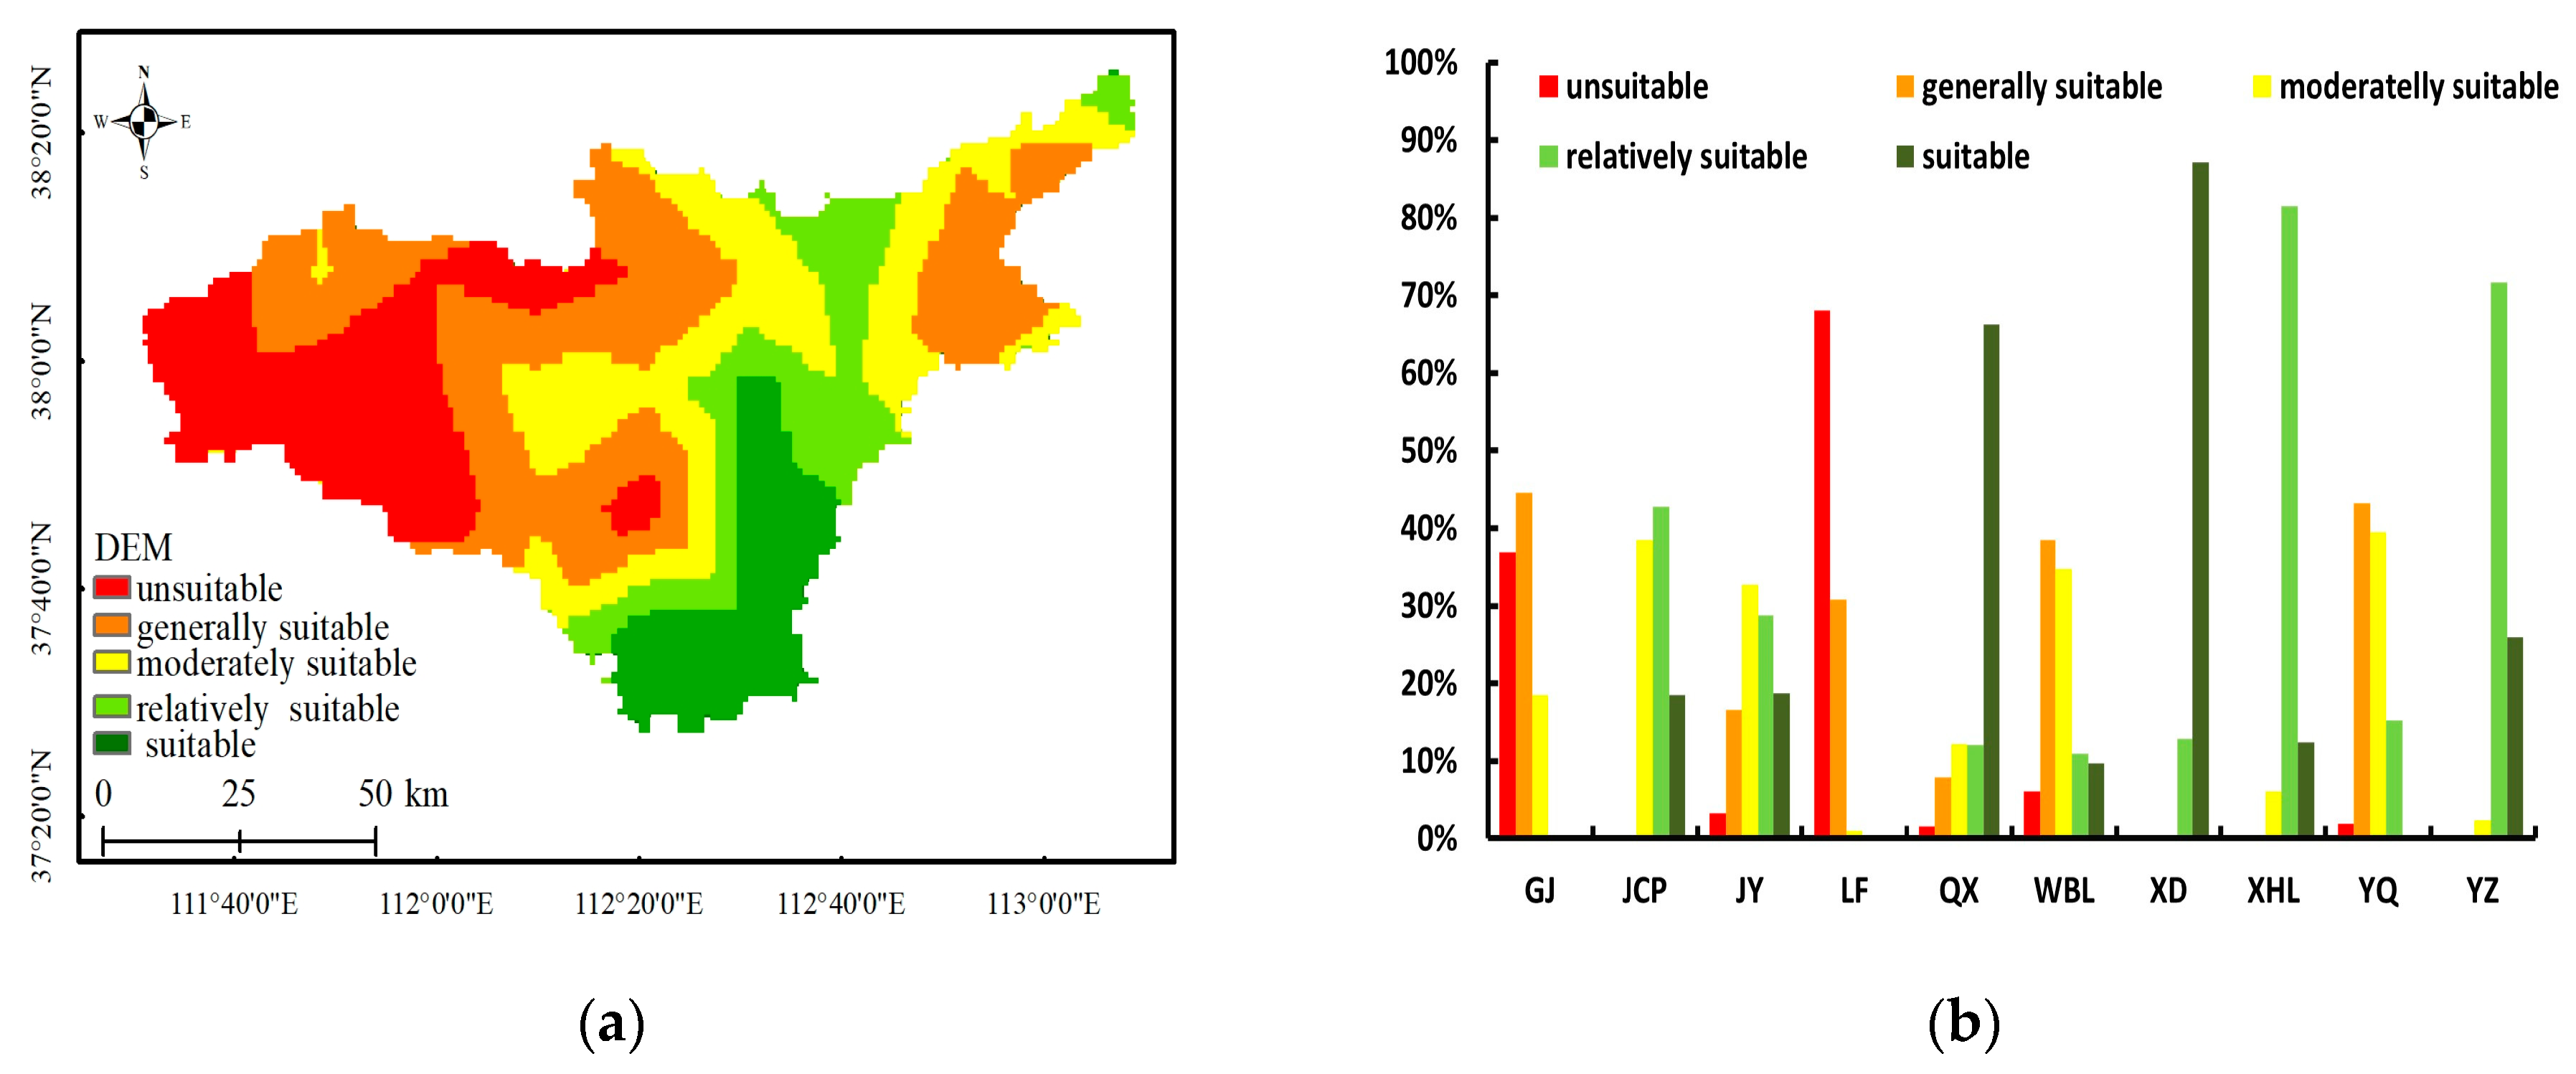
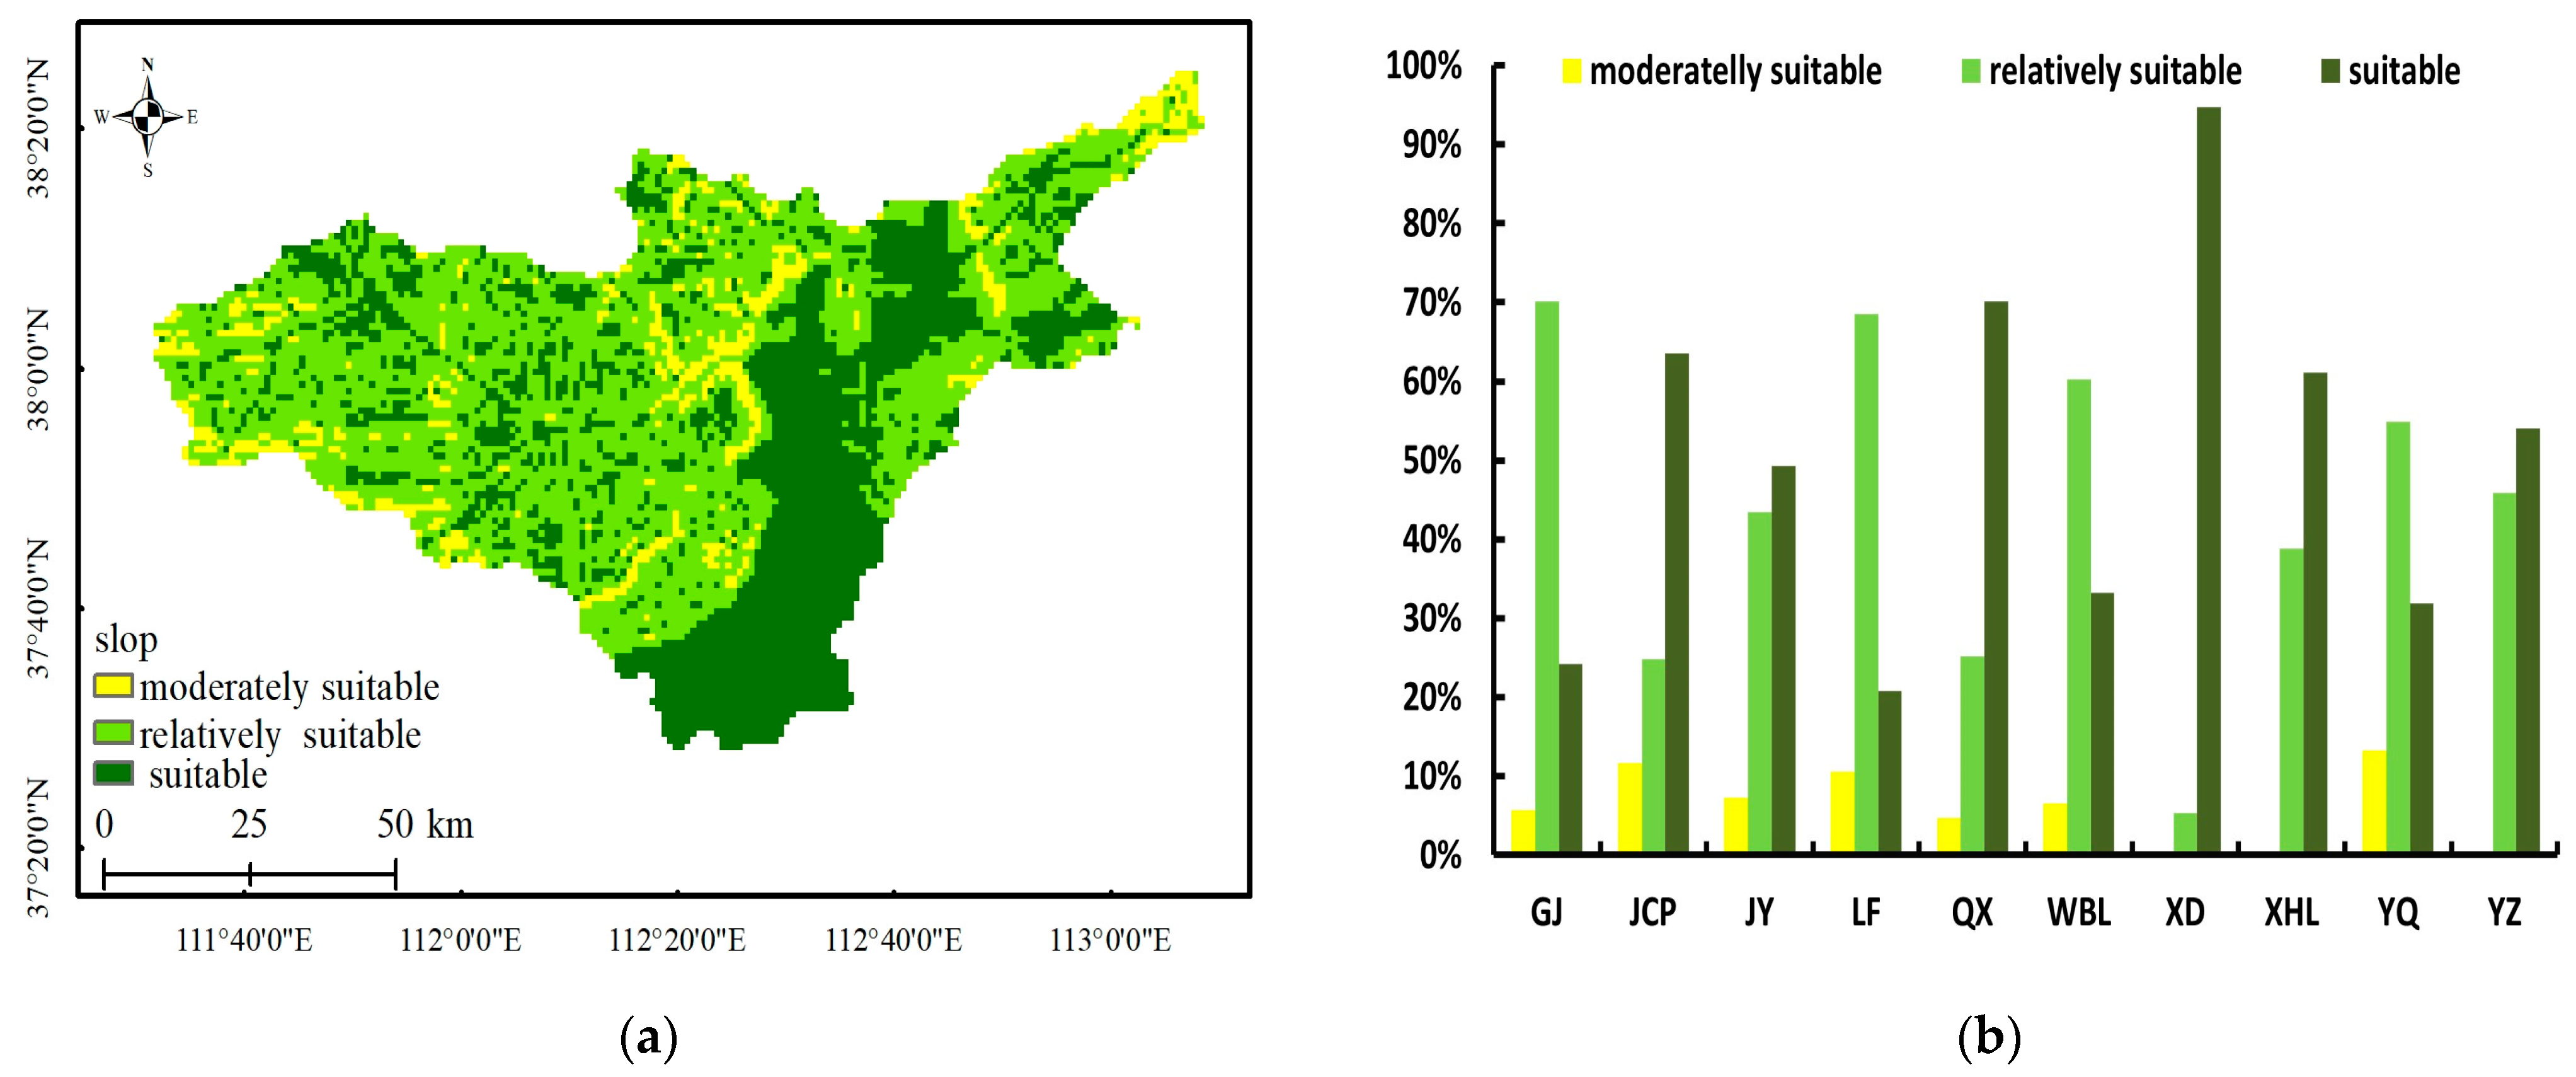
3.1. Results of Single-Factor Assessment
- DEM
- 2.
- Slope
- 3.
- Soil erosion
- 4.
- Soil texture
- 5.
- Distance to water sources
- 6.
- Annual precipitation
- 7.
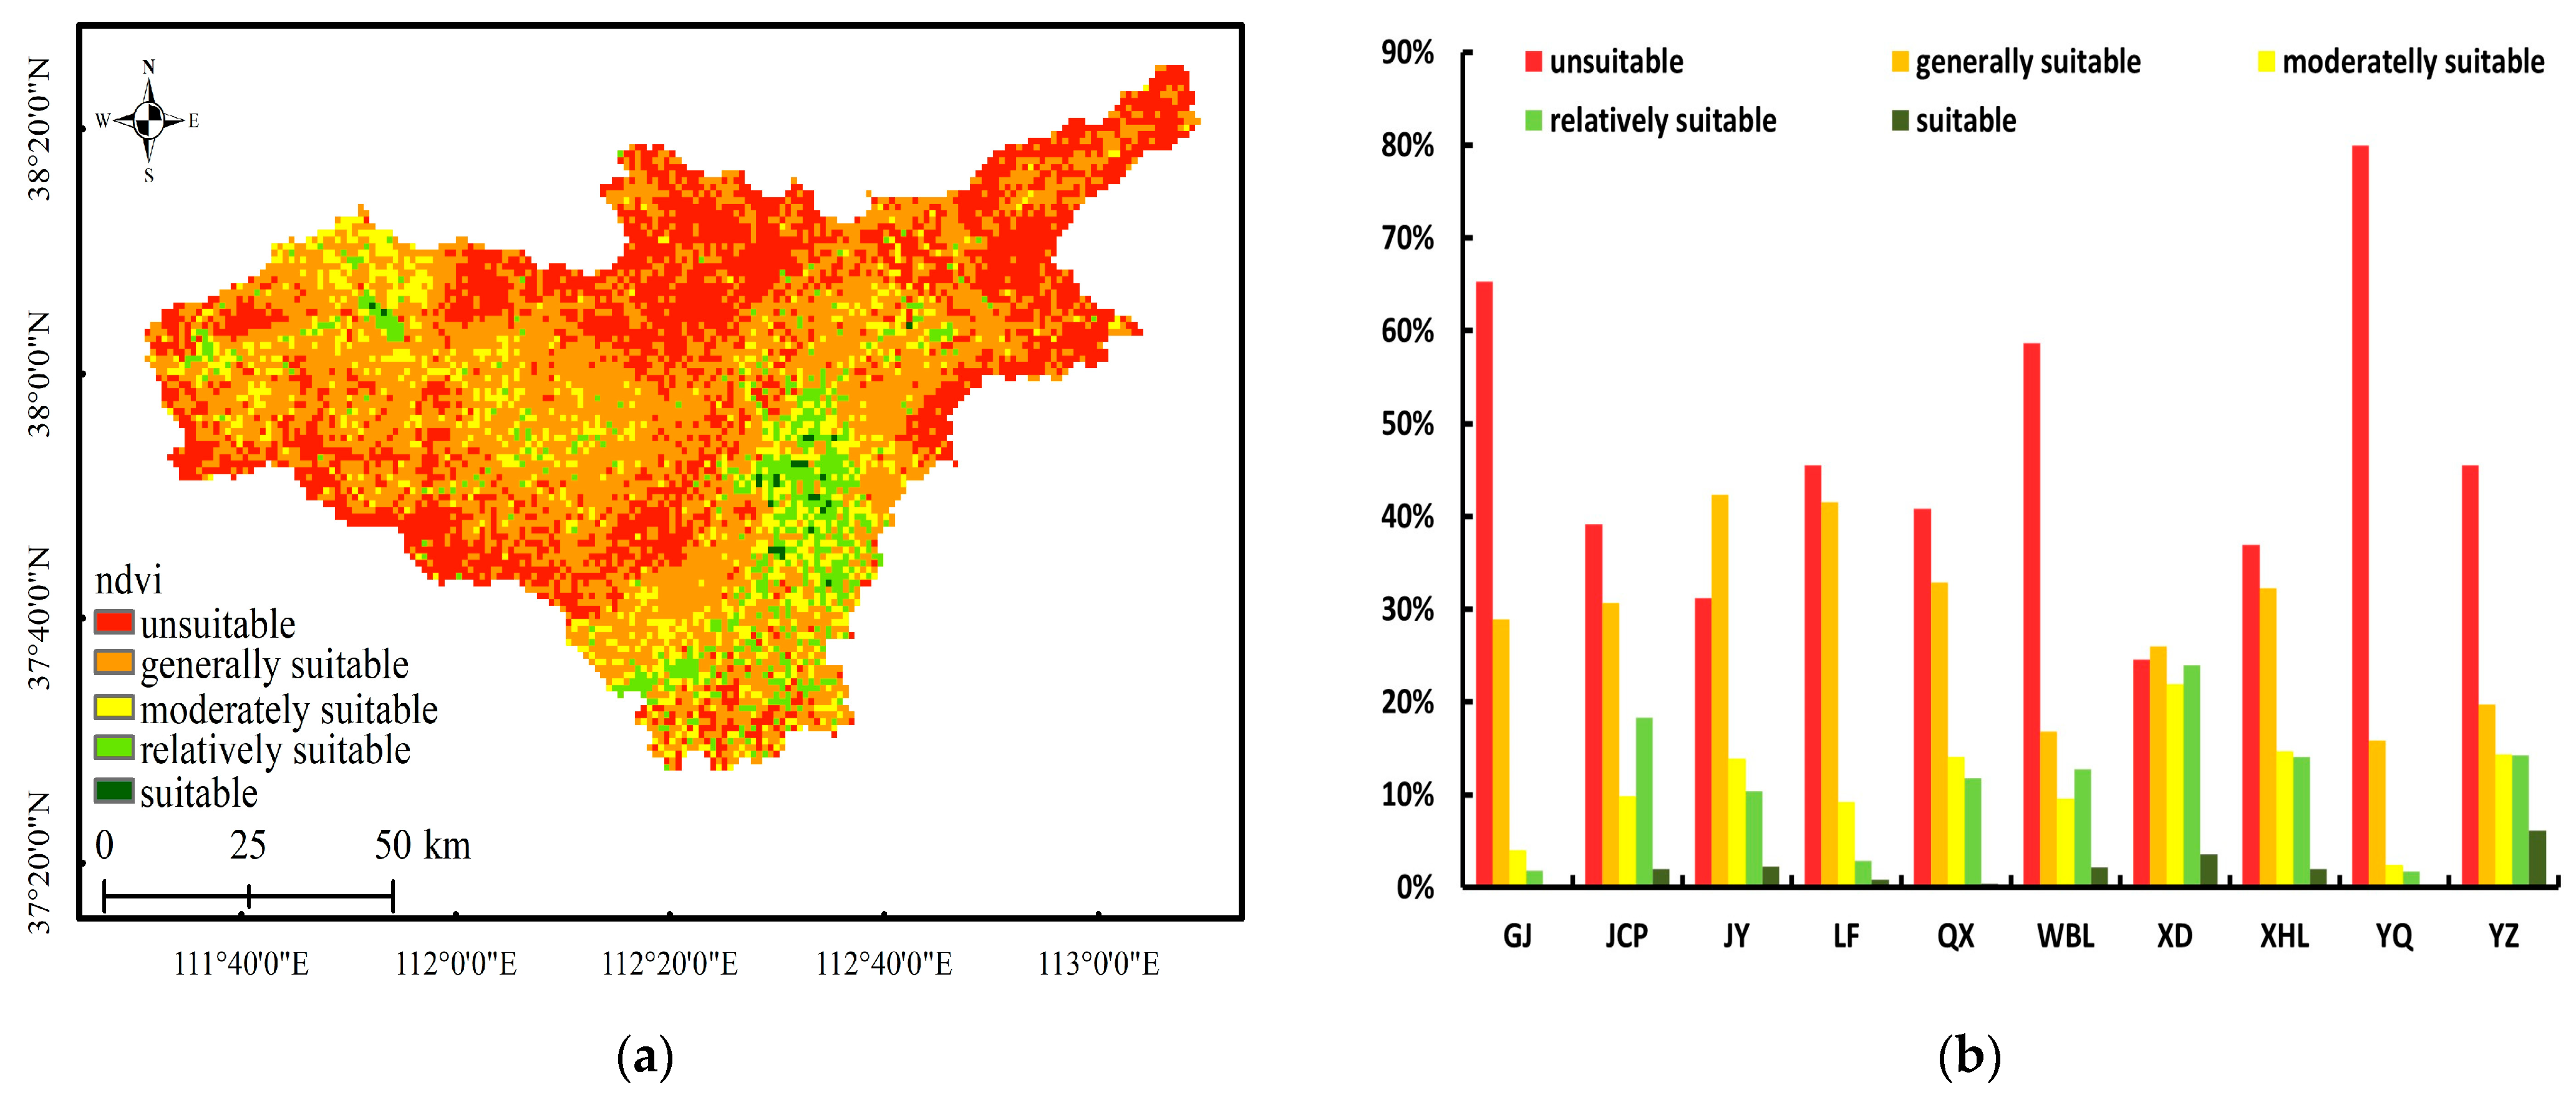
- NDVI
- 8.
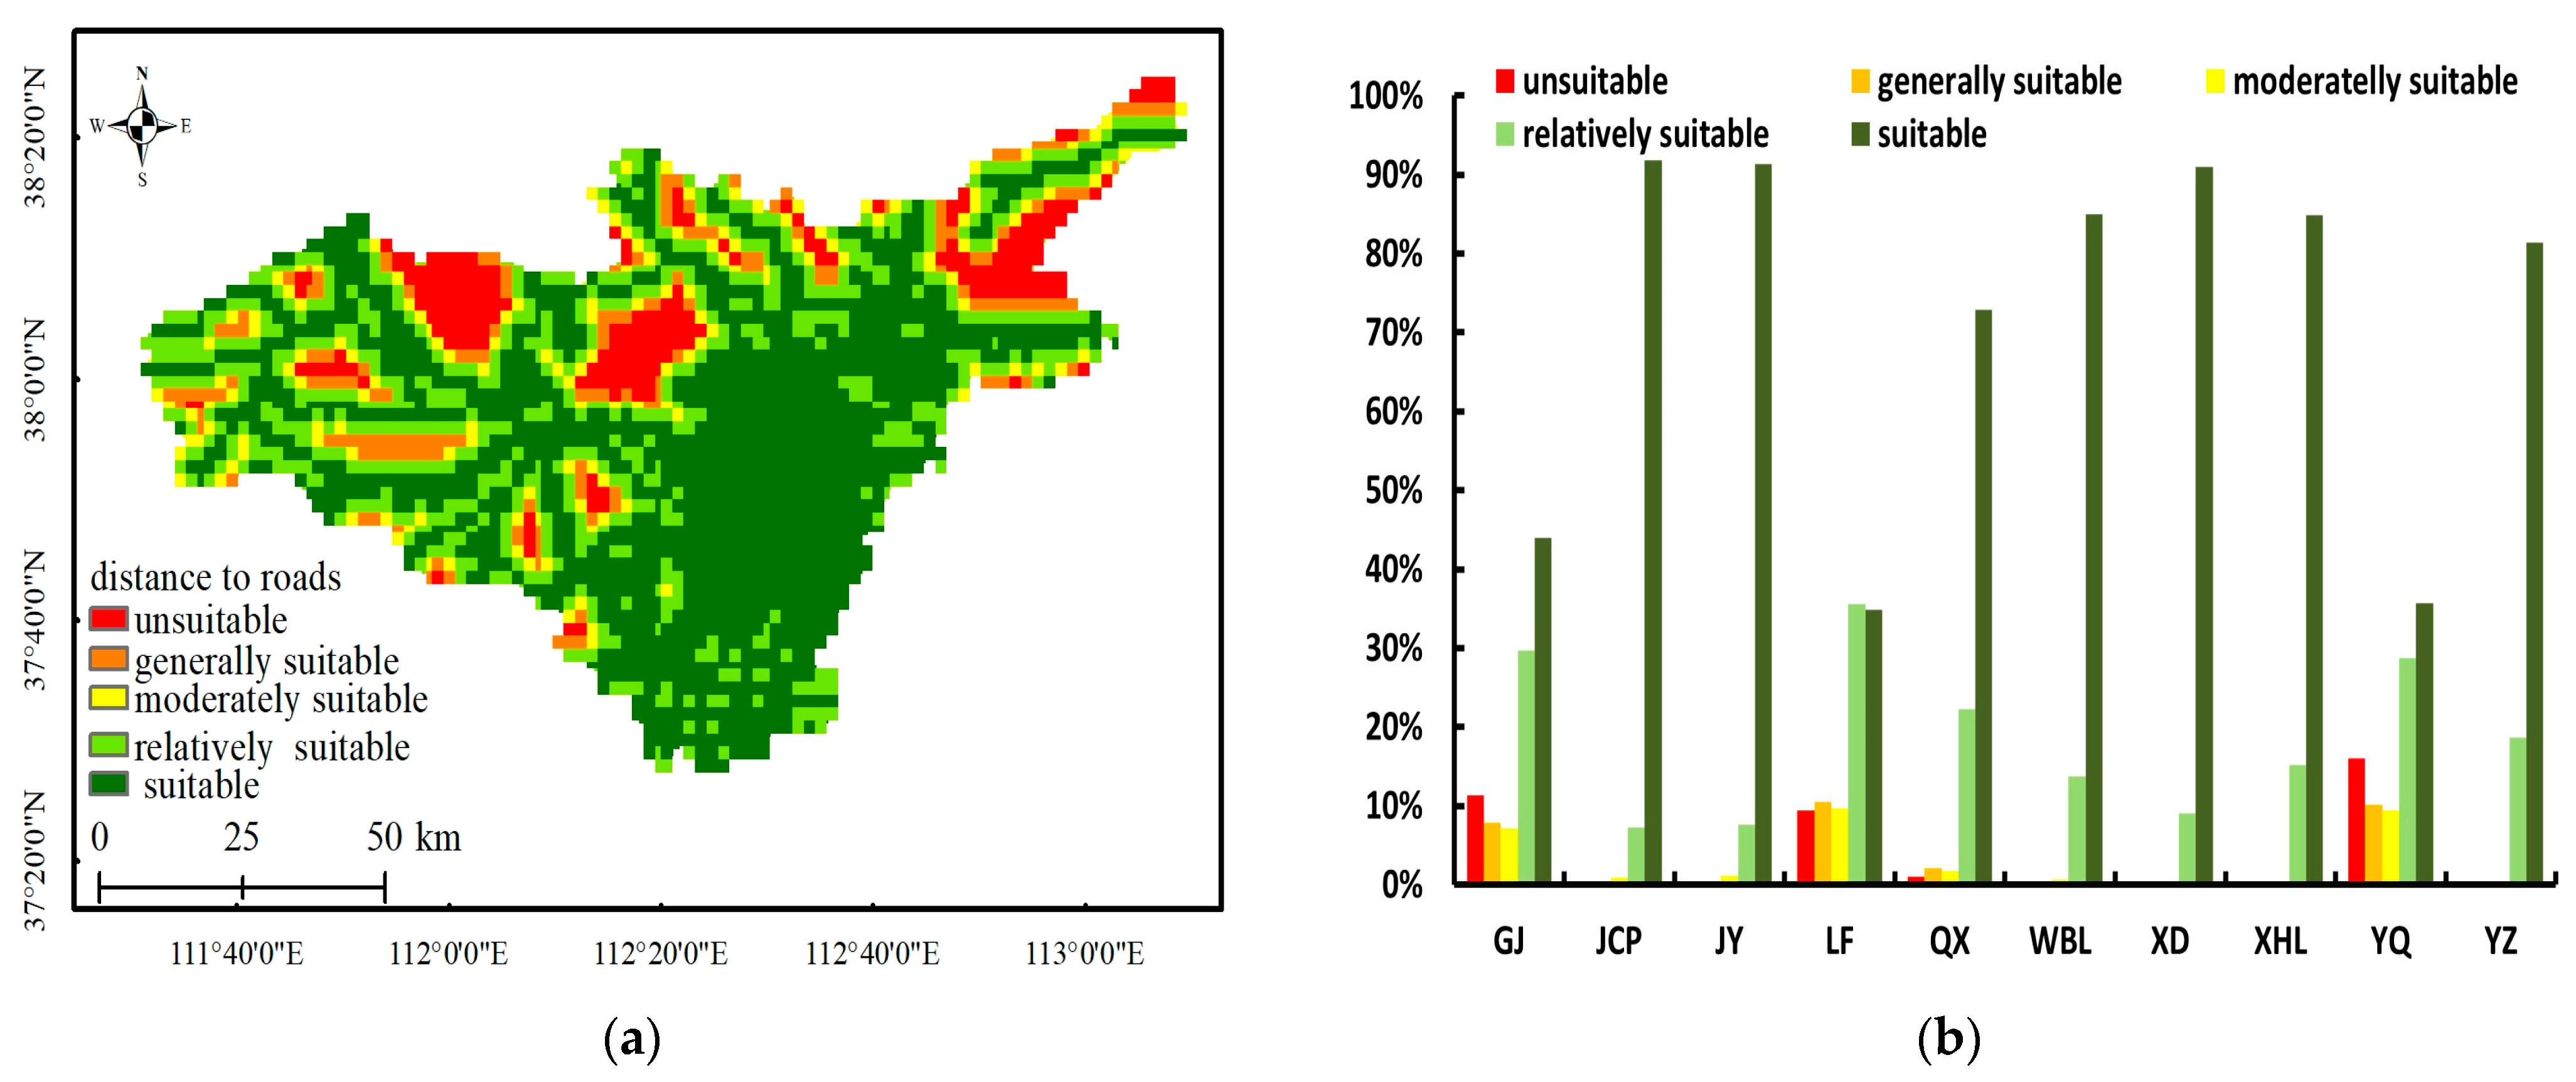
- Distance to roads
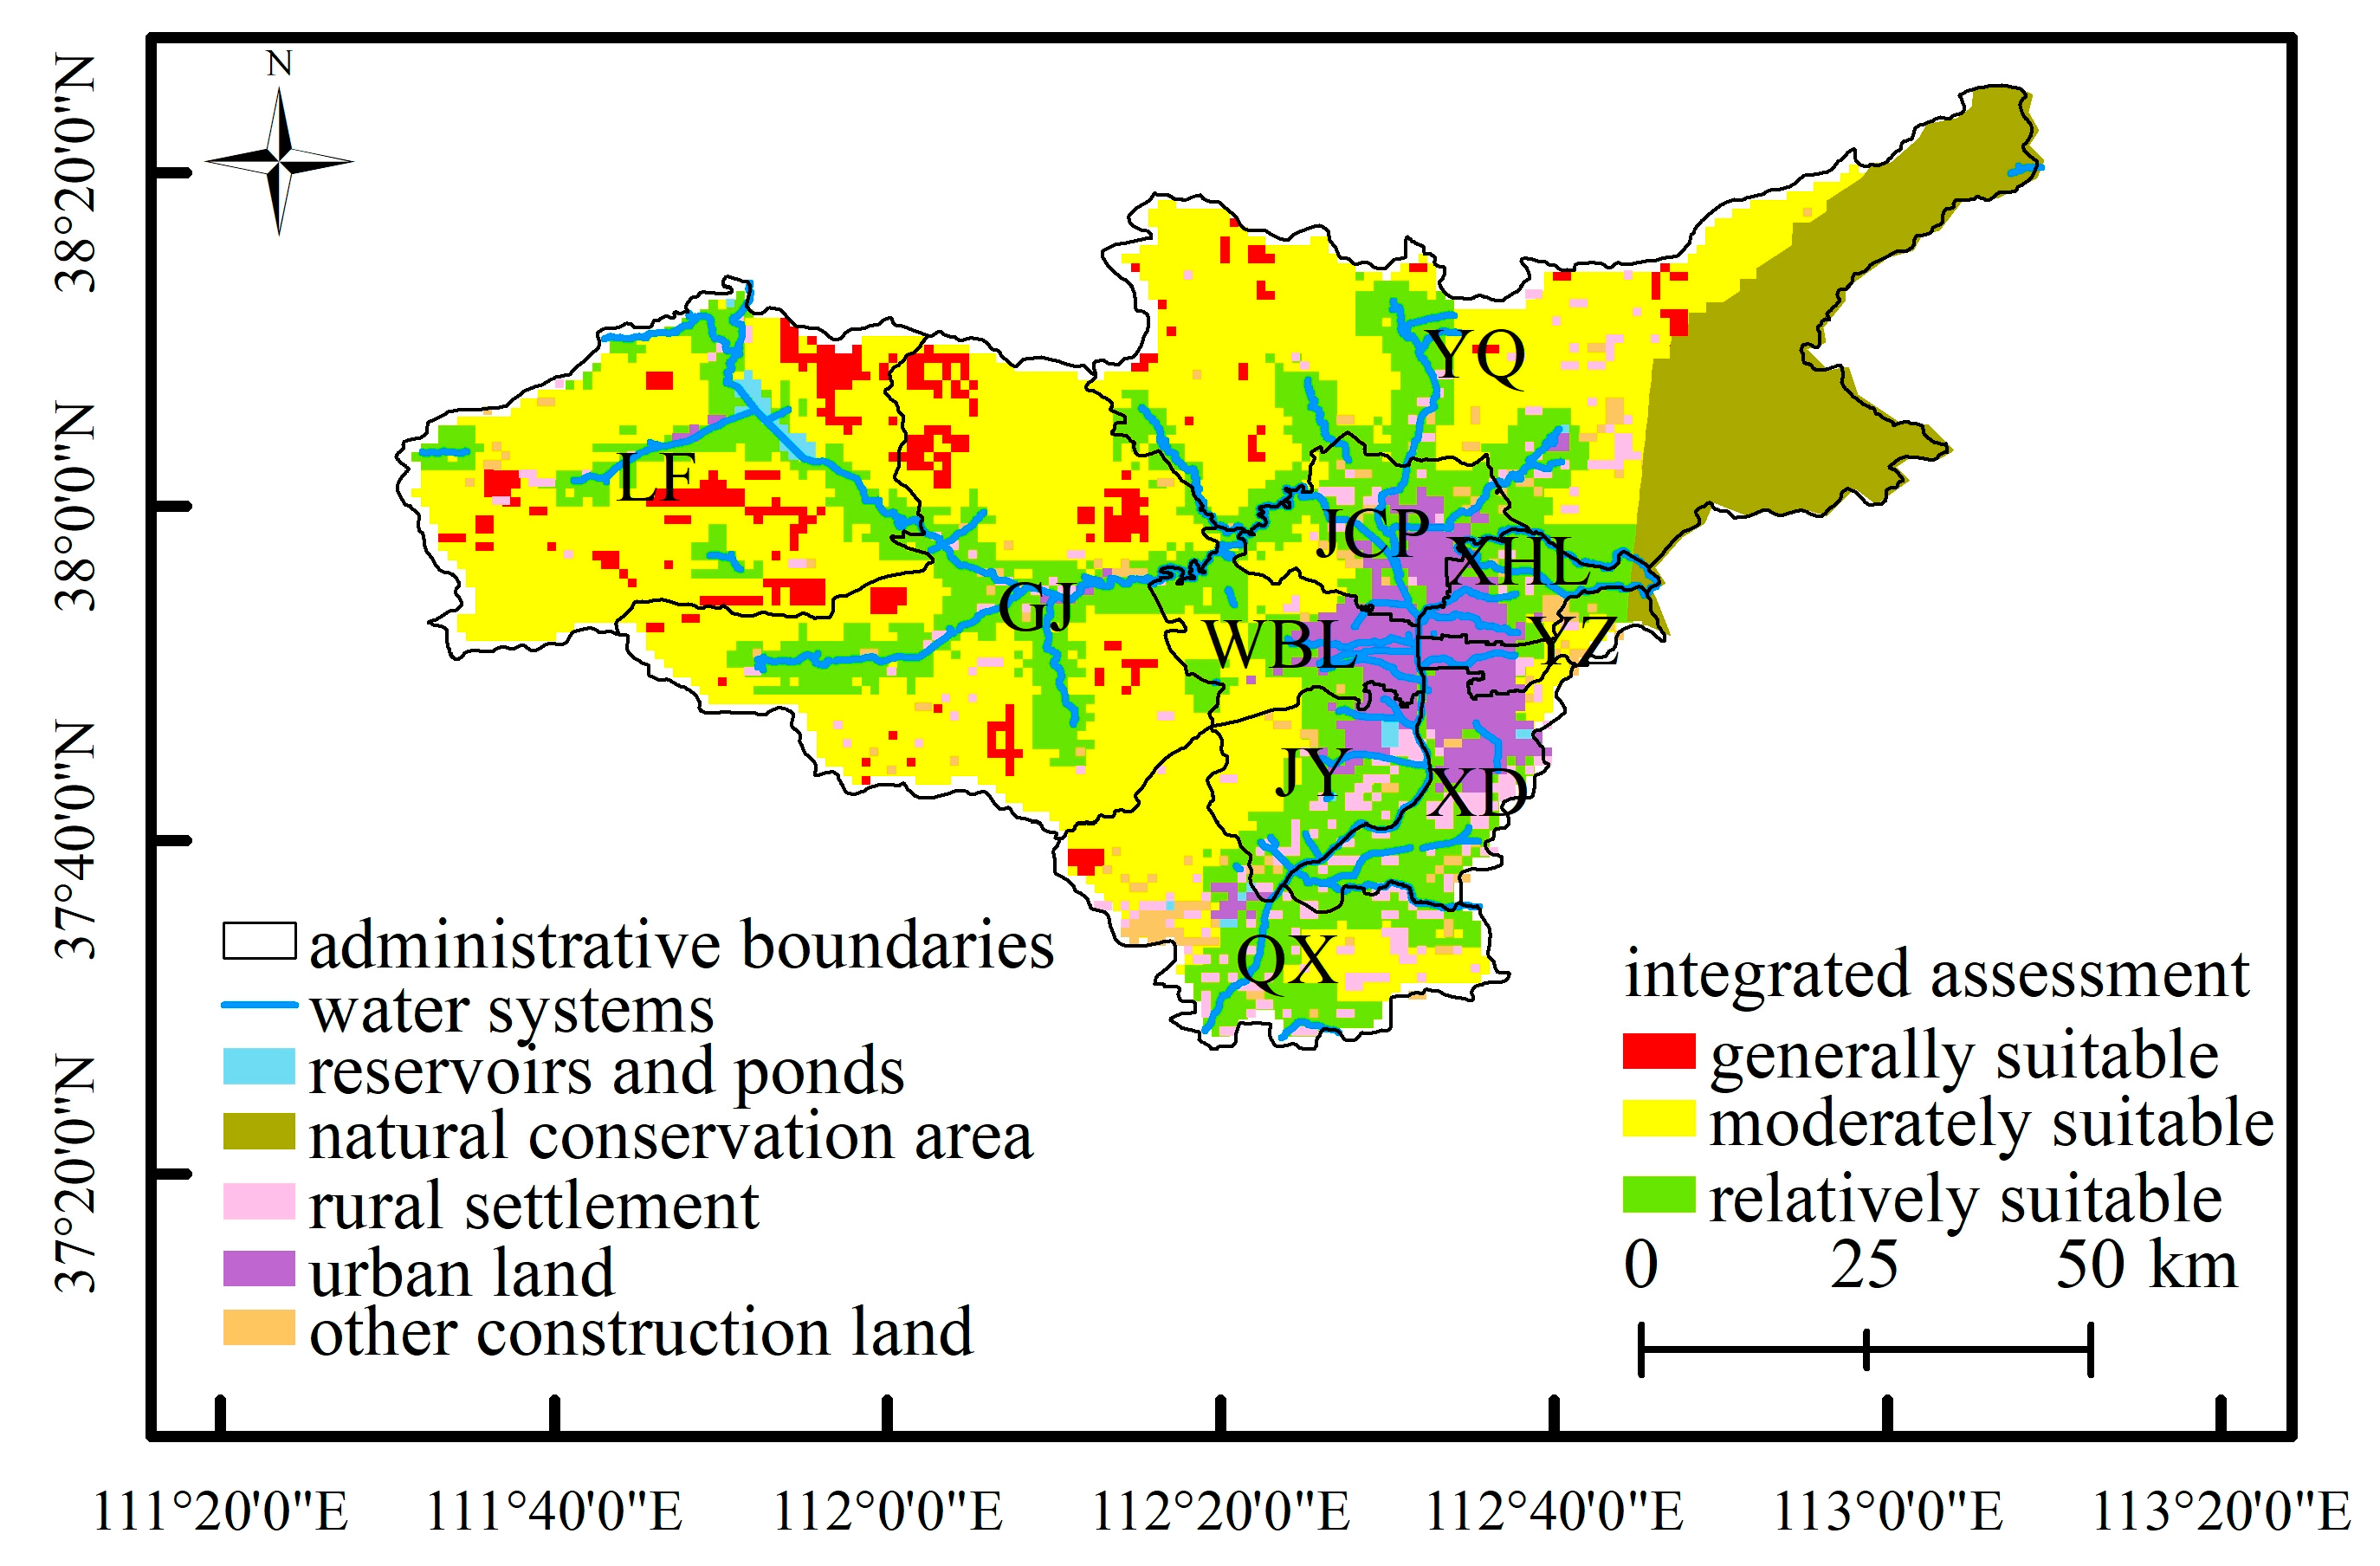
3.2. Integrated Assessment Results
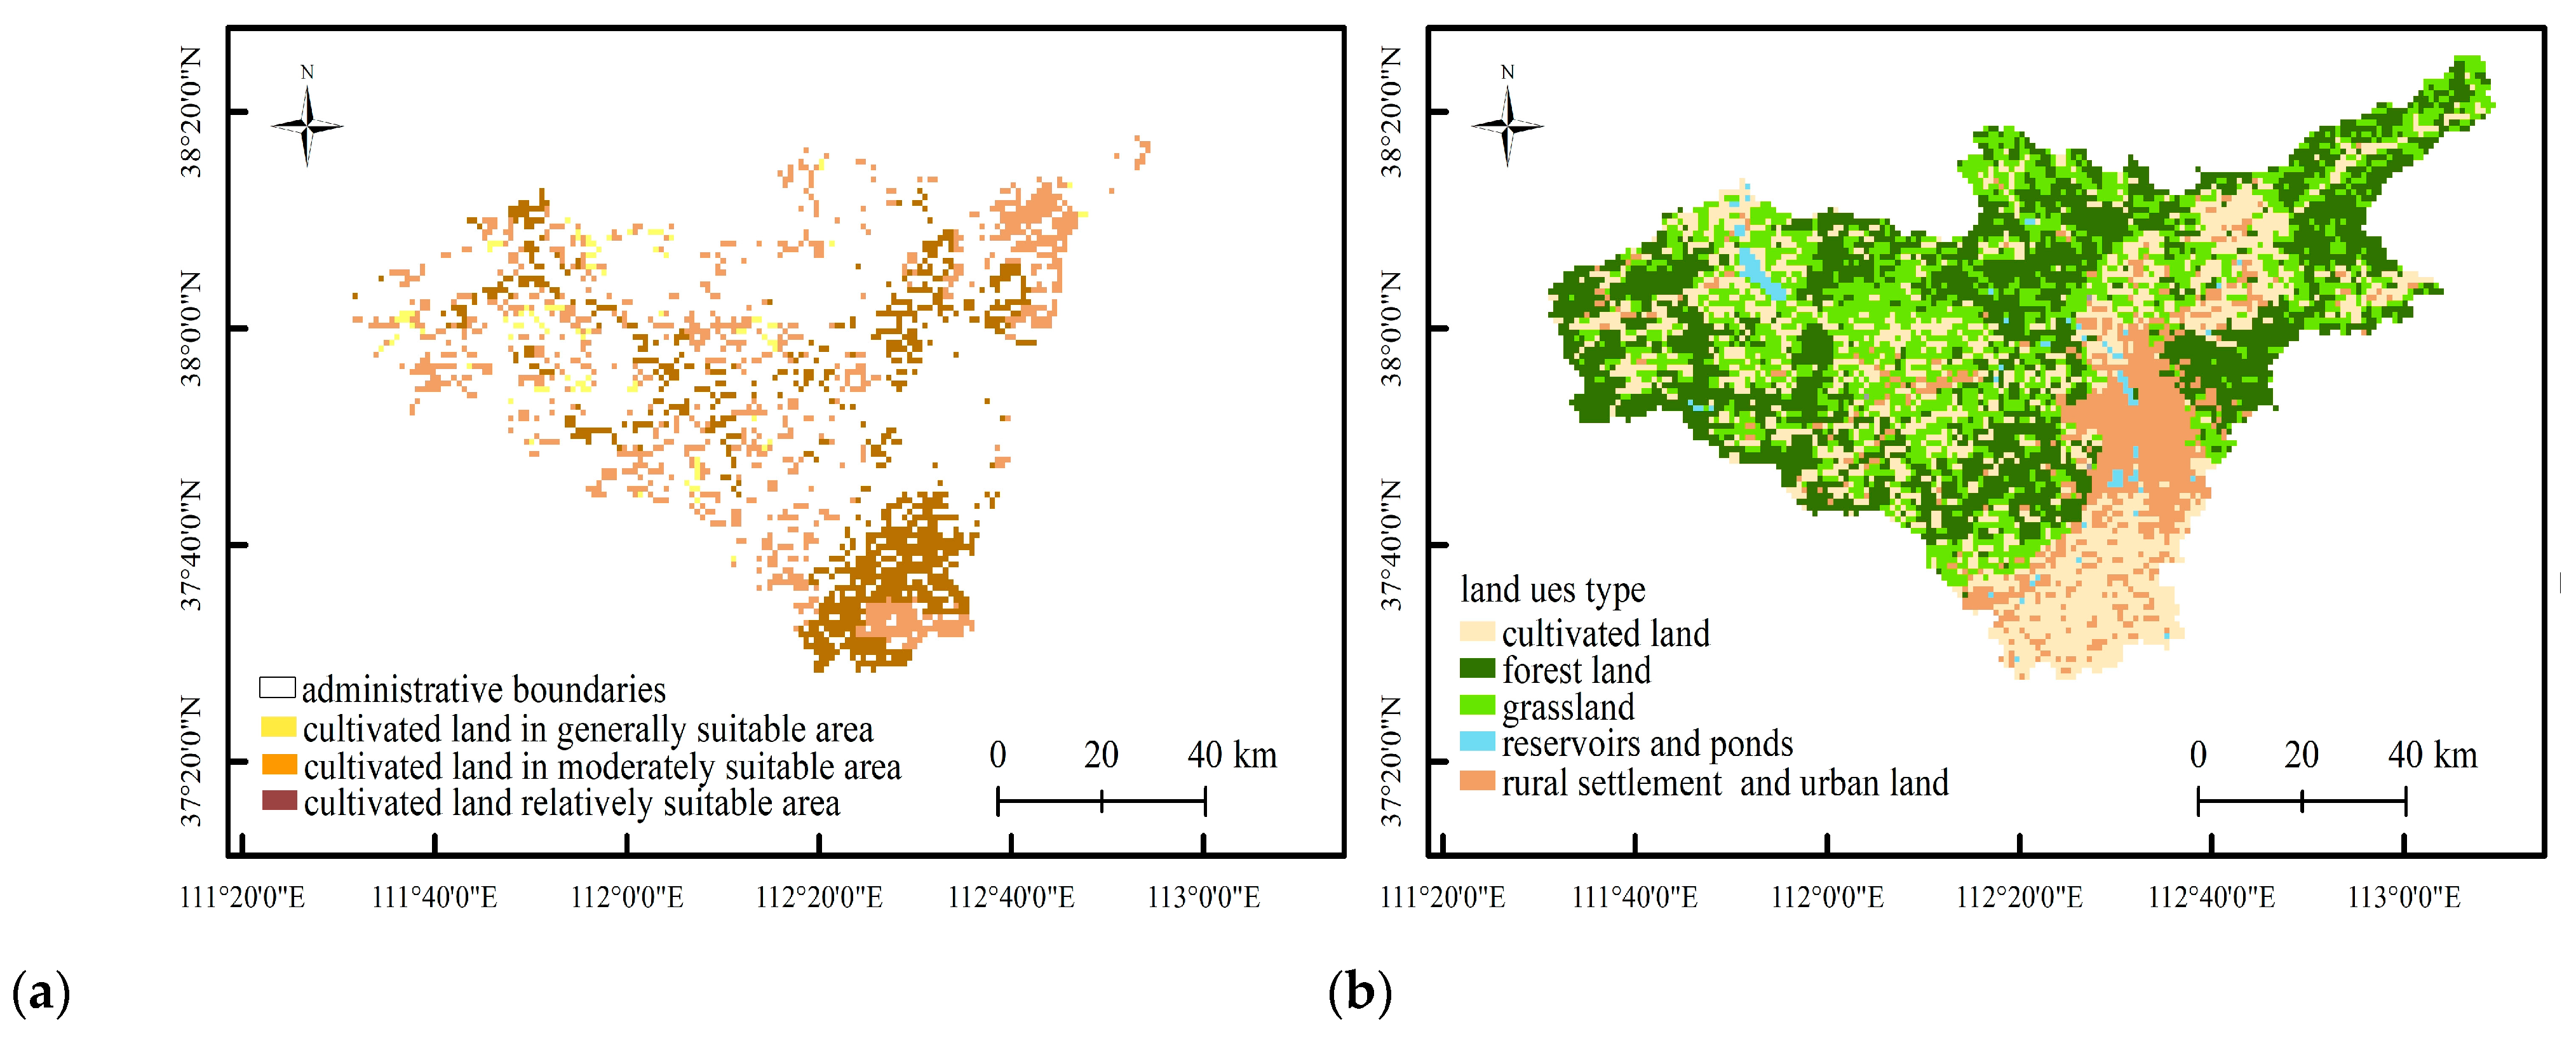
3.3. Cross-Validation of Assessment Results with Current Cultivated Data
4. Discussion
5. Conclusions and Policy Implications
Author Contributions
Funding
Institutional Review Board Statement
Data Availability Statement
Acknowledgments
Conflicts of Interest
References
- Jimoh, A.I.; Aliyu, J.; Saboand, A.T.; Yusuf, O.Y. Land suitability evaluation of Kubanni floodplain for rice production in Zaria, Kaduna State, Nigeria. Niger. J. Basic Appl. Sci. 2018, 26, 46–54. [Google Scholar] [CrossRef]
- Akıncı, H.; Özalp, A.Y.; Turgut, B. Agricultural land use suitability analysis using GIS and AHP technique. Comput. Electron. Agric. 2013, 97, 71–82. [Google Scholar] [CrossRef]
- Topuz, M.; Deniz, M. Application of GIS and AHP for land use suitability analysis: Case of Demirci district (Turkey). Hum. Soc. Sci. Commun. 2023, 10, 115. [Google Scholar] [CrossRef]
- Edrisi, S.A.; Dubey, P.K.; Chaturvedi, R.K.; Abhilash, P.C. Bioenergy Crop Production Potential and Carbon Mitigation from Marginal and Degraded Lands of India. Renew. Energ. 2022, 192, 300–312. [Google Scholar] [CrossRef]
- Verma, V.; Edrisi, S.A. Sustainable management of land resources via the codesigning approach. J. Clean. Prod. 2022, 373, 133833. [Google Scholar] [CrossRef]
- Han, C.; Chen, S.; Yu, Y.; Xu, Z.; Zhu, B.; Xu, X.; Wang, Z. Evaluation of Agricultural Land Suitability Based on RS, AHP, and MEA: A Case Study in Jilin Province, China. Agriculture 2021, 11, 370. [Google Scholar] [CrossRef]
- Komlavi, A.; Kabo-bah, A.T.; Zwart, S.J. Agricultural land suitability analysis: State-of-the-art and outlooks for integration of climate change analysis. Agric. Syst. 2019, 173, 172–208. [Google Scholar] [CrossRef]
- Ostovari, Y.; Honarbakhsh, A.; Sangoony, H.; Zolfaghari, F.; Maleki, K.; Ingram, B. GIS and multi-criteria decision-making analysis assessment of land suitability for rapeseed farming in calcareous soils of semi-arid regions. Ecol. Indic. 2019, 103, 479–487. [Google Scholar] [CrossRef]
- Choudhary, K.; Boori, M.S.; Shi, W.; Valiev, A.; Kupriyanov, A. Agricultural land suitability assessment for sustainable development using remote sensing techniques with analytic hierarchy process. Remote Sens. Appl. 2023, 32, 101051. [Google Scholar] [CrossRef]
- Yalew, S.G.; Van Griensven, A.; Van Der Zaag, P. AgriSuit: A web-based GIS-MCDA framework for agricultural land suitability assessment. Comput. Electron. Agric. 2016, 128, 1–8. [Google Scholar] [CrossRef]
- Tashayo, B.; Honarbakhsh, A.; Akbari, M.; Eftekhari, M. Land suitability assessment for maize farming using a GIS-AHP method for a semi- arid region, Iran. J. Saudi Soc. Agric. Sci. 2020, 19, 332–338. [Google Scholar] [CrossRef]
- Nosratabadi, S.; Ardabili, S.; Lakner, Z.; Mako, C.; Mosavi, A. Prediction of Food Production Using Machine Learning Algorithms of Multilayer Perceptron and ANFIS. Agriculture 2021, 11, 408. [Google Scholar] [CrossRef]
- Ayoub, S.T.; Rasool, T.; Rasheed, L.F. Towards leveraging the role of machine learning and artificial intelligence in precision agriculture and smart farming. Comput. Electron. Agric. 2022, 198, 107119. [Google Scholar] [CrossRef]
- Nguyen, H.; Nguyen, T.; Hoang, N.; Bui, D.; Vu, H.; Van, T. The application of LSE software: A new approach for land suitability evaluation in agriculture. Comput. Electron. Agric. 2020, 173, 105440. [Google Scholar] [CrossRef]
- Hao, X.J.; Zhang, H.; Xu, X.M.; Wang, L.; Cui, Y. Evolution and simulation of land use/land cover pattern in northern Shanxi Province. Acta Ecol. Sin. 2020, 40, 257–265. (In Chinese) [Google Scholar] [CrossRef]
- Liu, Q.; Yang, N.; Gao, M.M. Evaluation of Agricutural Production Suitability for Territory Spatial Planning: A Case Study of Liaozhong Plain. Chin. J. Agric. Resour. Reg. Plan. 2023, 44, 183–193. (In Chinese) [Google Scholar]
- Jiang, H.; Tang, X.; Yang, L. Suitability evaluation of land space development based on land resources: A case study of Yichang City in Hubei Province. Geol. China 2020, 47, 1776–1792. (In Chinese) [Google Scholar] [CrossRef]
- Andrianarimanana, M.H.; Yongjian, P.; Rabezanahary Tanteliniaina, M.F. Assessment of the importance of climate, land, and soil on the global supply for agricultural products and global food security: Evidence from Madagascar. Food Policy 2023, 115, 102403. [Google Scholar] [CrossRef]
- Yao, S.; Liu, P.; Wei, H.J. Research on Coupling Coordinated Development abd its Drivin Mechanism of Agricultural Ecological-Economics System in the Yellow River Basin Under the Perspectivev of Food Security. Chin. J. Agric. Resour. Reg. Plan. 2023, 44, 1–13. Available online: https://kns.cnki.net/kcms/detail//11.3513.S.20230117.0909.004.html (accessed on 17 January 2023). (In Chinese).
- Jin, G.; He, D.; Guo, B.; Li, Z.; Shi, X. Designing a spatial pattern to rebalance the orientation of development and protection in Wuhan. Geogr. Sci. 2020, 30, 569–582. [Google Scholar] [CrossRef]
- Chen, Y.; Wu, T.; Wang, T.Y.; Yue, W.Z.; Xia, H.X. Theoretical thinking and practical scheme of “double evaluations” at provincial level: A case study of Zhejiang province. J. Nat. Resour. 2020, 35, 2325–2338. (In Chinese) [Google Scholar] [CrossRef]
- Ma, X.H.; Su, Y.H.; Lin, F.; Dai, C.Y. Land use/cover change and its driving factors in Taiyuan city. Ecol. Sci. 2021, 40, 201–210. [Google Scholar] [CrossRef]
- Hou, W.; Zhou, W.; Li, J.; Li, C. Simulation of the potential impact of urban expansion on regional ecological corridors: A case study of Taiyuan, China. Sustain. Cities Soc. 2022, 83, 103933. [Google Scholar] [CrossRef]
- Ding, L.F. Analysis of temporal and spatial change of grain production and current situation of supply and demand in Shanxi Province. Chin. J. Agric. Resour. Reg. Plan. 2022, 43, 18–26. [Google Scholar]
- Hua, X.Z.; Cheng, B.; Zhao, R.F.; Huo, X.L.; Wang, Z.; Wang, S. Pollution assessment and spatial distribution of heavy metals in the farmland soils of Taiyuan City. J. Irrig. Drain. Eng. 2021, 40, 101–109. (In Chinese) [Google Scholar] [CrossRef]
- Peng, S.; Ding, Y.; Liu, W.; Li, Z. 1 km monthly temperature and precipitation dataset for China from 1901 to 2017. Earth Syst. Sci. Data 2019, 11, 1931–1946. (In Chinese) [Google Scholar] [CrossRef]
- Xu, X. A multi-annual data about administrative areas boundaries at prefecture-level city. Resour. Environ. Sci. Data Regis. Public Syst. 2023. (In Chinese) [Google Scholar] [CrossRef]
- Xu, X.; Liu, J.; Zhang, S.; Li, R.; Wu, S. Remote sensing dataset for a multi-temporal land use/land cover change monitoring in China (CNLCC). Environ. Sci. Data Regis. Public Syst. 2018. (In Chinese) [Google Scholar] [CrossRef]
- Xu, X. Data set of river basin and river network extracted based on DEM in China. Environ. Sci. Data Regis. Public Syst. 2018. (In Chinese) [Google Scholar]
- Huang, H.; Zhou, Y.; Qian, M.J.; Zeng, Z.Q. Land Use Transition and Driving Forces in Chinese Loess Plateau: A Case Study from Pu County, Shanxi Province. Land 2021, 10, 67. [Google Scholar] [CrossRef]
- Ding, X.Y.; Shi, X.L.; Ling, M.H.; Wang, S.L.; Zhang, Y.Y.; Li, F.K. Evaluation of water resources carrying capacity based on quantity -quality-domin flow in Taiyuan City. South-North Water Trans. Water Sci. Technol. 2022, 20, 9–20. (In Chinese) [Google Scholar] [CrossRef]
- SL190-96; Soil Erosion Classification and Grading Standards. Ministry of Water Resources of the People’s Republic of China: Beijing, China, 2008.
- Zhao, Y.; Hu, Y.M.; Zhang, X.C. Spatial Pattern of Farming Distance in Rural Area Using ESDA. Sci. Geogr. Sin. 2016, 36, 760–765. (In Chinese) [Google Scholar] [CrossRef]
- Tang, Q.Y.; Qi, D.H.; Song, L.W. Correlation of Vegetation Coverage and Topographic Factors in Yanhe River Basin Based on GIS and RS. Res. Soil Water Conserv. 2017, 24, 198–203. (In Chinese) [Google Scholar] [CrossRef]
- Zhang, H.Y. A limitation scoring method used in the land evaluation system for new south wales, Australia. Geogr. Res. 1994, 13, 67–73. (In Chinese) [Google Scholar]
- Zhou, K.; Li, J.Y.; Wang, Q. Evaluation on agricultural production space and layout optimization based on resources and environmental carrying capacity: A case study of Fujian Province. Sci. Geogr. Sin. 2021, 41, 280–289. (In Chinese) [Google Scholar] [CrossRef]
- Kang, Q.; Guo, Q.X.; Ding, Y.; Zhang, Y.; Hu, Y.; Chen, S.Y. Temporal and Spatial Evolution and Driving Factors of Productional-Living Ecological Functions of Shanxi Province during 2005–2018. Bullet. Soil Water Conserv. 2021, 41, 327–337. (In Chinese) [Google Scholar] [CrossRef]
- Huang, Y.Y. Evaluation of suitability of territorial space development background of low carbon in Shanxi Province under the background of low carbon. Shanxi Univ. Financ. Econ. 2023. (In Chinese) [Google Scholar] [CrossRef]
- Li, Y.; Tan, Q.; Wang, L.S.; Zhang, F. Research on suitability evaluation and optimization of agricultural land use in county region—A case study of Yuanping City, Shanxi Province. Chin. J. Agric. Resour. Reg. Plan. 2022, 43, 91–99. (In Chinese) [Google Scholar]
- Guo, Y.; Liu, Y. Poverty alleviation through land assetization and its implications for rural revitalization in China. Land Use Policy 2021, 105, 105418. [Google Scholar] [CrossRef]
- Donkor, E.; Frimpong, F.K.; Owusu, V. Land tenure and investment in productive inputs in Ghanaian cocoa farming: A generalised structural equation modelling approach. Land Use Policy 2023, 132, 1068053. [Google Scholar] [CrossRef]
- Mao, H.; Chai, Y.J.; Chen, S.J. Land Tenure and Green Production Behavior: Empirical Analysis Based on Fertilizer Use by Cotton Farmers in China. Int. J. Environ. Res. Public. Health 2021, 18, 4677. [Google Scholar] [CrossRef] [PubMed]
- Vu, H.T.; Goto, D. Does awareness about land tenure security (LTS) increase investments in agriculture? Evidence from rural households in Vietnam. Land Use Policy 2020, 97, 104721. [Google Scholar] [CrossRef]
- Hu, Y.Q. Innovation in the Farmland Property-Right System and Sustainable Development of Agriculture. J. Beijing Norm. Univ. (Soc. Sci.) 2008, 9, 130–138. (In Chinese) [Google Scholar]
- Trukhachev, V.; Ivolga, A.; Lescheva, M. Enhancement of Land Tenure Relations as a Factor of Sustainable Agricultural Development: Case of Stavropol Krai, Russia. Sustainability 2015, 7, 164–179. [Google Scholar] [CrossRef]
- Yang, Q.; Zhu, Y.J.; Liu, L.; Wang, F. Land tenure stability and adoption intensity of sustainable agricultural practices in banana production in China. J. Clean. Prod. 2022, 338, 130553. [Google Scholar] [CrossRef]
- Akram, N.; Akram, M.W.; Wang, H.; Mehmood, A. Does Land Tenure Systems Affect Sustainable Agricultural Development? Sustainability 2019, 11, 3925. [Google Scholar] [CrossRef]
- Zhang, J.; Chen, Q. The Impact of Farmland Tenure Security on China’s Agricultural Production Efficiency: A Perspective of Agricultural Production Factors. Sustainability 2022, 14, 16266. [Google Scholar] [CrossRef]


| Assessment Factors | Grading Criteria | Scores |
|---|---|---|
| DEM (m) | >900 | 5 |
| 900–1100 | 4 | |
| 1100–1300 | 3 | |
| 1300–1500 | 2 | |
| >1500 | 1 | |
| Slope (°) | 0–2 | 5 |
| 2–6 | 4 | |
| 6–15 | 3 | |
| 15–25 | 2 | |
| >25 | 1 | |
| Soil erosion | slight | 5 |
| light | 4 | |
| moderate | 3 | |
| strong | 2 | |
| very strong, severe | 1 | |
| Soil texture (%) | <20 | 5 |
| 20–40 | 4 | |
| 40–60 | 3 | |
| 60–80 | 2 | |
| >80 | 1 | |
| Distance to water sources (km) | <1 | 5 |
| 1–2 | 4 | |
| 2–3 | 3 | |
| 3–4 | 2 | |
| >4 | 1 | |
| Annual precipitation (mm) | >1200 | 5 |
| 800–1200 | 4 | |
| 400–800 | 3 | |
| 200–400 | 2 | |
| <200 | 1 | |
| NDVI | <0.1 | 5 |
| 0.1–0.3 | 4 | |
| 0.3–0.5 | 3 | |
| 0.5–0.7 | 2 | |
| >0.7 | 1 | |
| Distance to roads (km) | <1 | 5 |
| 1–2 | 4 | |
| 2–3 | 3 | |
| 3–4 | 2 | |
| >4 | 1 |
| Assessment Factors | Elevation | Slope | Soil Erosion | Soil Texture | Distance to Water Sources | Annual Precipitation | NDVI | Distance to Roads |
|---|---|---|---|---|---|---|---|---|
| Elevation | 1 | 1/3 | 1/2 | 1/2 | 1/5 | 1/3 | 2 | 1/2 |
| Slope | 3 | 1 | 3/2 | 4/3 | 3/5 | 1 | 6 | 3/2 |
| Soil erosion | 2 | 2/3 | 1 | 3/2 | 2/5 | 2/3 | 5 | 3/2 |
| Soil texture | 2 | 3/4 | 2/3 | 1 | 2/5 | 2/3 | 4 | 1 |
| Distance to water sources | 5 | 5/3 | 5/2 | 5/2 | 1 | 5/3 | 8 | 5/2 |
| Annual precipitation | 3 | 1 | 3/2 | 3/2 | 3/5 | 1 | 6 | 3/2 |
| NDVI | 1/2 | 1/6 | 1/5 | 1/4 | 1/8 | 1/6 | 1 | 1/4 |
| Distance to roads | 2 | 2/3 | 2/3 | 1 | 2/5 | 2/3 | 4 | 1 |
| District/County | Generally Suitable | Moderately Suitable | Relatively Suitable | Total Area (km2) | |||
|---|---|---|---|---|---|---|---|
| Area (km2) | Proportion (%) | Area (km2) | Proportion (%) | Area (km2) | Proportion (%) | ||
| Gujiao | 130 | 7.4 | 1198 | 68.1 | 433 | 24.6 | 1761 |
| Jiancaoping | 0 | 0.0 | 58 | 24.2 | 183 | 75.8 | 241 |
| Jinyuan | 0 | 0.0 | 100 | 37.7 | 165 | 62.3 | 266 |
| Loufan | 162 | 11.3 | 1004 | 70.0 | 269 | 18.8 | 1435 |
| Qingxu | 10 | 1.8 | 317 | 57.7 | 222 | 40.5 | 550 |
| Wanbailin | 0 | 0.0 | 121 | 47.3 | 135 | 52.7 | 255 |
| Xiaodian | 0 | 0.0 | 17 | 10.1 | 155 | 89.9 | 172 |
| Xinghualing | 0 | 0.0 | 3 | 2.7 | 98 | 97.3 | 100 |
| Yangqu | 47 | 3.3 | 977 | 69.3 | 385 | 27.4 | 1409 |
| Yingze | 0 | 0.0 | 23 | 54.1 | 19 | 45.9 | 42 |
| Total area | 348 | 5.6 | 3819 | 61.3 | 2064 | 33.1 | 6232 |
Disclaimer/Publisher’s Note: The statements, opinions and data contained in all publications are solely those of the individual author(s) and contributor(s) and not of MDPI and/or the editor(s). MDPI and/or the editor(s) disclaim responsibility for any injury to people or property resulting from any ideas, methods, instructions or products referred to in the content. |
© 2023 by the authors. Licensee MDPI, Basel, Switzerland. This article is an open access article distributed under the terms and conditions of the Creative Commons Attribution (CC BY) license (https://creativecommons.org/licenses/by/4.0/).
Share and Cite
Xu, J.; Jiao, C.; Zheng, D.; Li, L. Agricultural Land Suitability Assessment at the County Scale in Taiyuan, China. Agriculture 2024, 14, 16. https://doi.org/10.3390/agriculture14010016
Xu J, Jiao C, Zheng D, Li L. Agricultural Land Suitability Assessment at the County Scale in Taiyuan, China. Agriculture. 2024; 14(1):16. https://doi.org/10.3390/agriculture14010016
Chicago/Turabian StyleXu, Juan, Cuicui Jiao, Dalun Zheng, and Luoxin Li. 2024. "Agricultural Land Suitability Assessment at the County Scale in Taiyuan, China" Agriculture 14, no. 1: 16. https://doi.org/10.3390/agriculture14010016