Article

Productivity and Stability Evaluation of 12 Selected Avena magna ssp. domestica Lines Based on Multi-Location Experiments during Three Cropping Seasons in Morocco

1
Institut Agronomique et Vétérinaire Hassan II, Rabat 10000, Morocco
2
Plant Genetic Resources Laboratory, Department of Plant & Wildlife Sciences, Brigham Young University, Provo, UT 84602, USA
3
25:2 Solutions, 815 S First Ave Suite A, Pocatello, ID 83201, USA
4
Context Global Development, 9666 Olive Blvd Suite 750, St. Louis, MO 63132, USA
*
Author to whom correspondence should be addressed.
Agriculture 2023, 13(8), 1486; https://doi.org/10.3390/agriculture13081486
Submission received: 19 June 2023 / Revised: 18 July 2023 / Accepted: 19 July 2023 / Published: 26 July 2023
(This article belongs to the Special Issue Germplasm Resources Exploration and Genetic Breeding of Crops)

Abstract

:
Avena magna (2n = 4x = 28) is a tetraploid oat with a very high protein content compared to the hexaploid common oat, A. sativa (2n = 6x = 42). The wild type of A. magna originates from Morocco; its domestication has been achieved only within the past 25 years. The present study aimed to evaluate the productivity potential of an A. magna ssp. domestica collection of 11 advanced lines and a control variety, ‘Avery’. Twelve trials were conducted during three cropping seasons at four, three, and five locations and revealed significant differences among the accessions. Data on twelve agro-morphological characters and two disease traits were collected, and they confirmed the presence of variability in this oat germplasm set. Mean grain yield was 30.76 q/ha and varied from site to site, ranging from 6.89 q/ha at Bouchane_19 to 85.5 q/ha at Alnif_21. Across experimental sites, plant height ranged from 48.93 to 120.47 cm; thousand kernel weight from 32.83 to 49.73 g; and harvest index from 20.43 to 31.33%. Line AT6 was relatively tolerant of BYDV and crown rust infections, based on disease severity scoring at the heading stage. According to AMMI analysis, 78% of the grain yield variability was due to the environment factor and 4% was explained by the genetic factor. Among the highest-yielding lines, AT5 and ATC were relatively unstable. Line AT5 was more productive at the elevated site of El Kbab_19, and ATC performed better at the oasis location of Alnif_21 under irrigation. Line AT7 showed the most stable behavior; it was high yielding across the five environments and exceeded the general mean of the experiments. The A. magna ssp. domestica lines proved their suitability for cultivation under local farming conditions. Their nutritional quality, especially their high protein content, makes them good candidates for further testing in the Moroccan breeding program and for integration into local cropping systems.

1. Introduction

An ever-increasing world population and climate change are among the major contributors to famine. Crop yields must continue to increase to attain the Sustainable Development Goals and ensure safe, nutritious, and adequate food for everyone. Cereals and derivatives should play a key role in this challenge since they are the staple food of most countries of the world and the primary food for livestock. Cereal grains constitute more than half of the food energy and half of the protein consumed on Earth [1]. With the pressure on resources and the climate change scenario, future food supplies not only need to be increased but also enriched especially in nutrients and protein to address food and nutrient security. Nutrition deficiencies have a significant impact on a country’s productivity and can reduce its gross domestic product (GDP) by as much as 7% globally and up to 9–10% in African and South Asian countries [2]. In this context, there is a need to develop new sustainable sources of protein and nutrients to avoid the 150 more people expected to be at risk of protein deficiencies by 2050 [3]. It is evident that protein plays an essential role within the human body, including building muscle and bone and brain development. Its components, amino acids, are the building blocks of this development and are critically important in the first 1000 days of life and throughout the lifecycle [4]. Animal-based foods are excellent sources of protein but contribute 14.5% of all greenhouse gas emissions [5]. In this view, development of new nutrient-rich crops such as high-protein oat, Avena magna ssp. domestica, becomes one of the pathways to diversify the sources of protein and help attack the dual challenge of increasing supply in a sustainable manner.
Oat ranks sixth in world cereal production after wheat, maize, rice, barley, and sorghum [6]. The most widespread cultivated species of oat is common oat (Avena sativa), with Abyssinian oat (A. abyssinica), diploid naked or hulless oats (A. nuda), and lopsided oat (A. strigosa) being of relatively minor importance [7]. Morocco is the center of origin and a major center of diversity of the Avena genus [8]; consequently, it represents an essential country for expanding genetic resource conservation efforts and an interesting location for expanding oat production.
Oat is a cereal that has long been prized for its nutritional attributes, particularly in terms of mixed-linkage soluble beta-glucan, protein, oil, and antioxidants. Oat grain is also free-gluten and has the highest protein content among cereals; as a consequence, it is tolerated by most celiac disease patients [9]. Several previous studies have shown oat’s health-promoting effects in preventing obesity, type II diabetes, gastrointestinal diseases, coronary heart disease, and certain types of cancer [10]. For human consumption, an increasing supply of oat-based products has been exhibited in the market, including a diverse array of breads, oatcakes, biscuits, granola bars, and ever more novel foods such as yogurt-type products and oat-based drinks [11,12,13].
The newly domesticated Moroccan tetraploid species A. magna (2n = 4x = 28, CCDD genome) was developed via sexual transfer of the domestication syndrome from the hexaploid common oat A. sativa (2n = 6x = 42, AACCDD; [14]). Subsequently, Jackson [7] produced a set of A. magna ssp. domestica lines via mutagenesis within a population of F2:8 recombinant inbred lines (RILs) from a cross between a stable domesticated backcross line, Ba13-13, and a wild A. magna parent [15]. Oliver et al. [15] also mapped three of the domestication syndrome genes, for shattering (Ba), geniculate awn (Awn), and lemma pubescence (Lp), and measured the linkage of Awn and Ba with a terminal knob on chromosome 2C at a distance of 2.1 cM.
While the lines developed by Jackson [7] are suitable for production under standard cultivation practices, they also possess much higher protein levels than common oats, exceeding 25% in the relatively new cultivar ‘Avery’. Avena magna ssp. domestica also showed promise in improving dietary iron and zinc in comparison to other cereals, thus potentially reducing anemia [16,17]. These characteristics make A. magna a good grain resource for the development of high-quality protein products to address developing-world malnutrition, developed-world obesity, and high-quality livestock feed [11]. Since A. magna is already adapted to the semi-arid conditions of Morocco, it is a promising source of sustainable grain for a world increasingly affected by climate change. Nevertheless, there is still a need to continue breeding under Moroccan conditions for traits such as resistance to seed dehiscence, lodging, dormancy, productivity, and stability, as well as tolerance of diseases.
The main objective of this study was to assess the diversity and performance of A. magna ssp. domestica lines using ‘Avery’ as the control in seven diverse environments in Morocco. The evaluation included morphological and yield parameters, disease tolerance (crown rust, BYDV), and yield stability.

2. Materials and Methods

2.1. Plant Materials

Eleven A. magna ssp. domestica lines were used in this study along with ‘Avery’, which was registered in the Official Moroccan Catalog in 2019, as control (Table 1). These lines were selected from a set of 41 lines introduced in Morocco during the 2017–2018 and 2018–2019 cropping seasons for adaptation trials. A. magna was domesticated via hybridization with common hexaploid oat A. sativa followed by a single backcross cycle to produce line Ba13-13 [14]. Subsequently, Jackson [7] produced six foundational A. magna ssp. domestica lines from a domesticated Ba13-13 × wild A. magna # 169 population [15,18], segregating for the wild-type growth habit and resistance to field races of crown rust (Puccinia coronata) in Baton Rouge, LA, USA. According to Jellen et al. [19], a virtual pedigree using a genotype/phenotype model with the JMP Genomics software package version 10 (SAS Institute Cary, NC, USA) was used as instruction to produce the 41 lines and the internal control Avery by intercrossing the foundational lines.

2.2. Experimental Locations

Field experiments were conducted in three consecutive growing seasons (2018–2019, 2019–2020, and 2020–2021), and at 4, 3, and 5 experimental sites in each of these respective winter growing seasons. The selected experimental sites belong to contrasting Emberger bioclimatic stages across the central part of Morocco including per-arid (Alnif in the Anti-Atlas/Sahara); arid (Bouchane in the Phosphate Plateau); semi-arid cold winter (El Kbab in the Middle Atlas); sub-humid (Ain Itto in the Saïs Plain); and sub-humid cold winter (Oukaimeden in the High Atlas; [20]).
Among the twelve trials conducted in this investigation, one was not successful; data from the other eleven trials were subjected to ANOVA analysis. As four tests did not reveal any productivity differences among the advanced lines, the productivity and stability evaluation comprised the seven remaining trials.
Site descriptions for the seven retained trials are reported in Table 2. During the 2018–2019 season, experimental trials were installed at El Kbab (mountain plateau) on 29 November and Bouchane (Phosphate Plateau) on 30 November. Experiments for the following season, 2019–2020, were conducted at only one location, Bouchane, with a sowing date of 23 November. The third season (2020–2021) consisted of four experimental stations: Ain Itto, Bouchane, Oukaimeden, and Alnif. Seeds were sown on 16 October in Oukaimeden, 18 October in Bouchane, 20 October in Ain Itto, and on 21 November in Alnif. Table 2 summarizes the experimental locations’ specifications, the type of environmental climates (warm to cool), and the altitudes at the trial sites. Photos of some experimental sites are shown in Figure 1.
In Alnif, Ain Itto, and Bouchane, mechanized moldboard plowing was used to prepare the soil for sowing, while for El Kbab and Oukaimeden, tillage was performed with a horse-drawn plow. Depending on the germination rate, the sowing dose was calculated to establish a density of 25 plants per linear meter. Trials were fertilized at the early tillering stage in the form of ammonium nitrate at the rate of 45 Kg/ha. Accessions were evaluated under rainfed conditions except for the Alnif site, where irrigation (1 m3 of water per m2) was supplied due to aridity. Weed control was performed manually at the tillering and flowering stages; if necessary, the number of weeding times exceeded two, depending on the degree of weed infestation, to avoid competition between plants.

2.3. Experimental Design

The field experiment design was a randomized complete block with three replications. The sowing plan varied from one site to another according to land availability for the trial. For the 2018–2019 season, the elementary plot included three six-meter rows at Bouchane and four three-meter rows at El Kbab with an inter-row spacing of 0.5 and 0.35 m, respectively. The space between elementary plots was 1.2 m for Bouchane and 1 m for El Kbab. Plots at Bouchane during the 2019–2020 season had four rows of 3.6 m length and were spaced 0.30 m apart. The 2020–2021 experimental plan was carried out in six rows of 12.5 m length and 0.3 m spacing. However, there was an exception at the Alnif and Oukaimeden sites, where eight rows of 8 m and four rows of 3 m were used, respectively, because of the land space limitations. The seeding rate per row was adjusted accordingly in those two sites.

2.4. Notations and Measurements

Crown rust (RC) and barley yellow dwarf virus (BYDV) assessments were made under natural infection at the flowering stage. The percentage of leaf area showing pathogen symptoms was scored for each accession and site where diseases were noticeable. At maturity, 12 agro-morphological traits were scored on harvested individual plants. Plant height (PH, cm) was measured at maturity from the soil surface to the tip of the panicle. After hand-harvesting of the four plants per elementary plot, the panicles were threshed and dried at 35 °C for seeds and 70 °C for other parts of the plant (stem weight SW (g) and root weight RW (g)). Grain yield per plant YP (g) and dry matter per plant DMP (g) were measured using a weighing scale. Harvest index (HI, %) was derived as the ratio of grain yield to total biomass by the formula: HI = (YP/(YP + DMP)) × 100. At harvest, plant density was estimated by counting the number of plants on a one-meter row length. Subsequently, the yield in quintals per hectare (Yield q/ha) and dry matter in quintals per hectare (DM q/ha) were estimated according to plant density, yield per plant, and the plot area which varied between experimental sites. The root length RL (cm), number of fertile tillers NFT, and number of spikelets per panicle (NSP) were also assessed. Furthermore, the weight of a thousand unshelled kernels (TKW g) was estimated using three samples of 250 seeds.

2.5. Statistical Analysis

Collected data were subjected to a variety of statistical analyses. Descriptive statistics, two- and three-way analyses of variance (ANOVA), and multivariate analyses such as principal component analysis (PCA) and additive main effects and multiplicative interaction (AMMI) were performed to assess the genetic diversity in terms of productivity, yield stability, and disease tolerance among lines and experimental sites. The R software version 3.5.1 was used for these tests. The ANOVA tests were conducted to assess the variability among lines within and between sites. For significant ANOVAs, determination of homogeneous groups of lines was performed using the Newman–Keuls post hoc test. Associations among pertinent traits, which were useful for line classifications, as well as significant correlations between those traits, were performed through multivariate principal component analysis (PCA) with Factominer package version 2.4 [21]. The AMMI analysis via R [22] combines both ANOVA and PCA to determine the main effects and genotype-by-environment interactions (GEI) in multi-location trials. The interaction principal component axes, IPCA1 and IPCA2, are calculated and displayed as biplots to project GEI patterns graphically. Initially, adaptability and phenotype stability across the locations were performed by the AMMI method described by Zobel et al. [23]. Subsequently, Purchase [24] developed the AMMI stability value (ASV) based on the AMMI model’s principal components axis 1 and 2 scores for each genotype, respectively. Genotypes with small values of IPCA1, IPCA2, and ASV are more stable across environments. Of course, yield stability is a critical factor to protect small-holding subsistence farmers from starvation in adverse growing seasons.

3. Results

3.1. Disease Assessments

Crown rust (RC; Puccinia coronata f. sp. avenae), barley yellow dwarf virus (BYDV), and powdery mildew (Blumeria graminis f. sp. avenae) are the three most common diseases found on oats in Morocco [19]. Powdery mildew was not noticeable in the experimental trials; consequently, only RC and BYDV infections were assessed at the flowering stage in Bouchane_19, El Kbab_19, Bouchane_21, Ain Itto_21, and Oukaimeden_21. Table 3 shows that BYDV symptoms were more frequent than the two other diseases in five out of seven trials. The ANOVA test for BYDV revealed significant differences among oat lines at three sites: Bouchane_21, Ain Itto_21, and Oukaimeden_21. The average leaf area covered by the virus was equal to 14.62 and 14.25% in Ain Itto_21 and Bouchane_21, respectively. El Kbab_19 BYDV infection was the lowest at only 4.09% and with no significant differences among lines. Regarding RC, the ANOVA test was significant in Bouchane_19 with an average infection value of 20.28%.
The Student–Newman–Keuls test allowed ranking of the oat lines in locations where disease infections were significant (Table 4). There was an irregular ranking of the BYDV infection across sites apart from line AT6. This accession tended to show more tolerance than the others with a value of 9% at Bouchane_21 (Rank 1), 10% at Ain Itto_21 (Rank 2), and 5% at Oukaimeden_21 (Rank 1). It was also ranked second for RC at Bouchane_19 (13.33%).

3.2. Analyses of Agro-Morphological Traits

The average values (means) and coefficients of variation (CVs) of the different morphological (PH, RL) and agronomic (NFT, Yield, DM, HI, etc.) traits across sites are presented in Table 5. Plant height (PH) was less variable than the other traits, with CVs of 9.97% at Oukaimeden_21 and 21.18% at Bouchane_19. The variable TKW also possessed small CVs among samples but was quite variable from site to site (6.82% and 55.58%, respectively). As expected, traits related to grain yield or biomass showed large variation. For example, the CV for yield was over 55% across sites. The Alnif_21 trial yield was the highest at 85.5 q/ha, while the Bouchane_21 trial was the least productive at just 6.89 q/ha. Bouchane_19 plants, in comparison to the other sites, were the shortest (48.93 cm) and had the deepest roots (16.16 cm).
The two-way ANOVA detected significant differences among lines for all the investigated traits except for DMP, TKW, and SW at Bouchane_19.
Table 6 summarizes the line rankings for seed yield at the experimental sites based on the Student–Newman–Keuls test. Table 6 shows that there was no dominant line across all locations. For example, the ATC control performed well in El Kbab_19 (73.8 q/ha) and Alnif_21 (114.9 q/ha), while it ranked last at Bouchane_20 (6.67 q/ha) and Oukaimeden_21 (11.64 q/ha). Line AT5 had the highest yield at Bouchane_19 (39.45 q/ha) and El Kbab_19 (103.17 q/ha); it yielded relatively well at Bouchane_21 (9.13 q/ha) and Oukaimeden_21 (27.11 q/ha) but was less productive at the other locations.
Merely considering line performance through all sites combined does not allow for their correct ranking because they showed contrasting productivity potential. The three-way ANOVA was conducted to take into account line × environment interaction. The ANOVA_3 test revealed significant differences among genotypes for most of the traits except TKW. Furthermore, it showed a high location effect on genotype morphology and productivity.
The ranking of the experimental sites for productivity parameters showed that average Yield varied from 6.89 to 85.5 q/h; DM from 15.34 to 188.15 q/ha; and HI ranged from 20.43 to 31.33%. Alnif_21 and El Kbab_19 produced both high grain and biomass yields in comparison to the other sites. During the 2019_2020 and 2020_2021 seasons, the arid Bouchane site produced less than the other locations.
The Student–Newman–Keuls test results of the three-way ANOVA are reported in Table 7. Combining all the sites’ data showed clearly that AT5 was the most productive line. It was ranked first for grain yield (43.41 q/ha), HI (34.76%), and TKW (49.73 g). For the DM, it was ranked second after AT1 with a value of 69.24 q/ha. On the other hand, the least productive lines were AT15 (23.90 q/ha) and AT9 (23.11). Regarding the morphological traits, the accession PH ranged between 84.07 cm (AT2) and 94.92 cm (AT15). Lines ATC (85.06 cm), AT6 (84.64 cm), and AT2 (84.07 cm) were the shortest. Root length (RL), NFT, and NSP varied between 13.52 (AT5) and 15.61 cm (AT15); between 4.03 (AT15) and 5.93 (AT1); and between 24.85 (AT2) and 36.06 (AT13), respectively.

3.3. Principal Components Analysis

The principal component analysis (PCA) was conducted to identify the main traits that contribute to differentiation among lines. PCA considers all the variables at the same time to cluster the oat lines through their similarities. The PCA outputs showed that 84.57% of the variability was explained by the first four principal components’ axes. This high percentage reflects strong discrimination among the assessed lines. The main contributors to the first principal component (PC1) were PH, RL, HI, and RC (35.73%). Thus, PC1 can be considered an indicator of the plant morphology behind the RC disease. Both PC2 and PC3 accounted for 37.71% of the total variation; they were mainly linked to the grain and biomass yield components: NTF, NSP, SW, DMP, YP, DM, and Yield. The fourth axis was essentially explained by the TKW and BYDV degree of susceptibility.
According to the Pearson correlations matrix (Table 8), DMP exhibited both highly significant and positive correlations with YP and SW (R2 = 0.81; R2 = 0.82). Yield per plant (YP) was also positively correlated with NSP and RW (R2 = 0.63 and R2 = 0.65). Grain yield per hectare (Yield) and DM were positively correlated at 75%. A negative correlation was found between the HI and PH (R2 = −0.59), RL (R2 = −0.74), and RC (R2 = −0.78). On the other hand, the HI showed a positive relationship with grain yield (R2 = 0.63). The susceptibility to BYDV and RC diseases appeared together in oat plants up to 62%.
The biplot PC1 × PC2 revealed four accessions’ clusters (Figure 2). Two accessions, AT5 and AT1, formed cluster I, which included high biomass and grain production potential. Cluster II gathered AT13 and AT14, which had good individual plant performance (grain yield and dry matter per plant). Cluster III included ATC and AT6, short size, and high harvest-index lines with better tolerance to BYDV and RC infection than AT7 and AT9. Cluster IV included AT4 with its high TKW.

3.4. AMMI Analysis

An AMMI analysis was performed to scrutinize yield stability of the experimental lines across environments. The analysis of variance (ANOVA) associated with the AMMI model revealed highly significant site, line, and their interaction (S × L) effects (p-value ≤ 0.001). The environment explained the largest grain yield variability (78%), followed by the interaction (18%; Table 9). Only 4% of the total sum of squares was assigned to the genetic factor of the A. magna ssp. domestica lines—the large contrast between the sites was intended to assess the specific adaptation of the experimental lines through the GxE interactions. Differences among lines were more expressed within the experimental sites. The two first axes, IPCA1 and IPCA2, explained 59.7% and 31.7%, respectively, of the genotype×environment interaction (GEI) sum of squares.
Figure 3 displays a scatter plot formed by genotypes and experimental locations according to their coordinates on the two first axes of GEI. The values of these coordinates indicate the accessions’ contribution to GEI. In this case, the lower the coordinate is, the lower its contribution to GEI and therefore the more stable the genotype is. Thus, lines AT7, AT6, AT13, and AT4 being closer to the biplot’s center have more stable grain production across the experimental sites. In contrast, grain yields of the AT5, AT9, AT15, and ATC lines are unstable from site to site, as their position is far away from the biplot center. The other accessions are ranked intermediate with respect to their grain yield stability (AT1, AT2, AT3, and AT14). Furthermore, the length of vectors assigned to the experimental locations shows their ability to discriminate among the oat lines. El Kbab_19 and Alnif_21 sites showed more yield variation among lines. When a genotype projection is close to a site position on the biplot, that means the line has a specific adaptation to it; for example, AT5 was better suited to El Kbab_19 (103.17 q/ha), and ATC interacted positively with the Alnif_21 environment (114.9 q/ha), as did AT9 (34.83 q/ha) with Oukaimeden_21.
AMMI analysis provided comparisons between productivity and stability (Figure 4). We observed two main categories of the studied lines. The first group consisted of high-yielding lines that exceeded the experimental site average yield (30.76 q/ha). Among these lines, two were the most productive, AT5 and ATC, though they were quite unstable (ASV = 9.62 and 6.37, respectively). Line AT1 had intermediate stability and a yield equal to 36.17 q/ha, while AT7, which was the most stable (ASV = 1.69), yielded 32.73 q/ha. The other lines produced below the mean yield, with AT6 and AT13 showing good yield stability and a slightly lower yield than average (30.44 q/ha and 29.24 q/ha, respectively).

4. Discussion

The goal of this present work was to determine the agro-morphological variability of 11 A. magna ssp. domestica advanced lines and a control cultivar named Avery (ATC). Avena sativa (2n = 6x = 42) is the principal species of oat cultivated in Morocco, usually for fodder [25]. At the beginning of the local oat research program of the National Institute of Agricultural Research, varieties derived from the native hexaploid A. byzantina (red oat), which has a low water requirement and the ability to adjust its growth cycle to Moroccan environmental variability, were also released [26]. The array of wild Avena species native to Morocco—the center of origin of the genus—unfortunately lacks the required traits for broad cultivation such as resistance to shattering, semi-dwarfism, lodging resistance, erect growth habit, resistance to seed dormancy, etc. The neo-domesticated A. magna material first described by Ladizinsky [14] and later modified by Jackson [7] should have the potential to diversify the cultivated germplasm of oats. This new oat diversity contributes to the conservation of genetic resources of the genus and plays a positive role in maintaining crop diversity [6,17]. In addition, the significantly higher protein content of ‘Avery’ previously reported by Jackson [7] could encourage farmers and manufacturers to harness this asset to improve the crop’s profitability for both human and animal feed. Over the course of the past 40 years, interest in oats for human consumption has gradually increased, concomitant with mounting clinical evidence regarding its nutritional benefits for cardiovascular health [27].
The disease assessment study had focused only on RC and BYDV, since there were no noticeable symptoms of powdery mildew at the heading stage when scoring was carried out. Several authors agree that RC (Puccinia coronata) is the major disease threatening global oat production [28]. This pathogen can drastically affect oat production by causing 10–40% yield loss [29]. Crown rust (RC) was only recorded at Bouchane in the 2018–2019 cropping season because at the other locations there were no noticeable symptoms in the experimental plots. The cause may be due to relatively dry and cool conditions at the experimental sites during 2020–2021. Nazareno et al. [28] reported that crown rust epidemics usually occur in warm areas as temperatures fluctuate between 20 and 25 °C and humidity surpasses 50–60%. At the El Kbab high-altitude site and in Alnif’s dry environment, weather conditions would be expected to suppress crown rust development. The incidence of BYDV was more common than RC across the experimental locations. BYDV is probably the most economically important small-grain virus transmitted by insects, with 25 aphid species being involved as potential BYDV vectors [30]. High light intensity and low temperatures (15–18 °C) also promote increased intensity of BYDV symptoms [31]. All of these considerations and A. magna’s well-known susceptibility to BYDV [
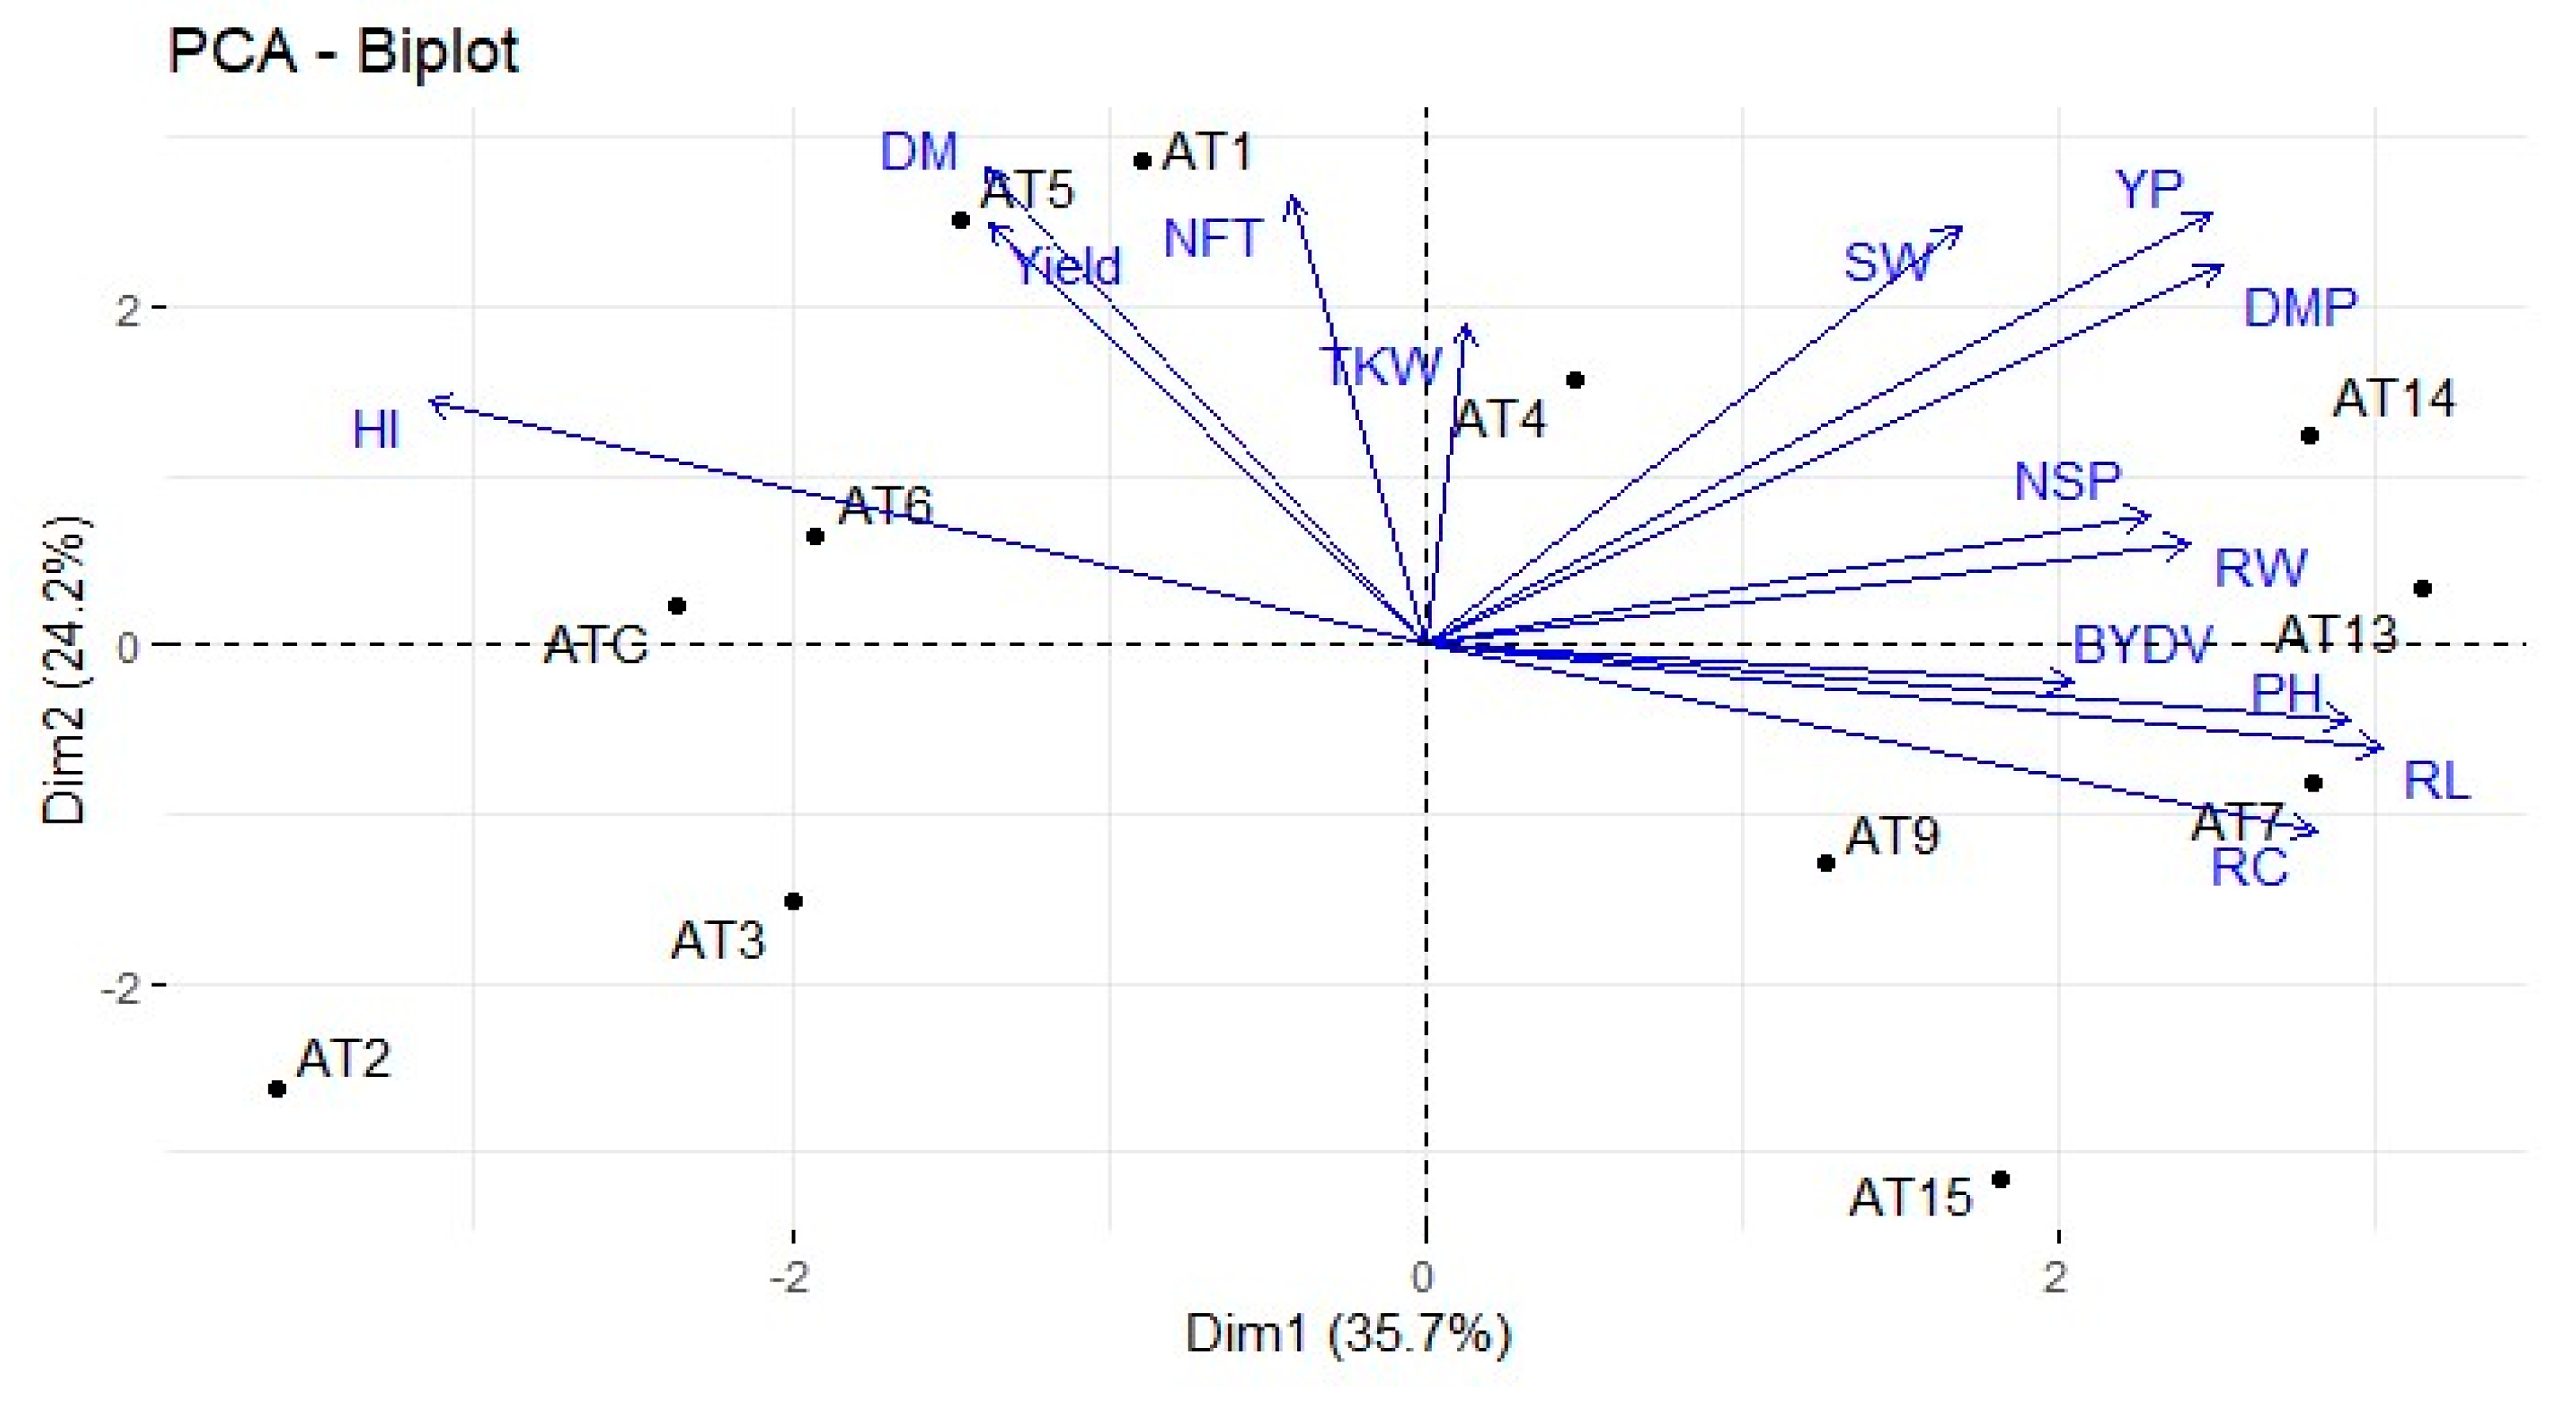
14] may explain the high incidence of the virus observed in our experiments. The trials’ results did not show consistent tolerance to diseases of tested lines at all sites, except for line AT6, which appeared to be more tolerant to BYDV and RC infections. Combining data from all sites, PCA revealed that the control variety Avery and AT6 were relatively less susceptible to the diseases, which was not the case for AT7 and AT9. Jellen et al. [19] had already noted A02 (line AT7 in this study) among the lines showing RC symptoms in the Lahri experiment in 2018.
Data analyses revealed significant agro-morphological diversity between the domesticated A. magna lines. Plant height (PH) varied between 48.93 and 120.47 cm across the sites. Through the different sites, PH fluctuated between 84.07 cm for AT2 and 94.92 cm for AT15. Previous studies reported similar plant height values. Dumlupinar et al. [32], who studied A. sativa pure-line varieties, reported variation for plant height between 46 and 112 cm. Among our investigated traits, PH gave the lowest CV, between 9.97 and 21.18% across the five sites. This finding is in line with Solange et al. [33] and Dumlupinar et al. [32], who reported CVs of 11.16 and 8.7%, respectively, for this trait. A possible explanation for these observations is that plant height is affected by a relatively small number of major genes, which in this case might be largely fixed through selection. PCA analysis showed that PH was positively correlated with RL (0.72) and NSP (0.60); on the other hand, PH was significantly negatively correlated with HI. Other authors reported a significant negative correlation between PH and grain yield and explained the relationship as being due to lodging [34,35]. Plant size has to be examined closely in varietal selection to avoid lodging, in our case with lines AT13 and AT15.
Root length across locations ranged from 11.87 to 16.16 cm at Oukaimeden_21 and Bouchane_19, respectively. The longest roots were observed in Bouchane in three successive seasons. This behavior is likely due to the sandy soil at Bouchane, which facilitates and encourages deep root penetration as capillary water drains downward through the soil profile. Finer roots were also more easily retained as the plants were uprooted in the light-textured soil to take RL measurements. The higher clay content at the other experimental sites allowed for better soil water retention. This supports the previous observation that A. magna ssp. domestica has the ability to deeply penetrate the soil under water-stress conditions [19].
The three-way ANOVA detected significant differences among lines according to their tillering ability: 4.03 NFT/plant for AT15 and 5.93 for AT1 on average (Table 7). The genetic control of tillering capacity has been discussed previously in oat genotypes [36,37]. The mean NFT was mostly equivalent among our test locations except for Alnif_21, where it reached an average of 11.09. Good crop management practices such as irrigation and fertilization have a positive influence on the tillering ability of plants; this may explain the significantly higher NFT value at this irrigated site.
The NSP varied among lines, ranging from 24.85 to 36.06 for AT2 and AT7, respectively. Solange et al. [33] observed an NSP mean of 26.63 for A. sativa, which is close to our findings. However, Jan et al. [6] counted 66 spikelets per panicle on average in their experiment. The number of spikelets is influenced by soil fertility, humidity, and photoperiod.
Thousand-kernel weight (TKW) is an important productivity and grain-quality trait for oats. According to our three-way ANOVA, TKW was more significantly influenced by growing location than genotype. Considering separately the experimental sites, two-way ANOVA showed a significant effect of the accessions at all testing sites except Bouchane_19. Our line TKW values, similar to previous results in A. sativa, varied between 32.83 and 49.73 g for AT3 and AT5, respectively. Our results correspond well with A. sativa TKW values [6,32,33].
Seed partitioning on the total biomass is evaluated through the HI. Statistical analyses showed that HI was influenced by both the line and the environment; it varied between 20.43 and 31.33% across the five testing locations. Regarding the effect of the lines, the HI varied between 19.88% for AT13 and 34.76% for AT5. Jan et al. [6] and Li et al. [38] reported on variation for HI among A. sativa genotypes and between environments and years; their HI values were comparable to ours.
It has historically been a major challenge for plant breeders to consistently identify superior-yielding genotypes across environments when GEI is highly significant. Several researchers testing crops in multi-location conditions have reported larger environmental than genotypic effects on grain yield [39,40,41,42]. In our case, the environmental effect represented 78% of the total grain yield variation, while the genotype explained only 4%. Grain yield varied extensively among our sites: from 6.89 q/ha at Bouchane_19 to 85.50 q/ha at Alnif_21. Previously, within a larger set of A. magna lines, Jellen et al. [19] identified the environment as the most important factor influencing yield, with genotype being the second most significant factor. Our AMMI analysis allowed classification of the A. magna lines based on their ASVs. Combining ASV and yield into a single index should represent a better way to evaluate a genotype’s potential across locations. The yield stability index has been used by several authors to rank their germplasm [40,43,
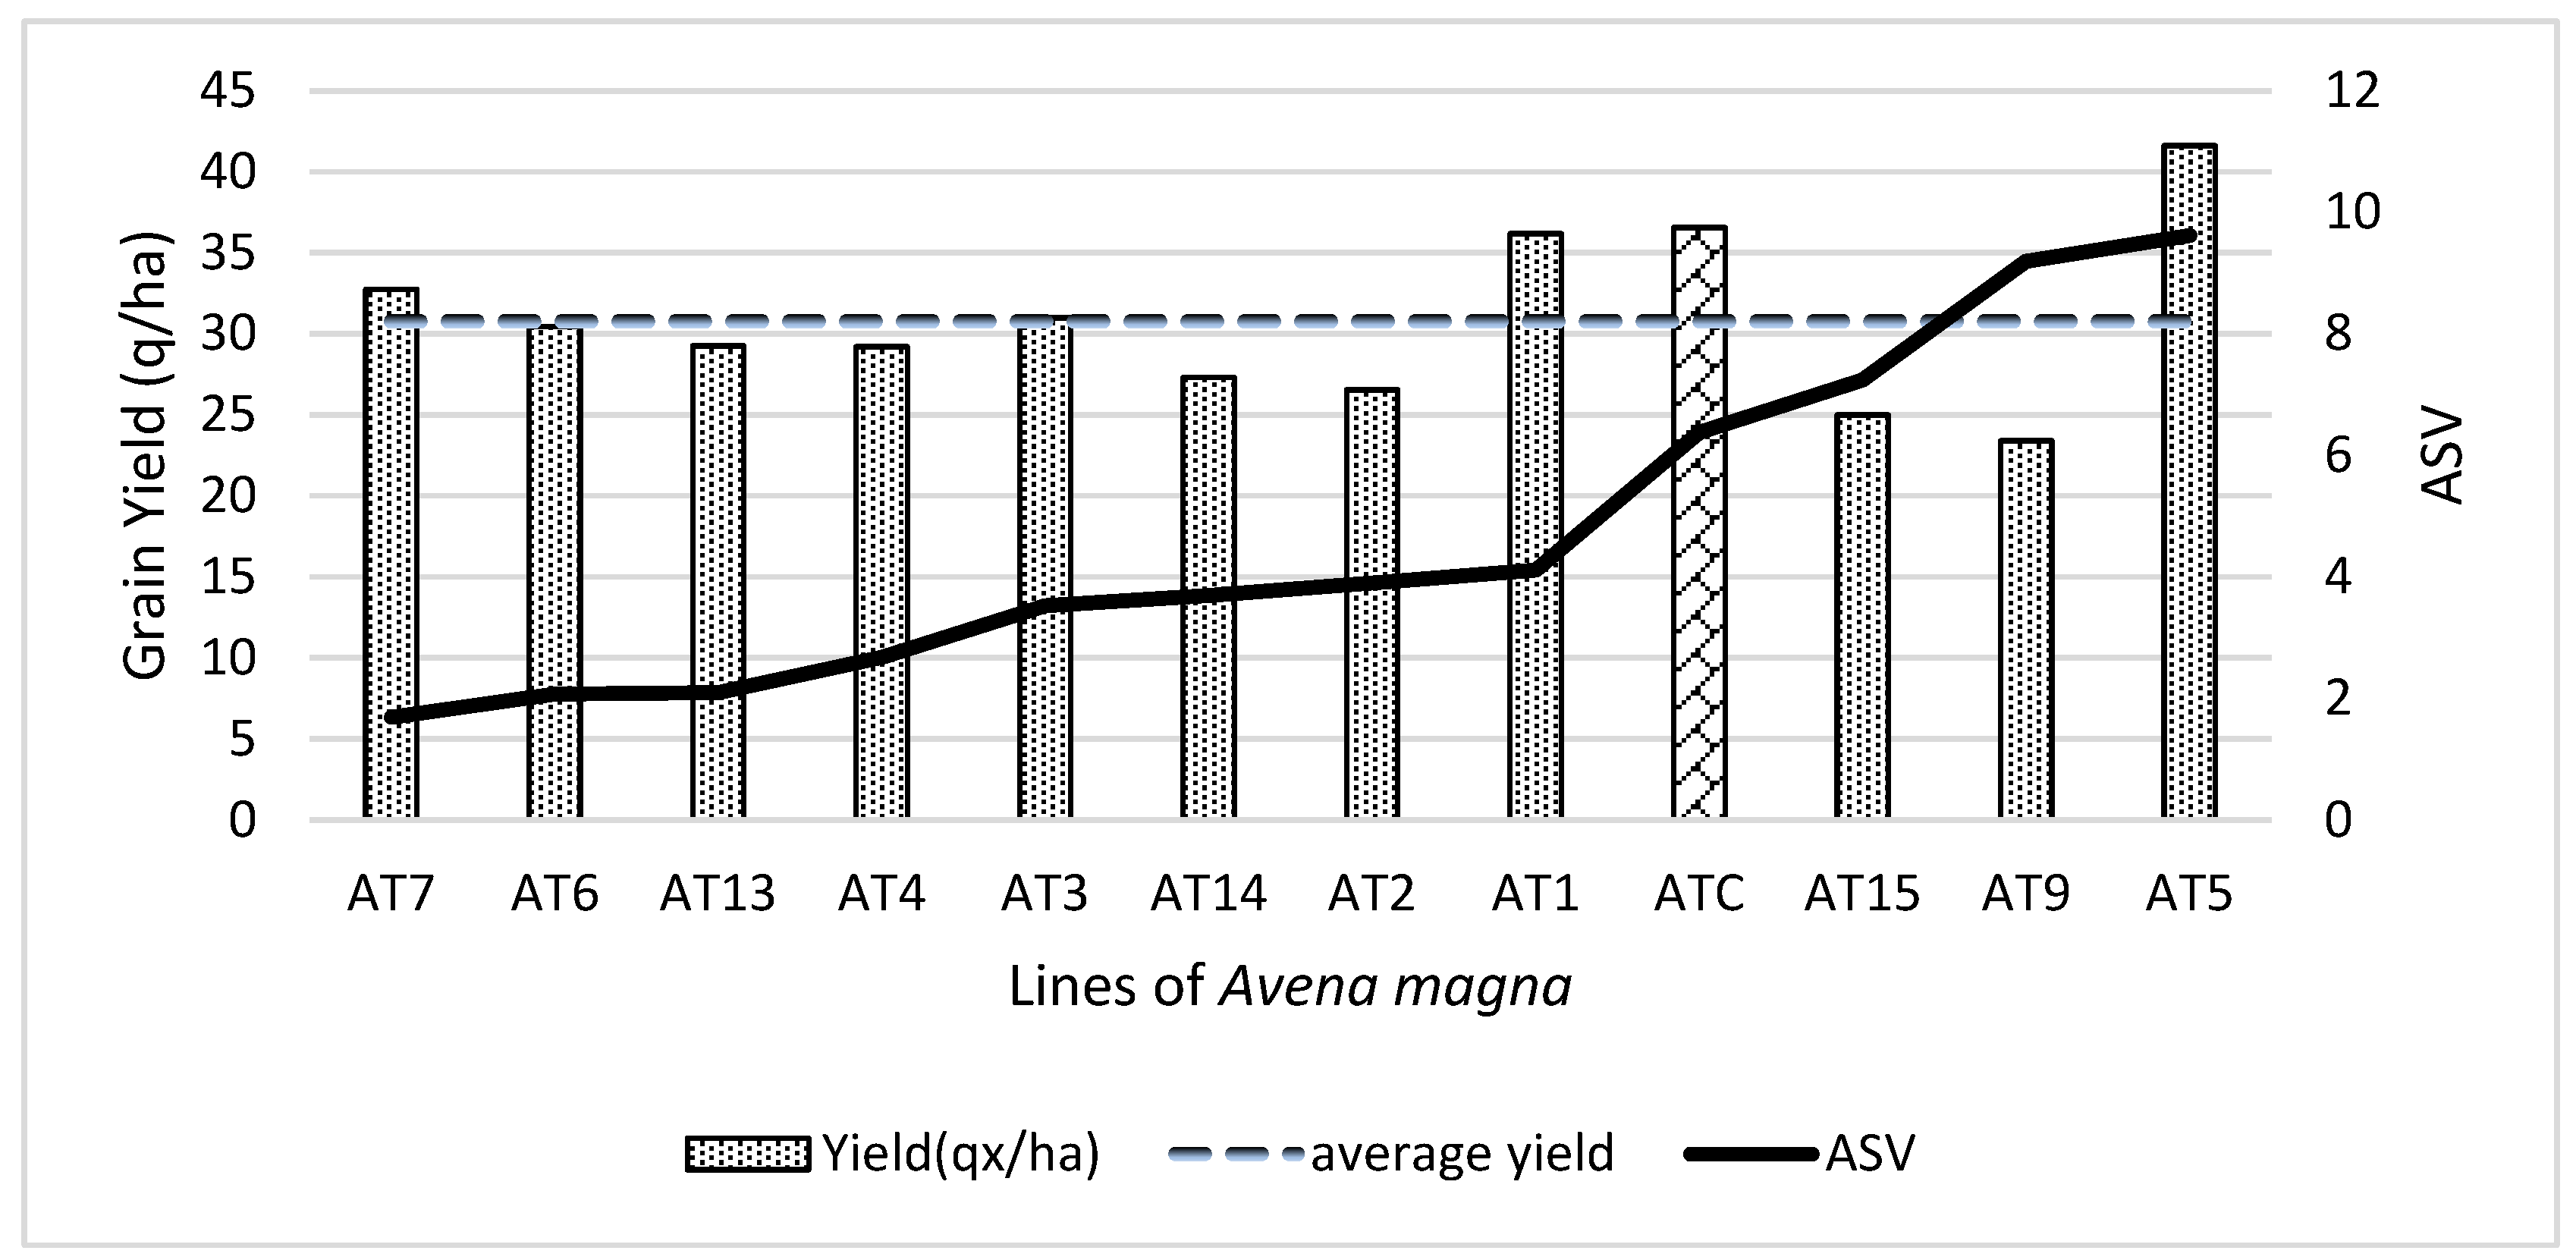
44]. Stable lines are usually less productive than low-stability ones. Stable genotypes have large adaptation and intermediate yield potential, while low-stability lines yield the maximum in the environment in which they are best adapted while ranking among the lowest in other locations. In this study, we presented a hybrid graph to display the A. magna line performance and separated them into two groups according to their ASV and grain yield. The first group included A. magna lines whose grain yield across locations exceeded the average yield of 30.76 q/ha. Two of the genotypes produced relatively higher grain yields, but they were unstable: AT5 (mean yield of 43.31 q/ha) Avery (35.66 q/ha). Line AT5 performed the best at El Kbab_19 while Avery produced the most at Alnif_21, with respective yields of 103.17 q/ha and 114.9 q/ha. Gadisa et al. [40], while investigating germplasm consisting of 15 bread wheat lines, noticed that the two highest-yielding genotypes were among the most unstable. Each of these two wheat lines had interacted positively at a given site. These results are in agreement with our findings. Among the tested A. magna lines, AT1 was moderately stable, while AT7 had the highest stability in the collection. Using the yield stability index, AT7 ranked first as being the superior genotype among the tested germplasm in terms of stability and grain yield. This accession, however, appeared to be less tolerant to diseases. Among the A. magna lines that produced below the mean grain yield, AT6 exhibited good yield stability and will be further scrutinized for its apparent tolerance to the main common diseases and its yield, which approached 30.44 q/ha.
The average grain yield of this present study across five sites and three years of experimentation was 30,76 q/ha. It may be recalled when Tam [45] tested 101 oat varieties of A. sativa from Germany, Sweden, Russia, Canada, the USA, and other countries, where the average yields ranged between 32.88 and 58.24 q/ha. In our trials, Bouchane’s relatively low average yield of 6.89 q/ha is explained by the semi-arid climate conditions; moreover, Morocco is an arid to semi-arid country, unlike Estonia where Tam carried out his experiment. At the most favorable Moroccan site, Ain Itto_21, rainfall barely reached 609.8 mm during the cropping season. However, it should be noted that with certain lines at certain locations, grain yield greatly exceeded the above-mentioned yield range: for example, AT5 at El Kbab_19 and Avery at Alnif_21. Tests of various A. sativa varieties selected for northern Morocco reached 45 q/ha under experimental conditions and 24 q/ha in farmers’ production fields [46]; these previous results confirm that grain yield tends to decrease under working farm conditions, and some A. magna lines might express their best yield potential under good cultivation and environmental conditions.

5. Conclusions

This present study focused on the agronomic performance of advanced A. magna ssp. domestica lines under working farm conditions at five contrasting locations in Morocco. The results measured diversity among the investigated lines for agro-morphological traits. Grain yield was most highly influenced by the contrasted environments, followed by GEI, with genotype explaining very little of the variation for yield. The mountainous site of El Kbab seems to be more suitable for growing A. magna under obligate rainfed conditions. The average grain yield obtained is in the range usually found for common oat production around the world, which justifies the adaptability of these A. magna ssp. domestica lines to their native zone. Line AT5 had the highest grain yield and is therefore expected to attain higher grain yields in different locations in Morocco experiencing ample rainfall. Line AT7 was interesting for its relatively high yield stability value, as measured by AMMI. We hope to be able to select one of these advanced lines for registration in Morocco along with the existing control variety, Avery. Further investigation of these lines’ nutritional differences and molecular genotyping of these lines are the next steps for facilitating further improvement of domesticated A. magna.

Author Contributions

Conceptualization, O.B., E.N.J. and E.W.J.; methodology, O.B., E.W.J., E.h.T. and A.E.M.; formal analysis, E.h.T., O.B. and A.E.M.; execution of research, O.B., E.h.T., E.N.J., E.W.J., A.E.M., M.N. and W.R.; writing—original draft preparation, E.h.T., O.B. and E.N.J.; writing—review and editing, O.B., E.N.J., E.h.T. and M.N.; visualization, O.B., E.N.J. and E.h.T.; supervision, O.B., E.N.J., E.W.J., M.N. and W.R.; project administration, O.B., M.N., W.R., E.N.J. and E.W.J.; funding acquisition, O.B., E.W.J., E.N.J., M.N. and W.R. All authors have read and agreed to the published version of the manuscript.

Funding

This research was funded by Context Global Development (USA) under the Rich Oats for Africa project agreement with the Institut Agronomique et Vétérinaire Hassan II (Morocco).

Data Availability Statement

Data is contained within the article.

Acknowledgments

The authors would like to acknowledge Context Global Development (USA), SALL Family Foundation (USA), 25:2 Solutions (USA), Brigham Young University (USA), and Institut Agronomique et Vétérinaire Hassan II (Morocco) for their financial support and for conducting the field trials under the ″Rich Oats for Africa″ Project.

Conflicts of Interest

The authors declare no conflict of interest.

References

  1. Loskutov, I.G.; Khlestkina, E.K. Wheat, Barley, and Oat Breeding for Health Benefit Components in Grain. Plants 2021, 10, 86. [Google Scholar] [CrossRef]
  2. Galasso, E.; Wagstaff, A.; Naudeau, S.; Shekar, M. Economic Costs of Stunting and How to Reduce Them; World Bank Research Group Policy Research Note; October 2016; Available online: http://pubdocs.worldbank.org/en/536661487971403516/PRN05-March2017-Economic-Costs-of-Stunting.pdf (accessed on 9 July 2018).
  3. Medek, D.E.; Schwartz, J.; Myers, S.S. Estimated Effects of Future Atmospheric CO2 Concentrations on Protein Intake and the Risk of Protein Deficiency by Country and Region. Environ. Health Perspect. 2017, 125, 087002. [Google Scholar] [CrossRef] [PubMed] [Green Version]
  4. Edge, M.S.; Tiffany, A. The Importance of Protein in the Developing World—A Solution to Food and Nutrition Insecurity; 2018; Available online: https://contextglobaldevelopment.medium.com/the-importance-of-protein-in-the-developing-world-79189e3ad67f (accessed on 23 May 2023).
  5. Food and Agriculture Organization, United Nations. Tackling Climate Change Through Livestock; 2013; Available online: http://www.fao.org/3/a-i3437e.pdf (accessed on 6 July 2018).
  6. Jan, S.F.; Khan, M.R.; Iqbal, A.; Khan, F.U.; Ali, S. Genetic diversity in exotic oat germplasm & resistance against barley yellow dwarf virus. Saudi J. Biol. Sci. 2020, 27, 2622–2631. [Google Scholar] [CrossRef] [PubMed]
  7. Jackson, E.W. High Protein Oat Species. W.I.P.O. Patent Application WO 2017/070104 A1, 27 April 2017. [Google Scholar]
  8. Leggett, J.M. Classification and speciation in Avena. In Oat Science and Technology, Agronomy Monograph No. 33; Marshall, H.G., Sorrells, M.E., Eds.; American Society of Agronomy, Crop Science Society of America Madison: Madison, WI, USA, 1992. [Google Scholar]
  9. Ahola, H.G.; Sontag-Strohm, T.S.; Schulman, A.H.; Tanhuanpää, P.; Viitala, S.; Huang, X. Immunochemical analysis of oat avenins in an oat cultivar and landrace collection. J. Cereal Sci. 2020, 95, 103053. [Google Scholar] [CrossRef]
  10. Song, M.; Wu, K.; Meyerhardt, J.A.; Ogino, S.; Wang, M.; Fuchs, C.S.; Giovannucci, E.L.; Chan, A.T. Fiber Intake and Survival After Colorectal Cancer Diagnosis. JAMA Oncol. 2018, 4, 71–79. [Google Scholar] [CrossRef]
  11. Rasane, P.; Jha, A.; Sabikhi, L.; Kumar, A.; Unnikrishnan, V.S. Nutritional advantages of oats and opportunities for its processing as value added foods—A review. J. Food Sci. Technol. 2015, 52, 662–675. [Google Scholar] [CrossRef] [Green Version]
  12. Kouřimská, L.; Sabolová, M.; Horčička, P.; Rys, S.; Božik, M. Lipid content, fatty acid profile, and nutritional value of new oat cultivars. J Cereal Sci. 2018, 84, 44–48. [Google Scholar] [CrossRef]
  13. Gu, Y.; Qian, X.; Sun, B.; Ma, S.; Tian, X.; Wang, X. Nutritional composition and physicochemical properties of oat flour sieving fractions with different particle size. LWT 2021, 154, 112757. [Google Scholar] [CrossRef]
  14. Ladizinsky, G. Domestication via hybridization of the wild tetraploid oats Avena magna and A. murphyi. Theor. Appl. Genet. 1995, 91, 639–646. [Google Scholar] [CrossRef]
  15. Oliver, R.E.; Jellen, E.N.; Ladizinsky, G.; Korol, A.B.; Kilian, A.; Beard, J.L.; Dumlupinar, Z.; Wisniewski-Morehead, N.H.; Svedin, E.; Coon, M.; et al. New Diversity Arrays Technology (DArT) markers for tetraploid oat (Avena magna Murphy et Terrell) provide the first complete oat linkage map and markers linked to domestication genes from hexaploid A sativa L. Theor. Appl. Genet. 2011, 123, 1159–1171. [Google Scholar] [CrossRef]
  16. Kassebaum, N.J.; Jasrasaria, R.; Naghavi, M.; Wulf, S.K.; Johns, N.; Lozano, R.; Regan, M.; Weatherall, D.; Chou, D.P.; Eisele, T.P.; et al. A systematic analysis of global anemia burden from 1990 to 2010. Blood 2014, 123, 615–624. [Google Scholar] [CrossRef]
  17. Manzali, R.; Douaik, A.; Bouksaim, M.; Ladizinsky, G.; Saidi, N. Assessment of important technological parameters of new Moroccan domesticated tetraploid oat lines of Avena magna. Труды пo прикладнoй бoтанике, генетике и селекции 2018, 179, 32–42. [Google Scholar] [CrossRef] [Green Version]
  18. Jellen, E.; Beard, J. Geographical Distribution of a Chromosome 7C and 17 Intergenomic Translocation in Cultivated Oat. Crop. Sci. 2000, 40, 256–263. [Google Scholar] [CrossRef]
  19. Jellen, E.N.; Jackson, E.W.; Elhadji, T.; Young, L.K.; El Mouttaqi, A.; Al Halfa, I.; El Fartassi, I.; Katile, L.S.; Linchangco, R.; Klassen, K.; et al. Adaptation and Agronomic Performance of Domesticated Moroccan Oat (Avena magna ssp. domestica) Lines under Subsistence Farming Conditions at Multiple Locations in Morocco. Agronomy 2021, 11, 1037. [Google Scholar] [CrossRef]
  20. Mokhtari, N.; Mrabet, R.; Lebailly, P.; Bock, L. Spatialisation des bioclimats, de l’aridité et des étages de végétation du Maroc. Rev. Mar. Sci. Agron. Vét. 2014, 2, 50–66. [Google Scholar]
  21. Husson, F.; Le, S.; Pages, J. Exploratory Multivariate Analysis by Example Using R; Chapman and Hall: London, UK, 2010. [Google Scholar]
  22. R Core Team. R: A Language and Environment for Statistical Computing; R Foundation for Statistical Computing: Wien, Austria, 2016; ISBN 3-900051-07-0. Available online: https://www.R-project.org (accessed on 9 September 2022).
  23. Zobel, R.W.; Wright, M.J.; Gauch, H.G., Jr. Statistical Analysis of a Yield Trial. Agron. J. 1988, 80, 388–393. [Google Scholar] [CrossRef]
  24. Purchase, J.L. Parametric Analysis to Describe Genotype x Environment Interaction and Yield Stability in Winter Wheat; University of Free State: Bloemfontein, South Africa, 1997. [Google Scholar]
  25. Al Faïz, C.; Saïdi, S.; Jaritz, G. Avoine fourragère (Avena sativa L.). In Production et Utilisation des Cultures Fourragères au Maroc; Jaritz, G., Bounejmate, M., Eds.; INRA: Rabat, Morocco, 1997; pp. 209–224. [Google Scholar]
  26. Bari Abdellah. Oats in Morocco. 2016. Available online: https://www.researchgate.net/publication/31057526 (accessed on 22 February 2022).
  27. Broeck, H.C.V.D.; Londono, D.M.; Timmer, R.; Smulders, M.J.M.; Gilissen, L.J.W.J.; Van der Meer, I.M. Profiling of Nutritional and Health-Related Compounds in Oat Varieties. Foods 2016, 5, 2. [Google Scholar] [CrossRef] [Green Version]
  28. Nazareno, E.S.; Li, F.; Smith, M.; Park, R.F.; Kianian, S.F.; Figueroa, M. Puccinia coronata f. sp. avenae: A threat to global oat production. Mol. Plant Pathol. 2018, 19, 1047–1060. [Google Scholar] [CrossRef] [Green Version]
  29. Behnken, L.M.; Breitenbach, F.R.; Miller, R.P. Impact of Foliar Fungicide to Control Crown Rust in Oats. 2009. Available online: https://www.extension.umn.edu/agriculture/forages/pest/docs/umn-ext-impact-offoliar-fungicide-to-control-crown-rusts-in-oats.pdf (accessed on 21 April 2017).
  30. Halbert, S.; Voegtlin, D. Biology and taxonomy of vectors of barley yellow dwarf viruses. Barley Yellow Dwarf 1995, 40, 217–258. [Google Scholar]
  31. D’Arcy, C.J.; Burnett, P.A. Barley Yellow Dwarf: 40 Years of Progress; The American Phytopathological Society Press: St. Paul, MN, USA, 1995. [Google Scholar]
  32. Dumlupinar, Z.; Güngör, H.; Dokuyucu, T.; Herek, S.; Tekin, A.; Akkaya, A. Agronomical Screening of OGLE1040/TAM O-301 Oat Genetic Mapping Population. Sains Malays. 2019, 48, 975–981. [Google Scholar] [CrossRef]
  33. Solange, F.d.S.S.; Danyela, d.C.S.O.; Latoia, E.M.; Tiago, C.; Victoria, F.d.O.; Cristiano, S.; Henrique, P.C.; Vianei, R.; Maraisa, C.H.; Luis, C.G.; et al. Associations between Agronomic Performance and Grain Chemical Traits in Oat. 2020, Volume 10. Available online: http://cpsjournal.org (accessed on 8 November 2021).
  34. Dumlupinar, Z.; Kara, R.; Dokuyucu, T.; Akkaya, A. Correlation and path analysis of grain yield and yield components of some Turkish oat genotypes. Pak. J. Bot. 2012, 44, 321–325. [Google Scholar]
  35. Buerstmayr, H.; Krenn, N.; Stephan, U.; Grausgruber, H.; Zechner, E. Agronomic performance and quality of oat (Avena sativa L.) genotypes of worldwide origin produced under Central European growing conditions. Field Crop. Res. 2007, 101, 343–351. [Google Scholar] [CrossRef]
  36. Ahmad, G.; Ansar, M.; Kalem, S.; Nabi, G.; Hussain, M. Performance of early maturing oats (Avena sativa L.) cultivars for yield and quality. J. Agric. Res. 2008, 46, 341–346. [Google Scholar]
  37. Ma, Y.; Liu, Z.; Bai, Y.; Wang, W.; Wang, H. Study on diversity of oats varieties in Xinjiang. Xinjiang Agric. Sci. 2006, 43, 510–513. [Google Scholar]
  38. Li, P.-F.; Mo, F.; Li, D.; Ma, B.-L.; Yan, W.; Xiong, Y. Exploring agronomic strategies to improve oat productivity and control weeds: Leaf type, row spacing, and planting density. Can. J. Plant Sci. 2018, 98, 1084–1093. [Google Scholar] [CrossRef]
  39. Thiam, E.; Allaoui, A.; Benlhabib, O. Quinoa Productivity and Stability Evaluation through Varietal and Environmental Interaction. Plants 2021, 10, 714. [Google Scholar] [CrossRef]
  40. Gadisa, A.W.; Hussein, M.; Dawit, A.; Tesfahun, A. Genotype X Environment Interaction and Yield Stability of Bread Wheat Genotypes in Central Ethiopia. J. Plant Breed. Genet. 2019, 7, 87–94. [Google Scholar]
  41. Machado, N.G.; Lotufo-Neto, N.; Hongyu, K. Statistical analysis for genotype stability and adaptability in maize yield based on environment and genotype interaction models. Ciênciae Nat. 2019, 41, 25. [Google Scholar] [CrossRef]
  42. Doehlert, D.C.; McMullen, M.S.; Hammond, J.J. Genotypic and Environmental Effects on Grain Yield and Quality of Oat Grown in North Dakota. Crop. Sci. 2001, 41, 1066–1072. [Google Scholar] [CrossRef]
  43. Farshadfar, E. Incorporation of AMMI Stability Value and Grain Yield in a Single Non-Parametric Index (GSI) in Bread Wheat. Pak. J. Biol. Sci. 2008, 11, 1791–1796. [Google Scholar] [CrossRef] [Green Version]
  44. Atta, B.M.; Shah, T.M.; Abbas, G.; Haq, M.A. Genotype x environment interaction for seed yield in kabuli chickpea (Cicer arietinum L.) genotypes developed through mutation breeding. Pak. J. Bot. 2009, 41, 1883–1890. [Google Scholar]
  45. Tamn, I. Genetic and environmental variation of grain yield of oat varieties. Agron. Res. 2003, 1, 93–97. [Google Scholar]
  46. Noutfia, A.; El Mourabit, N.; Alfaiz, C. Selection of oat varieties to the North of Morocco. Need of diffusion and renewal of the varieties. In New Approaches for Grassland Research in a Context of Climate and Socio-Economic Changes; (Option s Méditerranéennes: Série A. Séminaires Méditerranéens; n. 102); Acar, Z., López-Francos, A., Porqueddu, C., Eds.; CIHEAM: Zaragoza, Spain, 2012; pp. 233–236. [Google Scholar]
Figure 1. Experimental site photographs: (A) Bouchane, April 2020; (B) El Kbab, June 2019; (C) Oukaimeden, June 2021; (D) Alnif, April 2021; (E) A. magna panicle from Ain Itto site.
Agriculture 13 01486 g001
Figure 2. Biplot principal component 1 (PC1), principal component 2 (PC2) of the 12 lines, and traits derived from the average linkage cluster analysis. Explanation: traits: PH = plant height (cm); RL = root length (cm); NFT = number of fertile tillers; DMP = dry matter per plant (g); YP = grain yield per plant (g); HI = harvest index (%); Yield = grain yield per hectare (q); DM = dry matter per hectare (q); NSP = number of spikelets per panicle; TKW = thousand-seed weight (g); SW = stem weight (g); RW = root weight (g).
Agriculture 13 01486 g002
Figure 3. Biplot between the two first components (IPCA1 and IPCA2) of the genotype × environment interaction (GEI) for the grain yield of the 12 Avena magna domestica ssp. lines. Explanations: Bolds represent the locations Al_21: Alnif_21; Ai_21: Ain Itto_21; Bo_19: Bouchane_19; Bo_20: Bouchane_20; Bo_21: Bouchane_21; El_19: El Kbab_19; Ou_21: Oukaimeden_21.
Agriculture 13 01486 g003
Figure 4. Average grain yield (Yield) and evolution of the AMMI stability values (ASV) of the 12 oat lines. The box ATC represents the control variety used in this investigation.
Agriculture 13 01486 g004
Table 1. List of A. magna ssp. domestica lines used in this study.
IAV_ID CorrespondLINE_ID PEDIGREE
ATC (Avery)A40BAM_96-5-6BAM_96-5-6
AT1A18a2013Y1193BAM_34/55_1
AT2A142013Y1397BAM_6/235_44
AT3A272013Y1291BAM_55/231_22
AT4A352013Y1302BAM_55/231_33
AT5A442013Y1307BAM_55/231_38
AT6A452013Y1200BAM_34/55_36
AT7A022013Y1297BAM_55/231_28
AT9A202013Y1275BAM_55/231_6
AT13A412013Y1508BAM_34/235_21
AT14A432013Y1310BAM_55/231_41
AT15A102013Y1373BAM_6/235_20
Explanation: IAV_ID: Institut Agronomique et Vétérinaire Hassan II Identifier. ATC: Avena magna spp. domestica variety ‘Avery’.
Table 2. Location and description of the experiment agro-climatic sites. Climate data were provided by worldweatheronline.com. Only data covering the periods of the experiments (between October and July) are reported.
LocationZoneGeographic PositionAltSoil TypeTempRainHum S.HHarvest Date
LatitudeLongitude MinMax
Ain Itto_21Saïss Plain34°05′33″ N5°48′54″ W855Vertisols836609.861.830992 June 2021
Alnif_21Oasis31°06′37″ N5°03′50″ W1320Fluvisols94343.2 *26.2352917 May 2021
Bouchane_21Phosphate Plateau32°14’35″ N8°19’45″ W830Cambisols938250.254.1330425 May 2021
Oukaimeden_21Atlas Mounain31°14′07″ N7°48′42″ W2530Fluvisols 1140319.347.0336925 June 2021
Bouchane_20Phosphate Plateau32°14’35″ N8°19’45″ W830Cambisols940105.553.7337622 June 2020
El kbab_19Middle Atlas32°42’25″ N5°31’57″ W1540Fluvisols235573.050.934773 July 2019
Bouchane_19Phosphate Plateau 32°14’35″ N8°19’45″ W830Cambisols933313.153.4346320 June 2019
With additional 200 m3 of irrigation during the cycle development of plants. * By simplifying the number added on each location, the cropping season is specified, and each number is used for the rest of the article: 21 (season 2020–2021), 20 (season 2019–2020), and 19 (season 2018–2019). Alt: altitude (m); Temp: temperature (°C); Rain: rainfall (mm); Hum: humidity (%); S.H: sun hour (h).
Table 3. Summary one-way ANOVA for BYDV and RC infestations.
SiteSeasonTraitFMean (%)p_Value
Bouchane_192018–2019BYDV2.109 NS6.110.061
RC6.811 ***20.280.000
El Kbab_192018–2019BYDV0.731 NS4.090.699
Bouchane_212020–2021BYDV7.928 ***14.250.000
Ain Itto_212020–2021BYDV5.437 ***14.620.000
Oukaimeden_21 2020–2021BYDV5.377 ***9.380.000
NS = not significant; *** significant at p = 0.001. BYDV: barley yellow dwarf virus; RC: Crown rust.
Table 4. Disease rankings of the 12 lines using the Student–Newman–Keuls test.
BYDV (%)RC (%)
Bouchane_21Ain Itto_21Oukaimeden_21Bouchane_19
AT69.00aAT38.33aAT65.00aATC10.00a
AT410.00abAT610.00abAT137.50bAT613.33ab
AT1311.00abAT1411.67abcAT18.75bAT213.33ab
AT512.00abAT113.33abcdAT58.75bAT513.33ab
ATC12.00abATC13.33abcdAT1410.00bcAT116.67ab
AT312.50abAT214.17abcdAT1510.00bcAT316.67ab
AT1513.50abAT915.83bcdAT210.00bcAT416.67ab
AT1416.00bcAT1516.25cdAT310.00bcAT1423.33ab
AT216.00bcAT717.08cdAT710.00bcAT1523.33ab
AT119.00cAT1317.50cdAT910.00bcAT1326.67bc
AT919.00cAT418.33dATC10.00bcAT730.00c
AT721.00cAT519.58dAT412.5cAT940.00d
Values within a column followed by a common (a–d) are not significantly different (p < 0.05). BYDV: barley yellow dwarf virus; RC: crown rust.
Table 5. Descriptive statistics of the agro-morphological traits of domesticated A. magna for the three cropping seasons.
Season 2018–2019Season 2019–2020Season 2020–2021
El Kbab_19Bouchane_19Bouchane_20Ain_Itto_21Alnif_21Bouchane_21Oukaimeden_21
TraitsMeanCVMeanCVMeanCVMeanCVMeanCVMeanCVMeanCV
PH72.8613.9248.9321.1887.9114.70118.4715.65116.8911.4464.6114.08120.479.97
RL15.4119.8416.1622.2815.6621.8314.1920.0512.5819.6914.4222.611.8714.10
NFT4.3569.813.1034.254.8044.984.4243.2411.0932.093.5951.995.6036.07
DMP15.3656.659.8774.849.3588.1912.5441.1635.5140.924.0858.7413.5948.41
YP9.6959.65.6386.163.1865.594.7452.7116.151.141.8369.375.9251.28
HI25.7479.5620.4386.3827.2327.3327.1222.5330.6823.6731.3324.1430.3717.32
Yield51.9677.7923.1985.7611.8562.7920.1755.7785.555.786.8987.6418.9960.83
DM78.3367.1942.7682.9434.4180.9853.546.01188.1545.7715.3481.7243.8559.30
NSP53.8958.8129.7476.4516.1738.4025.352.1543.4334.2314.2453.2124.8332.50
TKW45.7311.8437.6655.5840.617.5843.946.8242.766.9834.2945.1140.047.95
SW13.7456.78.5577.51NANA10.8641.6426.6341.72.8360.0111.6146.57
RW1.6272.661.3374.59NANA1.6848.658.8851.831.2563.91.9866.73
Explanations: CV: coefficient of variation; PH = plant height (cm); RL = root length (cm); NFT = number of fertile tillers; DMP = dry matter per plant (g); YP = grain yield per plant (g); HI = harvest index (%); Yield = grain yield per hectare (q); DM = dry matter per hectare (q); NSP = number of spikelets per panicle; TKW = thousand-seed weight (g); SW = stem weight (g); RW = root weight (g); NA: not available.
Table 6. Ranking of the 12 lines for grain yield per hectare at each site where it was significant across the three cropping seasons.
Season 2018–2019Season 2019–2020Season 2020–2021
Bouchane_19El Kbab_19Bouchane_20Ain_Itto_21Alnif_21Bouchane_21Oukaimeden_21
AT539.45aAT5103.17aAT1422.13aAT331.64aATC114.9aAT412.26aAT934.83a
AT928.86abATC73.8bAT315.41bAT1527bAT1103.7abAT711.84aAT527.11ab
AT227.21abAT168.52bcAT1515bcAT1322.29bcAT797.1abcAT19.28abAT724.67bc
AT325.09abAT362.7bcAT1314.14bcAT622.1bcAT1493.5abcAT59.13abAT1419bc
AT1324.85abAT659.01bcAT113.4bcAT121.69bcAT490.7abcAT28.88abAT418.96bc
AT724.17abAT258.09bcAT411.23bcAT1421.14bcAT1590.3abcAT36.9abcAT1318.48bc
AT123.99abAT744.8bcdAT910.82bcAT920.49bcAT688.2abcAT65.19bcAT1517.24bc
ATC23.19abAT1338.34bcdAT59.99bcATC16.82cdAT1387.7abcAT94.75bcAT215.47bc
AT419.3abAT436.12bcdAT79.99bcAT716.54cdAT586abcAT144.59bcAT614.24c
AT1415.24bAT1430.76cdAT69.19bcAT516.46cdAT361.6bcAT134.2bcAT313.59c
AT615.15bAT1513.47dAT27.4bcAT415.93cdAT258.7bcATC2.83cAT112.6c
AT159.08bAT910.35dATC6.67cAT29.99dAT953.7cAT152.81cATC11.64c
Values within a column followed by a common (a–d) are not significantly different (p < 0.05).
Table 7. Ranking of 12 lines for principal agro-morphological traits with ATC (Avery) as control.
Agronomic TraitsMorphological Traits
Yield DMHITKWPHRLNTFNSP
AT543.41 aAT180.05 aAT534.76 aAT549.73 aAT1594.92 aAT1515.61 aAT15.93 a AT736.06 a
AT135.93 abAT569.24 abAT431.78 bAT442.94 abAT1394.57 aAT1315.27 abAT145.69 abAT1334.34 ab
ATC35.66 abATC67.33 abcAT331.33 bAT941.93 abcAT792.71 abAT1415.23 abAT95.64 abAT1433.13 ab
AT331.74 bcAT1366.75 abcATC31.20 bAT141.62 abcAT589.93 bcAT714.96 abcAT45.6 abAT531.56 abc
AT731.64 bcAT665.85 abcAT630.35 bAT741.27 abcAT489.76 bcAT414.83 abcdAT65.51 abAT1530.48 abc
AT630.15 bcAT363.36 abcAT229.67 bAT640.99 abcAT988.94 bcdAT114.31 bcdAT55.17 abcATC30.47 abc
AT1329.78 bcAT462.83 abcAT129.47 bAT240.29 bcAT188.58 bcdAT614.13 bcdATC4.98 bcAT330.39 abc
AT1428.75 bcAT1461.77 bcAT722.57 cAT1440.19 bcAT388.56 bcdAT314.11 bcdAT24.94 bcAT128.77 abc
AT428.07 bcAT261.28 bcAT922.17 cAT1539.60 bcAT1488.07 cdAT913.85 cdAT134.86 bcAT428.50 abc
AT227.32 bcAT758.33 bcAT1420.33 cAT1338.72 bcATC85.06 deAT213.81 cdAT34.58 cdAT628.04 bc
AT1523.90 cAT1552.64 bcAT1520.28 cATC37.97 bcAT684.64 deATC13.65 dAT74.45 cdAT925.23 c
AT923.11 cAT949.99 cAT1319.88 c AT332.83 cAT284.07 eAT513.52 dAT154.03 dAT224.85 c
Values within a column followed by a common (a–e) are not significantly different (p < 0.05). Yield = grain yield per hectare (q); DM = dry matter per hectare (q); HI = harvest index (%); TKW = thousand-seed weight (g); PH = plant height (cm); RL = root length (cm); NFT = number of fertile tillers; NSP = number of spikelets per panicle.
Table 8. Pearson correlation with traits from principal component analysis results.
PHRLNFTNSPRWSWDMPYPYieldDMHITKWRCBYDV
PH1
RL0.721
NFT−0.48−0.311
NSP0.600.54−0.381
RW0.220.410.030.631
SW0.270.320.620.100.151
DMP0.360.550.510.390.490.821
YP0.430.340.360.630.650.670.811
Yield−0.15−0.470.130.32−0.070.00−0.060.301
DM−0.26−0.260.420.12−0.270.290.250.190.751
HI−0.59−0.740.25−0.36−0.50−0.11−0.41−0.240.630.531
TKW0.06−0.210.36−0.040.100.280.100.350.400.140.231
RC0.540.38−0.050.140.360.240.310.31−0.56−0.63−0.78−0.011
BYDV0.520.24−0.100.230.130.170.100.30−0.09−0.29−0.450.440.621
Bolded values are significant Pearson correlation. PH = plant height (cm); RL = root length (cm); NFT = number of fertile tillers; NSP = number of spikelets per panicle; RW = root weight (g); SW = stem weight (g); DMP = dry matter per plant (g); YP = grain yield per plant (g); Yield = grain yield per hectare (q); DM = dry matter per hectare (q); HI = harvest index (%); TKW = thousand-seed weight (g); RC: crown rust (%); BYDV: barley yellow dwarf virus (%).
Table 9. Additive main effects and multiplicative interaction analysis (AMMI) analysis of variance for grain yield of 12 lines for three cropping seasons.
SourceDfSum SqMean SqF ValuePr (>F)% Variation
Site6596,99699,49912.32 ***6.92 × 10−578
Line1127,74025226.04 ***1.40 × 10−94
S × L66136,79320734.96 ***2.20 × 10−1618
IPCA11619,821.101238.822.97 ***0.000159.7
IPCA21410,539.33752.811.80 *0.034431.7
Residuals897374,620418
* significant at p = 0.05; *** significant at p = 0.001.
Disclaimer/Publisher’s Note: The statements, opinions and data contained in all publications are solely those of the individual author(s) and contributor(s) and not of MDPI and/or the editor(s). MDPI and/or the editor(s) disclaim responsibility for any injury to people or property resulting from any ideas, methods, instructions or products referred to in the content.

