Article

Response of Strawberry Fruit Yield, Soil Chemical and Microbial Properties to Anaerobic Soil Disinfestation with Biochar and Rice Bran

1
Institute of Plant Protection, Chinese Academy of Agricultural Sciences, Beijing 100193, China
2
Hebei Technology Innovation Center for Green Management of Soil-Borne Diseases, Baoding University, Baoding 071000, China
3
Beijing Innovation Consortium of Agriculture Research System, Beijing 100193, China
4
Key Laboratory of Plant Nutrition and Fertilizer, Ministry of Agriculture, Institute of Agricultural Resources and Regional Planning, Chinese Academy of Agricultural Sciences, Beijing 100081, China
*
Authors to whom correspondence should be addressed.
Agriculture 2023, 13(7), 1466; https://doi.org/10.3390/agriculture13071466
Submission received: 13 June 2023 / Revised: 13 July 2023 / Accepted: 21 July 2023 / Published: 24 July 2023
(This article belongs to the Special Issue Integrated Management of Soil-Borne Diseases)

Abstract

:
Organic materials added to soil create anaerobic conditions that can reduce soil-borne pathogens that reduce the yield and quality of agricultural crops. Anaerobic soil disinfestation (ASD) requires relatively large quantities of readily available, inexpensive organic materials. We evaluated the impact of ASD with rice bran and biochar organic materials on changes to the soil’s physicochemical properties, microbial taxa, and strawberry fruit yield. We found that the organic materials applied at different dose rates significantly increased the control effect of the soil Fusarium spp. and Phytophthora spp. to 69–99% and 63–98%, respectively. In addition, ASD significantly increased soil organic matter and ammonium nitrogen contents. Strawberry yield also increased significantly after ASD treatment with biochar applied at 10 t/ha, which was positively correlated with increased soil nutrients and a significant reduction in pathogens. High-throughput gene sequencing showed that ASD significantly increased the abundance of some beneficial microorganisms such as Bacillus, Pseudomonas, and Mortierella, possibly due to changes in the soil’s physicochemical properties that favored their survival. We found for the first time that biochar applied at 10 t/ha could create anaerobic conditions that effectively reduced soil-borne pathogens and increased crop yield.

1. Introduction

Strawberry (Fragaria × ananassa Duch.) is an economical crop globally because of the fruit’s pleasant aroma, bright color, and high nutritional value [1]. Strawberries are most often re-planted in the same soil, which reduces their suitability for continuous production [2]. In addition, monocropping is easy to cause an accumulation of soil-borne pathogens that increase plant disease, which reduces fruit yield and quality [3]. For example, Fusarium oxysporum and Rhizoctonia solani in soil can cause strawberry root rot, which can seriously reduce the yield and quality of strawberries, and even lead to a zero harvest [4]. Verticillium dahliae spp. and Fusarium spp. can cause strawberry verticillium wilt, resulting in stunted growth and even the death of strawberry plants [5]. In order to promote the sustainable production of strawberries, it is necessary to find suitable methods to control soil pathogens.
Soil disinfestation before crop planting is often used to control soil-borne pathogens in crops that are produced on a large scale [6]. The chemical fumigants chloropicrin, metam sodium, and dazomet are expensive to use, and their prolonged use increases the risk of environmental damage and poses a potential threat to human health [7]. Physical and biological soil disinfestation is less likely to cause harm to the soil environment, but they have not been widely used because they are expensive and have a slow and unstable effect on pests [8]. Anaerobic soil disinfestation (ASD) overcomes many of the deficiencies of many soil disinfestation methods because it has a broad spectrum of pest control, and the materials necessary for ASD are widely available, generally inexpensive, and can often be sourced locally [9].
ASD technology is also known as reductive soil disinfestation (RSD) or biological soil disinfestation (BSD) [10]. The process of ASD includes adding an organic carbon source to the soil, followed by irrigation, and covering the soil surface with plastic film for 2–15 weeks to minimize gas exchange. This series of operations will create an anaerobic soil environment that is in a strong reduction state, thus killing the pathogens and pests in the soil [11]. Previous research has reported that anaerobic conditions generated by incorporating broccoli and weed materials into the soil significantly reduced the number of Fusarium oxysporum and Verticillium dahlia pathogens [12]. Song et al. [13] generated anaerobic conditions using maltose that reduced soil pathogens and increased strawberry yield. The effect of ASD is determined mostly by the organic material used as the carbon source, the soil’s properties, the availability of water, and the size of the field [14]. Effective pest control has been achieved using rice bran and straw as organic materials, but it is still necessary to find additional organic materials for ASD.
Biochar can be obtained by the pyrolysis and carbonization of biomass in anoxic or low-temperature environments [15]. Biochar significantly improved the soil microecological environment, increased soil organic carbon content, and was conducive to soil health [16]. Biochar’s ability to adsorb gases significantly improved the efficiency of nitrogen use by plants, which promoted crop growth and yield [17]. However, little is known about biochar as a carbon source for ASD, and the ability of biochar used for ASD to change the relationship between the soil’s physicochemical properties and the microbial taxa present in the soil is unclear.
Soil microorganisms are critical in the transformation of nutrients, humus decomposition, and maintaining soil ecological functions [18]. Monocropping increases the number of pathogenic bacteria in the soil and reduces the resistance of beneficial microorganisms [19,20], which ultimately leaves the soil unusable for crops. ASD technology can change the soil microbial community structure and species diversity and reduce soil-borne diseases by rebuilding and optimizing the soil microecological environment [11].
At present, the research on rice bran used in ASD is relatively mature. In this study, rice bran was selected as the experimental control group to determine the effect of biochar used in ASD. Our study aimed to compare the effects of ASD with rice bran and biochar that had been continuously cropped for more than 20 years. The objectives of the research were to (1) study the effects of different organic materials for ASD on strawberry growth and soil-borne pathogens; (2) identify the soil physicochemical properties and microbial community variations under different organic materials and concentrations; and (3) clarify the feasibility and response mechanism of using biochar for ASD. The purpose of our study was to determine the feasibility of using biochar for anaerobic soil disinfestation, which could provide a new option for soil anaerobic disinfestation.

2. Materials and Methods

2.1. Site Description

The experiment was conducted in Changping (40°12′ N, 116°25′ E, Trial I) and Daxing (39°41′ N, 116°36′ E, Trial II) districts in Beijing in July 2017. The soil in the glasshouses had not been chemically fumigated in more than 20 years of continuous strawberry production (Table 1). Fusarium and Phytophthora spp. recorded in the soil of the Changping and Daxing glasshouses prior to any experimental treatment exceeded 4000 and 6000 cfu/g, respectively (Table S1).

2.2. Experimental Design

The experiment included six treatments: (1) CK: No rice bran or biochar added to the soil and no film applied; (2) ST: Soil covered by Totally Impermeable Film (TIF) without rice bran or biochar; (3) RB10: 10 t/ha rice bran plus TIF; (4) RB20: 20 t/ha rice bran plus TIF; (5) BC5: 5 t/ha biochar plus TIF; (6) BC10: 10 t/ha biochar plus TIF. All treatments were arranged in a randomized complete block design with three replications, and the plot size was 24 m2. TIF 0.05 mm thick was sourced from Longxing Plastic Film Technology Co., Ltd., Shandong, China. Rice bran and biochar were applied to the soil. The basic properties of both organic materials are shown in Table S2.
After the biochar and rice bran were artificially scattered on the surface of the soil, they were mixed into the soil using a rotary tiller to a depth of 5–20 cm. The soil was then irrigated with water to achieve a soil moisture content of 70%. Finally, it was covered with TIF and sealed with compacted soil on the edges of the film. After four weeks, the film was removed. Then, the oxidation–reduction potential (ORP) of each treatment was immediately measured with an ORP potentiometer produced by BELL Analytical Instruments Co., Ltd., Dalian, China, and the measured result was 190–220 mV, indicating that our ASD treatments were all under anaerobic conditions [21]. Strawberry (cv “red face”) seedlings were then planted 10–15 days later in seedbeds. Strawberry plants were planted on a seedbed 20 cm high and 50 cm wide. Each 15 cm long seedbed was planted with two rows of strawberry plants, which in total contained 120 plants. Strawberry plants were about 25 cm apart, and the spacing between the two seedbeds was 50 cm.

2.3. Soil Sampling

On the first day after removing the TIF, three locations were randomly selected in each plot of the two glasshouses, and we used a graduated earth boring auger with a scale to collect soil samples from the top surface (5–20 cm depth). Fresh soil samples were mixed as a composite sample and then sieved to pass through a 2 mm sieve. They were divided into three parts: The first part was refrigerated at 4 °C for later analysis of soil inorganic nitrogen content; the second part was air-dried and used to determine the physicochemical properties of the soil; and the third part was refrigerated at −80 °C for determination of the bacterial and fungal taxonomic composition. We collected further soil samples from each treatment 10 and 120 d after removing the TIF to determine the soil pathogens.

2.4. Detection of Soil-Borne Pathogens

According to the methods of [22,23], 5 g of fresh soil samples were shaken in sterilized distilled water, from which 1 mL of soil suspension was absorbed and added to the selective medium of Fusarium spp. and Phytophthora spp, respectively. Colonies were counted after 3 days at 28 °C The ingredients of selective media for the cultivation of Fusarium spp. and Phytophthora spp. are reported in Table S3.

2.5. Analysis of Soil Physicochemical Properties

Soil ammonium nitrogen (AN) and nitrate nitrogen (NN) were extracted by 2 M KCl, and soil available phosphorus (AP) was extracted by 0.5 M NaHCO3, then oscillated and filtered, and the filtrate was quantified by a UV-2600 Spectrophotometer (Shimadzu, Kyoto, Japan). Available potassium (AK) was extracted with 1 M CH3COONH4, then oscillated and filtered, and the filtrate was determined by an AP1302 flame spectrophotometer (Shanghai Instruments Group Co., Ltd., Shanghai, China). Soil organic matter (OM) was determined by the dichromate digestion method using K2Cr2O7 at 170–180 °C. Soil pH (soil/water = 1:2.5) and electrical conductivity (EC) were quantified using a Starter 3C pH meter (Ohaus Instrument Co. Ltd., Parsippany, NJ, USA) and a Five Easy Plus EC meter (Mettler Toledo Co., Shanghai, China), respectively.

2.6. Strawberry Plant Growth and Yield

At harvest, forty strawberry plants were randomly selected in each treatment plot, and plant height and stem diameter were measured with a tape measure and a digital display electronic vernier caliper, respectively. When measuring the plant height, the plant was held upright by hand, and a tape measure was used to measure the height of the unearthed part to the longest leaf. The stem thickness was measured from the stem closest to the root soil. And two rows of strawberries were randomly selected to assess strawberry plant mortality. The date and total weight of mature strawberries collected at each harvest were recorded. The strawberry yield from each treatment was calculated at the end of the production period.

2.7. High-Throughput Gene Sequencing

The soil sample (0.25 g) was used to extract total DNA following the instructions of the MoBio Power Extraction kit (MoBio, Carlsbad, CA, USA). Each treatment was repeated three times. DNA quality and concentration were analyzed using a Nanodrop spectrophotometer (ND-1000, Thermo Scientific, USA). The V4-V5 region of the bacterial 16 S rRNA gene was amplified using the primer sets 338F (5′-ACTCCTACGGGAGCAGCAG-3′)-806R (5′-GGACTACHGGGTWTCTAAT-3´), and fungal ITS genes were amplified using the primer sets ITS1F (5′-CTTGGTCATTTAGGAAGTAA-3′)-ITS2R(5′-GCTGCGTTCTTCATCATGATGC-3′). The MiSeq PE300 platform was used for high-throughput sequencing at Majorbio Biopharm Technology Co. Ltd. (Shanghai, China).
The soil microflora DNA data sequences were analyzed using FLASH (version 1.2.7) and Fastp (version 0.20.0) software for stitching and quality control, respectively. All samples were extracted according to the minimum number of sample sequences required. Under the condition of a confidence threshold of 0.7 and using the Ribosomal Database Project (RDP) classification tool, the bacterial 16S rRNA and fungal ITS gene sequences were compared with the Silva bacterial and Unite fungal databases, respectively.

2.8. Statistical Analysis

When calculating the Alpha diversity of the soil microbial community, the Shannon index represents diversity and the Chao index represents richness. Qiime (V.1.9.1) software was used to calculate principal coordinate analysis (PCoA) and non-metric multidimensional scaling analysis (NMDS), and the similarity or difference of soil bacterial and fungal community composition was studied based on the Bray–Curtis algorithm. Linear discriminant analysis effect size (LEfSe) was used to detect species with significant differences in relative abundance between treatments (LDA score = 2.0), and they were plotted with R (3.3.1) software. R (V.4.2.2) software heat map and statistical correlation were used. We analyzed the sequencing data on the cloud platform (https://cloud.majorbio.com/page/project/overview.html, accessed on 6 September 2022) provided by Majorbio Biopharm Technology Co. Ltd. (Shanghai, China).
SPSS 20.0 statistical software was used to conduct a one-way analysis of variance (ANOVA) with Duncan’s range test on the soil physicochemical properties, strawberry growth and yield, and abundance of soil pathogens (p < 0.05).
The formulae for calculating the effects of different treatments on the number of Fusarium or Phytophthora species were Y = (X1 − X2)/X1 × 100%, where X1 represents the number of pathogens in the control soil and X2 represents the number of pathogens in the treated soil. The mortality of strawberry plants was calculated by X = N1/(N1 + N2) × 100%, where N1 is the number of dead strawberry plants per treatment and N2 is the number of surviving strawberry plants per treatment.

3. Results

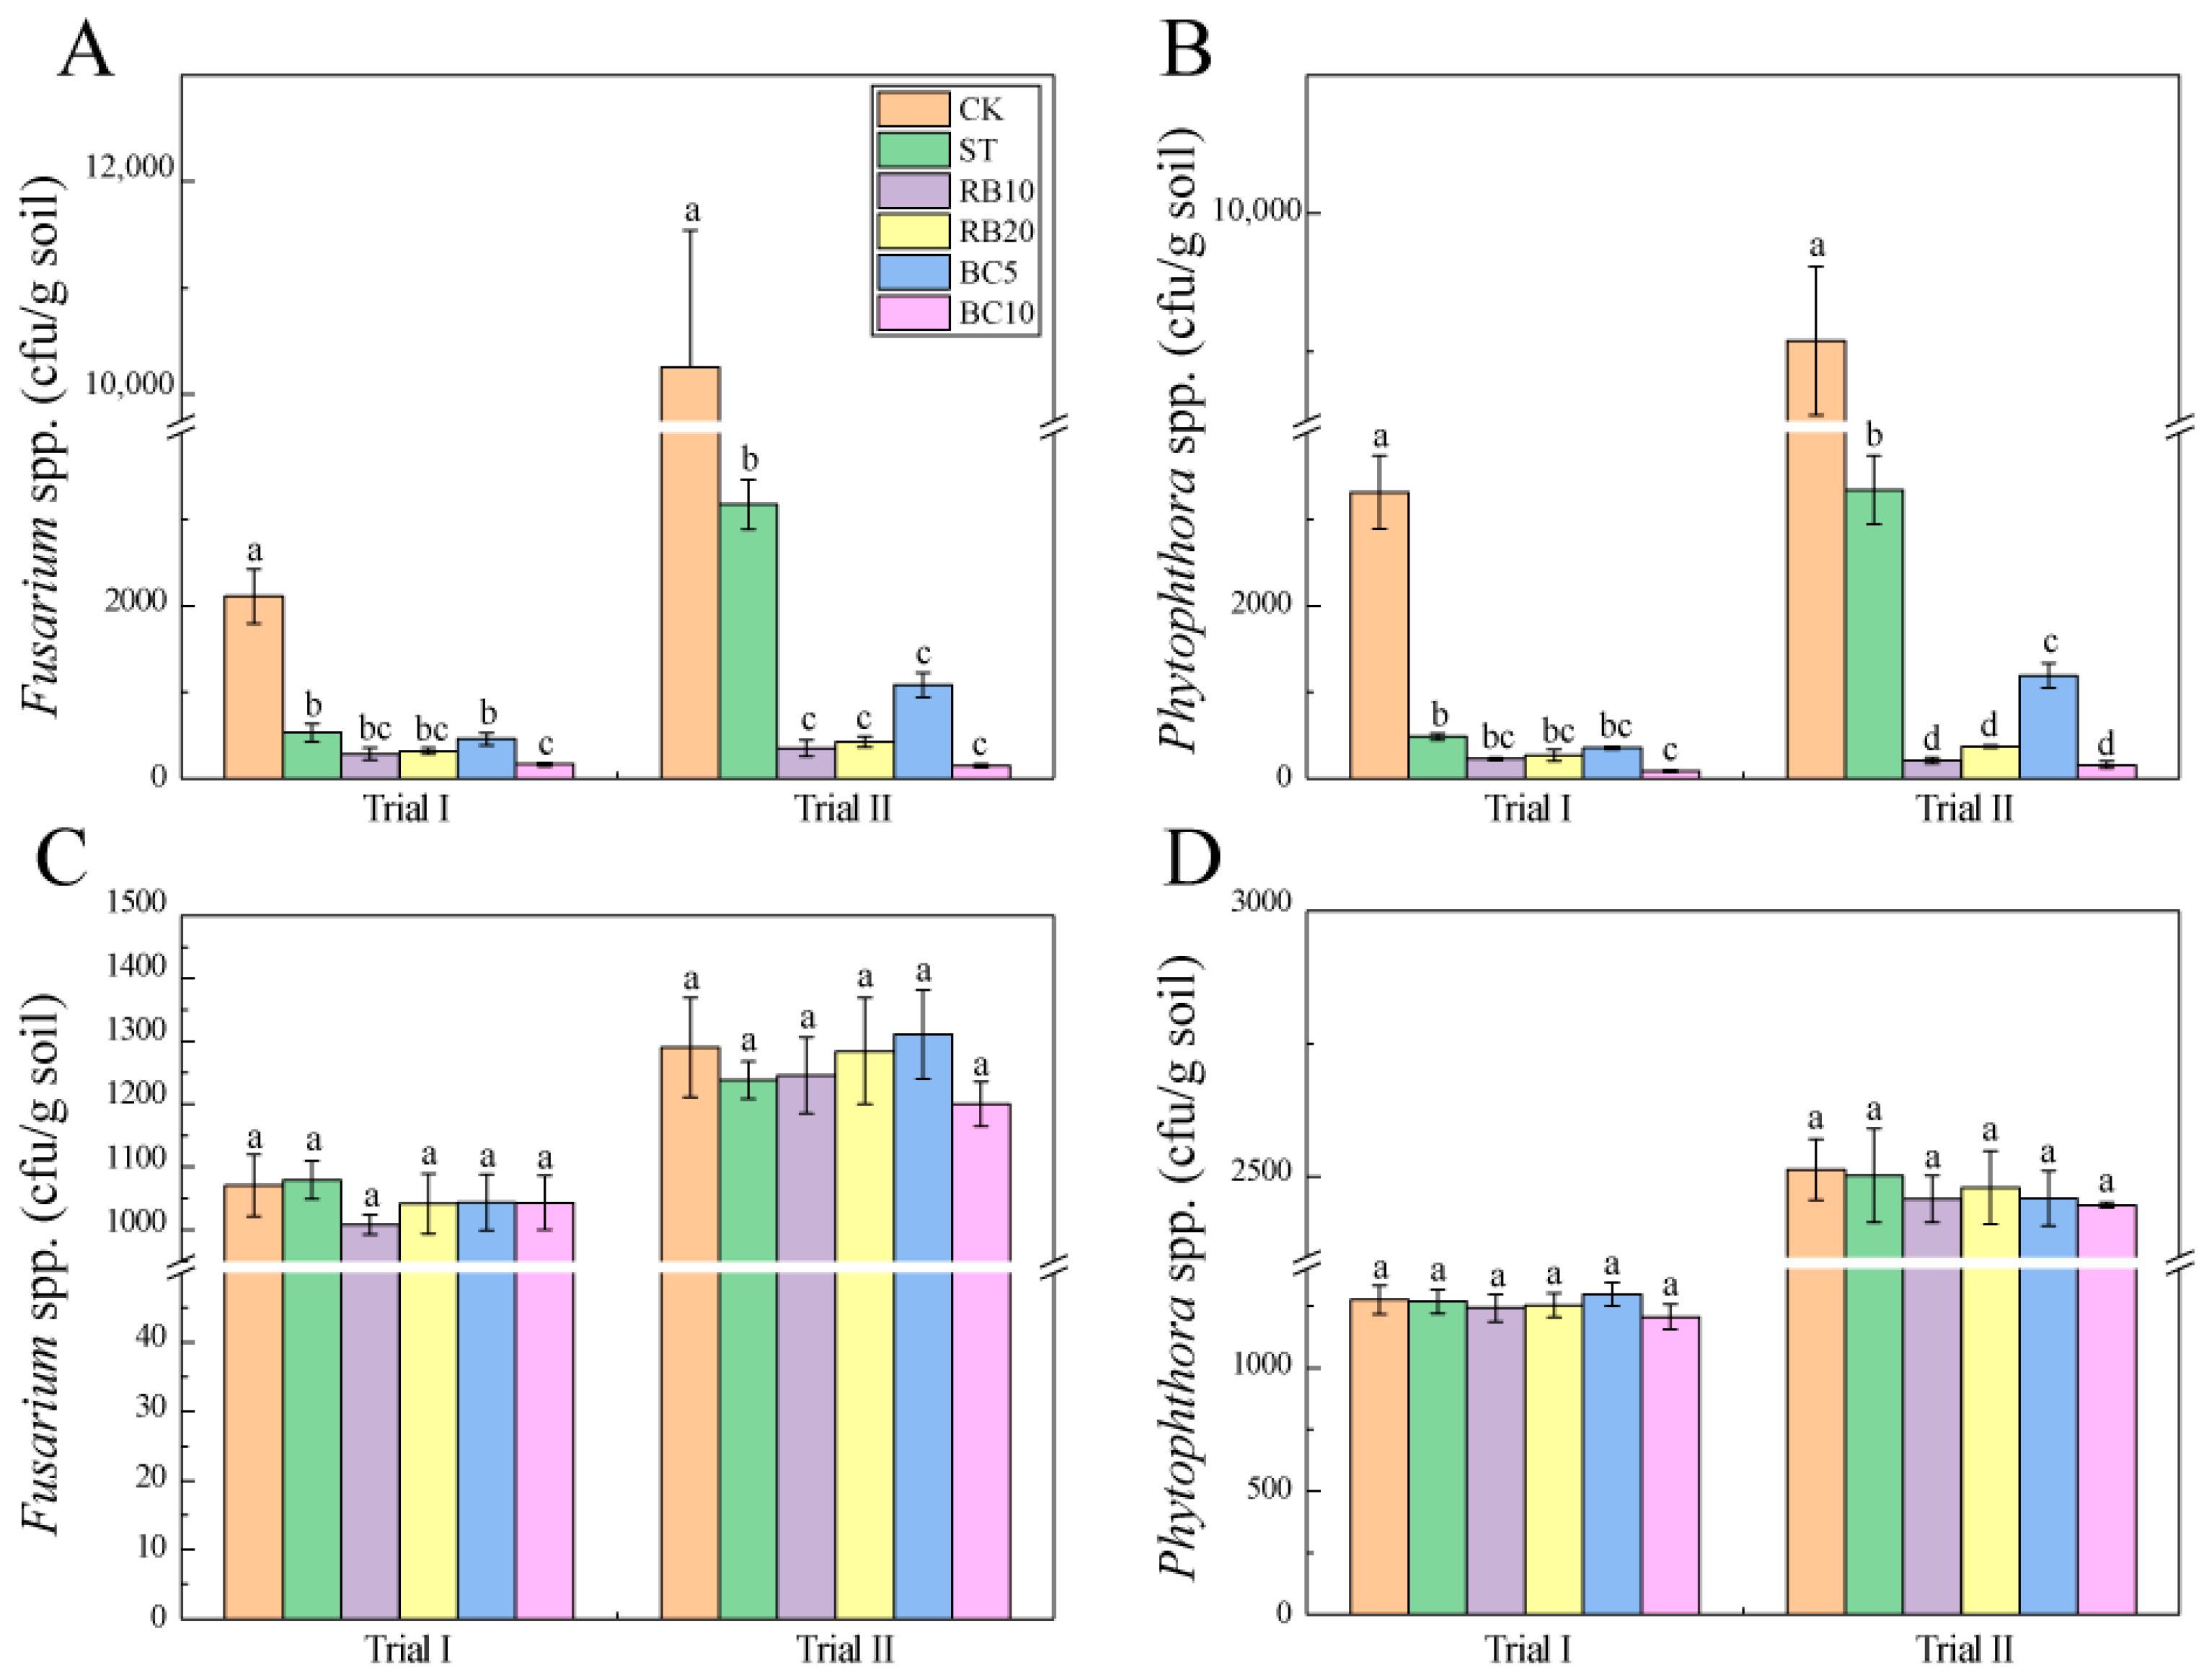
3.1. Soil Pathogens Control

Populations of Fusarium and Phytophthora species were significantly reduced 10 d after the application of ASD (Figure 1A,B). Fusarium and Phytophthora species mortality in response to the treatments was 74.8–92.2% and 85.4–97.4% in Trial I, respectively, and 69.1–98.6% and 63.2–98.3% in Trial II, respectively (Table S4). In Trial I, BC10 significantly increased the mortality of Fusarium and Phytophthora species compared with ST. In Trial II, both RB and BC significantly increased the mortality of Fusarium and Phytophthora species compared with ST. BC10 caused the highest mortality of Fusarium and Phytophthora species in Trials I and II. However, there was no significant difference in the number of Fusarium and Phytophthora species after 120 d of ASD treatments (Figure 1C,D), indicating that ASD treatments were only effective shortly after they started (Table S5).

3.2. Physicochemical Properties of Soil

Compared to CK, the contents of ammonium nitrogen in ST, RB, and BC treatments were significantly increased by 76.0–216.0%, and the contents of nitrate nitrogen content were significantly decreased by 41.5–69.4% (Table 2). ASD treatments significantly decreased the available phosphorus content by 15.2–29.1% (except RB20) and decreased the available potassium content by 13.6–37.0% (except RB10). Furthermore, ASD treatments significantly increased the organic matter content (13.9–35.6%), among which BC10 was the highest. Compared to CK, ST, BC, and RB treatments significantly increased soil pH by 9.3–18.2% and electrical conductivity by 161.4–486.8%. Compared with ST, ASD treatment significantly increased the content of the soil ammonium nitrogen and organic matter, indicating that RB and BC can improve soil fertility in an anaerobic environment.

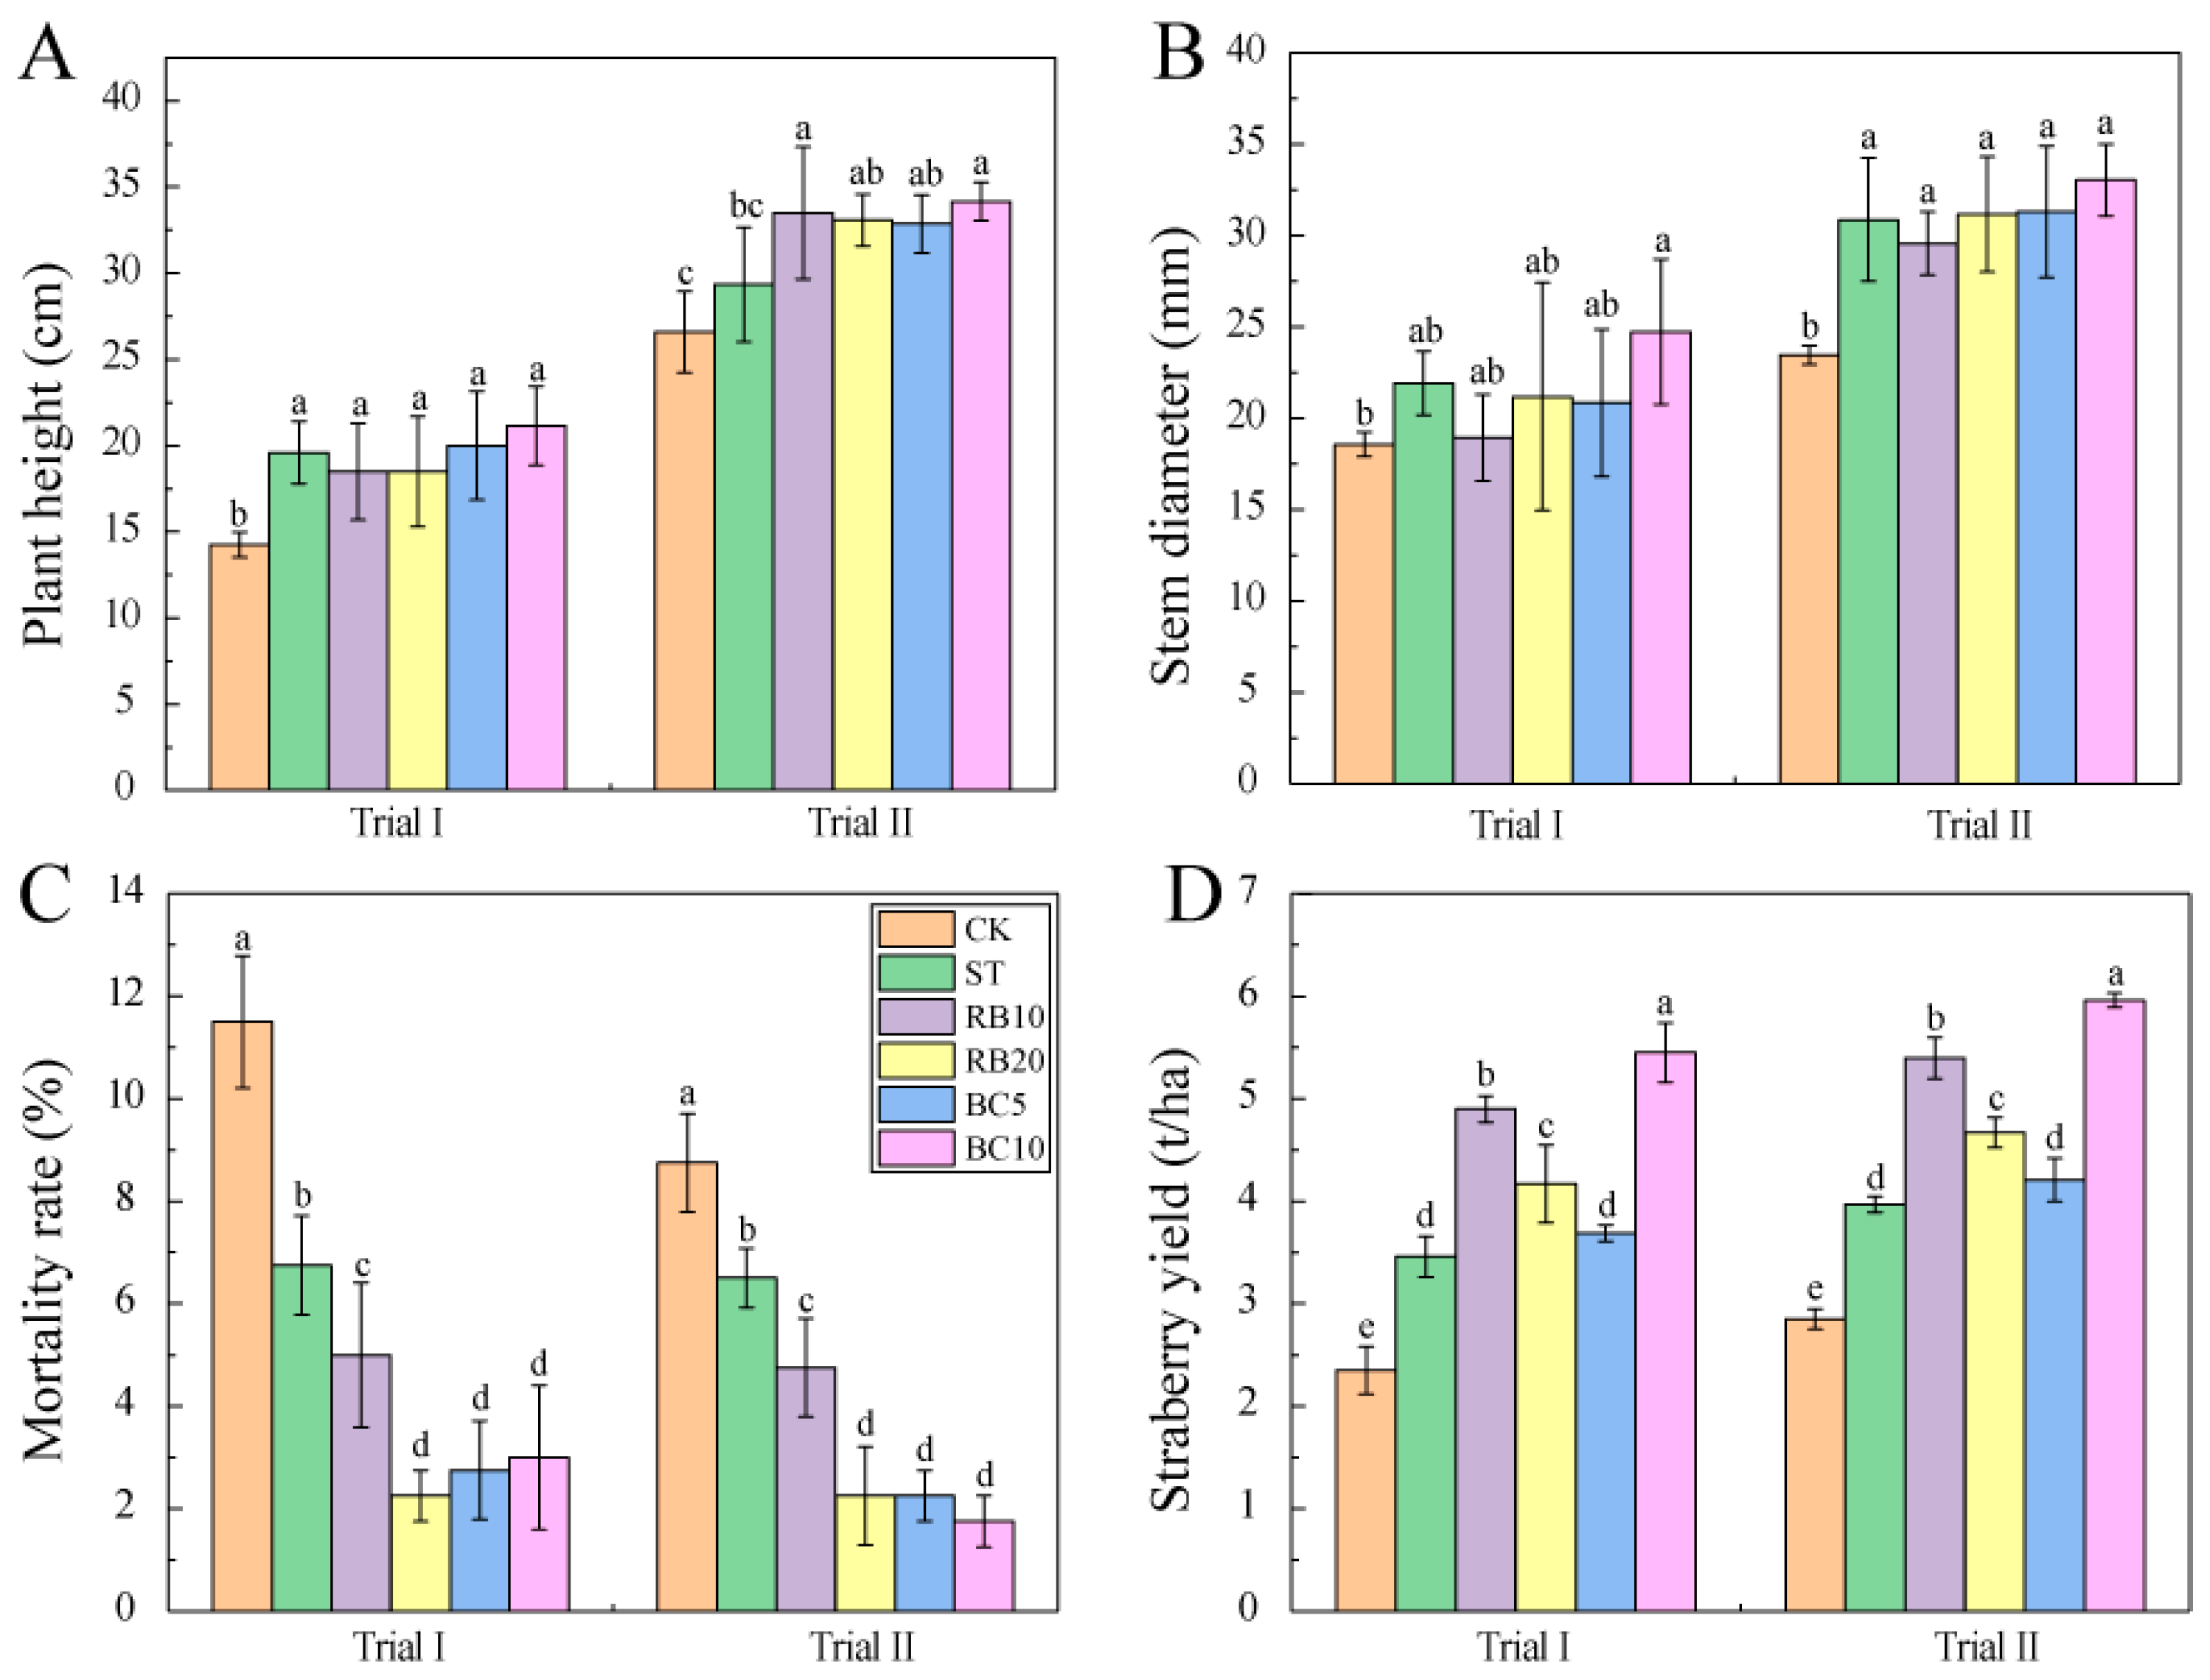
3.3. Strawberry Growth and Yield

The strawberry plant heights in Trials I and II were significantly increased by all treatments (except ST in Trial II) (Figure 2A). The stem diameter of strawberry plants was significantly increased by all treatments in Trial II, and there was no significant difference between the treatments (Figure 2B), but in Trial I, only BC10 significantly increased the stem diameter of strawberry plants. Strawberry plant mortality was significantly reduced in both Trials (Trial I by 41.3–80.4%; Trial II by 25.7–80.0%) (Figure 2C). Compared with ST, each treatment further reduced the mortality of strawberry plants (Table S6), which indicated that in anaerobic conditions, RB and BC improved the survival of plants. Strawberry fruit yield was significantly increased in both Trials (Trial I by 47.2–131.9%; Trial II by 39.3–109.1%) (Figure 2D). In Trials I and II, the strawberry yield from high to low was as follows: BC10 > RB10 > RB20 > BC5 > ST > CK.

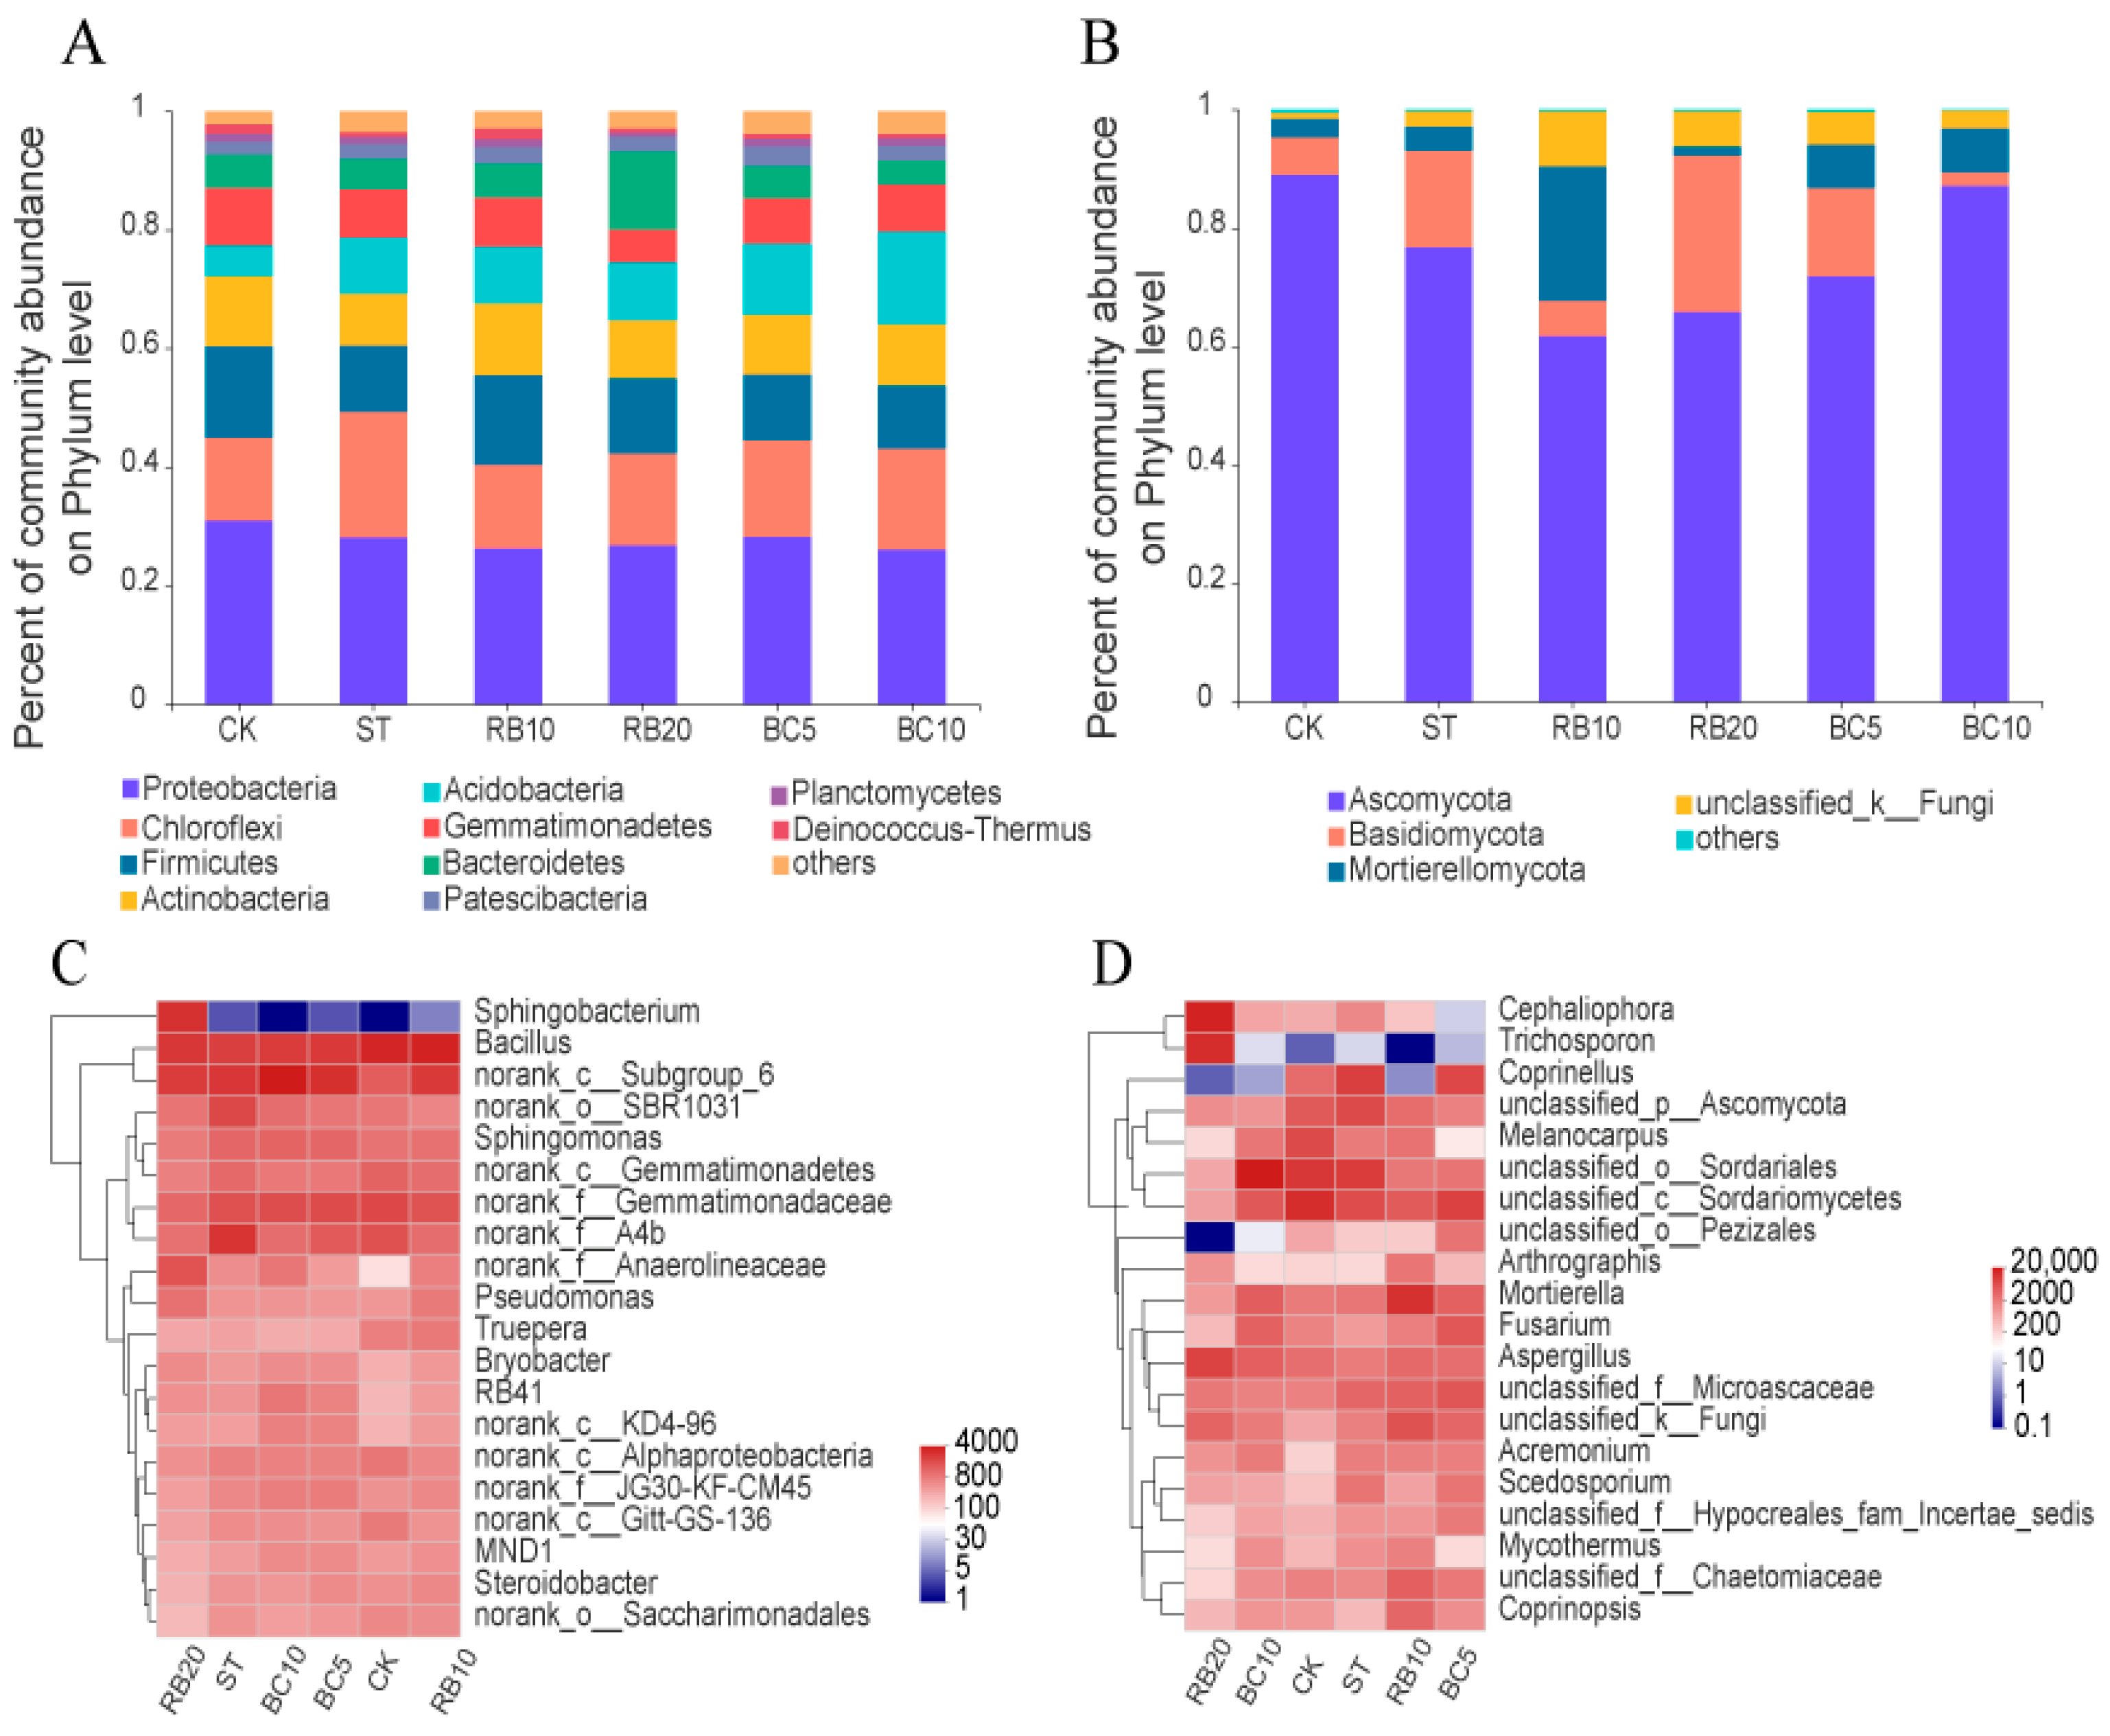
3.4. Changes to the Taxonomic Composition of Soil Microbial Communities

3.4.1. Base Pair Length and Rarefaction Curves

We obtained 2,886,380 bacterial high-quality gene sequences and 3,822,555 fungal high-quality gene sequences from a total of 18 soil samples. The average sequence lengths of bacterial and fungal DNA were 418 and 249, respectively. We obtained 9249 OTUs of bacteria and 1697 OTUs of fungi in total.

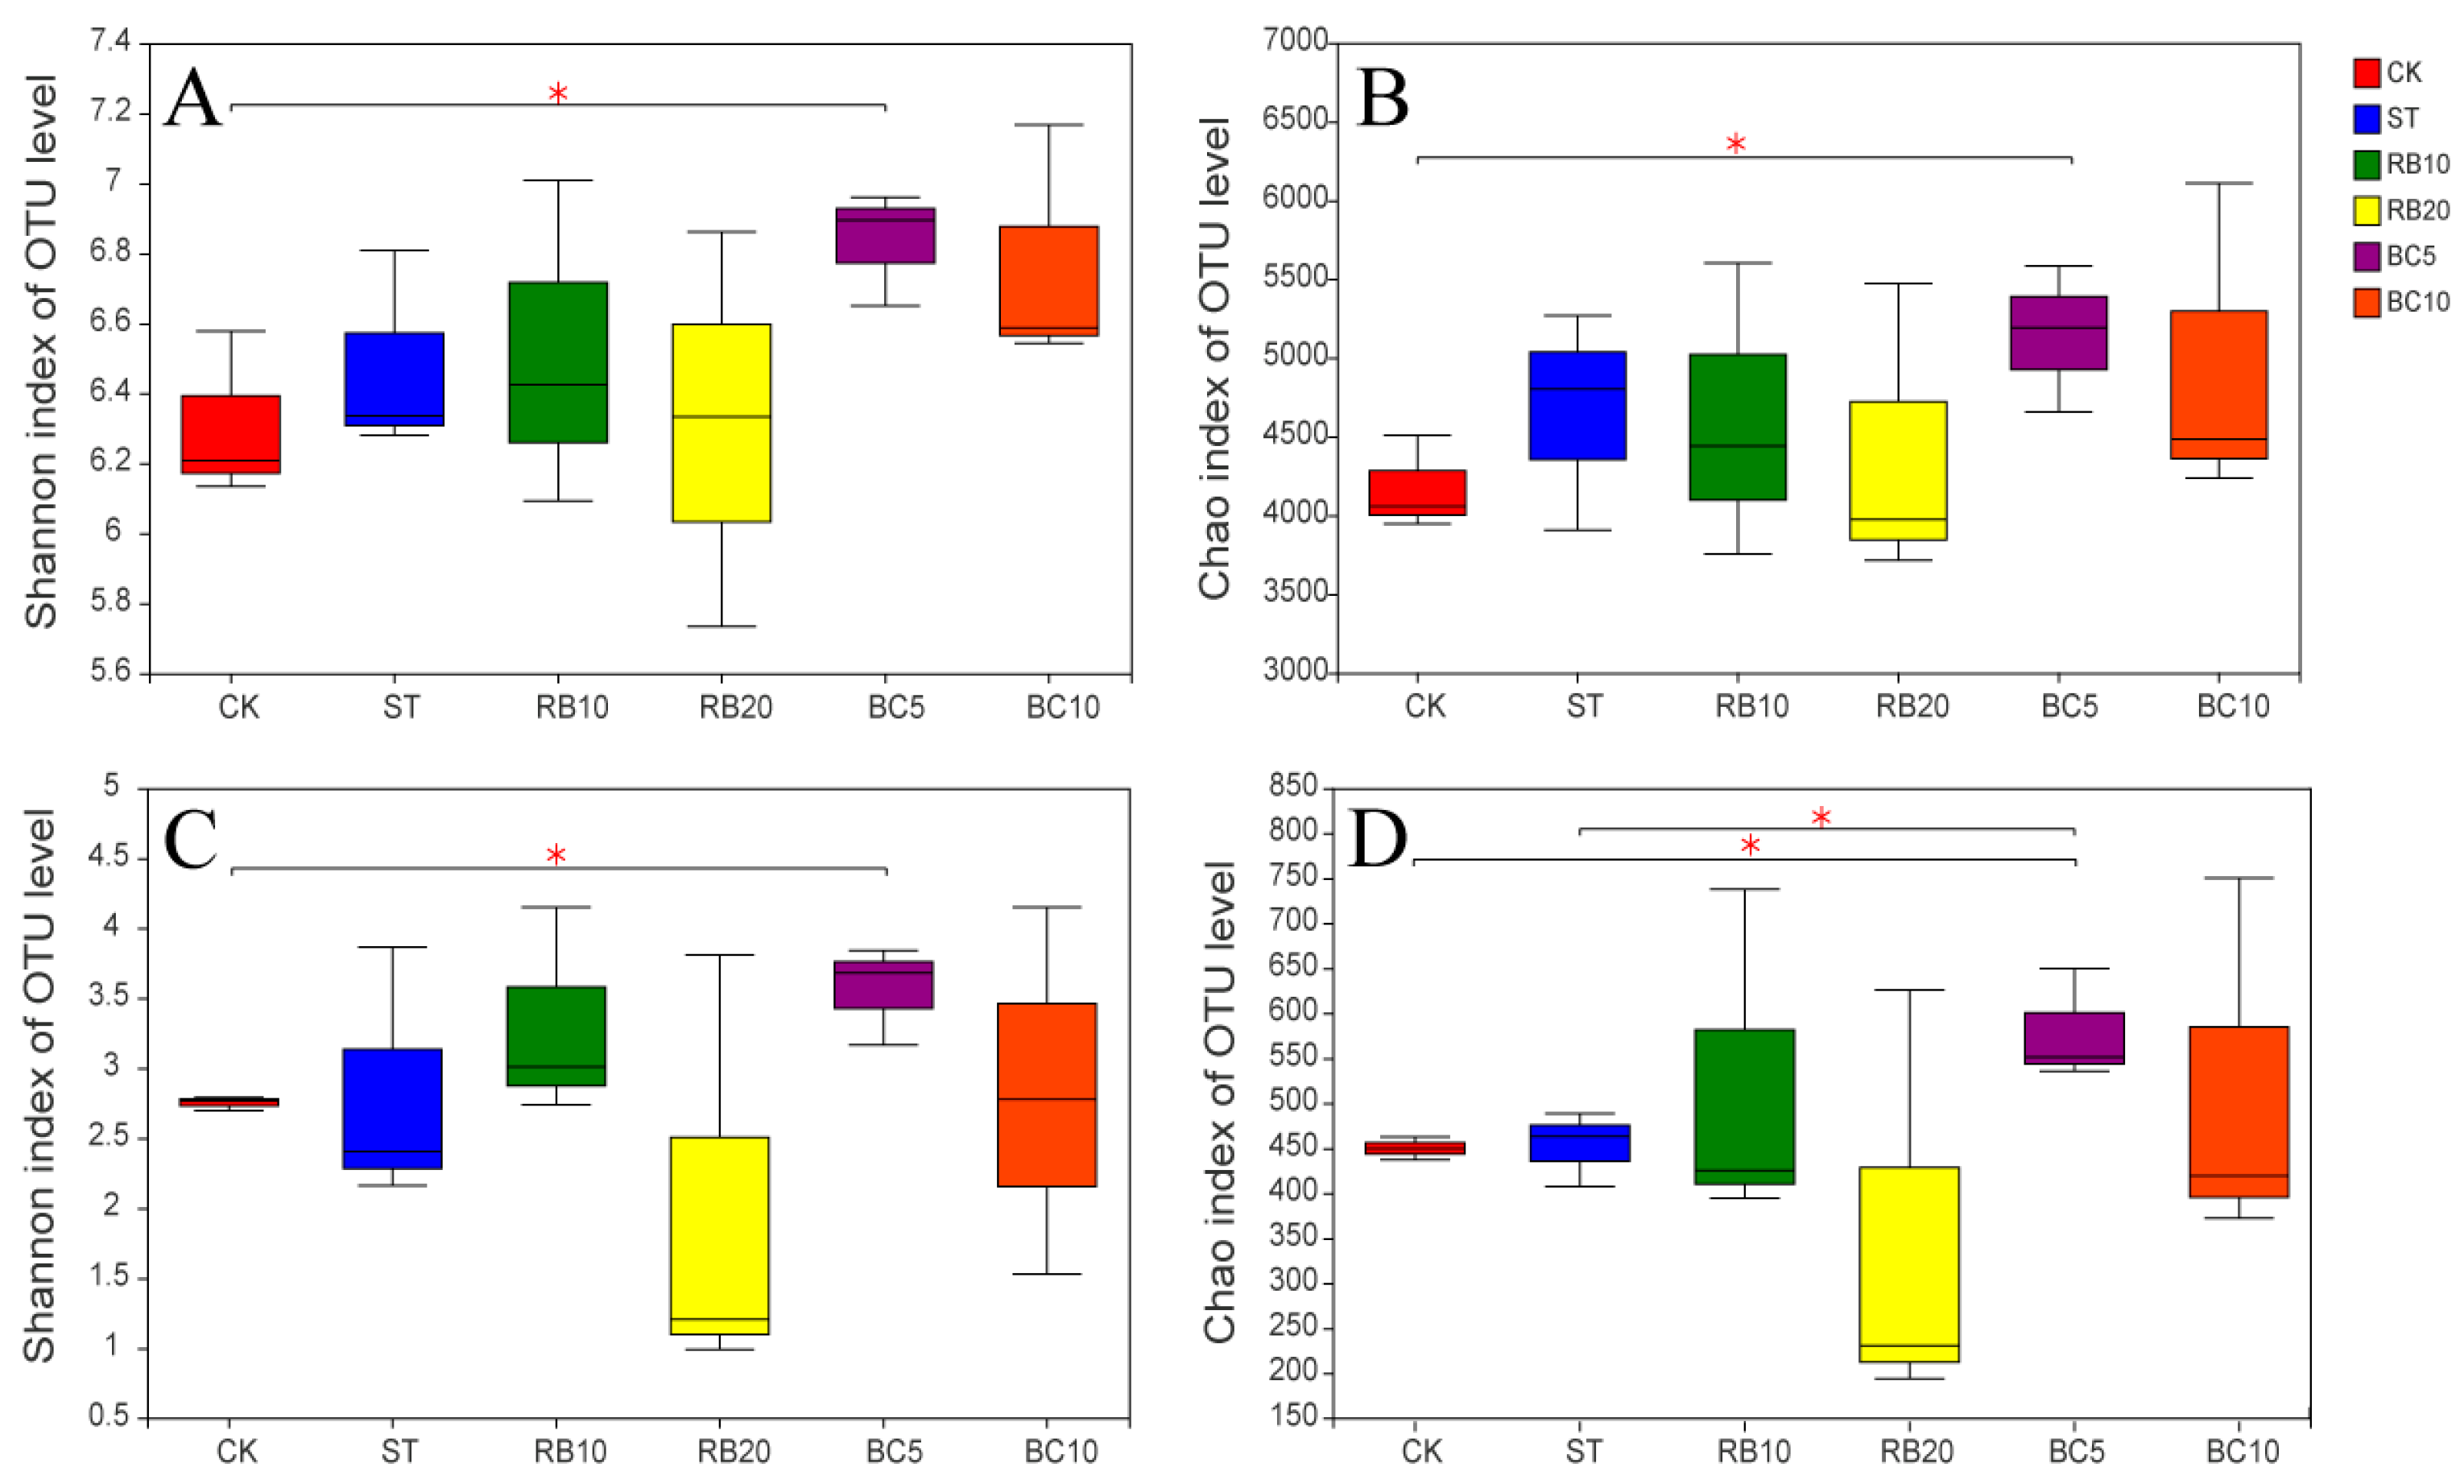
3.4.2. Alpha Diversity

The bacterial and fungal Shannon and Chao diversity indices increased in each treatment except RB20 (Figure 3A,B for bacteria; Figure 3C,D for fungi), which suggested ASD increased bacterial and fungal taxonomic diversity and richness, respectively, in those treatments. BC5 significantly increased the Shannon and Chao indices of bacterial and fungal communities compared to CK (for bacteria, p = 3.37 × 10⁻², p = 3.77 × 10⁻², separately; for fungi, p = 1.68 × 10⁻², p = 2.37 × 10⁻², separately). BC5 also significantly increased the Chao index of the fungal community compared to ST treatment (p = 4.26 × 10⁻², BC5-ST).

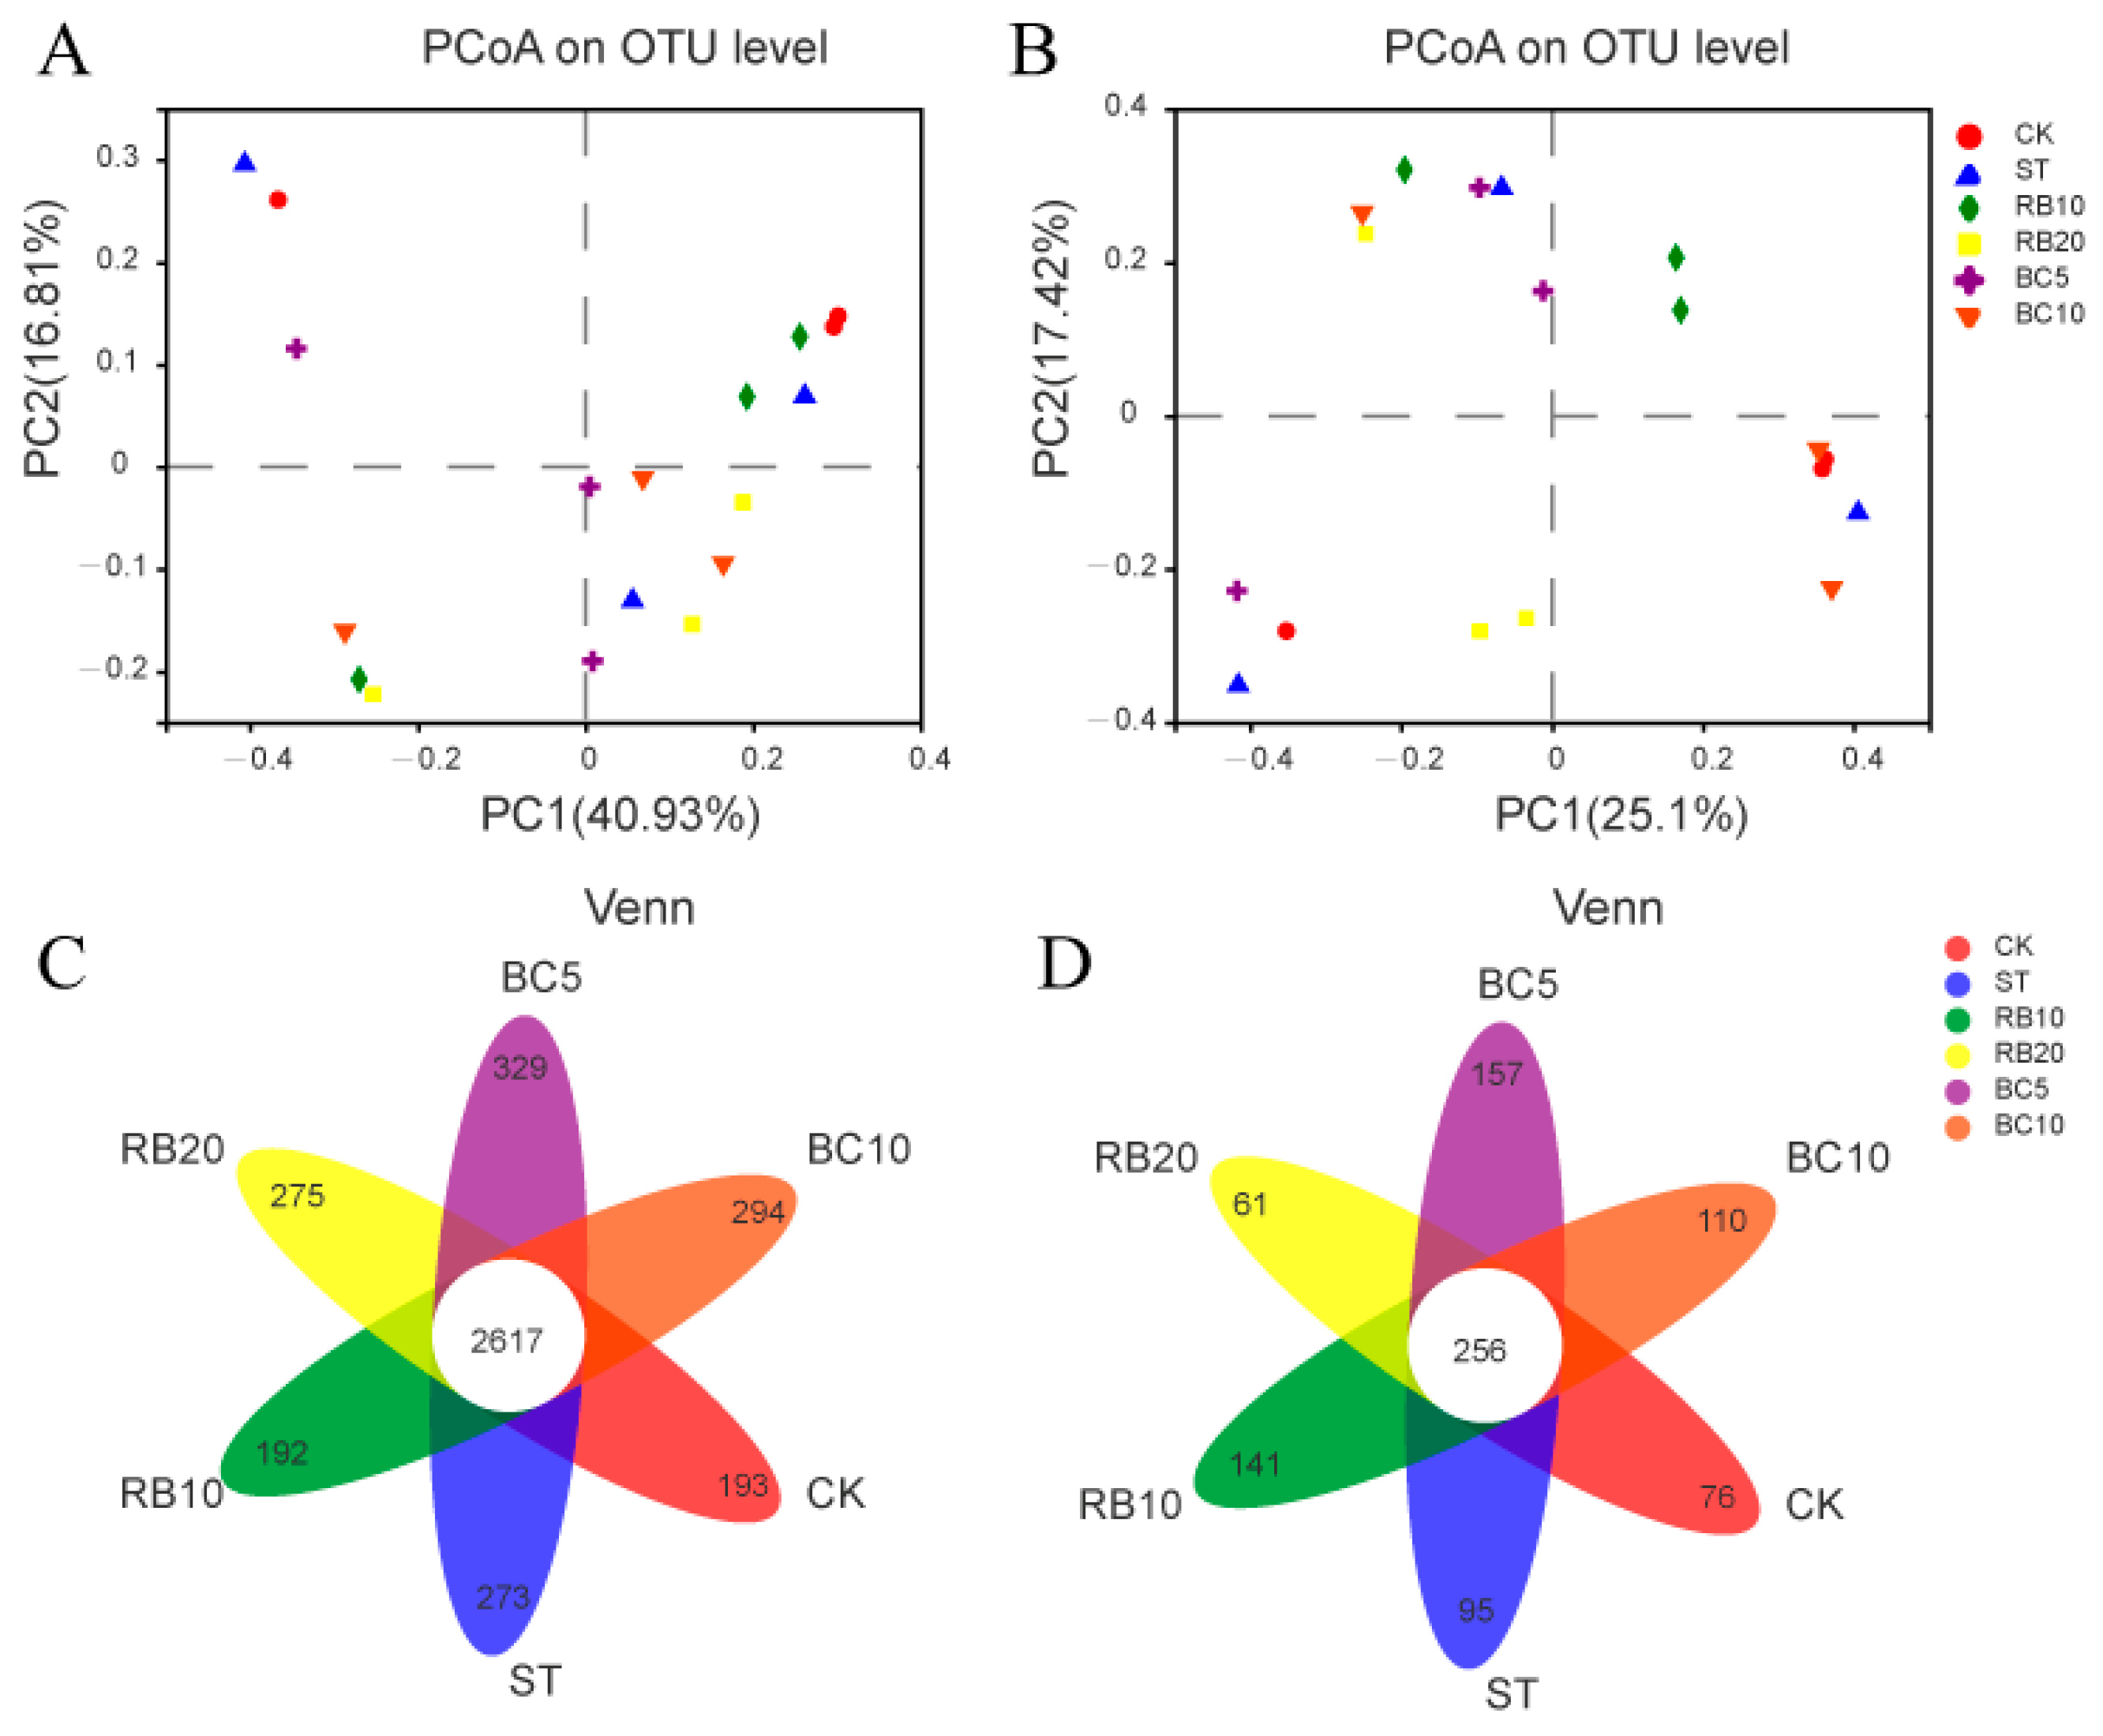
3.4.3. Beta Diversity and Venn Diagram

The PC1 and PC2 axes explained 40.9 and 16.8% (16S region, bacteria) and 25.1 and 17.4% (ITS region, fungi) of the differences in the taxonomic compositional response to the different treatments, respectively (Figure 4A,B). The PCoA results showed that the taxonomic composition of the soil microflora was changed by the treatments, which was also supported by our NMDS analysis (stress−bacteria = 0.054 < 0.2; stress−fungi = 0.072 < 0.2, Figure S1).
There were 2617 bacterial OTUs common to all treatments (Figure 4C). OTUs for bacteria unique to the CK, ST, RB10, RB20, BC5, and BC10 totaled 193, 273, 192, 275, 329, and 294, respectively. The common bacterial OTUs accounted for 51.7, 44.6, 46.3, 50.4, 41.5, and 42.8%, respectively, of the total OTUs exposed to CK, ST, RB10, RB20, BC5, and BC10, respectively. The proportions of unique OTUs in the total OTUs of bacteria exposed to CK, ST, RB10, RB20, BC5, and BC10 were 2.1, 3.0, 2.1, 3.0, 3.6, and 3.2%, respectively. There were 256 fungal OTUs common to all treatments (Figure 4D). In addition, OTUs for fungi unique to the CK, ST, RB10, RB20, BC5, and BC10 treatments totaled 76, 95, 141, 61, 157, and 110, respectively. The common fungal OTUs accounted for 36.6, 33.4, 28.9, 43.5, 28.1, and 30.5%, respectively, of the total OTUs exposed to CK, ST, RB10, RB20, BC5, and BC10, respectively. The proportions of unique OTUs in the total OTUs of fungi exposed to CK, ST, RB10, RB20, BC5, and BC10 were 4.5, 5.6, 8.3, 3.6, 9.3, and 6.5%, respectively.

3.4.4. Changes in Soil Microbial Communities

The dominant phyla in the bacterial community were Proteobacteria (27.7%), Chloroflexi (16.3%), Firmicutes (12.7%), Actinobacteria (10.5%), Acidobacteria (10.3%), Gemmatimonadetes (7.9%), and Bacteroidetes (6.6%) (Figure 5A). The dominant phylum in the fungal community was Ascomycota (75.4%), followed by Basidiomycota (12.0%), Mortierellomycota (7.69%), and unclassified_k_Fungi (4.6%) (Figure 5B). Each treatment reduced the relative abundance of Proteobacteria, Firmicutes, and Gemmatimonadetes in the bacterial community by 9.1–15.8%, 2.9–30.9%, and 15.5–43.8% compared to CK, respectively. Each treatment increased the relative abundance of Chloroflexi and Acidobacteria by 1.5–52.5% and 83.9–203.9%, respectively. In the fungal community, each treatment reduced the relative abundance of Ascomycota by 2.1–30.6% and increased the relative abundance of Mortierellomycota (except RB20) by 26.6–618.0%.
We examined the responses of the top 20 most abundant bacterial genera to different treatments. Compared with ST, each treatment significantly increased the relative abundance of Bacillus by 8.1–61.8% (Figure 5C). RB20 significantly decreased the relative abundance of Sphingomonas, which had a higher relative abundance when exposed to ST, RB10, BC5, and BC10 than CK by 4.0–31.0%. The relative abundance of Pseudomonas increased by 0.7–101.6% in each treatment. All the treatments decreased the relative abundance of Melanocarpus by 65.3–98.7% in the fungal community (Figure 5D). ST and RB20 significantly decreased the relative abundance of Fusarium, but RB10, BC5, and BC10 significantly increased the relative abundance of Fusarium by 16.3–225.5%. The relative abundance of Mortierella increased by 14.0–533.4% (except RB20) and Aspergillus increased by 15.3–227.4% in each treatment (except ST).

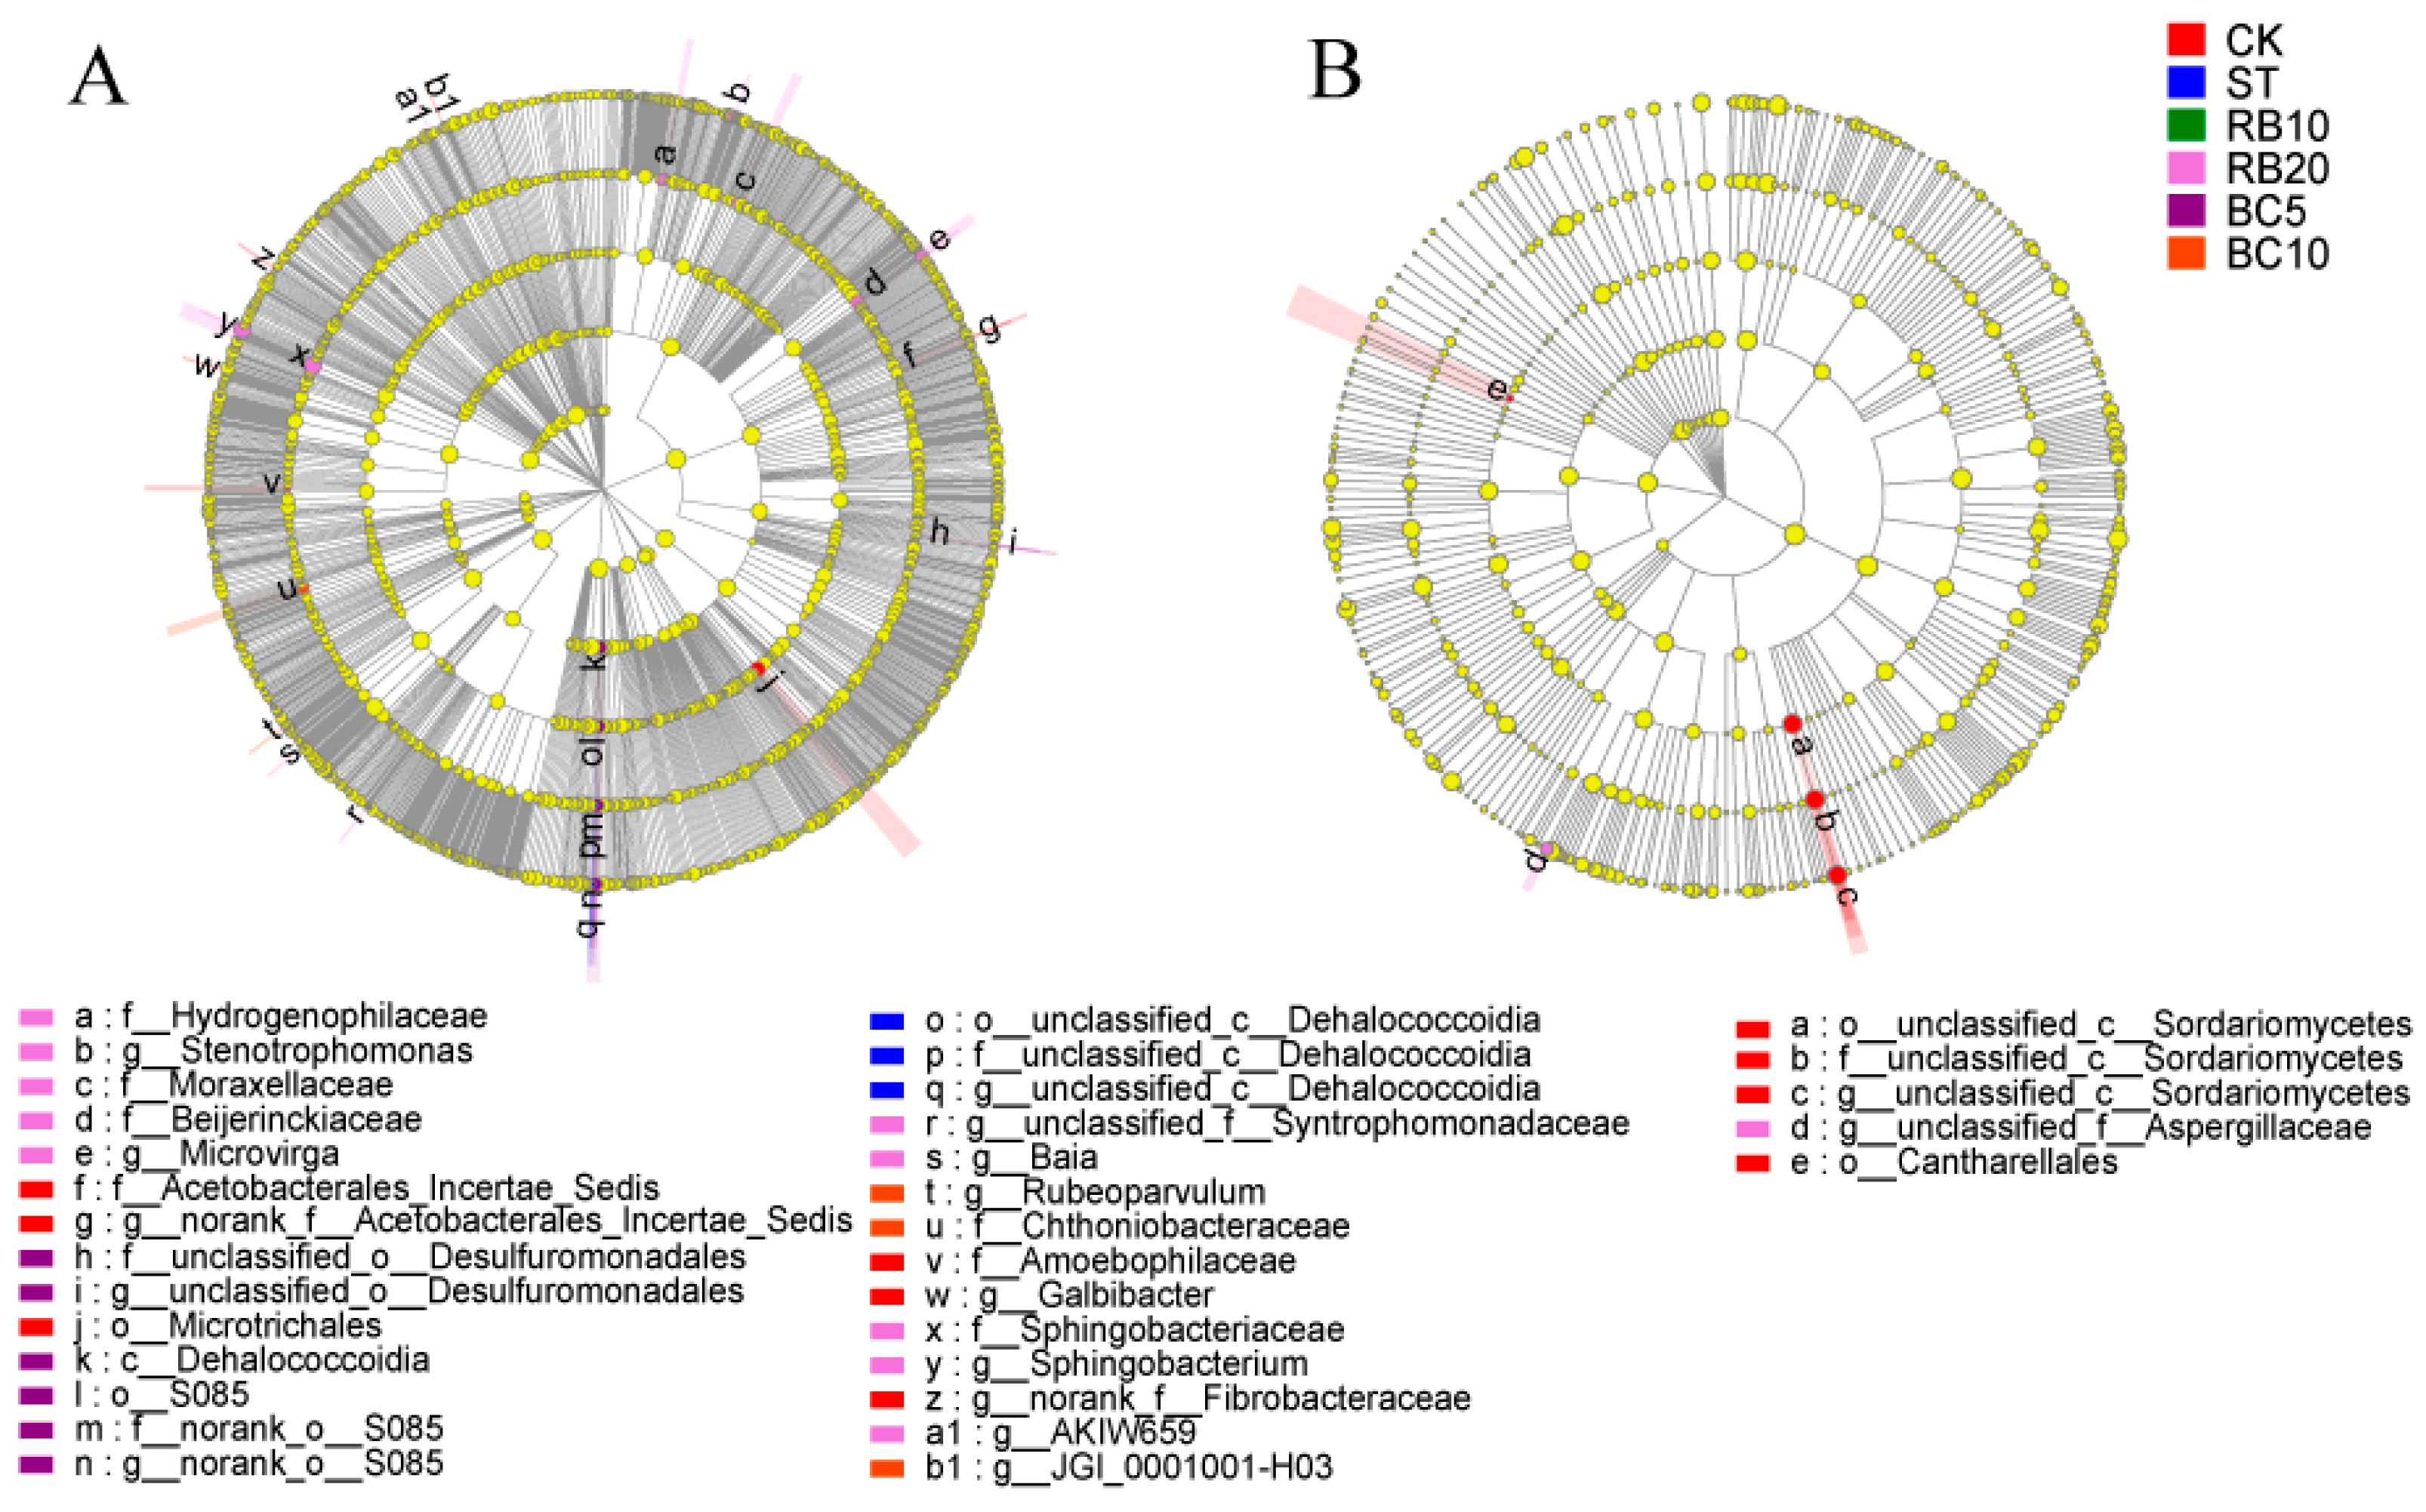
3.5. Biomarker Analysis of Soil Microbial Communities

A total of 28 significantly different microbiota were identified by LEfSe analysis within the bacterial communities that had an LDA threshold of 2.0 and p < 0.05 (Figure 6A). There were 6, 3, 0, 10, 6, and 3 biomarkers in CK, ST, RB10, RB20, BC5, and BC10 treatments, respectively. For example, Microtrichales (order), unclassified_c__Dehalococcoidia (genus), Sphingobacterium (genus), Dehalococcoidia (class), and Rubeoparvulum (genus) were the predominant biomarkers found in the CK, ST, RB20, BC5, and BC10 treatments, respectively. In addition, we found that 32.8% of the biomarkers of the flora could be attributed to Proteobacteria, which was evident in the CK, RB20, and BC5 treatments.
The results of LEfSe analysis within the fungal communities showed that there were 5 significantly different microflora that had an LDA threshold of 2.0 and p < 0.05 (Figure 6B). There were 4 and 1 biomarkers in the CK and RB20 treatments, respectively, but no biomarkers were detected in the other treatments. Biomarkers in CK treatment included unclassified_c__Sordariomycetes (order to genus) and Cantharellales (order), and biomarkers in RB20 treatment included unclassified_f__Aspergillaceae (genus). We found that 90.5% of the biomarkers of the flora could be attributed to Ascomycota, which was evident in the CK and RB20 treatments.

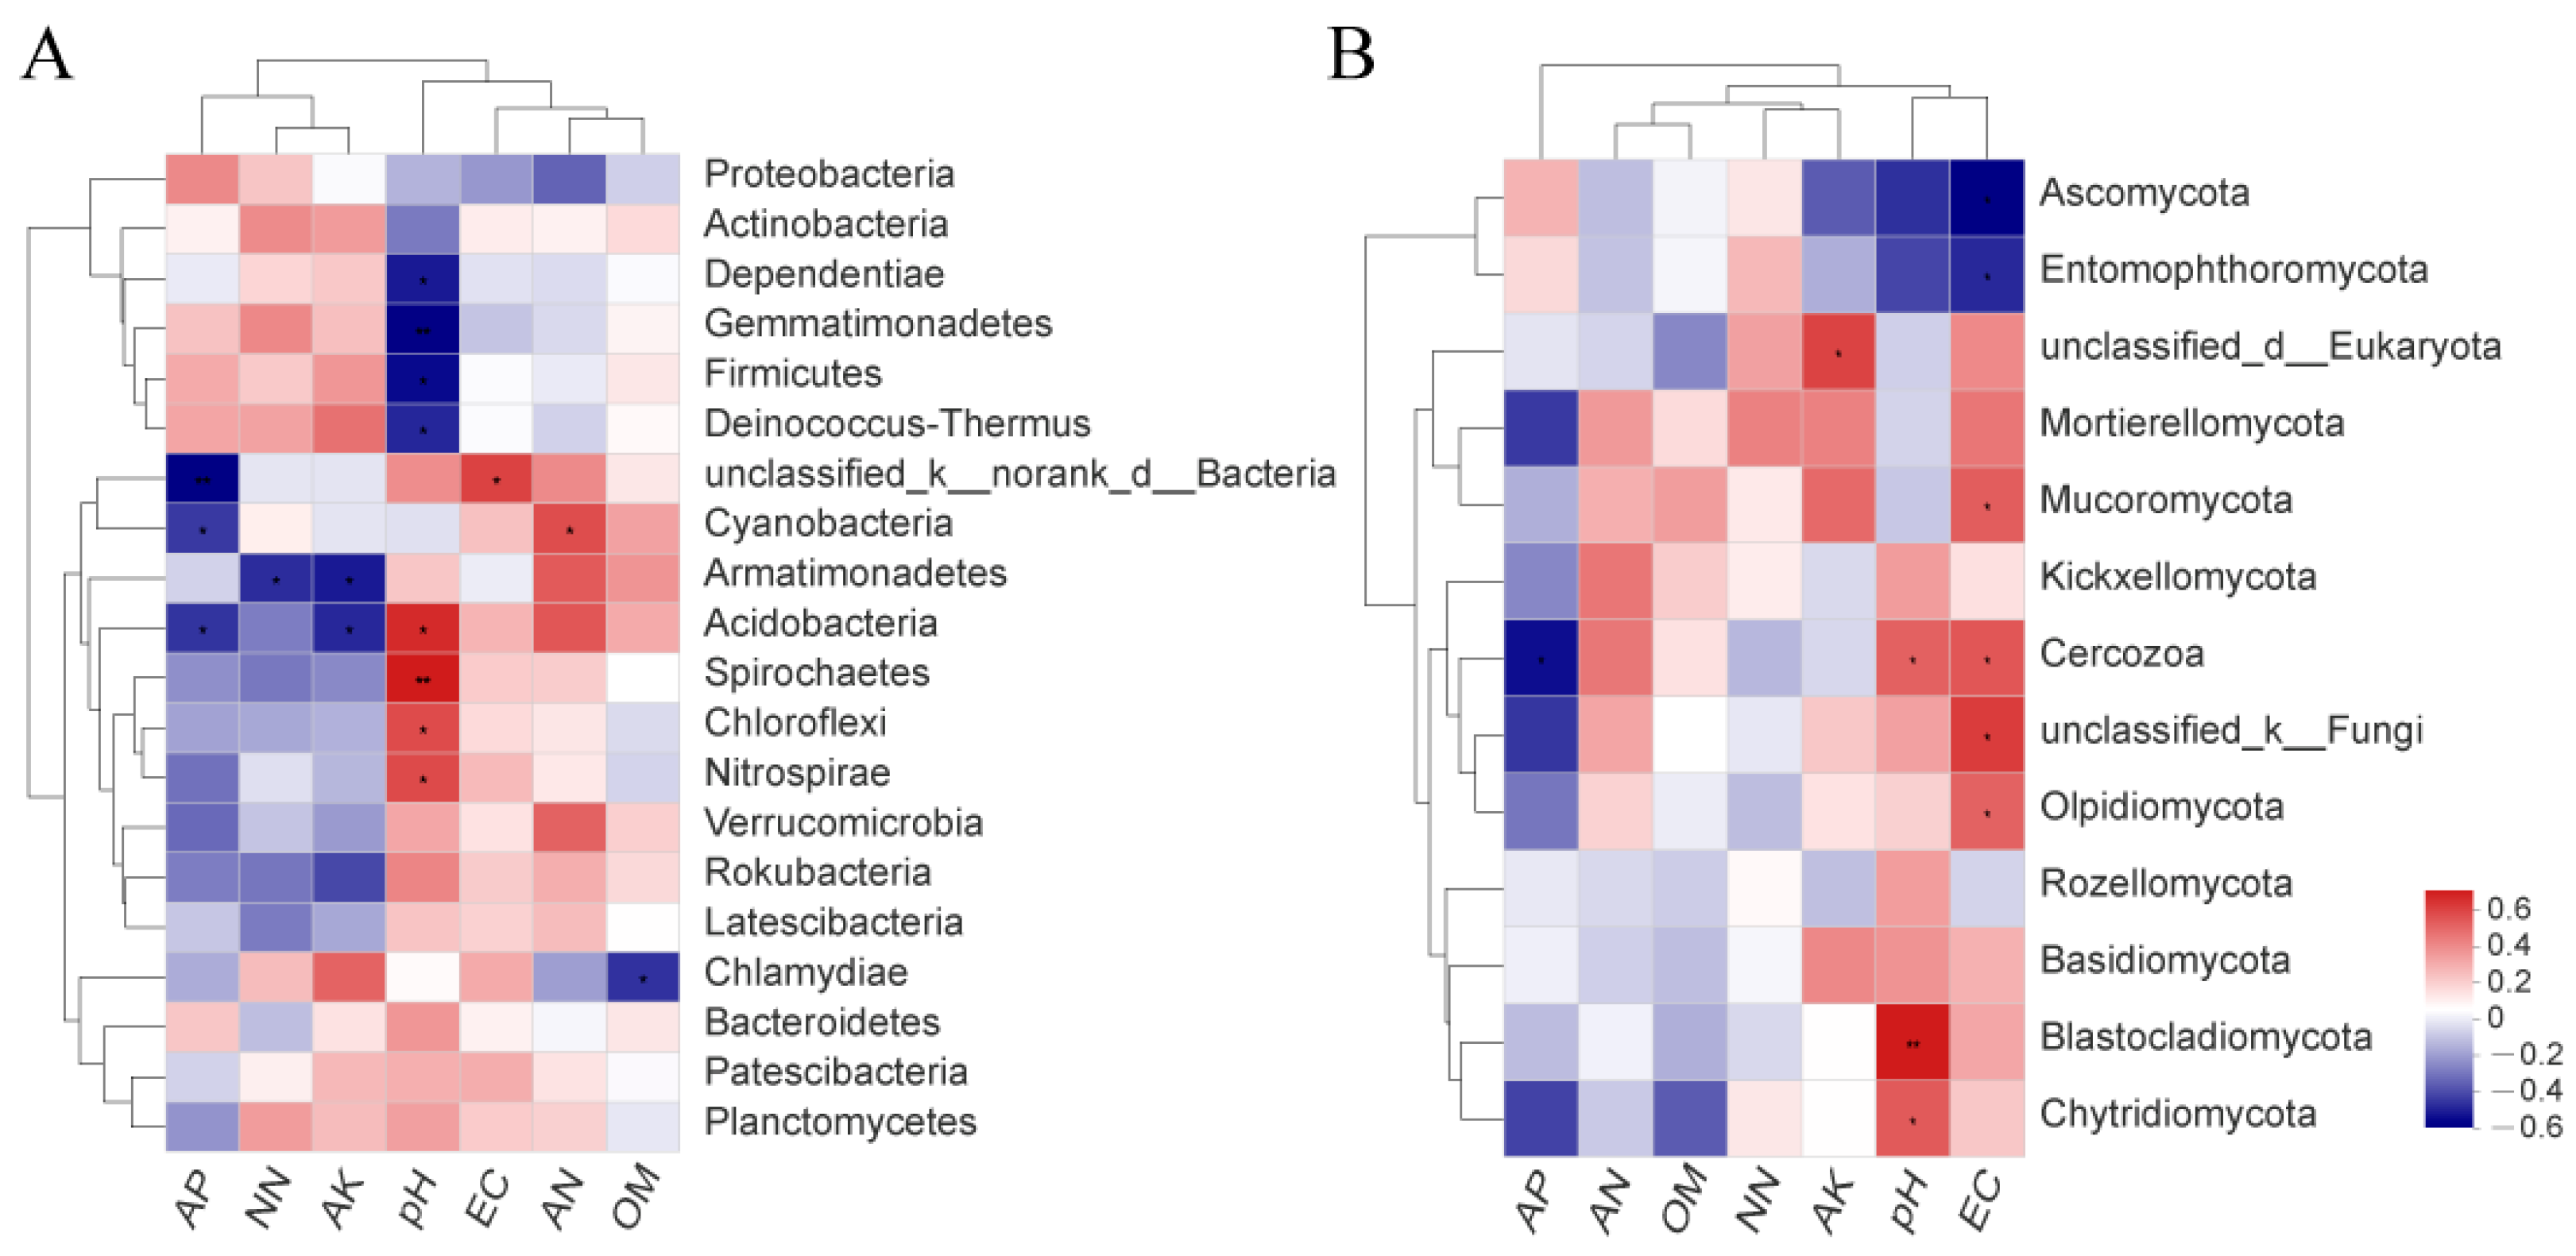
3.6. Correlation between Soil Physicochemical Properties and Microorganisms

We applied Spearman’s rank correlation to determine any significant correlation between the main species of microorganisms and the soil physicochemical properties. In bacterial phyla, the relative abundances of Chloroflexi and Nitrospirae were significantly positively correlated with the soil pH (R = 0.49, p < 0.05; R = 0.49, p < 0.05), but the relative abundances of Gemmatimonadetes and Firmicutes were significantly negatively correlated with the soil pH (R = −0.61, p < 0.01; R = −0.57, p < 0.05) (Figure 7A). The relative abundance of Acidobacteria was significantly positively correlated with the soil pH (R = 0.57, p < 0.05) and significantly negatively correlated with available phosphorus and available potassium (R = −0.48, p < 0.05; R = −0.51, p < 0.05). In fungal phyla, the relative abundance of Ascomycota and Entomophthoromycota was significantly negatively correlated with electrical conductivity (R = −0.58, p < 0.05; R = −0.47, p < 0.05), but the relative abundance of Olpidiomycota and Mucoromycota was significantly positively correlated with electrical conductivity (R = 0.47, p < 0.05; R = 0.49, p < 0.05) (Figure 7B). The relative abundance of Chytridiomycota and Blastocladiomycota was significantly positively correlated with pH (R = 0.49, p < 0.05; R = −0.57, p < 0.01). Cercozoa, however, was significantly negatively correlated with available phosphorus (R = −0.53, p < 0.05).
In bacterial genera, the relative abundance of Bacillus and Truepera was significantly negatively correlated with pH (R = −0.53, p < 0.05; R = −0.50, p < 0.05), and the relative abundance of RB41 was significantly negatively correlated with available potassium (R = −0.49, p < 0.05) (Figure S2A). In fungal genera, the relative abundance of Trichosporon was significantly negatively correlated with nitrate nitrogen (R = −0.49, p < 0.05), and the relative abundance of Fusarium was significantly negatively correlated with available phosphorus (R = −0.51, p < 0.05) (Figure S2B). The relative abundance of Mycothermus and Melanocarpus was significantly negatively correlated with pH (R = −0.47, p < 0.05; R = −0.63, p < 0.01).
We carried out an ordinal regression analysis of soil microbial diversity and pH because our results showed that the presence of some bacterial and fungal taxa was strongly correlated with the soil pH. Shannon and Chao indices in the bacterial and fungal communities were significantly positively correlated with soil pH (for bacteria, R2 = 0.2507; R2 = 0.3750 (Figure S3A,C); for fungi, R2 = 0.0821; R2 = 0.2117 (Figure S3B,D)). The correlation was weaker in the fungal community compared to the bacterial community.

4. Discussion

4.1. Effects of ASD on Soil Pathogens

ASD can create conditions that are anaerobic, strongly reducing, and relatively warm that produce volatile gases, organic acids, metal ions, and other substances that collectively reduce the abundance of soil-borne pathogens [24,25]. Overbeek et al. [26] found that ASD reduced the abundance of Ralstonia solanacearum in soil by more than 99.4%, and that such reductions also reduced bacterial wilt incidence. Our previous research had shown that ASD could be applied in pre-plant fumigation to control strawberry soil-borne pests, strengthen soil fertility, improve crop yield, and increase growers’ income [13,27]. In this experiment, we found that Fusarium and Phytophthora species in Trials I and II were significantly reduced by as much as 98.6% 10 d after disinfestation. In addition, BC10 was particularly effective in reducing Fusarium and Phytophthora species, which indicated the potential for biochar to be used commercially for that purpose. Li et al. [28] found that biochar reduced the reproductive rates of both species. The efficacy of the treatment is transient because 120 d after the TIF was removed, we found that pathogen levels were similar to the control in all treatments and unacceptable as a season-long control measure. However, ASD with the selected carbon sources did not reduce crop yield.

4.2. Effects of ASD on Soil Physicochemical Properties

Soil denitrification is enhanced in an anaerobic environment, resulting in a rapid reduction in nitrate concentration in ASD-treated soil [29]. ASD significantly increased the concentration of ammonium nitrogen, which may be related to an increase in nitrogen-generating microorganisms in the soil [30]. During the ASD treatment, the carbon sources used can significantly increase the soil nutrient content and enhance microbial activity through mineralization and degradation [31].
We found that ASD significantly increased the organic matter content. ASD with biochar significantly reduced the concentrations of available phosphorus and potassium in the soil. Similar results were found previously; soil organic matter content is usually positively correlated with crop production [32]. The soil pH increased in the treatments that involved biochar and rice bran, possibly because the soil undergoes a reduction reaction under anaerobic conditions; it forms a large amount of highly oxidative alkaline substances that consume H+ [33]. The increase in soil conductivity may be due to the release of a large number of ions from organic carbon sources during ASD treatment, resulting in an increased ion concentration in the soil [21].

4.3. Effects of ASD on Strawberry Plant Growth and Fruit Yield

ASD increased the plant height and stem diameter of strawberry plants in both experimental sites, which was consistent with the results found by Zhu et al. [34] that ASD with ryegrass could significantly increase cucumber plant height and growth. Liu et al. [35] also found a similar effect: ASD with rice bran significantly increased tobacco plant height and stem circumference. We also found that strawberry plant mortality was significantly reduced when rice bran or biochar, both with TIF, were included in the treatment, and that BC10 produced the highest yield. That result may be related to the increased nutrient content of organic materials, which promoted the reconstruction of microbial communities [36]. Previous research reported that increased soil nutrient levels and reduced levels of pathogens may directly or indirectly reduce strawberry plant mortality. Shrestha et al. [37] applied a meta-analysis to the research results reported on the effect of ASD on crop yield and showed that all ASD treatments significantly increased crop yield. Butler et al. [38] used molasses as a carbon source and found that pepper and eggplant yields in response to ASD were equal to or greater than those obtained in response to methyl bromide. Correlation analysis of our results showed that strawberry yield was also significantly positively correlated with soil ammonium nitrogen and organic matter content (Figure S4) and significantly negatively correlated with the number of soil-borne pathogens 10 d after disinfestation (Figure S5), which was consistent with the results of Wang et al. [39].

4.4. Effects of ASD on Microbial Taxonomic Composition

PCoA and NMDS analysis showed that the main factors affecting microbial community composition were the dose and type of organic material, which was consistent with previous research [40]. Our Venn diagram analysis showed that ASD increased the number of OTUs.
Our results confirmed that ASD changed the relative abundance of the dominant microbes at both the phylum and genus levels, but the extent varied according to the type of organic material used and the dose (Figure 5). We found that ASD increased the relative abundance of Chloroflexi and Acidobacteria, which was significantly positively correlated with soil pH. Chloroflexi has been proven to inhibit the reproduction of soil pathogens [41]. Acidobacteria have also been reported to play an important role in plant residue degradation and ecosystem carbon cycling [42]. We found that the relative abundance of Ascomycota decreased after ASD, which was significantly negatively correlated with electrical conductivity, which was consistent with Zhao et al. [43].
The relative abundance of Bacillus increased significantly by 61.8% (compared with ST) in response to RB10, and it was also significantly negatively correlated with soil pH. Zampieri et al. [44] reported that Bacillus is a growth-promoting bacteria resident in the plant rhizosphere and can promote healthy plant growth. When present, Bacillus improves the absorption of nutrients by plants and controls pathogenic bacteria. We found that ASD increased the relative abundance of Pseudomonas, which has been reported to reduce plant mortality and promote crop growth [45]. We found that ASD (except RB20) significantly increased the relative abundance of Mortierella. Liu et al. [46] reported that Mortierella can decompose cellulose, hemicellulose, and lignin, leading to an increase in soil organic matter and nutrients. Changes to the microbial taxonomic composition in response to rice bran or biochar also suggested that ASD could stabilize the soil ecosystem.
Therefore, we speculated that the potential mechanism of ASD to promote plant growth was to reduce the abundance of soil pathogens by promoting the propagation of beneficial microorganisms in the soil and further increasing soil nutrients, thus promoting strawberry growth.

5. Conclusions

Our results showed that ASD effectively controlled Fusarium and Phytophthora species in the short term, and ultimately significantly increased strawberry yield. In particular, biochar at a dosage of 10 t/ha increased yield the most of all treatments tested. ASD significantly increased the content of soil ammonium nitrogen and organic matter, which was also significantly positively correlated with strawberry yield. Changes in soil physicochemical properties significantly affected soil microbial community composition. The soil pH and electrical conductivity also increased significantly. The relative abundance of some beneficial microorganisms related to crop disease control was significantly increased in the anaerobic environment, such as Chloroflexi, Acidobacteria, Bacillus, Pseudomonas, and Mortierella.
In conclusion, biochar can be used as an option for ASD. In addition, the use of rice bran and biochar in ASD reduces pollution from agricultural waste, chemical fertilizer input, and the use of chemicals used for soil disinfestation. However, ASD technology has not been widely used commercially in China, and the effective combination of ASD technology and other control measures should be emphasized in monocropping plots in the future.

Supplementary Materials

The following supporting information can be downloaded at: https://www.mdpi.com/article/10.3390/agriculture13071466/s1, Figure S1: Nonmetric Multidimensional Scale Analysis of soil’ (A) bacterial and (B) fungal communities exposed to different treatments; Figure S2: Heatmap analysis of correlations between soil (A) bacterial and (B) fungal communities at the genus level with soil physicochemical properties; Figure S3: Ordinal regression analysis of alpha diversity and pH of soil bacterial (A, C) and fungal (B, D) communities. R2 is the coefficient of determination, which represents the proportion of variation explained by the regression line; Figure S4: Correlation analysis between strawberry yield and soil physicochemical properties; Figure S5: Correlation analysis between strawberry yield and soil-borne pathogens. Table S1: Approximate number of soil-borne pathogens before soil anaerobic disinfestation; Table S2: Properties of rice bran and biochar materials; Table S3: Culture medium composition (making 2 L of culture medium)a; Table S4: Soil-borne pathogen abundance and mortality 10 days in the different treatmentsa; Table S5: Soil-borne pathogen abundance 120 days in the different treatmentsa; Table S6: Strawberry plant height, stem diameter and plant mortality, and strawberry fruit yield in the different treatmentsa.

Author Contributions

Conceptualization, Z.S., D.Y. and W.F.; methodology, Z.S.; software, D.Z.; validation, X.J. and Y.L.; formal analysis, Z.S.; investigation, Q.W.; resources, G.W.; data curation, Q.L.; writing—original draft preparation, Q.L.; writing—review and editing, A.C.; visualization, Z.S.; supervision, A.C.; project administration, A.C.; funding acquisition, A.C. All authors have read and agreed to the published version of the manuscript.

Funding

This research was funded by the Beijing Innovation Consortium of Agriculture Research System (BAIC01-2022) and the Beijing Natural Science Foundation (6232034).

Institutional Review Board Statement

Not applicable.

Data Availability Statement

No new data were created or analyzed in this study.

Acknowledgments

The authors thank TA Batchelor for his editorial comments on an early draft of the manuscript.

Conflicts of Interest

The authors declare no conflict of interest.

References

  1. Xu, F.; Ren, W.; Fang, X.; Chen, L.; Zha, X. Residues, dissipation, and safety evaluation of pymetrozine-clothianidin mixture in strawberry. Environ. Sci. Pollut. Res. Int. 2021, 28, 22641–22650. [Google Scholar] [CrossRef] [PubMed]
  2. Cheng, H.Y.; Zhang, D.Q.; Ren, L.R.; Song, Z.X.; Li, Q.J.; Wu, J.J.; Fang, W.S.; Huang, B.; Yan, D.D.; Li, Y.; et al. Bio-activation of soil with beneficial microbes after soil fumigation reduces soil-borne pathogens and increases tomato yield. Environ. Pollut. 2021, 283, 117160. [Google Scholar] [CrossRef] [PubMed]
  3. Iapichino, G.; Prinzivalli, C.; D’Anna, F. Soil solarization as an alternative to methyl bromide fumigation for annual strawberry production in a Mediterranean Area. J. Sustain. Agr. 2008, 32, 365–375. [Google Scholar] [CrossRef]
  4. He, Y.; Chen, J.; Tang, C.; Deng, Q.; Guo, L.; Cheng, Y.; Li, Z.; Wang, T.; Xu, J.; Gao, C. Genetic diversity and population structure of fusarium commune causing strawberry root rot in southcentral China. Genes 2022, 13, 899. [Google Scholar] [CrossRef]
  5. Wang, Z.; Fu, M.Y.; Zhao, S.C. Research progress of strawberry verticillium wilt. Anhui Agric. Sci. Bull. 2021, 27, 111–114. [Google Scholar]
  6. Li, Q.J.; Zhang, D.Q.; Song, Z.X.; Ren, L.R.; Jin, X.; Fang, W.S.; Yan, D.D.; Li, Y.; Wang, Q.X.; Cao, A.C. Organic fertilizer activates soil beneficial microorganisms to promote strawberry growth and soil health after fumigation. Environ. Pollut. 2022, 295, 118653. [Google Scholar] [CrossRef]
  7. Li, H.; Yang, H.Y.; Calderón-Urrea, A.; Li, Y.P.; Zhang, L.P.; Yu, Y.L.; Ma, J.Y.; Shi, G.Y. Microbial Fertilization Improves Soil Health When Compared to Chemical Fumigation in Sweet Lily. J. Fungi 2022, 8, 847. [Google Scholar] [CrossRef]
  8. Wang, C.; Ma, X.H.; Wang, G.; Li, G.T.; Zhu, K. Implication of O2 dynamics for both N2O and CH4 emissions from soil during biological soil disinfestation. Sci. Rep. 2021, 11, 6590. [Google Scholar] [CrossRef]
  9. Utsala, S.; Mary, E.D.; Bonnie, H.O.; David, M.B. Anaerobic soil disinfestation reduces germination and affects colonization of Sclerotium rolfsii sclerotia. Phytopathology 2018, 108, 342–351. [Google Scholar]
  10. Murphy, C.M.; Weller, D.L.; Reiter, M.S.; Bardsley, C.A.; Eifert, J.; Ponder, M.; Rideout, S.L.; Strawn, L.K. Anaerobic soil disinfestation, amendment-type, and irrigation regimen influence Salmonella survival and die-off in agricultural soils. J. Appl. Microbiol. 2022, 132, 2342–2354. [Google Scholar] [CrossRef]
  11. Song, Z.X.; Yan, D.D.; Fang, W.S.; Wang, Q.X.; Li, Y.; Xu, J.; Jin, X.; Cao, A.C. Anaerobic soil disinfestation technology, action mechanisms and influencing factors. J. Plant Prot. 2022, 49, 994–1003. [Google Scholar]
  12. Blok, W.J.; Lamers, J.G.; Termorshuizen, A.J.; Bollen, G.J. Control of soil-borne plant pathogens by incorporating fresh organic amendments followed by tarping. Phytopathology 2000, 90, 253–259. [Google Scholar] [CrossRef] [Green Version]
  13. Song, Z.X.; Yan, D.D.; Fang, W.S.; Huang, B.; Wang, X.L.; Zhang, D.Q.; Zhu, J.H.; Liu, J.; Ouyang, C.B.; Li, Y.; et al. Maltose and totally impermeable film enhanced suppression of anaerobic soil disinfestation on soil-borne pathogens and increased strawberry yield. Sustainability 2020, 12, 5456. [Google Scholar] [CrossRef]
  14. Cai, Z.C.; Zhang, J.B.; Huang, X.Q.; Zhu, T.B.; Wen, T. Application of reductive soil disinfestation to suppress soil-borne pathogens. Acta Pedol. Sin. 2015, 52, 469–476. [Google Scholar]
  15. Patwa, D.; Bordoloi, U.; Dubey, A.A.; Ravi, K.; Sekharan, S.; Kalita, P. Energy-efficient biochar production for thermal backfill applications. Sci. Total Environ. 2022, 833, 155253. [Google Scholar] [CrossRef]
  16. Zheng, X.M.; Xu, W.H.; Dong, J.; Yang, T.; Shangguan, Z.C.; Qu, J.; Li, X.; Tan, X.F. The effects of biochar and its applications in the microbial remediation of contaminated soil: A review. J. Hazard. Mater. 2022, 438, 129557. [Google Scholar] [CrossRef] [PubMed]
  17. Ginebra, M.; Muñoz, C.; Calvelo-Pereira, R.; Doussoulin, M.; Zagal, E. Biochar impacts on soil chemical properties, greenhouse gas emissions and forage productivity: A field experiment. Sci. Total Environ. 2022, 806, 150465. [Google Scholar] [CrossRef] [PubMed]
  18. Xu, C.; Chen, Y.P.; Su, C.C.; Ma, J.F.; Wu, J.H.; Wang, K.B.; Wang, Y.; Jiang, Y. Microbial characteristics response to the soil quality of newly created farmland on the Loess Plateau. Environ. Sci. Pollut. Res. Int. 2021, 28, 42290–42299. [Google Scholar] [CrossRef]
  19. Mehrabi, Z.; McMillan, V.E.; Clark, I.M.; Canning, G.; Hammond-Kosack, K.E.; Preston, G.; Hirsch, P.R.; Mauchline, T.H. Pseudomonas spp. diversity is negatively associated with suppression of the wheat take-all pathogen. Sci. Rep. 2016, 6, 29905. [Google Scholar] [CrossRef] [Green Version]
  20. Zhang, D.Q.; Yan, D.D.; Fang, W.S.; Huang, B.; Wang, X.L.; Wang, X.N.; Zhu, J.H.; Liu, J.; Ouyang, C.B.; Li, Y.; et al. Chloropicrin alternated with biofumigation increases crop yield and modifies soil bacterial and fungal communities in strawberry production. Sci. Total Environ. 2019, 675, 615–622. [Google Scholar] [CrossRef]
  21. Momma, N.; Kobara, Y.; Momma, M. Fe2+ and Mn2+, potential agents to induce suppression of Fusarium oxysporum for biological soil disinfestation. J. Gen. Plant Pathol. 2011, 77, 331–335. [Google Scholar] [CrossRef]
  22. Komada, H. Development of a selective medium for quantitative isolation of Fusarium oxysporum from natural soil. Rev. Plant Prot. Res. 1975, 8, 114–125. [Google Scholar]
  23. Masago, H.; Yoshikawa, M.; Fukada, M.; Nakanishi, N. Selective inhibition of pythium spp. on a medium for direct isolation of phytophthora spp. from soils and plants. Phytopathology 1977, 77, 425–428. [Google Scholar] [CrossRef]
  24. Oka, Y. Mechanisms of nematode suppression by organic soil amendments—A review. Appl. Soil Ecol. 2010, 44, 101–115. [Google Scholar] [CrossRef]
  25. Runia, W.T.; Molendijk, L.P.G. Physical methods for soil disinfestation in intensive agriculture: Old methods and new approaches. Acta Hortic. 2010, 883, 249–258. [Google Scholar] [CrossRef] [Green Version]
  26. Overbeek, L.V.; Runia, W.; Kastelein, P.; Molendijk, L. Anaerobic disinfestation of tare soils contaminated with Ralstonia solanacearum biovar 2 and Globodera pallida. Eur. J. Plant Pathol. 2014, 138, 323–330. [Google Scholar] [CrossRef]
  27. Song, Z.X.; Massart, S.; Yan, D.D.; Cheng, H.Y.; Eck, M.; Berhal, C.; Ouyang, C.B.; Li, Y.; Wang, Q.X.; Cao, A.C. Composted Chicken Manure for Anaerobic Soil Disinfestation Increased the Strawberry Yield and Shifted the Soil Microbial Communities. Sustainability 2020, 12, 6313. [Google Scholar] [CrossRef]
  28. Li, Q.J.; Fang, W.S.; Zhang, D.Q.; Yan, D.D.; Li, Y.; Wang, Q.X.; Cao, A.C. Effects of dazomet fumigation combined with biochar and zeolite on soil microecology and soil-borne pathogens. Plant Prot. 2022, 48, 150–157. [Google Scholar]
  29. Huang, X.Q.; Wen, T.; Meng, L.; Zhang, J.B.; Zhu, T.; Cai, Z.C. Anaerobic Soil Disinfestation on Fusarium oxysporum. Soils 2014, 46, 851–855. [Google Scholar]
  30. Drury, C.F.; Findlay, W.I.; McKenney, D.J. Oxygen inhibition of denitrification in chloroform fumigated and non-fumigated soil. Soil Biol. Biochem. 2021, 23, 711–715. [Google Scholar] [CrossRef]
  31. Wu, C.R.; Huang, F.; Gao, Y.; Mao, Y.H.; Cai, K.Z. Effect of biological disinfestation on soil improvement, Ralstonia solanacearum suppression and tomato growth. Chin. J. Eco-Agr. 2017, 25, 1173–1180. [Google Scholar]
  32. Tian, J.H.; Kuang, X.; Tang, M.T.; Chen, X.D.; Huang, F.; Cai, Y.X.; Cai, K.Z. Biochar application under low phosphorus input promotes soil organic phosphorus mineralization by shifting bacterial phoD gene community composition. Sci. Total Environ. 2021, 779, 146556. [Google Scholar] [CrossRef]
  33. Dai, Z.G.; Lu, J.W.; Lu, M.X.; Yang, W.B.; Fan, X.P. Effect of rape straw rate on physicochemical properties of soil surface solution under waterlogged incubation. J. Soil Water Conserv. 2010, 24, 200–204. [Google Scholar]
  34. Zhu, T.B.; Zhang, J.B.; Cai, Z.C. Effects of organic material amendment on vegetable soil nitrate content and nitrogenous gases emission under flooding condition. Chin. J. Appl. Ecol. 2012, 23, 109–114. [Google Scholar]
  35. Liu, Y.N.; He, G.S.; Wei, J.Y.; Jia, H.J.; Huang, C.J.; Cai, Y.X.; Cai, K.Z.; Pan, B.G.; Wang, W. Effects of anaerobic soil disinfestation on the quality and bacterial community of tobacco-growing soils. Chin. Tobacco Sci. 2019, 40, 39–46. [Google Scholar]
  36. Hewavitharana, S.S.; Mazzola, M. Carbon source-dependent effects of anaerobic soil disinfestation on soil microbiome and suppression of rhizoctonia solani AG-5 and pratylenchus penetrans. Phytopathology 2016, 106, 1015–1028. [Google Scholar] [CrossRef] [PubMed] [Green Version]
  37. Shrestha, U.; Augé, R.M.; Butler, D.M. A meta-analysis of the impact of anaerobic soil disinfestation on pest suppression and yield of horticultural crops. Front. Plant Sci. 2016, 7, 1254. [Google Scholar] [CrossRef] [Green Version]
  38. Butler, D.M.; Kokalis-Burelle, N.; Albano, J.P.; McCollum, T.G.; Muramoto, J.; Shennan, C.; Rosskopf, E.N. Anaerobic soil disinfestation (ASD) combined with soil solarization as a methyl bromide alternative: Vegetable crop performance and soil nutrient dynamics. Plant Soil 2014, 378, 365–381. [Google Scholar] [CrossRef]
  39. Wang, X.Y.; Duan, Y.; Zhang, J.; Ciampitti, I.A.; Cui, J.W.; Qiu, S.J.; Xu, X.P.; Zhao, S.C.; He, P. Response of potato yield, soil chemical and microbial properties to different rotation sequences of green manure-potato cropping in North China. Soil Till. Res. 2022, 217, 105273. [Google Scholar] [CrossRef]
  40. Feng, X.Y.; Wang, Q.L.; Sun, Y.H.; Zhang, S.W.; Wang, F.Y. Microplastics change soil properties, heavy metal availabilit and bacterial community in a Pb-Zncontaminated soil. J. Hazard. Mater. 2022, 424, 127364. [Google Scholar] [CrossRef]
  41. Bauld, J.; Brock, T.D. Ecological studies of Chloroflexis, a gliding photosynthetic bacterium. Arch. Microbiol. 1973, 92, 267–284. [Google Scholar] [CrossRef]
  42. Hausmann, B.; Pelikan, C.; Herbold, C.W.; Köstlbacher, S.; Albertsen, M.; Eichorst, S.A.; Glavina, D.R.T.; Huemer, M.; Nielsen, P.H.; Rattei, T.; et al. Peatland Acidobacteria with a dissimilatory sulfur metabolism. ISME J. 2018, 12, 1729–1742. [Google Scholar] [CrossRef] [PubMed] [Green Version]
  43. Zhao, W.Y.; Deng, J.B.; Chi, S.L.; Wang, W.Z.; Xu, L.S.; Huang, Q.Z.; Zhang, Y.M.; Yu, X.M.; Xu, J.; Chen, Y.C.; et al. Sustainability assessment of topsoil ecology in Chongqing, China based on the application of livestock and poultry manure. J. Clean. Prod. 2022, 358, 131969. [Google Scholar] [CrossRef]
  44. Zampieri, B.D.B.; Pinto, A.B.; Schultz, L.; Oliveira, M.A.D.; Oliveira, A.J.F. Diversity and distribution of heavy metal-resistant bacteria in polluted sediments of the araça bay, são sebastião (SP), and the relationship between heavy metals and organic matter concentrations. Microb. Ecol. 2021, 72, 582–594. [Google Scholar] [CrossRef] [Green Version]
  45. Wolińska, A.; Kuźniar, A.; Zielenkiewicz, U.; Izak, D.; Szafranek-Nakonieczna, A.; Banach, A.; Błaszczyk, M. Bacteroidetes, as a sensitive biological indicator of agricultural soil usage revealed by a culture-independent approach. Appl. Soil Ecol. 2017, 119, 128–137. [Google Scholar] [CrossRef]
  46. Liu, W.R.; Zeng, D.; She, L.; Su, W.X.; He, D.C.; Wu, G.Y.; Ma, X.R.; Jiang, S.; Jiang, C.H.; Ying, G.G. Comparisons of pollution characteristics, emission situations, and mass loads for heavy metals in the manures of different livestock and poultry in China. Sci. Total Environ. 2020, 734, 139023. [Google Scholar] [CrossRef] [PubMed]
Figure 1. Effects of different treatments on the number of Fusarium and Phytophthora species at 10 d (A,B) and 120 d (C,D) after the removal of TIF. Different letters above the columns indicate significant differences between treatments for each trial (p ≤ 0.05). CK = No rice bran or biochar added to the soil and no film applied; ST = Soil covered by TIF without rice bran or biochar; RB10 = 10 t/ha rice bran plus TIF; RB20 = 20 t/ha rice bran plus TIF; BC5 = 5 t/ha biochar plus TIF; BC10 = 10 t/ha biochar plus TIF.
Agriculture 13 01466 g001
Figure 2. Effects of different treatments on the strawberry plant (A) height, (B) stem diameter, and (C) mortality rate, and (D) the strawberry fruit yield. Error bars represent the standard deviation between multiple replicates of the same treatment. Different letters above the columns indicate significant differences between treatments for each trial (p ≤ 0.05). The treatments are described in Figure 1.
Agriculture 13 01466 g002
Figure 3. Alpha diversity of the soil (A,B) bacteria and (C,D) fungi as measured using student’s t-test to evaluate the effects of different treatments: * 0.01 < p ≤ 0.05. The treatments are described in Figure 1.
Agriculture 13 01466 g003
Figure 4. Principal Coordinate Analysis (PCoA) of soil (A) bacterial and (B) fungal communities in different treatments. Venn diagrams of operational taxonomic units (OTU) classification for soil (C) bacterial and (D) fungal communities exposed to different treatments. Different petals represent different treatments, overlapping numbers represent the number of species common to multiple treatments, and non-overlapping numbers represent the number of species unique to the corresponding treatment. The treatments are described in Figure 1.
Agriculture 13 01466 g004
Figure 5. Microbial composition of soil bacterial communities ((A) at phylum level; (C) at genus level) and fungal communities ((B) at phylum level; (D) at genus level) exposed to different treatments. (A,B): the horizontal coordinate is the treatment group, the vertical coordinate is the proportion of species in the treatment, the columns of different colors represent different species, and the length of the columns represents the size of the proportion of species. (C,D): The horizontal coordinate is the processing group, and the vertical coordinate is the species name. The variation in abundance of different species in the sample is shown through the color gradient of the color block. The value represented by the color gradient is shown on the right side of the figure. The treatments are described in Figure 1.
Agriculture 13 01466 g005
Figure 6. LEfSe cladogram analysis of (A) bacterial and (B) fungal communities exposed to different treatments. The figure shows five rings in the cladogram, from inside to outside, representing the phylum, class, order, family, and genus, respectively. The different color nodes (except yellow) on the ring represent significant changes in taxonomic composition due to the treatments. The treatments are described in Figure 1.
Agriculture 13 01466 g006
Figure 7. Heatmap analysis of the correlation between (A) bacterial and (B) fungal communities at the phylum level with soil physicochemical properties (defined in Table 2). Correlation analysis was performed using Spearman’s rank correlation method. Red represents a positive correlation, and blue represents a negative correlation. Significance levels: * p ≤ 0.05, ** p < 0.01. The treatments are described in Figure 1. Abbreviations: AN, NH4+-N; NN, NO3-N; AP, available phosphorus; AK, available potassium; OM, organic matter; EC, electrical conductivity.
Agriculture 13 01466 g007
Table 1. The physicochemical properties of glasshouse soil used for growing strawberries.
Glasshouses SoilSand
%
Clay
%
Silt
%
Ammonium Nitrogen
(mg/kg)
Nitrate Nitrogen
(mg/kg)
Available
Phosphorus
(mg/kg)
Available
Potassium
(mg/kg)
Organic
Matter
(g/kg)
pH
(1:2.5)
Electrical
Conductivity
(μS/cm)
Trial I6033710.4188.41102.3982.823.67.9895.4
Trial II576376.6146.9734.9470.916.97.5954.3
Note: Soil composition was determined by a particle size analyzer. Soil ammonium nitrogen and nitrate nitrogen were extracted with 2 M KCl, available phosphorus was extracted with 0.5 M NaHCO3, and then analyzed by a UV-2600 Spectrophotometer. Available potassium was extracted with 1 M CH3COONH4 and analyzed by an AP1302 flame spectrophotometer. Organic matter was determined by the wet oxidation method. Soil pH and electrical conductivity were measured with a compound electrode (soil/water = 1:2.5).
Table 2. Effects of different treatments on soil physicochemical properties a.
TreatmentAN
(mg/kg)
NN
(mg/kg)
AP
(mg/kg)
AK
(mg/kg)
OM
(g/kg)
pH
(1:2.5)
EC
(μS/cm)
CK6.92 ± 0.40 f282.60 ± 5.44 a944 ± 20.55 a605 ± 29.57 b14.40 ± 0.47 c6.54 ± 0.21 c228 ± 3.06 d
ST12.18 ± 0.60 e87.55 ± 7.39 d882 ± 57.29 ab469 ± 41.68 cd14.58 ± 0.55 c7.41 ± 0.27 ab1142 ± 56.82 b
RB1018.22 ± 0.72 b165.32 ± 12.67 b801 ± 34.64 bc710 ± 57.83 a18.30 ± 1.20 a7.15 ± 0.21 b1372 ± 33.47 a
RB2014.89 ± 0.43 c86.46 ± 7.97 d914 ± 24.34 a408 ± 22.11 de18.22 ± 0.56 a7.38 ± 0.25 ab614 ± 59.02 c
BC513.82 ± 0.44 d138.98 ± 4.10 c669 ± 32.52 d523 ± 41.00 c16.40 ± 0.36 b7.73 ± 0.29 a1338 ± 115.76 a
BC1021.87 ± 0.45 a98.34 ± 2.87 d774 ± 85.91 c381 ± 34.65 e19.52 ± 0.87 a7.22 ± 0.40 ab596 ± 84.07 c
a Abbreviations: AN, NH4+-N; NN, NO3-N; AP, available phosphorus; AK, available potassium; OM, organic matter; EC, electrical conductivity. Means (N = 3) within the same column accompanied by the different letters indicate significant differences between treatments (p ≤ 0.05). CK = No rice bran or biochar added to the soil and no film applied; ST = Soil covered by TIF without rice bran or biochar; RB10 = 10 t/ha rice bran plus TIF; RB20 = 20 t/ha rice bran plus TIF; BC5 = 5 t/ha biochar plus TIF; BC10 = 10 t/ha biochar plus TIF.
Disclaimer/Publisher’s Note: The statements, opinions and data contained in all publications are solely those of the individual author(s) and contributor(s) and not of MDPI and/or the editor(s). MDPI and/or the editor(s) disclaim responsibility for any injury to people or property resulting from any ideas, methods, instructions or products referred to in the content.

