Article

Effect of Agricultural Production Trusteeship on Agricultural Carbon Emission Reduction

1
School of Economics, Shandong University of Finance and Economics, Jinan 250014, China
2
School of Foreign Languages, Shandong University of Finance and Economics, Jinan 250014, China
3
Faculty of Economics, Chiang Mai University, Chiang Mai 50200, Thailand
*
Author to whom correspondence should be addressed.
Agriculture 2023, 13(7), 1457; https://doi.org/10.3390/agriculture13071457
Submission received: 25 June 2023 / Revised: 19 July 2023 / Accepted: 21 July 2023 / Published: 24 July 2023

Abstract

:
Based on the survey data of five large grain-producing provinces in China, this paper studies the effect of agricultural production trusteeship on agricultural carbon emission reduction by using a propensity score matching method. The empirical results show that the carbon emission of wheat reduces by 7.107 kg/mu, with a decrease rate of 15.5% after participating in agricultural production trusteeship. Among them, chemical fertilizers, manpower input, agricultural chemicals and diesel oil, respectively, reduce with rates of 14.2%, 27.7%, 14.1%, and 6%. However, there are differences in the facilitation effects of different trusteeship services, with the best promotion effect of field management services, followed by cultivation, planting and harvest services, and then agricultural material supply services, for which the average treatment effects on treated (ATT) is −6.160, −5.732 and −5.530, respectively. Meanwhile, there are differences in the promotion effects for farm households with different factor endowments. The promotion effect is better for small farm households with one type of agricultural machinery or less, and an operation scale of 7 mu or less. Therefore, in order to better play the role of agricultural production trusteeship in agricultural carbon emission reduction, the government should vigorously support its development and guide more smallholders to choose agricultural production trusteeship.

1. Introduction

While the traditional mode of economic development promotes the high-speed development of China’s economy, it also brings in the serious problem of environmental pollution because of excessive carbon emission [1], which has affected the sustainable development of China’s economy and society and has garnered the government’s high attention [2]. China has been promoting green development with unprecedented determination and strength, and formally put forward the goal of “carbon peak” in 2020. At present, China’s agricultural carbon emission accounts for 16–17% of the national total carbon emission [3], which is higher than that of the world average level. Therefore, in order to achieve the carbon peak target, China should not only focus on lowering industrial carbon emission, but also promote agricultural carbon emission reduction [4].
How can one promote agricultural carbon emission reduction? Some of the studies emphasize the role of the government, believing that the government should increase the intensity and efficiency of its financial support and promote green and low-carbon technologies [5]. Another study proposes to vigorously stimulate the spontaneous power of the agricultural operation entities, emphasizing the promotion of the operation entities’ willingness of green production and use of green production technologies [6,7]. However, due to the farm households’ low willingness and weak capability of adopting green technologies, and due to the insufficient precision of government subsidies [8], it is difficult for the green development of agriculture and it is difficult to “finish the last mile” to bring green technologies into effect. Meanwhile, researchers also find that socialized agricultural service organizations are readier to respond to the government’s green subsidy policy and are willing to adopt the mode of green service. And while they provide services for the agricultural operation entities, they can introduce green technology into agricultural production, alleviating the difficulties of implementing green technologies [9,10].
Existing literature affirms the role of socialized agricultural service in promoting the green development of agriculture. However, can the application of agricultural green technology promote agricultural carbon emission reduction? And what will be the effect? At present, these issues have attracted little concern. In this paper, we will conduct an in-depth study on the effect of agricultural production trusteeship on promoting agriculture carbon emission reduction.
Agricultural production trusteeship specifically refers to a mode of socialized service in which farm households and other entities entrust all or part of operational links in agricultural production to agricultural production service organizations for completion or assistance without transferring their land management rights [11]. It distinguishes itself from other socialized services in that the service is more professional, one-stop and all-inclusive. It has developed into the most important form of socialized service in China. By the end of 2021, the area under agricultural production trusteeship has exceeded 1.67 billion mu in China (in China, the unit of land area in statistics is usually “mu”(1 mu = 666.67 m2), so the land area in this paper is expressed in mu.), with more than 78 million small-scale farm households being served (Ministry of Agriculture and Rural Affairs of the People’s Republic of China: https://baijiahao.baidu.com/s?id=1722458574626137471&wfr=spider&for=pc (accessed on 17 March 2023)). Can this form of socialized service better introduce green production technology into agriculture and promote agricultural carbon emission reduction more comprehensively and efficiently? This paper will study this issue and further explore the heterogeneity of the promotion effect. Then, accordingly, suggestions will be provided in order to better promote agricultural carbon emission reduction.
The chapters of this paper are structured as follows: First, a literature review and the theoretical framework will be presented. This part mainly reviews the definition of carbon sources, measurement of carbon emission, and the relationship between agricultural socialized services and carbon emission reduction. Next, the data sources, measurement model, and variable selection of this paper are introduced. Then, the empirical study is conducted. This section includes the overall promotion and heterogeneous effects of agricultural production trusteeship on agricultural carbon emission reduction. Finally, the study findings are summarized and policy recommendations are provided.

2. Literature Review and Theoretical Framework

2.1. Literature Review

2.1.1. The Definition of Carbon Sources and the Measurement of Carbon Emission

The carbon sources should be first defined in the study of agricultural carbon emission. This paper is concerned with agriculture in a narrow sense, i.e., planting, which generally has three carbon sources: carbon emission from the use of production factors, such as the use of inputs and fossil fuels [12,13]; carbon emission from the production process, such as farming, irrigation and other production operations [14,15]; and carbon emission from agricultural waste treatment, which is mainly caused by the burning of straw [16,17]. Since straw burning is prohibited by law in China, the carbon sources for China’s planting industry roughly include the use of fertilizers, pesticides, diesel oil and manpower in the production process. There are three main ways to measure carbon emission [18]. The intergovernmental panel on climate change method (IPCC) is mainly concerned with measuring the carbon emission of the planting industry and breeding industry, and its calculation is performed according to classifications, with clear items. The input–output (I-O) method is easy to use, but input–output data are not readily available [19,20]. The life cycle analysis method (LCA) is utilized to calculate the carbon emission in the whole cycle of agricultural production, which can give an extensive and comprehensive investigation, but its implementation is complicated [21,22]. In China, agricultural production trusteeship mainly serves field crops, and straw treatment is relatively mature; so, it is not easy to cause obvious post-harvest carbon emission. Therefore, based on the consideration of comprehensiveness and simplicity, the IPCC method is chosen in this paper to calculate the carbon emission of the above four carbon sources.

2.1.2. Relationship between Agricultural Socialized Services and Agricultural Carbon Emission Reduction

Some studies show that socialized agricultural services can reduce the input of chemicals such as fertilizers and pesticides, with the socialized services being accepted by more and more farm households [23,24]. Other studies conclude that the formula fertilization technology can reduce the input of carbon-containing production factors, improve fertilizer utilization and reduce fertilizer consumption [25]. Technologies such as physical and biological prevention and control, as well as unified prevention and control can improve the efficiency and reduce the amount of the pesticides used [26]. Conservation farming technologies have environmental benefits such as reducing greenhouse gas emission and energy consumption [27].

2.1.3. Literature Review and the Main Contributions of This Paper

Some studies have been carried out focusing on the question of “agricultural socialized service promoting agricultural carbon emission reduction”. But, there are still some shortcomings. For example, the existing literature either only unilaterally studies agricultural carbon emission reduction, or only separately studies the impact of socialized services on the adoption of agricultural green technologies. In addition, regarding how to promote agricultural carbon emission reduction through socialized services, previous studies mainly focus on the emission reduction effect of single services on a single carbon source. However, in the face of the new requirements of the goals of carbon peak and the new development of China’s agricultural socialized services, further research has to be conducted.
A more comprehensive and systematic study will be conducted in this paper. The main contributions of this paper include the following: Firstly, we will select a one-stop and all-inclusive form of socialized services, agricultural production trusteeship, and study how it can promote carbon emission reduction from four agricultural carbon sources. Second, we will further examine the heterogeneity of agricultural carbon emission reduction effects from the aspects of different carbon sources, different services and different farm households. Finally, we will propose some public policies to enhance the effectiveness of agricultural production trusteeship in promoting agricultural carbon emission reduction, emphasizing the role of public policies in fostering the transition to sustainability.

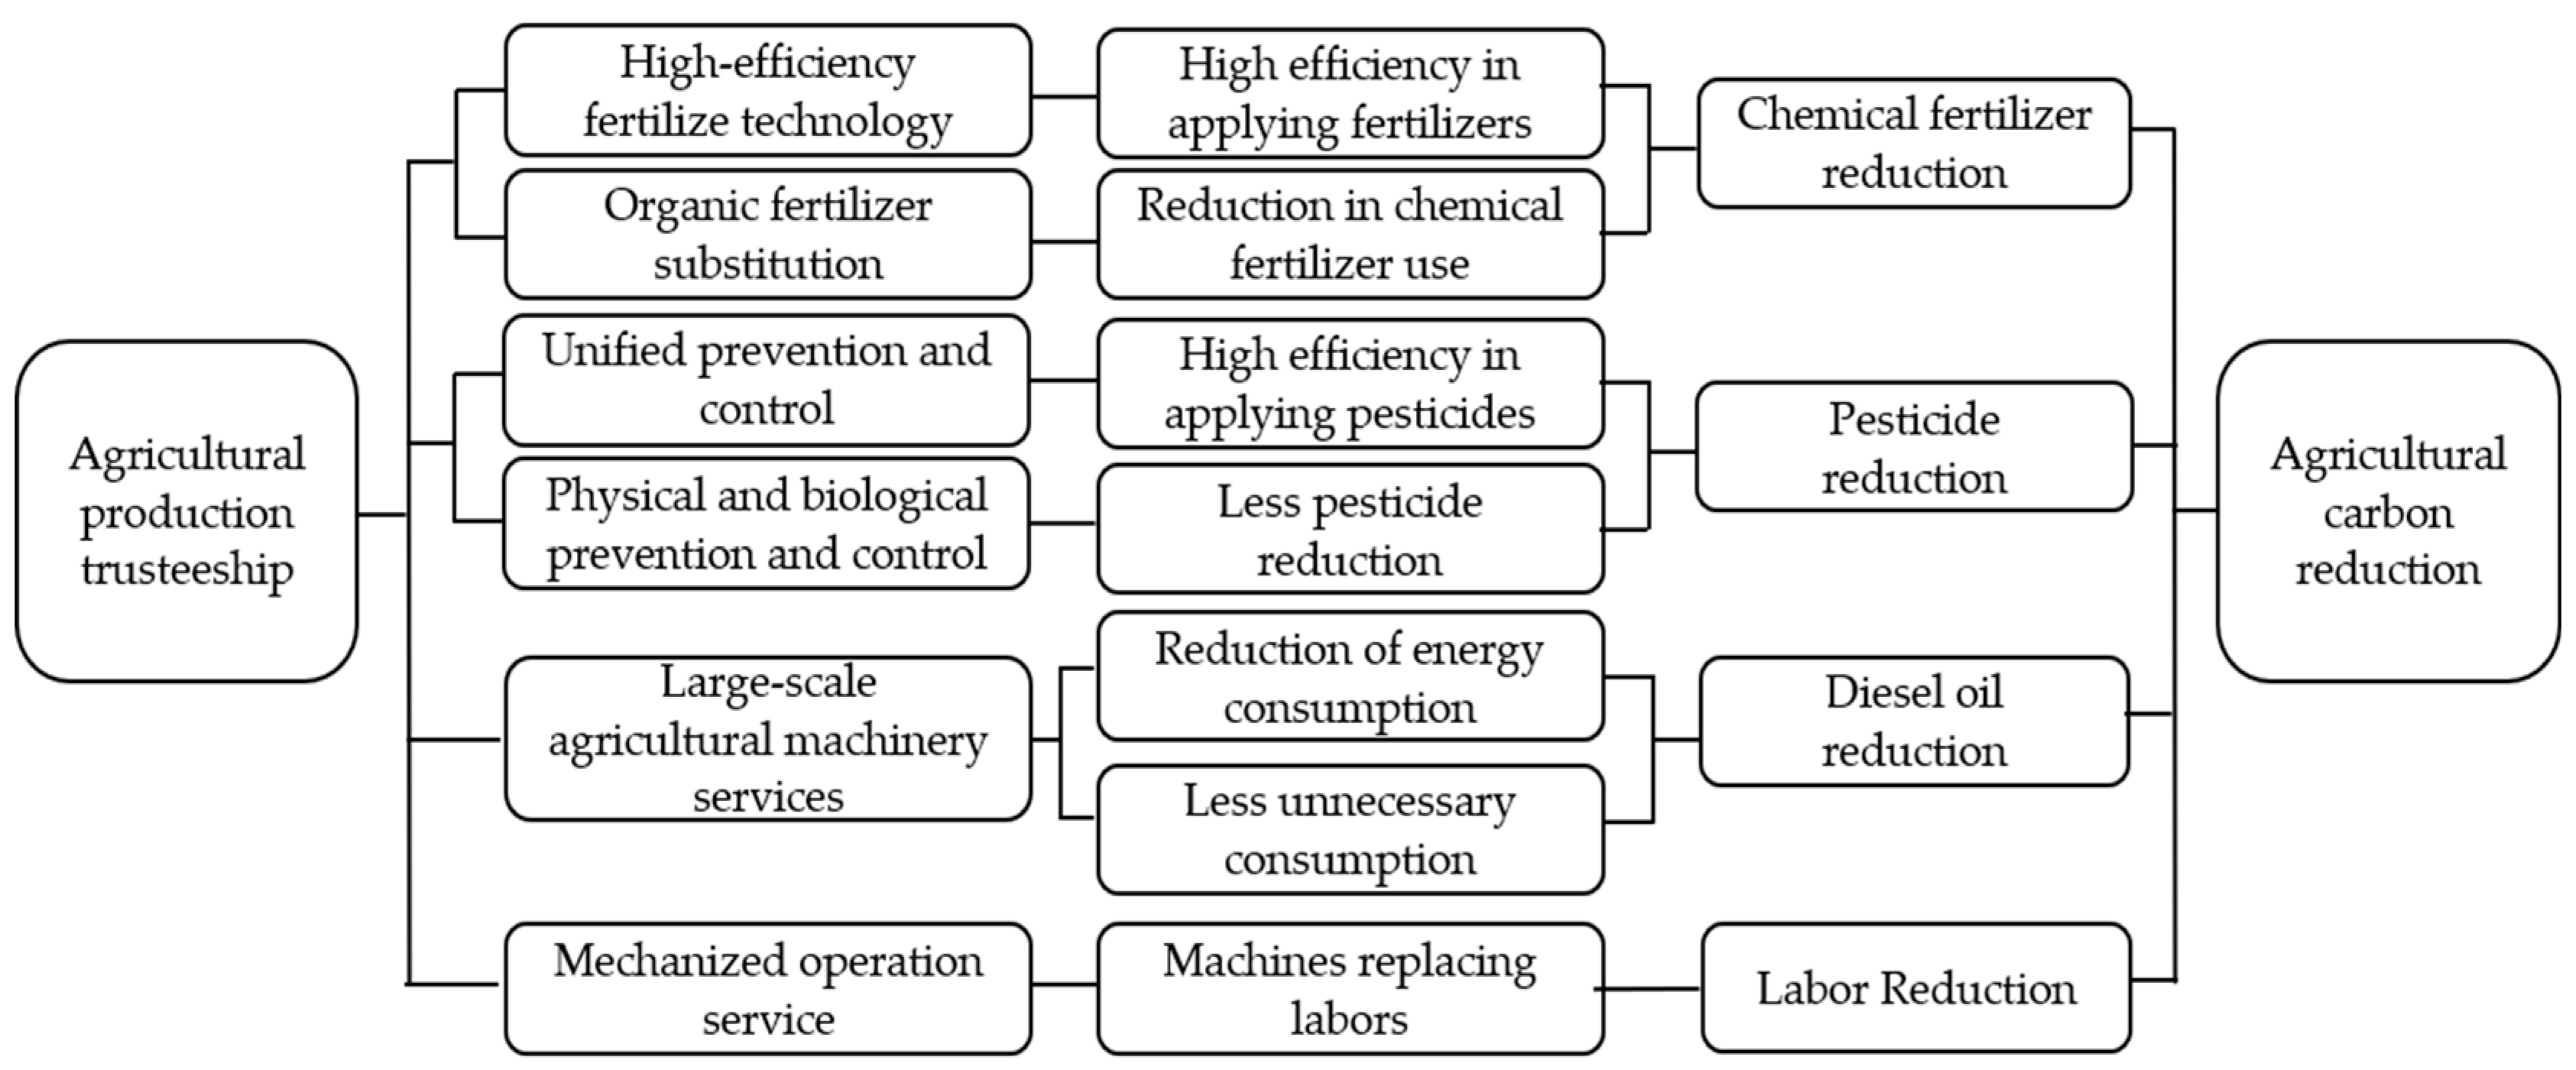
2.2. Theoretical Framework

Agricultural carbon emission mainly comes from agricultural material input, agricultural machinery usage and manpower input in the agricultural production process [28]; so, chemical fertilizers, pesticides, diesel oil and labors are the main carbon sources. Agricultural production trusteeship organizations can adopt green production technologies such as soil testing-based formula fertilization, simultaneous sowing of seeds and fertilizers, deep tillage and deep loosening, and unified prevention and control for agricultural production [29,30,31]. The adoption of green production technologies can not only reduce the amount of the input, but also improve its efficiency [32], thus reducing agricultural carbon emission. The specific framework is shown in Figure 1.

2.2.1. Effect of Chemical Fertilizers Reduction

Agricultural production trusteeship organizations take advantage of their large-scale services to implement precise fertilization using the soil testing-based formula to avoid repeated fertilizer input [25]. At the same time, they can realize simultaneous sowing of seeds and fertilizers through the unified purchase of seeds and fertilizers and the work of large-scale agricultural machinery, so as to reduce fertilizer loss and ensure the slow release of fertilizers, thus reducing fertilizer consumption in the whole production cycle [33]. In addition, they also adopt deep ploughing and deep loosening technology to improve soil fertility; in the selection of fertilizers, organic fertilizer’s long-time effects shall be considered and low pollution shall be selected for as far as possible to reduce the application of chemical fertilizers [34]. Through the use of precise and efficient fertilization technology and the substitution of organic fertilizers, agricultural production trusteeship can effectively reduce the input of chemical fertilizers and reduce the carbon emission generated by the use of chemical fertilizers [35].

2.2.2. Effect of Pesticides Reduction

Trusteeship organizations usually formulate scientific plant-protection schemes according to crop growth conditions and conditions of diseases, pests and weeds. Before problems of diseases, pests and weeds become serious, unified and efficient prevention and control technology will be adopted in order to reduce the use of a large amount of agricultural chemicals [36]. Meanwhile, the united prevention and control measures for adjacent plots reduce the possibility of cross-infection of crops between plots, thus reducing the number of prevention and control and the amount of agricultural chemicals used. In addition, agricultural production trusteeship organizations also use physical prevention and control technologies such as trapping and killing, and biological prevention and control technologies against insects to control diseases and pests safely and efficiently, and meanwhile reduce the use of agricultural chemicals [37,38]. In summary, trusteeship organizations can effectively improve the efficiency of agricultural chemicals use and reduce agricultural chemicals consumption by adopting unified prevention and control technologies, and physical and biological prevention and control technology, thus reducing the carbon emissions caused by the use of agricultural chemicals.

2.2.3. Effect of Diesel Oil Reduction

Because of farm-time constraints and cost-saving motivation, trusteeship organizations usually rely on the advantage of large scale and use large- and medium-sized agricultural machinery. Large- and medium-sized agricultural machinery can reduce diesel consumption per mu of arable land through efficient operation [39]. At the same time, the large-scale agricultural machinery service will greatly reduce the losses of agricultural machinery when transferring from one plot of field to another, and reduce the amount of diesel oil used. In summary, agricultural production trusteeship improves the operation efficiency of agricultural machinery and reduces the transfer losses, so that the diesel consumption per mu of arable land is greatly reduced, and the carbon emission caused by the use of diesel oil is reduced. Of course, the wider use of agricultural machinery can also lead to an increase in diesel consumption, which in turn may weaken the carbon reduction effect of the reduction in diesel consumption per mu [40].

2.2.4. Effect of Manpower Reduction

The foundation and advantage of agricultural production trusteeship is large-area, multi-stage mechanized services, which not only reduce the manual input in individual production stages, but also reduce the stages of manual operation through intelligent and united-operation technologies [41,42]. For example, the mechanized operation service of the ploughing, sowing and harvesting link can greatly reduce the manpower input and thereby reduce the carbon emission of human activities during the farm work.

3. Data Sources, Measurement Model and Variable Selection

3.1. Data Sources

The data used in this paper are from the survey data from wheat growers in Henan, Shandong, Hebei, Anhui and Jiangsu provinces from January to February 2020. Since wheat is the most important grain crop in China, and it is also the most important crop under agricultural production trusteeship services, wheat growers were selected for the research. In 2019, the planting area and yield of wheat in these five provinces accounted for about 72.5% and 80%, respectively, in China (the data are from the statistical yearbooks of Shandong, Hebei, Henan, Anhui, and Jiangsu provinces and from the 2020 National Statistical Yearbook of China), which reflect the basic conditions of wheat planting in China well. At the same time, the development of agricultural production trusteeship in these provinces starts earlier and the development level is higher. Therefore, this paper chose these five provinces for study. The paper adopts a combination of stratified sampling and random sampling methods. In order to make the samples representative of different regional characteristics and different economic levels, we first selected three counties (or cities or districts) in each province where agricultural production trusteeship is developed. Then, from each of the counties (or cities or districts), we further selected three townships (or towns) where agricultural production trusteeship is developed, and then from each of the three townships (or towns), we further again selected two administrative villages where agricultural production trusteeship is developed, and finally from each of the administrative villages 10–18 wheat-growing households were randomly selected. The research was conducted by means of one-to-one interviews with the farm households, with questions in the questionnaires asked and with questionnaires filled in personally by ourselves. The questions included in the questionnaires are related to individual characteristics of the head of a household, family characteristics, household operation characteristics, social relationship characteristics, organizational characteristics, the households’ purchase of agricultural production trusteeship services, etc. After screening and excluding the invalid questionnaires, 1245 questionnaires were obtained, with an effective rate of 92.22%.

3.2. Measurement Model

The farm household’s behavior of purchasing agricultural production trusteeship services is affected by the individual characteristics of the head of the household, the family characteristics of the household and operation characteristics of the household. These characteristics will also affect the carbon emission of agricultural production of the household. Therefore, there exists an endogenous problem in the study of the effect of agricultural production trusteeship on agricultural carbon emission. In addition, before and after the farm households purchase the trusteeship services, the control variables may change, resulting in the control variables being uncontrollable. Therefore, for the farm households who have already purchased the services, their situation before their purchase of the services can only be simulated. In order to solve the above-mentioned problems, this paper will adopt the propensity score matching (PSM) method.
First, estimating propensity score. The decision-making equation of a farm household’s purchasing agricultural production trusteeship services is constructed, and the conditional probability fitting value of the farm household’s purchasing agricultural production trusteeship is taken as a propensity score, and is estimated through a Logit model:
p x i = p D i = 1 x i
where, i represents a different farm household, D i = 1 denotes the farm household i has purchased agricultural production trusteeship services, and x i is a series of control variables that may affect the farm household i ’s purchase of the services.
Second, propensity score matching. After obtaining the propensity score, the sample farm households are divided into the experimental group (the farm households which have purchased the services) and the control group (the farm households who have not purchased the services) by constructing an anti-factual analysis framework. Since the data of the experimental group when they have not purchased the trusteeship services are not measurable, the sample households with similar characteristics are found in the control group by the matching method, and the experimental group and the control group are matched. In order to ensure the robustness of the matching results, five methods, i.e., K-nearest neighbor matching (k = 4), caliper matching, kernel matching, local linear regression matching and spline matching were used to estimate the results.
Third, estimating ATT. After propensity score matching, the average treatment effects (ATT) on the farm households who have purchased the agricultural production trusteeship services are expressed as
A T T = E Y 1 i Y 0 i D i = 1
where Y 1 i represents the carbon emissions of farm household i in the experimental group who has purchased the agricultural production trusteeship services, and Y 0 i represents the carbon emissions of farm household i before purchasing the trusteeship services. The difference between the average treatment effects of the two samples is regarded as the net effect of agricultural production trusteeship on agricultural carbon emission reduction.

3.3. Variable Selection

3.3.1. The Explained Variable

The explained variable is the agricultural carbon emission of farm households in the process of planting wheat, measured by the average carbon emission per mu of wheat. Generally speaking, the carbon emission in wheat production mainly comes from the application of chemical fertilizers and pesticides, the consumption of diesel oil for agricultural machinery, the consumption of electric power for irrigation, manpower input and straw burning. According to the estimation of researchers, in China, the carbon emission of chemical fertilizers accounts for more than 50% of agricultural carbon emission; the carbon emission of diesel oil and pesticides accounts for 20–30%; and the carbon emission caused by irrigation accounts for only 1–2% [43,44]. Therefore, this paper focuses on the carbon emission of chemical fertilizers, pesticides and diesel oil. At the same time, agricultural production trusteeship services can greatly reduce manpower input, so manpower input is also selected as one of the focuses of this research. In addition, in 2021, the returning rate of wheat straw in China was as high as 73.7% (Chinese government website: http://www.gov.cn/xinwen/2022-10/10/content_5717116.htm (assessed on 2 April 2023)), and the returning rate of wheat straw of the sample farm households was more than 95%. Therefore, the carbon emissions caused by straw burning will not be studied in this paper. So, we have focused on the carbon emission caused by chemical fertilizers, pesticides, diesel oil and manpower input, and we have measured the carbon emissions of the four carbon sources by adopting the IPCC method [45], while referring to the carbon emission coefficients issued by various authorities. The calculation formula is as follows:
E = E i = δ i × T i
where, E is the total agricultural carbon emission per mu, E i is the average carbon emission per mu of i agricultural carbon sources, T i is the average consumption per mu of i agricultural carbon sources, and δ i is the carbon emission coefficient of i agricultural carbon sources, as shown in Table 1.

3.3.2. The Core Explanatory Variable

This paper focuses on the promotion effect of agricultural production trusteeship on agricultural carbon emission reduction. Therefore, the purchase of agricultural production trusteeship services is taken as the core explanatory variable. According to the link or content, trusteeship services can be divided into agricultural material supply services, ploughing, sowing and harvesting services, and field management services. In wheat farming, most farm households need agricultural material supply services and ploughing, sowing and harvesting services, which can be purchased from the same trusteeship organization or from multiple trusteeship organizations. Because the trusteeship services emphasize a one-stop and multi-link mode, this paper defines the farm households who have purchased agricultural production trusteeship services as “those who have purchased the services for two or more links from the same trusteeship organization”.

3.3.3. Control Variables

With regard to the factors affecting agricultural carbon emission and the demand of purchasing agricultural production trusteeship, based on the above theoretical analysis and referring to the related research, this paper selected 12 variables from the following five aspects: individual characteristics of the head of a farm household (age and education level), household characteristics (the proportion of grain income, types of agricultural machinery, the number of labor force, and the part-time employment or business conditions), operation characteristics (the scale of operation, degree of land fragmentation, land quality), characteristics of social relations (whether relatives or friends work as civil servants, and whether family member work in agricultural enterprises), and organizational characteristics (join a cooperative or not). The definition and descriptive statistics of all the above 15 variable are each shown in Table 2.

4. Empirical Test on Agricultural Production Trusteeship’s Promoting Effect on Carbon Emission Reduction

4.1. Logit Model Estimation of Farm Households’ Decision-Making in Purchasing Agricultural Production Trusteeship Services

A farm household’s decision-making in purchasing agricultural production trusteeship services is significantly related to the individual characteristics of the head of the household and the family characteristics, the operation characteristics, the characteristics of social relations and the organizational characteristics of the household. As shown in Table 3, there is a significant positive correlation between the purchase of production trusteeship services and the age, the level of education, the part-time employment or business conditions of the head of the household members, whether or not the household has relatives or friends working as civil servants, and whether or not the household has joined a cooperative. And the proportion of grain income, the types of agricultural machinery owned, the number of labor force, the degree of land fragmentation and the land quality negatively affect the household’s behavior of purchasing the trusteeship services.

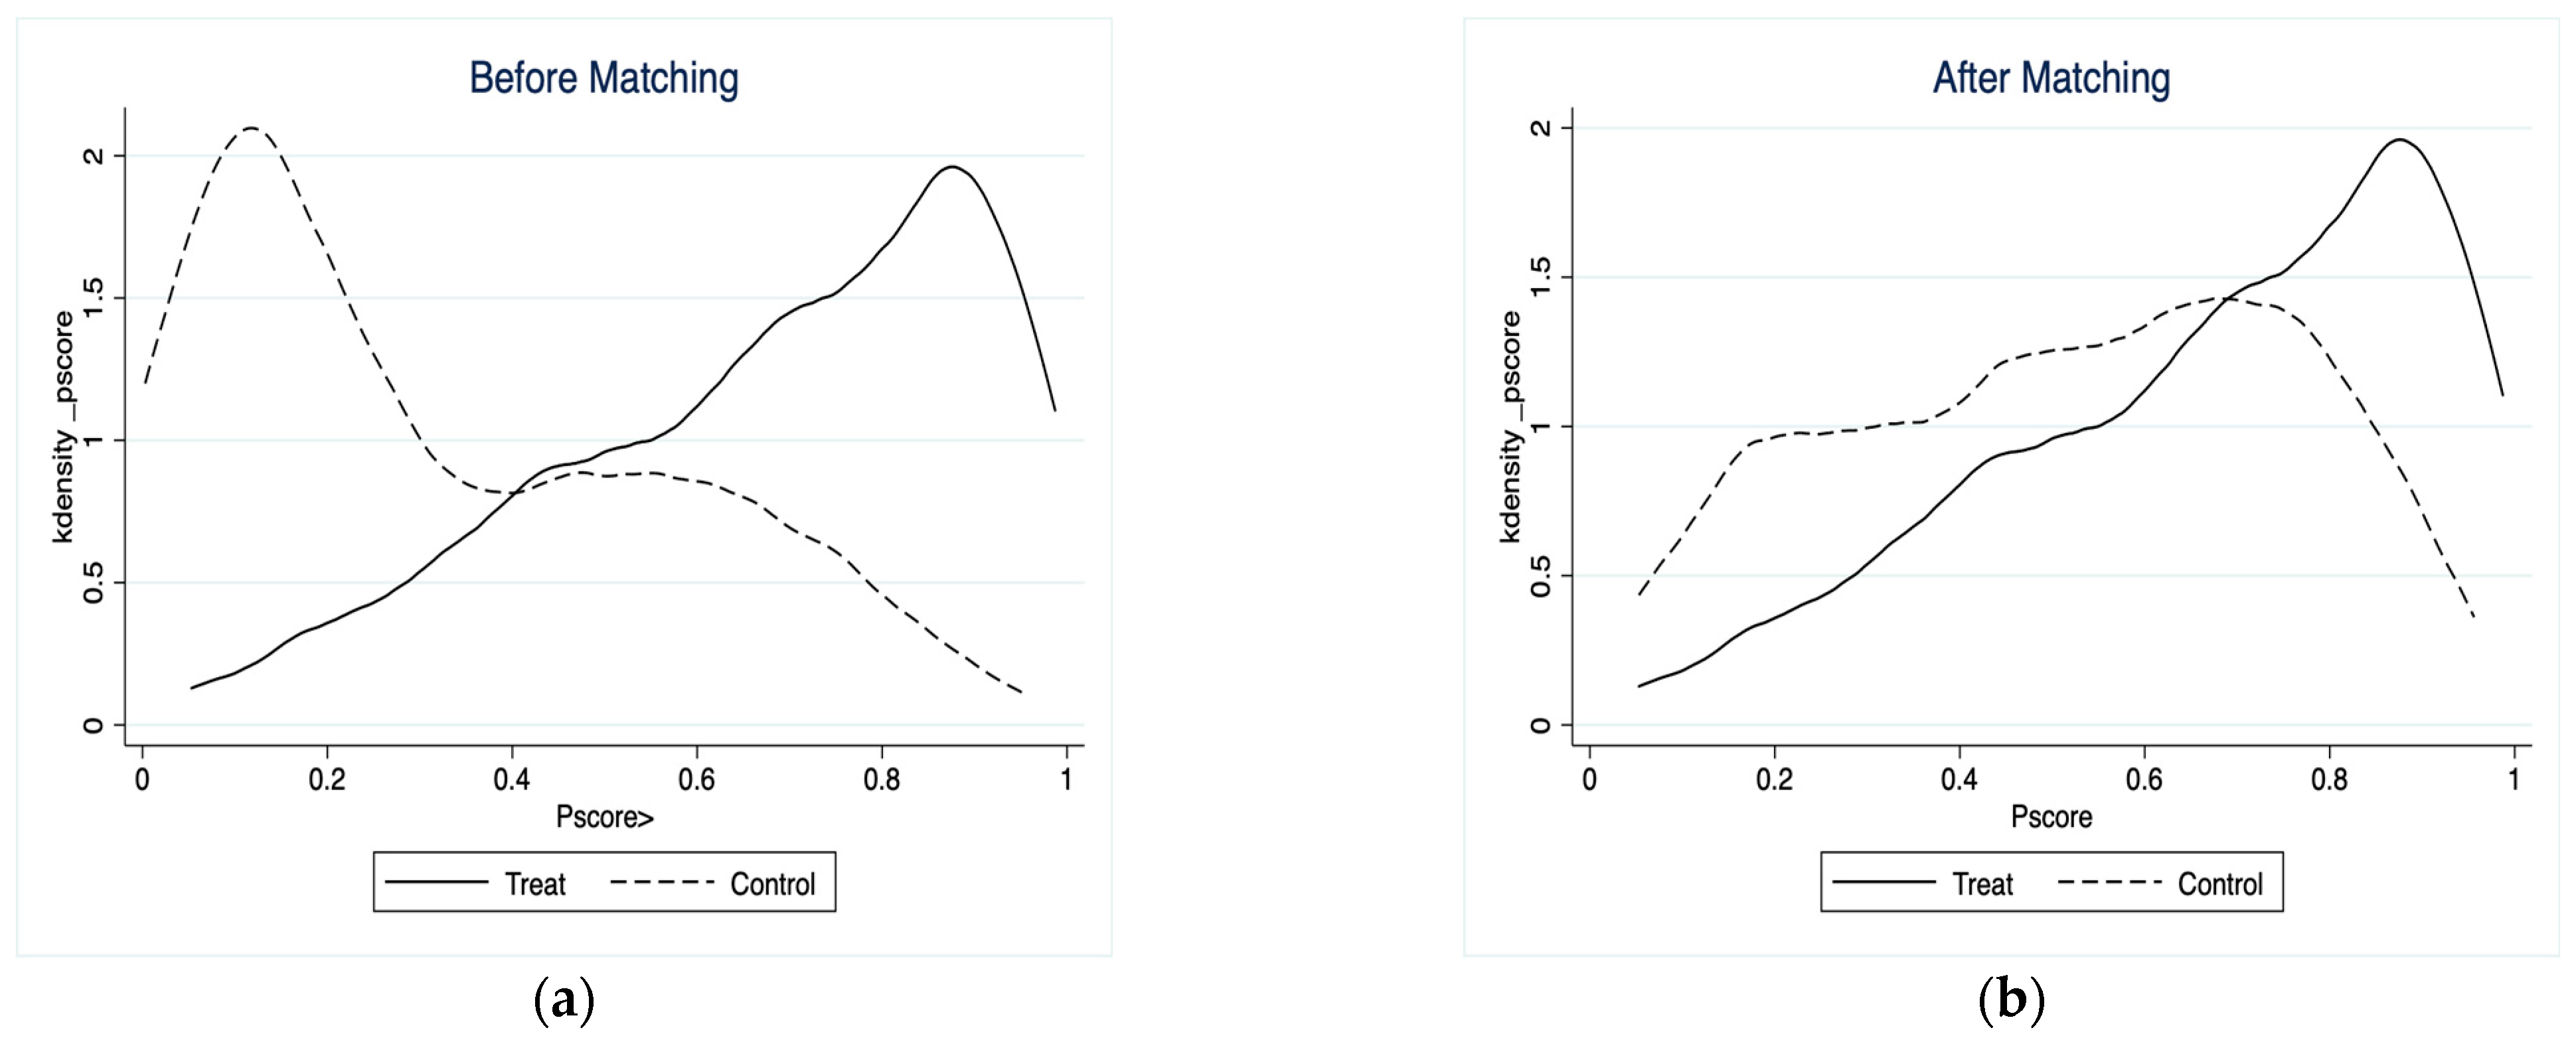
4.2. Common Support Domain and Balance Test

4.2.1. Common Support Domain

In order to ensure sample matching quality, after obtaining the propensity score of a farm household’s decision of purchasing agricultural production trusteeship services, it is necessary to further discuss the common support domain after sample matching. As shown in Figure 2a, the overlapping area between the experimental group and the control group before matching is small. After matching, as shown in Figure 2b, the overlapping area of the probability distribution of the experimental group and the control group propensity matching score becomes larger, and the peak value of the control group moves backward, and the difference between the two groups is significantly smaller. After matching, nine samples are lost, including two in the experimental group and seven in the control group. The loss rate is only 0.7% and the matching effect is ideal.

4.2.2. Balance Test

When the sample matching is completed, the statistical significance of the differences of the control variables between the experimental group and the control group shall be further verified by the balance test. The results are shown in Table 4. The mean deviation of the control variables before matching is 26.8% and it decreased to 3.6–5.7% after matching. The median deviation also decreased from 16.6% before matching to 3.4–4.0% after matching. In addition, the p-value indicates that the significance test of the control variables is significant before matching, but the sample is rejected with high probability after matching. Furthermore, the Pseudo value decreased from 0.228 before matching to 0.004–0.010 after matching. The above results show that the differences of the control variables between the experimental group and the control group decrease significantly and the model matching results are ideal.

4.3. The Test of Agricultural Production Trusteeship’s Effect on Promoting Agricultural Carbon Emission Reduction

4.3.1. Overall Effect of Agricultural Production Trusteeship on Promoting Agricultural Carbon Emission Reduction

In order to ensure the robustness of regression results, five matching methods, i.e., K-nearest neighbor matching (k = 4), caliper matching, kernel matching, local linear regression matching and spline matching were adopted to calculate the ATTs to quantify the effect of agricultural production trusteeship on agricultural carbon emission reduction. As shown in Table 5, all five matching methods demonstrate that the effect of agricultural production trusteeship on agricultural carbon reduction is significant.
In terms of the overall effect, the total carbon emission of the farm households who have purchased the trusteeship services is about 38.785 kg/mu. Compared with before they purchase the trusteeship services, the carbon emission of wheat after they purchase the services is reduced by 7.107 kg/mu, with a carbon emission reduction range of 15.5%. The above conclusions are in good agreement with other relevant studies. Some researchers found that the use of no-tillage technology, organic-fertilizer-application technology and straw-returning technology of the farm households who have purchased socialized services is 10–15 percent higher than that of those who have not [39]. In addition, it has also been documented that conservation-tillage technology is beneficial in reducing agricultural carbon emission, and after adopting the technology, the greenhouse gas emission of winter wheat in Canadian experimental fields in normal years was 577 kg/ha (38.5 kg/mu) [46]. After receiving the trusteeship services, the carbon emission of winter wheat in China was 581.77 kg/ha (38.8 kg/mu) in this study, which is consistent with the above comparative analysis.

4.3.2. Effect of Agricultural Production Trusteeship on Promoting Carbon Emission Reduction of Different Carbon Sources

At the same time, it is found in this study that the effects of agricultural production trusteeship services on the emission reduction of different carbon sources are different. As shown in Table 6, the carbon emission generated by chemical fertilizers, manpower input, agricultural chemicals and diesel oil was reduced by 4.506 kg/mu, 2.012 kg/mu, 0.307 kg/mu and 0.282 kg/mu, respectively, with decrease rates of about 14.2%, 27.7%, 14.1%, and 6%, respectively. In terms of absolute reduction quantity and magnitude, agricultural production trusteeship has the best effect on promoting carbon emission reduction through chemical fertilizer reduction and manpower replacement, and its effect through agricultural chemicals reduction is the second best, but the reduction still reaches 14%; the carbon emission reduction effect through diesel reduction is relatively insignificant. The reason is that in the aspect of chemical fertilizers, the use of the technologies of precision fertilization and conservation tillage can greatly reduce the use of chemical fertilizers. In addition, the carbon emission coefficient of chemical fertilizers is relatively high, so the effect of promoting agricultural carbon emission reduction through chemical fertilizer reduction is the best. In terms of manpower input, the trusteeship organizations greatly reduce the manpower input through mechanized operation, and the carbon emission can be reduced by 10.5 kg for the reduction of each labor force; so, the carbon emission reduction effect through manpower replacement is also significant. In terms of agricultural chemicals, the amount of agricultural chemicals used in wheat planting is relatively small, and the absolute amount of carbon emission reduction is small. However, the application of agricultural chemicals can be greatly reduced by the technology of unified prevention and control; so, the emission reduction magnitude can still reach 14.1%, which is the same as that through chemical fertilizer reduction. Under the aspect of diesel oil, large-scale mechanical operation is beneficial for reducing the diesel consumption per unit of arable land, but the expansion of mechanized operation area will increase diesel consumption; so, its effect of reducing agricultural carbon emission is not obvious.
Other researchers have conducted relevant studies. Fabbri et al. [47] found that precision fertilization can reduce nitrogen application by about 75%; Cillis et al. [48] showed that conservation tillage can reduce CO2 emission by about 56% compared with conventional tillage; Pretty and Bharucha [49] observed that comprehensive pest management projects can reduce pesticide use to 30.7%. The results of this study show that the best way for agricultural production trusteeships to reduce carbon emission is by reducing the use of fertilizers, and the second-best way is by reducing the use of agricultural chemicals. These results are in good agreement with the results above. However, researchers have focused less on the relationships between mechanized operation, diesel consumption and carbon reduction. The reason may be that, in reality, it is difficult to reduce agricultural carbon emission by reducing diesel fuel while advancing mechanized operations. This research confirms that the effect of the trusteeship service on agricultural carbon emission reduction through diesel reduction is not obvious, which also gives reason for the limited relevant research.
The main contributions of this research are as follows: The main research line of this paper is “agricultural production trusteeship services—application of green production technologies—agricultural carbon emission reduction”, while the previous studies mainly focus on the theme of “agricultural socialized services—application of green production technologies” or “application of green production technologies—agricultural carbon emission reduction”. Besides integrating these related problems in theory, more importantly, this study has more practical significance for China. The reason is that small-sale farm households are still the main agricultural operation body in China, managing 71.4% of China’s arable land (China’s Third Agricultural Census, http://www.stats.gov.cn/sj/pcsj/nypc/202302/U020230223531273769774.pdf (assessed on 17 March 2023)). This situation is difficult for implementing green production technology. However, agricultural production trusteeship services have driven more than 78 million small-scale farm households to engage in agricultural green production in China. Therefore, it is easier to find an effective way of achieving China’s agricultural carbon emission reduction by studying along the main line of “agricultural production trusteeship services—application of green production technologies—agricultural carbon emission reduction”. With regard to manpower input, there are comparatively less studies on the effect of agricultural production trusteeship services on agricultural carbon emission from the perspective of manpower replacement. The core of agricultural production trusteeship services is the massive substitution of manpower input by mechanized operation. Therefore, the reduction of manpower input has become a main way for agricultural production trusteeships to promote carbon emission reduction. This paper has proved the validity of this way, which is another contribution of this paper.

4.4. Heterogeneity of the Effect of Agricultural Production Trusteeship on Promoting Agricultural Carbon Emission Reduction

4.4.1. Heterogeneity of Carbon Emission Reduction Effect on Different Production Links

As shown in Table 7, after farm households’ purchasing of the field management services, the carbon emission of wheat planting was reduced by 6.16 kg/mu, with an average decrease of 13.9%; after farm households’ purchasing agricultural materials supply services and ploughing, sowing and harvesting services, the carbon emission from wheat planting was reduced by about 5 kg/mu, with a decrease of about 12%. It can be seen that the field management services have the most significant effect on the agricultural carbon emission reduction, followed by ploughing, sowing, and harvesting and agricultural material supply services.
The reason for this is that in the field management link, soil testing-based formula fertilization services and unified prevention and control services can improve the efficiency of fertilization and agricultural chemical application, and reduce the consumption of chemical fertilizers and agricultural chemicals. Meanwhile, the enlargement of service scale can also reduce diesel consumption and manpower input, resulting in a better overall carbon emission reduction effect. In the ploughing, sowing and harvesting link, trusteeship organizations mainly provide efficient mechanized services, which will reduce the average diesel consumption and manpower input. However, considering that the increase of the number of mechanized services and the expansion of service area may cause the increase of diesel consumption, the effect of promoting carbon emission reduction will be reduced. In the agricultural material supply link, service organizations can achieve a certain carbon emission reduction effect by providing organic fertilizers and pesticides. In summary, field management services run through the whole cycle of crop growth, which has a great impact on the carbon emission of the four carbon sources; in the ploughing, sowing and harvesting link, it is mainly through reducing diesel oil and manpower input that carbon emission reduction is achieved; and in the agricultural material supply link, carbon emission reduction is reduced through chemical fertilizer and agricultural chemical reduction. The different carbon sources and the different degree of carbon emission reduction of the three links lead to the heterogeneity of the effect on carbon emission reduction.
Many researchers studied carbon emission reduction in a single link. Fan et al. [5] found that soil nutrient management can improve fertilizer productivity by 10.5–18.5%, thereby reducing the input of fertilizers; Brown et al. [50] found that the combination of precision agriculture and the use of agricultural machinery can reduce the input of chemicals by 6.94–10.55%; Naher et al. [51] found that the application of bio-organic fertilizers in rice production can reduce synthetic nitrogen emission by 30%. The research of the above researchers confirmed that green services in different links have the effect of carbon emission reduction, which is consistent with our research results. However, for the rarely studied heterogeneity of the effects of carbon emission reduction in different production links, this paper not only studies the carbon emission reduction effect in different links separately, but also makes a comparative study on the different links.

4.4.2. Heterogeneity of the Carbon Emission Reduction Effects of the Farm Households with Different Factor Endowments

The effect of agricultural production trusteeship on carbon emission reduction for farm households with different factor endowments is also different. This paper will examine the heterogeneity of the carbon emission reduction effect of agricultural production trusteeship in terms of capital and land.
  • Impact of agricultural production trusteeship on carbon emission reduction for the farm households with different capital endowment
Agricultural capital endowment is mainly reflected in agricultural machinery ownership. This paper uses “types of agricultural machinery owned” to measure the capital endowment of the farm households. Taking the ownership of one type of agricultural machinery as the criterion, we divide the farm households into two groups (According to our investigation, for most farm households who have no or only one type of agricultural machinery, which are generally for transportation, there are no great differences in their agricultural production and the farm households with more than one type of agricultural machinery have certain self-service ability. So this research takes the ownership of one type of agricultural machinery as the criterion for grouping samples.). It can be seen from Table 8 that the carbon emission for the farm households equipped with a type of agricultural machinery has been reduced by 7.102 kg/mu after they have purchased the trusteeship services, while the carbon emission for the farm households with more than one type of agricultural machinery has been reduced by 6.627 kg/mu after they have purchased the trusteeship services, which indicates that the promotion effect of the reduction in carbon emissions of the trusteeship services for capital-poor agricultural households is better. The possible reasons are as follows: farm households possessing less agricultural machinery have purchased trusteeship services in more links; farm households owning more types of agricultural machinery have purchased less trusteeship services; in addition, the energy consumption of household-owned agricultural machinery is usually high due to out-of-date functions and low efficiency. Therefore, compared with the farm households with more types of agricultural machinery, trusteeship services have a better emission reduction effect for those with less types of agricultural machinery.
This aspect also studied by other researchers. For example, Qing et al. [39] found that the adoption rates of no-tillage technology, organic fertilizer application technology and straw returning technology by the farm households after they have purchased machinery outsourcing services have increased by about 10.6%, 14.5% and 12%, respectively, compared with when they did not purchase the services. These studies confirm that farm households are more inclined to adopt green production technology after purchasing machinery outsourcing services. This is also largely the same as the results of this study. In addition to this, we further study the carbon emission reduction effect of trusteeship services for the farm households with different capital endowments.
2.
Impact of agricultural production trusteeship on carbon emission reduction for the farm households with different land endowments
In this paper, the median of the farm households’ operation scale (7 mu) is taken as the basis of grouping, since the households’ land endowments are mainly reflected in their operation scale. As shown in Table 8, the carbon emission reduction effect of agricultural production trusteeship services for the farm households with the operation scale of less than 7 mu is better than that of those with the scale of 7 mu and above. The carbon emission reduction amount of the former is 0.88 kg higher than that of the latter. That is to say, the carbon emission reduction effect of the agricultural production trusteeship services on the farm households with a smaller operation scale is better than those with a larger scale. The main reasons are as follows: for large-scale farm households, the use efficiency of the agricultural materials and agricultural machinery and the adoption rate of the green production technologies are relatively high; even if they do not purchase trusteeship services, carbon emission is relatively low. Therefore, the carbon reduction room is relatively small for large-scale farm households, although their purchase of the trusteeship services will further reduce their agricultural carbon emission. For small-scale farm households, before their purchasing of trusteeship services, the use efficiency of the agricultural materials and agricultural machinery, and the adoption rate of the green production technologies are relatively low; so, their agricultural carbon emission level is high and their carbon emission reduction scale is large after their purchasing of the trusteeship services; so, the emission reduction effect of the services on them is more obvious.
There are researchers who studied the carbon emission of the farms of different sizes. Pishgar-Komleh et al. [52] found that the energy (diesel, fertilizers, agricultural chemicals, etc.) consumption of large-size farms in potato planting is 4–14% lower than that of small- and medium-size farms; Wu et al. [53] found that every 1% increase in farm size can reduce the use of herbicides by 1.8%, and can reduce the use of fertilizers and agricultural chemicals by 0.3%. The above researches proved that the larger the farm size, the less average agricultural input or average energy consumption, which is consistent with the conclusion of this paper. On this basis, this paper further compares and studies the effect of trusteeship services on the carbon emission reduction of the farm households of different operation scales, and finds that the promotion effect on the carbon emission reduction of the small-scale farm households is better.

5. Conclusions and Implications

5.1. Conclusions

Based on the survey data of 1245 wheat growers in the five provinces, Shandong, Hebei, Anhui, Jiangsu and Henan, this paper studied the overall effect of agricultural production trusteeship on agricultural carbon emission reduction using the PSM method. The differences of carbon emission reduction effect of the trusteeship services were analyzed from three aspects: carbon sources, trusteeship links, and factor endowments of the farm households. According to our research, trusteeship services generally contribute to agricultural carbon emission reduction; meanwhile, there are differences in emission reduction effect. The absolute amount of carbon emission reduction of the fertilizers is the largest, and the carbon emission reduction magnitude of the manpower input is the largest; the carbon emission reduction effect of the field management link is the best, followed by the ploughing, sowing and harvesting link and agricultural material supply link, with their emission reduction magnitude also more than 10%; from the aspect of the farm households, trusteeship services have a larger promotion effect on carbon emission reduction for the farm households with less types of agricultural machinery and a small operation scale.

5.2. Implications

The above results show that agricultural production trusteeship can effectively reduce agricultural carbon emission and help achieve carbon emission reduction targets. In the transition to sustainability, special emphasis should be placed on the role of public policy in the mechanism of “agricultural production trusteeship services—application of green production technologies—agricultural carbon emission reduction”. Therefore, this paper will provide some suggestions from the perspective of public policy and business management.
Firstly, the government should vigorously support the development of agricultural production trusteeship services, and give it the necessary policy and financial support, especially in the purchase of agricultural machinery, in the supply of green agricultural materials and in the promotion of green production technology. Specifically with regard to the promotion of green production technologies, the government should actively guide trusteeship organizations to provide green services with good effects in carbon emission reduction, such as soil testing-based formula fertilization and unified prevention and control services. Secondly, the trusteeship organizations should improve agricultural green production technologies, enhance the capacity of green services, especially the green services with a better effect on carbon emission reduction. At the same time, the trusteeship organizations should also focus on the real needs of the farmers and provide more precise services. In addition, more attention should be paid to the needs of the small-scale farm households and guiding more of them to choose agricultural production trusteeships. For them, the concept of green production should be established, and the resources provided by the government and agricultural trusteeship organizations should be fully utilized to carry out green and low-carbon production.

Author Contributions

Conceptualization, X.S. and S.G.; methodology, X.S., S.G. and J.C.; software, S.G. and J.C.; validation, X.S. and J.C.; formal analysis, J.L. and S.S.; investigation, X.S., S.G. and J.C.; resources, J.L.; data curation, S.G. and J.C.; writing—original draft preparation, X.S.; writing—review and editing, F.Z.; visualization, S.G. and J.C.; supervision, X.S. and J.L.; project administration, X.S.; funding acquisition, X.S. All authors have read and agreed to the published version of the manuscript.

Funding

This research was funded by Shandong Provincial Office for Philosophy and Social Sciences, under the Key Project of Social Science Planning of Shandong Province, China, grant number 22BJJJ02.

Institutional Review Board Statement

Not applicable.

Data Availability Statement

All data can be obtained by email from the corresponding author.

Conflicts of Interest

The authors declare no conflict of interest.

References

  1. Huang, R.J.; Zhang, Y.; Bozzetti, C.; Ho, K.F.; Cao, J.J.; Han, Y.; Daellenbach, K.R.; Slowik, J.G.; Platt, S.M.; Canonaco, F.; et al. High secondary aerosol contribution to particulate pollution during haze events in China. Nature 2014, 514, 218–222. [Google Scholar] [CrossRef] [Green Version]
  2. Zheng, H.; Ma, J.; Yao, Z.; Hu, F. How Does Social Embeddedness Affect Farmers’ Adoption Behavior of Low-Carbon Agricultural Technology? Evidence From Jiangsu Province, China. Front. Environ. Sci. 2022, 10, 909803. [Google Scholar] [CrossRef]
  3. Huang, X.; Xu, X.; Wang, Q.; Zhang, L.; Gao, X.; Chen, L. Assessment of Agricultural Carbon Emissions and Their Spatiotemporal Changes in China, 1997–2016. Int. J. Environ. Res. Public Health 2019, 16, 3105. [Google Scholar] [CrossRef] [PubMed] [Green Version]
  4. Zhang, X.; Wang, C.; Liu, X.; Wu, J. Tax pressure, farmland management, and agricultural carbon abatement: Empirical evidence from tax-and-fees reform in rural China. Front. Environ. Sci. 2022, 10, 1037248. [Google Scholar] [CrossRef]
  5. Fan, M.; Shen, J.; Yuan, L.; Jiang, R.; Chen, X.; Davies, W.J.; Zhang, F. Improving crop productivity and resource use efficiency to ensure food security and environmental quality in China. J. Exp. Bot. 2012, 63, 13–24. [Google Scholar] [CrossRef] [PubMed]
  6. Du, K.; Li, J. Towards a green world: How do green technology innovations affect total-factor carbon productivity. Energy Policy 2019, 131, 240–250. [Google Scholar] [CrossRef]
  7. He, P.; Zhang, J.; Li, W. The role of agricultural green production technologies in improving low-carbon efficiency in China: Necessary but not effective. J. Environ. Manag. 2021, 293, 112837. [Google Scholar] [CrossRef]
  8. Rigg, J.; Salamanca, A.; Phongsiri, M.; Sripun, M. More farmers, less farming? Understanding the truncated agrarian transition in Thailand. World Dev. 2018, 107, 327–337. [Google Scholar] [CrossRef]
  9. Manda, J.; Khonje, M.G.; Alene, A.D.; Tufa, A.H.; Abdoulaye, T.; Mutenje, M.; Setimela, P.; Manyong, V. Does cooperative membership increase and accelerate agricultural technology adoption? Empirical evidence from Zambia. Technol. Forecast. Soc. Chang. 2020, 158, 120160. [Google Scholar] [CrossRef]
  10. Mao, H.; Zhou, L.; Ying, R.; Pan, D. Time Preferences and green agricultural technology adoption: Field evidence from rice farmers in China. Land Use Policy 2021, 109, 105627. [Google Scholar] [CrossRef]
  11. Ma, L.; Wang, Y.; Teng, Y. Evolutionary game analysis of stakeholders under the whole process trusteeship mode of agricultural production. Kybernetes 2022, 51, 2877–2901. [Google Scholar] [CrossRef]
  12. West, T.O.; Marland, G. A synthesis of carbon sequestration, carbon emissions, and net carbon flux in agriculture: Comparing tillage practices in the United States. Agric. Ecosyst. Environ. 2002, 91, 217–232. [Google Scholar] [CrossRef]
  13. Wang, R.; Zhang, Y.; Zou, C. How does agricultural specialization affect carbon emissions in China? J. Clean. Prod. 2022, 370, 133463. [Google Scholar] [CrossRef]
  14. Boeckx, P.; Van Nieuland, K.; Van Cleemput, O. Short-term effect of tillage intensity on N2O and CO2 emissions. Agron. Sustain. Dev. 2011, 31, 453–461. [Google Scholar] [CrossRef] [Green Version]
  15. Zou, X.; Li, Y.E.; Li, K.; Cremades, R.; Gao, Q.; Wan, Y.; Qin, X. Greenhouse gas emissions from agricultural irrigation in China. Mitig. Adapt. Strateg. Glob. Change 2013, 20, 295–315. [Google Scholar] [CrossRef] [Green Version]
  16. Johnson, J.M.; Franzluebbers, A.J.; Weyers, S.L.; Reicosky, D.C. Agricultural opportunities to mitigate greenhouse gas emissions. Environ. Pollut. 2007, 150, 107–124. [Google Scholar] [CrossRef]
  17. Yu, L.; Liu, S.; Wang, F.; Liu, Y.; Liu, H.; Wang, Q.; Tran, L.S.P.; Dong, Y.; Li, W. Strategies for agricultural production management based on land, water and carbon footprints on the Qinghai-Tibet Plateau. J. Clean. Prod. 2022, 362, 132563. [Google Scholar] [CrossRef]
  18. Pandey, D.; Agrawal, M.; Pandey, J.S. Carbon footprint: Current methods of estimation. Environ. Monit. Assess. 2011, 178, 135–160. [Google Scholar] [CrossRef] [PubMed]
  19. Dong, G.; Mao, X.; Zhou, J.; Zeng, A. Carbon footprint accounting and dynamics and the driving forces of agricultural production in Zhejiang Province, China. Ecol. Econ. 2013, 91, 38–47. [Google Scholar] [CrossRef]
  20. Su, B.; Ang, B.W.; Li, Y. Input-output and structural decomposition analysis of Singapore’s carbon emissions. Energy Policy 2017, 105, 484–492. [Google Scholar] [CrossRef]
  21. Brentrup, F.; Küsters, J.; Kuhlmann, H.; Lammel, J. Environmental impact assessment of agricultural production systems using the life cycle assessment methodology. Eur. J. Agron. 2004, 20, 247–264. [Google Scholar] [CrossRef]
  22. Weber, C.L.; Matthews, H.S. Quantifying the global and distributional aspects of American household carbon footprint. Ecol. Econ. 2008, 66, 379–391. [Google Scholar] [CrossRef]
  23. Hamilton, J.; Sidebottom, J. Mountain Pesticide Education and Safety Outreach program: A model for community collaboration to enhance on-farm safety and health. N. C. Med. J. 2011, 72, 471–473. [Google Scholar] [CrossRef] [PubMed]
  24. Zhang, S.; Sun, Z.; Ma, W.; Valentinov, V. The effect of cooperative membership on agricultural technology adoption in Sichuan, China. China Econ. Rev. 2020, 62, 101334. [Google Scholar] [CrossRef]
  25. Micha, E.; Tsakiridis, A.; Ragkos, A.; Buckley, C. Assessing the effect of soil testing on chemical fertilizer use intensity: An empirical analysis of phosphorus fertilizer demand by Irish dairy farmers. J. Rural Stud. 2023, 97, 186–191. [Google Scholar] [CrossRef]
  26. Ehler, L.E. Integrated pest management (IPM): Definition, historical development and implementation, and the other IPM. Pest. Manag. Sci. 2006, 62, 787–789. [Google Scholar] [CrossRef] [PubMed]
  27. Małgorzata, H.; Kowalska, J.; Jakubowska, M. Reducing Carbon Footprint of Agriculture—Can Organic Farming Help to Mitigate Climate Change? Agriculture 2022, 12, 1383. [Google Scholar] [CrossRef]
  28. Wang, Y.; Yang, J.; Duan, C. Research on the Spatial-Temporal Patterns of Carbon Effects and Carbon-Emission Reduction Strategies for Farmland in China. Sustainability 2023, 15, 10314. [Google Scholar] [CrossRef]
  29. Alam, M.Z.; Crump, A.R.; Haque, M.M.; Islam, M.S.; Hossain, E.; Hasan, S.B.; Hasan, S.B.; Hossain, M.S. Effects of Integrated Pest Management on Pest Damage and Yield Components in a Rice Agro-Ecosystem in the Barisal Region of Bangladesh. Front. Environ. Sci. 2016, 4, 22. [Google Scholar] [CrossRef] [Green Version]
  30. Midingoyi, S.K.G.; Kassie, M.; Muriithi, B.; Diiro, G.; Ekesi, S. Do Farmers and the Environment Benefit from Adopting Integrated Pest Management Practices? Evidence from Kenya. J. Agric. Econ. 2018, 70, 452–470. [Google Scholar] [CrossRef]
  31. Wu, F.; Zhai, L.; Xu, P.; Zhang, Z.B.; Baillo, E.H.; Tolosa, L.N.; Kimotho, R.N.; Jia, X.L.; Guo, H.Q. Effects of deep vertical rotary tillage on the grain yield and resource use efficiency of winter wheat in the Huang-Huai-Hai Plain of China. J. Integr. Agric. 2021, 20, 593–605. [Google Scholar] [CrossRef]
  32. Adnan, N.; Nordin, S.M.; Bahruddin, M.A.; Tareq, A.H. A state-of-the-art review on facilitating sustainable agriculture through green fertilizer technology adoption: Assessing farmers behavior. Trends Food Sci. Technol. 2019, 86, 439–452. [Google Scholar] [CrossRef]
  33. Macintosh, K.A.; Chin, J.; Jacobs, B.; Cordell, D.; McDowell, R.W.; Butler, P.; Haygarth, P.M.; Williams, P.; Quinn, J.P.; O’Flaherty, V.; et al. Transforming phosphorus use on the island of Ireland: A model for a sustainable system. Sci. Total Environ. 2019, 656, 852–861. [Google Scholar] [CrossRef] [PubMed] [Green Version]
  34. Sun, Y.; Hu, R.; Zhang, C. Does the adoption of complex fertilizers contribute to fertilizer overuse? Evidence from rice production in China. J. Clean. Prod. 2019, 219, 677–685. [Google Scholar] [CrossRef]
  35. Li, S.; Zhu, Z.; Dai, Z.; Duan, J.; Wang, D.; Feng, Y. Temporal and Spatial Differentiation and Driving Factors of China’s Agricultural Eco-Efficiency Considering Agricultural Carbon Sinks. Agriculture 2022, 12, 1726. [Google Scholar] [CrossRef]
  36. Sun, S.; Hu, R.; Zhang, C. Pest control practices, information sources, and correct pesticide use: Evidence from rice production in China. Ecol. Indic. 2021, 129, 107895. [Google Scholar] [CrossRef]
  37. Chowdhury, J.; Al Basir, F.; Takeuchi, Y.; Ghosh, M.; Roy, P.K. A mathematical model for pest management in Jatropha curcas with integrated pesticides—An optimal control approach. Ecol. Complex. 2019, 37, 24–31. [Google Scholar] [CrossRef]
  38. Ali, M.P.; Bari, M.N.; Haque, S.S.; Kabir, M.M.M.; Afrin, S.; Nowrin, F.; Islam, M.S.; Landis, D.A. Establishing next-generation pest control services in rice fields: Eco-agriculture. Sci. Rep. 2019, 9, 10180. [Google Scholar] [CrossRef] [Green Version]
  39. Qing, C.; Zhou, W.; Song, J. Impact of outsourced machinery services on farmers’ green production behavior: Evidence from Chinese rice farmers. J. Environ. Manag. 2023, 327, 116843. [Google Scholar] [CrossRef]
  40. Li, J.; Rodriguez, D.; Tang, X. Effects of land lease policy on changes in land use, mechanization and agricultural pollution. Land Use Policy 2017, 64, 405–413. [Google Scholar] [CrossRef]
  41. Zhang, X.; Yang, J.; Thomas, R. Mechanization outsourcing clusters and division of labor in Chinese agriculture. China Econ. Rev. 2017, 43, 184–195. [Google Scholar] [CrossRef]
  42. Belton, B.; Win, M.T.; Zhang, X.; Filipski, M. The rapid rise of agricultural mechanization in Myanmar. Food Policy 2021, 101, 102095. [Google Scholar] [CrossRef]
  43. Yan, M.; Cheng, K.; Luo, T.; Yan, Y.; Pan, G.; Rees, R.M. Carbon footprint of grain crop production in China—Based on farm survey data. J. Clean. Prod. 2015, 104, 130–138. [Google Scholar] [CrossRef]
  44. Liu, D.; Zhu, X.; Wang, Y. China’s agricultural green total factor productivity based on carbon emission: An analysis of evolution trend and influencing factors. J. Clean. Prod. 2021, 278, 123692. [Google Scholar] [CrossRef]
  45. Li, J.; Li, S.; Liu, Q.; Ding, J. Agricultural carbon emission efficiency evaluation and influencing factors in Zhejiang province, China. Front. Environ. Sci. 2022, 10, 1005251. [Google Scholar] [CrossRef]
  46. Gan, Y.; Liang, C.; Chai, Q.; Lemke, R.L.; Campbell, C.A.; Zentner, R.P. Improving farming practices reduces the carbon footprint of spring wheat production. Nat. Commun. 2014, 5, 5012. [Google Scholar] [CrossRef] [PubMed] [Green Version]
  47. Fabbri, C.; Dalla Marta, A.; Napoli, M.; Orlandini, S.; Verdi, L. Short-term Response of Greenhouse Gas Emissions from Precision Fertilization on Barley. Agronomy 2022, 13, 96. [Google Scholar] [CrossRef]
  48. Cillis, D.; Maestrini, B.; Pezzuolo, A.; Marinello, F.; Sartori, L. Modeling soil organic carbon and carbon dioxide emissions in different tillage systems supported by precision agriculture technologies under current climatic conditions. Soil Tillage Res. 2018, 183, 51–59. [Google Scholar] [CrossRef]
  49. Pretty, J.; Bharucha, Z.P. Integrated Pest Management for Sustainable Intensification of Agriculture in Asia and Africa. Insects 2015, 6, 152–182. [Google Scholar] [CrossRef] [Green Version]
  50. Brown, R.M.; Dillon, C.R.; Schieffer, J.; Shockley, J.M. The carbon footprint and economic impact of precision agriculture technology on a corn and soybean farm. J. Environ. Econ. Policy 2015, 5, 335–348. [Google Scholar] [CrossRef]
  51. Naher, U.A.; Biswas, J.C.; Maniruzzaman, M.; Khan, F.H.; Sarkar, M.I.U.; Jahan, A.; Hera, M.H.R.; Hossain, M.B.; Islam, A.; Islam, M.R.; et al. Bio-Organic Fertilizer: A Green Technology to Reduce Synthetic N and P Fertilizer for Rice Production. Front. Plant. Sci. 2021, 12, 602052. [Google Scholar] [CrossRef] [PubMed]
  52. Pishgar-Komleh, S.H.; Ghahderijani, M.; Sefeedpari, P. Energy consumption and CO2 emissions analysis of potato production based on different farm size levels in Iran. J. Clean. Prod. 2012, 33, 183–191. [Google Scholar] [CrossRef]
  53. Wu, Y.; Xi, X.; Tang, X.; Luo, D.; Gu, B.; Lam, S.K.; Vitousek, P.M.; Chen, D. Policy distortions, farm size, and the overuse of agricultural chemicals in China. Proc. Natl. Acad. Sci. USA 2018, 115, 7010–7015. [Google Scholar] [CrossRef] [Green Version]
Figure 1. Mechanism diagram of agricultural production trusteeship affecting agricultural carbon emission reduction.
Agriculture 13 01457 g001
Figure 2. Density function diagram of farmer’s household inclination score before and after matching: (a) before matching; (b) after matching.
Agriculture 13 01457 g002
Table 1. Carbon sources, coefficients and reference sources for agricultural carbon emissions.
Carbon SourceCarbon Emission FactorSource of Coefficient
Chemical fertilizer0.8956 kg/kgT. O. West, Oak Ridge National Laboratory
Pesticide4.9341 kg/kgOak Ridge National Laboratory
Agricultural diesel oil0.5927 kg/kgIPCC
Manual input10.5 kg/man-dayIPCC
Table 2. Variable definition and descriptive statistics.
Variable NameVariable DescriptionMean ValueStandard Deviation
Explained variable
Agricultural carbon emissionsAverage carbon emission per mu of wheat (kg/mu)42.6665.072
Explanatory variable
Whether to purchase agricultural production trusteeship servicesWhether to purchase agricultural production trusteeship services: Yes = 1; No = 00.4220.494
Control variable
AgeAge (years)55.27110.016
Level of educationEducation level: primary school and below = 1; junior high school = 2; secondary school and technical secondary school = 3; college and above = 41.5920.669
Proportion of food incomeProportion of food income in total household income: [0, 10%) = 1; [10%, 20%) = 2; [20%, 30%) = 3; [30%, 50%) = 4; 50% and above = 52.7491.484
Type of agricultural machineryHousehold-owned farm machinery type (types)1.2831.798
Number of labor forceNumber of labor force in the household2.9910.693
Concurrent-business situationWhether family members went out for work or business in the past year:
Yes = 1; No = 0
0.7100.454
Operating scaleArea of wheat planted by the farmer (mu)22.556113.556
Degree of land fragmentationNumber of plots in which the farmer grows wheat/scale of operation0.5290.475
Land qualitySelf-assessment of cultivated land quality: poor = 1; average = 2; good = 32.2860.652
Do relatives and friends have civil servantsWhether relatives and friends work as civil servants: Yes = 1; No = 00.4150.493
Does the family member
Working in an agribusiness
Do family members work in agricultural enterprises: Yes = 1; No = 00.0800.271
Join a cooperative or notHas the family joined the cooperative: Yes = 1; No = 00.4560.498
Table 3. Logit Model Estimation of Farms’ Agricultural Production Trust Purchase Decision.
Index CoefficientStandard DeviationZ Value
Age0.022 ***0.0072.90
Level of education0.480 ***0.1134.26
Proportion of food income−0.179 ***0.059−3.04
Type of agricultural machinery−0.376 ***0.052−7.20
Number of labor force−0.1410.114−1.23
part-time business situation 0.683 ***0.1763.87
Operating scale0.00010.0010.08
Degree of land fragmentation−3.091 ***0.321−9.62
Land quality−0.244 **0.106−2.31
Do relatives and friends work as civil servants 0.649 ***0.2143.04
Do family members work in leading enterprises −0.1150.275−0.42
Join a cooperative or not 1.376 ***0.2066.67
Constant term −0.2890.754−0.38
LR statistics 404.87
Pseudo R 2 0.2387
Sample Size 1245
Note: ** and *** indicate significance at 5% and 1%, respectively.
Table 4. Stationarity test results.
Matching Method Pseudo LR Statisticsp-Value Mean
Deviation (%)
Median Deviation (%)
Before Matching 0.228385.970.00026.816.6
K-Nearest Neighbor Matching 0.0046.360.8973.63.4
Caliper Matching 0.00811.130.5184.83.8
Core matching 0.00710.200.5994.94.0
Local linear regression matching 0.01014.550.2675.73.9
Spline matching 0.01014.550.2675.73.9
Table 5. Overall effect of agricultural production trusteeship on promoting agricultural carbon emission reduction.
Matching MethodK-Nearest Neighbor MatchingCaliper MatchingCore MatchingLocal Linear Regression MatchingSpline MatchingMean Value
Total carbon emissions
Experimental group 38.78538.78538.78538.78538.78538.785
Control group 45.87845.77745.84045.88846.07845.892
ATT−7.092 ***
(0.394)
−6.991 *** (0.261)−7.054 *** (0.296)−7.103 ***
(0.287)
−7.293 *** (0.285)−7.107
Note: *** denotes significant at 1% level; standard errors obtained by self-service method for 400 repeated samples are presented in parentheses.
Table 6. Effect of agricultural production trusteeship on promoting carbon emission reduction of different carbon sources.
Matching MethodK-Nearest Neighbor MatchingCaliper MatchingCore MatchingLocal Linear Regression MatchingSpline MatchingMean Value
Carbon emission of chemical fertilizers
Experimental group27.21927.21927.21927.21927.21927.219
Control group31.74531.64531.67031.71031.82631.719
ATT−4.527 ***
(0.275)
−4.426 ***
(0.220)
−4.481 ***
(0.227)
−4.491 ***
(0.214)
−4.607 ***
(0.218)
−4.506
Carbon emission of agricultural chemicals
Experimental group1.8691.8691.8691.8691.8691.869
Control group2.1712.1752.1752.1782.1822.176
ATT−0.301 ***
(0.013)
−0.306 ***
(0.009)
−0.305 ***
(0.010)
−0.309 ***
(0.010)
−0.313 ***
(0.009)
0.307
Carbon Emission of agricultural diesel oil
Experimental group4.4534.4534.4534.4534.4534.453
Control group4.7404.7354.7424.7334.7284.736
ATT−0.286 ***
(0.037)
−0.281 *** (0.023)−0.289 *** (0.027)−0.279 ***
(0.027)
−0.275 *** (0.024)−0.282
Carbon emission of manpower input
Experimental group5.2445.2445.2445.2445.2445.244
Control group7.2227.2227.2237.2687.3427.255
ATT−1.978 *** (0.143)−1.978 ***
(0.111)
−1.980 ***
(0.114)
−2.024 ***
(0.114)
−2.098 ***
(0.123)
−2.012
Note: *** denotes significant at 1% level; standard errors obtained by self-service method for 400 repeated samples are presented in parentheses.
Table 7. Impact of different trusteeship links on agricultural carbon emissions.
Matching MethodK-Nearest Neighbor MatchingCaliper MatchingCore MatchingLocal Linear
Regression Matching
Spline MatchingMean Value
The agricultural material supply link
Experimental group37.77037.77037.77037.77037.77037.770
Control group43.21343.32043.31143.33843.30043.296
ATT−5.442 ***
(0.436)
−5.550 ***
(0.317)
−5.540 ***
(0.325)
−5.568 ***
(0.343)
−5.530 ***
(0.333)
−5.530
The ploughing, sowing and harvesting link
Experimental group40.90740.90740.90740.90740.90740.907
Control group46.43046.79046.74846.49746.72946.639
ATT−5.522 ***
(0.442)
−5.883 ***
(0.325)
−5.841 ***
(0.312)
−5.590 ***
(0.319)
−5.822 ***
(0.352)
−5.732
The field management link
Experimental group38.21538.21538.21538.21538.21538.215
Control group44.37544.39244.40444.35844.34644.375
ATT−6.160 ***
(0.422)
−6.176 ***
(0.300)
−6.189 ***
(0.325)
−6.143 ***
(0.328)
−6.131 ***
(0.279)
−6.160
Note: *** denotes significant at 1% level; standard errors for 400 repeated samples obtained by self-service method are shown in parentheses.
Table 8. Impact of agricultural production trusteeship on carbon emission of farms without factor endowment trusteeship.
Grouping VariablesK-Nearest Neighbor MatchingCaliper MatchingCore MatchingLocal Linear Regression MatchingSpline MatchingMean Value
Types of agricultural machinery
0–1 type Experimental group39.53839.53839.53839.53839.53839.538
Control group46.69046.66746.63046.45446.65046.618
ATT−7.152 ***
(0.437)
−7.129 ***
(0.334)
−7.092 ***
(0.337)
−7.026 ***
(0.343)
−7.111 ***
(0.322)
−7.102
More than one types Experimental group38.36238.36238.36238.36238.362138.362
Control group45.18544.95244.95944.93744.1044.827
ATT−6.823 ***
(0.509)
−6.590 ***
(0.455)
−6.597 ***
(0.479)
−6.576 ***
(0.455)
−6.548 ***
(0.434)
−6.627
Operation scale
Below 7 mu Experimental group39.51039.51039.51039.51039.51039.510
Control group46.32246.30846.30046.15846.32046.282
ATT−6.812 ***
(0.459)
−6.798 ***
(0.341)
−6.790 ***
(0.363)
−6.648 ***
(0.355)
−6.810 ***
(0.380)
−6.772
7 mu and
Above
Experimental group38.95438.95438.95438.95438.95438.954
Control group44.76345.75144.70145.04144.96445.044
ATT−5.810 ***
(0.538)
−5.797 ***
(0.478)
−5.747 ***
(0.461)
−6.087 ***
(0.409)
−6.010 ***
(0.472)
−5.890
Note: *** denotes significant at 1% level; standard errors obtained by self-service method for 400 repeated samples are shown in parentheses.
Disclaimer/Publisher’s Note: The statements, opinions and data contained in all publications are solely those of the individual author(s) and contributor(s) and not of MDPI and/or the editor(s). MDPI and/or the editor(s) disclaim responsibility for any injury to people or property resulting from any ideas, methods, instructions or products referred to in the content.

