Article

Measuring Pathogenic Soil Fungi That Cause Sclerotinia Rot of Panax ginseng Using Real-Time Fluorescence Quantitative PCR

1
College of Plant Protection, Jilin Agricultural University, Changchun 130118, China
2
State-Local Joint Engineering Research Center of Ginseng Breeding and Application, Changchun 130118, China
*
Authors to whom correspondence should be addressed.
Agriculture 2023, 13(7), 1452; https://doi.org/10.3390/agriculture13071452
Submission received: 24 June 2023 / Revised: 16 July 2023 / Accepted: 19 July 2023 / Published: 23 July 2023
(This article belongs to the Special Issue Diseases Diagnosis, Prevention and Weeds Control in Crops)

Abstract

:
Sclerotinia ginseng is the primary pathogenic fungus responsible for Sclerotinia rot of ginseng, which significantly reduces plant yield and quality. The density of sclerotia in the soil is closely associated with rot incidence and severity. Whole genome sequencing was conducted to obtain fungal frame maps. The specific primers, q2001F/q2001R, were screened out by pan-genomic analysis using the NCBI database. Recombinant plasmids containing amplicons obtained with this primer set were used as standard plasmids to construct a real-time fluorescence quantitative PCR system. The relationships between the cycle threshold (Ct) values and the soil sclerotium densities were determined by real-time PCR. Real-time PCR had a detection limit of 1.5 × 10⁻² g·kg−1 soil for Sclerotinia rot causing fungal mycelium, and the relationship between the density of S. ginseng mycelium n (g·g−1 soil) and the Ct value was n = 10(40.048 − Ct)/6.9541. The detection limit of real-time PCR for measuring soil sclerotia was 3.8 × 10⁻⁵ g·g−1 soil, suggesting a sensitivity 100 times that of conventional PCR. The relationship between the sclerotium density n (g·g−1 soil) and the Ct value was n = 10(18.351 − Ct)/7.0914. Compared with the conventional PCR method, the fluorescent quantitative PCR method could detect the population of Sclerotinia spp. in soil more efficiently, accurately, and sensitively.

1. Introduction

Sclerotinia sp. is an important soil-borne fungus with a wide host range that serves as the causative agent of Sclerotinia rot, a devastating root disease of ginseng [1]. This fungus primarily exists as a dormant structure called sclerotia, allowing it to overwinter and accumulate, resist adversity, and survive in the soil for many years [2]. When the conditions are favorable in the early spring, the mycelium that germinates from the sclerotia causes infestation, allowing it to spread to adjacent ginseng plants and reduce plant yield and quality. The sclerotia presented in soil impacts the occurrence, development, and prevalence of Sclerotinia rot and when it reaches a certain level, the soil becomes unsuitable for planting ginseng. Thus, quantitative measurement of the fungal sclerotia that causes Sclerotinia rot of ginseng is critical for disease prediction and prevention.
Real-time fluorescence quantitative PCR (real-time PCR), which evolved from conventional PCR, not only identifies the presence or absence of a gene fragment but also allows for quantitative analysis [3]. Real-time PCR has become an important tool in molecular biology research because it is rapid, sensitive, specific, has good reproducibility, can be accurately quantified, and has been used in several fields of biological research [4]. Zhu et al. (2022) established a real-time fluorescence quantitative PCR detection system and applied it to detect Ciboria shiraiana and C. carunculoides in the collected mulberry fruit sclerotinia samples, which provided a basis for the prediction and early control of the disease [5]. This technique is also widely used in the detection of soil-borne pathogenic fungi [6,7,8,9], helping to identify the occurrence, epidemiology, and timely control of soil-borne diseases. Thomas et al. (2022) developed a rapid and sensitive diagnostic tool to detect and quantify Fusarium sambucinum in plant tissues by using a modified random amplified polymorphic DNA PCR assay [10]. Grabicoski et al. (2020) designed and optimized a real-time quantitative LAMP reaction and a calcein ion indicator-based LAMP reaction to detect S. sclerotiorum on mycelium, plant, and soil samples [11]. Roth et al. (2020) developed a TaqMan probe-based quantitative PCR assay to distinguish F. brasiliense from other closely related species within clade 2 of the F. solani species complex. This assay was able to detect F. brasiliense from soil samples throughout Michigan [12]. Meng et al. (2022) established a real-time PCR reaction system of Fusarium oxysporum f. sp. Lycopersici (FOL) based on the protein kinase gene sequences of FOL. The detection sensitivity was 5.76 × 10³ copies ·μL−1, which was 10 times more sensitive than the conventional PCR [13]. Wang et al. (2022) optimized and established the real-time fluorescence quantitative PCR with standard DNA to detect the dynamic changes of pathogen number at different times after the pathogen was connected to plants [14]. In order to quickly and accurately detect the density of R. solani and sclerotia in soil, Li et al. (2021) established a quantitative real-time PCR detection system by using the conservative region of translation elongation factor (TEF). The sensitivity of this real-time quantitative PCR detection system was 1000-fold higher than common PCR [15].
However, there is no report on the real-time fluorescence quantitative PCR detection of Sclerotinia spp. on P. ginseng. As such, there are many technical problems in Sclerotinia spp. detection on P. ginseng, such as DNA fragment or primer screening, assessment of primer specificity, optimization of PCR conditions, the establishment of the relationship between the mycelial quantity, or the number of sclerotia and the Ct value in soil.
This study aims to set up a rapid, robust, and accurate real-time PCR system for measuring sclerotium density in ginseng planting soil, with real-time PCR amplification using the standard plasmid at different concentrations as the template. The relationship between the sclerotium density and the cycle threshold (Ct) value was also determined, providing theoretical guidance for the Sclerotinia spp. Diagnosis, monitoring, and prevention of Sclerotinia rot of ginseng.

2. Materials and Methods

2.1. Materials

The pathogenic fungi used in the study were identified and preserved by the Phytopathology Laboratory of Jilin Agricultural University, which were isolated from P. ginseng, Nicotiana tabacum, and Helianthus annuus (Table 1). Ninety-one soil samples were selected based on the plots where Sclerotinia disease had occurred in the past or in the season, and samples were collected from the main ginseng producing areas in Jilin Province and parts of Heilongjiang and Liaoning Province, placed into sterile bags, and stored at −20 °C (Table 2). Furthermore, soil sampling equipment was used to collect soil samples, and the depth of soil sample collection was consistent with the growth area of ginseng.

2.2. DNA Extraction from Fungi That Acquired from Table 1

After a 5 d incubation on potato dextrose agar (PDA) at 25 °C (MJX smart mold incubator, Ningbo Jiangnan Instruments Factory, Ningbo, China), approximately 50 mg of the mycelium on the agar surface was gently scraped off, and the genomic DNA of the pathogenic fungi described in Table 1 was extracted using fungal genomic DNA extraction kits (Biospin, Hangzhou Bioer Technology, Hangzhou, China). A soil sample (0.25 g) from Table 2 and grinding beads (0.25 g) were added to a 2 mL centrifuge tube (Solarbio life sciences, Beijing Solaibao Technology Co., Ltd., Beijing, China) and vortexed until the sample was well mixed. The genomic DNA was extracted according to the instructions and then purified and recovered by using a reagent test kit (CoWin Biosciences, Jiangsu Cowin Biotech Co., Ltd., Taizhou, China).

2.3. Primer Design and Synthesis

S. nivalis YC5, S. ginseng 149 and 150, and Sclerotinia spp. YY6 were cultured in 150 rpm shaking flasks at 25 °C for 5 days, and the mycelium were collected and sent to Shanghai Majorbio Co., Ltd. (Shanghai, China) for genome frame map sequencing. A pan-genomic comparison of Sclerotinia fungi of the same genus but different species were conducted using the NCBI nr database and common and unique genes were identified (adj. p value < 0.05). Blast comparison of the unique genes was conducted using GenBank to ensure that the screened genes were present in the Sclerotinia spp. strains from P. ginseng but not in the Sclerotinia fungi of different genera [16]. Based on the unique genes, specific primers were designed using Primer Premier 5.0 and synthesized by Sangon Bioengineering (Shanghai) Co., Ltd., Shanghai, China.
The conventional PCR reaction included 12.5 µL PCR Taq DNA polymerase (Takara, Takara Biomedical Technology Co., Ltd., Dalian, China), 0.5 µL 10.0 µmol·L−1 upstream primer, 0.5 µL 10.0 µmol·L−1 downstream primer, 0.5 µL 10–100 ng·µL−1 genomic DNA, and 11.0 µL ddH2O for a final volume of 25.0 µL. The reaction included 35 cycles of pre-denaturation at 95 °C for 5 min, denaturation at 95 °C for 30 s, annealing at 56 °C for 30 s, and extension at 72 °C for 30 s, and a final extension at 72 °C for 10 min (C1000 Touch thermal cycler, Bio-Rad Laboratories, Hercules, CA, USA). PCR amplification products were subjected to 1% agarose gel electrophoresis (DYY-6C electrophoresis apparatus, Beijing Liuyi Instruments Factory, Beijing, China). Eight pathogenic fungi of ginseng from different regions were selected to determine the PCR primer specificity (Table 1). Primers that could amplify Sclerotinia spp. from P. ginseng, but none of the other pathogenic fungi of ginseng were screened. The specificity of the screened primers was verified using ddH2O as a control.

2.4. Development of Standard Plasmids and Assessment of Primer Specificity by Real-Time PCR

Representative conventional PCR amplification products from S. nivalis YC5 were subjected to 1% agarose gel electrophoresis and the target fragments were recovered according to the agarose gel extraction kit’s protocol (Biospin, Hangzhou Bioer Technology, Hangzhou, China). The fragments were ligated into pMD18-T vectors (Takara Biomedical Technology Co., Ltd., Dalian, China) and transformed into E. coli DH5α. Positive clones were screened using ampicillin, inoculated into LB liquid medium containing ampicillin (100 μg·mL−1) [17], and shaken at 220 r·min−1 for 12 h at 37 °C. The plasmid DNA was extracted using a rapid plasmid extraction kit (Jiangsu Cowin Biotech Co., Ltd., Taizhou, China) and assessed by PCR. Plasmids recovered from the target band were sent to Sangon Bioengineering (Shanghai, China) for sequencing, and the obtained sequence was compared against the NCBI database. Plasmid mass concentration (ng·μL−1) was determined using a spectrophotometer (Nano Drop 2000, Thermo Scientific Co., Ltd., Bedford, MA, USA) according to the following equation:
Plasmid copy concentration (copies·μL−1) = 6.02 × 10²³ plasmid mass concentration (g·μL−1)/plasmid molecular mass (g·mol−1) to be 1.87 × 10¹¹ copies·μL−1 (plasmid molecular mass (g·mol−1) = number of plasmid base pairs (bp) × 650 daltons·bp−1).
After 10-fold gradient dilutions, eight concentration gradients of standard plasmids were obtained (1.87 × 10⁻², 1.87 × 10⁻¹, 1.87 × 100, 1.87 × 101, 1.87 × 10², 1.87 × 10³, 1.87 × 10⁴, and 1.87 × 10⁵ copies·μL−1) and stored at −20 °C prior to use [18].
The real-time PCR reaction system included 10.0 μL of 2 × TB Green Premix Ex TaqII (Takara Biomedical Technology Co., Ltd., Dalian, China), 0.5 μL of each upstream and downstream primer, 2.0 μL DNA template, and ddH2O added to make a final volume of 20.0 μL. Reaction procedures included 36 cycles of pre-denaturation at 95 °C for 10 min, denaturation at 95 °C for 15 s, and annealing at 60 °C for 32 s. As a control, ddH2O was used in place of the template. Fluorescent signals were determined at the annealing temperature to assess primer specificity.

2.5. Assessment of the Real-Time PCR System and Generation of Standard Real-Time PCR Curves

The standard plasmid with a concentration of 1.87 × 10⁻² to 1.87 × 10⁵ copies·μL−1 was used as a template for conventional PCR and real-time PCR amplification. For conventional PCR amplification, the faintest band that was observable with the naked eye was considered the detection limit, while for real-time PCR amplification, a smooth amplification curve with good reproducibility was used as the template detection limit [19].
Real-time PCR amplification was performed using the standard plasmid at a concentration of 1.87 × 101 to 1.87 × 10⁵ copies·μL−1 as the template, and the amplification was repeated five times. To measure the reproducibility, the coefficient of variation (CV) was calculated using the following formula:
CV = (SD ÷ MN) × 100%
where SD = standard deviation, MN = mean [20].
To generate standard real-time PCR curves, the standard plasmid at a concentration of 1.87 × 10⁻² to 1.87 × 10⁵ copies·μL−1 was used as a template. PCR amplification was repeated three times for each plasmid concentration. The reaction system and conditions were the same as those described in Section 2.5. The standard curves were plotted using the logarithm of the plasmid DNA concentration as the abscissa and the Ct value as the ordinate [21].

2.6. Establishment of the Relationship between the Mycelial Quantity of Sclerotinia Ginseng and the Ct Value in Soil

Mycelium of S. ginseng weighing 0, 10, 20, 30, 50, 100, or 300 mg were added to 1 kg of sterile soil, respectively [21]. After thoroughly mixing, three soil samples from each treatment were weighed and filtered, and the DNA was extracted. The soil DNA samples were measured by quantitative fluorescence and the relationship curve was plotted using the logarithm of the soil fungal density (g·g−1 soil) as the abscissa and the corresponding Ct value as the ordinate.

2.7. Establishment of the Relationship between the Number of Sclerotia in the Soil and the Ct Value

Sclerotia were counted, weighed, added to 7 samples of sterilized soil, and mixed well. The sclerotium contents were 0, 1, 10, 50, 100, 300, and 500 sclerotia·kg−1 soil [22], and the densities were 0.00, 3.80 × 10⁻³, 3.80 × 10⁻², 1.90 × 10⁻², 3.80 × 10⁻¹, 1.14 × 10⁻¹, and 1.90 g·kg−1 soil in each sample, respectively. The soil particles and sclerotia were pulverized with a tissue crusher (Auari AF-20A, Wenling Aoli Traditional Chinese Medicine Machinery Co., Ltd., Wenling, China) and mixed for 1 min at 60–80 rpm. Each treatment was repeated three times, and soil DNA was extracted using the soil DNA fast extraction kit.
The soil DNA extracted in Section 2.1 (21 samples from each section) was amplified by real-time PCR using the screened primers. After PCR amplification of the fungal DNA, the standard curves of real-time PCR were generated using the real-time PCR system software (CFX96 Touch™, Bio-Rad Laboratories, Hercules, CA, USA), with the logarithm of the initial concentration of the fungal DNA template as the abscissa and the Ct value as the ordinate. The correlation between the Ct value and the logarithm of the mycelial and sclerotia DNA extracted from the soil was assessed, and the standard curve equation and correlation coefficient, R2, were determined [22].

2.8. Assay of Field Soil Samples Using Specific Primers

To test primer suitability, 91 DNA samples extracted from ginseng planting soil were used as templates, and PCR amplification was performed using conventional PCR and real-time PCR primers. For a control, ddH2O was used in place of the template. The reaction system used for conventional PCR and real-time PCR were the same as described in Section 2.4 and Section 2.6, respectively.

2.9. Data Analysis

Melting and amplification curves were generated using the CFX96 Touch™ real-time PCR system software. The standard real-time PCR curves and the relationship curves between the number of sclerotia in soil and the Ct value were plotted using Microsoft Office Excel 2019.

3. Results

3.1. Design and Synthesis of Specific Primers

The genomic DNA of strains or soil samples listed in Table 1 and Table 2 were extracted, purified, and recovered successfully. Pan-genomic comparison was used to obtain the common and unique genes of Sclerotinia spp. from B. cinerea B05.10, S. sclerotiorum 1980-UF-70, P. cactorum, S. glacialis, F. oxysporum Fo47, A. alternata, R. solani AG-3, F. solani, C. gloeosporioides, C. destructans, S. borealis F-4128, S. nivalis YC5, S. ginseng 149 and 150, and Sclerotinia spp. YY6. Sixteen primer pairs (Supplementary File S1) were designed based on the common genes, and candidate primers were verified by PCR. The A2001F/A2001R primers (A2001F:5′-ATGGCGTCGATCTTGCC-3′, A2001R:5′-TCAAGCAAGCTTTGTAGTGC-3′) were screened as the common Sclerotinia spp. PCR primers and the amplified segment had a length of 552 bp. Using these data, the specific real-time PCR primers designed to test Sclerotinia spp. were q2001-F/R (q2001-F:5′-GGAATTATC TCATTGCTTTGTGGCT-3′, q2001-R:5′-TCAAGCAAGCTTTGTAGTGCTCTTTCTA-3′). PCR amplification of the test fungi resulted in a single amplified band and no band for the negative control. A GenBank comparison revealed no homogeneity with primer sequences from other species. The amplified segment had a length of 253 bp.

3.2. Specificity of Primers Assessed Using Conventional PCR

While a Sclerotinia spp. band was successfully amplified from different hosts using the A2001F/A2001R primers, no band was amplified for other pathogenic fungi of ginseng. Thus, this primer pair was determined to be specific for Sclerotinia spp. (Figure 1a).
PCR amplification was carried out in 47 test fungi using the q2001-F/R primers. Gel electrophoresis showed that a band at 253 bp was only amplified in Sclerotinia spp., but not in other control fungi or in the negative control, demonstrating that these primers had good specificity (Figure 1b).

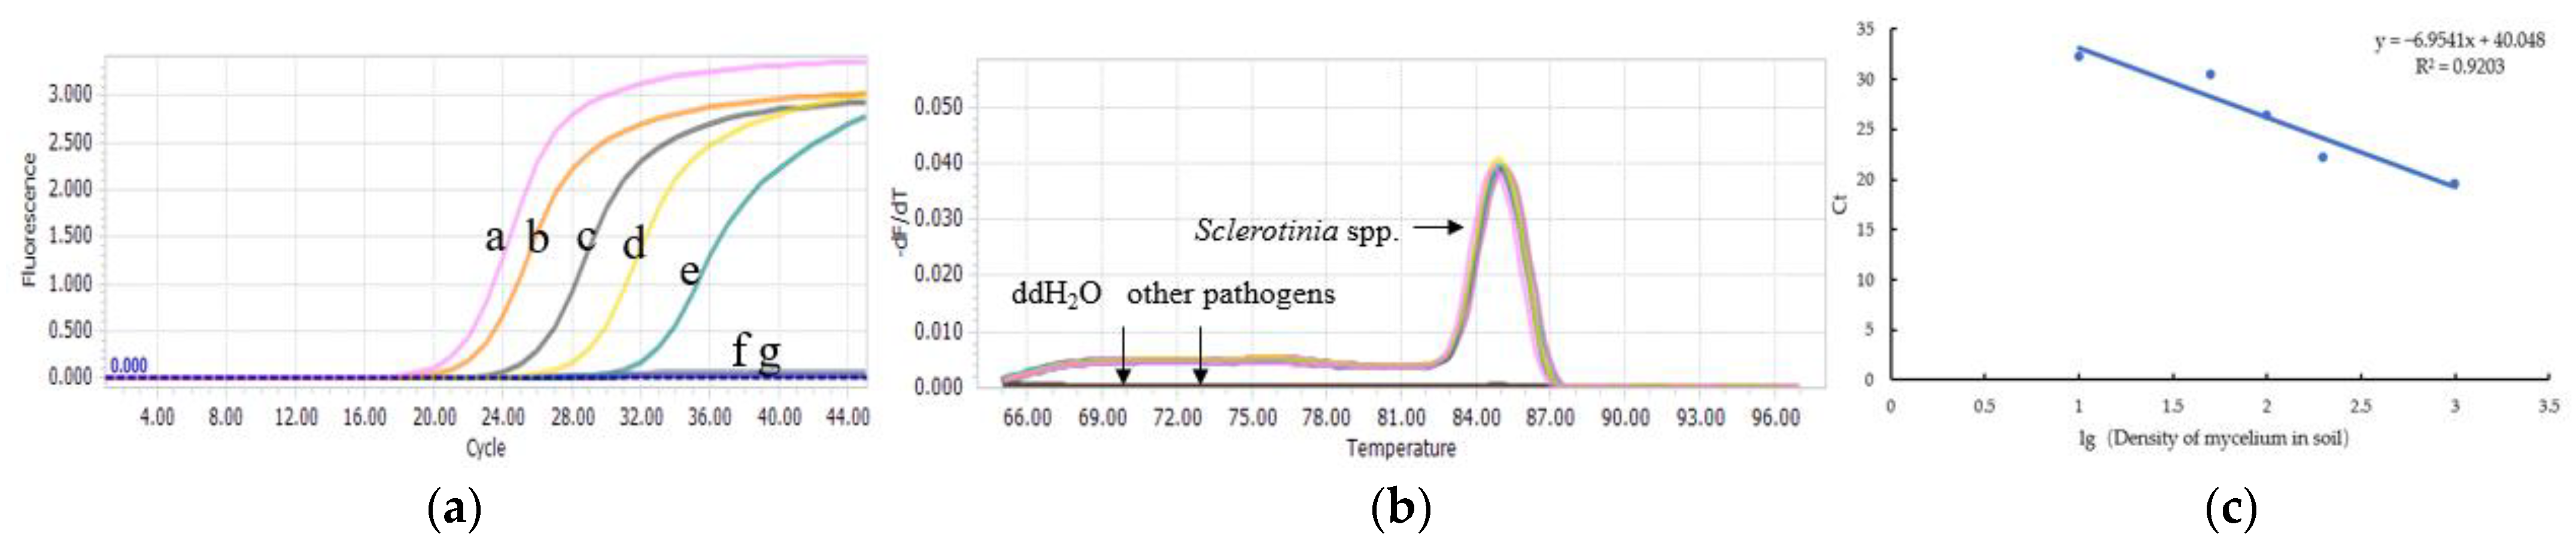
3.3. Specificity of Primers Assessed Using Real-Time PCR

PCR was performed for Sclerotinia spp. And other pathogenic fungi of ginseng. Melting curves with a unimodal peak were generated, and there was no amplification of other pathogenic fungi. These results indicated that the primers had good specificity and did not result in nonspecific amplification (Figure 2a,b).

3.4. Assessment of the Real-Time PCR System

Real-time PCR was performed using standard plasmids of eight gradient dilutions at concentrations ranging from 1.87 × 10⁻² to 1.87 × 10⁵ copies·μL−1. Standard plasmids at 1.87 × 101 copies·μL−1 yielded weak positive signals, while those <1.87 × 101 copies·μL−1 failed to yield a signal using conventional PCR. Thus, the detection limits for conventional PCR and real-time PCR were 1.87 × 101 copies·μL−1 and 1.87 × 10⁻¹ copies·μL−1, respectively (Figure 2c,d). The results showed that the sensitivity of real-time PCR was 100 times higher than that of conventional PCR.
Real-time PCR was performed on standard plasmids at concentrations ranging from 1.87 × 101 to 1.87 × 10⁵ copies·μL−1 under the same conditions, and amplification was repeated five times for each concentration. The mean Ct values were 4.196, 9.642, 14.570, 19.570, and 23.870, respectively, and the coefficients of variation were 1.4%, 1.7%, 1.0%, 0.9%, and 1.7%, respectively. Given that these were all below 2% [22], the detection system was found to have good reproducibility (Table 3).

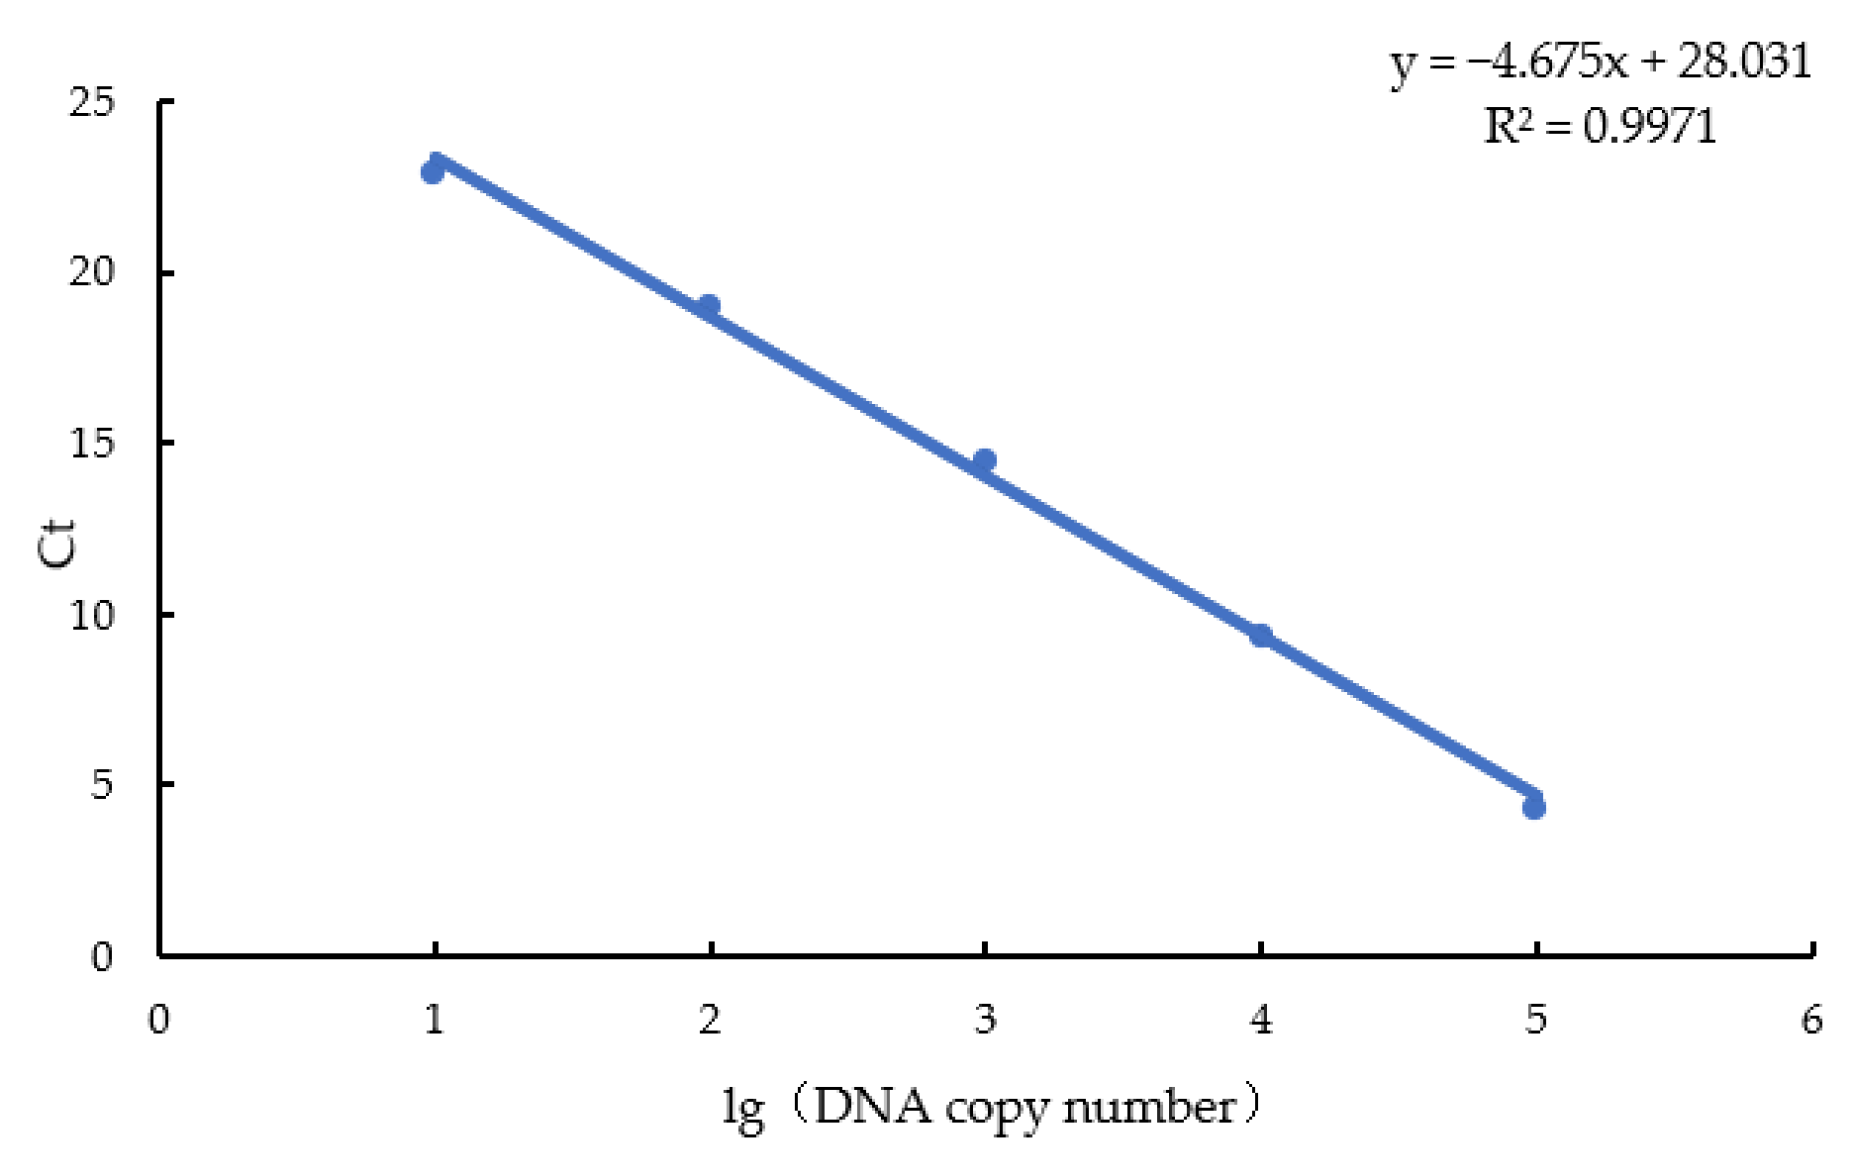
3.5. Plotting Real-Time PCR Standard Curves of Sclerotinia spp.

Based on the quantitative results, the standard curves were plotted with the number of plasmid DNA (copies) as the abscissa and the corresponding Ct value as the ordinate (Figure 3). The standard curve equation was Y = −4.675x + 28.031 and the correlation coefficient R2 = 0.9971, suggesting good linearity of the system.

3.6. Establishment of the Relationship between the Amount of Mycelium in the Soil and the Ct Value

Real-time PCR was performed after adding the known mycelium weights to the sterilized soil. The real-time PCR detection limit of Sclerotinia spp. Mycelium was 1.5 × 10⁻² g·kg−1 soil, or 1.5 × 10⁻⁵ g·g−1 soil. There was a good linear relationship between the Ct value (y-axis) and the logarithm of the mycelial density (x-axis) (Figure 4a,b), y = −6.9541x + 40.048, and R2 = 0.9203 (Figure 4c). The mycelial density and the Ct value had the following relationship:
n = 10 40.048 C t 6.9541

3.7. Establishment of a Relationship between the Number of Sclerotia in the Soil and the Ct Value

Real-time PCR was performed after adding a known weight of sclerotia to the sterilized soil. The detection limit of sclerotia was 3.8 × 10⁻² g·kg−1 soil, or 3.8 × 10⁻⁵ g·g−1 soil. There was a good linear relationship between the Ct value (y-axis) and the logarithm of the sclerotium density (x-axis) (Figure 5a,b), y= −7.0914x + 18.351, and R2 = 0.9488 (Figure 5c). The sclerotium density and the Ct value had the following relationship:
n = 10 18.351 C t 7.0914

3.8. Assay of Field Soil Samples Using Specific q2001F/q2001R Primers

Conventional PCR detected Sclerotinia spp. in 29 out of the 91 soil samples collected from Sclerotinia infected ginseng fields with different degrees of decay on ginseng, for a detection rate of 31.86%. In contrast, real-time PCR detected Sclerotinia spp. in 89 out of the 91 soil samples, for a detection rate of 97.80% (Figure 6 and Table 4).
The different levels of detection listed in Table 4 relate to the amount of disease. The severity of disease decreases with the increase in Ct value. Sclerotinia root rot or sclerotia were found in some of samples (Ct value < 24.09). Two samples that had the Ct value zero were found to have Sclerotinia root rot in the last season; meanwhile, the whole diseased ginseng was removed.
These results indicate that real-time PCR was more sensitive at detecting Sclerotinia spp. than conventional PCR.

4. Discussion

Sclerotinia rot caused by S. sclerotiorum is a devastating soil-borne disease with a wide host range, causing damage to more than 400 plants in 208 genera of 75 families, including crops, cash crops, horticultural plants, Chinese herbal medicines, and weeds [23]. Since S. sclerotiorum sclerotia can survive for years in the soil, this fungus is a primary infestation source for Sclerotinia rot of ginseng, and this difficult-to-control disease is likely to cause significant reductions in ginseng production. In recent years, the incidence of Sclerotinia rot has worsened in major ginseng-producing areas such as the Changbai Mountains, Ji’an, and Fusong of the Jilin Province in China. Thus, it is particularly important to establish sensitive, specific, and rapid methods for detecting soil-borne pathogenic fungi responsible for Sclerotinia rot.
Several molecular techniques, including nested PCR, multiplex PCR, LAMP, and real-time PCR, are used to detect soil-borne pathogens [24,25]. Real-time PCR has the advantage of having high specificity, sensitivity, and efficiency, and has become the primary method for identifying soil-borne pathogens. Primer design was generally obtained through GenBank by using known sequences or functional gene fragments for BLAST. In this study, genome framework sequencing was used, common and unique genes were obtained through genome single nucleotide polymorphism comparison. Based on this, common gene fragments of Sclerotinia spp. were selected for primer design, which was highly innovative.
This study is the first to use real-time PCR to measure S. sclerotiorum in soil samples. While the detection limit for real-time PCR was 1.87 × 10⁻¹ copies·μL−1, the detection limit for conventional PCR was 1.87 × 101 copies·μL−1 indicating that the sensitivity was 100 times higher for real-time than conventional PCR. Chen et al. (2011) showed that the detection limit of real-time PCR for S. sclerotiorum of canola was 1.4 × 10⁻³ ng·μL−1, 10–100 times the sensitivity of conventional PCR [19] and comparable to the sensitivity observed in this study. In this study, the detection rates were 31.86% and 97.80% for conventional PCR and real-time PCR, respectively. The detection rate for real-time PCR may not have been 100% because humic acids, heavy metal ions, and other components in the soil samples undermined the integrity of DNA extracted from the soil, reducing the accuracy of quantitative detection or soil sclerotia and causing its DNA to degrade.
Both the relationship curve of the Ct value and mycelium density in soil and the relationship curve of the Ct value and sclerotia density in soil were established in this study. A real-time PCR system was established to detect S. ginseng DNA extracted from ginseng planting soil. The detection limit was 3.8 × 10⁻⁵ g·g−1 soil for S. ginseng mycelium and 1.5 × 10⁻⁵ g·g−1 soil for sclerotia. The detection limit of the real-time PCR system established by Lees et al. (2002) to detect soil-borne R. solani is 5 × 10⁻⁴ g·g−1 soil [26], which is 10 times less sensitive than the real-time PCR system established in this study. Shen et al. (2017) established a real-time PCR system with water screening that had a detection limit of 5 × 10⁻⁶ g·g−1 soil for R. solani [27], which was 10 times more sensitive than the real-time PCR system established here. However, the sensitivity and accuracy might vary due to different pathogens used for detection. Meanwhile, water screening removed most of the impurities so that only the sclerotia and a small portion of the soil particles were retained on the screen, increasing the detection accuracy.

5. Conclusions

This paper makes it possible to set up a rapid, robust, and accurate real-time PCR system for measuring the number of S. ginseng sclerotia and mycelium in ginseng planting soil. The conventional PCR system established in this study was appropriate for the detection of isolated and purified S. ginseng. The severity of disease decreases with the increase in Ct value. The detection limit was 3.8 × 10⁻⁵ g·g−1 soil for S. ginseng mycelium and 1.5 × 10⁻⁵ g·g−1 soil for sclerotia. Real-time fluorescence quantitative PCR was a fast detection method that can be used for the rapid diagnosis of S. ginseng. In addition, real-time PCR is of great significance for guiding the prediction of Sclerotinia disease and formulating control measures in ginseng planting.

Supplementary Materials

The following supporting information can be downloaded at: https://www.mdpi.com/article/10.3390/agriculture13071452/s1, Table S1: Sixteen primer pairs Details screened by common and unique genes; Table S2: Design and screen of specific primer sequences of Sclerotinia spp.

Author Contributions

Conceptualization, S.F., B.L. and J.G.; methodology, S.F. and B.L.; software, S.F.; validation, S.F., B.L. and J.G.; formal analysis, S.F. and B.L.; investigation, S.F. and C.Z.; resources, J.G.; data curation, S.F., B.L. and J.G.; writing—original draft preparation, S.F.; writing—review and editing, B.L., X.W. and J.G.; visualization, B.L.; supervision, B.L. and J.G.; project administration, C.C. and J.G.; funding acquisition, B.L. and J.G. All authors have read and agreed to the published version of the manuscript.

Funding

This study received support from the National Natural Science Foundation of China (31701354), Project of Science and Technology Development Plan of Jilin Province (20210204047YY), the Overseas Expertise Introduction Project for Discipline Innovation (111 Project) (D17014), and the earmarked fund for China Agriculture Research System (CARS-21).

Institutional Review Board Statement

Not applicable.

Data Availability Statement

Not applicable.

Conflicts of Interest

The authors declare no conflict of interest.

References

  1. Wang, C.R.; Chen, C.F.; Chen, J.; Fu, J.F. Sclerotinia ginseng, A new species of Sclerotinia. Acta Mycol. Sin. 1995, 14, 187–188. [Google Scholar]
  2. Han, Y.L.; Wang, D.; Li, Z.B.; Zhou, R.J.; Fu, J.F. Study on myceliogenic germination of sclerotia of Sclerotinia ginseng. China Plant Prot. 2019, 39, 19–22+62. [Google Scholar]
  3. Chen, X.; Qi, F.K.; Kang, L.G.; Li, J.F. Advance and application of real-time fluorescent quantitative PCR. J. Northeast. Agric. Univ. 2010, 41, 148–155. [Google Scholar]
  4. Xu, X.G.; Liu, Y.T. Application of Real-time Fluorescence Quantitative PCR in Plant Disease. Chin. Agric. Sci. Bull. 2009, 25, 52–56. [Google Scholar]
  5. Zhu, Z.X.; Dong, Z.X.; Mo, R.L.; Hu, X.M.; Yu, C. Establishment and application of real-time PCR for detecting pathogens causing mulberry fruit sclerotiniosis. J. Plant Prot. 2022, 49, 909–916. [Google Scholar]
  6. Milner, H.; Ji, P.; Sabula, M.; Wu, T. Quantitative polymerase chain reaction (Q-PCR) and fluorescent in situ hybridization (FISH) detection of soilborne pathogen Sclerotium rolfsii. Appl. Soil Ecol. 2019, 136, 86–92. [Google Scholar] [CrossRef]
  7. Atallah, Z.K.; Bae, J.; Jansky, S.H.; Rouse, D.I.; Stevenson, W.R. Multiplex real-time quantitative PCR to detect and quantify Verticillium dahliae colonization in potato lines that differ in response to Verticillium wilt. Phytopathology 2007, 97, 865–872. [Google Scholar] [CrossRef] [Green Version]
  8. Ziesman, B.R.; Turkington, T.K.; Basu, U.; Strelkov, S.E. A quantitative PCR system for measuring Sclerotinia sclerotiorum in canola (Brassica napus). Plant Dis. 2016, 100, 984–990. [Google Scholar] [CrossRef] [Green Version]
  9. Kim, T.G.; Knudsen, G.R. Quantitative real-time PCR effectively detects and quantifies colonization of sclerotia of Sclerotinia sclerotiorum by Trichoderma spp. Appl. Soil Ecol. 2008, 40, 100–108. [Google Scholar] [CrossRef]
  10. Thomas, W.J.; Borland, T.G.; Bergl, D.D.; Claassen, B.J.; Flodquist, T.A.; Montgomery, A.S.; Gent, D.H. A Quantitative PCR Assay for Detection and Quantification of Fusarium sambucinum. Plant Dis. 2022, 106, 2601–2606. [Google Scholar] [CrossRef] [PubMed]
  11. Grabicoski EM, G.; Jaccoud-Filho DD, S.; Lee, D.; Henneberg, L.; Pileggi, M. Real-time quantitative and ion-metal indicator LAMP-based assays for rapid detection of Sclerotinia sclerotiorum. Plant Dis. 2020, 104, 1514–1526. [Google Scholar] [CrossRef]
  12. Roth, M.G.; Oudman, K.A.; Griffin, A.; Jacobs, J.L.; Sang, H.; Chilvers, M.I. Diagnostic qPCR assay to detect Fusarium brasiliense, a causal agent of soybean sudden death syndrome and root rot of dry bean. Plant Dis. 2020, 104, 246–254. [Google Scholar] [CrossRef]
  13. Meng, Z.; Zhang, W.P.; Wang, Y.; Li, L.; Ji, X.X.; Dong, B.; Qiao, K. Establishment and Application of Real-Time PCR for Quantitative Detection of Fusarium oxysporum f. sp. Lycopersici. Acta Hortic. Sin. 2022, 49, 2479–2488. [Google Scholar]
  14. Wang, X.Y.; Dong, C.M.; Yang, L.L.; Gao, Y.H.; Hou, W.C.; Gu, X.P.; Hou, Q.F. Establishment and Application of Real-Time Fluorescent Quantitative PCR Assay for Leaf Ring Rot of Rehmannia glutinosa. J. Chin. Med. Mater. 2022, 45, 530–535. [Google Scholar]
  15. Li, L.; Chen, L.D.; Huang, Y.S.; Xie, X.W.; Shi, Y.X.; Chai, A.L.; Li, B.J. Establishment and Application of Real-time Quantitative PCR Detection System for Black Scurf Pathogen in Potato (Solanum tuberosum). J. Agric. Biotechnol. 2021, 29, 1417–1425. [Google Scholar]
  16. Li, M.; Lu, B.H.; Gao, J.; Zhang, Y.J. Molecular Specific Detection of Phytophthora cactorum and Five Other Species of Phytophythora by Conventional PCR. J. Jilin Agric. Univ. 2022, 44, 135–142. [Google Scholar]
  17. Demontis, M.A.; Cacciola, S.O.; Orrù, M.; Balmas, V.; Chessa, V.; Maserti, B.E.; Migheli, Q. Development of real-time PCR systems based on SYBR® Green I and TaqMan® technologies for specific quantitative detection of Phoma tracheiphila in infected Citrus. Eur. J. Plant Pathol. 2008, 120, 339–351. [Google Scholar] [CrossRef]
  18. Wei, F.; Yu, Z.Z.; Shang, W.J.; Yang, J.R.; Xu, X.M.; Hu, X.P. Rapid detection and quantification of Verticillium dahliae microsclerotia in soil. Acta Phytopathol. Sin. 2013, 43, 449–457. [Google Scholar]
  19. Chen, C.J.; Li, J.; Zhao, W.; Wang, J.X.; Zhou, M.G. Detection of Sclerotinia sclerotiorum by a quantitative real-time PCR. Acta Phytopathol. Sin. 2011, 41, 516–525. [Google Scholar]
  20. Shen, Y.M.; Guo, C.J.; Wang, X.G.; Shen, R.Q.; Chen, A.C.; Hu, X.P. Rapid detection of Rhizoctonia solani AG3 sclerotia in soil by quantitative real-time PCR. Mycosystema 2017, 36, 1383–1391. [Google Scholar]
  21. Kang, Z.H.; Huang, J.L. Detection of Thielaviopsis basicola in soil with real-time quantitative PCR. Acta Phytopathol. Sin. 2010, 40, 210–213. [Google Scholar]
  22. Yu, Z.Z. Quantitative Detection of the Cotton Verticillium dahliae Microsclerotia of Cotton in Soil by Molecular Analysis. Master’s Thesis, Northwest A&F University, Xianyang, China, 2012. [Google Scholar]
  23. Gu, Y.Y.; Wang, L.N.; Yuan, J.; Zhang, Y.; Yao, L.M.; Ma, X.H.; Wang, B.; Wu, T.L. Identification of Hyacinth Bean Sclerotinia Pathogen and Its Biological Characteristics. China Veg. 2020, 10, 68–76. [Google Scholar]
  24. Xiao, R.; Yu, Z.Z.; Elsharawy, A.A.; Wei, F.; Yang, J.R. SYBR Green I real time RT-PCR assay for quantitatively detecting the occurrence of Verticillium dahliae of cotton in naturally infested Soil. Mycosystema 2011, 30, 598–603. [Google Scholar]
  25. Jansson, L.; Koliana, M.; Sidstedt, M.; Hedman, J. Blending DNA binding dyes to improve detection in real-time PCR. Biotechnol. Rep. 2017, 14, 34–37. [Google Scholar] [CrossRef]
  26. Lees, A.K.; Cullen, D.W.; Sullivan, L.; Nicolson, M.J. Development of conventional and quantitative real-time PCR assays for the detection and identification of Rhizoctonia solani AG-3 in potato and soil. Plant Pathol. 2002, 51, 293–302. [Google Scholar] [CrossRef]
  27. Shen, Y.M. Pathogen detection of potato black scurf in soil and evaluation of potato cultivars resistance to Rhizoctonia solani. Master’s Thesis, Northwest A&F University, Xianyang, China, 2017. [Google Scholar]
Figure 1. Amplification results of specific primer pairs: (a): Amplification results of specific primer pairs A2001F/A2001R; (b): Amplification results of specific primer pairs q2001F/q2001R. M: DL2000 marker lane 1–3: S. ginseng, lane 4–6: S. nivalis, lane 7–9: S. sclerotiorum, lane 10–12: S. sclerotiorum, lane 13–15: S. sclerotiorum, lane 16–18: S. minor, lane 19–20: R. solani, lane 21–23: P. cactorum, lane 24–26: A. panax, lane 27–28: A. alternata., lane 29–30: F. solani, lane 31–32: F. oxysporum, lane 33–34: C. panacicola, lane 35–36: C. lineola, lane 37–39: B. fabae, lane 40–42: B. cinerea, lane 43–44: P. debaryanum, lane 45–47: C. destructans, lane 48: ddH2O; lane 1–9, 19–47: pathogens were isolated from P. ginseng; lane 10–12: pathogens were isolated from N. tabacum; lane 13–18: pathogens were isolated from H. annuus.
Agriculture 13 01452 g001
Figure 2. (a): Primer-specific detection by SYBR Green PCR—Amplification curve (b): Primer- specific detection by SYBR Green PCR—Melt curve; (c): Sensitivity test of conventional PCR; (d): Sensitivity of real-time PCR using the q2001F/R primer pair; (c): M: DL2000 DNA marker; lanes 1–8: 1.87 × 10⁵, 1.87 × 10⁴, 1.87 × 10³, 1.87 × 10², 1.87 × 101, 1.87 × 100, 1.87 × 10⁻¹, and 1.87 × 10⁻² copies plasmid, respectively; (d): a–h: 1.87 × 10⁵, 1.87 × 10⁴, 1.87 × 10³, 1.87 × 10², 1.87 × 101, 1.87 × 100, 1.87 × 10⁻¹, and 1.87 × 10⁻² copies plasmid, respectively; i: ddH2O.
Agriculture 13 01452 g002
Figure 3. Standard curve of standard plasmid by SYBR Green PCR.
Agriculture 13 01452 g003
Figure 4. (a): Amplification curves by SYBR Green PCR for detecting the density of mycelium in soil (a–g: 300, 100, 50, 30, 20, 10, 0) mg/kg soil; (b): Melt curves by SYBR Green PCR for detecting the density of mycelium in soil; (c): The relationship curve of Ct value and mycelium density in soil.
Agriculture 13 01452 g004
Figure 5. (a): Amplification curves by real-time PCR for detecting the density of sclerotia in soil (a–g: 1.90, 1.14, 3.80 × 10⁻¹, 1.90 × 10⁻², 3.80 × 10⁻², 3.80 × 10⁻³, 0.00) g·kg−1 soil; (b): Melt curves by real-time PCR for detecting the density of sclerotia in soil; (c): The relationship curve of Ct value and sclerotia density in soil.
Agriculture 13 01452 g005
Figure 6. Detection of soil samples in field by conventional PCR M: DL 2000 Marker; lanes 1–91: Soil samples suspected of S. ginseng; lanes 92–94: Healthy ginseng soil samples; lane 95: ddH2O.
Agriculture 13 01452 g006
Table 1. Isolates used in the test.
Pathogen NameIsolate CodeHosts
S. ginsengYC7, TH2, 149-1, 150-1P. ginseng
S. nivalisYC5, KD616, CBG1-3P. ginseng
S. sclerotiorumTH6, TH9, FS2P. ginseng
S. sclerotiorumYB1-1, YB2-2, YB2-3N. tabacum
S. sclerotiorumXRK1-1, XRK2-2, XRK2-3H. annuus
S. minorJH6, YY6, JH1P. ginseng
R. solaniCB3-5, FS2-2P. ginseng
Phytophthora cactorumFS1-1, BC8-11, SL2-1P. ginseng
Alternaria panaxJY14, JY37, CPAP. ginseng
A. alternataFS3-7, CS31-5P. ginseng
Fusarium solaniCS4, DH2-2P. ginseng
F. oxysporumJB1-1, JB4-1P. ginseng
Colletotrichum panacicolaRS001, YL2-1P. ginseng
C. lineolaLHJ7-2, LHJ119P. ginseng
Botrytis fabaeDH-6, DH-7, SDF-1P. ginseng
B. cinereaJA-6, HR-3, SJH-2P. ginseng
Pythium debaryanumFM1-1, TH3-2P. ginseng
Cylindrocarpon destructansCSM2-1, XF1-1, CS6-4P. ginseng
Table 2. Collection information for soil samples in this study.
Code NumberHostsLocationsLongitude and Latitude
1–10P. ginsengChoushui, Baishan, Jilin, China41°52′25.36″ N, 127°42′52.66″ E
11–20P. ginsengSongjianghe, Baishan, Jilin, China42°11′10.24″ N, 127°28′31.73″ E
21–30P. ginsengTaishang, Tonghua, Jilin, China41°12′26.08″ N, 126°18′82.29″ E
30–35P. ginsengYongxing street, Changchun, Jilin, China43°78′04.30″ N, 125°42′29.40″ E
36–45P. ginsengTaiwang, Tonghua, Jilin, China41°8′31.14″ N, 126°12′55.23″ E
46–48P. ginsengLiuhe, Tonghua, Jilin, China42°28′46.06″ N, 125°74′47.35″ E
49–58P. ginsengChangbai, Baishan, Jilin, China41°26′9.17″ N, 127°47′43.06″ E
59–68P. ginsengYulin, Tonghua, Jilin, China40°59′17.04″ N, 125°57′44.18″ E
69–78P. ginsengDunhua, Yanbian, Jilin, China43°56′52.43″ N, 128°43′05.57″ E
70–86P. ginsengShangzhi, Haerbin, Heilongjiang, China45°27′60.84″ N, 127°51′25.60″ E
87–91P. ginsengHuanren, Benxi, Liaoning, China41°21′75.80″ N, 125°69′39.00″ E
Table 3. Repeatability of real-time PCR assay.
Log Starting Quantity (Copies·μL−1)Average Ct ValueSD (n = 5)CV (%)
1.87 × 1054.1960.0601.4
1.87 × 1049.6420.1661.7
1.87 × 10314.5660.1541.0
1.87 × 10219.5660.1910.9
1.87 × 10123.2860.4031.7
Table 4. Fluorescence quantitative PCR detection results of primer q2001F/R to detect soil samples from field.
SamplesCt ValueSeveritySamplesCt ValueSeveritySamplesCt ValueSeverity
123.99+++3223.80+++6324.09+++
223.81+++3323.64+++6435.07--
322.79+++3423.80+++6530.69+
434.11+3522.64+++6619.63++++
533.09+3623.66+++6723.72+++
628.75++3723.92+++6823.60+++
730.10+380.00--6928.07++
828.66+390.00--7032.99+
924.31++4023.06+++7130.29+
1026.84++4136.72--7236.02--
1119.39++++4236.16--7325.65++
1219.84++++4319.19++++7436.68--
1320.12++++4424.73++7522.81+++
1420.33++++4524.02+++7633.17+
1519.06++++4619.84+++7730.13+
1617.80++++4723.80+++7825.42++
1736.60--4833.72+7922.88+++
1820.60++++4924.06+++8022.60+++
1928.59+5031.00+8122.78+++
2019.87++++5134.57+8220.85++++
2131.53+5235.34--8323.67+++
2233.61+5328.83+8424.36++
2333.87+5418.85++++8533.13+
2418.42++++5518.57++++8623.12+++
2525.69++5622.81+++8734.05+
2636.73--5722.73+++8822.66+++
2723.20+++5826.83++8921.84+++
2821.23+++5922.73+++9031.87+
2923.92+++6022.64+++9131.83+
3024.05+++6122.33+++
3123.84+++6222.89+++
Note: “0” means that Sclerotinia spp. is not detected and no symptom was observed in this season; “--” means no Ct value; “+” means the samples severity on the plots that Sclerotinia disease had occurred, the greater the number of plus signs, the more serious the disease, “+++++” represents five or more infected ginseng caused by Sclerotinia spp. at the sampling site in last season; Samples showed “--” also means no symptom was observed in this season but observed in last season.
Disclaimer/Publisher’s Note: The statements, opinions and data contained in all publications are solely those of the individual author(s) and contributor(s) and not of MDPI and/or the editor(s). MDPI and/or the editor(s) disclaim responsibility for any injury to people or property resulting from any ideas, methods, instructions or products referred to in the content.

