Article

Agricultural Practices and Soil and Water Conservation in the Transboundary Region of Kenya and Uganda: Farmers’ Perspectives of Current Soil Erosion

1
Institute of Hydrology and Water Management, Department of Water, Atmosphere and Environment, University of Natural Resources and Life Sciences, Vienna (BOKU) Muthgasse 18, 1190 Vienna, Austria
2
Department of Biological Sciences, Egerton University, Egerton P.O. Box 536-20115, Kenya
3
Department of Biosystems and Environmental Engineering, Technical University of Kenya, Nairobi P.O. Box 52428-00200, Kenya
4
Institute of Chemical, Environmental and Bioscience Engineering, Vienna University of Technology (TU Wien), Getreidemarkt 9/166, 1060 Vienna, Austria
*
Author to whom correspondence should be addressed.
Agriculture 2023, 13(7), 1434; https://doi.org/10.3390/agriculture13071434
Submission received: 12 June 2023 / Revised: 12 July 2023 / Accepted: 14 July 2023 / Published: 20 July 2023

Abstract

:
Poor agricultural practices among small-scale sub-Saharan African farmers can lead to soil erosion and reduce agricultural productivity. However, information on such practices is normally not well documented, making it challenging to design future mitigation strategies. We conducted a fine-scale agricultural survey on 200 farm households within the transboundary Sio Malaba Malakisi River Basin (SMMRB) between Kenya and Uganda to quantify the frequency and type of soil conservation practices (SWCPs) implemented. Information on farm sizes, ownership, crops grown, soil fertility, soil erosion, soil water conservation practices, and the decision-making processes was collected. Descriptive and chi-squared statistics were used to present trends in land use, decision-making processes and the extent of adoption of SWCPs, as well as to analyse the relationship between the SWCPs and the farmers’ perceptions on soil erosion. The region showed highly fragmented farms (mean area: 0.6 ha), primarily practising rain-fed subsistence farming. The principal decision-makers of each farm were mainly (63%) male. Various farmers (28%) lacked soil and water conservation practices (SWCPs). However, most farmers (35%) implemented one type of soil and water conservation practice, while 37% practised a combination of two to five soil and water conservation practices. Extensive soil and water conservation practices such as intercropping were widely practised as they were more affordable than intensive measures. Results on the farmers’ perceptions on soil erosion showed that most farmers in the SMMRB reported soil erosion (60%) and even more (92%) reported to have experienced a loss of soil fertility over the last 5 years. There was a significant positive correlation (X2 (2, n = 198) = 92.8, p = < 0.001) between the perception of soil erosion and the perception of the change in soil fertility, suggesting that reducing soil erosion could result in a reduction in the loss of soil fertility. Thus, there is still a need for strategies and measures to address the soil erosion risks currently faced by Sio Malaba Malakisi River Basin farmers. This study is a baseline study that shows the importance of farmers’ perceptions on the practice of soil and water conservation measures in the Sio Malaba Malakisi River Basin and therefore becomes an important avenue for improving the currently practised soil and water conservation measures as well as developing adoption programs as well as future studies that combine scientific and farmers’ perception/knowledge for sustainable agriculture. Further research into the efficiency of currently adopted SWCPs as well as the extent of the farmers’ knowledge and the accuracy of their perceptions is recommended.

Graphical Abstract

1. Introduction

Sustaining food security and improving environmental quality are among the main challenges facing contemporary societies, particularly in sub-Saharan Africa. Several studies have shown that poor agricultural practices among small-scale farmers can lead to soil erosion and reduced agricultural productivity [1,2,3,4].
Soil erosion deteriorates soil and water resources, posing a serious threat to food sustainability. Indeed, it is one of the major issues confronting sub-Saharan African countries in their pursuit to boost their agricultural output towards sustainable food security and the reduction of poverty [5]. Soil erosion is arguably among the most predominant land degradation mechanisms in the region, often depleting arable lands of essential nutrients, resulting in declining soil productivity; lower soil productivity underlies food insecurity, low incomes, and poverty among rural populations [6]. On farmlands, increased soil erosion could result from land fragmentation [7], poor agricultural practices, climate change, and rainfall aggressivity [6]. Erosion by water is the primary cause of soil quality degradation in both Kenya [8] and Uganda [9,10] leading to reduced agricultural productivity.
Reduced agricultural productivity causes farmers to increase the pressure on their agricultural lands to meet their families’ food demand [3,11,12,13]. The consequences of this pressure are a land-use change on the one hand, converting for instance forests and wetlands into cropland [14], and land degradation on the other hand, by intensifying the use of the land available [15].
Increasing agricultural productivity through expanding existing cultivated lands may not be a sustainable option, as it has adverse effects on the environment, such as the loss of natural forests. In Uganda, for example, ref. [9] noted that the country has been experiencing a long-term decline in vegetation cover and ecosystem productivity due to land degradation. Ref. [16] reported land degradation in Uganda at over 41,506 km2 (17.6%) in forest and croplands within 22 years (1981–2003), with a total net primary productivity (NPP) loss of about 1.5 megatons of carbon affecting over 15% of the national population. Similarly, the same study also showed that Kenya had 104,994 km2 (18.0%) of its land degraded with an NPP loss of 6.6 megatons of carbon, affecting 36% of its national population. A decline in the NPP across 40% of the croplands in Kenya created huge constraints due to increased food demand from the doubling human population during the same period [16]. Another example by the authors in [17], whose study investigated the impacts of land-use changes on soil erosion in the western part of Kenya, showed that the major form of land-use/land-cover change was the conversion of 108,103 ha of grass/shrub land and 48,729 ha of forestland to farms, leading to a total soil loss of 56,260 tons and 40,696 tons, respectively. The highest soil erosion rates of 0.84 tons/ha and 0.52 tons/ha were realized in the conversion of forest and grass/shrub lands to farms, respectively [17].
Measures implemented by Kenya and Uganda to increase agricultural land productivity have mostly resulted in the degradation of agricultural lands [9,16,18]. Agricultural intensification without implementing improved land management practices such as soil and water conservation practices (SWCPs) can negatively impact soil productivity by increasing erosion [1,9,19]. Therefore, it is important that soil improvement and conservation through the application of appropriate SWCPs are implemented, not only to maintain soil functions but also to improve food security, which is largely dependent on agriculture [6].
Understanding farmers’ perceptions and behaviour towards the adoption of SWC practices is integral in preventing soil erosion, conserving water resources and ultimately curbing land degradation [20]. There are several studies that have been carried out in Eastern Africa to this effect, demonstrating the importance of understanding what happens on farms through the farmers’ perspectives. These studies have sought to analyse how the farmers view or comprehend the presence of soil erosion on their farms and the importance of their perspectives as a pathway to increasing the effectiveness, efficiency, and sustainability of natural resource conservation, including the practice and implementation of SWCP programs. Some of the above-referenced studies include [6] in Northern Kabare, D.R. Congo; ref. [21] in the Gojeb river catchment in Ethiopia; ref. [22] in Awi Zone, Amhara Regional State of Ethiopia; ref. [23] in the Bokole and Toni watersheds, which are part of the Omo-Gibe basin in Ethiopia, that drains in the Lake Turkana, the world’s largest and permanent desert lake that borders Ethiopia and Kenya. Particularly in Uganda, [2] showed that farmers’ perceptions of soil erosion played a crucial role in the decision-making process towards the adoption of SWCPs. This study, among others, seem to suggest that SWCP policies and guidelines should consider the farmers’ awareness of critical farm phenomena such as soil erosion as well as their knowledge of conservation practices in order to improve the possibility of their acceptance and adoption, the best SWCPs to adopt, to what extent they would be adopted, and whether these measures would be maintained in the long run. For example, traditional soil conservation methods such as surface runoff diversion ditches/trenches have been used as a relatively cheap option by many smallholder farmers and have provided the availability of waterways to divert excess runoff from farms [24]. These trenches also do not require any expertise to set up. Contour furrow has been used to plant crops in a row and serves as a cross-slope barrier for surface runoff and sediment to limit erosion [24]. Terraces are labour- and time-demanding techniques [6]; they tend to be rarely practised and when practised, in most cases, they are not well maintained. Generally, the implementation of SWCPs allows the farmers to evaluate the soil erosion control improvements. Such issues set the premise that farmers’ perceptions do affect the selection and continued use of SWCPs and should be considered in the development and implementation of policies for future soil and water conservation programmes in Eastern Africa.
This study was carried out as a baseline study to collect crucial data on crops grown, soil erosion status, soil fertility, and the soil and water conservation practices (SWCPs) as perceived by the farmers in a transboundary data-sparse catchment to provide a basis for other studies. The Sio Malaba Malakisi River Basin (SMMRB), shared by Kenya and Uganda, was chosen for this study mainly due to its vulnerability to soil erosion and degradation. The vulnerability is due to the high population (>2 million), high population density (470 persons/km2), and the dependence on agriculture as the primary means of livelihood for 80% of the population within the basin [18]. The human population in the basin is projected to double (∼4 million) by 2035 [18]. The river basin, therefore, provides an excellent example of where high population growth and density have led to excessive land fragmentation, pushing farming activities into marginal areas that are vulnerable to soil erosion and nutrient loss [1,2,18,25,26]. Despite the basin’s vulnerability to soil erosion and land degradation, only a few studies have been conducted, and they mainly focused on smaller subcatchments of the SMMRB or on neighbouring catchments only [27]. For example, ref. [28] studied the land-use and land-cover changes at Sio River, a Kenyan subcatchment of the SMMRB and reported a decline in wetland and bushlands with a 14% increase in small-scale farming from 1986 to 2000. Other studies, e.g., refs. [7,25,28] on the Manafwa river subcatchment in Uganda (located adjacent to the SMMRB) concluded that improved agricultural management could lead to an increase in yields and compensate overexploitation of land. However, more than 50% of the Manafwa catchment has been reported as having a high erosion risk [7]. The neighbouring regions to the catchment have been experiencing land degradation as large areas of natural forest cover, riparian zones, and seasonal wetlands have been converted into agricultural use [25,27,29,30,31,32]. The degradation includes the destruction of riverbanks, transport of sediments downstream, sedimentation of wetlands, and an increase in soil erosion [18]. The above-highlighted findings, among others, underpin the utmost need for a swift implementation of conservation agriculture along the SMMRB. Indeed, the proper application of SWCPs has been demonstrated to mitigate soil erosion effects. For example, Ref. [33] showed that soil-conscious tillage practices significantly reduced runoff depths, sediment yields, and the decomposition of sediment aggregates. Ref. [34] further demonstrated that such soil conservation practices were effective even in fragile soils by boosting the soils’ structural stability. Similar interventions would therefore be beneficial in the SMMRB areas with a high erosion risk from land degradation, such as the Manafwa catchment and its environs.
Mitigating land degradation associated with agricultural practices while also improving food production requires the participation of all stakeholders and a follow-up on the effectiveness of the implemented measures [35]. The SMMRB stakeholders (e.g., local farmers, agricultural extension officers, nongovernmental organizations that work with farmers on the ground, farm input suppliers, and researchers) need to understand the types of crops grown by the farmers and their current farming practices. Little is known about the extent of SWCPs carried out by the local farmers and the critical decision-makers in charge of each farm within the basin. Despite the heterogeneous topography of the SMMRB terrain, there is hardly any information on the current status of soil erosion and any link between the farm practices and the soil erosion status and SWCPs from the farmers’ perspective. This study was therefore designed to obtain baseline information from the local farmers on the farming practices (crops grown), farm management (decision makers), the status of soil erosion, and the conservation practices implemented. This knowledge is critical for the local administration for developing or improving conservation strategies as well as policies on conservation agriculture within the SMMRB, which will eventually increase yields for the local farmers, as well as for transferring knowledge to river basins that have similar characteristics within Kenya and Uganda or even within Africa.
Given this background, the following research questions focus on the (i) crops grown, (ii) soil erosion and soil fertility, and (iii) the soil and water conservation practices (SWCPs) in the border region between Kenya and Uganda:
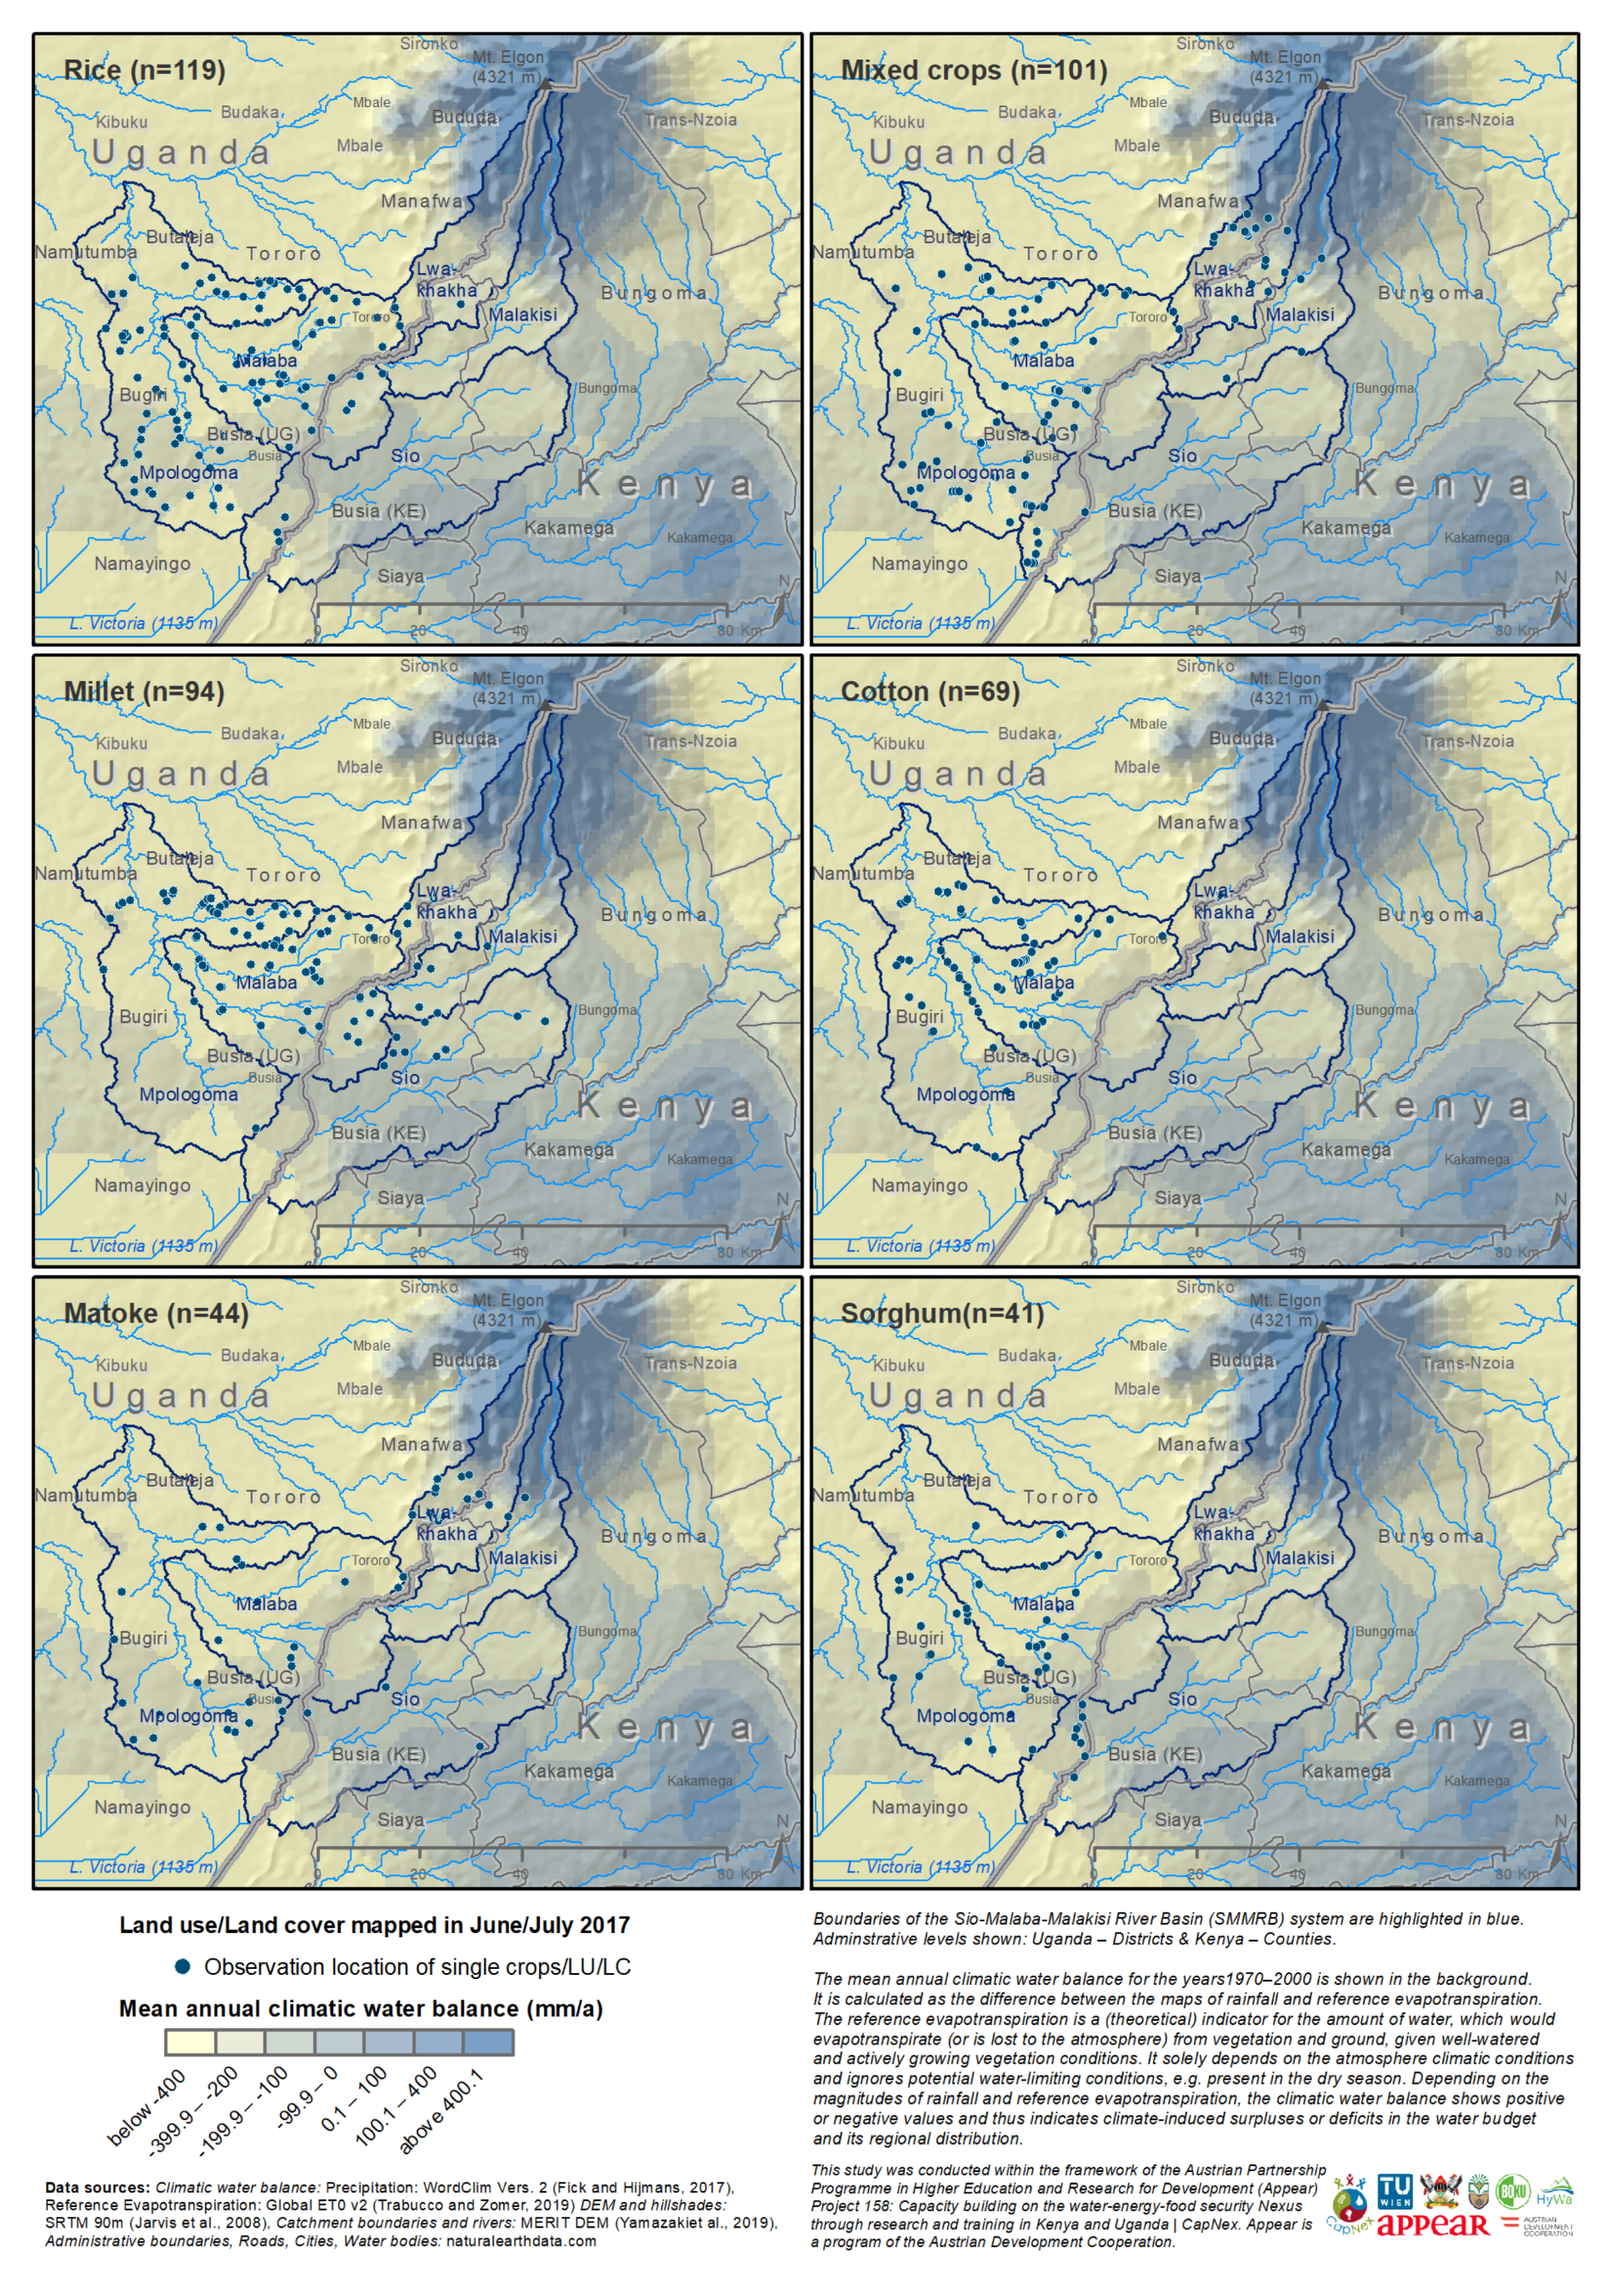
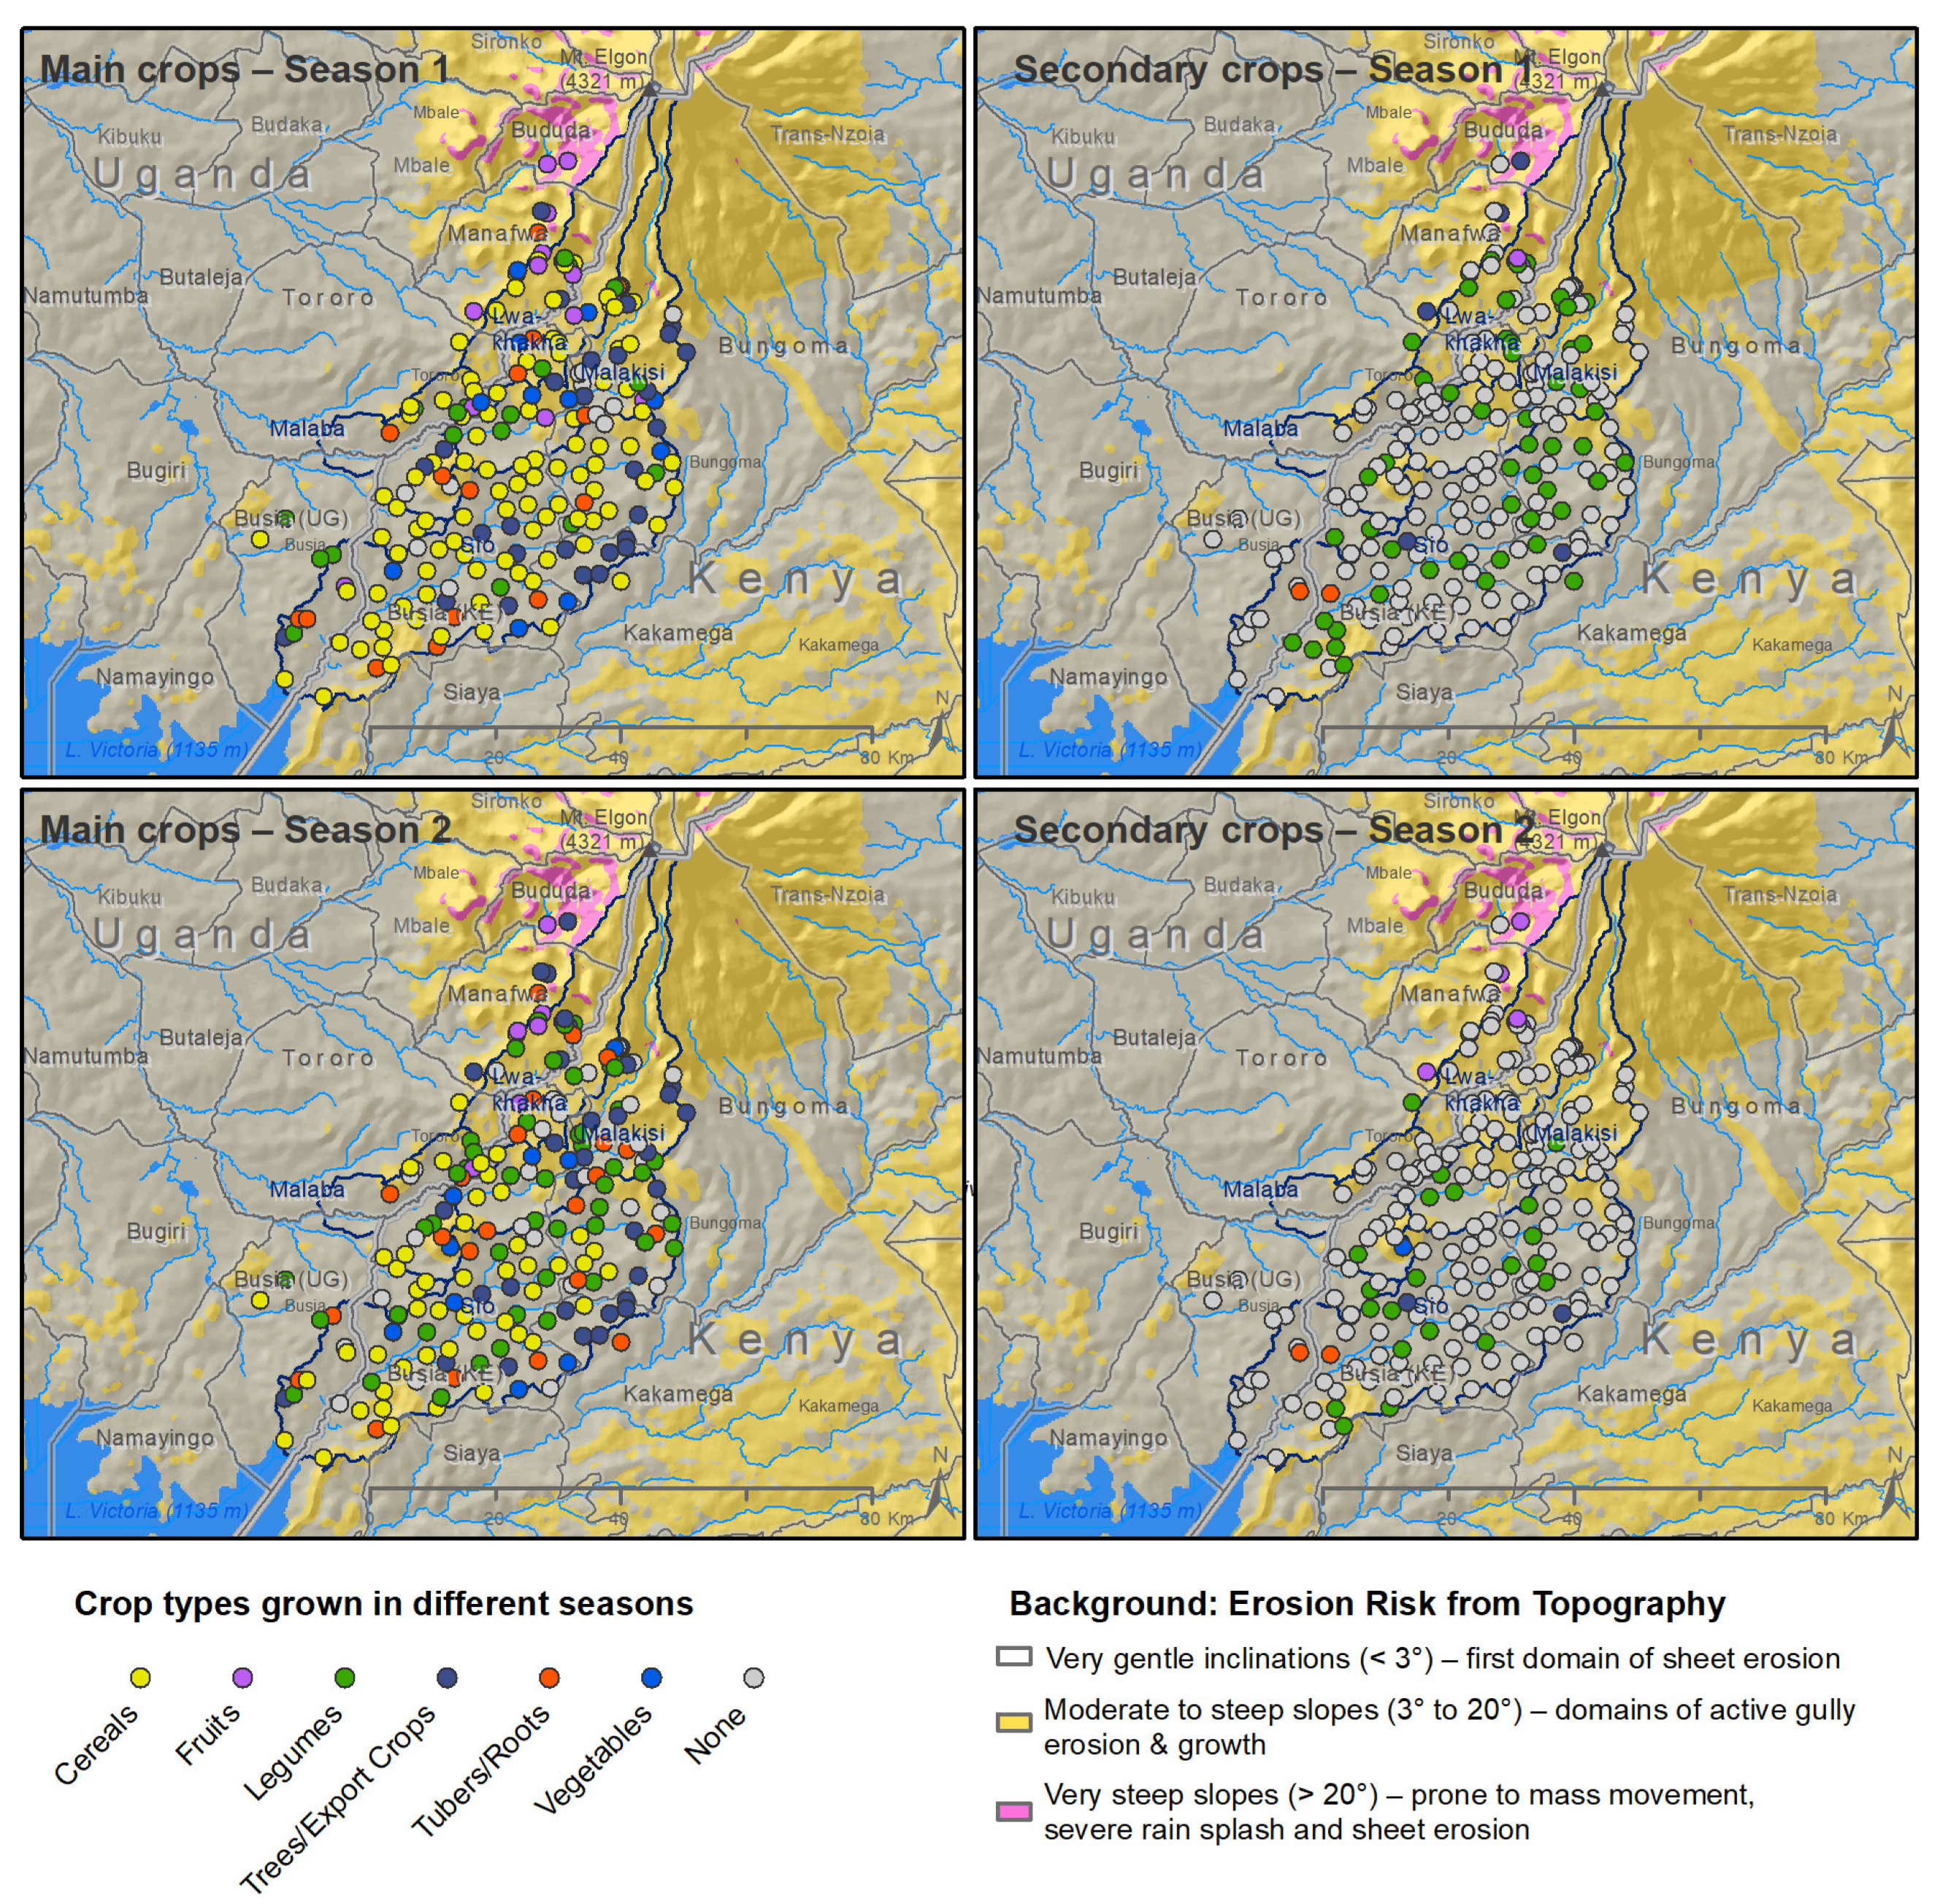
  • What are major crops grown in the Sio Malaba Malakisi River Basin, and how are they spatially distributed in relation to the slope?
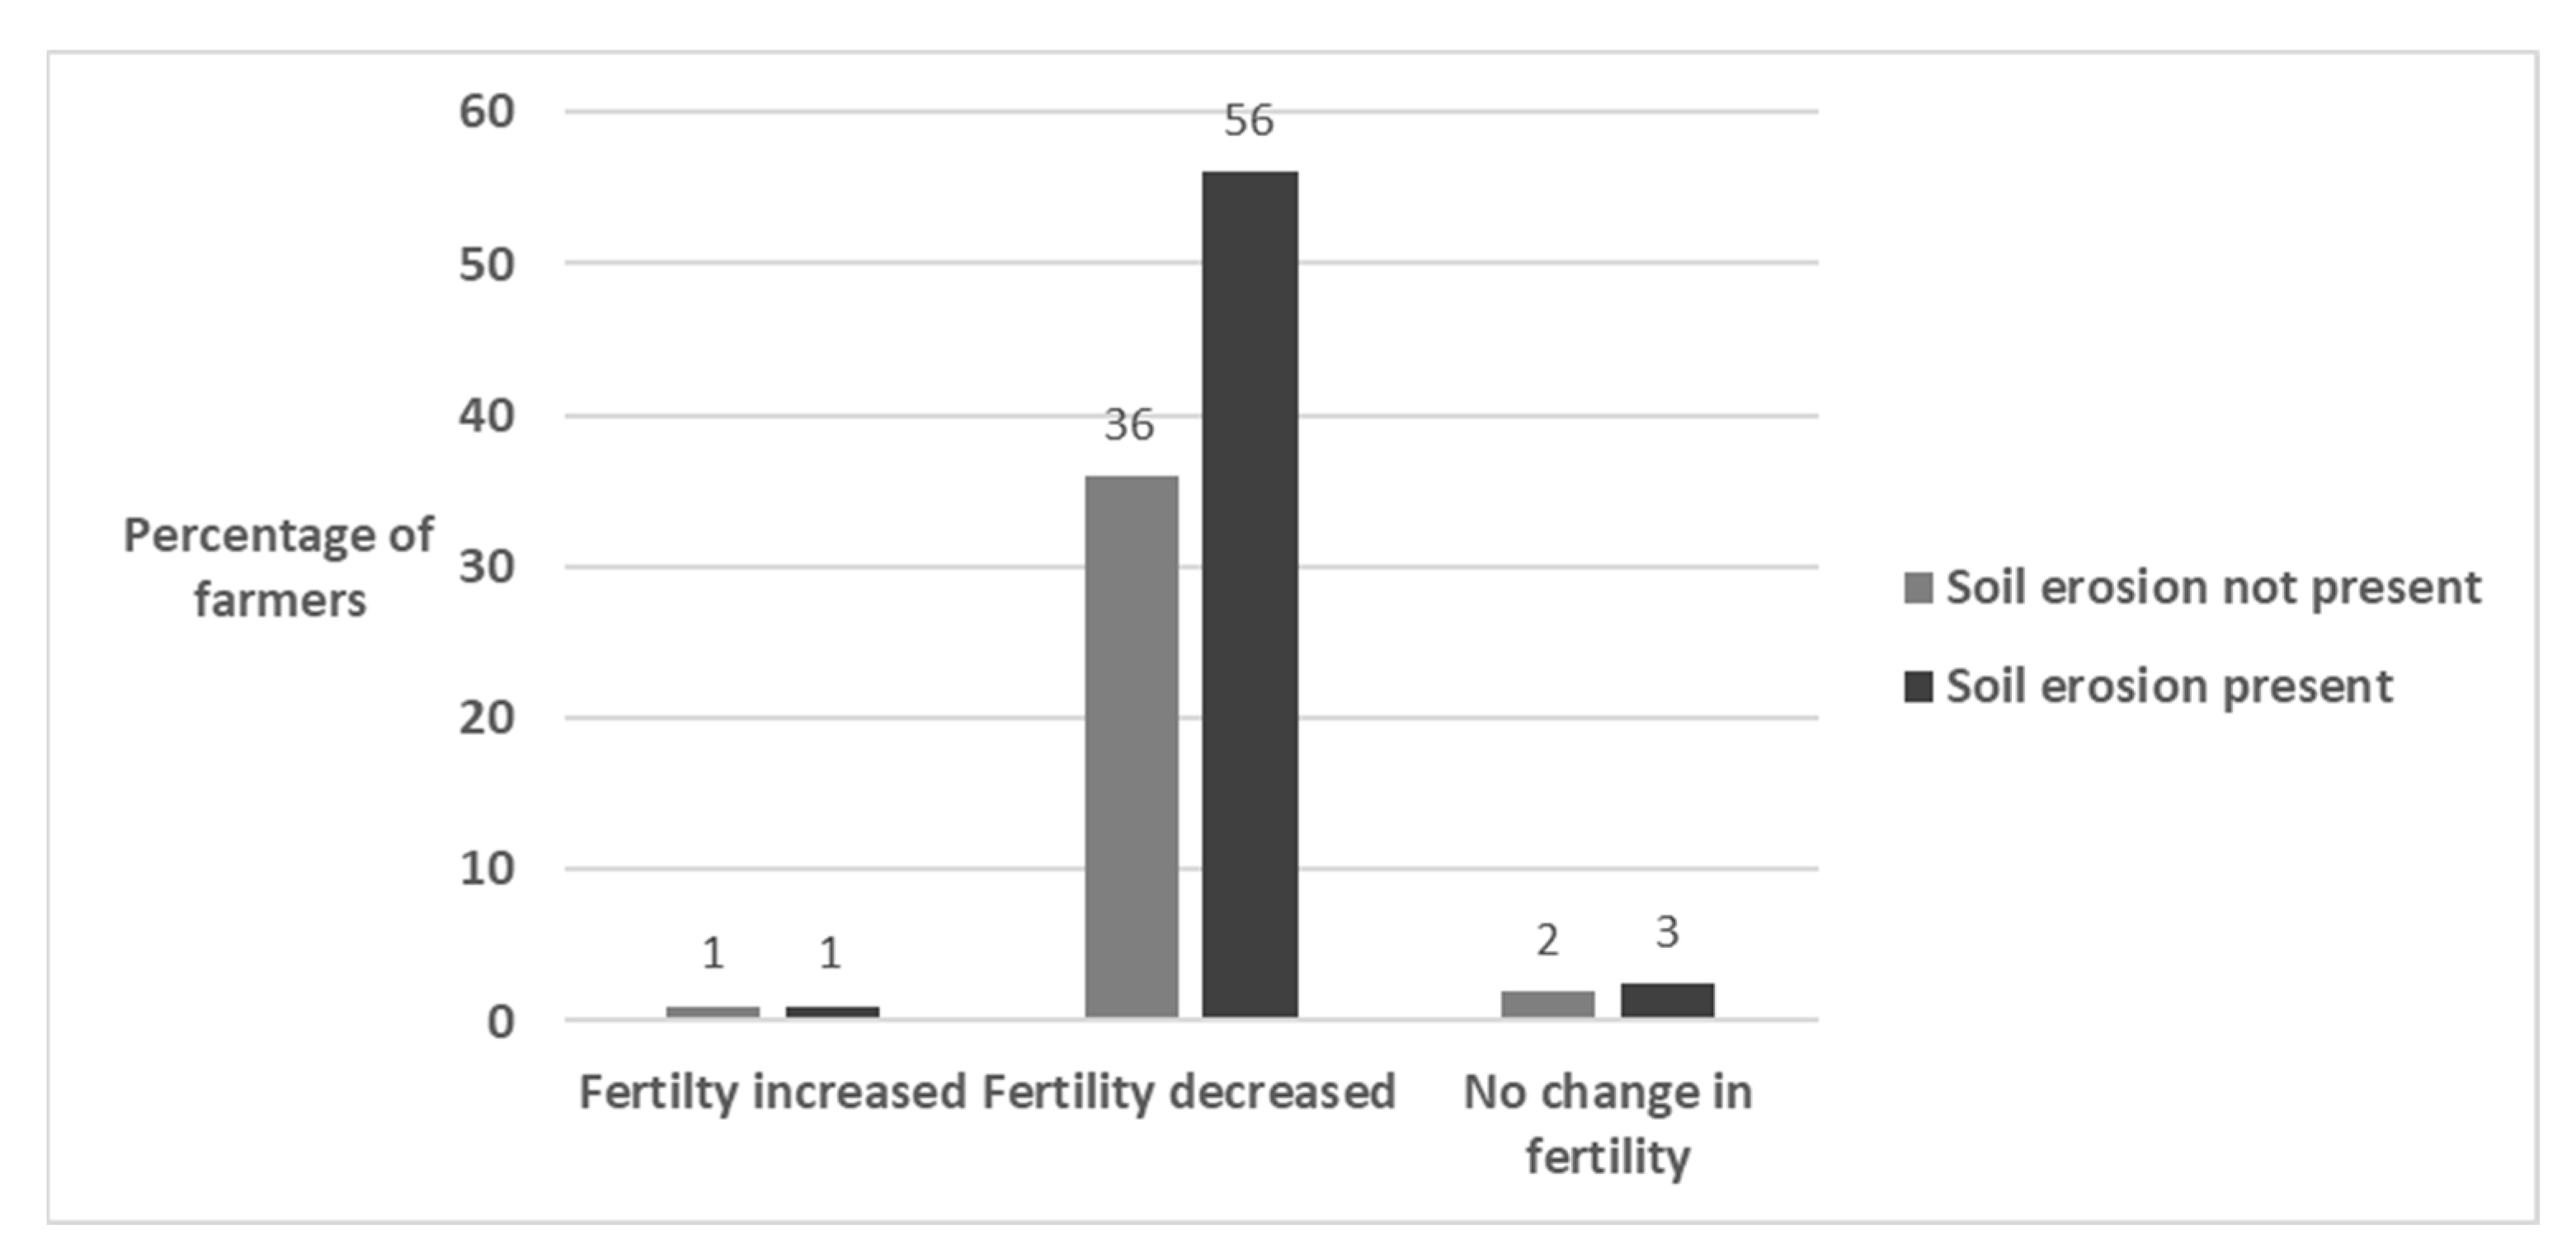
  • What is the current soil erosion status as reported by farmers on their farms? Does the reported soil erosion vary along the different slope categories, and does it influence the perceived change in soil fertility?
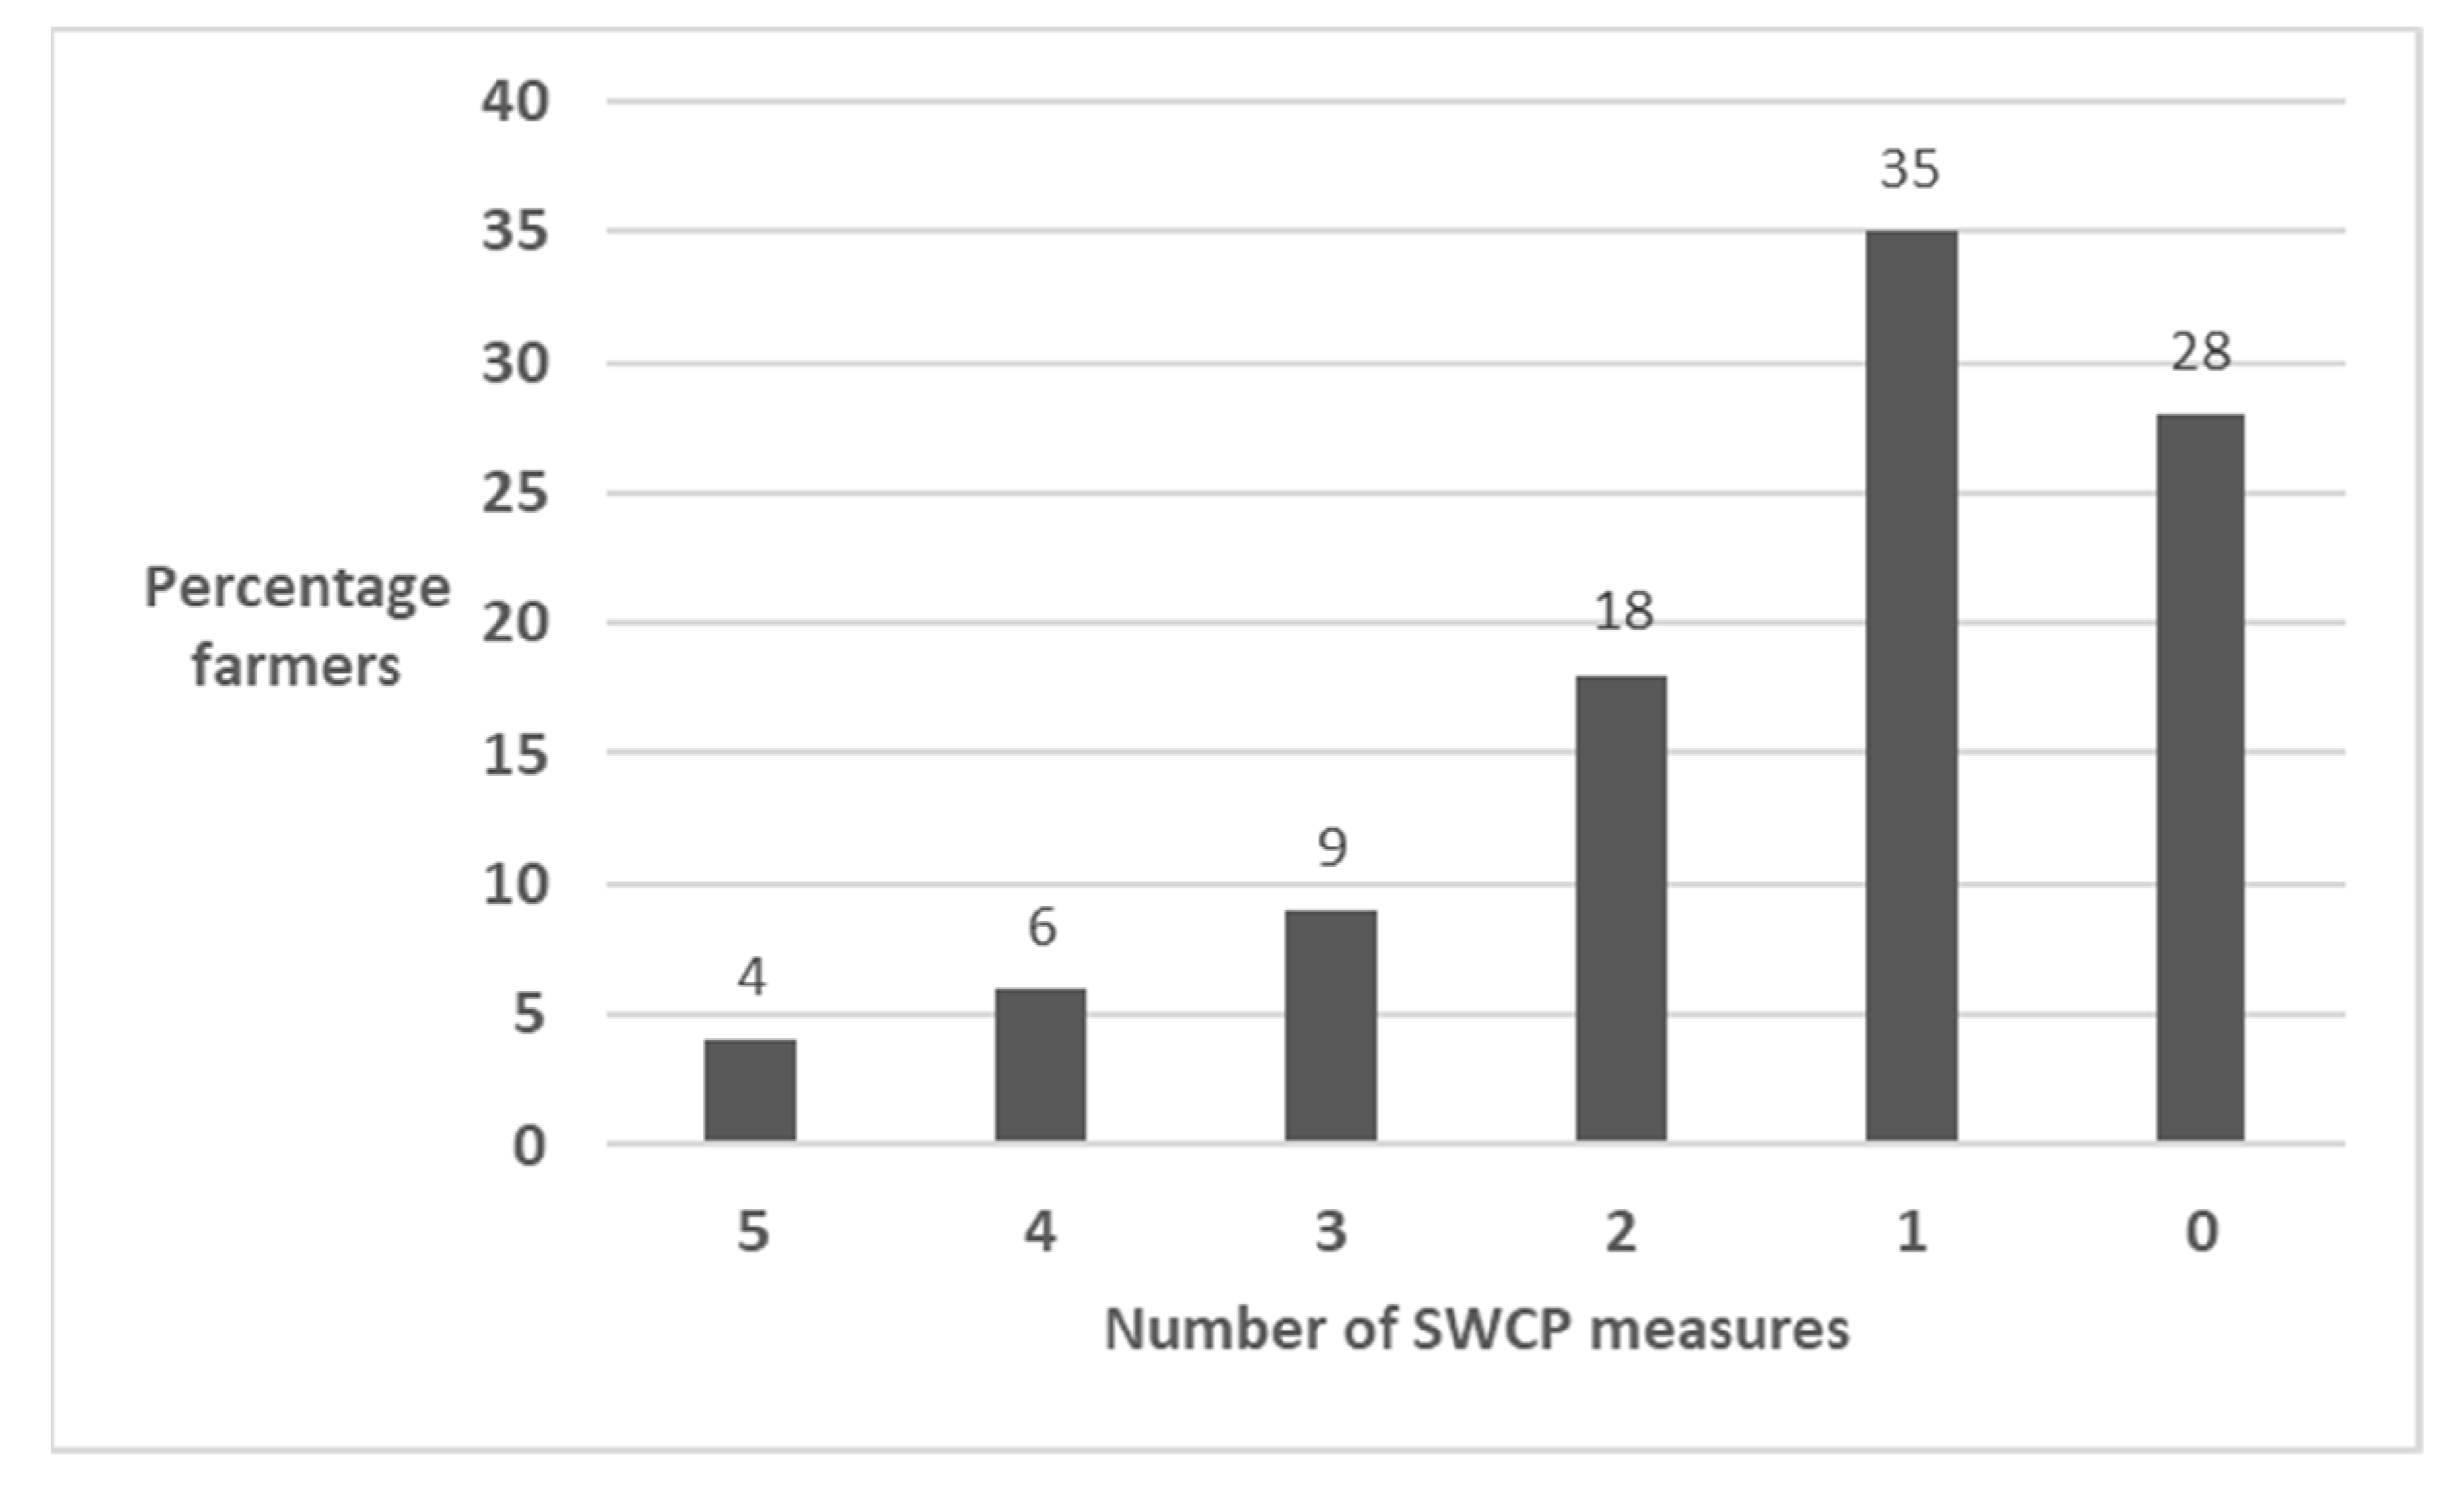
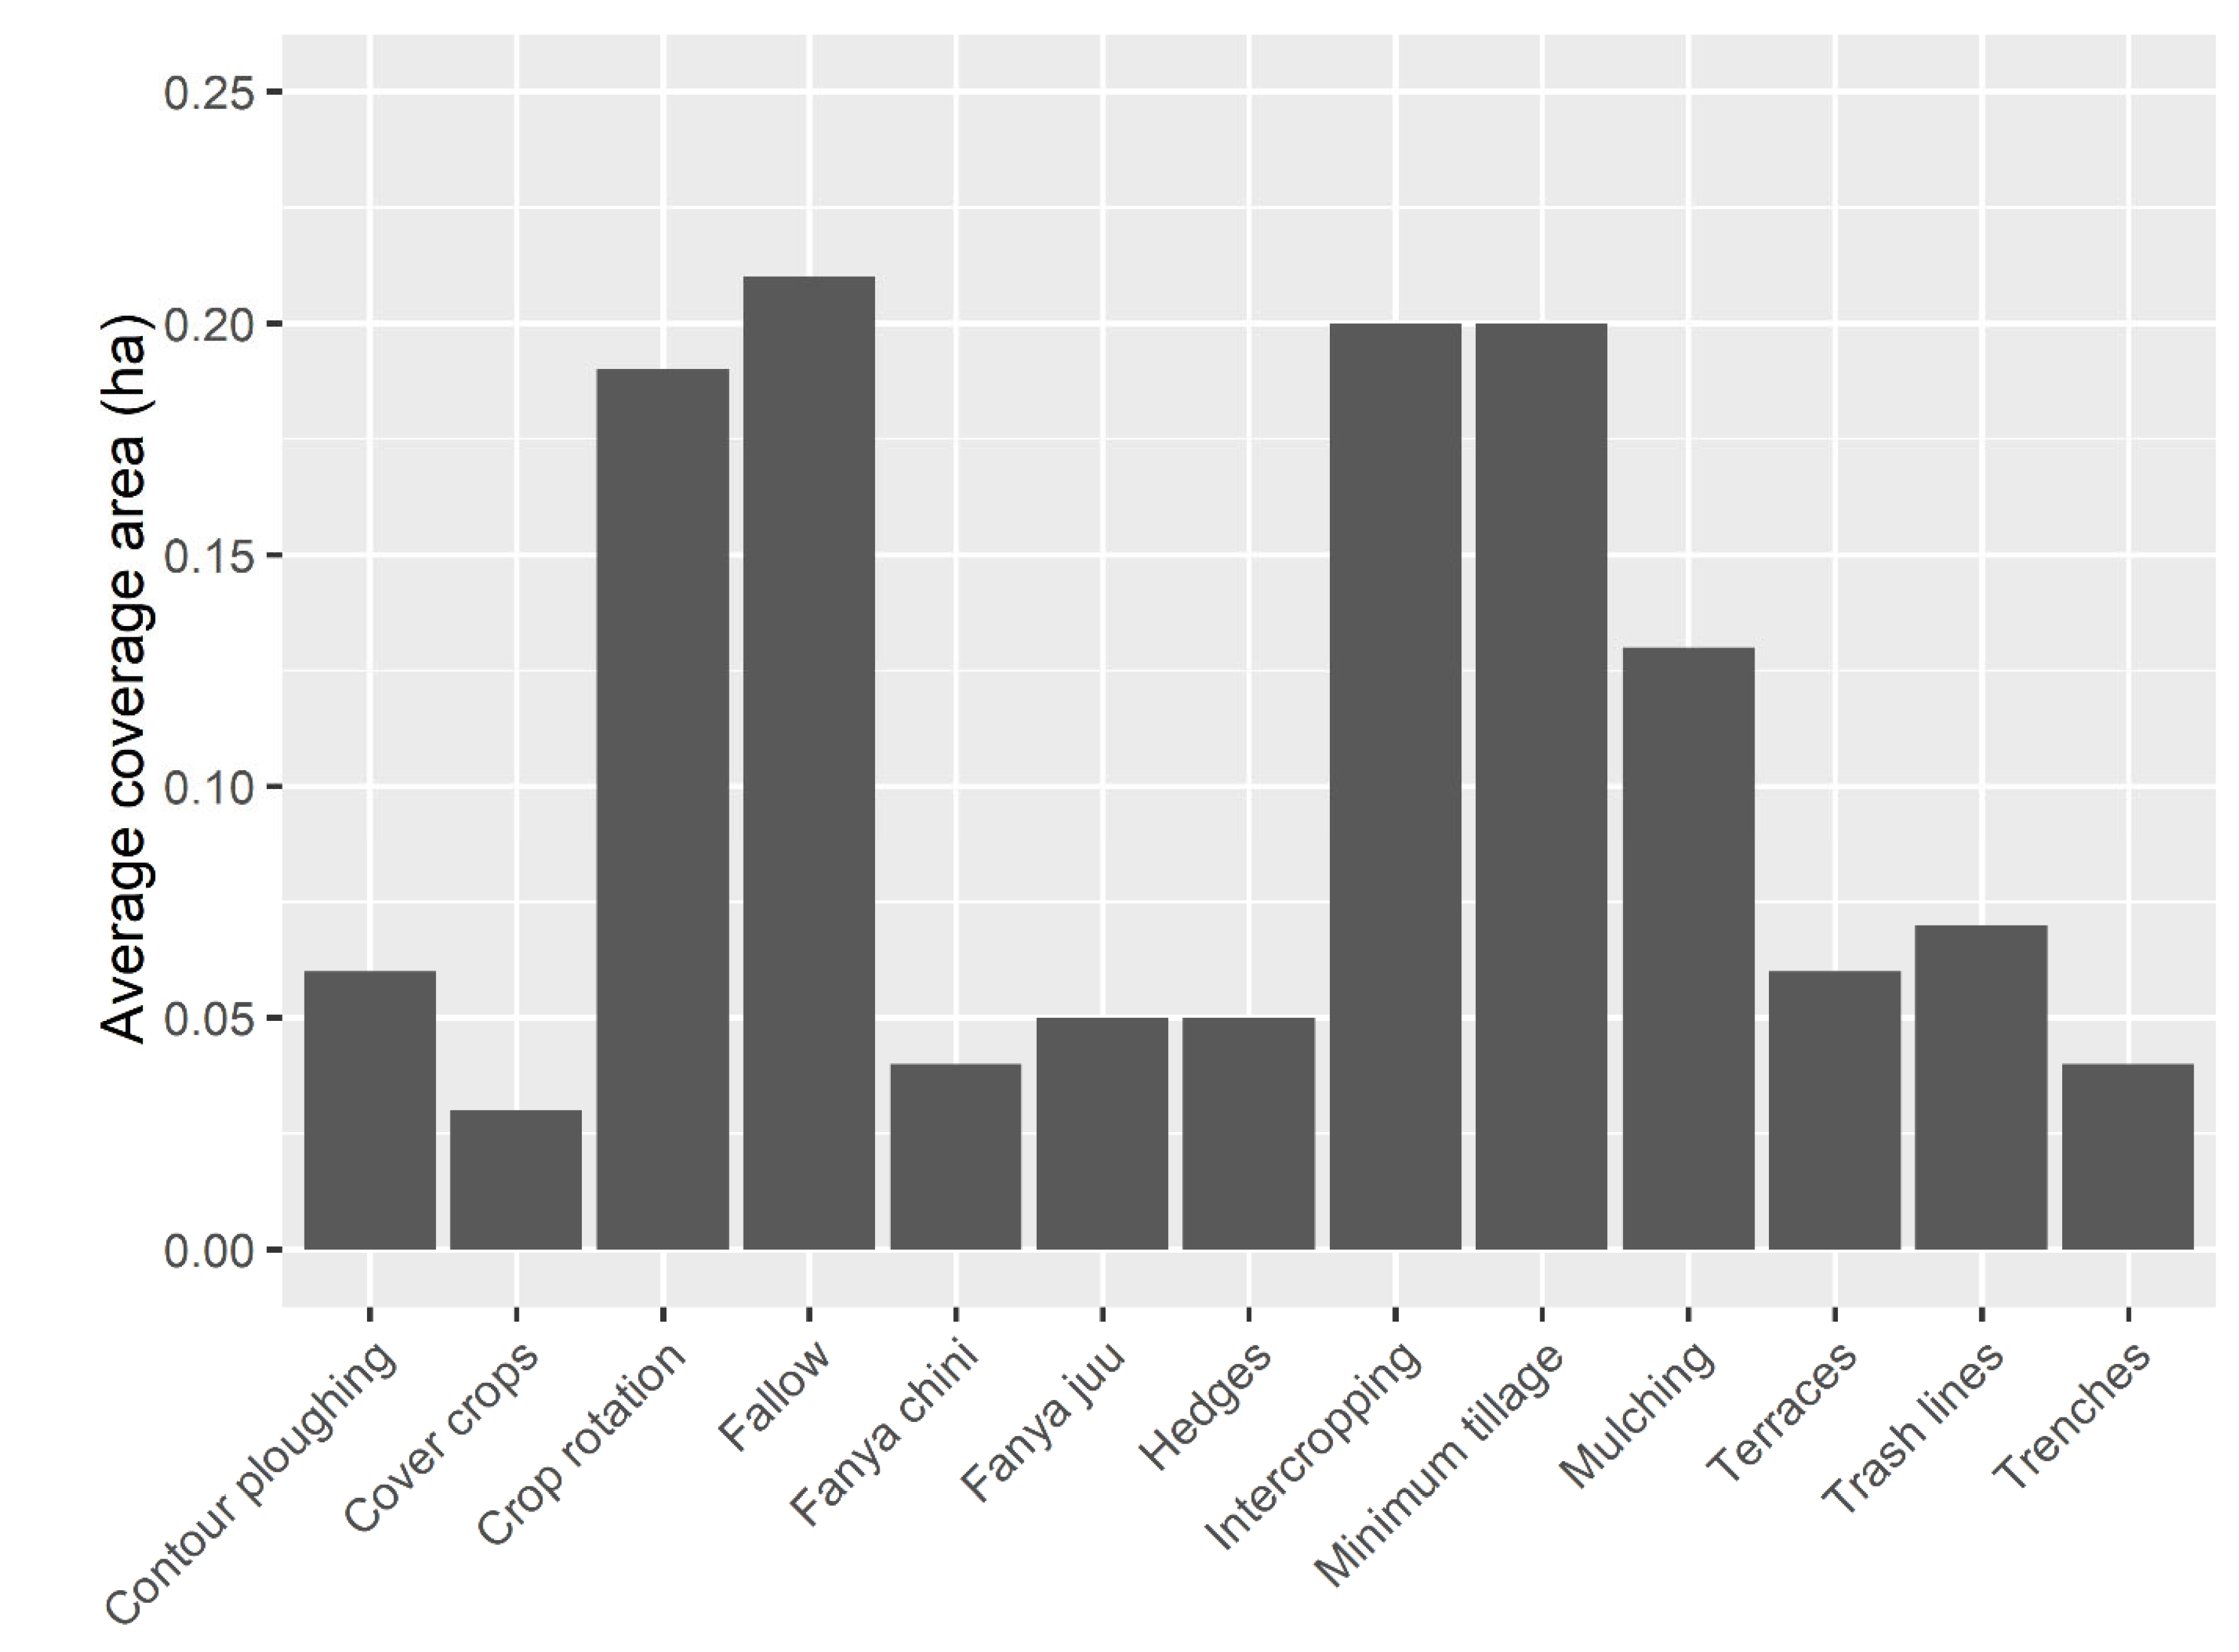
  • Which soil and water conservation practices are applied by the farm households, and how do they vary based on topographical positions?
  • Who are the key decision-makers for adopting agricultural practices in each farm household, and how do these decision-makers influence the adoption of soil and water conservation practices?
These questions will help to determine potential linkages between soil erosion as perceived by farmers and the soil water conservation practices practised by the farmers as reported by farmers themselves. This was achieved by applying a mixed-methods approach of social scientific data collection and by interviews with farmers, followed by a statistical analysis of these data.

2. Materials and Methods

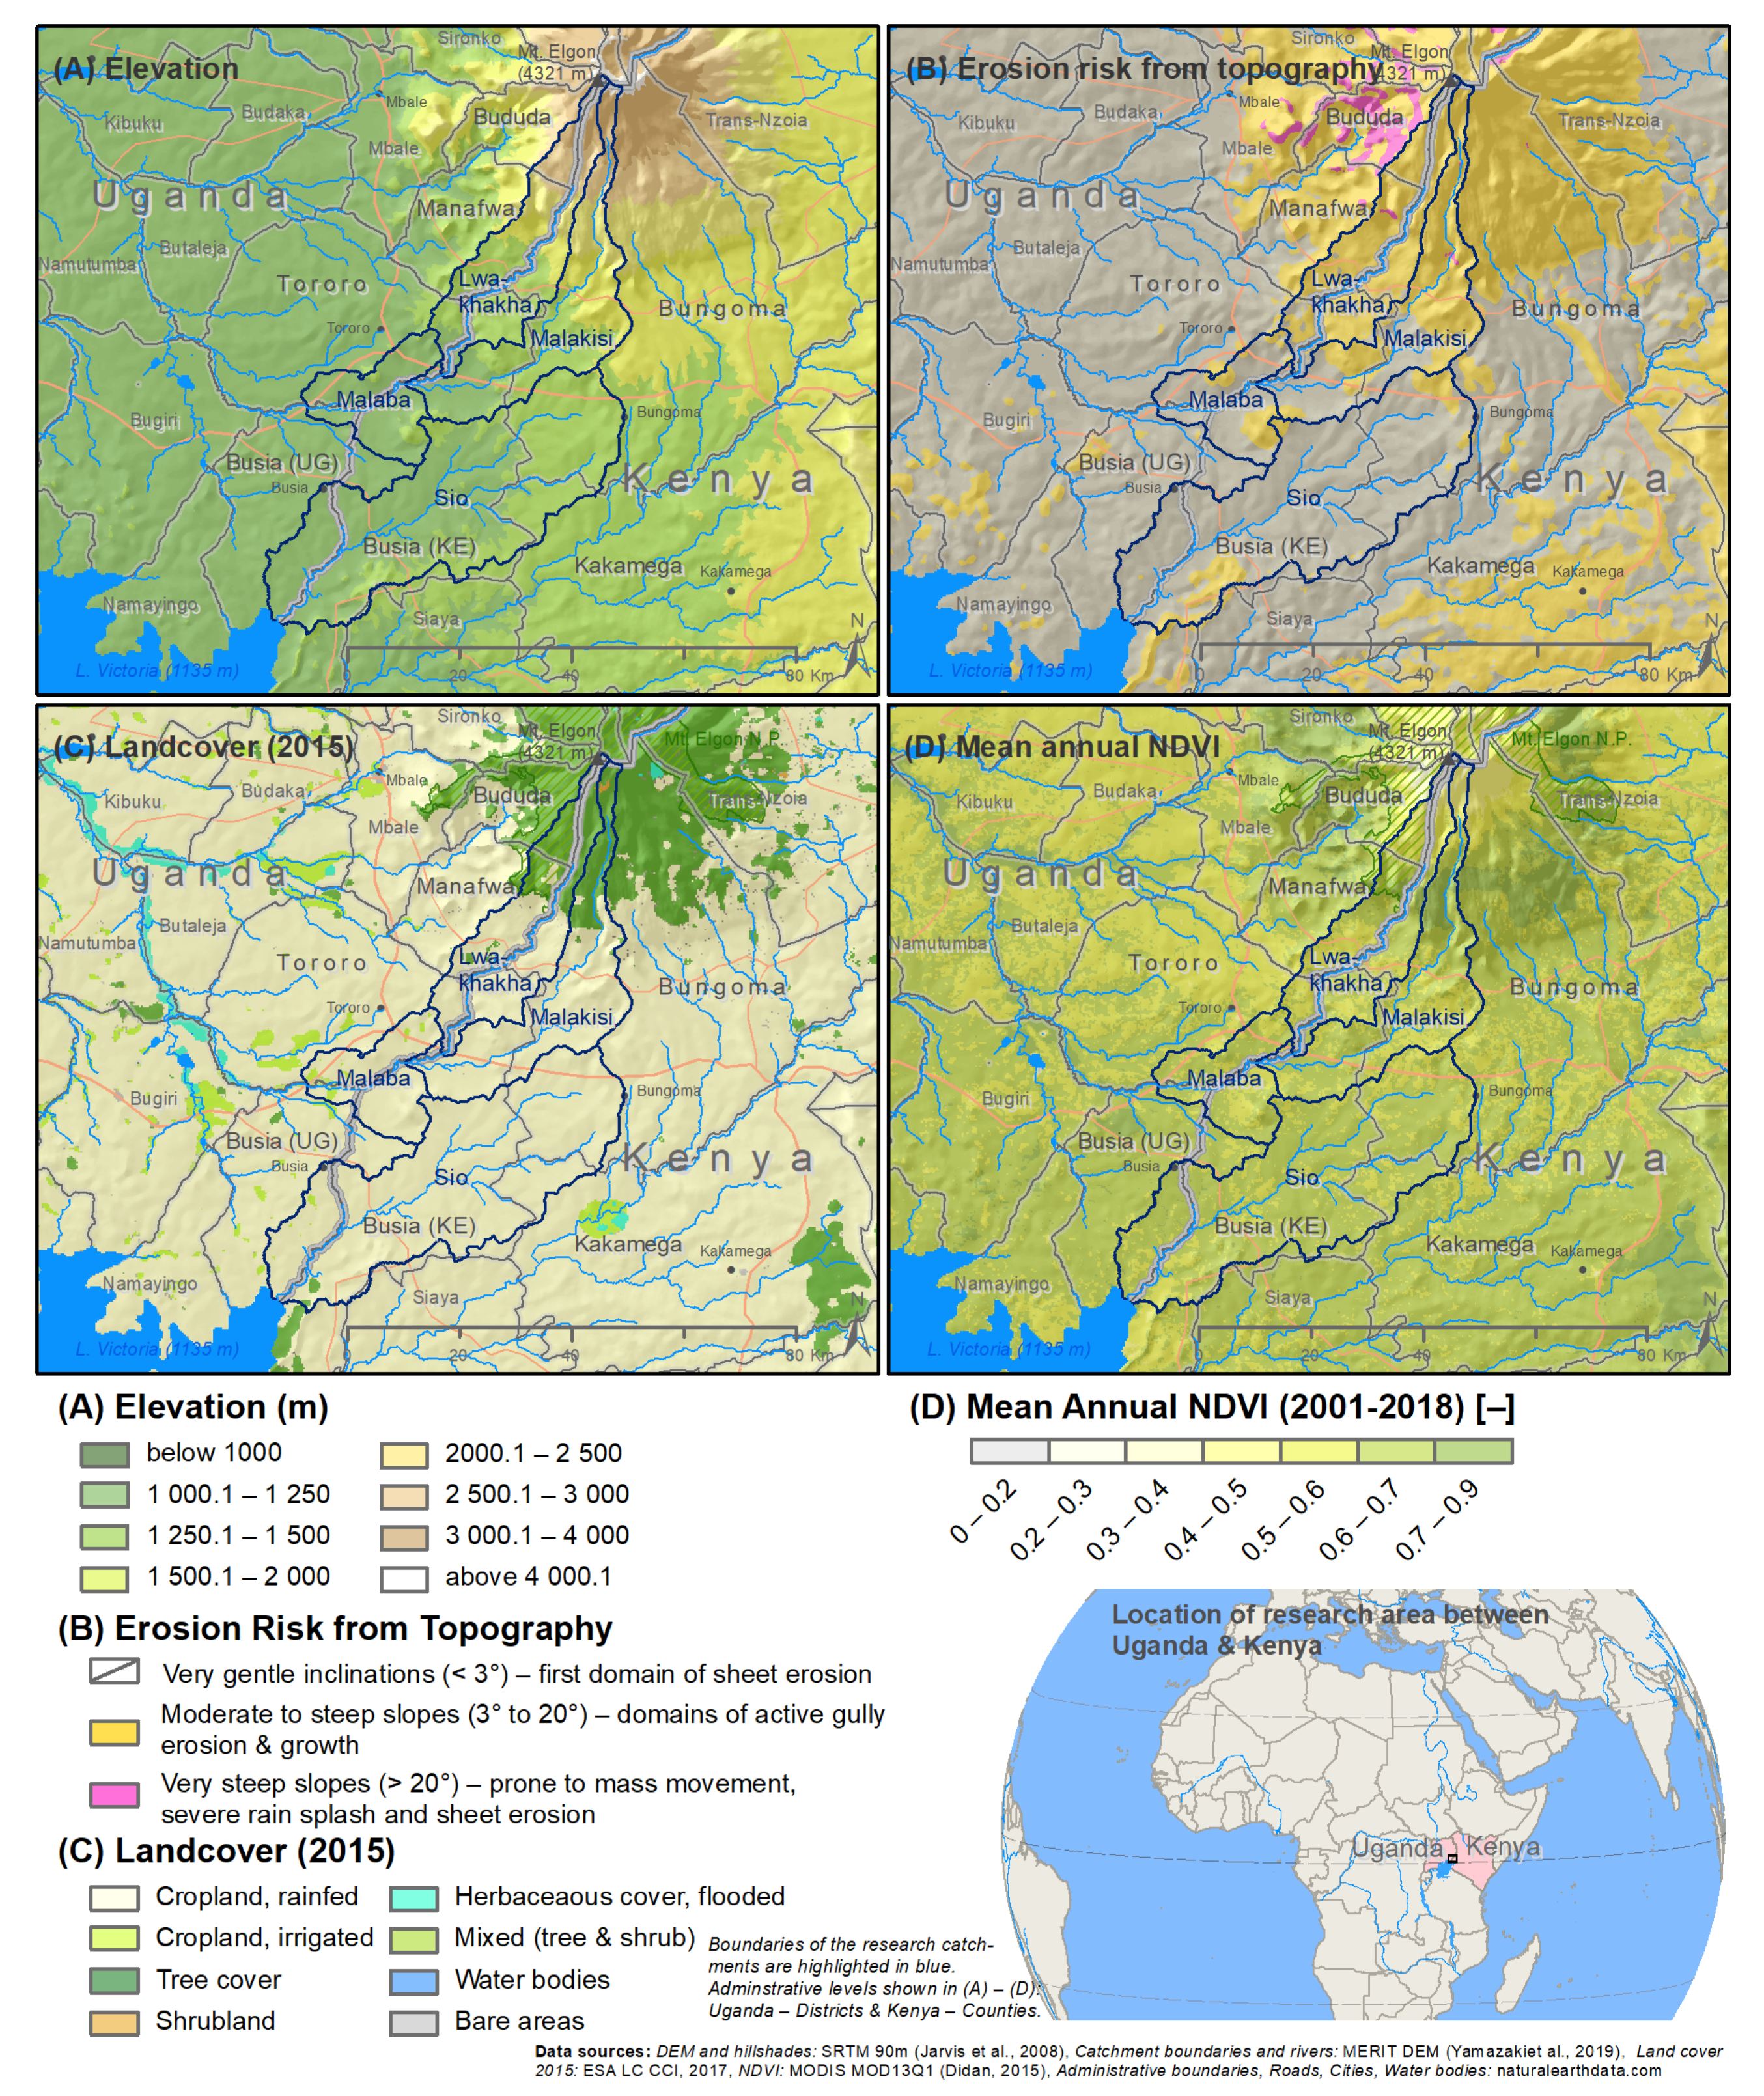
2.1. Case Study Area

The Sio-Malaba-Malakisi River Basin in the border region between Kenya and Uganda is bounded by Mount Elgon in the north and Lake Victoria in the south (between latitude 1.133° north to 0.193° south and longitude 33.673° west to 34.571° east) (Figure 1). The studied area comprised two main river catchments (Sio catchment and Lwakhakha-Malaba-Malakisi catchment), which cover a total area of 3022 km2, with most (78%) of the area in Kenya and the rest (22%) in Uganda. Figure 1 generally illustrates the characteristics of the study area and shows the elevation, classification of the soil erosion risk following [36], land cover classification with the reference year 2015 [37], and the mean annual MODIS NDVI [38] as a proxy for vegetation cover. The visualization was done with ArcGIS Desktop.
The Sio Malaba Malakisi River Basin has a heterogenous topography ranging from flat areas of low soil erosion risk located near Lake Victoria (1134 masl) to steep hills with a high risk of soil erosion towards Mount Elgon (4321 masl) (Figure 1B). The landscape has different land uses and land cover, with forests mainly covering the mountain slopes (Mount Elgon national park and Busitema forest reserve). The primary land use (>70%) is mostly rain-fed agriculture and fewer sections of irrigated agriculture with various types of crops (Figure 1C). The basin also has different inland waters such as wetlands, lakes, and rivers. The normalized difference vegetation index shows that it is mostly covered by vegetation, with higher vegetation densities around Mount Elgon (Figure 1D). The area has a population density of around 470 persons per km2 [39,40,41] (see Supplementary Materials) and thus has one of the highest population densities in subsistence-farming-dominated rural areas in sub-Saharan Africa [42]. All of these characteristics (high population and high soil erosion risk) are more pronounced in the SMMRB than in other regions investigated by researchers studying soil erosion in Africa, including the Nabajuzi watershed in Uganda [43] or the Mo river basin in Togo [44].

2.1.1. Hydrology and Climate

The Lwakhakha-Malaba-Malakisi rivers originate from Mount Elgon and flow into Lake Kyoga and its wetlands in Uganda. The Sio River, which has a catchment area of about 1410 km2, stems from the marshy land west of Bungoma town. It flows along the Kenya–Uganda border before it discharges into Lake Victoria. Soil erosion risk is apparent in the northern parts of the catchments, where the topography is dominated by the steeper slopes around Mount Elgon (Figure 1B). Mt. Elgon is an extinct shield volcano and is the oldest and largest solitary volcanic mountain in East Africa. With a volcanic base of around 80 km in diameter, it is, in terms of width, the largest in the world.
Climatic conditions within the SMMRB vary, with upstream regions having a humid climate and a subhumid climate in the midregion. The rainfall patterns are influenced by the water currents from Lake Victoria and the Intertropical Convergence Zone [18,45] The region experiences bimodal rainfall patterns with short rains from October to December and long rains from March to May. The basin also receives two types of rainfall; orographic rainfall in the mountainous terrain of Mount Elgon (mean annual rainfall > 1800 mm) and convectional rainfall in the low-lying areas near Lake Victoria. The temperatures within the basin are also highly variable due to the orographic features related to Mount Elgon. Low-lying areas experience a maximum average temperature of about 28 °C, whereas the slopes of Mount Elgon average about 5 °C [46]. In the lower-lying areas, the mean maximum temperature is about 27.5 °C.
Pan evaporation rates are only recorded in Kakamega to the west of the study area, where a mean annual pan evaporation of 1760 mm/yr is observed. Monthly sums from 120 mm/month in June and July to 160 mm/month in the dry-season months from December to March are observed. Winds over the SMMRB catchment closely follow the pattern of the movement of the sun across the equator through the Intertropical Convergence Zone (ITCZ). Rainfall is also influenced by the ITCZ. This, in combination with the low pressures over Lake Victoria, dictates the distribution of rainfall over the periphery areas along its shoreline around Busia in Uganda and Kenya, where average annual rainfall ranges between 1460 mm to 1600 mm according to [18]. In the mountainous terrain of Mt. Elgon, orographic rainfall is experienced and on the southern, windward side, higher precipitation sums are present. The low-lying areas tend to be drier. Areas of higher elevation in Mt. Elgon receive an average annual rainfall of over 1800 mm, while those on the northern, leeward side receive less rainfall ranging from 900 to 1180 mm. Generally, in the last decade, an increasing trend in rainfall in the area has been found [47].

2.1.2. Land Use, Land Cover, Agriculture, and Soil Erosion

The land use and cover in the SMMRB is dominated by rain-fed cropland (86%) and natural forests (11%), the latter mostly located in the Mount Elgon National Park on the slopes of the mountain. Other areas such as irrigated cropland (2%), shrubland (0.4%) and built-up land (0.16%) are of lower relevance (Figure 1C). The lack of pastures is particularly remarkable, since the livestock numbers and densities in the area are considerable. The main crops grown include maize, cassava, sweet potatoes, plantain, rice, and beans. On the Kenyan side, sugar cane is additionally an important cash crop. The small-scale agriculture and crops grown are generally very heterogenous. Figure 2 and Figure 3 give a qualitative impression of this fact.
Due to the population increase in the area, a massive land-use change has been observed in the last decades, transforming forests, grassland, bushland, but also wetlands, into cropland [7,27]. As a consequence, the risk to natural hazards such as soil erosion and landslides has increased, particularly in the very steep slopes (inclination >20°; 3.5% of the area) towards Mount Elgon in the Northern part of the SMMRB as shown by [7] and Figure 1B. The resulting soil loss caused by erosion on the steep slopes was thus estimated by [25] at very high values of up to 200 t ha−1 yr−1 and more, while in the flat areas (inclination <3°; 52% of the area) and in land with forest cover, the soil loss was estimated at below 10 t ha−1 yr−1. In [7], the authors determined much higher soil losses of up to 5000 t ha−1 yr−1 for the steep slopes. This soil loss is, however, of a magnitude that hardly compares to values found in the literature, not even in erosion-prone Ethiopia [48,49]. A mean annual soil loss of around 40 cm (when assuming a bulk density of 1.2 t m−3) seems unrealistic.

2.1.3. Socio-Economic, Socio-Cultural, and Political Aspects

The study area has a population of 1,412,100, of which 1,064,800 and 348,100 live in Kenya and Uganda, respectively [39,40,41]. The population density is exceptionally high, with many people within the region practising subsistence farming and livestock rearing. On the Ugandan side, the study area is in three main districts: 30% in the Busia district in the south, 28% in the Manafwa district in the north, and 32% in the Tororo district in the middle. The other parts of the basin in Uganda are 10% in the Bududa district and 0.1% in the Kwen district. In the year 2017, Manafwa was divided into the Namisindwa and Manafwa districts. However, in this study, we refer to the old Manafwa district as existent until 2017. The districts in Uganda are equivalent to subcounties in Kenya. The SMMRB is in 4 subcounties in Kenya, mainly in Busia (56%) and Bungoma (39%) and the smaller parts in Kakamega (5%) and Siaya (0.1%) (Figure 1).

2.2. Farmer Questionnaire on Agricultural Practices

2.2.1. Background Information on the Questionnaire

Data collection on agricultural practices for large areas such as the SMMRB can be resource-intensive and time-consuming. Large-scale studies mainly depend on secondary sources of information, such as national census or remote-sensing-based data, which may not provide fine details. For instance, data collection on types of crops grown from satellite images of such a heterogeneous catchment with diverse land uses may give a good a priori approximation [30]. However, the satellite images may have a limitation in distinguishing the different types of crops grown on each small piece of land, as is frequently the case in the SMMRB. Thus, a customized questionnaire was chosen for this study to bridge the existing knowledge gap and provide a database for future applications, e.g., for hydrological and socio-economic models.
An agricultural survey was conducted through personal interviews of 200 farmers within the study area between 1 March and 8 April 2018. The complete questionnaire (see Supplementary S1) was adjusted after a trial run with ten farmers in separate households carried out between 13 to 14 February 2018. The final questionnaire was structured in 5 major sections (A–E), covering the following: The respondent’s identification/background information, general data on the farmers, and their farm characteristics in part A. Parts B and C included data on the crops grown, land use, and management. These parts also provided information on the main and secondary crops grown within the study area during the two growing seasons of 2017 (1st season from February 2017 to June 2017 and the 2nd from September 2017 to January 2018). The main crop was defined as the most frequent crop grown in a specific season and farm, while the secondary crop was the crop grown in combination with the main crop. Information on land use and SWCPs was also collected in parts B and C. The last sections (parts D and E) provided information on crop rotation and changes in cultivation, though these sections were not used for this study. The time taken to conduct a questionnaire with a farmer ranged from 1 to 2.5 h, depending on the language spoken by the farmer (Supplementary S1).
The unit of examination of the survey was farm households. The total population considered was all the farm households within the study area, which were calculated based on statistical data [39,40,41]. The lowest administrative units were used, which resulted in 33 subcounties in Uganda and 57 wards in Kenya (Supplementary Tables S2a and S2b). For each of these, the number of farm households was retrieved from national statistics, and a representative number of agricultural households were randomly selected for the survey. The selection was also based on the weighted area coverage of the subcounties and wards. The selected 200 farm households were distributed uniformly throughout the case study area by defining random but logistically possible routes (i.e., roads from Open Street Map) in each subcounty/ward. Along these routes, points were determined using a GPS tracker Figure 4.
The field survey was conducted during the planting season, thus ensuring that farmers or their relatives were present on the farms. The farm owners or the head of the families were interviewed after giving their consent. In cases where farm households were unwilling to participate in the survey, we tried the next proximate farm households. Due to civil unrest and difficult security situations, the areal coverage of the survey was limited in some areas and the sample density had to be increased in other places. For example, travel restrictions for Cheptais (Bungoma) on the Kenyan side of Mount Elgon led to missing samples in the northern part of the study area (Figure 4).

2.2.2. Soil Erosion and Fertility as Reported by Farmers

For this study, soil erosion was defined as soil disruption through the impact of external forces, such as kinetic energy induced by water or wind [50]. Regarding soil erosion risk across the different topographical conditions, we used three slope classifications based on [36]. The first category had very gentle inclinations (<3°), constituting the first domain of sheet erosion. The second one had moderate to steep slopes (3°–20°), where active gully erosion and growth occurred. The last category was comprised of very steep slopes (>20°), which are prone to mass movement, severe rain splash, and sheet erosion (Figure 1B). In part A of the questionnaire (qA6), farmers were asked if they experienced soil erosion on their farms. This question resulted in a binary yes or no response. A question on the perceived change to the soil fertility status of the farmer’s plot over the last five years was asked (qB38) to determine whether the reported soil erosion correlated with the reported fertility of the farms. A chi-squared test was applied to test if the two variables depended on each other.

2.2.3. Soil and Water Conservation Practices (SWCPs)

History of SWCPs in Kenya and East Africa

According to [51], the historical evidence indicates that in the 1930s, soil erosion was already a significant issue affecting agricultural productivity globally. It was during that time that SWCPs were introduced in Kenya and other parts of East and Central Africa and were made compulsory by the African Land Development Board (ALDEV) and the Swynnerton Plan as a response to severe erosion problems on both settler and African farms.
District-level bylaws were implemented during the colonial era (1930–1962) to specifically target coffee and cotton farming on African-held land and they were enforced by the local administration and agricultural technicians. Among the measures enforced were terrace strip cropping, contour farming, and tree planting. Farmers would face penalties for noncompliance [6,47], Then came “The Lost Decade” (1963–1972). This was the period following the colonial era, where there was a general laxity towards SWCPs. During that time, the coerced SWCPs became socially and politically unsustainable and resulted in a decline in the practice of SWCPs. The previously implemented terraces were neglected and some were eventually destroyed outnumbering the construction of new ones [51].
In 1972, land degradation in Kenya was recognized as a serious problem at the United Nations Conference on the Human Environment in Stockholm. As a response, the National Soil and Water Conservation Program (NSWCP) was launched in 1974 with the support from the Swedish International Development Cooperation Agency (SIDA). Its primary objective was to increase and sustain agricultural production through the practice of simple and cost-effective SWCPs. Initially, this approach targeted individual farms, with the farmers receiving a package of tools. Based on lessons learned from this phase, there was a shift towards a community-based soil and water conservation approach, known as the catchment approach. This approach aimed to address soil conservation at a broader landscape scale and involved the participation of local communities [51].
Overall, the historical background of soil and water conservation practices in both Kenya and Uganda reflects a progression from enforced measures during the colonial era to periods of laxity and a subsequent revival with the introduction of individual and community-based approaches.
The traditional SWCPs in Kenya included the construction of contour terraces, stone bunds, and diversion channels to control soil erosion. In Uganda, they involved the use of loose stone terraces, contour ridges, and grass strips to protect soil from erosion, especially in the hilly areas. During the colonial period, in both Kenya and Uganda there was extensive deforestation. Specifically for Kenya, there was an increase in cultivation on steep slopes, and an expansion of cash crop production that resulted in widespread soil erosion. Uganda experienced an expansion of its agriculture and inadequate soil conservation efforts, leading to increased soil erosion rates.
Since the postindependence era, in Kenya, the government and nongovernmental organizations such as One Acre Fund have made efforts to promote terracing, agroforestry, and other conservation practices. The adoption of modern SWCPs, such as vetiver grass strips, terraces, and check dams, has been gradually increasing in different regions of Kenya. In Uganda, since the independence, various initiatives have been undertaken to promote soil and water conservation, including the rehabilitation of degraded lands, the introduction of contour ploughing, the establishment of tree plantations, and the implementation of sediment control structures.

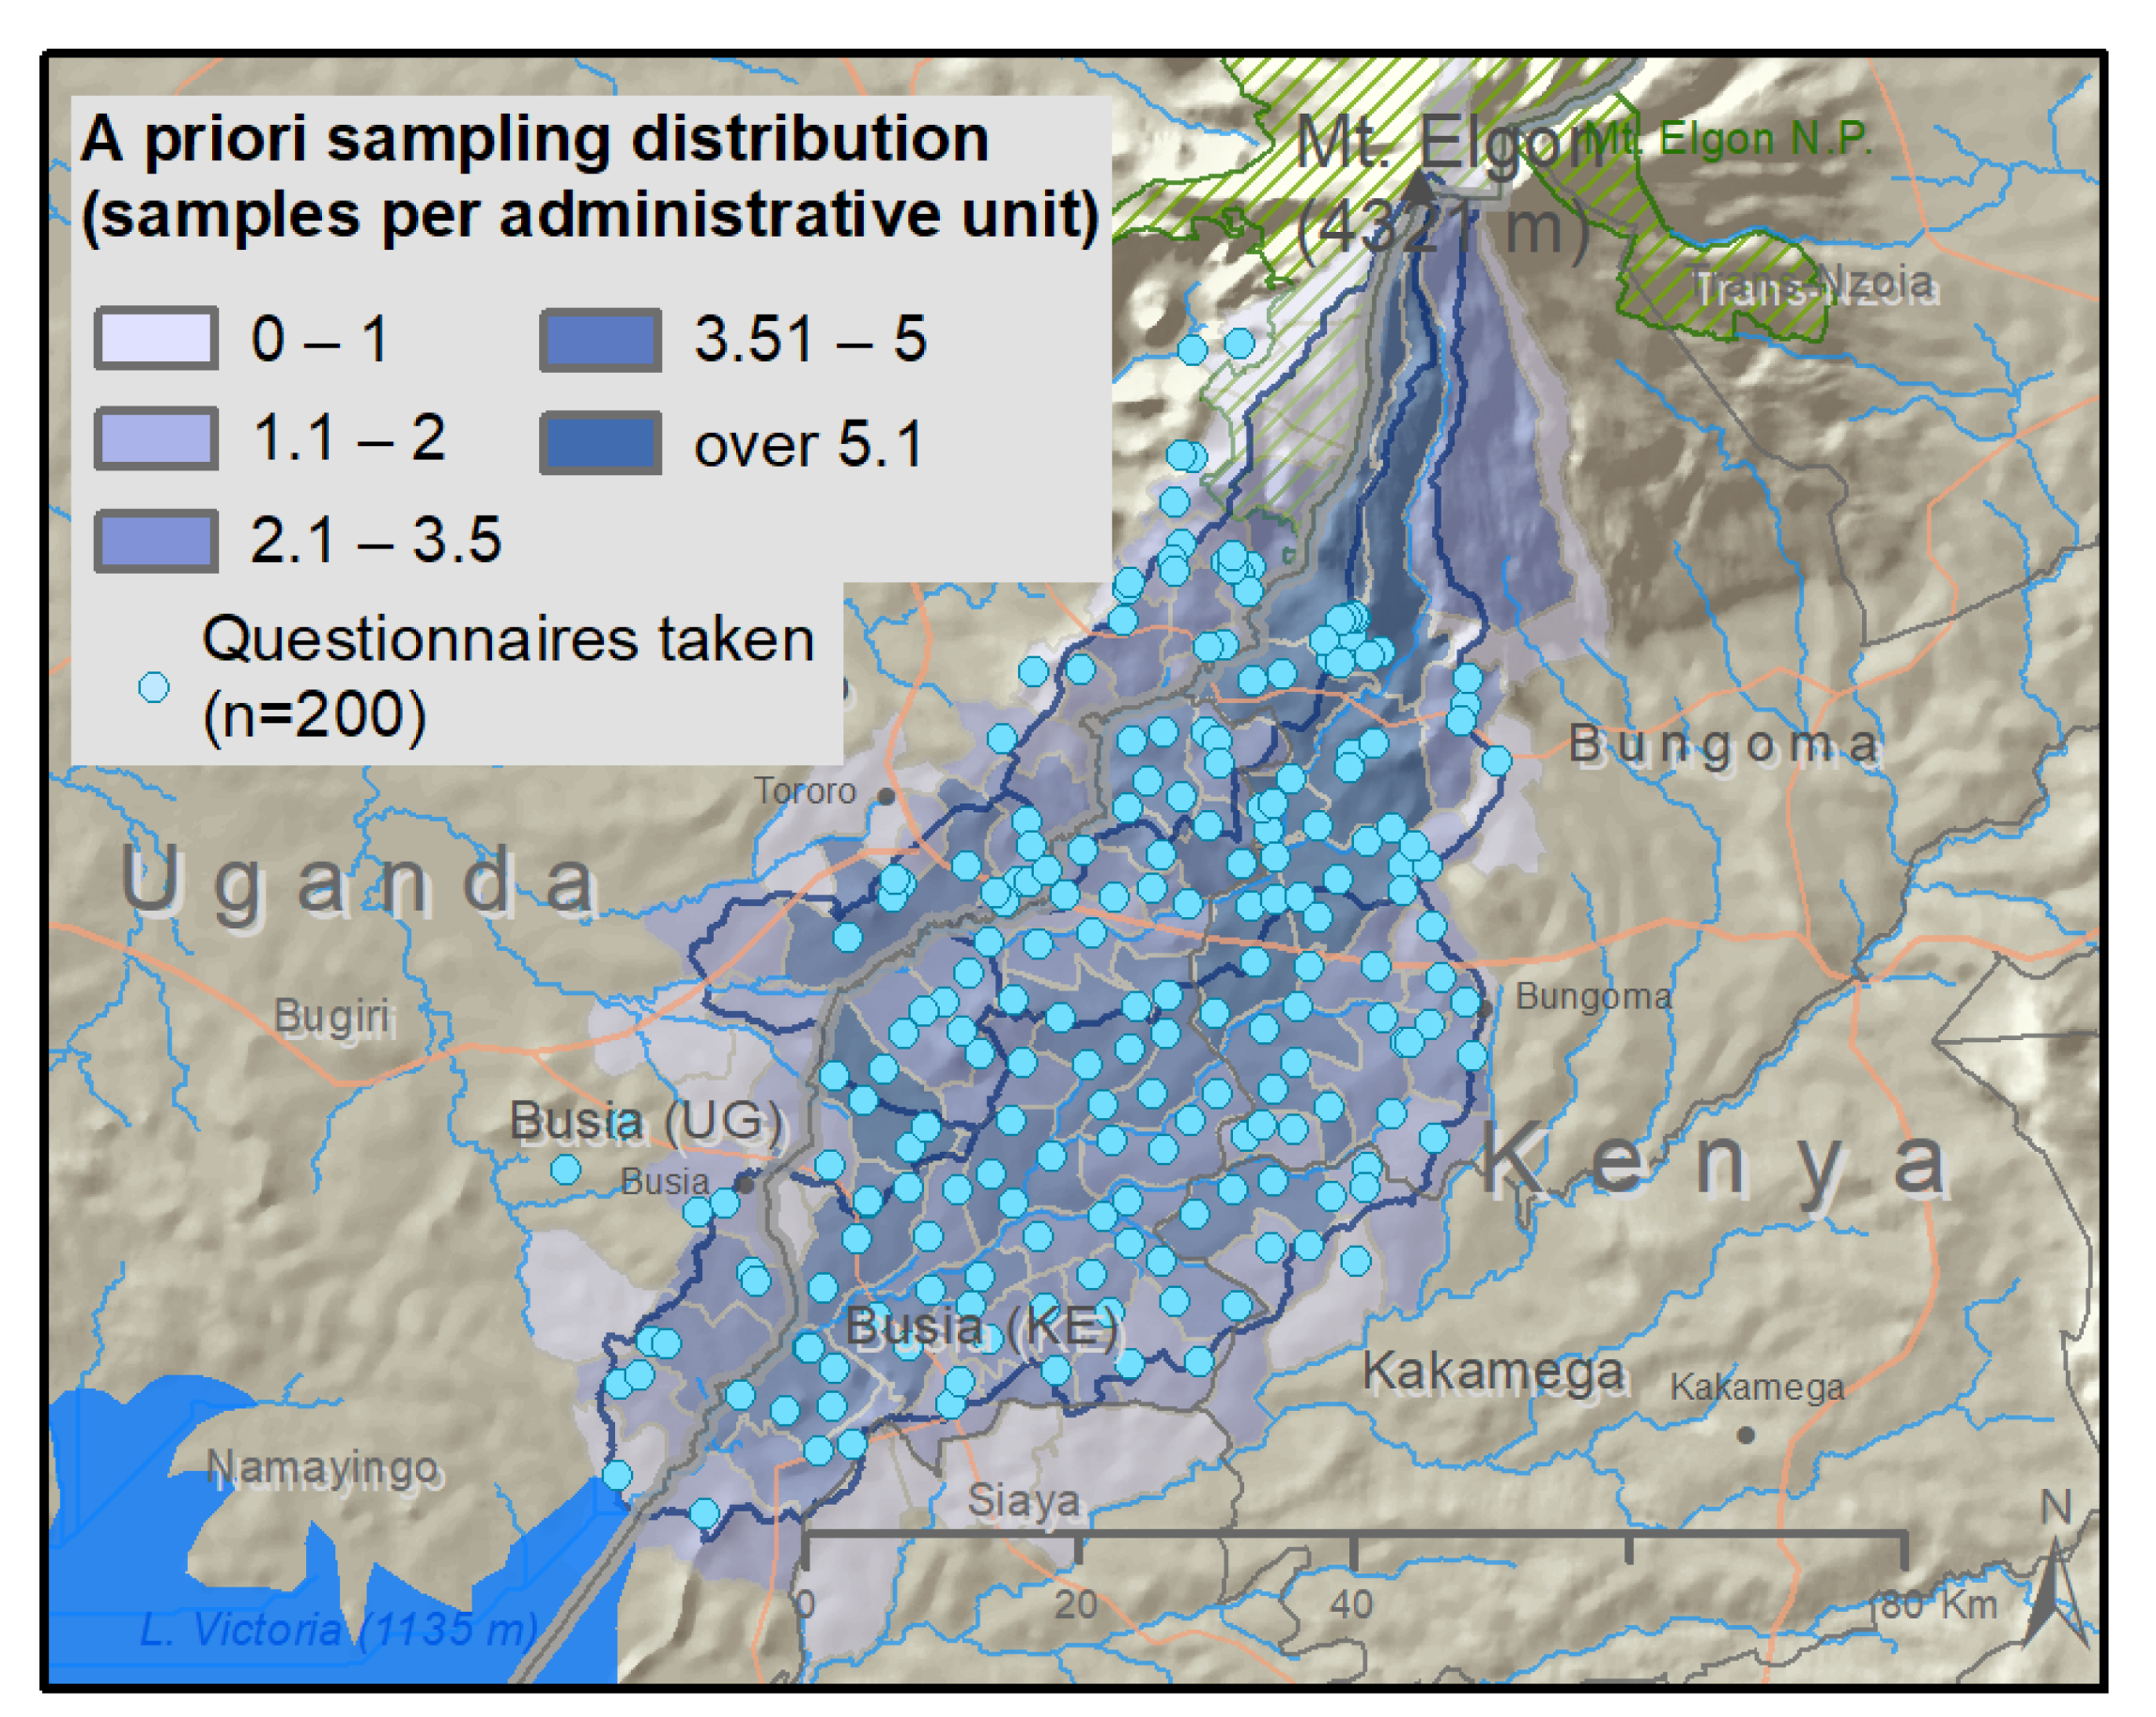
Sampling Soil and Sater Conservation Practices (SWCPs) in the Sio Malaba Malakisi River Basin (SMMRB)

The farmers were asked to report up to five major soil and water conservation practices applied on their main plot (qB32). Parts of the questionnaire that were used to analyse the SWCPs included: Part A on the relationship to the farm owner and decision-makers related to the crops in the farming systems. Part B: (qB33) area of the plot protected by the main SWCPs; and (qB32) major SWCPs in their three most predominantly cropped plots. The five SWCPs for each farm were then harmonized and grouped into 4 main classes (”generalized support practices”) based on a classification scheme used in the literature (e.g., [9,52,53]. Using the slope classes, we assessed if the slope influenced the soil water conservation practices applied within the basin.

2.3. Data Analysis

Raw data extracted from the answered questionnaires were analysed using Excel and R software. The generated data were mainly categorical and nonparametric. According to the research questions, multiple contingency tables were developed from the raw data before the application of appropriate statistical analyses.
The chi-squared test for independence was applied to test the statistical significance of the relationships between the farmers’ perceptions of the status of erosion and fertility, their social characteristics, and the applied SWCPs.

3. Results

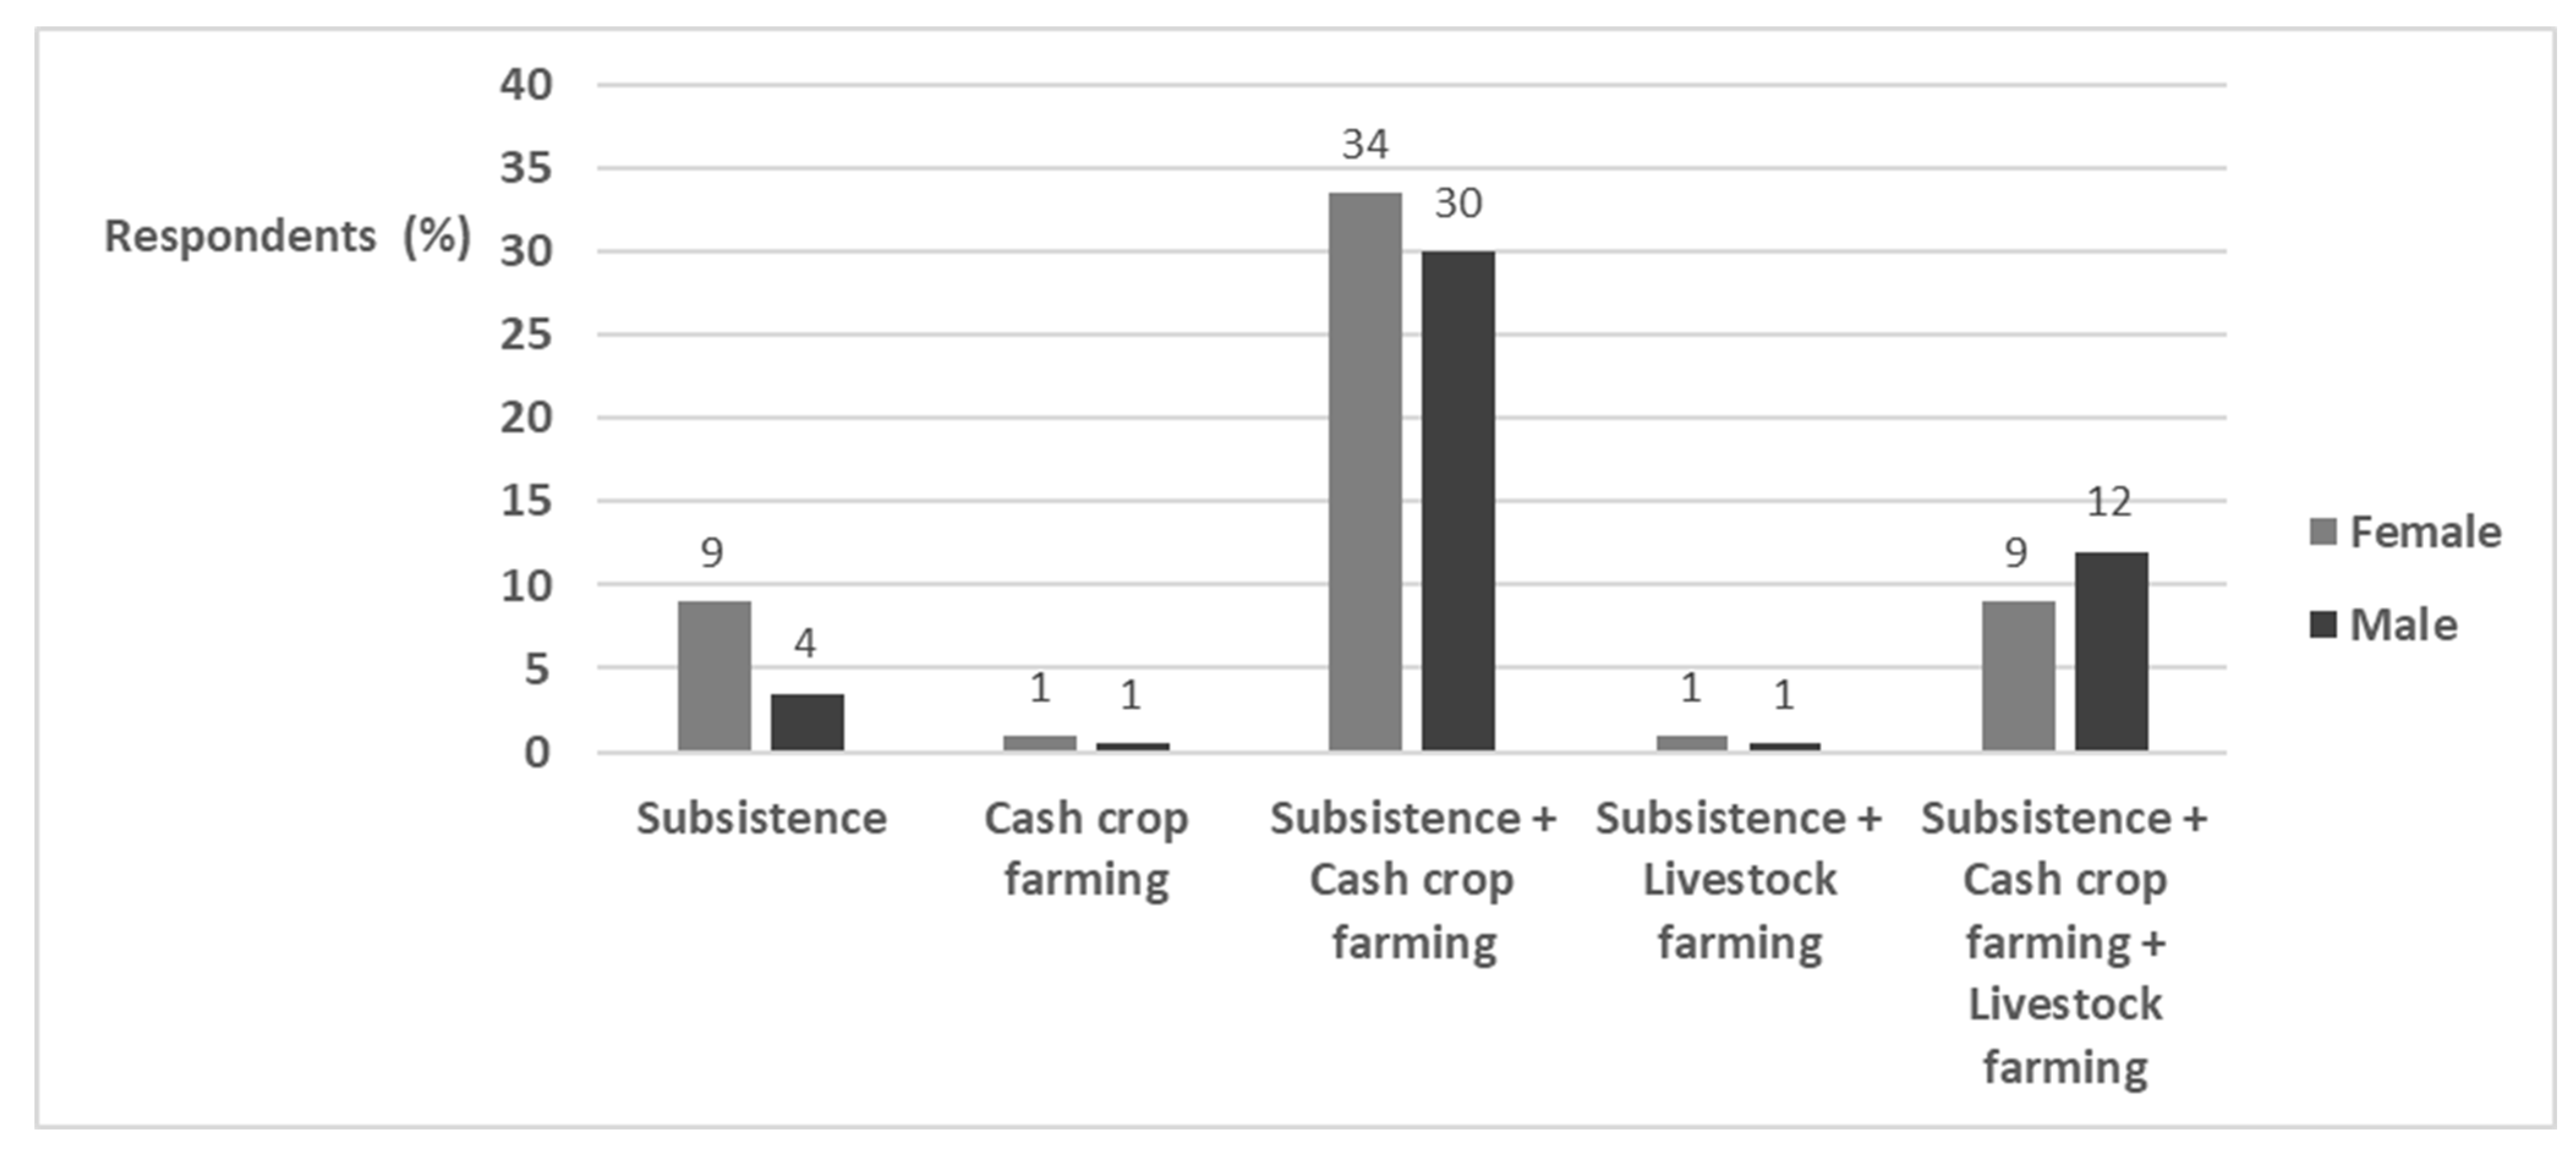
3.1. General Household Farm Characteristics

The gender distribution of the 200 interviewees in our agricultural survey was 53.5% female and 46.5% male. The total farm area belonging to the interviewees was 131 ha, with 657 plots of different sizes ranging from 0.1 ha to 0.8 ha. Each interviewee (farm household) had an average farm size of 0.66 ha comprised of at least three to four plots. Based on the total farm size area (131 ha), the land was owned mainly by males (78 ha; 59%) or jointly owned by males and females (43 ha; 32%). The females alone owned the least (8 ha; 17%) percentage of our surveyed agricultural area.
Subsistence farming entailed the growth of crops for home consumption by the local farmers. Cash crop farming was mainly for selling farm produce and income generation. Livestock farming involved the domestication of animals, mainly cows, goats, and sheep. Most farmers (64%) practised subsistence in combination with cash crop farming, while 21% of the farmers also kept livestock in addition to crop growing. About 13% of the farmers practised subsistence farming only, with 2% practising cash crop farming and another 2% of the farmers growing crops for subsistence farming while keeping livestock. More females practised combined crop farming (subsistence and cash crops), while more males practised combined crop (subsistence and cash crops) production and livestock farming (Figure 5). Table 1 shows smallholder farms’ characteristics of the Sio Malaba Malakisi River Basin.

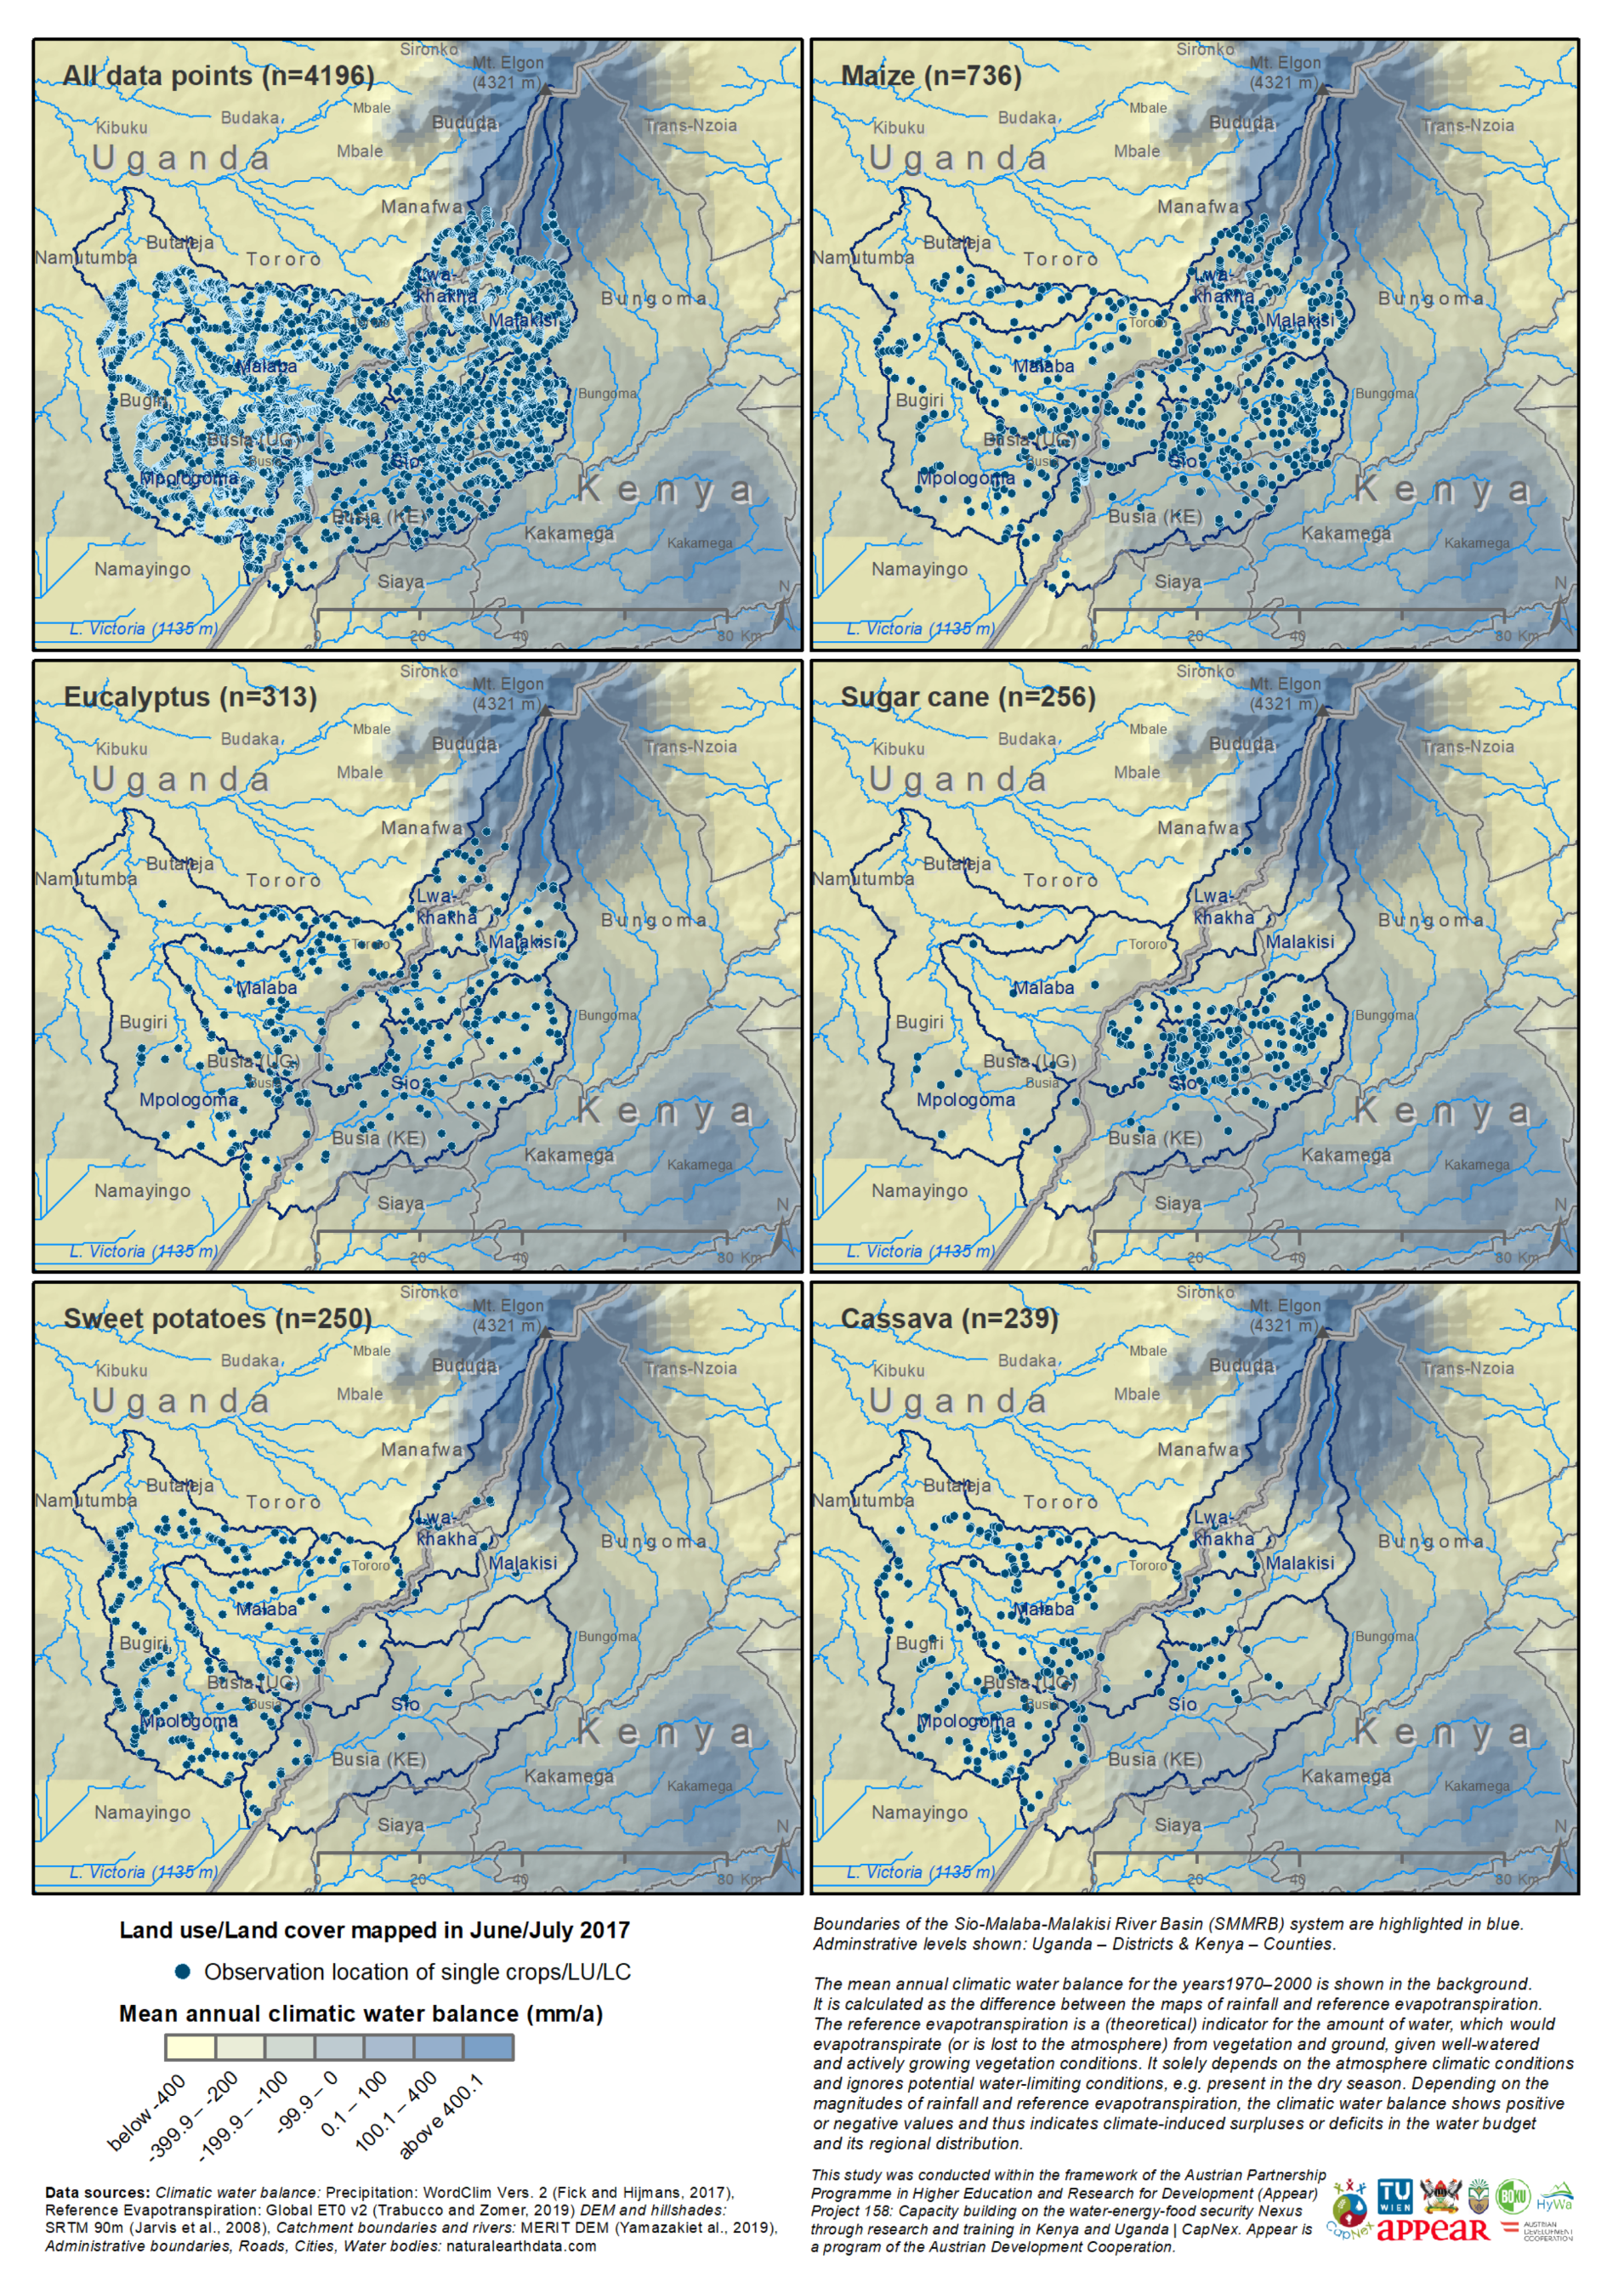
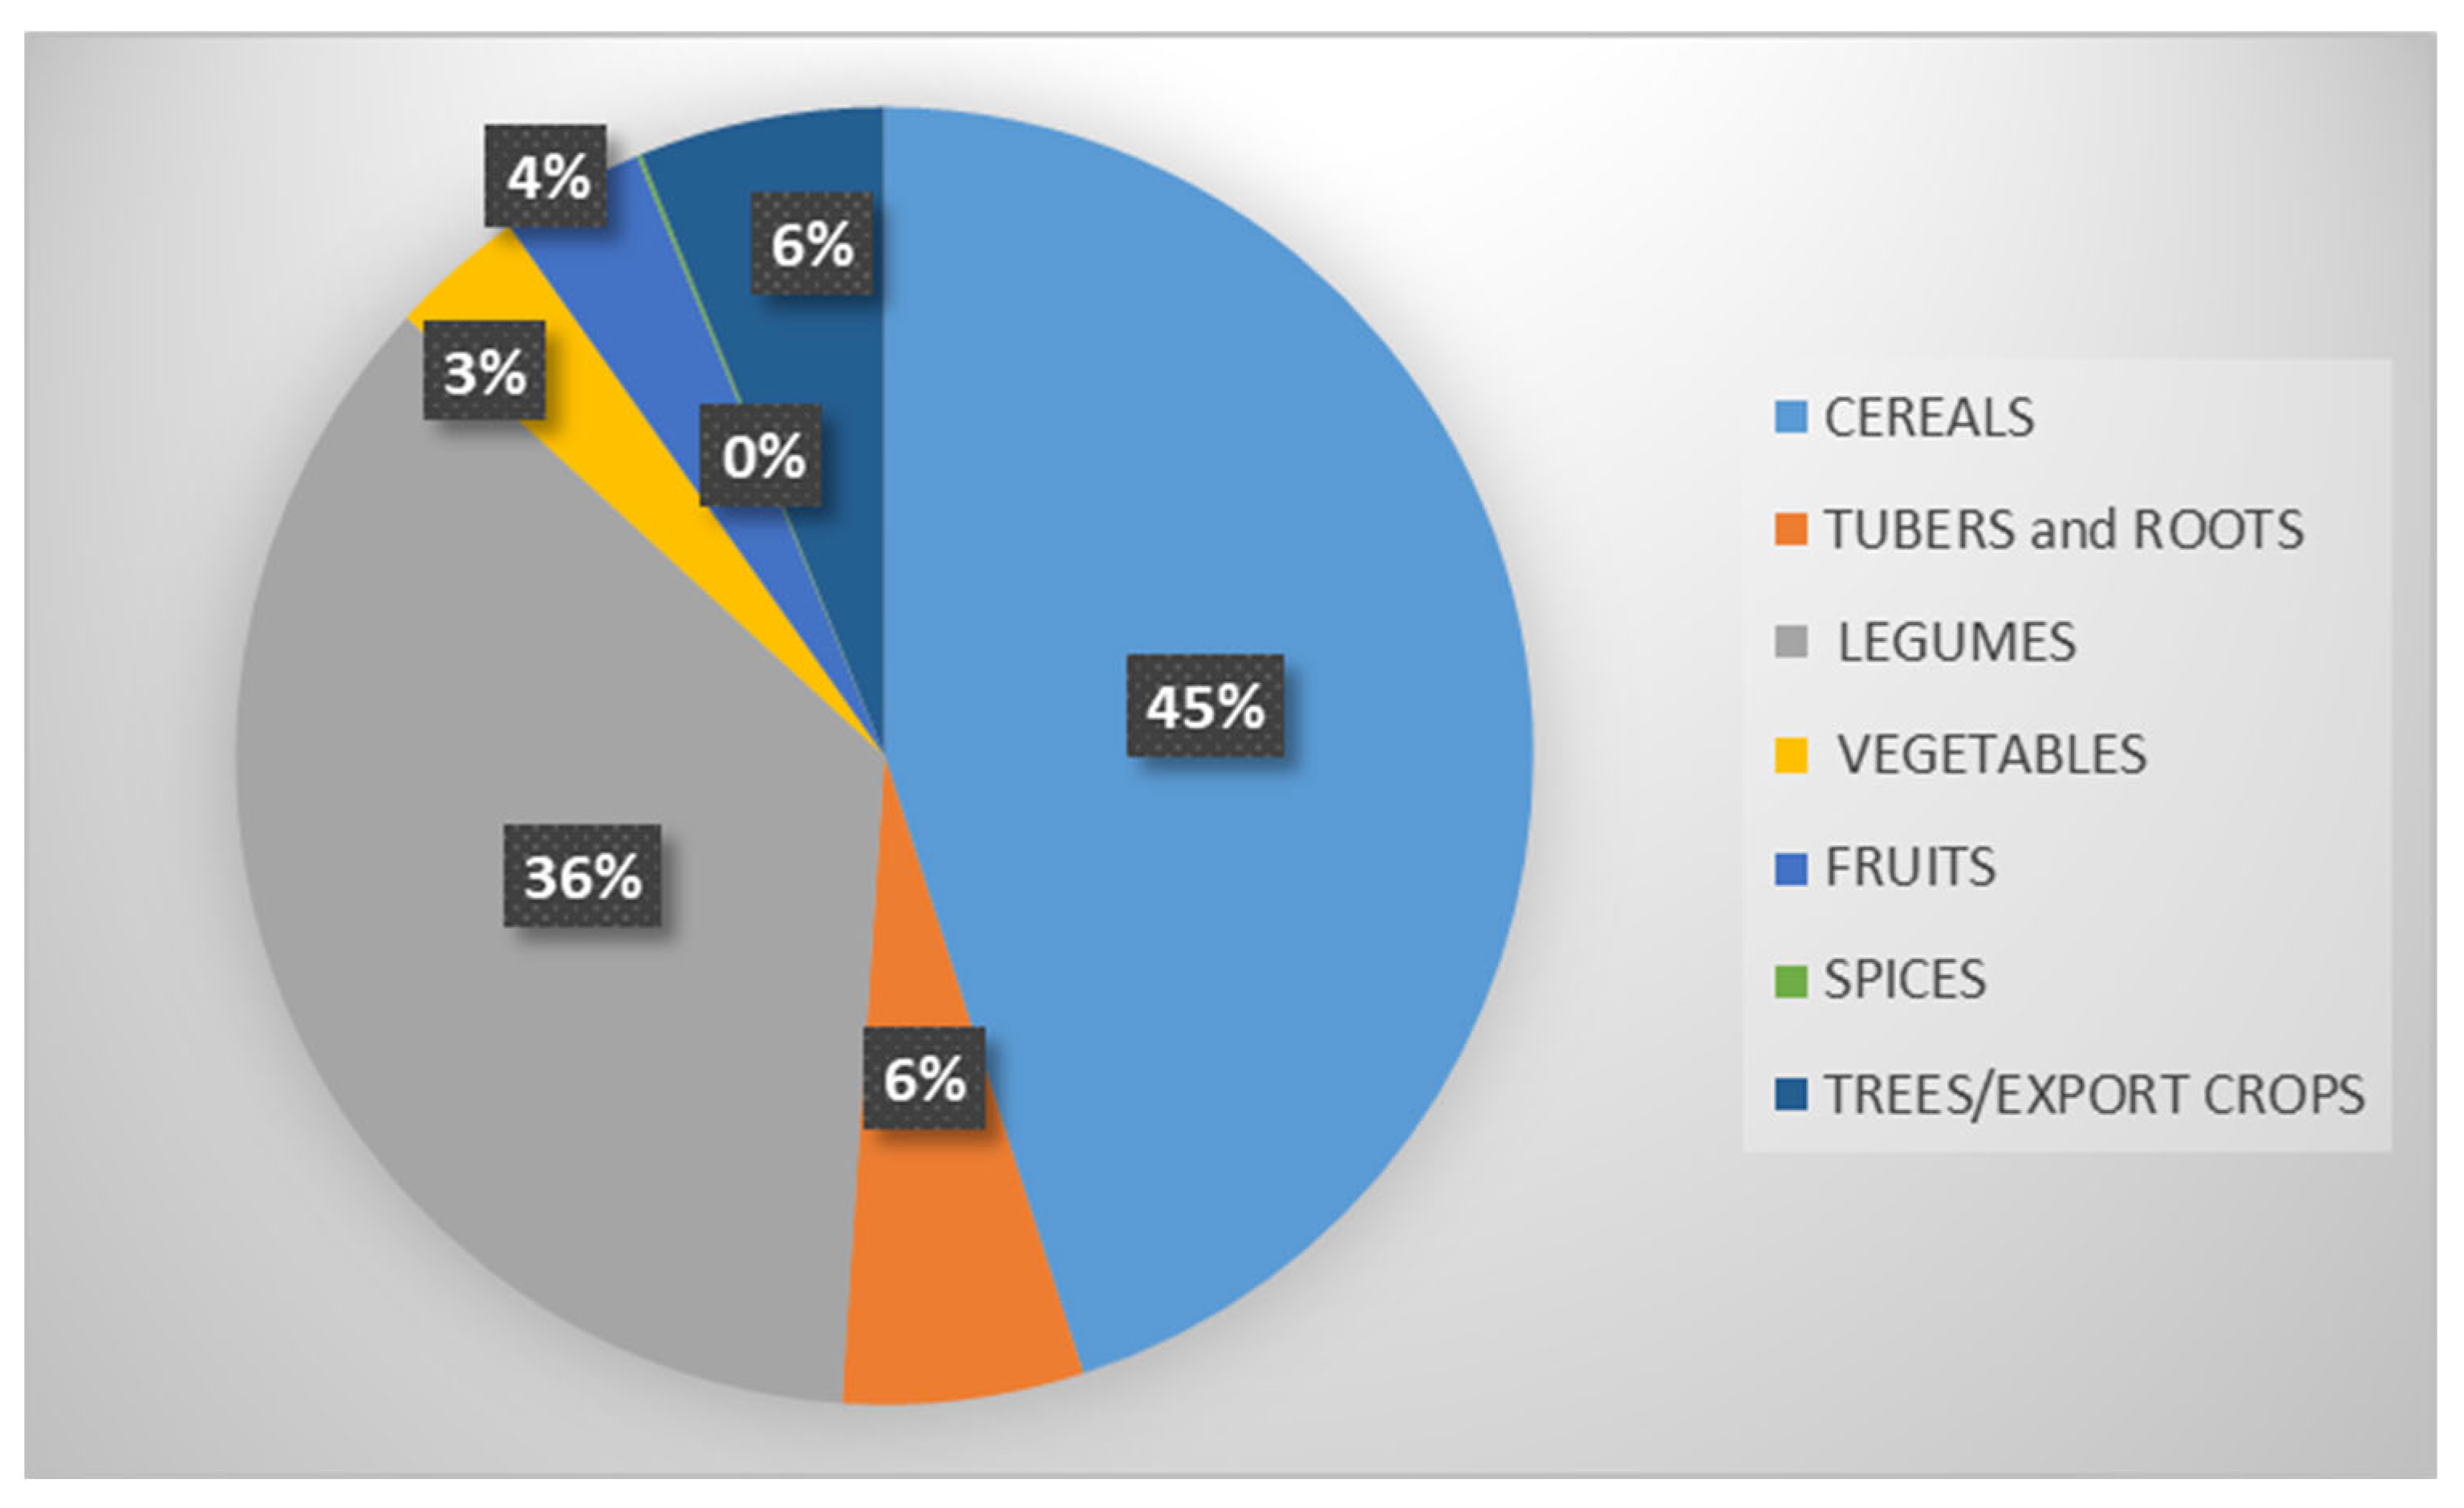
3.2. Crops in the Sio Malaba Malakisi River Basin

3.2.1. Major Crops Grown

Figure 2 and Figure 3 show the climatic water balance (as the difference between rainfall and reference evapotranspiration) in the background as an indicator of water availability and potential climatic gradients. The spatial patterns of the rainfall conditions and climatic water balance agreed with the spatial patterns of vegetation cover measured by the NDVI shown in the maps of the study area (Figure 1). The spatial variability of vegetation cover was, however, not very pronounced (with the exception of the forested areas and the national park around Mt. Elgon.
It is clear that spatial differences occurred in crops grown. These were, however, also not as pronounced.
The main crops in this study were defined in terms of frequency based on the crops planted by most farmers and the crops grown in the largest areas (Table 2). Thirty different types of crops were observed during the survey and were classified into seven categories (Figure 6). The most dominant categories were cereals (45%) and legumes (36%). The frequency at which different crop types appeared in the sampled farms differed, with maize and beans being the most popular crops (Table 2). Figure 2 and Figure 3 show that, for example, maize was grown in the whole study area. Other crops, e.g., matoke, cassava, sweet potato, or rice were mostly limited to areas in Uganda and did not follow a spatial pattern associated with rainfall. Maize and beans were grown on 393 and 304 plots, respectively, with an average mean yield of 504 and 88 kg/ha, respectively. In terms of the average area coverage, the most dominant crop types were fodder (0.45 ha), coffee (0.41 ha), and bananas (0.41 ha).

3.2.2. Crops Grown within the Farming Seasons

Crops were cultivated in two seasons: the first season from around February to June and the second season from September to January. The farmers in our study area grew both main and secondary crops during the two farming seasons. Both crops were cultivated on the same plot or different plots within the same farm. Various main crops (cereals and legumes, legumes only, trees/export crops only, and tubers/roots only) were grown during the two seasons. However, more cereals were produced as the main crop during the first season than in the second season, which had more legume crops. Regarding secondary crops, we observed that legumes were the most cultivated crops. Comparing both growing seasons, the first season had more secondary crops than the second season (Figure 7). Additionally, some farmers left their farms bare during the second season after harvesting the first-season crop.

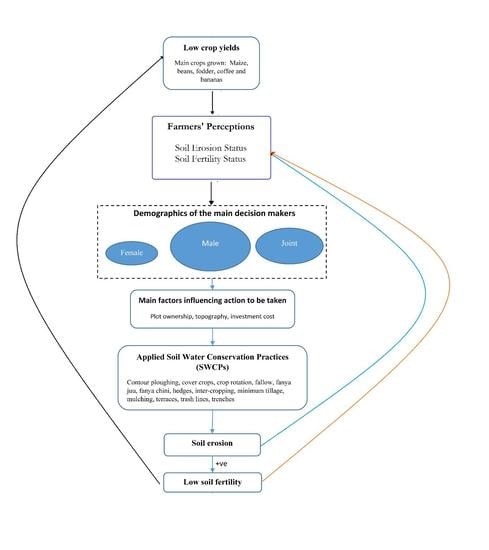
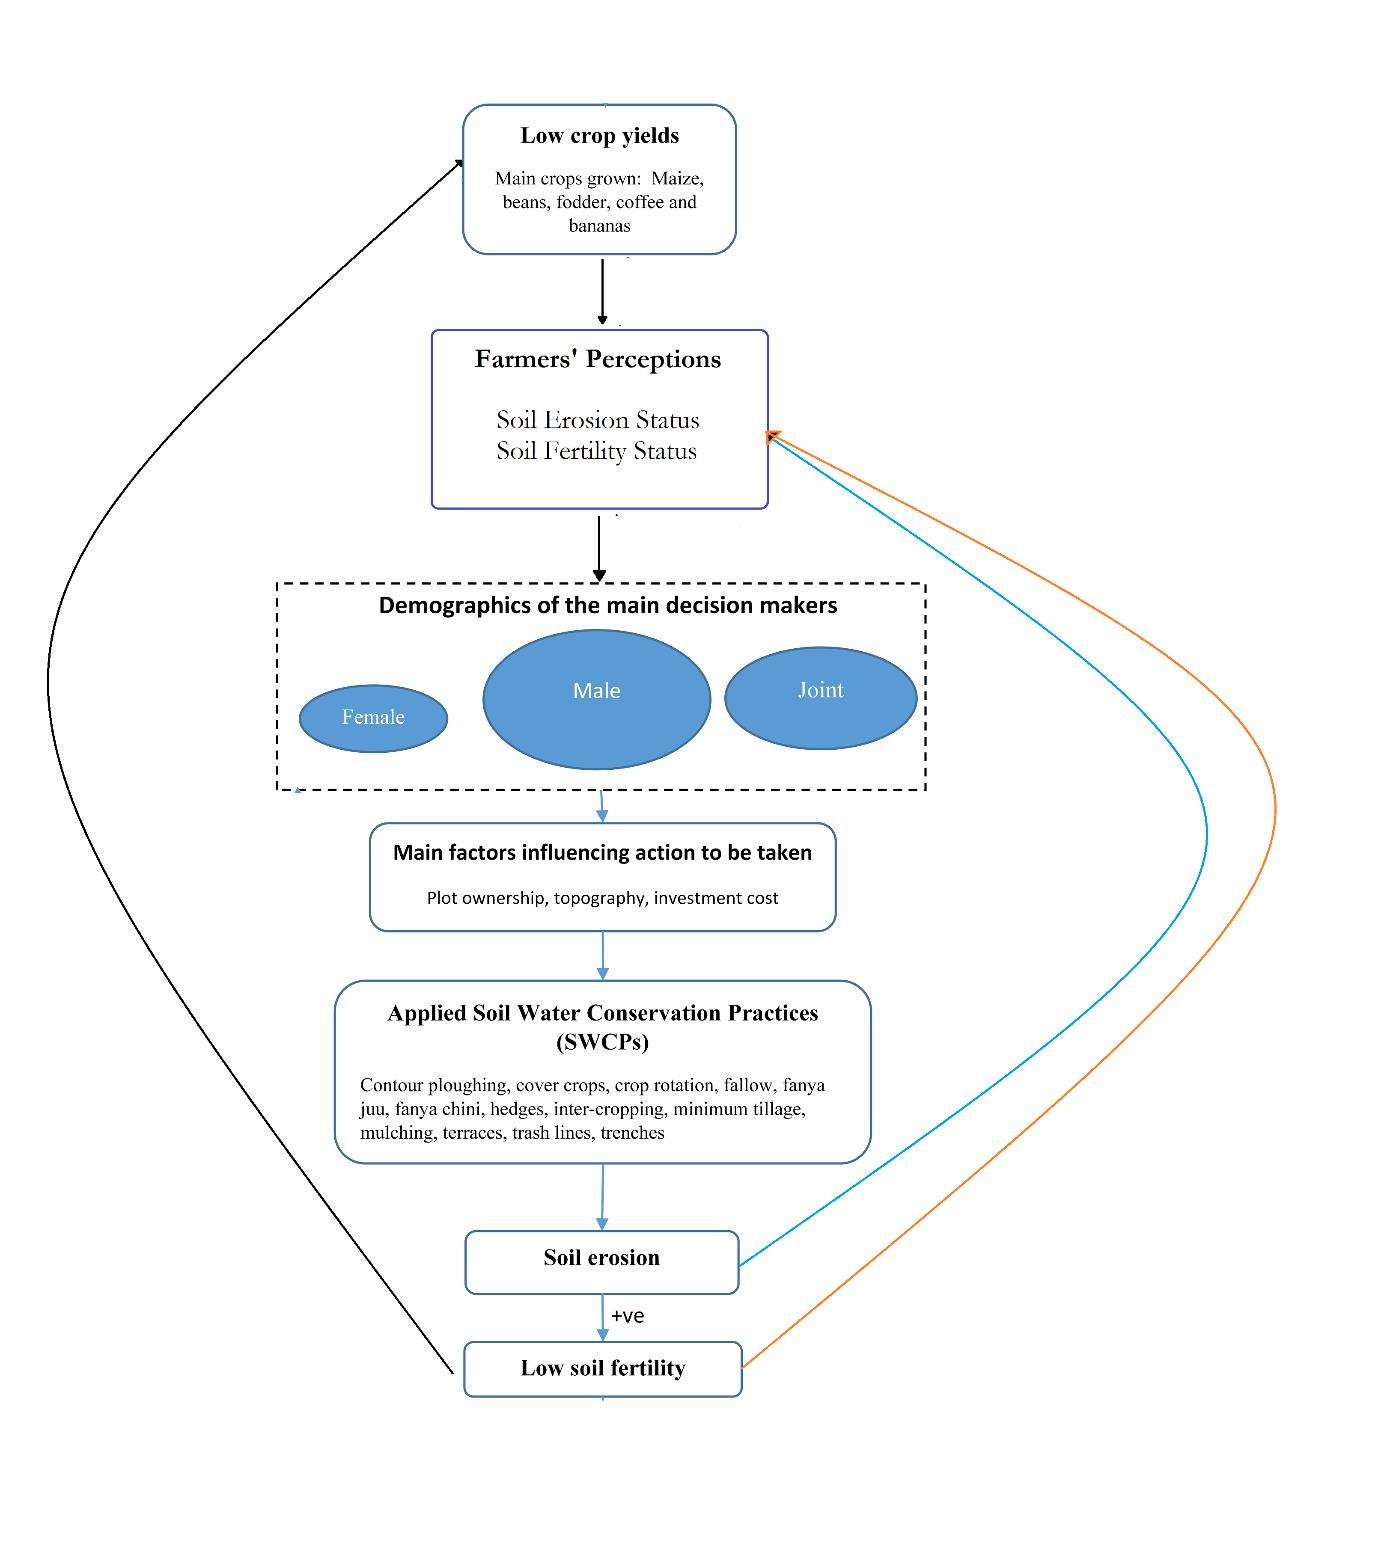
3.3. Farmers’ Perception of Soil Erosion and Fertility Conditions

Regarding soil erosion, 60% of the interviewed farmers reported the presence of soil erosion on their farms. When asked about the change in fertility status over the last 5 years, most farmers (92%) reported a decline in soil fertility in their farms, while 5% reported no significant change in soil fertility. Only a small percent (3%) reported an increase in soil fertility, and these were mainly from the group of farmers that reported no soil erosion in their farms. Generally, most of the farmers who reported a reduction in the soil fertility of their fields reported the presence of soil erosion (Figure 8). The results of a chi-squared test of the independence between soil erosion and fertility showed that the variables had a significant (X2 (2, n = 198) = 92.8, p < 0.001) relationship. Thus, soil erosion was more likely to reduce farm fertility.

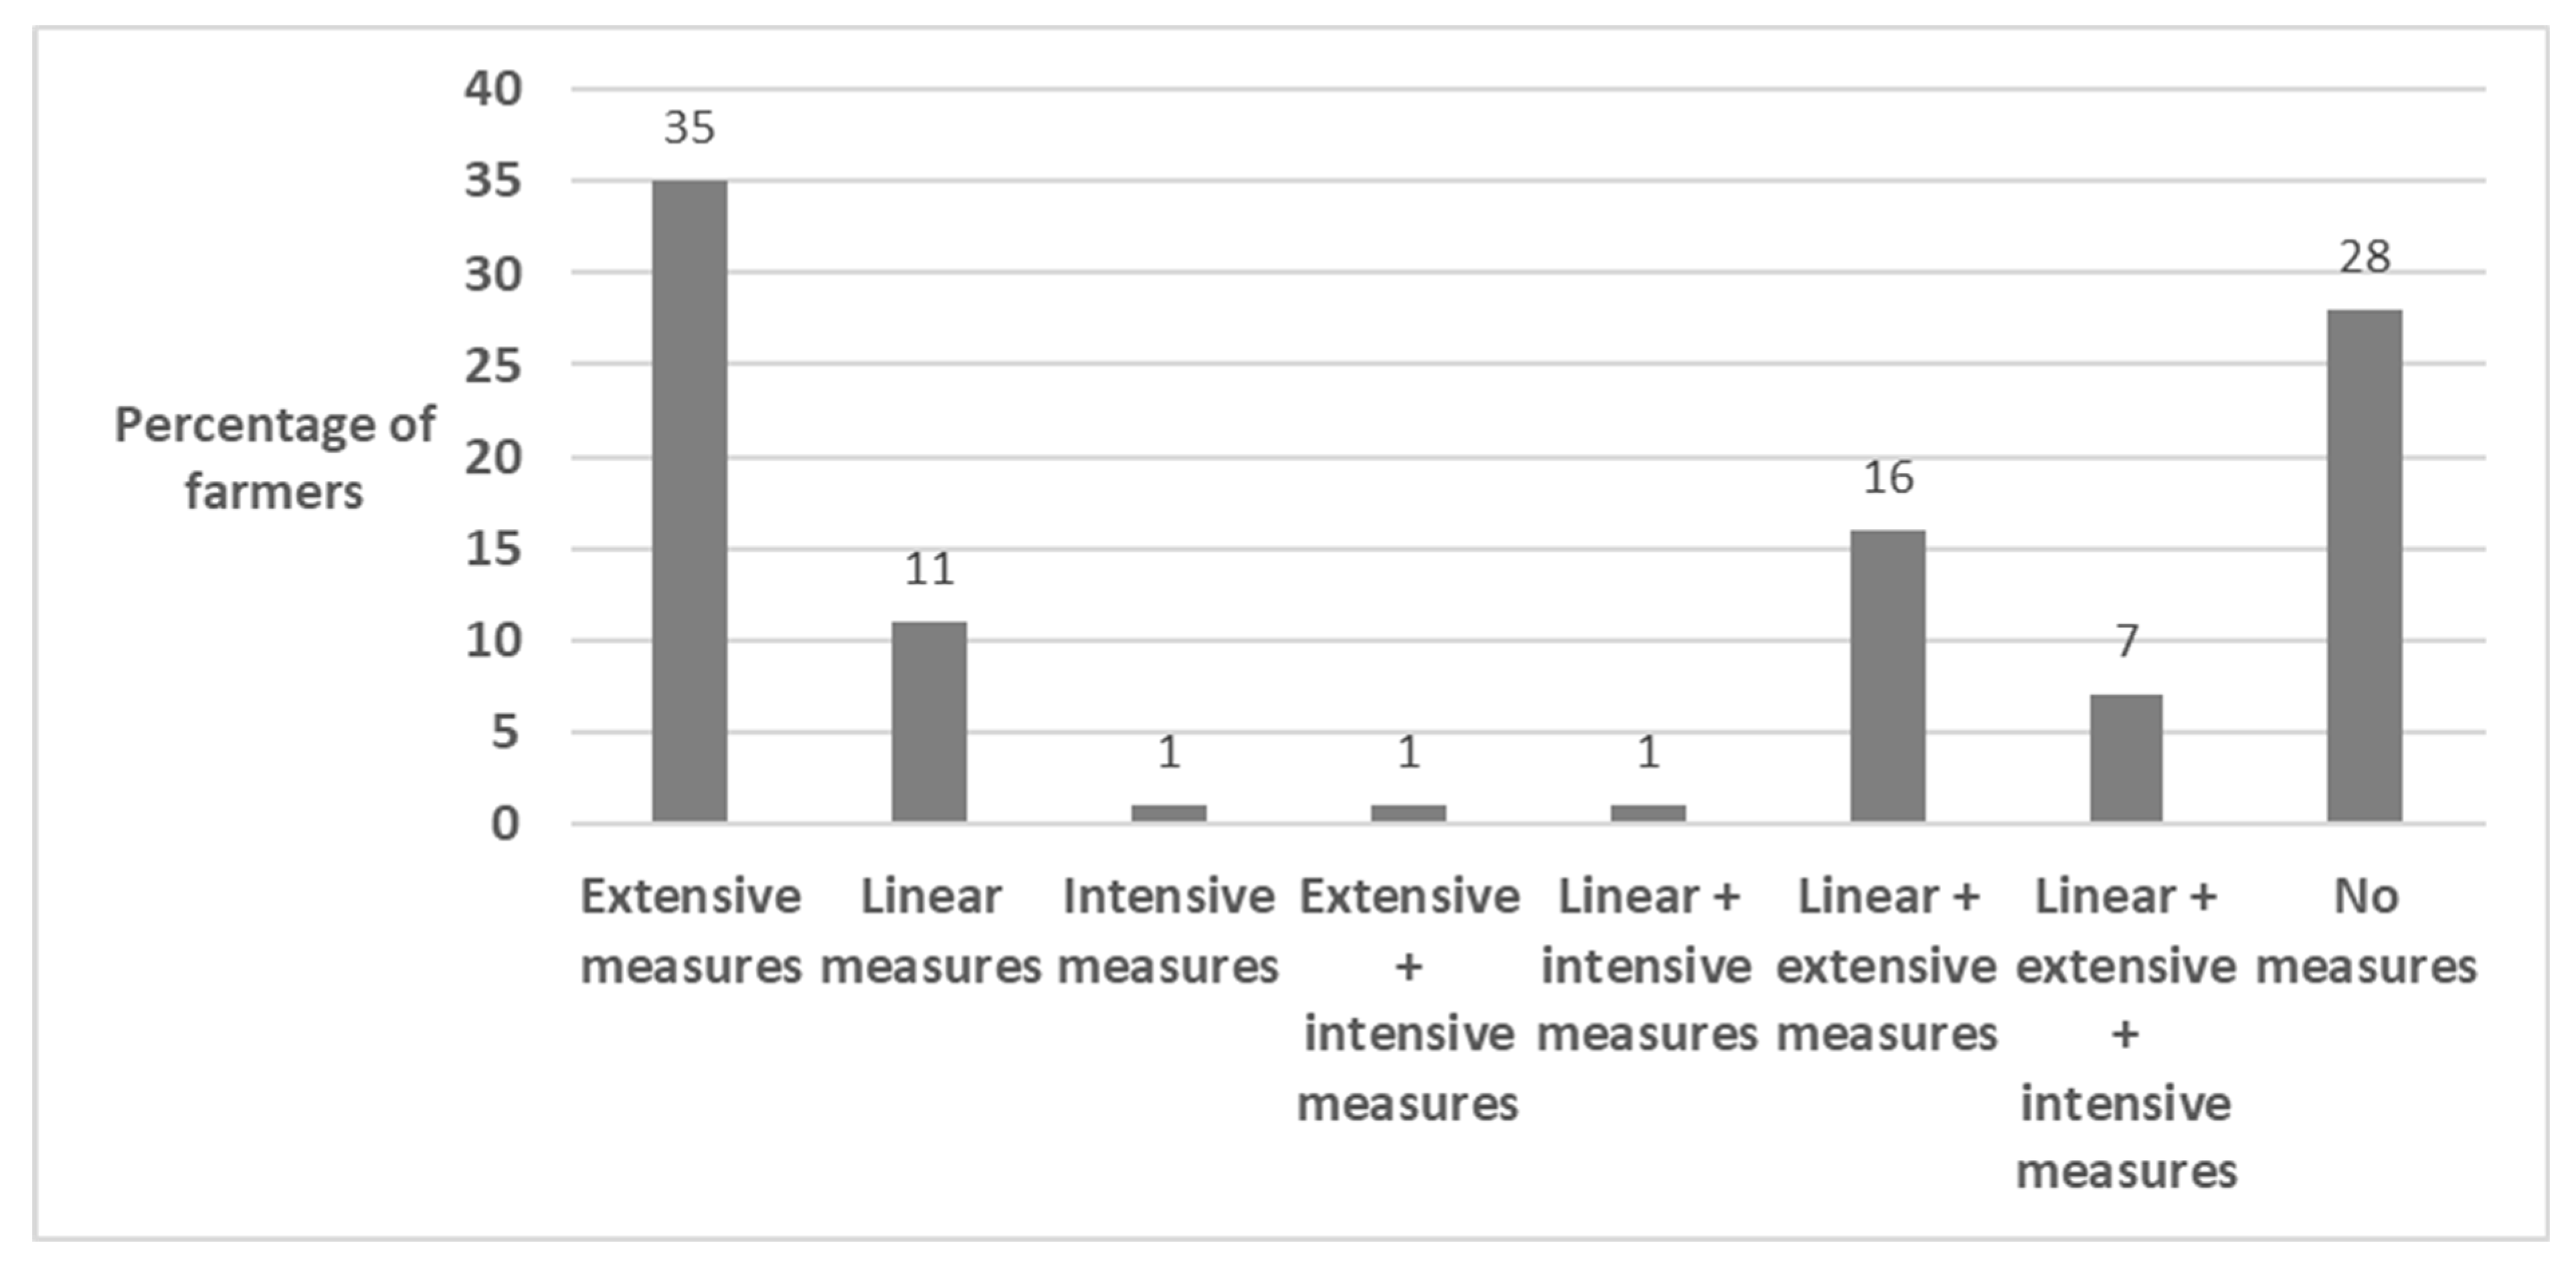
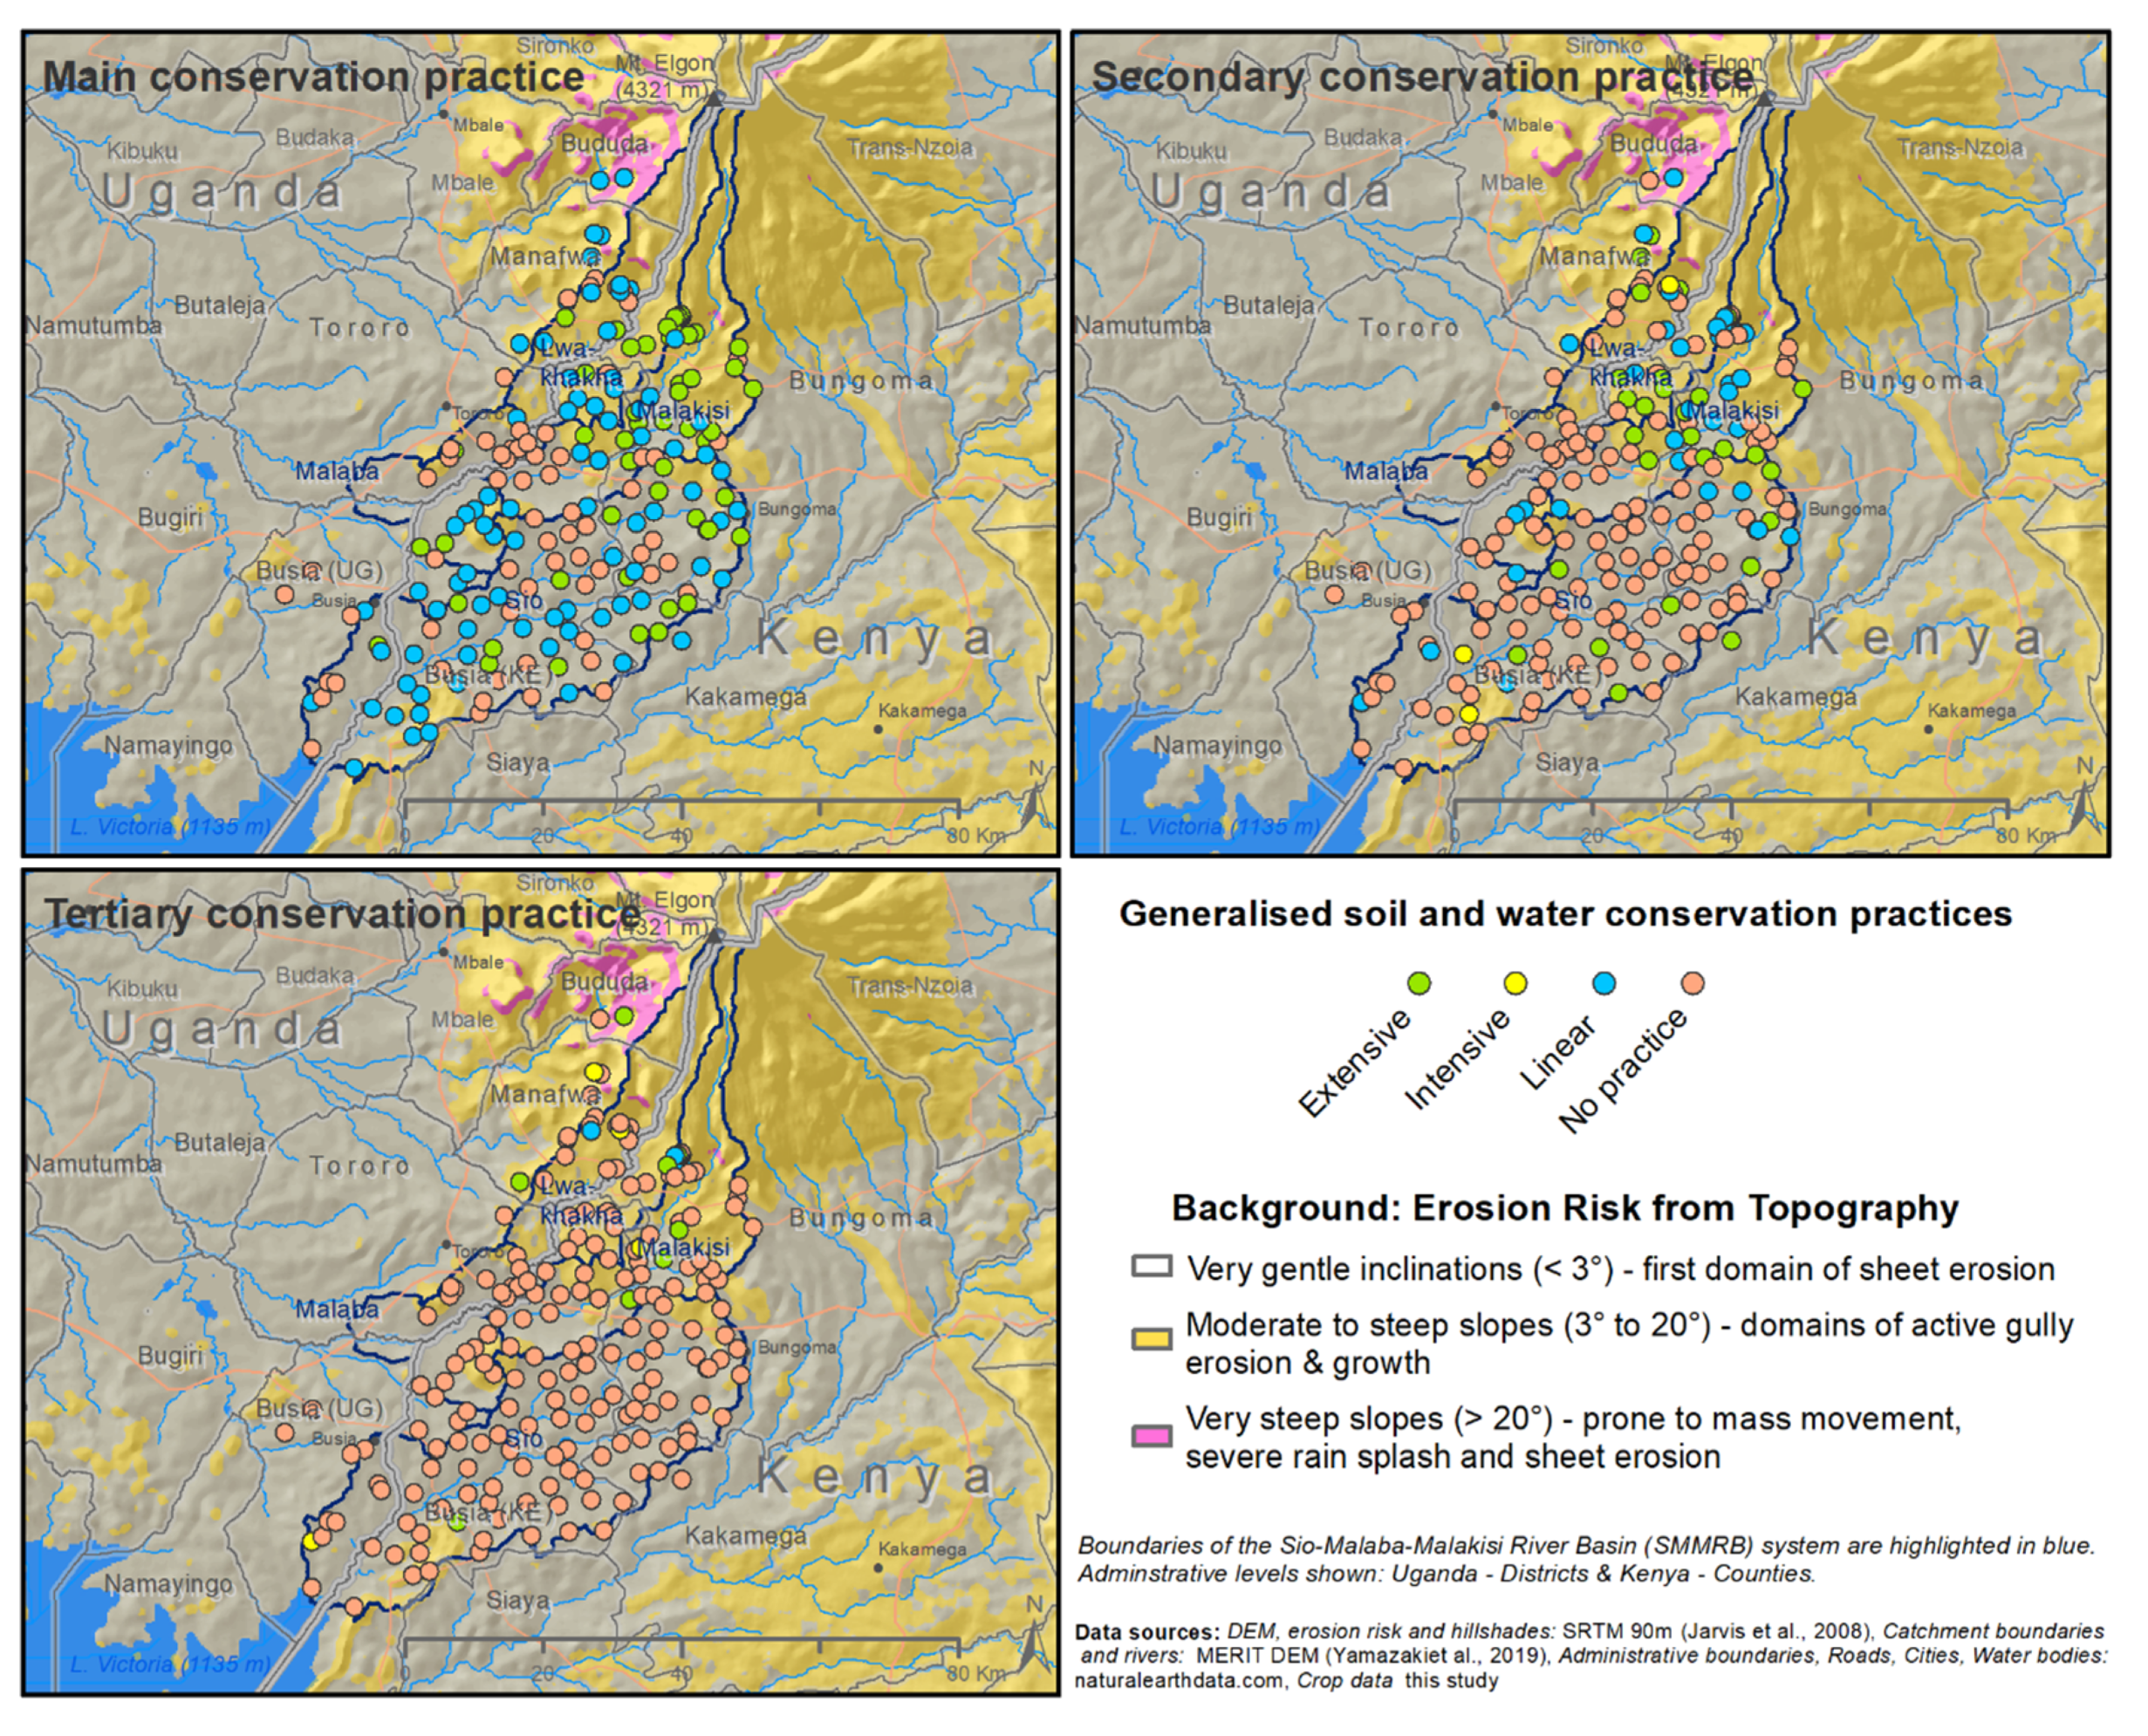
3.4. Applied Soil and Water Conservation Practices

The soil and water conservation practices (SWCP) practised by the interviewed farm households, especially on their primary pieces of land during the main planting season, showed a varying distribution. Most farmers (72%) applied SWCPs, with a majority practising one SWCP. The least farmers (4%) combined the highest number (five) of SWCPs. Around 28% of the farm households lacked SWCPs (Figure 9).
The farmers reported 13 different types of SWCPs, which they applied in various combinations on their farms (Figure 10). The common SWCP practised in most areas (average area of >0.18 ha) included fallowing, intercropping, minimum tillage, and crop rotation. The least implemented SWCPs were the cover crops (on average 0.025 ha). We grouped the 13 SWCPs into four main categories and renamed them as generalized support practices (gSPs). The gSP categories included extensive, intensive, linear, and no measures/practice (Table 3). The extensive category entailed the SWCPs practised on the entire farm, while the intensive category entailed terraces around the mountain slopes. The SWCPs practised in a linear form, such as trenches and alley cropping, were classified as linear measures. The last category (no measure) applied to the farms where the farmers practised no SWCPs.
A further analysis of the distribution of the four main generalized support practices (gSPs) among the interviewed farm households showed that the most practised (35% farmers) measures were in the extensive category. The linear measures were implemented by 11% of the farmers. The intensive methods were the least (1% of farmers) practised in the basin. The typical combinations of gSPs were the linear and extensive measures at 16%, followed by the mixture of linear, extensive, and intensive measures by 7% of the farmers (Figure 11).
Each farm household had several (three to four) plots, and the farmers placed different priority levels on each plot. Thus, each household had a main, secondary, and tertiary plot. The SWCPs practised on these plots also varied depending on the priority level placed on each plot (Figure 10). The main plots had more (67%) SWCPs compared to the secondary (25%) and tertiary (8%) plots. The most common SWCPs on the main and secondary plots included crop rotation, intercropping, and trenches, categorized as extensive and intensive measures. Terraces in the gSP category were practised on the secondary and tertiary plots and were limited to specific regions, especially towards the steep slopes of Mount Elgon (Figure 12).

Farmers’ Perception of the SWCPs and Soil Erosion

A further analysis was conducted on the farmers’ responses to SWCPs and their perception of soil erosion on their farms. Generally, more farmers (n = 144 out of the 200) practised the SWCPs irrespective of the soil erosion conditions on their farms. The results also showed that out of the farmers who reported the presence of soil erosion on their farms (n = 122), most of them (n = 84) responded to this problem and applied SWCPs. The chi-square test results on the independence of soil erosion from soil water conservation showed that the variables lacked a significant (X2(1, n = 200) = 0.16, p = 0.28) relationship. Regarding gender comparison, slightly more females (11%) than males (7%) acknowledged that despite the soil erosion they experienced on their farms, they implemented no preventative or remedial measures (Table 4).

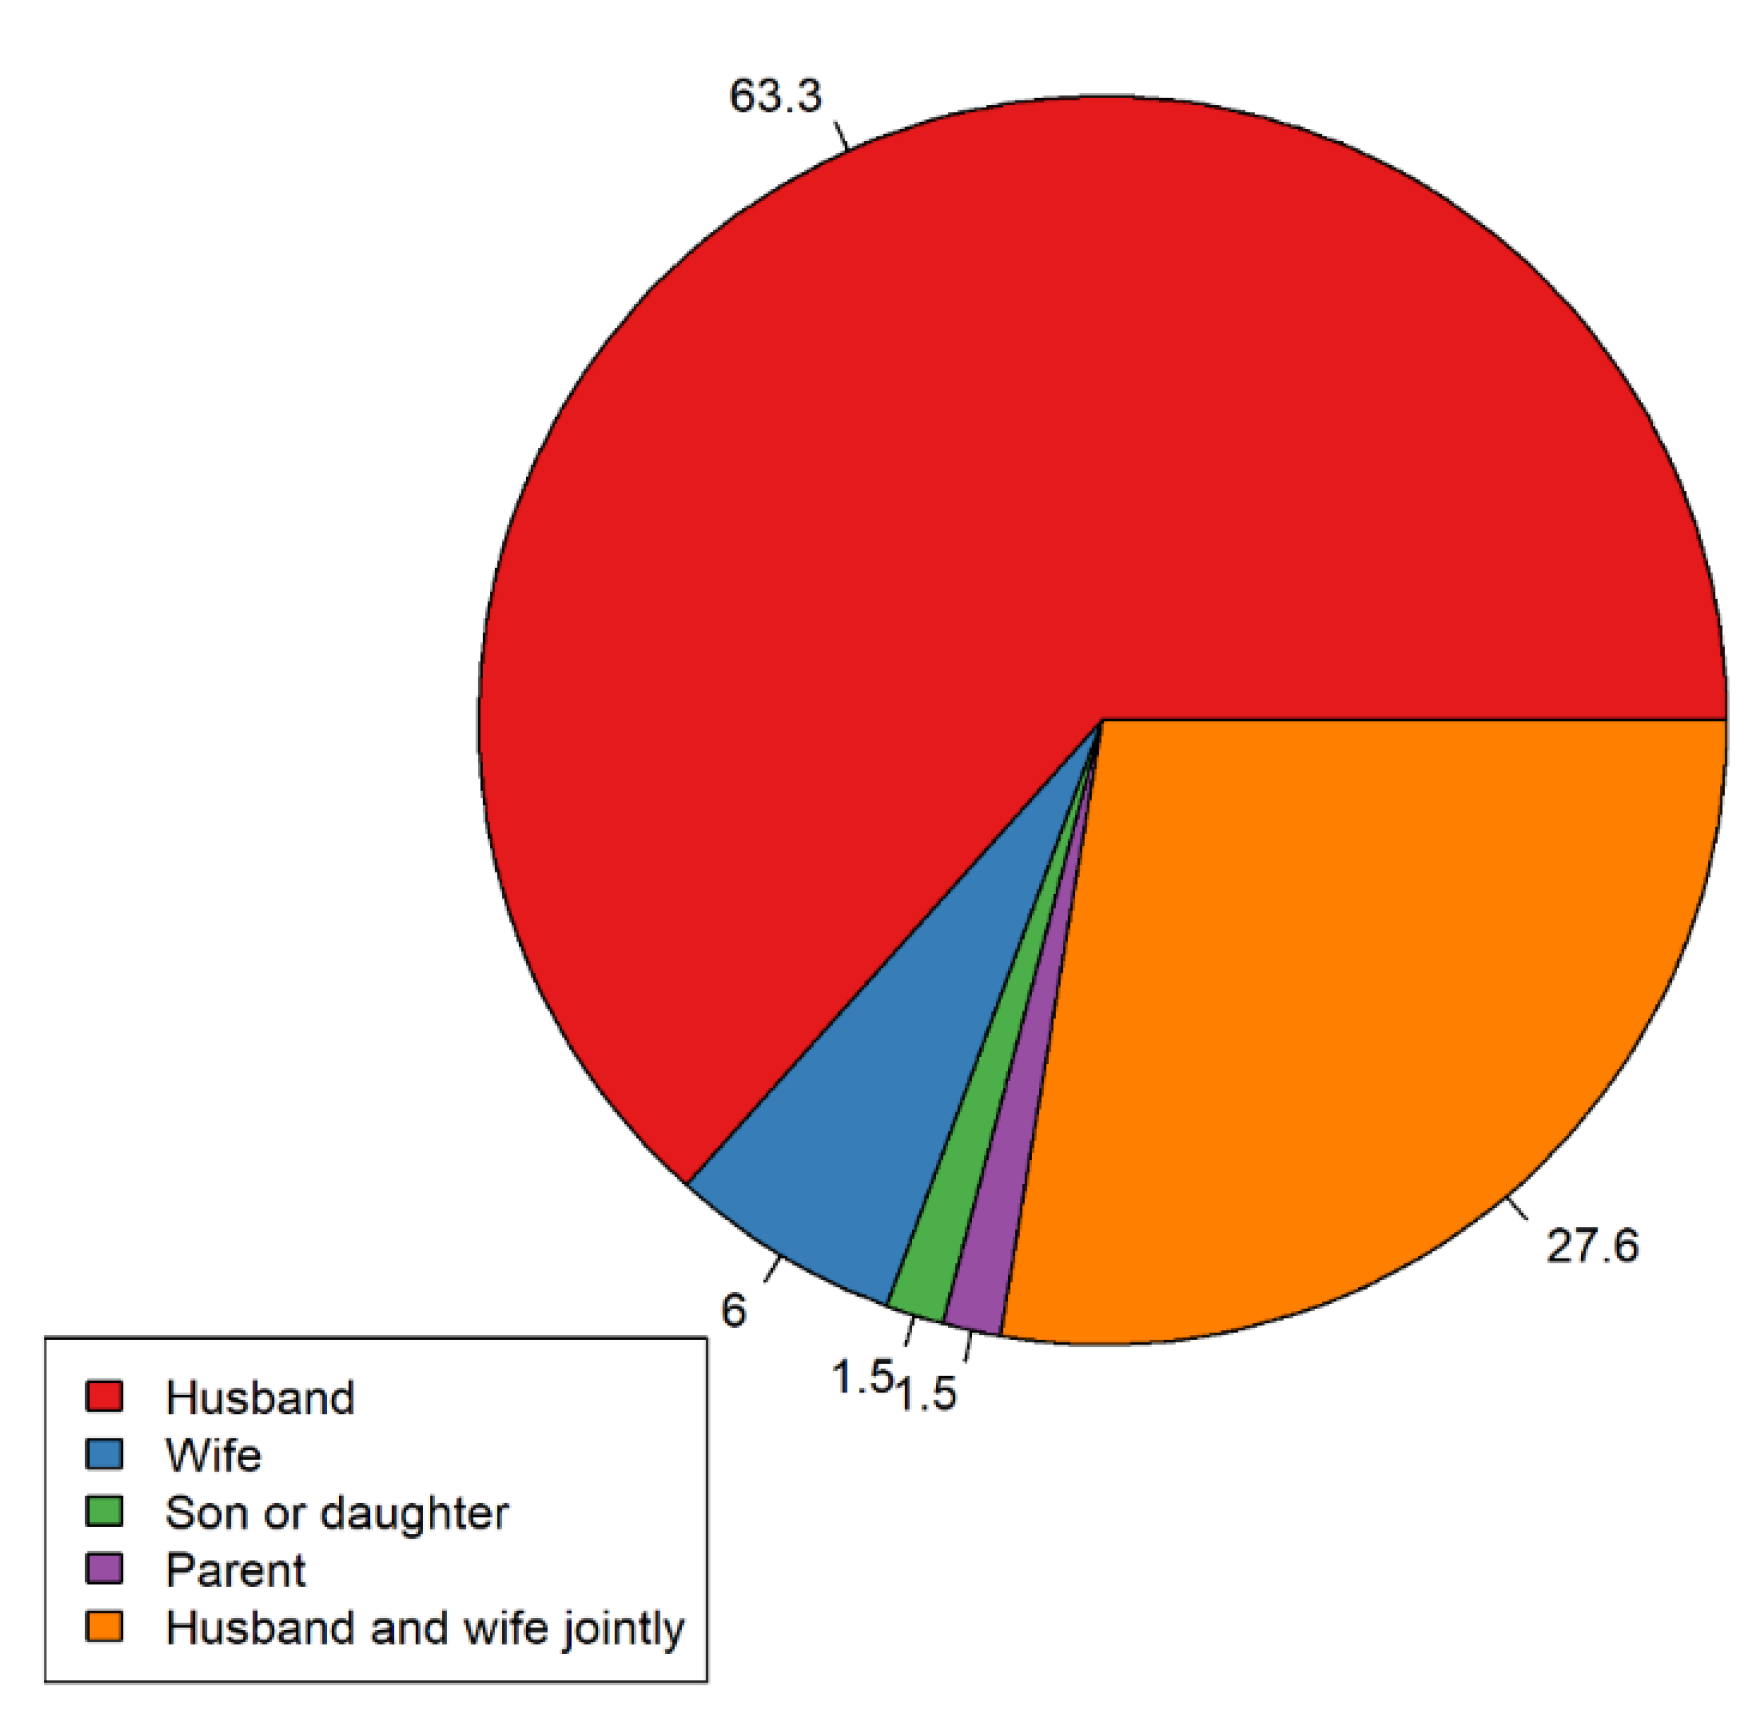
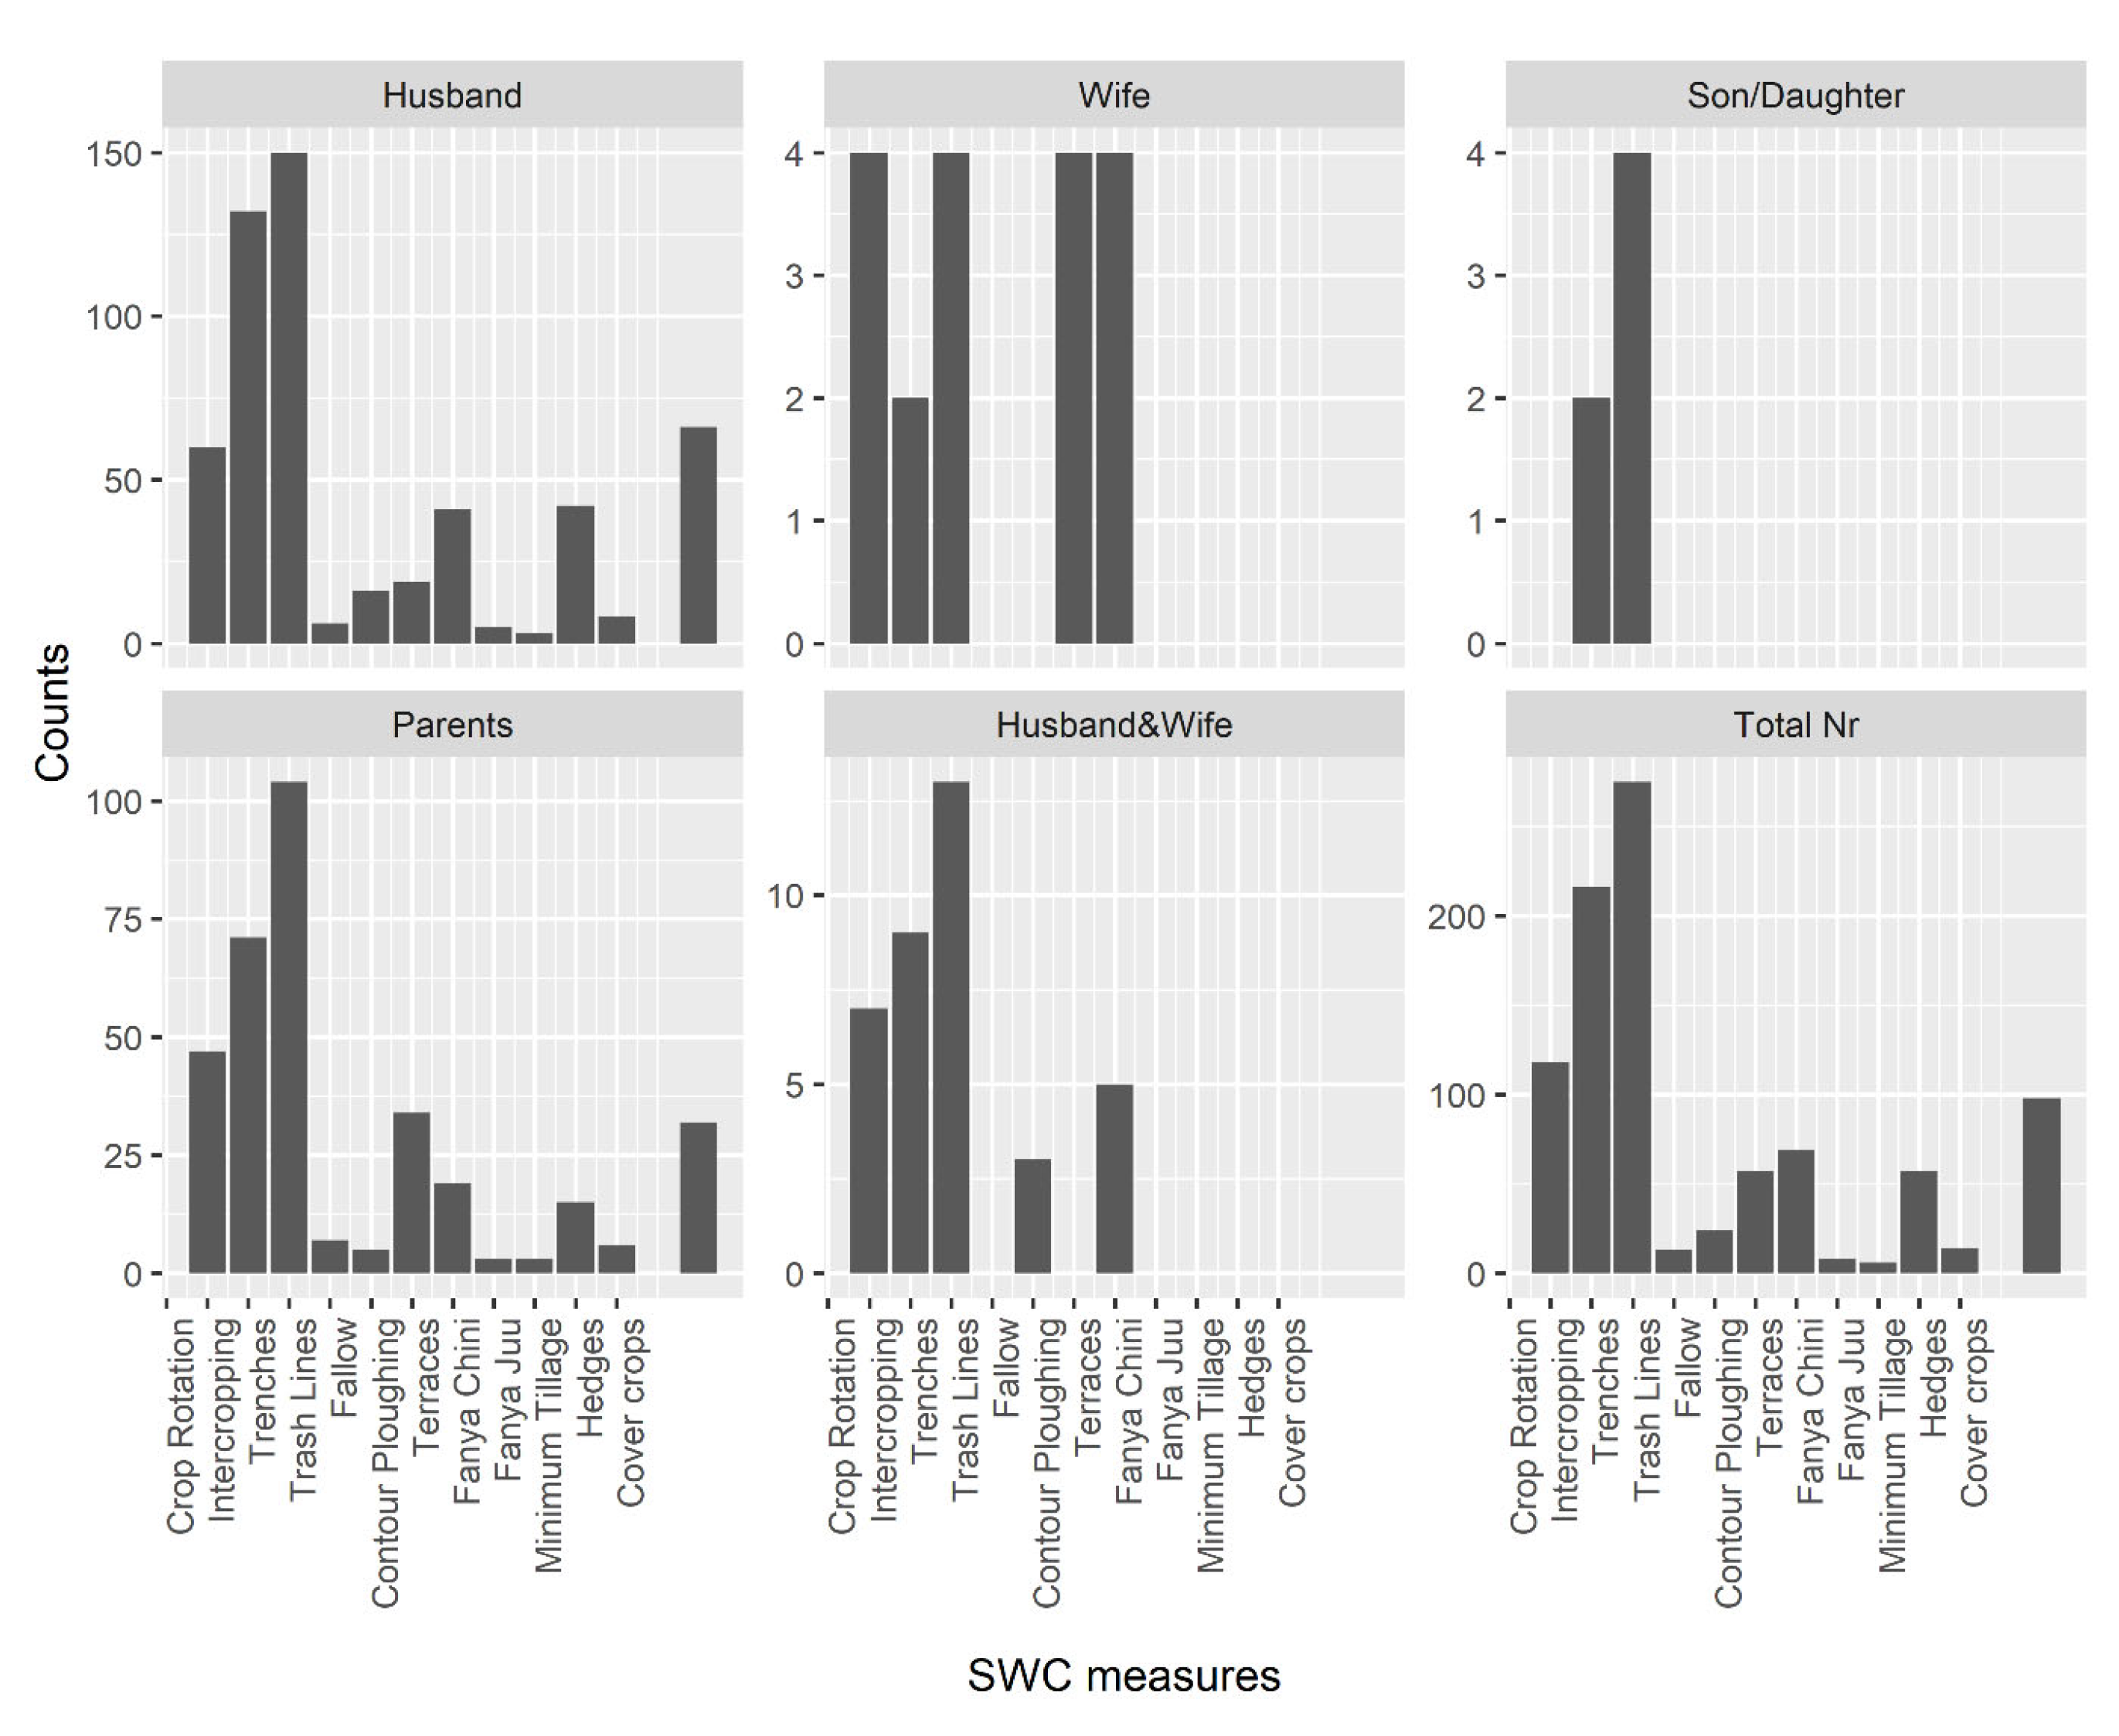
3.5. Decision-Makers and Their Influence on Applied Agricultural Practices

The decision-maker is herein defined as the person responsible for making all the decisions regarding the farm, including but not limited to the types of crops to be planted, the farm inputs (e.g., fertilizers), the management practices carried out, and where to sell the harvested produce. The survey results showed that five categories of decision-makers could be discerned. These included (i) husband, (ii) wife, (iii) both husband and wife, (iv) children, either son or daughter, and (v) parents. Category (iv) was common if the owner of the farm was deceased and the children took over the management of the farm, or in some cases, if the parents were absent or lived in another area. Case (v) applied when the farm owner was away from home, working in another place, and the owner’s parents managed the farm.
Regarding the distribution of the decision-makers, the husbands were the most common (63%) decision-makers in the farm households (Figure 13). Secondly, a joint decision-making by husbands and wives (27.6%) was also crucial in some households. The wives represented 6% of the decision-makers of the surveyed households. The least common decision-makers were children (1.5%) and parents (1.5%). For the “parents” decision-maker category, the respondents were still living with their parents, or the farms belonged to their parents who were living and working in other places (Figure 13).
A further analysis of the influence of the various decision-makers on the implementation of SWCPs was conducted on a plot level, in this case, 657 plots. The husbands had the most influence on the SWCPs implemented on the plots since they were in charge of up to two orders of magnitude higher number of plots with SWCPs compared to the wives, despite the balanced gender ratio (male:female) of the interviewees. Parents, as decision-makers, were also in charge of a higher number of plots with SWCPs and practised almost all the different SWCPs. The wives and the children were in charge of the least number of plots with SWCPs, with also fewer varieties of SWCPs (Figure 14).

4. Discussion

4.1. Farm Household Characteristics and Agricultural Practices

The representation of the males and females interviewed in this study was balanced. The female members (53.5%) of the household interviewed were either the household heads or jointly made decisions concerning the farm with their husbands. Such a gender balance of respondents is contrary to other studies that usually have a relatively low female representation. For example, compared to the results of this study, ref. [54] had a larger representation of males (66%) and fewer (34%) females in their study in Eastern Uganda. In [31], the authors also had a higher representation of males (62%) compared to the female gender at 38%. In [55], the author, whose work focused on sustainable farming practices among Ghanaian farmers, noted that when females were not separated from the males, the interviews tended to focus more on the men and their activities, which was not the case in this study.
The average farm size of 0.66 hectares was similar to the study conducted in Uganda, where the sampled farmlands averaged between 0.65 and 0.75 ha [32]. Ref. [31] also had respondents owning land sizes of less than 0.8 ha, which is also within the same range. The relatively small plot sizes in our study indicated that land was highly fragmented within the SMMRB. Our results showed that males (59%) owned most of the land, as also seen by [54]’s study in Eastern Uganda. Interestingly, joint land ownership was also a common practice (32% of farms) within the SMMRB, as this meant that decisions could be made jointly by males and females, as also reported by the farmers.

4.2. Major Crops Grown in the SMMRB and Their Spatial Distribution in Relation to Topography

Most farmers within the SMMRB area practised subsistence farming with relatively small farms. Subsistence farming is also observed in the surrounding regions of the catchment, including the western part of Kenya. The SMMRB is dominated by rain-fed agriculture, and the main crops grown based on our survey were maize, beans, fodder, coffee, and bananas. Sugar cane and tobacco were grown as additional essential cash crops. The crops grown within the catchment were generally very heterogeneous and grown within small plot areas. Due to the increasing population trend and the high population density, a significant land-use change was observed, transforming forests, wetlands, and grasslands into croplands, making these areas vulnerable to soil erosion and partially to landslides, especially on the very steep slopes of Mount Elgon (i.e., Lwakhakha and the Malakisi subcatchments).
The cultural influence, but also flatter topographic conditions and wetlands, probably play a more important role than rainfall in the distribution of the crops grown within the Sio Malaba Malakisi River Basin. Sugar cane is limited to a specific area around Bungoma in the northern part of the Sio catchment, not necessarily because of climate, but due to historical developments and a nearby sugar factory. These observations are also supported by the spatial distribution of the crops grown in the two planting seasons. Season 1 is the long rainy season (February–June) where the farm preparations start in February and March in preparation for the long rains which begin in April and end in June. In this season, mostly maize and beans are grown. The second season is characterized by a short rainy season (September–January), in which most farmers plant legumes. These are mostly beans because they grow fast and also fix nitrogen. Secondary crops in this case are the crops that are grown after the two main crops for each farmer in their plots/farms.

4.3. The Status of Soil Erosion

4.3.1. Soil Erosion and Perceived Change in Fertility

Most farmers (60%) within the SMMRB reported soil erosion within their farms. This finding is consistent with ref. [32]’s study in the proximity of the SMMRB, which reported that about 80% of the surveyed farmers experienced soil erosion. The finding is also supported by ref. [31]’s study, which showed that 91% of their respondents indicated that soil erosion occurred on their farmlands, and 95% considered it a severe environmental problem. The high soil erosion within the catchment may be due to the high population density within the basin, which has resulted in a fragmentation and overcultivation of the land and is in agreement with the findings in the report on the state of the Sio Malaba Malakisi Basin by [18]. The report further stated that the land fragmentation had reached unproductive levels of about an eighth acre in some areas, which was also reiterated by this study using the reported sizes of farms and plots (Table 2). From the chi-squared test on the relationship between soil erosion and fertility on the farms, it emerged that the presence of soil erosion was significantly related to the reported reduction in fertility. This result is supported by [1,31], who noted that soil nutrient depletion was a problem on virtually all types of lands in their study watersheds. The result of this study was also consistent with the report on the state of the Sio Malaba Malakisi Basin, which reported the most typical manifestation of soil erosion as a loss of soil fertility.

4.3.2. Soil Water Conservation Practices/Measures Practised within the Study Area

Identifying the individual SWCPs practised within the catchment was essential, as each played a crucial role on the farms. However, selecting a single soil water conservation measure to extrapolate to a whole farm area may be misleading, as farms within the region are highly fragmented and tend to have more than one soil water conservation measure. We found the farmers who implemented SWCPs applied 2–3 different types of these SWCPs to their fields. Furthermore, this study termed soil water conservation practices applied to the whole cropping area, such as intercropping and minimum tillage, as extensive measures. The other soil water conservation measures, such as trenches, provided a higher value to farmers with less land and these were the linear measures. The analysis of the SWCPs individually as single technologies rather than as multiple combined technologies showed that farmers using one practice were better ranked in adoption and coverage of SWCPs than those who adopted multiple practices on their farms [56]. In this study, the farmers listed the five most crucial soil water conservation measures they applied on their farms (provided as a proportion of the cropping area). Our results showed that farmers combined several SWCPs, similar to other studies [19,32,55,57].
The farmers (28%) who lacked SWCPs on their farms in this study could be explained by the lack of technical know-how, or financial capacity as most soil water conservation measures require a high initial investment and regular maintenance for them to be effective [35]. This finding is contrary to [31], who reported that 65% of their survey respondents around the Mount Elgon region practised some soil water conservation measures, leaving about 35% who lacked SWCPs. In Ref. [31], the authors noted that the motivation for implementing SWCPs in their study area was not exclusively soil erosion control but also included economic, food, and nutritional security benefits. This reason, coupled with the fact that [31]’s study was focused on the mountainous region of the Elgon with steep slopes, could explain the relative differences in their results from our findings.
The type of farming system has also been viewed as an essential factor contributing to the adoption rate of certain soil water conservation measures. For instance, farmers practising subsistence farming [55] are less likely to invest in soil water conservation measures if they are not convinced that a severe problem exists [31]. In Ref. [56]’s study in West Africa Sahel, farmers who grew cash crops were highly willing to adopt stone bunds because they acknowledged the existence of soil erosion and the potential profit of addressing the erosion, despite the high cost of stone bunds. In [2], the authors showed that an average household in SMMRB waits about 10 years to adopt any of the 17 soil water conservation measures they recorded in their study, which were among the 13 SWCPs also found in this study. Household heads and accessible markets can motivate farmers to control land degradation through the timely adoption of soil water conservation measures to increase crop yield [2]. Only 28% of the farmers are not practising soil water conservation measures in the SMMRB.
The major soil water conservation measures included intercropping and minimum tillage. Intensive measures (e.g., terraces) were limited to steep slopes and the area around the foot of Mount Elgon. This explains their low share and is supported by [31], who did not report the use of terraces. In Ref. [32], the authors acknowledged that using terraces was an important structural soil conservation practice that farmers adopted to control soil erosion. They were constructed several years back, regardless of the land type. This was evident in the farms that were surveyed in this study.
A large share of linear measures within the catchment consisted of trenches. Farmers constructed trenches to deal with uncontrolled surface runoff that washes the fertile soils from their farmlands. In Ref. [32], the authors also reported that farmers in the Mount Elgon region constructed trenches to deal with surface runoff flowing down slopes, damaging terrace risers, and removing fertile soils from the farmlands, aggravating crop yield, and increasing the cost of terrace maintenance. The authors of [31] reported that contour bunds and cut-off drains were the most popular measures applied in their study area, supporting the finding that linear and extensive measures were the most commonly used in that region.
During the questionnaire, we had informal discussions with the farmers to understand their situations (this particular topic was a sensitive matter and therefore not documented and not part of the survey responses because of farmers’ privacy issues), it came out that the agricultural extensions officers rarely visited the farms for both Kenya and Uganda and when they did, it was only when they needed to implement a funded project and they needed model farms; moreover, the selection was highly biased/skewed to more affluent farmers with connections. The farmers mentioned that if they had access to the agricultural extension officers, their farms’ production would have been better since the agricultural extension services would have offered technical advice on increasing productivity to farmers. The authors of [58] recommended that agricultural extension service delivery be boosted through the timely recruitment and periodic training of agents and the provision of adequate logistics to the farmers.

4.3.3. Soil Water Conservation Practices/Measures in Relation to Perceived Soil Erosion

It is expected that farmers who experience soil erosion on their farms will most likely decide to practise SWCPs, and a correct implementation of the soil water conservation measures will lead to a reduction in soil erosion on their farms. However, the application of SWCPs and the presence of soil erosion in our study showed no such relationship. Two possible reasons may explain our findings. The first is that the number of farms that practised soil water conservation measures was not significant enough to be effective in the overall prevention of soil erosion. The second reason may be that the soil water conservation measures were practised for an entirely different reason other than soil erosion prevention. For example, measures such as intercropping, which was very popular among farmers in our study, were not only practised solely for soil erosion prevention but also to improve soil fertility. Such a finding is also similar to what was found by [31].
Although the narrative that most farmers who experience soil erosion are likely to implement soil water conservation measures is supported by the literature [59], this study’s results showed the contrary, as only 42% of the farmers responded to soil erosion by implementing soil water conservation measures. We attribute the low adoption of soil water conservation measures in our study area to several factors. These factors include limited resources, a lack of capital and labour, and a lack of incentives to invest in the soil water conservation measures (e.g., [2,31,60]).
The myriad of SWCPs reported in this study are similar to those practised in Ghana [55] and Tanzania [61]. This finding demonstrates that the farmers are aware of the soil erosion problem and the potential to prevent it. However, in some cases, the SWCPs we observed while conducting the survey were frequently not properly constructed or maintained, possibly due to a lack of sufficient human and construction resources. For example, [55] noted that the conservation measures adopted in their study area depended upon the availability of stones and grasses, while [61] reported that public participation in the construction and maintenance of the soil water conservation measures was crucial for their sustainability.
Research has shown that there is potential for exploring and practising organic farming in Kenya. The Research Institute of Organic Agriculture (FiBL), in collaboration with its research partners has established a network of long-term farming-system comparison trials in the tropics with field sites in Kenya, India, and Bolivia. The SysCom program by FIBL is specifically for organic agricultural production systems in the tropics. In Kenya, for example, [62] experimented with free living nematodes while [63] experimented with termites. Both studies demonstrated that the application of the correct quantity of organic inputs at the right time was necessary to improve organic crop yields. By employing a systemic approach and implementing good agricultural practices, organic systems could be managed successfully and profitably [64]. Ref. [64] also found that organic systems could build up soil fertility over the long term if managed well. Soil organic carbon was increased after a decade of organic inputs through compost, liquid manure, mulch. The authors of [62,63,64] showed that organic farming systems could produce yields equal to conventional systems, and gaps through which the Sio Malaba Malakisi River Basin can benefit from organic farming needs to be explored through targeted research.

4.3.4. The Decision-Makers within the SMMRB and Their Influence on Applied Agricultural Practices

Regarding decision making and the implementation of SWCPs, male farmers played an important role as the main decision-makers within the SMMRB, similar to other studies in Western Kenya and Eastern Uganda [54,65]. This finding highlights the socio-cultural context, where the man is culturally the head of the household and the overall decision-maker [65]. The likelihood of adopting a specific soil water conservation measures at a farm household would be higher if the male household members were targeted. The authors [57] in the southwest of Uganda reiterated this finding, as they showed that among the adopters of soil water conservation measures, 87% were households headed by men. However, decision making within the household was inconsistent for all the topics that required a decision. For instance, [66] found that for farm households in Uganda, the decision on the production of food crops for subsistence was close to being equally distributed between the female and male household members. Yet, [56] suggested that female-headed households were more likely to adopt inorganic fertilizers than male-headed households, whereas gender differentiation had no impact on the adoption of any of the other practices. That said, it is clear that the roles played by males and females in the decision-making process depend on the region and the type of farm management practice. For this reason, a detailed agricultural survey, such as the one in this study, is crucial in determining the key players in the decision-making processes within a farm household.

5. Conclusions

This study set out to investigate the frequency and type of soil conservation practices implemented in the Sio Malaba Malakisi River Basin (SMMRB), located in the transboundary region between Kenya and Uganda. We designed and implemented an agricultural survey through structured questionnaires, collecting information on farm sizes, ownership, crops grown, soil fertility, soil erosion, soil water conservation practices, and the decision-making processes in the SMMRB area. According to our research objectives, we collated relevant contingency tables and then applied appropriate statistical analyses. The chi-squared Test for independence was used to test the statistical significance of the relationships between farmers’ perceptions of the status of erosion and fertility, their social characteristics, and the applied SWCPs. Descriptive statistics were employed to show the critical trends in land use, decision-making processes and the extent of adoption of SWCPs.
The Sio Malaba Malakisi River Basin (SMMRB) is composed of highly fragmented farms, which practise rain-fed subsistence farming of maize and beans on small plots of land. In addition to maize and beans, 30 other crops were planted during the growing seasons. The use of a questionnaire in this study enabled us to capture the spatial distribution of the major crops grown in the catchment, which low-resolution remote sensing products would have otherwise missed. A large portion of the farmers reported both soil erosion (60%) and a loss of soil fertility (92%) on their farms. We found a significant correlation between the perceived soil erosion and perceived loss of soil fertility. This finding strengthens the postulate that reducing soil erosion may significantly improve soil fertility. Only 28% of the farmers questioned did not practise soil water conservation measures, which we linked from the data we collected to financial constraints and a lack of land ownership as some had leased their farmlands. Moreover, 72% of farmers who implemented soil water conservation measures practised 13 different soil water conservation measures. A total of 37% practised a combination of between two to five soil water conservation measures in their primary plot. These mainly included extensive methods such as intercropping that required smaller investments than intensive methods, such as terraces. Male farmers were the most common decision-makers and strongly determined the type of soil water conservation measures applied on the farms. More female farmers (22%) implemented soil water conservation measures on the farms with soil erosion compared to the male farmers (20%).
Therefore, the data obtained in this study give baseline information from the local farmers in the SMMRB region on the farming practices, crops grown, farm management and decision-makers, the status of soil erosion, and the conservation practices implemented. Its results highlight the value of incorporating detailed information on farm ownership and decision-making, crops grown, and the type of soil water conservation measures currently applied to provide more accurate information required for implementing farm-specific, spatially differentiated soil erosion and fertility loss mitigation strategies. This knowledge is critical for the local administration in developing or improving policies on conservation agriculture within the SMMRB, which will eventually increase yields for the local farmers. In addition, this study provides a basis for the transfer of knowledge to and from other river basins that have similar characteristics within Kenya and Uganda or even within Africa. This in turn provides an informed framework for the importation of proven farm management practices from outside the SMMRB, whose efficacy has been demonstrated.
Further investigations should focus on analysing the efficiency of the existing soil water conservation measures with spatial differentiation, as it was demonstrated by this study that the prevalence of SWCPs in the region did not result in the scarcity of soil erosion. Studies to evaluate the extent of the farmers’ knowledge of critical phenomena such as soil erosion, fertility, and quality and ultimately the accuracy of their perceptions of them will also be important.

Supplementary Materials

The following supporting information can be downloaded at: https://www.mdpi.com/article/10.3390/agriculture13071434/s1, Suplementary S1: Questionnaire and Supplementary S2: Statistical data for a priori sampling distribution estimation; Table S2a: Kenya; and Table S2b: Uganda.

Author Contributions

H.M. and M.H. designed the study, and H.M. conducted the survey to acquire input data; H.M. performed the analyses; M.H. and H.M. prepared the figures; K.S., J.L., N.K., L.O.O. and B.M.-S. contributed to the methodological framework; H.M., M.H., B.M.-S. and K.S. compiled the manuscript. All authors have read and agreed to the published version of the manuscript.

Funding

This research has been financed by the Austrian Partnership Programme in Higher Education and Research for Development—APPEAR, a programme of the Austrian Development Cooperation (ADC) and implemented by the Austrian Agency for International Cooperation in Education and Research (OeAD). Grant no. OEZA Project number: 0894–00/2014, Appear Project 158.

Informed Consent Statement

This study was approved by the National Commission for Science, Technology & Innovation (NACOSTI) as per the national regulations of research in Kenya under the permit number NACOSTI/P/18/14094/22399. Proper chain of command was followed in seeking permission to carry out the research. The permission granted was well documented in the form of acceptance letters for both Kenya and Uganda. Officials in the agriculture sector in the study area for both Kenya and Uganda were then approached to provide more information on the local farmers and advice on how to proceed in order to access the farmers for both Kenya and Uganda. Once the interviewers had access to the local areas, the local authorities (chiefs and village heads) were informed of the research and once they were sufficiently briefed, they also approved the study. An informed verbal consent was obtained from the household respondents prior to conducting the questionnaire survey. The study was conducted in accordance with the Declaration of Helsinki, and approved by the BOKU University Ethics Board reference number BOKU-2022/011.

Data Availability Statement

Data generated and supporting the findings of this study can be found in the article and/or supplementary materials. Primary data are available from the corresponding author, HM, upon request. Maps were generated using openly available primary input data. All these input data can be acquired from the rights holders of these data sets.

Acknowledgments

We would like to thank the interviewed farmers, who volunteered their time and work to provide the requisite responses during our long interviews. We also appreciate the support of the concerned government officials who facilitated the provision of the required permits to access the farmers in the transboundary region of study. We appreciate the efforts of David Owino and Stanley Chasia, who were part of the interviewing team that endured the difficult terrain, weather, and insecurity issues experienced during the study survey.

Conflicts of Interest

The authors declare no conflict of interest.

Abbreviations

SMMRBSio Malaba Malakisi River Basin
SWCPsSoil and water conservation practices
SWCPSoil and water conservation practice
gSPsGeneralized support practices
KNBSKenya National Bureau of Statistics
UBOSUganda Bureau of Statistics
NPPNet primary productivity
ITCZIntertropical Convergence Zone

References

  1. Amann, A.; Herrnegger, M.; Karungi, J.; Komakech, A.J.; Mwanake, H.; Schneider, L.; Schürz, C.; Stecher, G.; Turinawe, A.; Zessner, M.; et al. Can local nutrient-circularity and erosion control increase yields of resource-constraint smallholder farmers? A case study in Kenya and Uganda. J. Clean. Prod. 2021, 318, 128510. [Google Scholar] [CrossRef]
  2. Nyirahabimana, H.; Turinawe, A.; Lederer, J.; Karungi, J.; Herrnegger, M. What influences farmer’s adoption lag for soil and water conservation practices? Evidence from sio-malaba malakisi river basin of kenya and uganda borders. Agronomy 2021, 11, 1985. [Google Scholar] [CrossRef]
  3. Vanlauwe, B.; AbdelGadir, A.H.; Adewopo, J.; Adjei-Nsiah, S.; Ampadu-Boakye, T.; Asare, R.; Baijukya, F.; Baars, E.; Bekunda, M.; Coyne, D.; et al. Looking back and moving forward: 50 years of soil and soil fertility management research in sub-Saharan Africa. Int. J. Agric. Sustain. 2017, 15, 613–631. [Google Scholar] [CrossRef] [PubMed] [Green Version]
  4. Vogt, J.V.; Safriel, U.; Von Maltitz, G.; Sokona, Y.; Zougmore, R.; Bastin, G.; Hill, J. Monitoring and assessment of land degradation and desertification: Towards new conceptual and integrated approaches. Land Degrad. Dev. 2011, 22, 150–165. [Google Scholar] [CrossRef]
  5. Rotich, B.; Csorba, A. Soil and water conservation in Kenya; Practices, Challenges and Prospects. In Proceedings of the 5th ISCW, Szarvas, Hungary, 22–24 March 2022. [Google Scholar]
  6. Chuma, G.B.; Mondo, J.M.; Ndeko, A.B.; Bagula, E.M.; Lucungu, P.B.; Bora, F.S.; Karume, K.; Mushagalusa, G.N.; Schmitz, S.; Bielders, C.L. Farmers’ knowledge and Practices of Soil Conservation Techniques in Smallholder Farming Systems of Northern Kabare, East of D.R. Congo. Environ. Chall. 2022, 7, 100516. [Google Scholar] [CrossRef]
  7. Jiang, B.; Bamutaze, Y.; Pilesjö, P. Climate change and land degradation in Africa: A case study in the Mount Elgon region, Uganda. Geo-Spat. Inf. Sci. 2014, 17, 39–53. [Google Scholar] [CrossRef] [Green Version]
  8. Okeyo, A.I.; Mucheru-muna, M.; Mugwe, J.; Ngetich, K.F. Effects of selected soil and water conservation technologies on nutrient losses and maize yields in the central highlands of Kenya. Agric. Water Manag. 2014, 137, 52–58. [Google Scholar] [CrossRef]
  9. Karamage, F.; Zhang, C.; Liu, T.; Maganda, A.; Isabwe, A. Soil erosion risk assessment in Uganda. Forests 2017, 8, 52. [Google Scholar] [CrossRef]
  10. Bamutaze, Y. Patterns of Water Erosion and Sediment Loading in Manafwa Catchment, Mt. Elgon, Eastern Uganda Thesis. Ph.D. Thesis, Philosophy of Makerere University, Kampala, Uganda, 2010. [Google Scholar]
  11. Wichern, J.; van Wijk, M.T.; Descheemaeker, K.; Frelat, R.; van Asten, P.J.A.; Giller, K.E. Food availability and livelihood strategies among rural households across Uganda. Food Secur. 2017, 9, 1385–1403. [Google Scholar] [CrossRef] [Green Version]
  12. Ritzema, R.S.; Frelat, R.; Douxchamps, S.; Silvestri, S.; Rufino, M.C.; Herrero, M.; Giller, K.E.; López-Ridaura, S.; Teufel, N.; Paul, B.K.; et al. Is production intensification likely to make farm households food-adequate? A simple food availability analysis across smallholder farming systems from East and West Africa. Food Secur. 2017, 9, 115–131. [Google Scholar] [CrossRef]
  13. Pender, J.; Nkonya, E.; Jagger, P.; Sserunkuuma, D.; Ssali, H. Strategies to increase agricultural productivity and reduce land degradation: Evidence from Uganda. Agric. Econ. 2004, 31, 181–195. [Google Scholar] [CrossRef] [Green Version]
  14. Brink, A.B.; Bodart, C.; Brodsky, L.; Defourney, P.; Ernst, C.; Donney, F.; Lupi, A.; Tuckova, K. Anthropogenic pressure in East Africa-Monitoring 20 years of land cover changes by means of medium resolution satellite data. Int. J. Appl. Earth Obs. Geoinf. 2014, 28, 60–69. [Google Scholar] [CrossRef]
  15. Drechsel, P.; Gyiele, L.; Kunze, D.; Cofie, O. Population density, soil nutrient depletion, and economic growth in sub-Saharan Africa. Ecol. Econ. 2001, 38, 251–258. [Google Scholar] [CrossRef]
  16. Bai, Z.G.; Dent, D.L.; Olsson, L.; Schaepman, M.E. Proxy global assessment of land degradation. Soil Use Manag. 2008, 24, 223–234. [Google Scholar] [CrossRef]
  17. Kogo, B.K.; Kumar, L.; Koech, R. Impact of Land Use/Cover Changes on Soil Erosion in Western Kenya. Sustainability 2020, 12, 9740. [Google Scholar] [CrossRef]
  18. Kaindi, N. Final Report State of Sio-Malaba-Malakisi Transboundary Integrated Water Resources Management & Development Project February 2013; Nile Equatorial Lakes Subsidiary Action Programme (NELSAP): Kigali, Rwanda, 2013. [Google Scholar]
  19. Alice, T. Impact of soil and water conservation technology adoption on smallholder farms in South-Western Uganda. J. Dev. Agric. Econ. 2019, 11, 217–233. [Google Scholar] [CrossRef] [Green Version]
  20. Bagheri, A.; Teymouri, A. Farmers’ intended and actual adoption of soil and water conservation practices. Agric. Water Manag. 2022, 259, 107244. [Google Scholar] [CrossRef]
  21. Alemu, M.D.; Kebede, A.; Moges, A. Farmers’ Perception of Soil Erosion and Adoption of Soil Conservation Technologies at Geshy Sub-Catchment, Gojeb River Catchment, Ethiopia. Agric. Sci. 2019, 10, 46–65. [Google Scholar] [CrossRef] [Green Version]
  22. Moges, D.M.; Taye, A.A. Determinants of farmers’ perception to invest in soil and water conservation technologies in the North-Western Highlands of Ethiopia. Int. Soil Water Conserv. Res. 2017, 5, 56–61. [Google Scholar] [CrossRef]
  23. Wolka, K.; Sterk, G.; Biazin, B.; Negash, M. Benefits, limitations and sustainability of soil and water conservation structures in Omo-Gibe basin, Southwest Ethiopia. Land Use Policy 2018, 73, 1–10. [Google Scholar] [CrossRef]
  24. Betela, B.; Wolka, K. Evaluating soil erosion and factors determining farmers ’ adoption and management of physical soil and water conservation measures in Bachire watershed, southwest Ethiopia. Environ. Chall. 2021, 5, 100348. [Google Scholar] [CrossRef]
  25. Schürz, C.; Mehdi, B.; Kiesel, J.; Schulz, K.; Herrnegger, M. A systematic assessment of uncertainties in large-scale soil loss estimation from different representations of USLE input factors-a case study for Kenya and Uganda. Hydrol. Earth Syst. Sci. 2020, 24, 4463–4489. [Google Scholar] [CrossRef]
  26. Bamutaze, Y.; Thiemann, S.; Förch, G.G. Integrated Watershed Management for Urban Water Security. In Proceedings of the Integrated Watershed Management for Urban Water Security Integrated Watershed Management-a Tool for Urban Water Security Workshop Results from Mbale, Mbale, Uganda, 10–16 March 2014. [Google Scholar]
  27. Mondorf, D. The Water-Energy-Food Security Nexus in the Kenyan-Ugandan border region Impact of surface water quality deterioration through agricultural practices on drinking water. 2020. Available online: https://mediatum.ub.tum.de/doc/1612080/1612080.pdf (accessed on 10 July 2023).
  28. Barasa, B.; Majaliwa, J.G.M.; Lwasa, S.; Obando, J.; Bamutaze, Y. Magnitude and transition potential of land-use/cover changes in the trans-boundary river sio catchment using remote sensing and GIS. Ann. GIS 2011, 17, 73–80. [Google Scholar] [CrossRef]
  29. Bamutaze, Y.; Makooma, M.; Jackson, M.; Majaliwa, G.; Vanacker, V.; Bagoora, F.; Magunda, M.; Obando, J.; Ejiet, J. Catena in filtration characteristics of volcanic sloping soils on Mt. Elgon, Eastern Uganda. Catena 2010, 80, 122–130. [Google Scholar] [CrossRef]
  30. Chasia, S.; Herrnegger, M.; Juma, B.; Kimuyu, J.; Sitoki, L.; Olang, L. Analysis of land-cover changes in the Transboundary Sio-Malaba-Malakisi River Basin of East Africa: Towards identifying potential land-use transition regimes. Afr. Geogr. Rev. 2021, 42, 170–186. [Google Scholar] [CrossRef]
  31. Bamutaze, Y.; Mukwaya, P.; Oyama, S.; Nadhomi, D.; Nsemire, P. Intersecting RUSLE modelled and farmers perceived soil erosion risk in the conservation domain on mountain Elgon in Uganda. Appl. Geogr. 2021, 126, 102366. [Google Scholar] [CrossRef]
  32. Buyinza, M.; Kaboggoza, J.R.S.; Nabanoga, G.; Nagula, A.; Nabalegwa, M. Site specific soil conservation strategies Around Mt. Elgon National Park, Eastern Uganda. Res. J. Appl. Sci. 2007, 2, 978–983. [Google Scholar]
  33. Xu, L.; Zhang, D.; Proshad, R.; Chen, Y.l.; Huang, T.f.; Ugurlu, A. Effects of soil conservation practices on soil erosion and the size selectivity of eroded sediment on cultivated slopes. J. Mt. Sci. 2021, 18, 1222–1234. [Google Scholar] [CrossRef]
  34. El Mekkaoui, A.; Moussadek, R.; Mrabet, R.; Douaik, A.; El Haddadi, R.; Bouhlal, O.; Elomari, M.; Ganoudi, M.; Zouahri, A.; Chakiri, S. Effects of Tillage Systems on the Physical Properties of Soils in a Semi-Arid Region of Morocco. Agriculture 2023, 13, 683. [Google Scholar] [CrossRef]
  35. Wolka, K.; Mulder, J.; Biazin, B. Effects of soil and water conservation techniques on crop yield, runoff and soil loss in Sub-Saharan Africa: A review. Agric. Water Manag. 2018, 207, 67–79. [Google Scholar] [CrossRef]
  36. Ebisemiju, F. Gully morphometric controls in a laterite terrain, Guyana. Soil Tillage Res. 1988, 12, 49–51. [Google Scholar] [CrossRef]
  37. ESA ESA Land Cover Climate Change Initiative (ESA LC CCI) Data: ESACCI-LC-L4-LCCS-Map-300m-P1Y-1992_2015- v2.0.7.tif via Centre for Environmental Data Analysis. 2017. Available online: http://maps.elie.ucl.ac.be/CCI (accessed on 7 July 2023).
  38. Didan, K. MOD13Q1 MODIS/Terra vegetation indices 16-day L3 global 250m SIN grid V006, NASA EOSDIS Land Processes DAAC. NASA Eosdis Land Process. Daac 2015, 10, 415. [Google Scholar] [CrossRef]
  39. KNBS. County Statistical Abstract 2015. Bungoma County; Technical Report; Kenya National Bureau of Statistics: Nairobi, Kenya, 2015. [Google Scholar]
  40. KNBS. County Statistical Abstract 2015. Busia County; Technical Report; Kenya National Bureau of Statistics: Nairobi, Kenya, 2015; Volume II. [Google Scholar]
  41. Uganda Bureau of Statistics (UBOS). 2017 Statistical Abstract; Uganda Bureau of Statistics: Kampala, Uganda, 2017; pp. 1–341. [Google Scholar]
  42. Tatem, A.J.; Noor, A.M.; von Hagen, C.; Di Gregorio, A.; Hay, S.I. High resolution population maps for low income nations: Combining land cover and census in East Africa. PLoS ONE 2007, 2, e0001298. [Google Scholar] [CrossRef] [PubMed]
  43. Nadhomi, D.L.; Tenywa, J.S.; Majaliwa, J.G.M. Adaptation of RUSLE to Model Erosion Risk in a Watershed with Terrain Heterogeneity. Int. J. Adv. Earth Sci. Eng. 2013, 2, 93–107. [Google Scholar]
  44. Diwediga, B.; Le, Q.B.; Agodzo, S.K.; Tamene, L.D.; Wala, K. Modelling soil erosion response to sustainable landscape management scenarios in the Mo River Basin (Togo, West Africa). Sci. Total Environ. 2018, 625, 1309–1320. [Google Scholar] [CrossRef]
  45. Mugalavai, E.M.; Kipkorir, E.C.; Raes, D.; Rao, M.S. Analysis of rainfall onset, cessation and length of growing season for western Kenya. Agric. For. Meteorol. 2008, 148, 1123–1135. [Google Scholar] [CrossRef]
  46. Omonge, P.; Feigl, M.; Olang, L.; Schulz, K.; Herrnegger, M. Evaluation of satellite precipitation products for water allocation studies in the Sio-Malaba-Malakisi river basin of East Africa. J. Hydrol. Reg. Stud. 2022, 39, 100983. [Google Scholar] [CrossRef]
  47. Herrnegger, M.; Stecher, G.; Schwatke, C.; Olang, L. Hydroclimatic analysis of rising water levels in the Great rift Valley Lakes of Kenya. J. Hydrol. Reg. Stud. 2021, 36, 100857. [Google Scholar] [CrossRef]
  48. Yesuph, A.Y.; Dagnew, A.B. Soil erosion mapping and severity analysis based on RUSLE model and local perception in the Beshillo Catchment of the Blue Nile Basin, Ethiopia. Environ. Syst. Res. 2019, 8, 1–21. [Google Scholar] [CrossRef] [Green Version]
  49. Haregeweyn, N.; Tsunekawa, A.; Poesen, J.; Tsubo, M.; Meshesha, D.T.; Fenta, A.A.; Nyssen, J.; Adgo, E. Comprehensive assessment of soil erosion risk for better land use planning in river basins: Case study of the Upper Blue Nile River. Sci. Total Environ. 2017, 574, 95–108. [Google Scholar] [CrossRef] [Green Version]
  50. Zachar, D. Soil Erosion; Elsevier: Amsterdam, The Netherlands, 1982. [Google Scholar] [CrossRef]
  51. Gachene, C.; Nyawade, S.; Karanja, N. Soil and Water Conservation: An Overview. In Zero Hunger. Encyclopedia of the UN Sustainable Development Goals; Leal Filho, W., Azul, A.M., Brandli, L., Özuyar, P.G., Wall, T., Eds.; Springer: Cham, Switzerland, 2020. [Google Scholar] [CrossRef]
  52. Panagos, P.; Ballabio, C.; Borrelli, P.; Meusburger, K.; Klik, A.; Rousseva, S.; Per, M.; Michaelides, S.; Hrabalíková, M.; Olsen, P.; et al. Rainfall erosivity in Europe. Sci. Total Environ. 2015, 511, 801–814. [Google Scholar] [CrossRef] [PubMed] [Green Version]
  53. Terranova, O.; Antronico, L.; Coscarelli, R.; Iaquinta, P. Geomorphology Soil erosion risk scenarios in the Mediterranean environment using RUSLE and GIS: An application model for Calabria (southern Italy). Geomorphology 2009, 112, 228–245. [Google Scholar] [CrossRef]
  54. Nabikolo, D.; Bashaasha, B.; Mangheni, M.N.; Majaliwa, J.G.M. Determinants of Climate Change Adaptation Among Male and Female Headed Farm Households in Eastern Uganda. Afr. Crop Sci. J. 2012, 20, 203–212. [Google Scholar]
  55. Veihe, A. Sustainable farming practices: Ghanaian farmers’ perception of erosion and their use of conservation measures. Environ. Manag. 2000, 25, 393–402. [Google Scholar] [CrossRef] [PubMed]
  56. Kpadonou, R.A.B.; Owiyo, T.; Barbier, B.; Denton, F.; Rutabingwa, F.; Kiema, A. Advancing climate-smart-agriculture in developing drylands: Joint analysis of the adoption of multiple on-farm soil and water conservation technologies in West African Sahel. Land Use Policy 2017, 61, 196–207. [Google Scholar] [CrossRef]
  57. Turinawe, A.; Drake, L.; Mugisha, J. Adoption intensity of soil and water conservation technologies: A case of South Western Uganda. Environ. Dev. Sustain. 2015, 17, 711–730. [Google Scholar] [CrossRef]
  58. Kathula, D.N. Factors Impacting Agricultural Production and the Role of Agricultural Extension Services in Kenya. J. Agric. 2023, 7, 22–44. [Google Scholar] [CrossRef]
  59. Tesfaye, A.; Negatu, W.; Brouwer, R.; van der Zaag, P. Understanding soil conservation decision of farmers in the gedeb watershed, Ethiopia. Land Degrad. Dev. 2014, 25, 71–79. [Google Scholar] [CrossRef] [Green Version]
  60. de Graaff, J.; Amsalu, A.; Bodnár, F.; Kessler, A.; Posthumus, H.; Tenge, A. Factors influencing adoption and continued use of long-term soil and water conservation measures in five developing countries. Appl. Geogr. 2008, 28, 271–280. [Google Scholar] [CrossRef]
  61. Ligonja, P.J.; Shrestha, R.P. Soil Erosion Assessment in Kondoa Eroded Area in Tanzania using Universal Soil Loss Equation, Geographic Information Systems and Socioeconomic Approach. Land Degrad. Dev. 2013, 26, 367–379. [Google Scholar] [CrossRef]
  62. Atandi, J.G.; Adamtey, N.; Kiriga, A.W.; Karanja, E.N.; Musyoka, M.W.; Matheri, F.M.; Tanga, C.M.; Coyne, D.L.; Fiaboe, K.K.M.; Bautze, D.; et al. Organic maize and bean farming enhances free-living nematode dynamics in sub-Saharan Africa. Agric. Ecosyst. Environ. 2022, 327, 107846. [Google Scholar] [CrossRef]
  63. Anyango, J.J.; Bautze, D.; Fiaboe, K.K.M.; Lagat, Z.O.; Muriuki, A.W.; Stöckli, S.; Riedel, J.; Onyambu, G.K.; Musyoka, M.W.; Karanja, E.N.; et al. The impact of conventional and organic farming on soil biodiversity conservation: A case study on termites in the long-term farming systems comparison trials in Kenya. BMC Ecol. 2020, 20, 13. [Google Scholar] [CrossRef] [Green Version]
  64. Bhullar, G.S.; Bautze, D.; Adamty, N.; Cicek, H.; Goldmann, E.; Riar, A.; Rüegg, J.; Schneider, M.; Huber, B. What Is the Contribution of Organic Agriculture to Sustainable Development? A Synthesis of Twelve Years (2007-2019) of the “Long-Term Farming Systems Comparisons in the Tropics (SysCom)”; A Comprehensive Report; Research Institute of Organic Agriculture (FiBL), Department of International Cooperation: Frick, Switzerland, 2020. [Google Scholar]
  65. Osanya, J.; Adam, R.I.; Otieno, D.J.; Nyikal, R.; Jaleta, M. An analysis of the respective contributions of husband and wife in farming households in Kenya to decisions regarding the use of income: A multinomial logit approach. Women’s Stud. Int. Forum 2020, 83, 102419. [Google Scholar] [CrossRef]
  66. Sell, M.; Minot, N. What factors explain women’s empowerment? Decision-making among small-scale farmers in Uganda. Womens. Stud. Int. Forum 2018, 71, 46–55. [Google Scholar] [CrossRef]
Figure 1. Study area in the border region of Kenya and Uganda between Lake Victoria and Mt. Elgon. Spatial properties in the area include (A) elevation, (B) classification of the soil erosion risk following Ebisemiju (1988), (C) land cover classification with the reference year 2015 (ESA LC CCI, 2017), and (D) the mean annual MODIS NDVI as a proxy for vegetation cover. The boundaries of the studied catchments are shown with blue outlines. The area is bounded between latitude 1.133° north to 0.193° south and longitude 33.673° west to 34.571° east. Data source: DEM and hillshades: SRTM 90m (Jarvis et al., 2008), Catchment boundaries and rivers: MERIT DEM (Yamazaki et al., 2019), Administrative boundaries, Roads, Cities, Water bodies: naturalearthdata.com (accessed on 1 July 2023).
Agriculture 13 01434 g001
Figure 2. Land use/land cover mapped in June/July 2017 by systematically following main roads and recording obvious land uses and land cover. Data sources: Climatic water balance: Precipitation: WorldClim vers. 2 (Fick and Hijmans, 2017), Reference evapotranspiration: Global ET0 (Trabucco and Zomer, 2019) DEM and hillshades: SRTM 90m (Jarvis et al., 2008), Catchment boundaries and rivers: MERIT DEM (Yamazaki et al., 2019), Administrative boundaries, Roads, Cities, Water bodies: naturalearthdata.com (accessed on 1 July 2023).
Agriculture 13 01434 g002
Figure 3. Land use/land cover mapped in June/July 2017 by systematically following main roads and recording obvious land uses and land cover. Data sources: Climatic water balance: Precipitation: WorldClim vers. 2 (Fick and Hijmans, 2017), Reference evapotranspiration: Global ET0 (Trabucco and Zomer, 2019) DEM and hillshades: SRTM 90m (Jarvis et al., 2008), Catchment boundaries and rivers: MERIT DEM (Yamazaki et al., 2019), Administrative boundaries, Roads, Cities, Water bodies: naturalearthdata.com (accessed on 1 July 2023).
Agriculture 13 01434 g003
Figure 4. A priori sample distribution based on the administrative units in the background and the final location of sampled questionnaires. Data sources: DEM and hillshades: SRTM 90m (Jarvis et al., 2008), Catchment boundaries and rivers: MERIT DEM (Yamazaki et al., 2019), Administrative boundaries, Roads, Cities, Water bodies: naturalearthdata.com (accessed on 1 July 2023).
Agriculture 13 01434 g004
Figure 5. Types of farming systems distributed by gender as reported by the respondents.
Agriculture 13 01434 g005
Figure 6. Crop categories based on the number of plots within the sampled area of the SMMRB (n = 200).
Agriculture 13 01434 g006
Figure 7. The main and secondary crops grown in different seasons and the soil erosion risk within the SMMRB. Planting season 1 (February–July 2017), planting season 2 (September 2017–January 2018). Data sources: DEM and hillshades: SRTM 90m (Jarvis et al., 2008), Catchment boundaries and rivers: MERIT DEM (Yamazaki et al., 2019), Administrative boundaries, Roads, Cities, Water bodies: naturalearthdata.com (accessed on 1 July 2023).
Agriculture 13 01434 g007
Figure 8. Farmers’ responses to change in fertility status and their perception of soil erosion. The light grey and black colours in the bars represent the absence and presence of soil erosion, respectively (n = 200).
Agriculture 13 01434 g008
Figure 9. The population distribution (% farmers) with the number of SWCP measures applied on their farms.
Agriculture 13 01434 g009
Figure 10. The different soil and water conservation practices (SWCPs) applied to the 200 farm households surveyed in the SMMRB.
Agriculture 13 01434 g010
Figure 11. The mean percentages of farmers in the different categories of gSPs (n = 200).
Agriculture 13 01434 g011
Figure 12. The generalized support practices and the soil erosion risk on the 200 farms visited. Data sources: DEM and hillshades: SRTM 90 m (Jarvis et al., 2008), Catchment boundaries and rivers: MERIT DEM (Yamazaki et al., 2019), Administrative boundaries, Roads, Cities, Water bodies: naturalearthdata.com (accessed on 1 July 2023).
Agriculture 13 01434 g012
Figure 13. Decision-makers of the farms (%) as reported by the interviewed farmers (n = 200).
Agriculture 13 01434 g013
Figure 14. Management practices implemented by different decision-makers. The counts refer to the number of plots.
Agriculture 13 01434 g014
Table 1. Smallholder farms’ characteristics of the Sio Malaba Malakisi River Basin.
CharacteristicsModalities Respondents (n = 200) Percentage (%)
SexMale 9346.5
Female10753.5
Decision-makerHusband12627.6
Wife126
Son/daughter31.5
Parent31.5
Joint5563.3
Type of householdSubsistence2512.5
Cash crop farming31.5
Subsistence + cash crop farming12763.5
Subsistence + livestock farming31.5
Subsistence + cash crop farming + livestock farming4221
Membership associationsYes12462
No7638
Number of parcels of lands112060
25728.5
32311.5
Average farm size<0.5 ha10452
0.5–1.0 ha6432
>0.5 ha3216
Cropping systemMonocropping 7537.5
Intercropping12562.5
Ownership of the landOwned19497
Rented 63
Gender ownershipHusband13567.5
Wife2110.5
Other male member42
Joint4020
Primary land useCultivated (annual crops)17788.5
Cultivated (perennial crops)157.5
Fallow31.5
Homestead31.5
Pastureland21
Percentage of plot protected by SWCPs<40%11256
40–99%5929.5
100%2914.5
Change in SWCPsIncreased136.5
Decreased8341.5
No change10452
Reason for change in SWCPsIncreased land scarcity8442
Labor-intensive4321.5
SC attracts rodents10.5
Increased soil erosion 52.5
Reduced soil fertility52.5
Increased soil fertility10.5
Increased farm size105
Reduced soil erosion10.5
Reduced rainfall intensity21
Combination of reasons4824
Change in soil fertility (within the last 5 years)Increased52
Decreased18692
No change93
Reason for change in soil fertilityIncreased use of mineral fertilizer on the plot4020
Increased use of organic manure on the plot21
Increased use of a combination of mineral fertilizer and organic manure on the plot52.5
Leaving the plot fallowed (uncultivated) for some seasons10.5
Use practices of erosion control measures31.5
Lack capacity (money) to use fertilizers (inorganic or organic)21
Continuous cultivation without fallowing4020
Destroyed soil conservation structures31.5
Reduced yield4422
Combination of reasons6030
Livestock Yes5929.5
No14170.5
Table 2. The type of crops grown, the reported farm area, and the yield of the 200 household farms surveyed in the SMMRB.
Crop TypeCrop NrNr of PlotsCropMean Area (ha)Mean Yield (kg/ha)
Cereals 1393Maize0.18504
213Sorghum0.2193
320Millet0.15143
41Rice0.130
Tubers and roots733Cassava0.18924
817Sweet potatoes0.15398
96Irish potatoes0.135283
101Yams0.2100
Legumes12304Beans0.1988
1327Groundnuts0.17129
145Soya beans0.1431
163Green grams0.238
Vegetables182Cabbage0.21100
1915Kale0.134250
201Amaranth0.1200
216Other green leafy vegetables0.15333
227Onions0.193543
261Mushrooms0.130
Fruits281Sweet bananas0.21000
2916Banana0.41822
3013Tomatoes0.19508
384Watermelon0.26125
Spices431Chilies0.159
Tress/export crops4618Coffee0.411672
4918Timber0.3246,833
511Fuelwood trees0.052000
522Fodder0.453000
5310Sugarcane0.48820
546Tobacco0.44167
563Sesame0.13341
Table 3. Grouping of the soil water conservation practices queried in the field questionnaires into “generalized support practices” (gSPs) and the corresponding support practices adopted from Shin (1999) (Shin documented 3 major categories of SWCPs, strip cropping, contouring, and terraces, which formed the basis of the gSPs, i.e., linear, extensive, and intensive, respectively).
Generalized Support Practice (gSP)Soil and Water Conservation Practices (SWCPs) from the QuestionnaireSupport Practice (Shin, 1999)Remark
LinearTrenches/diversion channelsStrip croppingApplied in a linear form and covers parts of the farms
Grass strips
Fanya Chini (cut-off drain)
Fanya Juu
Hedges
Alley cropping
Stones/soil bands
ExtensiveMulchingContouringApplied to cover the entire farm area
Fallow
Contour ploughing
Minimum tillage
Cover crops
Intercropping/
Crop rotation
IntensiveTerracesTerracesPractised on the steeper slopes of Mt. Elgon
No practice No SWCP technologies present
Table 4. Relationship between management practices and perceived presence of soil erosion. The numbers represent the farmers interviewed representing their various farms.
Management PracticesPerceived Presence of Soil Erosion
Not PresentPresent
Male FemaleMaleFemale
SWCP measures not practised7 (4%)11 (6%)15 (7%)23 (11%)
SWCP measures practised30 (15%)30 (15%)41 (20%)43 (22%)
Disclaimer/Publisher’s Note: The statements, opinions and data contained in all publications are solely those of the individual author(s) and contributor(s) and not of MDPI and/or the editor(s). MDPI and/or the editor(s) disclaim responsibility for any injury to people or property resulting from any ideas, methods, instructions or products referred to in the content.

