Article

Spatiotemporal Evolution of Land Use Efficiency in Southwest Mountain Area of China: A Case Study of Yunnan Province

Institute of Land & Resources and Sustainable Development, Yunnan University of Finance and Economics, Kunming 650221, China
*
Author to whom correspondence should be addressed.
Agriculture 2023, 13(7), 1343; https://doi.org/10.3390/agriculture13071343
Submission received: 17 May 2023 / Revised: 27 June 2023 / Accepted: 30 June 2023 / Published: 2 July 2023

Abstract

:
The study of land use efficiency (LUE) evaluation and coupled coordination (CC) relationships under the perspective of urbanization can reasonably allocate land resources and contribute to the solution for agriculture, rural areas, and farmers. The LUE evaluation index system is constructed in three aspects: economy, society, and ecology. Then the LUE and CC degrees of Yunnan Province from 2010 to 2020 are measured, and the characteristics of LUE and the relationship of CC in each administrative region at each level are analyzed in space. Besides, the overall LUE and CC relationship in Yunnan Province is described. The study concludes that (1) The urbanization process in Yunnan Province is accelerating, unused land is decreasing, and construction land is increasing. (2) During the study period, the LUE of Kunming was much higher than that of other regions. The economic efficiency of the inner circle cities centered on Kunming is higher, while the economic efficiency of the outer circle cities is lower; social efficiency is increasing year by year except for Nujiang and Diqing, showing a higher pattern in the east than in the west; ecological efficiency is not increasing year by year except for Kunming, Qujing, and Lijiang, showing a higher pattern in the east than in the west; comprehensive efficiency is on the rise, with Kunming and Qujing leading the way with the overall pattern of “east > central > west”. The high-value area is relatively stable, and the low-value area has a clear tendency to shift eastward. (3) The coupling level of economic, social, and ecological efficiency of land use in administrative regions of Yunnan Province is low, but the coupling relationship is gradually optimized, showing the “contiguous effect” and realizing the state of extreme disorder to severe disorder in a large area. (4) The overall CC of three subsystems in Yunnan Province shows a fluctuating upward trend; the comprehensive efficiency index has an upward trend except for a slight decrease in 2017–2018; from 2010 to 2019, ecological and social efficiency is better than economic efficiency.

1. Introduction

The land is an integrated economic–social–natural complex system, as reflected in its ability to constrain economic growth as well as provide productive living space for human life and bring an abundance of energy [1,2]. Therefore, in order to meet the needs of production and life, humans have continuously exploited the land and thus changed the land use type [3]. From the perspective of urbanization, it requires us to both improve the efficiency of land use and balance the relationship between systems to promote the healthy development of CC relationships [4,5]. The level of urbanization affects land use [6]. The United Nations reports that 56% of people were concentrated in cities in 2021, and by 2050, these numbers will exceed 68% [7]. The accelerated global urbanization process has brought great challenges to the intensive use of land, resulting in prominent human–land conflicts and reduced LUE [8,9]. Sustainable development cannot be achieved without land management [10]. The CC of LUE affects the urbanization process, and how to maintain the healthy development of land use and enhance LUE among economy, ecology, and society has become the focus of scientific research and governmental strategic decisions [11,12,13]. In 2022, the Yunnan Provincial People’s Government pointed out in the Plan of Yunnan Province as a Pioneer in the Construction of Ecological Civilization (2021–2025) that Yunnan Province should play the role of a pioneer in promoting comprehensive economic and social transformation and improving environmental quality. The promulgation of relevant policy documents has reinforced the importance of the economy, society, and ecology [14]. Currently, the overall level of urbanization in China is gradually increasing [15]. The conflict between urban growth and ecology has intensified with the expansion of construction land and the shrinking of ecological land [16]. The reason for the above situation is that the land use is in a state of imbalance, and we need to take the sustainability and health assessment of the region as the reciprocal for the balanced use of land resources [17]. For land resources to be allocated properly and LUE to be improved, China proposed in 2014 to promote that land be used in an intensive way [18]. In order to realize the growth of LUE, it is pivotal to carry out an evaluation and coordinated analysis of LUE [19].
Since land exists as a resource and will eventually be used by humans, there is bound to be utilization efficiency, which is LUE [20]. Different research perspectives lead to different definitions of LUE. One is described in terms of inputs and outputs (also known as economic effects achieved), while the other is considered in terms of comprehensive indicators [21]. For example, scholars from an economic perspective define it as the ratio of the value added of secondary and tertiary industries to the area of construction land (also called construction land productivity) [22,23]; they also describe it as the economic output per unit area of land [24]. We prefer to use comprehensive indicators to define LUE. Because LUE reflects the relationship between human activities and nature, integrating economic, social, and ecological aspects, it can adequately measure the relationship between the harmonious development of the three [25]. Resource allocation theory is an important support for the study of LUE, which points out the link between the rational allocation of land resources and LUE [26]. Therefore, we evaluate whether LUE can not only realize the efficient use of land resources but also achieve the sustainable development of the region [27]. The evolution of this concept can also be seen in the process of scholarly research on LUE. Initial research on LUE focused on exploring economic efficiency, such as the theory of land rent and land price, which is an important guide for the economic evaluation and rational open use of land resources [28]. Of course, the dominant role of economics and politics on land is also an important reason for neglecting the social and environmental elements of LUE [29]. Although the accelerated urbanization process can bring huge economic efficiency, it also comes with increased social and ecological costs [30]. On this basis, people gradually realized that economic development should be based on good ecology, and thus the economic and ecological efficiency of land use were evaluated [31]. Nowadays, to achieve a harmonious coexistence of population, land, environment, and economy, the evaluation of LUE requires us to consider not only economic efficiency but also ecological and social efficiency [32].
Equilibrium between systems is very important, and coupling relationships emphasize the interaction between systems [33]. The term coupling originates from the physical concept, which refers to the phenomenon that two or more systems or forms of motion affect each other through various interactions [34]. As scholars study the coupling relationship more and more, its connotation has become correspondingly broad, and it has also been applied to various research fields such as geography, agronomy, and economics [35]. Studying the level of coupled and coordinated development between systems by studying coupling relationships alone is not enough; we also have to introduce coupling coordination relationships. CC helps study the nonlinear relationships between systems [36]. In addition, it can describe the structure and dynamic development trend of the system [37,38]. In this study, the three subsystems of economic, social, and ecological efficiency interacting and feeding back are defined as the CC of LUE in mountainous areas of southwest China [39]. Exploring the mutual interaction of the three subsystems can provide a better understanding of how LUE affects the sustainable development of regional lands. Therefore, we conducted a study on the evaluation of LUE and CC and were able to use the results as a basis for achieving a rational allocation of land resources.
China’s southwestern mountainous provinces are particularly ecologically sensitive and often face challenges with sustainable land use. It is important for China to construct a strategic pattern of ecological security based on “two screens and three belts” to achieve sustainable development. Yunnan is located within the ecological barrier of the Sichuan–Tiannan–Huangtu Plateau and the southern hilly mountain belt, which is an important support area for building a strategic ecological security pattern. What is the land use situation in Yunnan Province? What methods are used to measure LUE? What are the temporal changes and spatial distribution of LUE? How will the different systems interact with each other? To investigate these questions, we set four research objectives: (1) To analyze LUE in Yunnan Province; (2) To measure LUE in Yunnan Province; (3) To explore the spatial and temporal evolution characteristics of LUE; (4) To clarify the degree of interaction between LUE systems. To achieve these objectives, this study will use Yunnan Province as the study site and the period of 2010–2020 as the study period. Firstly, we analyze the interaction of land use and urbanization in Yunnan Province based on three phases of land use data in 2010, 2015, and 2020. Secondly, the entropy-weighted TOPSIS (Technique for Order Preference by Similarity to an Ideal Solution) method is applied to measure the time series of LUE to analyze the changes in the time series. Thirdly, the spatial series is visualized in ArcGIS10.8 to analyze the spatial pattern of LUE. Finally, the CC degree model is constructed to analyze the CC of LUE. By evaluating the efficiency achieved by land use in Yunnan Province between 2010 and 2020, it can reveal the level of LUE in the mountainous provinces of southwest China, further enrich and improve the evaluation system of LUE, provide a reference for rational land use in mountainous areas of developing countries in the future, and be of indelible significance to alleviate the problems caused by rapid urbanization in order to achieve the ecological, economic, and social sustainability goals of land use.

2. Literature Review

Since the mid 1990s, international research on land use has been gradually carried out. Since the ICSU (International Council for Science) and ISSC (International Social Science Council) jointly established the Land Use Core Project Planning Committee in 1993, international organizations and countries have responded [40]. USGCRP (U.S. Global Change Research Program) began research focused on land use cover change in North America in 1996; Japan proposed the project “Land Use Research for Global Environmental Protection” to explore sustainable land use in the Asia-Pacific region [41,42]. The achievement of sustainable development goals can be influenced by land use [43]. So, how do we evaluate the rationality of land use to achieve its sustainability [44,45]? Up to this point, many scholars have conducted studies on LUE. In terms of research content, the study of LUE has transitioned from one-way efficiency to comprehensive efficiency. Hu Tinglan et al. [46] and Cui Dengpan et al. [47] evaluate the ecological efficiency of agricultural land and coal cities, respectively, to provide a basis for future ecological efficiency evaluation studies. Hu Yi et al. evaluated the LUE of counties in Jiangsu province and analyzed the characteristics of spatial and temporal divergence. The research scales of LUE have also been continuously updated by scholars. It involves countries, urban clusters, watersheds, etc. For example, Guneralp Burak et al. found that LUE has decreased in India, China, North America, and Europe as a result of accelerated urbanization [48]. Zhang Liguo et al. studied LUE in the Yangtze River Economic Zone and found heterogeneity in the influencing factors [49]. Chu Zhi et al. evaluated the ecological protection red line policy after the implementation of the ecological efficiency of the Tarim River basin after the implementation of the ecological protection red line policy evaluated by Chu Zhi et al. and found that the region has the optimal ecological structure configuration [50]. The research has also been enriched and is no longer limited to the study of LUE measurement but incorporates the analysis of spatial and temporal evolution and the study of CC relationships on the basis of measurement. Tang Yingkai et al. studied the spatial and temporal changes of LUE in the Yangtze River Delta and found that unbalanced factor inputs are an important reason for the high and low distribution of LUE [51]. Wang Pai et al. proposed coupling LUE with rural revitalization and found that the coupling grade of the two was high [52]. Zhang Mingdou et al. analyzed the CC of LUE and urbanization in 34 prefecture-level cities in three northeastern provinces and found that the two belonged to asynchronous development, usually lagging behind or ahead of each other [53]. Liao Jihui et al. coupled economic, social, and ecological efficiency and found that the development of CC is constrained by several factors [54].
The use of correct assessment methods and tools is an essential element of research [55]. Research methods are exceptionally rich for conducting multi-objective decision-making. Lalisa Alemayehu Duguma used an expert scoring method to classify social and ecological efficiency into 10 levels, each replaced by maize seeds of different values, allowing farmers to assess LUE by placing seeds [56]. Subsequently, the AHP (the Analytic Hierarchical Process) method was developed on this basis, which is a subjective assignment evaluation method developed on the basis of the expert scoring method and is used to calculate the indicator weights by judging the importance of the indicators and scoring them by experts [57]. Zhu Xincheng et al. used the hierarchical analysis method for land use. Peng Ying et al. used factor analysis to evaluate the efficiency of cultivated land use in Shandong Province [58]. Subsequently, it was gradually realized that each of them gave different importance to the indicators, and therefore there were differences in the assigned values. Since the indicator pairs are scored by pairs of seeding methods through experts who analyze the importance of indicators two by two and thus obtain the indicator weights of each evaluation system, the results are somewhat subjective. So, scholars tend to use some slightly objective methods, such as Aris Gaaf et al., who used the cost–benefit method to evaluate the economic value of ecological networks and expanded this method to broader economic value of land use [59]. Zhang Pengyan et al. used principal component analysis to evaluate the influence factors of cultivated LUE in Henan Province [60]. However, the above methods also have some disadvantages, such as high requirements for evaluation sample size, and these methods do not reflect the distance between the evaluation object and the idealized target, so we use the entropy-weighted TOPSIS method to measure the land use effectiveness by referring to the research of related scholars. At present, when most scholars evaluate LUE, they usually adopt the method of comprehensive measurement of multiple indicators. The general idea is to construct a multi-level evaluation index system, standardize it to eliminate the influence of different scales on the evaluation results, calculate the weights of the indexes, and then carry out the integrated index, which is the entropy-weighted TOPSIS method [61]. Scholars have used the entropy-weighted TOPSIS method to obtain the weights of each indicator of LUE objectively and to calculate the distance between each indicator and the idealized target, which improves the accuracy of LUE evaluation results [62,63].

3. Materials and Methods
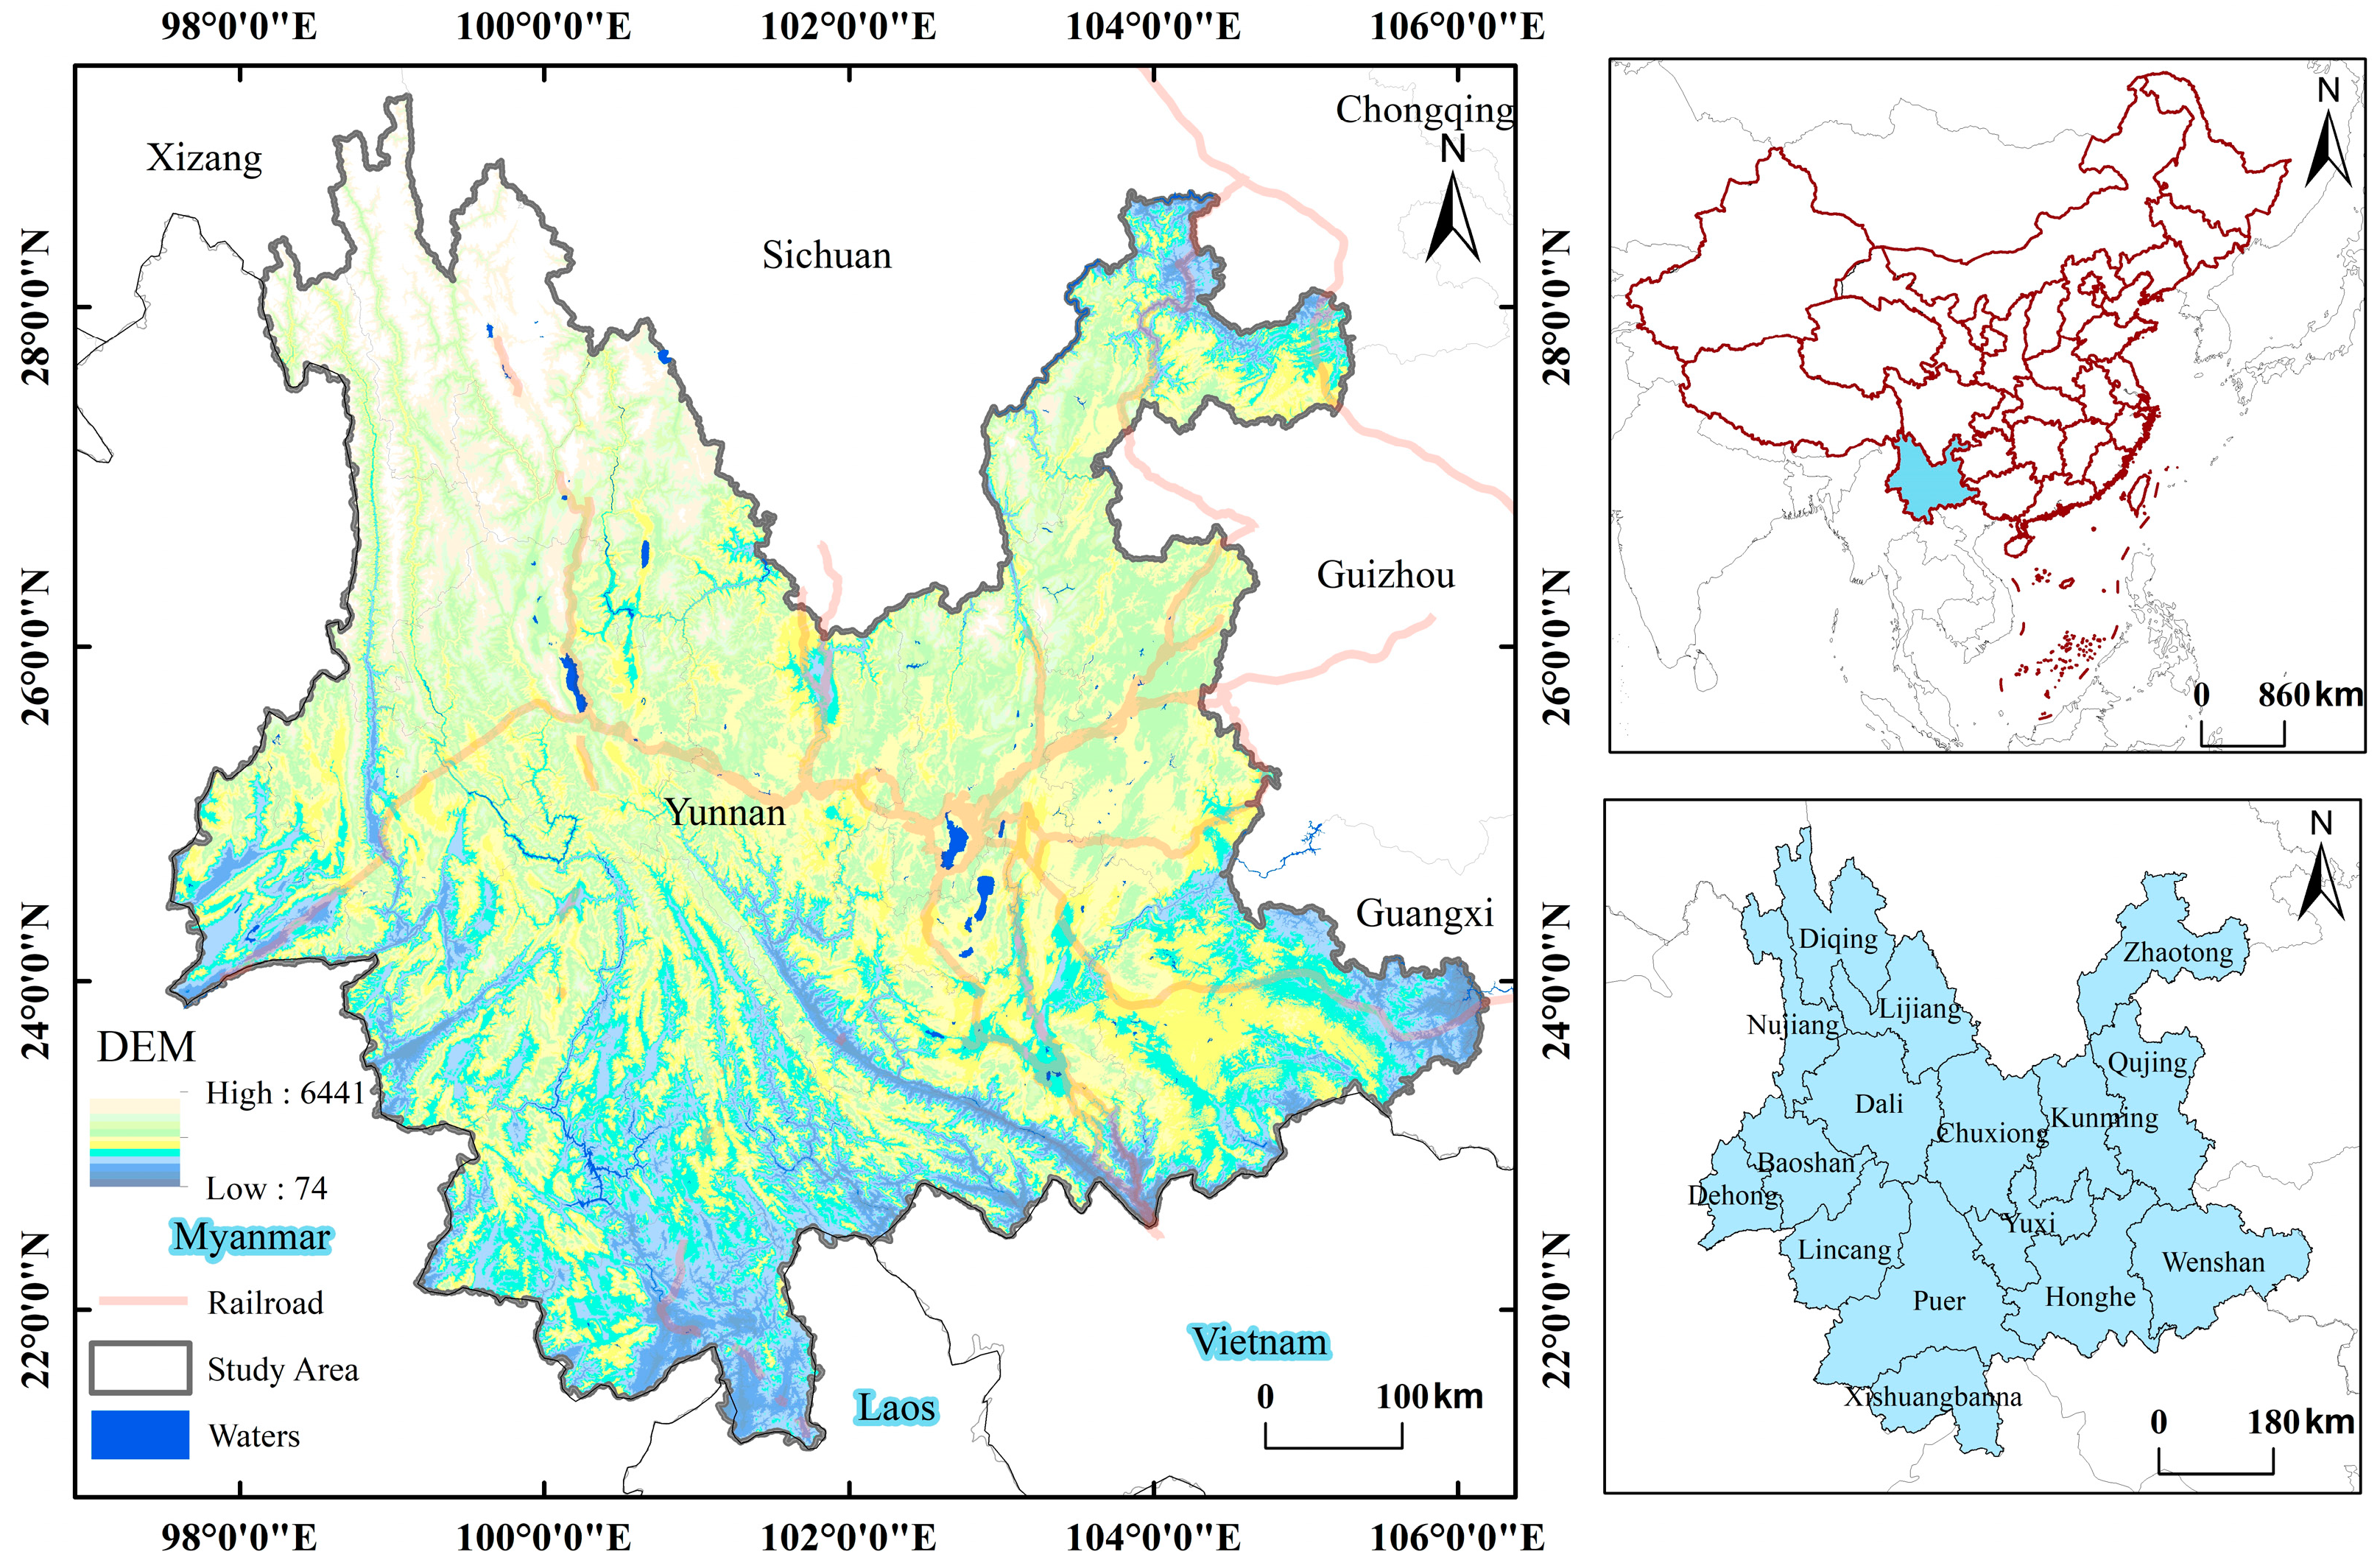
3.1. Study Area

Yunnan Province is located in southwest China; the northwest, north, northeast, and east are adjacent to Tibet, Sichuan, Chongqing, Guizhou, and Guangxi; the west, south, and southeast are bordered by Myanmar, Laos, and Vietnam (Figure 1). It is located between 21°8′ N and 29°15′ N, 97°31′ E and 106°11′ E. Yunnan Province spans six major water systems: the Yangtze, Pearl, Yuan, Lancang, Salween, and Irrawaddy Rivers, with subtropical, tropical monsoon, and highland mountain climates. The province had a resident population of 46.9 million in 2021 and a total GDP of about 2714.676 billion CNY, ranking 18th in the country. The unique climate of Yunnan province has created rich land resources such as high mountains (Yulong Snow Mountain), canyons (Nujiang Grand Canyon), karst landscapes (Puzhehei), modern glaciers (Mingyong Glacier), highland lakes (Dianchi Lake), etc. The obvious difference in altitude in Yunnan Province has led to a large gap in LUE between administrative regions at different levels, obvious differences in the ecological environment, and uneven economic and social development. Therefore, it is pivotal to study the evolution characteristics in time and space of LUE and the relationship of CC in Yunnan Province.

3.2. Data Sources

Considering the scientific quality and accessibility of the data, 2010–2020 was chosen as the time point for the study. The 30 M resolution land use data were obtained from the Resource and Environmental Science Data Center of the Chinese Academy of Sciences (http://www.resdc.cn, accessed on 8 May 2023), in which the land use types were classified into 6 primary categories and 25 secondary land types, where the primary land use types include: cultivated land, woodland, grassland, waters, construction land, and unused land, and the secondary land use types are further subdivided on the basis of the primary land use types, including paddy land, dry land, forest land, shrubland, etc. [64]. The administrative zoning data are obtained from the 1:1,000,000 national basic geographic databases of the National Geographic Information Resources Catalogue Service (https://www.webmap.cn/, accessed on 8 May 2023), which contains nine data sets of water systems, transportation, boundaries, and political areas, etc. and can fully meet the needs of administrative zoning mapping. We select H47, H48, G47, G48, F47, and F48 databases, use the merge function in geoprocessing to merge the administrative interface, fuse the merged elements with “name” as the field, and merge the administrative districts to get the administrative division map of Yunnan Province according to the research requirements. The DEM digital elevation data of Yunnan Province (90 M resolution) was obtained from the geospatial data cloud (http://www.gscloud.cn, accessed on 8 May 2023) by stitching and cropping multiple remote sensing images, which is image data covering more than 80% of the earth’s land surface and enables the simulation of topography through digital representation [65]. We selected images utm_srtm_56_07, utm_srtm_56_08, utm_srtm_57_07, utm_srtm_57_08, utm_srtm_58_07, and utm_srtm_58_08 to apply the mosaic function and mosaic with utm_srtm_58_08 as the target raster. We add the vector map of the administrative divisions of Yunnan Province and use the crop function to crop the raster after the mosaic to get the DEM of Yunnan Province. Statistical Yearbook can reflect the economic and development situation of each region comprehensively and also reflect certain ecological and environmental issues. The data on GDP per capita, gross regional product, area of each administrative region, value added of industrial product, local public finance budget revenue, population density, retail sales of social consumer goods, water consumption, grain sown area, greenery coverage area, green space per capita, the green coverage area of built-up areas, and total afforestation area are mainly from the Yunnan Statistical Yearbook 2010–2020, statistical yearbooks of Yunnan administrative districts, statistical bulletins, government websites, etc. It is worth noting that the economic density of each administrative district is the ratio of gross regional product to the area of the district.

3.3. Index System and Security Level Classification

3.3.1. Indicator System Construction

The top priority in conducting LUE is to develop an evaluation system for LUE. LUE is a system that integrates economic efficiency, social efficiency, and ecological efficiency, and the level of LUE depends on the joint action of these 3 systems. In a bid to gain insight into the interactions of each system, we selected 12 indicators to construct the LUE evaluation index system based on the reality of Yunnan (Table 1). The target layer is the comprehensive LUE, and the criterion layer contains economic efficiency, social efficiency, and ecological efficiency. Meanwhile, each criterion layer contains 4 evaluation indicators.

3.3.2. CC Level Classification

This paper draws on the research findings of Liao Chongbin [66]; a uniform distribution function is used to classify the CC into 10 levels (Table 2).

3.4. Methods

3.4.1. Measurement Method of LUE—Entropy-Weighted TOPSIS Method

The TOPSIS method is an analytical method for conducting multi-objective decision-making [67] and was first proposed by Ching-Lai Hwang and Kwangsun Yoon [68]. The traditional TOPSIS method calculates and ranks the proximity between evaluation objects and idealized objectives to determine the merits of evaluation objects. However, there are some problems with applying this method to comprehensive evaluation [69]. Relying on information entropy can reduce decision errors and improve decision accuracy, and the entropy-weighted method is to determine the weights by the entropy value in each index and reduce the subjective bias brought by human assignment [70]. Therefore, in this study, we choose to improve the TOPSIS method by adding the entropy-weighted method, which calculates the weights of evaluation indicators and introduces the weights into the calculation process of the TOPSIS method, which can eliminate the evaluation errors caused by subjective factors and can improve the accuracy of evaluation results. In addition, the entropy-weighted TOPSIS method has the characteristics of being simple to operate, intuitive, and easy to understand, and there is no restriction on the number of samples [71,72].
  • Entropy-weighted method
Firstly, we construct a system of indicators of LUE in Yunnan Province and mark the nature of each indicator with “+” for the positive indicator and “−” for the negative indicator. The first step of the entropy-weighted method is to distinguish the types of indicators, including positive indicators, negative indicators, and interval indicators. The positive indicator means that the indicator has a positive effect on the evaluation result, and the larger the value, the greater the positive effect on the evaluation result (the larger the value, the better); the negative indicator means that it has a negative effect on the evaluation result, and the larger the value, the greater the inhibitory effect on the evaluation result (the smaller the value, the better); the interval indicator means that an indicator is best only within a determined interval.
Secondly, we construct the matrix and unify the indicator types: there are n evaluation objects and m evaluation indicators composed of the matrix, and all indicators will undergo an index normalization process to obtain the corresponding normalization matrix.
Thirdly, we calculate P i j by Equation (1) to eliminate the effect of the different indicators of the scale, and this step is called the normalization process. After that, the entropy value E j is calculated by Equation (2).
P i j = X i j i = 1 n X i j 2
E j = 1 ln n i = 1 n P i j ln P i j   ( i = 1 , 2 , , n ; j = 1 , 2 , m )
where n stands for the number of evaluation objects. P i j stands for the weight of the ith evaluation object with respect to the jth indicator. X i j stands for the standardized indicator.
Finally, we calculate the weights ω j for each index by Equation (3).
ω j = 1 E j n j = 1 n E j
2.
TOPSIS model
We define the maximum value according to Equation (4).
Z + = ( m a x { Z 11 , Z 21 , · · · Z n 1 } · · · m a x { Z 1 m , Z 2 m , · · · Z n m } )
We define the minimum value according to Equation (5).
Z = ( m i n { Z 11 , Z 21 , · · · Z n 1 } · · · m i n { Z 1 m , Z 2 m , · · · Z n m } )
We calculate the distance between the object of evaluation and the maximum value according to Equation (6).
D i + = j = 1 m ω j ( Z j + Z i j ) 2
We calculate the distance between the object of evaluation and the minimum value by Equation (7).
D i = j = 1 m ω j ( Z j Z i j ) 2
We calculate the proximity S i by Equation (8).
S i = D i D i + + D i ( 0     S i     1 )
where S i represents the index of LUE. The larger the S i , the smaller the D i + , that is, the closer to the maximum value, the better the condition of each indicator; conversely, the worse the condition of the indicator.

3.4.2. Measurement Method of CC—CC Degree Model

  • We define the development level of the LUE guideline layer
We use the LUE index to express the level of development. The F ( x ) denotes the level of development of economic efficiency; the S ( y ) indicates the development level of social efficiency; and E ( z ) denotes the development level of ecological efficiency.
2.
We calculate the coordination index of the standard layers by Equation (9).
T = α F ( x ) + β   S ( y ) + γ E ( z )
3.
There are 3 criterion layers. We take α = β = γ = 1 3 in Equation (10).
T = F ( x ) + S ( y ) + E ( z ) 3
4.
We calculate the coupling degree of the criterion layer by Equation (11).
C = 3 F ( x ) + S ( y ) + E ( z ) 3 F ( x ) + S ( y ) + E ( z )
5.
We calculate the CC of the criterion layer by Equation (12).
D = T × C
where T denotes the coherence index, C denotes the coupling degree, D denotes the CC degree, and D ∈ (0, 1). The closer the value of D is to 1, the better the coupling state of the subsystem; vice versa, the worse the coupling state.

3.4.3. Analysis of Spatial Variation—Spatial Variational Model

  • Spatial variance function
The spatial variance function, also known as the semi-variance function, can effectively reveal the spatial variability characteristics of the study object [73,74]. Therefore, we choose this model to reveal the evolutionary characteristics of the spatial pattern of comprehensive LUE in Yunnan Province, and the function expression is Equation (13).
γ k = 1 2 N ( k ) i = 1 N ( k ) [ Y ( x i ) Y ( x i + k ) ] 2
where Y ( x i ) and Y ( x i + k ) are divided into the LUE of Y ( x ) on spatial units x i and ( x i + k ) , and N ( k ) denotes the sample size with separation distance k .
2.
Kriging interpolation
Kriging interpolation is an optimal linear unbiased spatial modeling and interpolation method for unknown sample points based on semi-variance functions [75]. We use Kriging interpolation to analyze the basic situation of LUE at unknown sample points and to explore their spatial divergence laws at a deeper level with the functional expression of Equation (14).
Y ( x 0 ) = i = 1 n λ i Y ( x i )
where Y ( x 0 ) denotes the unknown points, Y ( x i ) denotes the known sample points, λ i denotes the weight of the i th sample point on the unknown points, and n denotes the number of known points.

4. Results

4.1. Analysis of Land Use in Yunnan Province

To understand the land use changes in Yunnan Province, we analyzed land use data from three periods, which were interpreted from remote sensing maps (Figure 2). In Table 3, the areas of each land use type in Yunnan Province are woodland, grassland, cultivated land, constructed land, waters, and unused land in descending order. The main land use types are cultivated land, woodland, and grassland, and the three account for about 97.75%, among which the area of woodland accounts for the largest proportion. For the time change, the area of cultivated land has been decreasing year by year, and it decreased by 1.58% from 2010 to 2020, which is due to the policy of “returning cultivated land to the woodland” called for in China. From 2010 to 2020, the area of waters gradually increased, which is related to the increase of ice and snow melt water from high mountain glaciers in Yunnan Province due to climate warming. With accelerated urbanization, the unused land decreases year by year and the constructed land increases year by year; it increases by 1643.38 km2 in 10 years; the area ratio increases from 0.81% (2010) to 1.24% (2020). The area of constructed land in 2020 is 1.53 times that of it in 2010, which is the inevitable trend of urbanization development.

4.2. Analysis of the Spatial and Temporal Evolution of LUE in Administrative Regions of Yunnan Province

The LUE index was calculated by Equations (1)–(8), and 2010, 2015, and 2020 were selected as the research time nodes with a view to analyzing the evolution in time and space of LUE. To facilitate the analysis of the temporal changes of LUE in Yunnan Province, line charts were made. With the aim of demonstrating the spatial variation of LUE in Yunnan Province, the calculated values were imported into ArcGIS10.8 software for visualization, and the natural breakpoint method was used to divide the LUE into 5 categories, which are low-value area (LA), sub-low-value area (SLA), medium value area (MA), sub-high-value area (SHA), and high-value area (HA), to obtain the pattern distribution in time and space of LUE in Yunnan Province (Figure 3, Figure 4, Figure 5 and Figure 6).

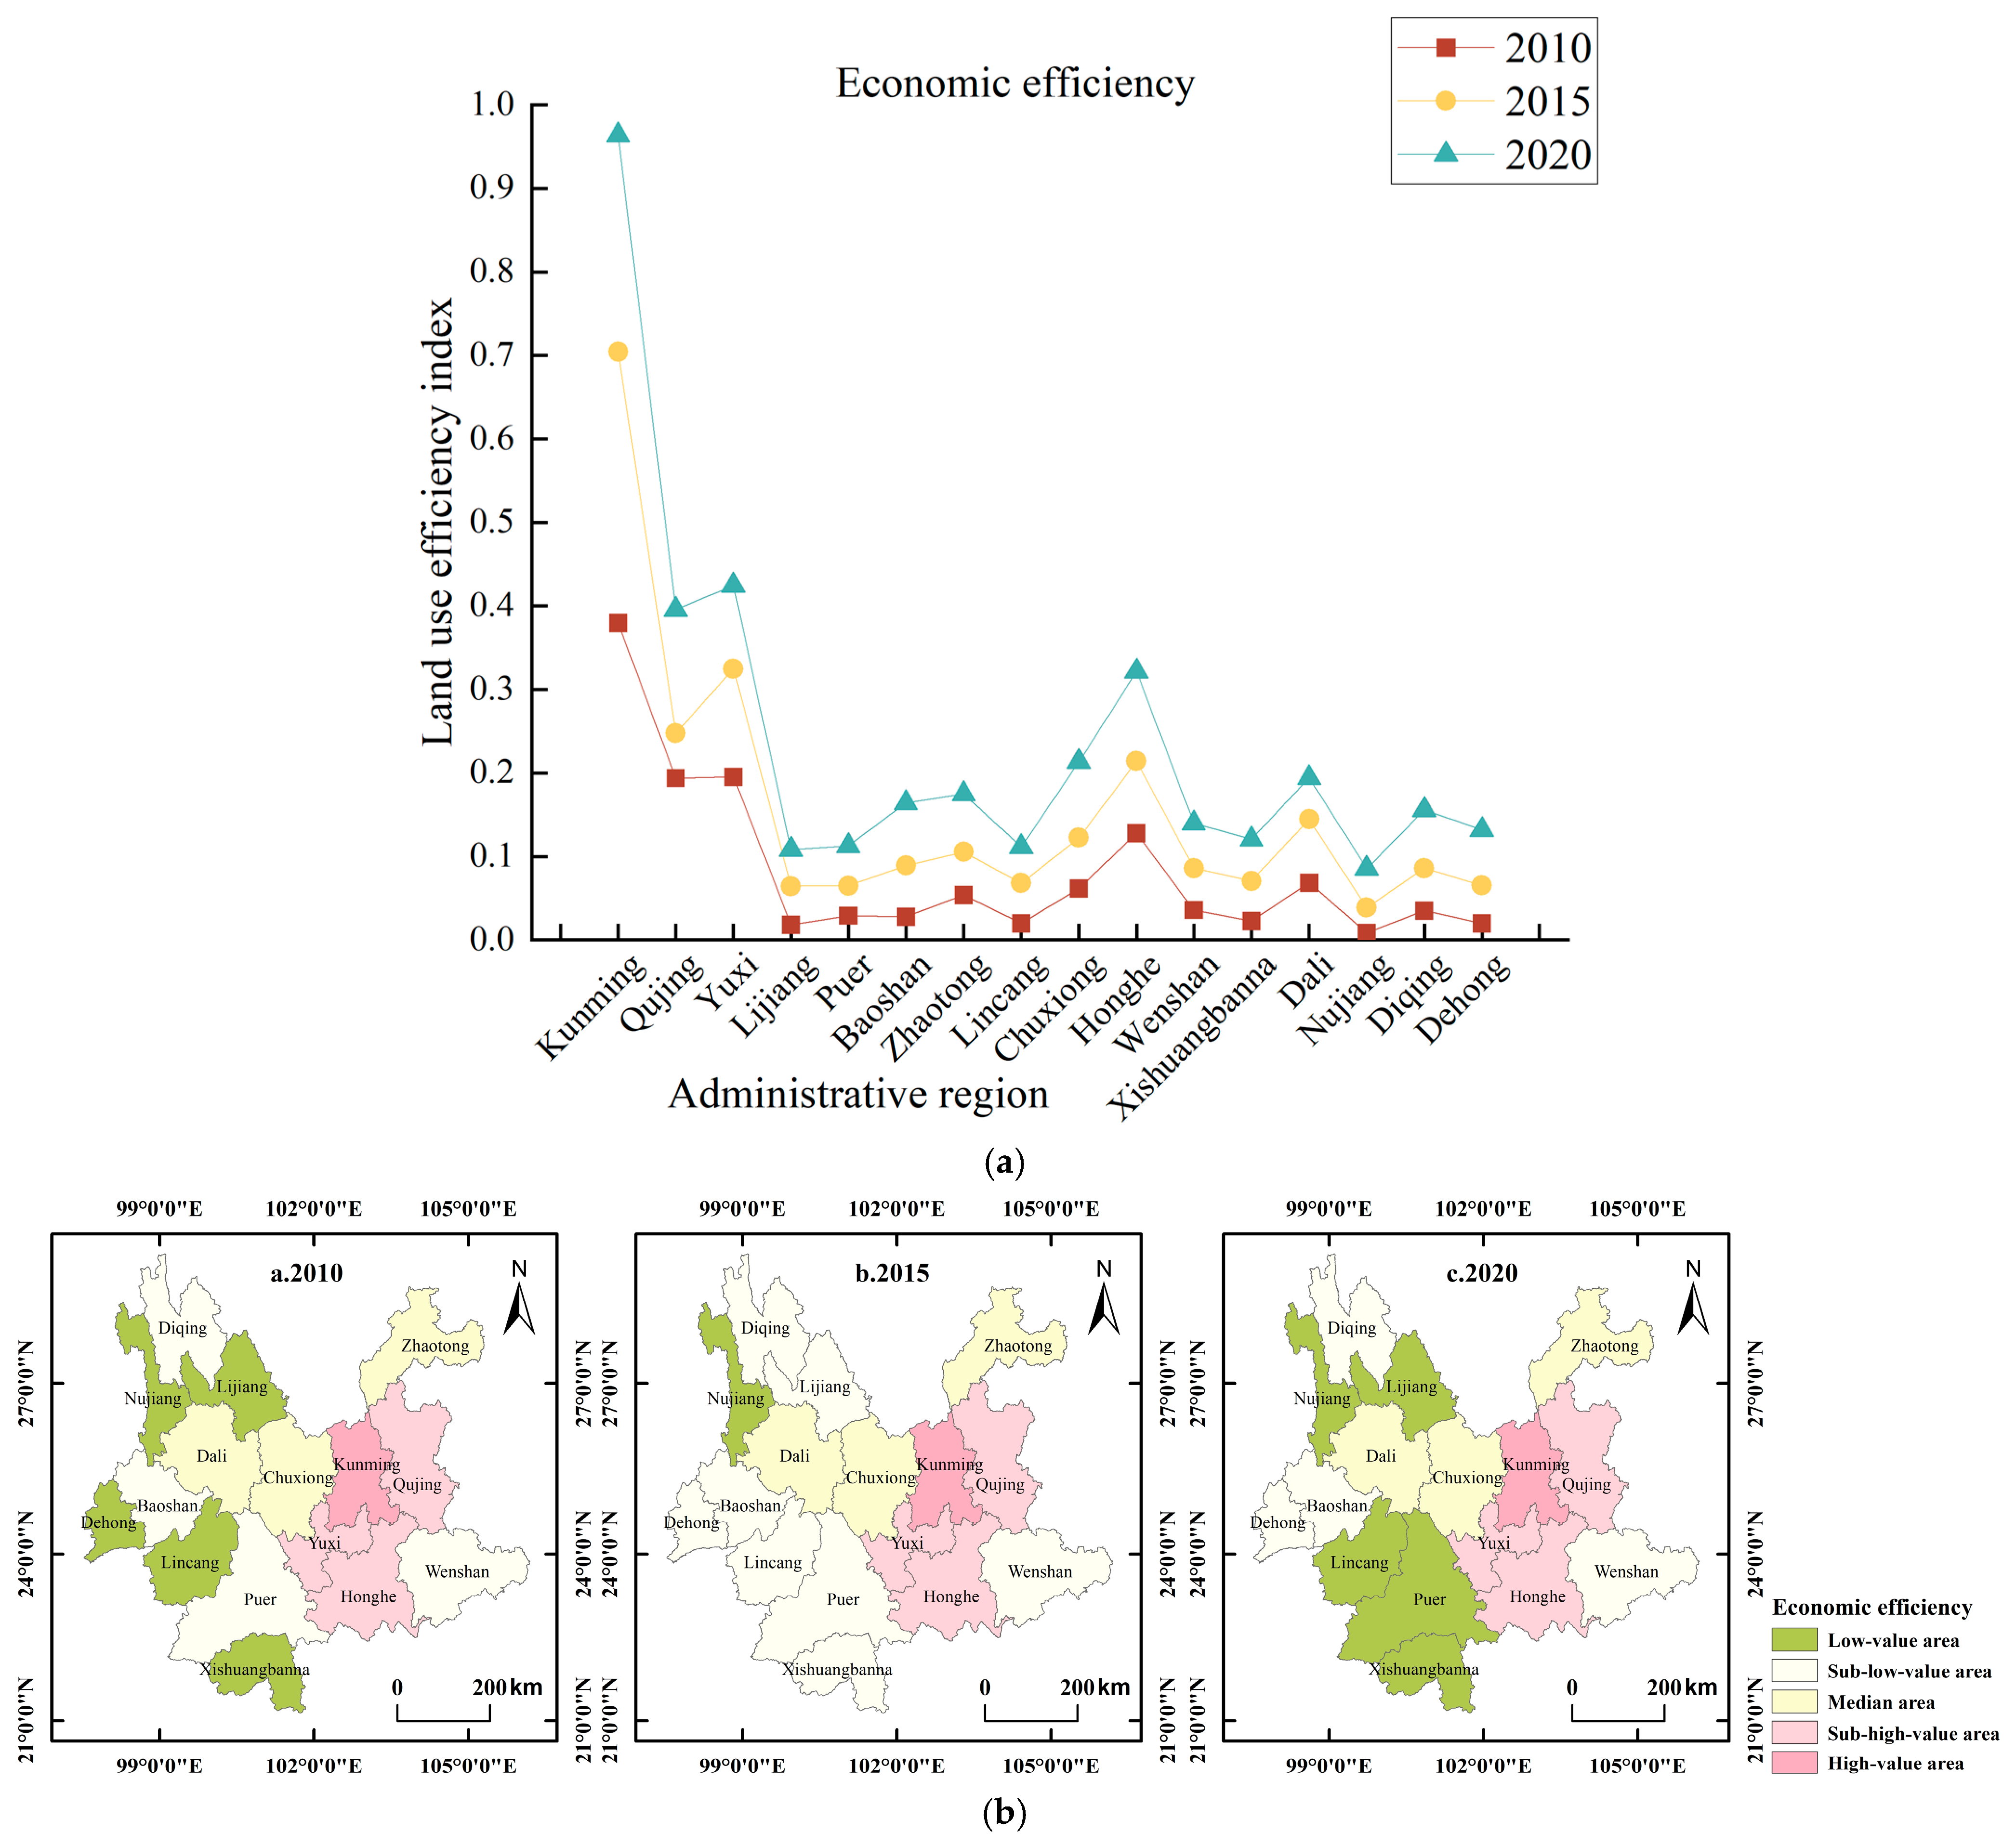
4.2.1. Spatial and Temporal Evolution of Economic Efficiency

Figure 3 shows the spatial and temporal patterns of economic efficiency in Yunnan Province. Figure 3a shows that the economic efficiency index of administrative regions in Yunnan Province increases year by year, and the top ones are Kunming, Yuxi, and Qujing in order, and the economic efficiency of Kunming is obviously better than other administrative regions and increases most obviously. As can be seen from Figure 3b, from 2010 to 2015, all the LAs of ecological efficiency in the southwestern prefecture of Yunnan Province were transformed into the SLA, and Lijiang was also transformed from the LA to the SLA; from 2015 to 2020, Lijiang, Lincang, Pu’er, and Xishuangbanna were transformed from the SLA to the LA. The economic efficiency of each administrative region in Yunnan Province from 2010 to 2020 shows a trend of higher economic efficiency in the inner circle cities centered on Kunming and lower economic efficiency in the outer circle cities. The HA (Kunming), SHA (Yuxi, Qujing, and Honghe), and MA (Dali, Chuxiong, and Zhaotong) are unchanged; the number of SLAs increases and then decreases; the number of LAs decreases and then increases; and the value areas in which Diqing, Baoshan, Wenshan (SLA), and Nujiang (LA) are located remain largely unchanged.

4.2.2. Spatial and Temporal Evolution of Social Efficiency

Figure 4 shows the spatial and temporal patterns of social efficiency in Yunnan Province. Figure 4a shows that the social efficiency index in Yunnan Province from 2010 to 2020 shows an upward trend except for Nujiang and Diqing, where the change is not obvious. The periods of 2010–2015 and 2015–2020 both had the most obvious rise in economic efficiency for Kunming. From Figure 4b, it can be seen that all the administrative regions in Yunnan Province changed from 2010 to 2015 except Wenshan (SHA), which dropped by one interval; from 2015 to 2020, the administrative regions in Yunnan Province remained unchanged. For 2010–2020, the social efficiency in Yunnan Province showed that the east was higher than the west, and the interval change was less obvious. The year 2010 had a higher number of SHA, accounting for 16% of the total. In 2010, the number of SHAs was higher, accounting for 16% of the total, mainly concentrated in the eastern part of Yunnan Province. The middle-value area was gathered in the central and west of Yunnan Province. The SLA distribution was scattered. The LA was concentrated in the northwestern part of Yunnan Province. In 2015 and 2020, the value area of each administrative region did not change, except for the decrease in the number of SHAs, the rest is the same as 2010.

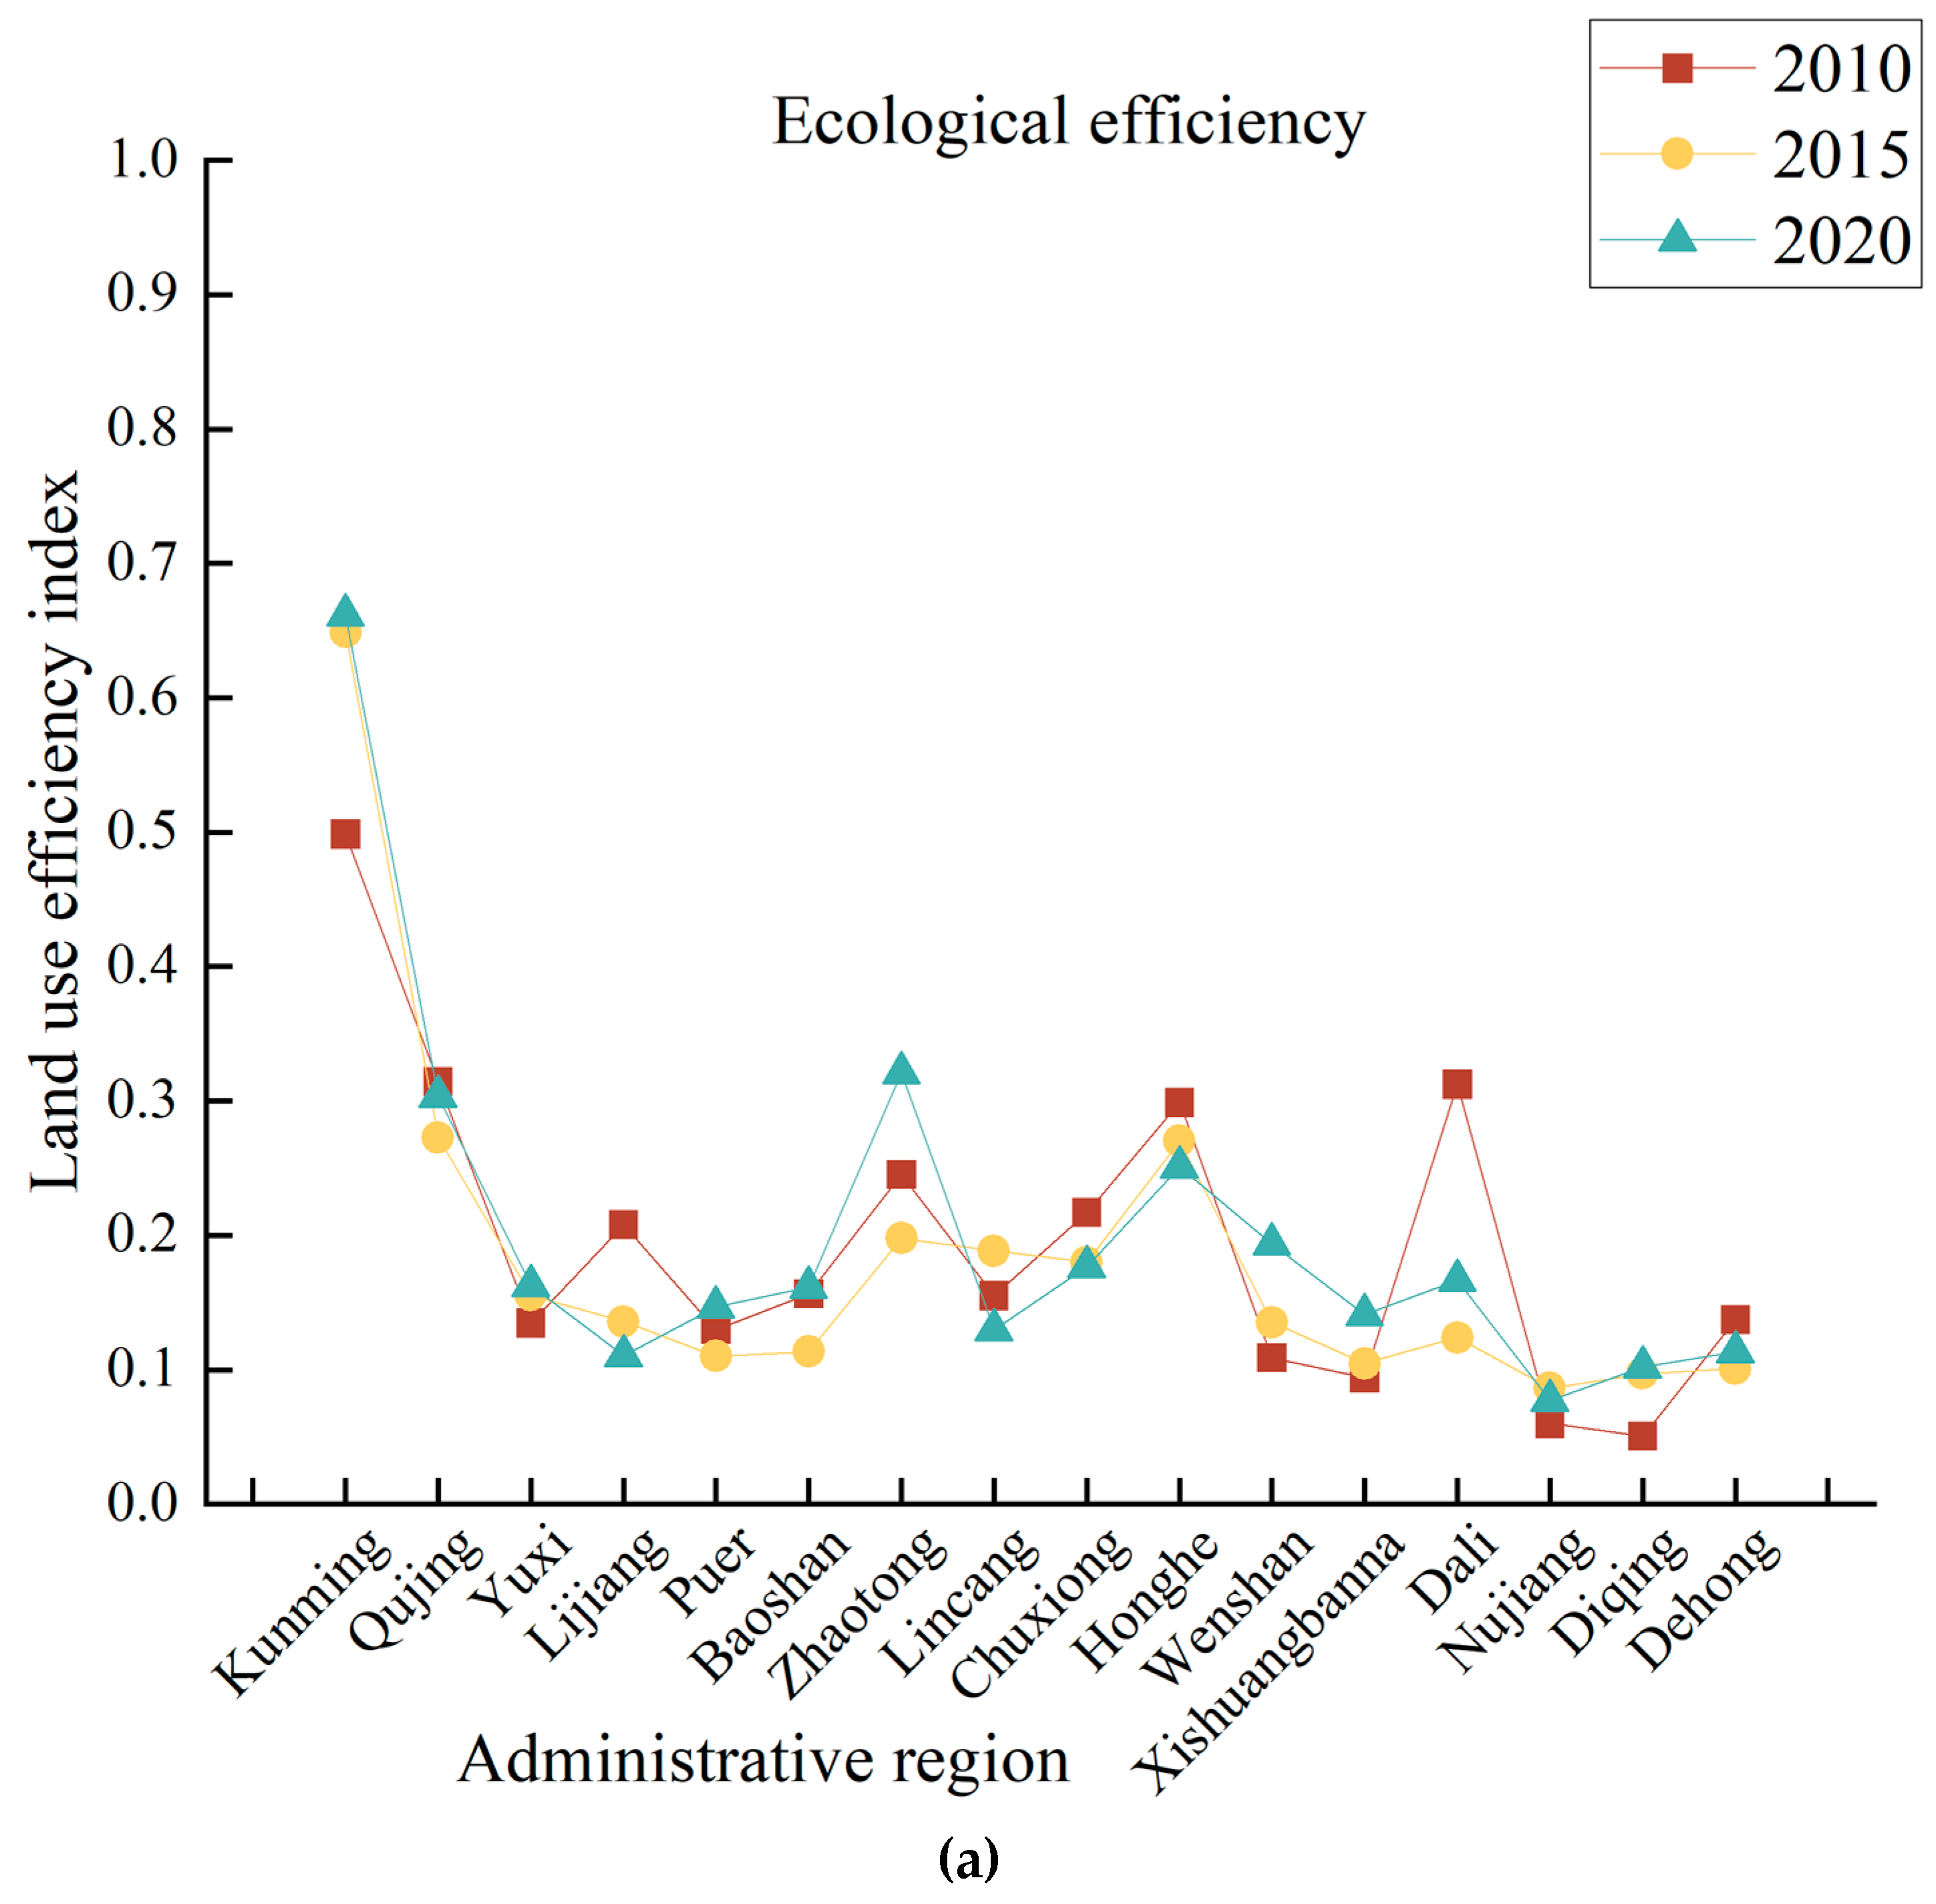
4.2.3. Spatial and Temporal Evolution of Ecological Efficiency

Figure 5 shows the spatial and temporal patterns of ecological efficiency in Yunnan Province. As can be seen from Figure 5a, except for Kunming, Yuxi, Wenshan, Xishuangbanna, and Diqing, the ecological efficiency of all the administrative regions did not increase over time, with the most significant increase in ecological efficiency in Kunming from 2010 to 2015 and the most significant increase in ecological efficiency in Zhaotong from 2015 to 2020. As can be seen from Figure 5b, Dali showed changes from the SHA to the SLA during 2010–2015. From 2015 to 2020, Dali, Baoshan, Pu’er, Xishuangbanna, Zhaotong, and Wenshan all rose by one value area, Lijiang and Lincang fell by one value area, and the rest of the administrative regions saw changes. From 2010 to 2020, the east of Yunnan Province had higher ecological efficiency than the west. In 2010, only Kunming was in the HA, the LA was concentrated in the northwest, and the distribution of the remaining value areas did not show obvious patterns; in 2015, the HA remained unchanged, the number of SHAs decreased, and the number of LAs increased; in 2020, the distribution of each value area gradually gathered, and the SHA and the middle-value area were both of the belt type. The HA did not change, the number of SHAs and MAs increased, the number of LAs and SLAs decreased, and the overall development trend was good.

4.3. Analysis of Spatial and Temporal Evolution and Spatial Differentiation of Comprehensive Efficiency

4.3.1. Analysis of the Spatial and Temporal Evolution of Comprehensive Efficiency

Figure 6 shows the spatial and temporal patterns of comprehensive efficiency in Yunnan Province. Figure 6a shows that the comprehensive efficiency of all administrative regions in Yunnan Province from 2010 to 2020, except Lijiang, is on the rise, with Kunming and Qujing leading the way and Pu’er and Nujiang having less significant changes in comprehensive LUE. As can be seen from Figure 6b, from 2010 to 2015, Dali transformed from SHA to MA; Lijiang is transformed from the MA to the SLA; Qujing is transformed from the LA to the SLA; the comprehensive efficiency range of the rest of the administrative regions remained unchanged; from 2015 to 2020, Lincang and Pu’er were transformed from MA to the SLA, and the comprehensive LUE range of the rest of administrative regions remained unchanged. In 2010, the percentages of HAs, SHAs, MAs, SLAs, and LAs were 6.25%, 31.25%, 37.5%, 12.5%, and 12.5%, respectively. In 2015, the number of SHAs and LAs decreased, the number of SLAs increased, and the number of remaining value areas remained unchanged. In 2020, compared with 2015, except for the LAs and HAs, the value areas of the rest of the administrative areas changed, with the number of SLAs increasing and the number of MAs and SHAs decreasing.

4.3.2. Spatial Differentiation Analysis of Comprehensive Efficiency

The spatial variation function can be useful for identifying the spatial structure of comprehensive efficiency. By analyzing its variation pattern, it can reflect the spatial evolution pattern of comprehensive efficiency in Yunnan Province in more detail. In ArcGIS10.8, the comprehensive efficiency of Yunnan Province from 2010 to 2020 is assigned to the center point of each administrative region, and the semi-variance model with the best fit is selected for kriging interpolation to analyze the variation pattern and distribution pattern of comprehensive efficiency in Yunnan Province. Figure 7 shows the interpolation results.
The results of Kriging interpolation show that the comprehensive efficiency of land use in Yunnan Province has certain extension and regularity in space. The spatial divergence is significant. The overall pattern of “east > central > west” is stable in the high-value area, while the low-value area has an obvious eastward shift (the high-value area and low-value area described here are different from those mentioned in the analysis of spatiotemporal patterns of LUE above). In 2010, the eastern region formed a clear “peak-like” structure with Kunming as the core, while the contour lines in the west were sparse, indicating that the comprehensive efficiency in the east was higher, while the comprehensive efficiency in the west was lower but developed in a balanced way. The contour lines become dense, indicating that the high-value area is clustered. In 2020, the contour lines of the high-value area with Kunming as the core slightly spread outward, and the core area of the western “low valley” showed a tendency to spread outward, indicating the difference in regional comprehensive efficiency.

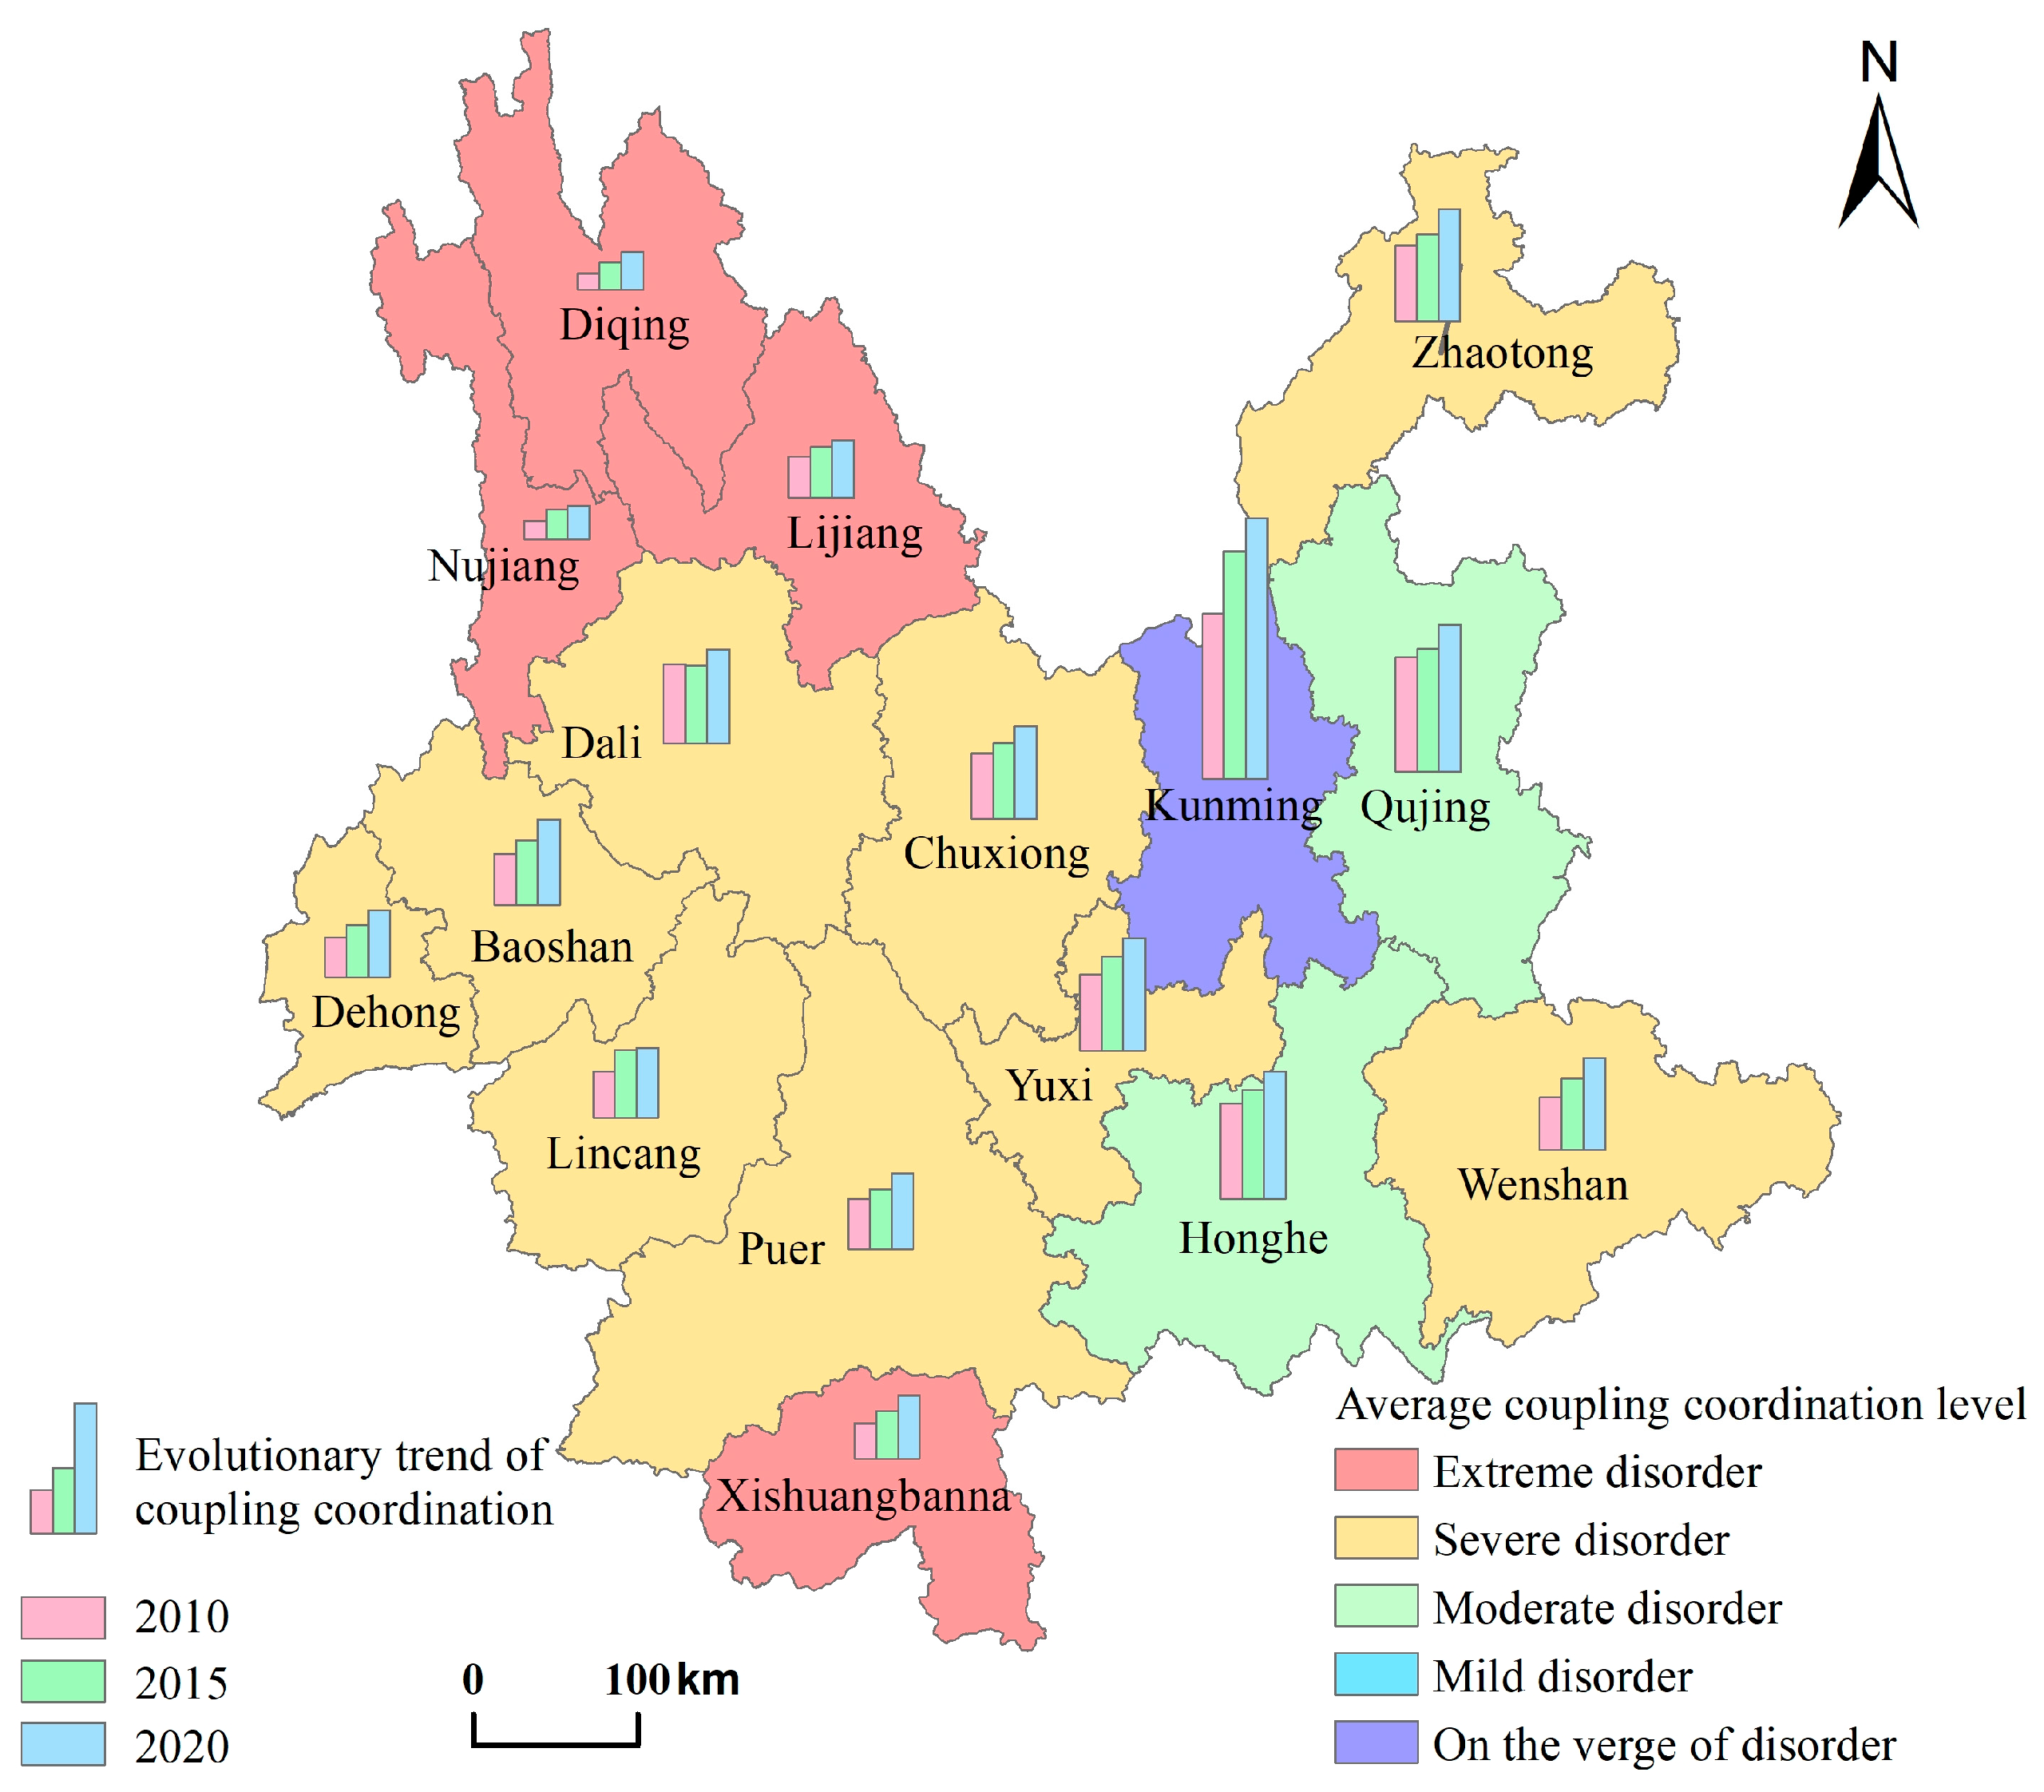
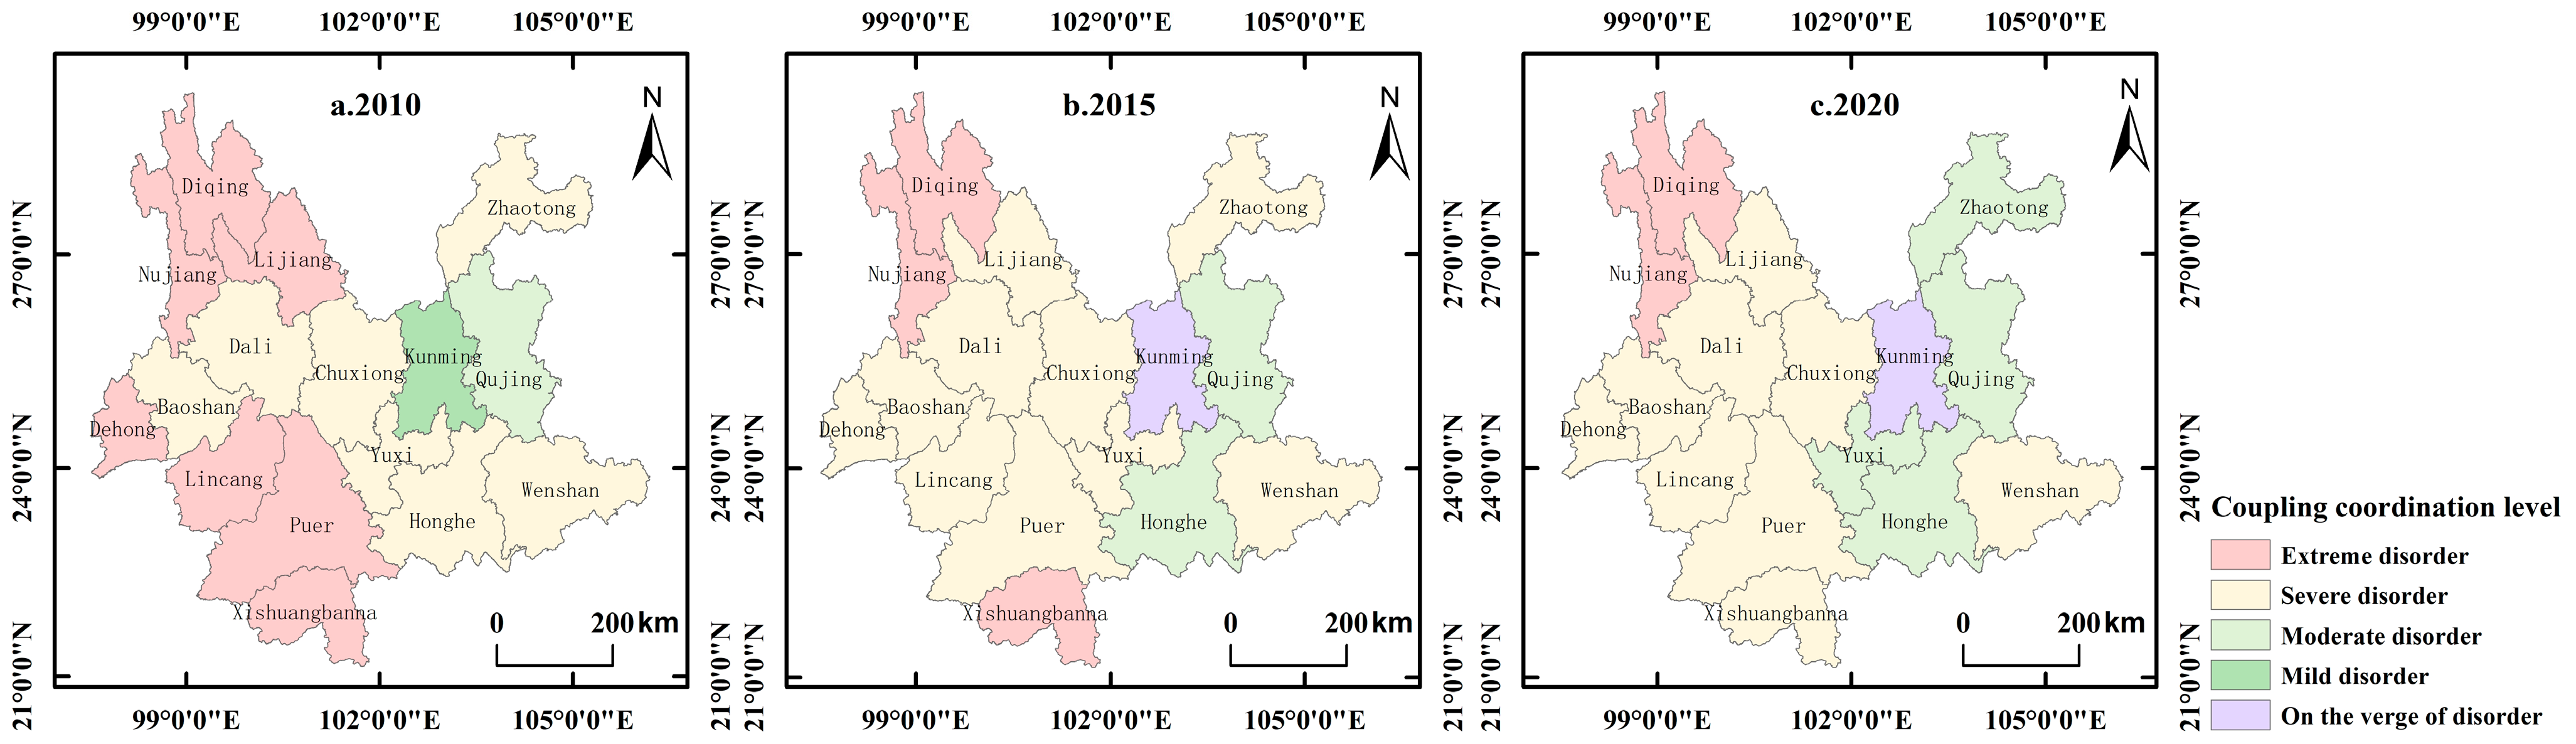
4.4. Analysis of the Spatial and Temporal Evolution of the CC Relationship of Administrative Regions in Yunnan Province

The CC of three subsystems of LUE in the administrative regions of Yunnan Province from 2010 to 2020 is calculated by Equations (9)–(12). The interannual variation and average value of the CC of administrative regions in Yunnan Province in 2010, 2015, and 2020 are obtained according to the criteria of CC level classification (Table 4), which is spatially visualized with the help of ArcGIS10.8 software. We made a map of the changing trend of the CC degree of Yunnan administrative regions (Figure 8) and a map of the spatial pattern distribution of the CC relationship of LUE in Yunnan administrative regions (Figure 9).
From Figure 8, the average CC level of Yunnan administrative regions includes extreme disorder, severe disorder, moderate disorder, and on the verge of disorder, with Kunming on the verge of disorder, Qujing and Honghe being moderate disorder, Diqing, Nujiang, Lijiang, and Xishuangbanna being extreme disorder, and the rest being severe disorder. This shows that the coupling level of economic, social, and ecological efficiency in Yunnan administrative regions is generally not high. From 2010 to 2020, the CC degree of each administrative region was on the rise, and the CC relationship improved, with the most obvious improvement in Kunming.
From Figure 9, the coupling relationship of each subsystem of LUE in Yunnan administrative regions is gradually optimized, and the CC relationship shows a “contiguous effect”, realizing a state from a large area of extreme disorder to a state of a severe disorder. The coupling level of LUE of administrative regions in Yunnan Province has obvious spatial variability, which shows that the CC of administrative regions around the provincial capital city is higher than the rest. From 2010 to 2015, the CC degree transforms from a state dominated by large areas of extreme disorders to a state dominated by severe disorders, and Kunming rises from mild disorders to on the verge of disorder. From 2015 to 2020, the number of administrative regions with mild disorders increased, and Zhaotong and Yuxi rise by one coupling interval in 2020 compared with 2015; the CC relationship in southern Yunnan Province improves significantly, and the extremely disordered administrative regions (Xishuangbanna) rose to moderate disorder. Comparing 2010 and 2020, we find that Kunming is the city with the strongest comprehensive development advantage in Yunnan Province, so the CC is relatively high; Qujing is the second economy and the second largest city in Yunnan Province, with a high level of urbanization, and has been on the list of “China’s top ten livable cities” for many years, and has a good ecological environment, so the CC is second to Kunming, and the stability is high. The CC degree of Baoshan, Dali, Chuxiong, and Wenshan basically stays within a fixed range (moderate disorder), indicating that the CC relationship of economic–social–ecological efficiency in the two regions is relatively stable but at a lower level, which is caused by the fluctuation of the intensity of ecological environmental protection weakening in the two regions but the increase of economic growth momentum. The CC degree of Dehong, Lincang, Pu’er, Xishuangbanna and Lijiang has increased from extreme disorder to severe disorder; the CC interval of Yuxi, Zhaotong and Honghe has increased from severe disorder to moderate disorder, and the CC degree of Kunming has increased from mild disorder to on the verge of disorder, and the CC degree of each has increased to more excellent coupling ranges, which cannot be separated from Yunnan Province’s efforts to “three positionings” objectives.

4.5. Analysis of the Evolution of the Overall LUE and CC Time Series in Yunnan Province

The overall CC relationship and subsystem LUE in Yunnan Province are shown in Table 5. In order to clearly see the LUE and CC time series changes in Yunnan Province according to Table 5, Figure 10 was made. Comprehensive efficiency during the study period showed a fluctuating upward trend, and it is influenced by economic efficiency, social efficiency, and ecological efficiency, of which, in 2010–2013, economic efficiency on comprehensive efficiency was the most significant, and comprehensive efficiency in this time period showed the most obvious rise; for the 2017–2018 period, comprehensive efficiency was most significantly influenced by ecological efficiency, both of which show a decreasing trend. The CC degree of the “economic–social–ecological” subsystem of overall LUE in Yunnan Province is on the rise, and the CC degree is higher than the coupling degree, indicating that the degree of coordinated development has deepened but the interaction is not strong. Ecological and social efficiency are ahead of economic efficiency until 2020, indicating that ecological and social efficiency contribute more to the coordinated development of coupled economic–social–ecological LUE in Yunnan Province than economic efficiency in this time period. The economic efficiency shows a rising trend, the social efficiency shows a rising trend after falling, then rising again, and finally a falling trend, and the ecological efficiency shows three “rising-declining” trends. It is noteworthy that economic, ecological, and social efficiency all increased significantly in 2018–2019, and the CC degree also increased significantly during this period as a result.

5. Discussion

From the perspective of urbanization, this research measures the LUE of 16 administrative regions in Yunnan Province from 2010 to 2020 and analyzes their spatiotemporal evolution characteristics based on the analysis of land use types and around three dimensions of economy, society, and ecology using the entropy-weighted TOPSIS method. By constructing a CC degree model, the CC relationship of time-space and the overall temporal evolution characteristics of each administrative region in Yunnan Province were analyzed. The following conclusions are drawn:
(1) The main land use types in Yunnan Province are cultivated land, woodland, and grassland, with the three accounting for about 97.75%. With accelerated urbanization, the unused land decreases year by year and the building land increases year by year, and the area of constructed land in 2020 was 1.53 times that of 2010, which is the inevitable trend of the implementation of the “Implementation Opinions on Deepening the New Type of Urbanization Construction” of the Yunnan Provincial Government.
(2) During the study period, Kunming was far ahead in terms of economic, social, ecological, and comprehensive efficiency, with a large gap with other administrative regions. This is due to the fact that Kunming is a comprehensive hub integrating science and technology, talents, and transportation, as well as a central city facing the whole country and based in South and Southeast Asia. The central role of Kunming and its central leading role in the surrounding cities are highlighted in the Notice of Yunnan Province on “the Development Plan of Central Yunnan City Cluster”. The spatial pattern shows that the economic efficiency in Yunnan’s administrative regions is increasing year by year, and the spatial pattern shows that the economic efficiency was higher in the cities around Kunming and lower in the peripheral cities; except for Nujiang and Diqing, the changes in the social efficiency index are not obvious, but the rest are on the rise, showing the spatial pattern that the east is higher than the west; the ecological efficiency, except for Kunming, Yuxi, Wenshan, Xishuangbanna, and Diqing, has not increased in time. Except for Kunming, Yuxi, Wenshan, Xishuangbanna, and Diqing, the rest of the administrative regions show a spatial pattern of higher efficiency in the east than in the west; the overall efficiency shows an upward trend, with Kunming and Qujing taking the lead, and the overall pattern of “east > central > west”, with the HA being more stable and the LA showing an obvious eastward shift.
(3) The average CC level of administrative regions in Yunnan Province is extreme disorder, severe disorder, moderate disorder, and on the verge of disorder, and the coupling level of economic, social, and ecological efficiency is low, but the coupling relationship of each subsystem is gradually optimized, and the CC relationship shows a “contiguous effect”, and the CC relationship has changed from a large area of extreme disorder to a state of severe disorder. This is the result of the rapid industrialization-driven economic development in the early years of New China, which resulted in predatory land exploitation and waste of resources, leading to a weakening of economic, social, and ecological interactions. However, the Chinese people will work hard for it in the coming decades, placing the construction of ecological civilization at a strategic level and easing the relationship between the three.
(4) From 2010 to 2020, the CC development of three subsystems of economic–social–ecological efficiency in Yunnan Province as a whole shows a fluctuating upward trend, in which the comprehensive efficiency is higher than the coupling degree and CC degree. The comprehensive efficiency index has an upward trend except for a slight decrease in 2017–2018, and the CC degree shows a trend of first increasing, after slightly decreasing, and then increasing. From 2010 to 2019, ecological and social efficiency are better than economic efficiency. The work report of Yunnan Province pointed out that “underdevelopment” is still the basic situation of Yunnan Province, and the unbalanced and insufficient development is still a problem to be solved. However, Yunnan is also a leader in ecological civilization, with a good ecological environment and several livable cities. This is consistent with our conclusion that the three subsystems are unevenly developed and that ecological and social efficiency is better than economic efficiency.
The above findings have similarities and differences with the findings of other scholars. From the similarities, Kunming is the central city in Yunnan Province and has better economic efficiency than other regions, higher economic efficiency in the inner circle cities centered on Kunming, and lower economic efficiency in the outer circle cities. Li Daichao et al. found that the economic efficiency in the central area was higher than that in other areas and radiated to the surrounding areas, which is basically consistent with our conclusion [19]. Zheng Lan et al. found that the coupling of central city subsystems was better [76], which is similar to our findings.
The difference lies in the fact that the natural and social conditions in each study area are different, and therefore the conclusions drawn may differ to some extent. The results of Li Daichao et al. indicate that ecological efficiency is less influenced by land use structure than economic efficiency and is increasing [19]. However, it is clear from Figure 10 that the ecological efficiency in our study area fluctuates more than the economic efficiency and is not always on the rise, while the economic efficiency is on the rise. By comparing the research process, we found that Li Daichao et al. used the value of ecosystem services to calculate ecological efficiency, while we used the statistical yearbook data, which contains some important indicators, such as the green cover area. The chosen coupling system differs, and the results of the study will also differ. For example, Ji Xuanming et al. found a strong interaction between economic, social, and ecological efficiency [11], but our findings suggest that, for the moment, the interaction between economic, social, and ecological efficiency is not particularly strong.

6. Conclusions

Compared with other research results, Yunnan Province can have much to learn from in terms of LUE improvement and promotion of coupling economic, social, and ecological efficiency.
Based on the previous analysis, we put forward the following policy recommendations: First, to address the problem of the low CC grade of economic, social, and ecological efficiency of land use in Yunnan Province as a whole, we emphasize that new urbanization can solve the problem of low LUE brought about by traditional urbanization, promote industrial transformation and upgrading, optimize the spatial structure, and balance the orderly development of regions with high and low CC. Second, targeted development policies can be adopted for different administrative regions. Kunming LUE is always in the lead state and can use its location, transportation, and economic advantages to drive the development of surrounding cities. Places such as Nujiang and Diqing, where social efficiency did not improve significantly during the study period, can improve social efficiency by optimizing regional infrastructure construction and improving internal conditions in the region. Thirdly, for the administrative regions with low ecological efficiency and insignificant improvement, problems such as the reduction of green areas caused by blind urban expansion can be avoided, and the green area per capita can be increased to protect the local ecological environment. Afforestation is also an important initiative to improve ecological efficiency. Finally, due to the natural conditions of Yunnan Province, the overall ecological and social efficiency of Yunnan Province is better than the economic efficiency in most years. Ecotourism can be developed on the basis of rational planning of land use structure to promote the simultaneous development of environment and economy and improve the economic efficiency.
“Agriculture, rural areas, and farmers” are social problems that need to be solved in China, and urbanization is an important way to solve the “three rural issues” [77]. The accelerated urbanization in Yunnan Province and the influx of large numbers of people into the cities have led to cities having to develop land resources to accommodate the pace of development. To relieve urban pressure, urbanization in Yunnan Province is currently promoted mainly in county cities as an important carrier [78]. Therefore, the LUE should be refined for county cities in future studies. There are intertwined economic, social, and ecological relationships among regions [79]. There are various factors affecting the evaluation of LUE, so the selection of evaluation indicators should take into account both the actual situation of the study area and balance the economic, social, and ecological relationships. The tobacco industry is a pivotal support for economic and social development and a source of fiscal revenue in Yunnan Province [80]. It should have been selected as an evaluation indicator for the study of LUE in Yunnan Province, but data on the area under tobacco cultivation in each administrative region are difficult to obtain, so we did not include this indicator. In addition, the climate is essential for increasing land productivity [81]. Therefore, the inclusion of climate factors and vegetation mapping data should be considered in future studies to enrich the evaluation index system. Yunnan is located on the southwest border of China, and it is adjacent to Southeast Asian countries. Some areas and Southeast Asian countries have similar tourism resources, so it can improve economic and social efficiency. Likewise, Yunnan Province has a rich and diverse climate type, so the species of flora and fauna are also exceptionally rich, and grasping the environmental advantages can also improve ecological efficiency. The eastern part of Yunnan Province is adjacent to Sichuan and other provinces, and we conclude that the eastern LUE is higher than those of the regions adjacent to Southeast Asia, which is in line with reality.

Author Contributions

Conceptualization, writing—review and editing, funding acquisition, F.L.; methodology, software, validation, formal analysis, resources, data curation, writing—original draft, S.W. All authors have read and agreed to the published version of the manuscript.

Funding

This research was funded by Yunnan Education Department of Scientific Research Fund Project (2021J0592), Yunnan University of Finance and Economics Talent Project (2022D13), and Yunnan University of Finance and Economics Graduate Innovation Fund Project (2022YUFEYC101).

Institutional Review Board Statement

Not applicable.

Data Availability Statement

Not applicable.

Conflicts of Interest

The authors declare no conflict of interest.

References

  1. Ding, C.; Lichtenberg, E. Land and Urban Economic Growth in China. J. Reg. Sci. 2011, 51, 299–317. [Google Scholar] [CrossRef]
  2. Hoekstra, A.Y.; Wiedmann, T.O. Humanity’s Unsustainable Environmental Footprint. Science 2014, 344, 1114–1117. [Google Scholar] [CrossRef] [PubMed]
  3. Li, X.W.; Fang, C.L.; Huang, J.C.; Mao, H.Y. The Urban land Use Transformations and Associated Effects on Eco-environment in Northwest China Arid Region: A Case Study in Hexi Region Gansu Province. Quat. Sci. 2003, 3, 280–290+348–349. [Google Scholar]
  4. Yuan, J.F.; Bian, Z.F.; Yan, Q.W.; Pan, Y.Q. Spatio-Temporal Distributions of the Land Use Efficiency Coupling Coordination Degree in Mining Cities of Western China. Sustainability 2019, 11, 5288. [Google Scholar] [CrossRef] [Green Version]
  5. Zhao, Z.; Bai, Y.; Wang, G.; Chen, J.; Yu, J.; Liu, W. Land Eco-Efficiency for New-Type Urbanization in the Beijing-Tianjin-Hebei Region. Technol. Forecast. Soc. Chang. 2018, 137, 19–26. [Google Scholar] [CrossRef]
  6. Pathirana, A.; Denekew, H.B.; Veerbeek, W.; Zevenbergen, C.; Banda, A.T. Impact of Urban Growth-Driven Landuse Change on Microclimate and Extreme Precipitation—A Sensitivity Study. Atmos. Res. 2014, 138, 59–72. [Google Scholar] [CrossRef]
  7. United Nations Website. UN-Habitat: Urbanization Remains Unstoppable, with 68% of the Global Urban Population by 2050. Available online: https://news.un.org/zh/story/2022/06/1105282 (accessed on 8 May 2023).
  8. Tian, J.F.; Wang, B.Y.; Wang, S.J. Urban Land Use Efficiency and Its Coupling Relationship in the Three Provinces of Northeast China. Sci. Geogr. Sin. 2019, 39, 305–315. [Google Scholar]
  9. Grimm, N.B.; Faeth, S.H.; Golubiewski, N.E.; Redman, C.L.; Wu, J.; Bai, X.; Briggs, J.M. Global Change and the Ecology of Cities. Science 2008, 319, 756–760. [Google Scholar] [CrossRef] [PubMed] [Green Version]
  10. Bloomfield, G.; Bucht, K.; Martínez-Hernández, J.C.; Ramírez-Soto, A.F.; Sheseña-Hernández, I.; Lucio-Palacio, C.R.; Ruelas Inzunza, E. Capacity Building to Advance the United Nations Sustainable Development Goals: An Overview of Tools and Approaches Related to Sustainable Land Management. J. Sustain. For. 2017, 37, 157–177. [Google Scholar] [CrossRef]
  11. Ji, X.M.; Wang, K.; Ji, T.; Zhang, Y.H.; Wang, K. Coupling Analysis of Urban Land Use Benefits: A Case Study of Xiamen City. Land 2020, 9, 155. [Google Scholar] [CrossRef]
  12. Zhao, H.N.; Zhao, Y.H.; Ning, J.; Gong, T.T.; Sun, Z.X. Evaluation of Land Use Benefit of Urban Agglomeration in the Yangtze River Delta Based on TOPSIS Method. Res. Soil Water Conserv. 2021, 28, 355–361. [Google Scholar]
  13. Liu, Y.; Meng, Q.; Zhang, J.; Zhang, L.; Allam, M.; Hu, X.; Zhan, C. Evaluation of Urban Spatial Structure from the Perspective of Socioeconomic Benefits Based on 3D Urban Landscape Measurements: A Case Study of Beijing, China. Remote Sens. 2022, 14, 5511. [Google Scholar] [CrossRef]
  14. Yunnan Government Website. Yunnan Province Ecological Civilization Construction Platoon Planning (2021–2025). Available online: https://www.yn.gov.cn/zwgk/zcwj/swwj/202205/t20220521_242388.html (accessed on 22 June 2023).
  15. Cai, Y.F. Population Growth and Land Expansion of City during the Urbanization: Characteristic Facts and Coordination Mechanism. China Soft Sci. Mag. 2023, 385, 84–93. [Google Scholar]
  16. Song, C.Z.; Liu, Q.F.; Song, J.P.; Jiang, Z.Y.; Lu, Z.L.; Chen, Y.Y. Land Use Efficiency in the Yellow River Basin in the Background of China’s Economic Transformation: Spatial-Temporal Characteristics and Influencing Factors. Land 2022, 11, 2306. [Google Scholar] [CrossRef]
  17. Zhou, L.; Huang, Q.H. Efficiency Evaluation on Urban Land Use Based on the Gray Correlation TOPSIS Method and Diagnosis of Its Obstacle Indicators. Res. Soil Water Conserv. 2014, 21, 39–44. [Google Scholar]
  18. China Central Government Portal. The Regulations of the Conservation and Intensive Use of Land. Available online: http://www.gov.cn/gongbao/content/2014/content_2736111.htm (accessed on 8 May 2023).
  19. Li, D.C.; Fan, K.K.; Lu, J.Q.; Wu, S.; Xie, X.W. Research on Spatio-Temporal Pattern Evolution and the Coupling Coordination Relationship of Land-Use Benefit from a Low-Carbon Perspective: A Case Study of Fujian Province. Land 2022, 11, 1498. [Google Scholar] [CrossRef]
  20. Yang, Z.S. Land Resources; Economy & Management Publishing House: Beijing, China, 2021. [Google Scholar]
  21. Ma, J.F.; Li, W.F.; Wang, Z.; He, L.; Han, L.J. Measuring Multi-Faceted Land Use Efficiency of Large-Scale Urban Agglomerations under Multi-Scale Drivers: Evidence from China. Land 2022, 11, 91. [Google Scholar] [CrossRef]
  22. Wu, C.Y.; Wei, Y.H.D.; Huang, X.J.; Chen, B. Economic Transition, Spatial Development and Urban Land Use Efficiency in the Yangtze River Delta, China. Habitat Int. 2017, 63, 67–78. [Google Scholar] [CrossRef]
  23. Zitti, M.; Ferrara, C.; Perini, L.; Carlucci, M.; Salvati, L. Long-Term Urban Growth and Land Use Efficiency in Southern Europe: Implications for Sustainable Land Management. Sustainability 2015, 7, 3359–3385. [Google Scholar] [CrossRef] [Green Version]
  24. Cui, X.Z.; Wang, X.T. Urban Land Use Change and Its Effect on Social Metabolism: An Empirical Study in Shanghai. Habitat Int. 2015, 49, 251–259. [Google Scholar] [CrossRef]
  25. Ma, Y.; Zheng, M.R.; Zheng, X.Q.; Huang, Y.; Xu, F.; Wang, X.L.; Liu, J.T.; Lv, Y.Q.; Liu, W.C. Land Use Efficiency Assessment under Sustainable Development Goals: A Systematic Review. Land 2023, 12, 894. [Google Scholar] [CrossRef]
  26. Hurwicz, L. The Design of Mechanisms for Resource Allocation. Am. Econ. Rev. 1973, 63, 1–30. [Google Scholar]
  27. Zhang, W.P.; Shi, P.J.; Tong, H.L. Research on Construction Land Use Benefit and the Coupling Coordination Relationship Based on a Three-Dimensional Frame Model—A Case Study in the Lanzhou-Xining Urban Agglomeration. Land 2022, 11, 460. [Google Scholar] [CrossRef]
  28. Liu, S.K. Land Economics; China Agricultural Ture Press: Beijing, China, 1996; p. 357. [Google Scholar]
  29. Polglase, P.J.; Reeson, A.; Hawkins, C.S.; Paul, K.I.; Siggins, A.W.; Turner, J.; Crawford, D.F.; Jovanovic, T.; Hobbs, T.J.; Opie, K.; et al. Potential for Forest Carbon Plantings to Offset Greenhouse Emissions in Australia: Economics and Constraints to Implemen-tation. Clim. Chang. 2013, 121, 161–175. [Google Scholar] [CrossRef]
  30. Ewing, R. Is Los Angeles-Style Sprawl Desirable? J. Am. Plan. Assoc. 1997, 63, 107–126. [Google Scholar] [CrossRef]
  31. Dai, J.S. Evaluation of Eco-Environment and Socio-Economic Benefit on the Project of Comprehensive Reclamation in Tarim River Basin. Ph.D. Thesis, Xinjiang Agricultural University, Ürümqi, China, 2015. [Google Scholar]
  32. Liu, C.; Luo, J.M.; Huo, Y.W.; Cheng, L. Exploring Spatial-Temporal Variation and Coordination of Land Use Benefits and Urbanization at County Level in Shaanxi Province. Res. Soil Water Conserv. 2020, 27, 320–327+335. [Google Scholar]
  33. Su, Q.M.; Wang, L.Y. Construct the Framework for the Allocation of Resources Invested in Ecological Governance from the Urban–Rural Land Use Coupling. Forests 2022, 13, 1588. [Google Scholar] [CrossRef]
  34. Siderov, K. Spatial Data Analysis: Theory and Practice. Austral. Ecol. 2005, 30, 240–241. [Google Scholar] [CrossRef]
  35. Gao, M.X. Coupling Relationship between Land Consolidation and New Countryside Construction and Its Pattern Innovation. Ph.D. Thesis, Shandong Agricultural University, Tai’an, China, 2008. [Google Scholar]
  36. Xiao, Y.; Zhong, J.L.; Zhang, Q.F.; Xiang, X.; Huang, H. Exploring the Coupling Coordination and Key Factors between Urbanization and Land Use Efficiency in Ecologically Sensitive Areas: A Case Study of the Loess Plateau, China. Sustain. Cities Soc. 2022, 86, 104148. [Google Scholar] [CrossRef]
  37. Wang, J.Y.; Wang, S.J.; Li, S.J.; Feng, K.S. Coupling Analysis of Urbanization and Energy-Environment Efficiency: Evidence from Guangdong Province. Appl. Energy 2019, 254, 113650. [Google Scholar] [CrossRef]
  38. Ariken, M.; Zhang, F.; Chan, N.W.; Kung, H.T. Coupling Coordination Analysis and Spatio-Temporal Heterogeneity between Urbanization and Eco-Environment along the Silk Road Economic Belt in China. Ecol. Indic. 2021, 121, 107014. [Google Scholar] [CrossRef]
  39. Ma, M.Y.; Tang, J.X. Interactive Coercive Relationship and Spatio-Temporal Coupling Coordination Degree between Tourism Urbanization and Eco-Environment: A Case Study in Western China. Ecol. Indic. 2022, 142, 109149. [Google Scholar] [CrossRef]
  40. Li, Y.N.; Duan, H.M. Progress in the Studies on Land Use/Cover Change. J. Shaanxi Norm. Univ. (Nat. Sci. Ed.) 2008, 36, 68–70. [Google Scholar]
  41. Niu, L.Z.; Shi, Y. A Review of Progress in Land Use/Cover change Research. J. Southeast Univ. (Philos. Soc. Sci. Ed.) 2014, 16, 25–26+97. [Google Scholar]
  42. Li, X.B. Review of the International Researches on Land Use/Land Cover Change. Acta Ecol. Sin. 1996, 51, 553–558. [Google Scholar]
  43. Lu, X.H.; Zhang, Y.W.; Lin, C.R.; Wu, F. Analysis and Comprehensive Evaluation of Sustainable Land Use in China: Based on Sustainable Development Goals Framework. J. Clean. Prod. 2021, 310, 127205. [Google Scholar] [CrossRef]
  44. Qin, D.H.; Zhang, K.M.; Niu, W.Y. Population, Resources, Environment and Sustainable Development in China; Xinhua Publishing House: Beijing, China, 2002; p. 935. [Google Scholar]
  45. Li, Z.B. Evaluation of Urban Land Sustainable Use. J. Zhejiang Norm. Univ. (Nat. Sci.) 2000, 1, 73–78. [Google Scholar]
  46. Hu, T.L.; Yang, Z.F. Method for Ecological Benefit Assessment of Rural Land Consolidation. Trans. Chin. Soc. Agric. Eng. 2004, 20, 275–280. [Google Scholar]
  47. Pan, D.P.; Song, G. Land Eco-Benefits Evaluation of Coal City in Heilongjiang: A Case Study in Hegang City. research of Soil Water Conserv. 2010, 17, 114–117+122. [Google Scholar]
  48. Guneralp, B.; Reba, M.; Hales, B.U.; Wentz, E.A.; Seto, K.C. Trends in Urban Land Expansion, Density, and Land Transitions from 1970 to 2010: A Global Synthesis. Environ. Res. Lett. 2020, 15, 044015. [Google Scholar] [CrossRef]
  49. Zhang, L.G.; Huang, L.C.; Xia, J.L.; Duan, K.F. Spatial-Temporal Evolution and It’s Influencing Factors on Urban Land Use Efficiency in China’s Yangtze River Economic Belt. Land 2022, 12, 76. [Google Scholar] [CrossRef]
  50. Chu, Z.; Xu, C.C.; Luo, Y.X.; Sun, Q. Land Use Simulation and Ecological Benefit Evaluation in the Tarim River Basin Based on Ecological Protection Red Line Management. Acta Ecol. Sin. 2021, 41, 7380–7392. [Google Scholar]
  51. Tang, Y.K.; Wang, K.; Ji, X.M.; Xu, H.; Xiao, Y.Q. Assessment and Spatial-Temporal Evolution Analysis of Urban Land Use Efficiency under Green Development Orientation: Case of the Yangtze River Delta Urban Agglomerations. Land 2021, 10, 715. [Google Scholar] [CrossRef]
  52. Wang, P.; Qi, M.N.; Liang, Y.J.; Ling, X.B.; Song, Y. Examining the Relationship between Environmentally Friendly Land Use and Rural Revitalization Using a Coupling Analysis: A Case Study of Hainan Province, China. Sustainability 2019, 11, 6266. [Google Scholar] [CrossRef] [Green Version]
  53. Zhang, M.D.; Mo, D.Y. Coupling Coordination Degree of Urban Land Use Benefit and Urbanization. Resour. Sci. 2014, 36, 8–16. [Google Scholar]
  54. Liao, J.H.; Peng, X.W.; Wang, Q.; Jian, P.; Wu, Q.T. Study on the Coupling and Coordination Relationship of Urban Land Use Benefit in Urban Agglomeration on the West Coast of Taiwan Strait. World Reg. Stud. 2021, 30, 556–566. [Google Scholar]
  55. Kaur, H.; Garg, P. Urban Sustainability Assessment Tools: A Review. J. Clean. Prod. 2019, 210, 146–158. [Google Scholar] [CrossRef]
  56. Duguma, L.A.; Hager, H. Farmers’ Assessment of the Social and Ecological Values of Land Uses in Central Highland Ethiopia. Env. Manag. 2011, 47, 969–982. [Google Scholar] [CrossRef]
  57. Qin, J.; Zhang, Y.P. Application of Contemporary Statistical Information Analysis Method in Safety Engineering—The Principle of AHP. Ind. Saf. Dust Control 1999, 5, 44–48. [Google Scholar]
  58. Peng, Y.; Wang, B.H.; Liu, X.Z.; Ma, B. Comprehensive Efficiency of the Cultivated Land Utilization: A Case Study in Shandong Province. Resour. Sci. 2007, 29, 131–136. [Google Scholar]
  59. Gaaff, A.; Reinhard, S. Incorporating the Value of Ecological Networks into Cost–Benefit Analysis to Improve Spatially Explicit Land-Use Planning. Ecol. Econ. 2012, 73, 66–74. [Google Scholar] [CrossRef]
  60. Zhang, P.; Qin, M.Z.; Yan, J.H.; Li, J.; Yang, L.; Sun, C. Study on Impact Factors and Characteristic of Cultivated Land Resources Utilization Benefit in Henan Province. China Popul. Resour. Environ. 2013, 23, 162–169. [Google Scholar]
  61. Zhang, X.Y.; Wang, Y.; Bao, J.; Wei, T.D.; Xu, S.W. A Research on the Evaluation of China’s Food Security under the Perspective of Sustainable Development—Based on an Entropy Weight TOPSIS Model. Agriculture 2022, 12, 1926. [Google Scholar] [CrossRef]
  62. Zhu, W.J.; Sun, H. Study on Spatio-Temporal Evolution and Driving Forces of Urban Land Use Benefits in Jiangsu Province. China Land Sci. 2019, 33, 103–112. [Google Scholar]
  63. Ma, X.L.; Wang, Y.T.; Hou, Q.F.; Lu, G.S.; Zhuo, X.A.; Wang, B.; He, Y.B. Spatial Benefit Evaluation of Land Use in Gansu Province from 2010 to 2018 Based on TOPSIS Model. Ecol. Sci. 2022, 41, 146–156. [Google Scholar]
  64. Liu, J.Y.; Zhang, Z.X.; Xu, X.L.; Kuang, W.H.; Zhou, W.C.; Zhang, S.W.; Li, R.D.; Yan, C.Z.; Yu, D.S.; Wu, S.X.; et al. Spatial Patterns and Driving Forces of Land Use Change in China in the Early 21st Century. Acta Geogr. Sin. 2009, 64, 1411–1420. [Google Scholar] [CrossRef]
  65. Balasubramanian, A. Digital Elevation Model (DEM) in GIS; University of Mysore: Mysore, India, 2017. [Google Scholar]
  66. Liao, C.B. Quantitative Judgement and Classification System for Coordinated Development of Environment and Economy -A Case Study of The City Group in the Pearl River Dolts. Trop. Geogr. 1999, 2, 76–82. [Google Scholar]
  67. Xia, S.W.; Yang, J.B.; Yang, Z.B. Introduction to Systems Engineering; Tsinghua University Press: Beijing, China, 1995. [Google Scholar]
  68. Ching, L.H.; Kwangsun, Y. Multiple Attribute Decision Making; Springer: Berlin, Germany, 1981. [Google Scholar]
  69. Hu, Y.H. The Improved Method for TOPSIS in Comprehensive Evaluation. J. Math. Pract. Theory 2002, 32, 572–575. [Google Scholar]
  70. Xiao, Y.; Tang, X.; Li, Y.; Huang, H.; An, B.W. Social Vulnerability Assessment of Landslide Disaster Based on Improved TOPSIS Method: Case Study of Eleven Small Towns in China. Ecol. Indic. 2022, 143, 109316. [Google Scholar] [CrossRef]
  71. Gao, Y.L.; Zhang, Z.Y.; Wang, Z.G. Food Security Evaluation Based on Entropy Weight TOPSIS Method: Cutting from Major Grain Producing Area. J. Agro-For. Econ. Manag. 2019, 18, 135–142. [Google Scholar]
  72. Lei, X.P.; Robin, Q.; Liu, Y. Evaluation of Regional Land Use Performance Based on Entropy TOPSIS Model and Diagnosis of Its Obstacle Factors. Trans. Chin. Soc. Agric. Eng. 2016, 32, 243–253. [Google Scholar]
  73. Wang, Z.F.; Chen, Q.Q. Spatio-Temporal Pattern Evolution and Trend Prediction of Tourism Ecological Security in the Yangtze River Economic Belt Since 1998. Acta Ecol. Sin. 2021, 41, 320–332. [Google Scholar]
  74. Che, L.; Bai, Y.P.; Zhou, L.; Wang, F.; Ji, X.P.; Qiao, F.W. Spatial Pattern and Spillover Effects of Green Development Efficiency in China. Sci. Geogr. Sin. 2018, 38, 1788–1798. [Google Scholar]
  75. Zhang, Z.A.; Huang, Z.F.; Cao, F.D.; Wang, K.; Chen, X.Y. The Space-Time Transition Characteristics and Its Driving Mechanism of County-Scale Inbound Tourism in Zhejiang Province. Geogr. Res. 2016, 35, 1177–1192. [Google Scholar]
  76. Zheng, L.; Zhang, Z.B.; Ma, Y.X.; Dong, J.H. Evaluation of Land Use Benefit and Analysis of the Coupling Coordination Degree in Gansu Province. J. Lanzhou Univ. (Nat. Sci.) 2022, 58, 11–19. [Google Scholar]
  77. Yunnan Government Website. Taking the Road of New Urbanization with Yunnan Characteristics. Available online: www.yn.gov.cn/ywdt/ynyw/202012/t20201223_214618.html (accessed on 8 May 2023).
  78. Yunnan Government Website. Implementation Plan on High-Quality Promotion of Urbanization with County Cities as Important Carriers. Available online: https://www.yn.gov.cn/zwgk/zcwj/swwj/202208/t20220806_245490.html (accessed on 8 May 2023).
  79. Bai, Y.P.; Deng, X.Z.; Jiang, S.J.; Zhang, Q.; Wang, Z. Exploring the Relationship Between Urbanization and Urban Eco-Efficiency: Evidence from Prefecture-Level Cities in China. J. Clean. Prod. 2018, 195, 1487–1496. [Google Scholar] [CrossRef]
  80. Lu, Z.P. Evaluation Study on the Sustainable Development Capacity of Tobacco Industry in Yunnan Province. Master’s Thesis, Kunming University of Science and Technology, Kunming, China, 2019. [Google Scholar]
  81. Bryan, B.A.; Crossman, N.D.; Nolan, M.; Li, J.; Navarro, J.; Connor, J.D. Land Use Efficiency: Anticipating Future Demand for Land-Sector Greenhouse Gas Emissions Abatement and Managing Trade-Offs with Agriculture, Water, and Biodiversity. Glob Chang. Biol. 2015, 21, 4098–4114. [Google Scholar] [CrossRef]
Figure 1. Location map of Yunnan Province.
Agriculture 13 01343 g001
Figure 2. Land use map of Yunnan Province.
Agriculture 13 01343 g002
Figure 3. Spatial and temporal patterns of economic efficiency in Yunnan Province. (a) Spatial patterns of economic efficiency in Yunnan Province; (b) Temporal patterns of economic efficiency in Yunnan Province.
Agriculture 13 01343 g003
Figure 4. Spatial and temporal patterns of social efficiency in Yunnan Province. (a) Spatial patterns of social efficiency in Yunnan Province; (b) Temporal patterns of social efficiency in Yunnan Province.
Agriculture 13 01343 g004
Figure 5. Spatial and temporal patterns of ecological efficiency in Yunnan Province. (a) Spatial patterns of ecological efficiency in Yunnan Province; (b) Temporal patterns of ecological efficiency in Yunnan Province.
Agriculture 13 01343 g005aAgriculture 13 01343 g005b
Figure 6. Spatial and temporal patterns of comprehensive efficiency in Yunnan Province. (a) Spatial patterns of comprehensive efficiency in Yunnan Province; (b) Temporal patterns of comprehensive efficiency in Yunnan Province.
Agriculture 13 01343 g006
Figure 7. Kriging interpolation simulation of comprehensive efficiency in Yunnan Province.
Agriculture 13 01343 g007
Figure 8. The trend of CC in the administrative regions in Yunnan Province.
Agriculture 13 01343 g008
Figure 9. Spatial patterns of CC relationship of LUE in administrative regions of Yunnan Province.
Agriculture 13 01343 g009
Figure 10. The overall LUE, CC relationship in Yunnan Province from 2010 to 2020.
Agriculture 13 01343 g010
Table 1. Evaluation index system of LUE in Yunnan Province.
Target LayerGuideline LayerIndicator LayerWeightsIndicator Properties
Comprehensive LUEEconomic efficiencyGDP per capita0.0580+
Economic density0.1307+
Value added of industrial GDP0.1333+
Local public finance budget revenue0.1490+
Social efficiencyPopulation density0.0631
Retail sales of social consumer goods0.1640+
Water consumption0.0438
Grain sown area0.0687+
Ecological efficiencyGreen coverage area0.1079+
Green space per capita0.0148+
The green coverage area of the built-up area0.0125+
Total afforestation area0.0541+
Note: The weights ( ω j ) in the table are calculated from Equation (3).
Table 2. Classification criteria for the level of CC.
Coupling DegreeCoupling Coordination LevelCoupling DegreeCoupling Coordination Level
0.00–0.09Extreme disorder0.50–0.59Barely coordinated
0.10–0.19Severe disorders0.60–0.69Primary coordination
0.20–0.29Moderate disorder0.70–0.79Intermediate coordination
0.30–0.39Mild disorders0.80–0.89Good coordination
0.40–0.49On the verge of disorder0.90–1.00Quality coordination
Table 3. Area of different land use and its proportion in Yunnan Province from 2010 to 2020.
Land Type201020152020Rate of Change/%
Area
Area/km2
%Area
Area/km2
%Area
Area/km2
%2010–2020
Cultivated land68,599.0617.91%68,328.8817.84%67,526.4417.63%−1.58%
Woodland220,220.1357.50%219,944.1357.44%219,490.1357.31%−0.33%
Grassland86,623.2522.62%86,493.3822.59%85,838.7522.41%−0.91%
Waters2872.440.75%3171.440.83%3816.501.00%24.74%
Constructed land3100.060.81%3432.310.90%4743.441.24%34.65%
Unused land1568.500.41%1566.880.41%1554.810.41%−0.88%
Table 4. Interannual variation and the average coupling coordination of administrative regions in Yunnan Province.
City201020152020Average
DCoupling Coordination LevelDCoupling Coordination LevelDCoupling Coordination LevelDCoupling Coordination Level
Kunming0.307740.422650.485150.40515
Qujing0.213130.228730.273630.23853
Yuxi0.140820.174020.208730.17452
Lijiang0.076310.094910.107320.09281
Pu’er0.092110.111320.139820.11442
Baoshan0.094510.120120.158620.12442
Zhaotong0.140320.161420.208530.17012
Lincang0.086110.125820.130820.11422
Chuxiong0.121720.141420.171220.14482
Honghe0.177920.202530.236830.20573
Wenshan0.098620.133020.170520.13402
Xishuangbanna0.065710.087510.117020.09011
Dali0.146720.144320.174520.15522
Nujiang0.034810.056110.062810.05131
Deqing0.030610.051510.069910.05071
Dehong0.075010.096820.124420.09872
The numbers 1–10 represent extreme disorder, severe disorder, moderate disorder, mild disorder, on the verge of disorder, barely coordinated, primary coordination, intermediate coordination, good coordination, and quality coordination.
Table 5. The overall LUE, CC, and grade classification in Yunnan Province from 2010 to 2020.
YearEconomic Efficiency IndexSocial Efficiency IndexEcological Efficiency IndexCoupling DegreeComprehensive Efficiency IndexCoupling CoordinationCoupling Coordination Level
20100.08110.16970.19510.09600.14700.1189Severe disorders
20110.10750.18090.19890.10790.16200.1318Severe disorders
20120.12910.18690.19600.11610.17100.1396Severe disorders
20130.14780.19040.19150.12050.17880.1444Severe disorders
20140.14910.19520.18070.12070.17910.1438Severe disorders
20150.15610.19960.18260.12310.18350.1470Severe disorders
20160.16510.20570.22490.12940.19780.1587Severe disorders
20170.18040.21550.22000.13260.20640.1632Severe disorders
20180.19050.21260.19820.13430.20470.1647Severe disorders
20190.22530.24280.20320.14160.23010.1758Severe disorders
20200.23870.23920.20110.14250.23530.1775Severe disorders
Disclaimer/Publisher’s Note: The statements, opinions and data contained in all publications are solely those of the individual author(s) and contributor(s) and not of MDPI and/or the editor(s). MDPI and/or the editor(s) disclaim responsibility for any injury to people or property resulting from any ideas, methods, instructions or products referred to in the content.

