1. Introduction
Agricultural production of pork is of great importance to the population of the Czech Republic as pork has a long-time share of more than 50% of total meat consumption in the Czech Republic, with an annual consumption of around 43 kg/person. The task of the agricultural policy is to ensure its availability to consumers in the appropriate quality, quantity, and price. This can be a rather challenging task, as the pork market faces frequent shocks. One of the risks in pig breeding is the occurrence of African swine fever. Lately, it affected China in 2019 and other Asian countries. This shock caused a high demand for pork in 2019. In the second quarter of 2020, there were sales problems due to restrictions on pork exports from the EU market due to the spread of the disease in several EU countries. Another market complication that was caused by the COVID-19 pandemic was that public catering was closed or restricted in many countries and the meat processing was limited. During the pandemic, farmers faced staff shortages and disrupted supply chains. In mid-2021, pig farming in China was fully revived and the global pork market was oversaturated. The last shock that pig farmers have been facing since February 2022 is the outbreak of war in Ukraine, which has an impact on rising energy and feed costs and logistics problems. These crises impair trade relations, which are reflected in the pricing policy of agricultural producer prices, processing prices, and consumer prices.
China has the largest share of world pig production (40% in 2019) and the European Union has the second-largest share (21%). Within the EU, the largest producers are Spain and Germany. The Czech Republic contributes about 1% of slaughtered pigs to the EU market [
1]. The EU has the largest share (40%) of world exports in the pork market, where most of the pork is exported to China. The EU’s main competitors in the Chinese market are the US and Brazil. Some EU Member States concerned about environmental aspects have introduced rules limiting the expansion of pork meat production. EU production, consumption, and exports are expected to have a slightly declining trend over the next ten years [
2].
The foreign market for pigs and pork in the Czech Republic has had a negative balance for a long time. Almost five times as many live animals are exported from the Czech Republic than are imported and eight times less pork meat is exported than imported. In the last ten years, self-sufficiency in the pork commodity has gradually decreased to 51%. There are 370 specialized primary producers in the Czech Republic for breeding and fattening pigs, where more than half of the production is produced. A significant part of pig production is also produced by mixed farms.
The current situation in the Czech and European agricultural markets is affected by crises and requires political intervention. Some countries, such as the Czech Republic, have already announced extraordinary support for pig farmers in the first quarter of 2022. A better understanding of current price transmission can evaluate and better set Common Agricultural Policy (CAP) measures [
3] and promote the long-term sustainability of production. Čechura and Šobrová [
4] consider, as a conclusion of their research, that the measures of agricultural policy affect not only the level of primary producers, but they are reflected within the entire agri-food chain of the oligopsony pig market in the Czech Republic. Contrary to this, Havlíček et al. [
5] are inclined to the conclusion that the Czech pork production industry converted into an oligopoly. That may be the case of structural change leading to the concentration of the industry [
6].
The Ministry of Agriculture supports pig breeding in the Czech Republic through national and EU resources based on CAP. Receiving support is conditioned by the fulfillment of many conditions and activities.
Within the framework of national support [
7], these are subsidy programs that are aimed at (i) maintaining and improving the genetic potential of the listed farm animals; (ii) support for selected activities and measures aimed at the spread of pig diseases and the recovery of poultry farms by increasing biological security; and (iii) improving welfare conditions in pig farming.
The Rural Development Program (reg. EU NO 1305/2013) provides support for various aspects of agricultural development. This includes investments in agricultural holdings, facilitating the entry of young farmers into the industry, fostering the development of new products, etc. [
8]. In addition, producers and processors can take advantage of the opportunity to use long-term support for commercial loans, financial support for insurance, and loans. The strategic plan for the CAP period 2023–2027 focuses on increasing the immunity in pig farming through vaccination and animal welfare.
The relationships between the price of agricultural producers, processors (PPs), and consumers (CPs) are examined across different sectors. Price transmission research is more intensive, especially in the period following the price shock. Price transmission (PT) exists in vertical, horizontal, and indirect forms [
9]. The vertical PT evaluates the relationship between the price of the commodity producer, the processed product, and the retail price of the market chain. The vertical form is determined by processing production and distribution costs. Following this approach, it is possible to analyse the type of competition in the market (perfect, imperfect) and whether there is a misuse of market power and status. For instance, when focusing on agro-food products, the dairy market chain would suppose an imperfect price transmission (low and asymmetric). In the pork market, an expected imperfect price transmission and modelling of asymmetric adjustment are assumed as dominant in new studies of price transmission, but it cannot be defined without the structural model and market being studied [
10]. Anyway, the asymmetry in price transmission can be implied by market power, but this is not the only reason; it can be caused by other factors too [
6]. It should not just be concluded that market power means the presence of asymmetric price transmission. It was already investigated more than twenty years ago that the asymmetric price transmission may be in competitive, as well as oligopolistic, market structures too [
11].
When examining the relationship between prices, it is possible to determine whether it is a short-term run (the situation returns to normal after the shock) or a long-term run (the shock has a long-term effect on the price). Baek and Koo [
12] documented a significant long-run effect of the change in energy price on food prices in the U.S. but found only a low impact of the short-run effect. Other research questions include whether the nature of the relationship is symmetric or asymmetric and what the response speed of their relationship is [
13]. Already in 2002, the work of Abdulai [
14] proved the existence of an asymmetry in the pork meat Swiss market between producer and retail prices. This was recently confirmed on the Czech pig market by Rudinskaya [
15].
The horizontal PT can take the form of spatial price transmission or cross-commodity price transmission [
16]. This form includes the effects of trade cost, volume, market barriers, or price support policy. The results of an extensive search focused on the methods used in horizontal price transmission research in the agricultural field were summarized in the work of Listorti and Esposti [
17].
Since the pork meat production in the Czech Republic continues to decrease in the long term, it is disputable if the support for this sector is set up adequately. There are many reasons for abandoning pork production. Among the most significant long-term ones, we can mention the labor intensity need, high input costs, requirements on high quality meat, ensuring welfare, and low competitiveness on the international market. In recent years, when the Green Deal initiative and Farm to Fork strategy were published as a part of the new CAP, the requirements of pig farming also increased in the direction of agri-environmental conditions or increased essentials for digitization. This created higher demands on the farmers’ education, training, and investments and, therefore, the agricultural policy should consider these directions.
The findings of this paper aim to support the decision makers to set up well-balanced measures to maintain meat production despite the mentioned barriers. Additionally, the investigated topic can tackle the problem of the appropriate pork price structure. Our research can help to understand how much of the increased costs are reflected in the final consumer price and how much of the increase in consumer prices comes from the trade margins.
As described above, the pig meat market can be affected by various factors. This research examines the relationship between the producer pork price and processed product price in the Czech Republic based on monthly time series and the VECM model approach.
2. Materials and Methods
After the theoretical framework was defined, the aims and methodology were set. This paper aims to bring out a deeper understanding of vertical price transmission in pork meat by investigating the short-run and long-run relationships within the product and the speed of establishing the equilibrium relationship. All mentioned analyses were performed by eViews 12 Student Version Lite software.
The paper hypothesis assumes that in the vertical price transmission exists an equilibrium relationship, which is simultaneous. An equilibrium relationship that is simultaneous refers to a scenario where the prices of LNAP and LNPP are interdependent and affect each other in a dynamic way. Simultaneity refers to the fact that changes in one price affect the other price, and vice versa. Therefore, the existence of a simultaneous equilibrium relationship means that the prices of agricultural products and their processed counterparts are not determined independently, but rather are influenced by each other. This relationship can be measured using various methods to understand the direction, magnitude, and speed of price adjustments in response to changes in market conditions or other factors.
There can be a demand-driven, supply-driven, or a combined mechanism according to market power. It is assumed that the agri-food chain is demand-driven. The existence of an equilibrium relationship is simultaneous in a demand-driven mechanism which suggests that changes in demand can have a significant impact on both agricultural and processing prices and should be considered when analysing price transmission in the agricultural sector. LNPP is found to be a stronger predictor of LNAP than the reverse; it implies that changes in LNPP have a greater influence on LNAP than the other way around. This could occur if processing prices have a more direct impact on the price of the agricultural commodity. Overall, the existence of an equilibrium relationship that is simultaneous in a demand-driven mechanism and the finding that PP is a stronger predictor of AP are why the equation is normalized by AP. This can provide valuable insights into the dynamics of the agricultural and processing markets and the interdependence between the two.
The dataset used in this study was gathered from the Czech Statistical Office. Collected data are, on a monthly basis, covering the period from January 2013 to November 2021 [
18]. Processing Price (LNPP) represents the logarithmic value of the price of pork ham in Czech crown per kilogram (CZK/kg) and the Agriculture Price (LNAP) represents the logarithmic value of the price of pig slaughter in Czech crown per kilogram (CZK/kg). A transmission framework with VECM was used to investigate the price transmission in the Czech Republic. First, the descriptive statistics were calculated, and graphical visualization of selected time series was done for the purpose of examining the selected time series.
2.1. Cointegrating Analysis
Cointegration techniques are widely utilized in the examination of agricultural price transmission mechanisms following the influential research conducted by Ardeni in 1989. These techniques utilize cointegration models which assume that variables that are integrated of order one (I(1)) are connected by a long-term (LR) relationship, and the residuals of this relationship are stationary. The conventional Johansen (trace) test is employed to evaluate the cointegration among prices. If cointegration is discovered, the corresponding VECM is computed. In the event that cointegration is not detected, and there are no explosive roots within the prices, a first-difference VAR is calculated [
16].
The cointegration analysis can be used to find the degree and magnitude of price transmission and price adjustment along the pork value chains. To analyse the price transmission, the following cointegration equation was used:
where
P1t and
P2t represent the natural logarithm of prices in markets (
P2t Agriculture Price (LNAP),
P1t Processing Price (LNPP)),
ut denotes the stationary disturbance term, i.e.,
Ut(
ut|
P1t,
P2t) = 0, which might not be white noise. The intercept
β0 denotes the long-run equilibrium and
β1 the long-run price transmission elasticity and measures the magnitude of price shock transmissions from one market to another. The value of the long-run price transmission elasticity (
β1) is within an interval 0 and 1, with
β1 = 1 signifying that the price is completely transmitted in the supply chain [
19,
20].
According to Čechura and Šobrová [
4], in the case that the price transmission elasticity is equal to 1, the market structure is considered to be competitive. If the price transmission elasticity is higher than 1, then oligopoly power is present. In case the price transmission elasticity is less than 1, then there is existence of an oligopsony power.
Johansen’s approach was applied to determine the co-integrating relationship between two time series. The null hypothesis of the Johansen test assumes that the rank (r) of cointegrating vectors between prices is zero (i.e., r = 0); it means there is no existence of a cointegrating relationship. Johansen’s approach is often used for cointegration analysis, which is based on estimating matrix π and its rank. It can be defined by a simple relationship in the form:
where
yt is an (n × 1) vector of non-stationary variables, π represents an (n × n) matrix, and η
t is a vector of possibly serially correlated normally distributed disturbances [
21].
The Unit Root Test based on the Augmented Dickey–Fuller test (ADF) was run to test the stationarity of employed time series. The null hypothesis of the ADF test states that the price time series are non-stationary. If this hypothesis is rejected, then time series are stationary and integrated of order zero I(0). In case of non-stationary time series, the first difference of variables is calculated and then again tested by the ADF test. If the first difference is stationary, then the variable is integrated of order one I(1).
The optimal lag length is determined using standard information criteria. The number of lagged difference terms is selected considering Akaike Information Criterion (AIC), Bayesian Information Criterion (BIC), and Hannan–Quinn information criterion (HC).
2.2. Vector Autoregression and Vector Error Correction Model
The vector autoregression model (VAR) contains information about the short-run relationship among variables, but not about the long-run relationship. It includes endogenous variables, of which the lags are equal, and all the variables are stochastic and simultaneously dependent.
The VAR(p) model can show that the form assumes
Cs = 0 for
s >
p:
where
Xt is g × 1 vector of stochastic stationary variables,
p denotes the length of lags, and
u1, …,
ut are nid (0,Σ) [
22].
In case there is a long-run relationship between employed variables, then the Vector Error Correction Model (VECM) is estimated to investigate the transmission of price changes along the pork meat production chains. After VECM estimation and verification, the diagnostics of autocorrelation, heteroscedasticity, and normal distribution of residuals are tested. In the end, impulse-response analysis is applied, and a long period decomposition of variance was performed of the LNAP and LNPP. Impulse-response analysis shows the reaction of the system to innovations and the speed of approaching the equilibrium. The VECM takes the following form:
where
Cs = 0 for
s >
p,
Xt is k × 1 vector of variables, which are integrated of order 1 I(1), u
1, …,
ut are nid (0,Σ) and π is a matrix of long-run relationship [
23].
The impulse-response analysis shows what response in one time series will be triggered by an impulse in another time series within a system that contains even more time series. It is therefore an examination of the relationship between two one-dimensional time series in a multidimensional system [
24]. The decomposition of variance shows the interaction between variables for forecast horizons [
4]. The impulse response analysis provides the information about effect and persistence of one market’s shock to other markets in price transmission (impact of innovations); in other words, how fast information transmits across the markets [
25].
3. Results
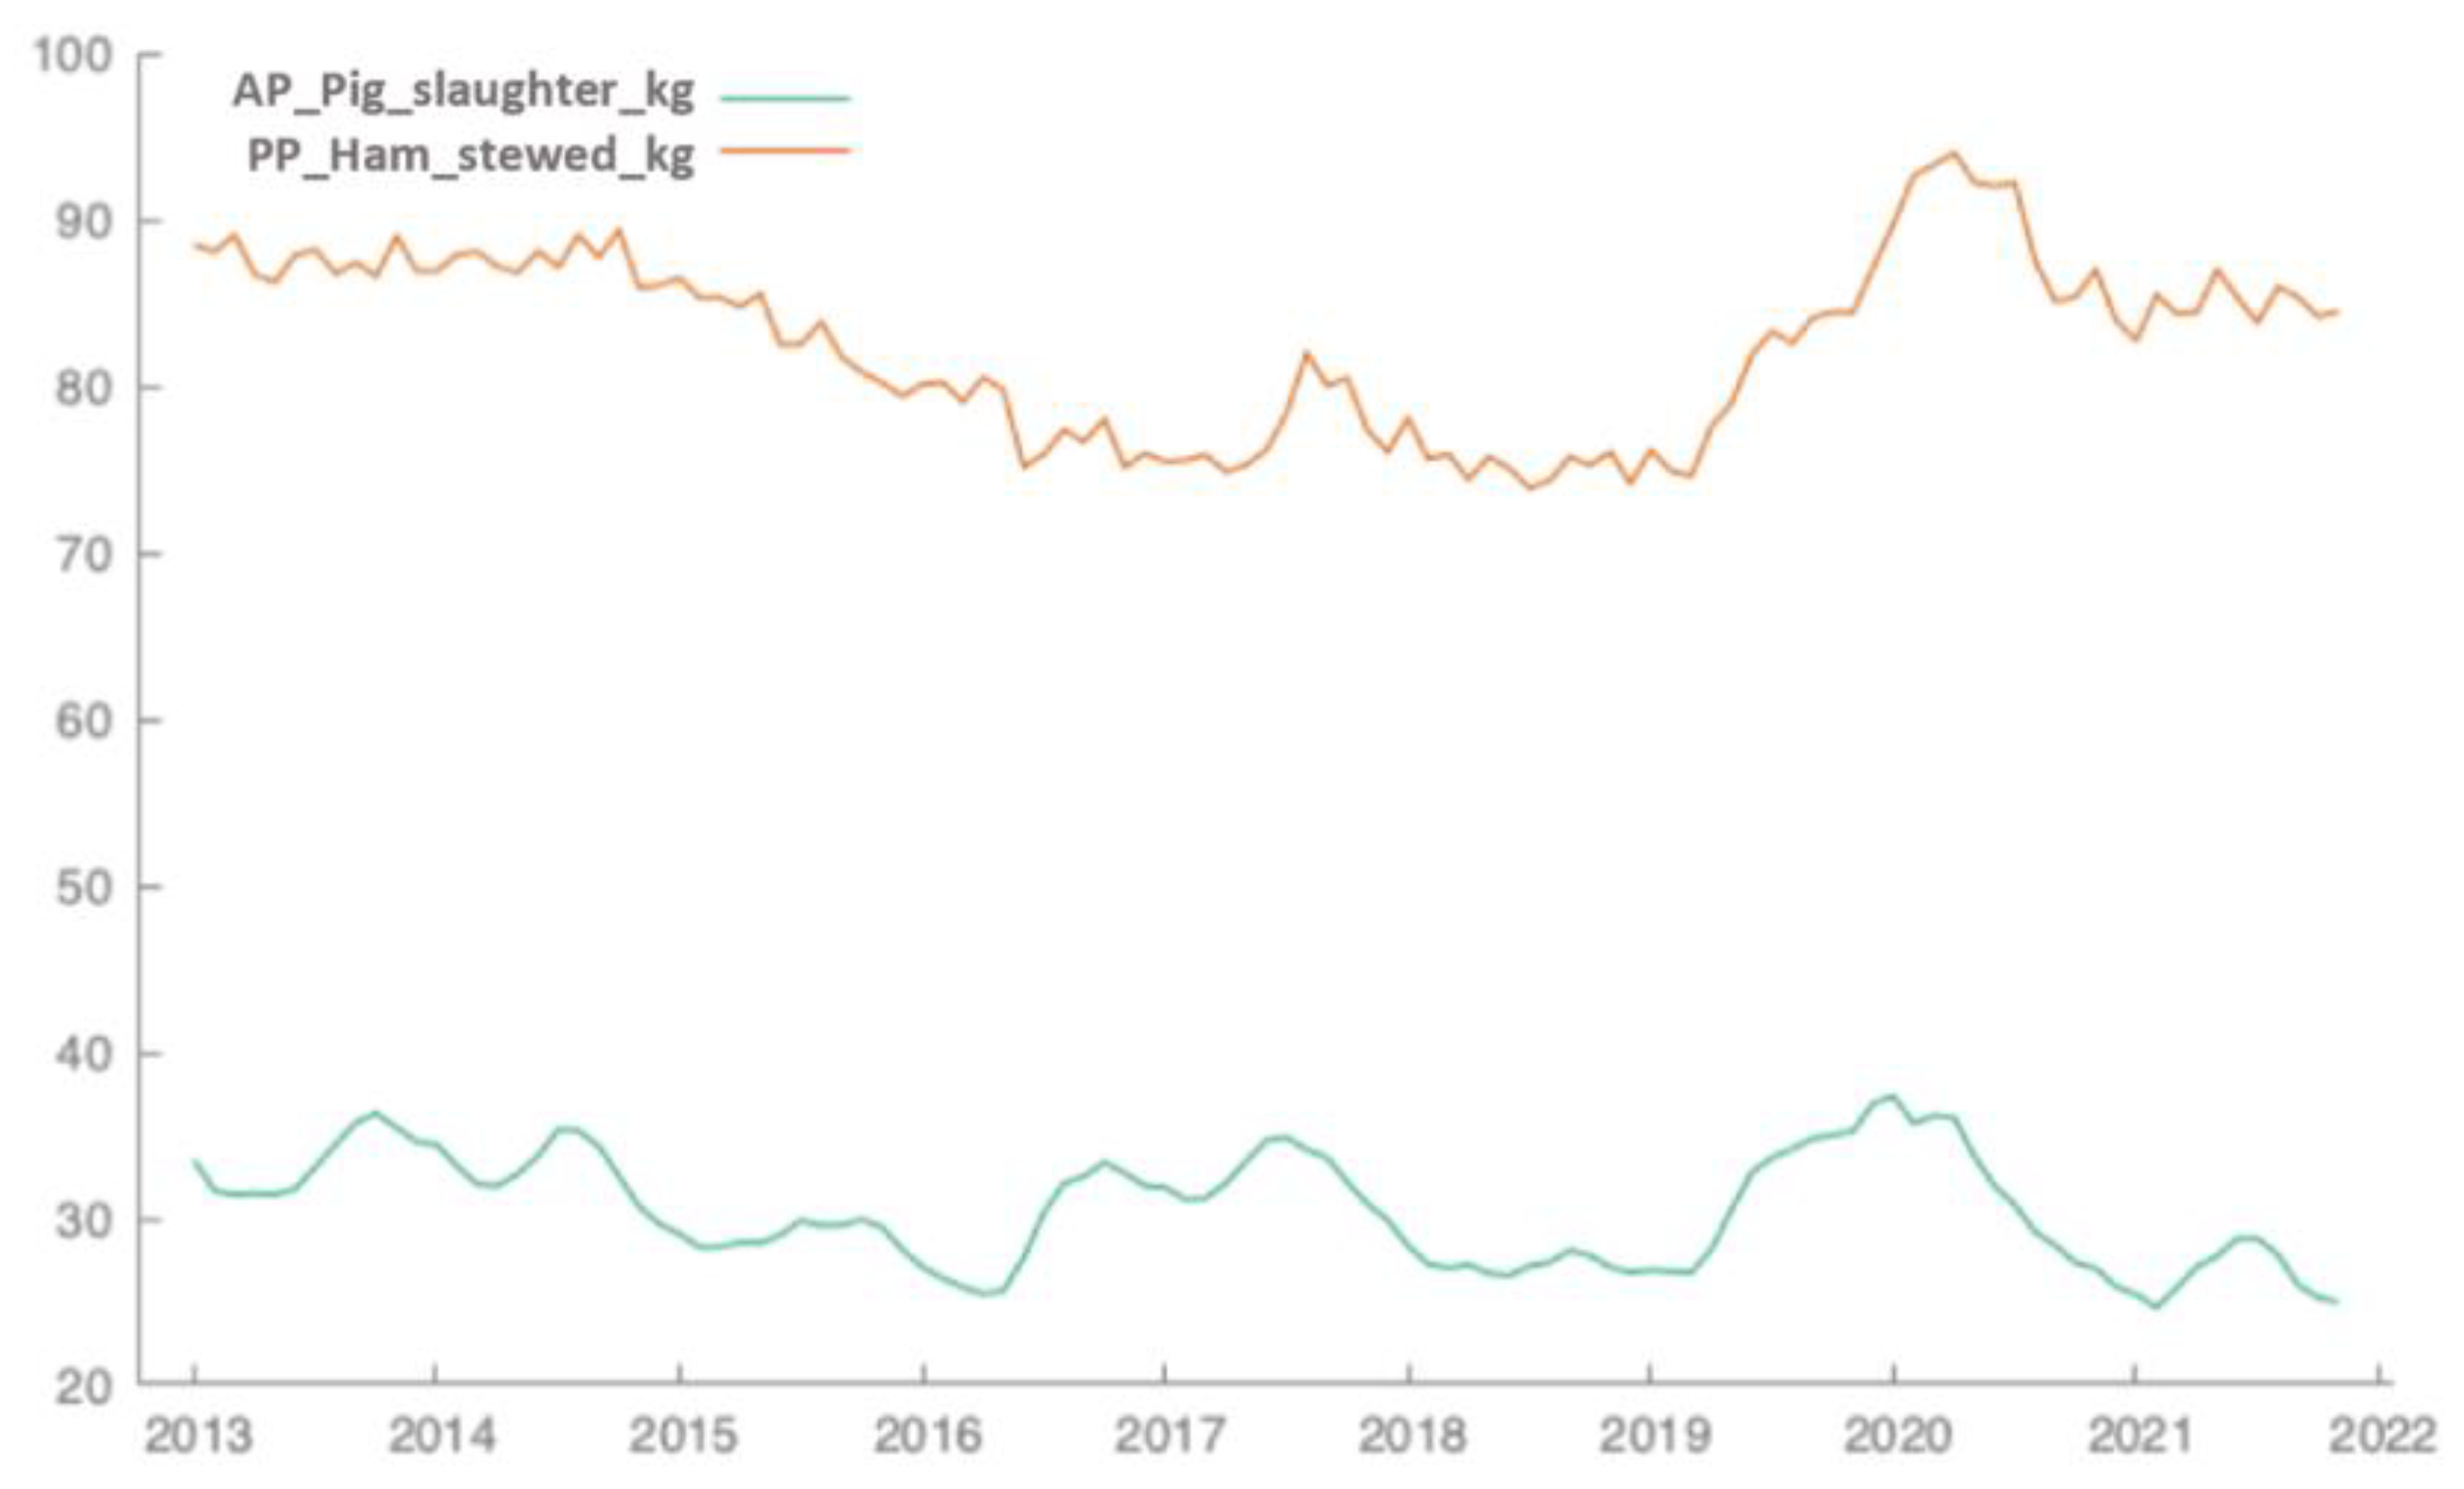
By graphical visualization of the dataset (
Figure 1), it can be concluded that the changes could be stochastic. There is no visible upward or downward sloping trend. It can be found that both time series react with a similar tendency towards the innovations (shocks).
Medium-term price fluctuations can be observed in agricultural producer price evolution. These fluctuations oscillate around the long-term average. Agricultural producer prices for slaughter pigs in the Czech Republic are influenced by the development of prices on the European Union market, mainly on the German market. The important decline started in 2015, continued throughout the first half of 2016, after which their gradual recovery followed and continued in 2017. In 2018, prices fell again as a reaction to the EU market. A sharp rise in agricultural producer prices for pigs for slaughter can be found in 2019 due to African swine fever. Stagnation in the first quarter of 2020 was followed by a dynamic price fall in the second quarter of 2020 as the pig market was revived and oversaturated. This fall continued in the first quarter of 2021. In the second quarter of 2021, prices rose again, stagnated in the middle of the year, and continued to decline.
Developments of the processing price represented by pig ham show a slightly different picture. Fluctuations are more often in the view of the sensitivity of the price to market changes. A significant drop in prices is evident in the second third of the examined time series. The last third of the presented time period is also affected by crisis factors due to the disease situation in pig farming and the COVID-19 pandemic.
As a next step, the Unit Root Test was done to get an order of integration of variables. Using the Augmented Dickey–Fuller (ADF) test confirmed that variables are not stationary in levels at the level of significance of 1% (null hypotheses were accepted, p-value > α). That is why the first differences were applied in the ADF test. The prices of LNAP and LNPP were integrated of order one, which means not stationary in levels, but stationary in first differences.
The variables are integrated of order one (e.g., I(1)); therefore, the cointegration can be analysed and Vector Error Correction Model estimated.
By Johansen’s approach, there were five alternatives considered. The first one was without an intercept and trend in both, cointegrating the vector and VAR. The second alternative had an intercept (no trend) in the cointegrating vector and not an intercept in VAR. The third alternative had an intercept (no trend in the model) in the cointegrating vector and VAR. The fourth alternative had an intercept and linear trend in the cointegrating vector and no intercept in VAR, and the fifth alternative had an intercept and trend in the cointegrating vector as well as in VAR (quadratic deterministic trend).
According to the theoretical framework, it is assumed that the pork agri-food chain may be characterized as demand driven [
4]; therefore, the normalization by LNAP was applied. By using Bayesian Information Criterion (BIC) and Hannan–Quinn information criterion (HC), the maximum number of lags for each variable was determined. A number of two lags was accordingly selected at the end (
Table 1).
In the first, second, and fourth alternatives, there is no evidence of a cointegrating vector. In the third alternative, the cointegrating vector was found by the trace test in the Johansen approach (
Table 2). Therefore, an alternative with an intercept (no trend in the model) in the cointegrating vector and VAR was selected.
The null hypothesis of no cointegration is rejected against the alternative of a cointegrating relationship in the model using the trace test at a significance level of 5%. Therefore, if there is a detected cointegrating relationship, then both short-run and long-run relationships can be analysed and VECM can be employed. In the long run, LNAP has a positive impact on LNPP on average, ceteris paribus.
The results of VECM can be found in
Table 3. The cointegrating equation for the long-run relationship can be written as follows:
The equilibrium relationship among the LNAP, LNPP, and constant is determined by the cointegrating vector (1, −0.294, −2.052). A negative coefficient of LNPP shows that the pig market is not competitive.
The Error Correction Term (ECT) is the speed of adjustment towards equilibrium; in other words, it denotes the speed of adjustment, informing that the previous period’s deviation from long-run equilibrium is corrected in the current period as an adjustment speed. A negative significant ECT suggests a long-run causality from LNAP to LNPP. There are visible market imperfections. A one-percentage change in LNPP is associated with a 0.0062% increase in LNAP on average, ceteris paribus, in the short run.
The inelastic price transmission of the pork ham can be recognized, which concludes that the change in the LNPP is not fully transmitted to LNAP. The coefficient at LNPP (−0.2943) represents the intensity of elasticity. It indicates that the market structure is not competitive.
Table 3.
Vector Error Correction estimates.
Table 3.
Vector Error Correction estimates.
| Cointegrating Equation | CointEq1 | |
|---|
| LNAP(−1) | 1.0000 | |
| LNPP(−1) | −0.2943 | |
| | (0.1093) | |
| | [−2.6925] | |
| C | −2.0516 | |
| Error Correction: | D(LNAP) | D(LNPP) |
| CointEq1 | −0.4237 | 0.0531 |
| | (0.1106) | 0.0909 |
| | [−3.8323] | [0.5836] |
| D(LNAP(−1)) | −0.8511 | −0.0109 |
| | (0.1136) | (0.0935) |
| | [−7.4926] | [−0.1170] |
| D(LNAP(−2)) | −0.2764 | −0.0163 |
| | (0.0905) | (0.0745) |
| | [−3.0543] | [−0.2190] |
| D(LNPP(−1)) | 0.0062 | −0.5329 |
| | (0.1215) | (0.1000) |
| | [0.0515] | [−5.3275] |
| D(LNPP(−2)) | 0.0789 | −0.1940 |
| | (0.1213) | (0.0998) |
| | [0.6504] | [−1.9433] |
| C | −0.0018 | −0.0013 |
| | (0.0022) | (0.0018) |
| | [−0.8232] | [−0.6920] |
| R-squared | 0.7629 | 0.2484 |
| Adj. R-squared | 0.7508 | 0.2101 |
| S.E. equation | 0.0225 | 0.0185 |
| F-statistic | 63.0891 | 6.4789 |
| Log likelihood | 250.3068 | 270.5562 |
| Akaike AIC | −4.6982 | −5.0876 |
| Schwarz SC | −4.5457 | −4.9351 |
| Mean dependent | −0.0009 | −0.0008 |
| S.D. dependent | 0.0449 | 0.0208 |
| Determinant resid covariance (dof adj.) | 1.72 × 10⁻⁷ |
| Determinant resid covariance (dof adj.) | 1.53 × 10⁻⁷ |
| Log likelihood | | 520.8636 |
| Akaike information criterion | −9.7474 |
| Schwarz criterion | | −9.3914 |
| Number of coefficients | | 14 |
Further diagnostics (
Table 4,
Table 5 and
Table 6) were applied to test that there is neither autocorrelation nor heteroscedasticity in the model (
p-values > α) at a level of significance of 1%. Moreover, it was confirmed by the Jarque–Bera test that residuals for both variables are normally distributed (
p-value = 0.000).
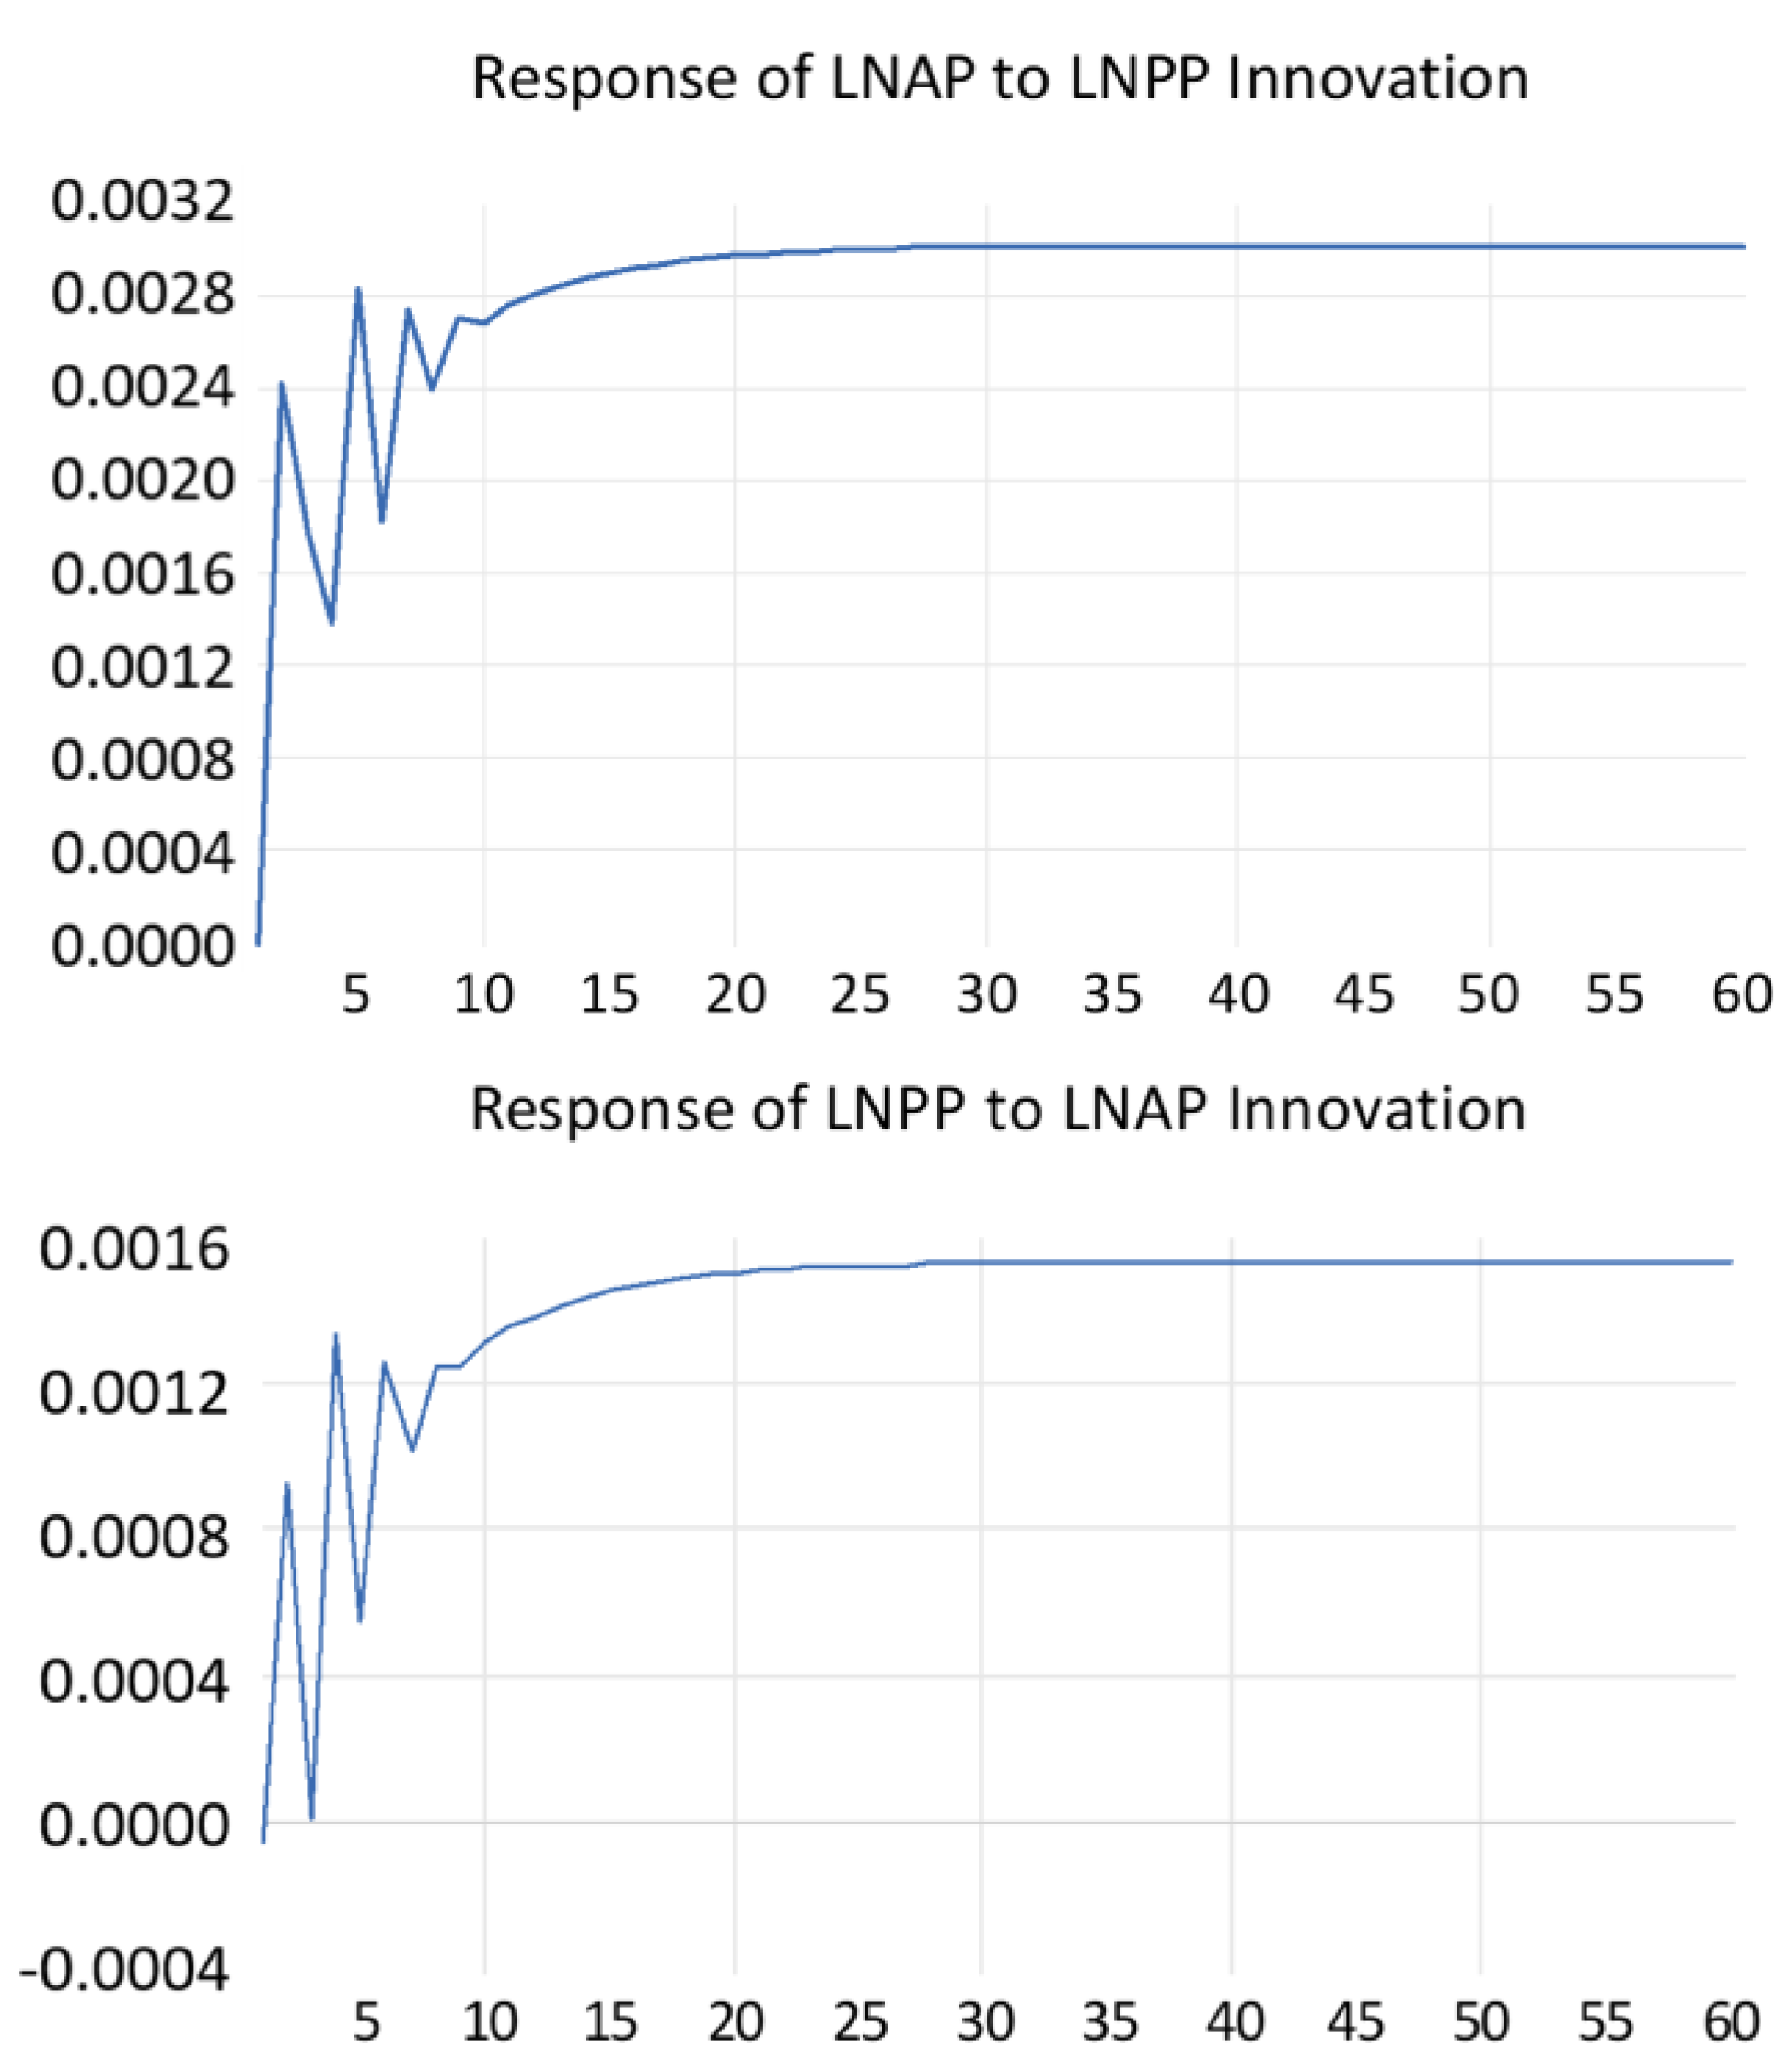
Figure 2 shows the responses of LNPP to the unitary/orthogonal innovation in the LNAP and vice versa. It shows the response of LNPP to a one standard deviation shock to LNAP from approximately 15–20 periods reaching long-run equilibrium. In the long run, there is a new level of a long-run change in price set up around 0.0015%.
The responses of LNAP to the unitary innovation in the LNPP show positive responses in all periods. The response of LNAP to a one standard deviation shock to LNPP reaching long-run equilibrium from approximately 15–20 periods is also shown. There is a new level of long-run change around 0.003% set up in the long run. Shocks to LNPP will have a positive impact on LNAP both in the short-run and long-run and vice versa.
These findings suggest that the time period needed to reach equilibrium is analogous for both LNAP and LNPP responses. Information gained from impulse-response analysis is valuable for agricultural policy evaluation. The response of LNAP to LNPP shock is faster and more intensive.
In
Figure 2, the top graph shows how the agriculture price LNAP reacts to the shocks or orthogonal innovation in the agriculture price LNAP. In the bottom graph, it can be seen how the processing price LNPP reacts to the shocks or orthogonal innovation in the agriculture price LNAP.
From an economic point of view, it is important to continue further research using other various approaches, as the results may differ depending on the factor of timing [
26]. In our case, we used the Cholesky decomposition method. Moreover, the forecast error variance decomposition was computed, which provides the information about the transmission of variations over time; in other words, it shows the dynamic behavior of variables [
27].
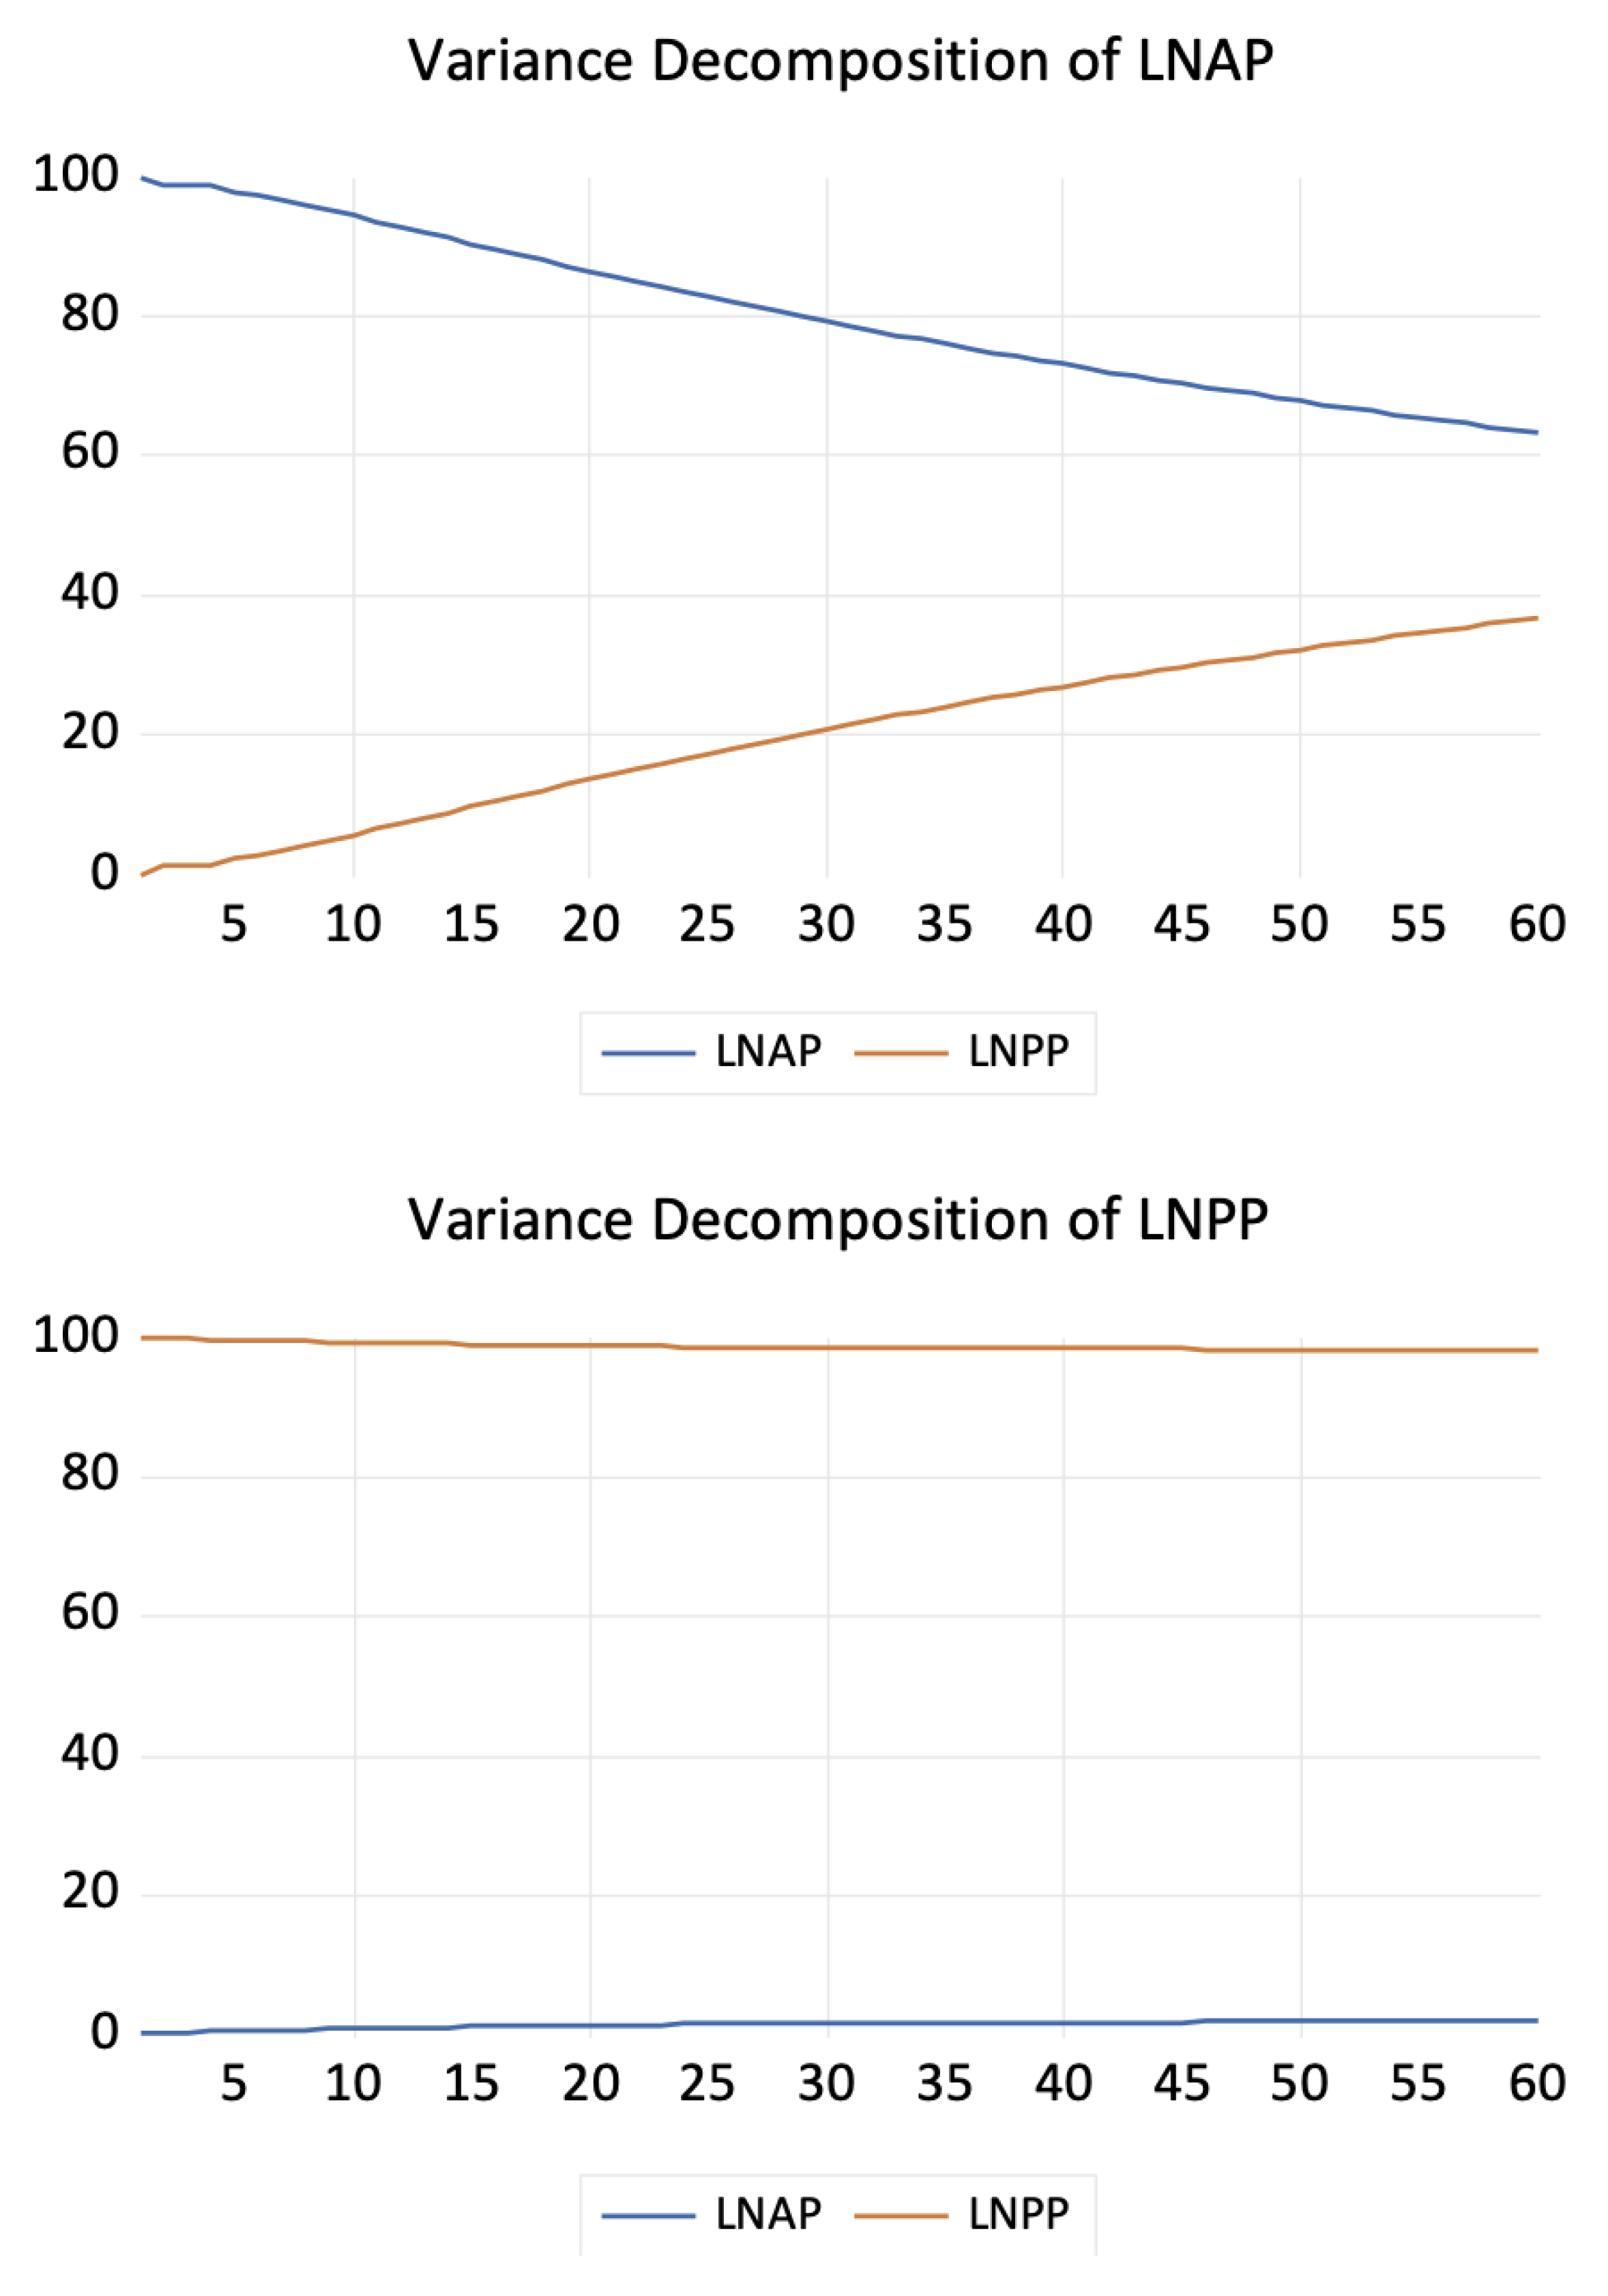
The decomposition of variance shows the interaction between variables, for longer forecast horizons particularly. The prognostic period is 60 months (
Figure 3). In one year (12 periods), LNAP explains 92.79% of the forecast error variance of the 12th period ahead, whereas LNPP explains 7.21% of the forecast error variance of the 12th period ahead in LNPP. The LNPP explains 36.69% of forecast error variance of the 60th month ahead in LNAP and LNAP explains 63.30% of forecast error variance of the 60th month ahead. The forecast error remains constant or increases slightly until the end of the forecast period.
The variable LNPP explains 99.99% of its first period forecast error variance. This explanatory ability of LNPP very slightly decreases until the end of the period of 60 months. The explanatory ability of LNAP is providing an increasing trend. At the end of the forecast horizon, LNPP explains 98.13% of its 60th month ahead of forecast error variance and LNAP explains 1.87% of the 60th period ahead of forecast error variance in LNPP. If longer forecast horizons would have been done, the explanatory ability of variables would change only very slightly.
4. Discussion and Conclusions
The empirical studies apply to the Vector Autoregression Model (VAR) or Vector Error Correction Model (VECM) to a large extent based on an econometric approach. VECM can be considered as an extension of the VAR model, allowing the distinction between short-run and long-run dynamics [
9]. The VECM approach has also been recently used by many authors in the agri-food sector [
3,
4,
9,
10,
15,
16,
28,
29]. The effects of the disease crisis on price developments were investigated by Lloyd et al. [
30], who found by VECM that the Bovine Spongiform Encephalopathy (BSE) crisis had a much higher impact on changes in agricultural prices than on retail prices. The type of commodity, characterized by specific market differences, can also affect the results of price transmission. In their work, Ahn and Lee [
31] focused on the specifics of perishable products. They found out that the perishable character may affect price adjustments and asymmetry patterns in the market vertical.
In this article using cointegration techniques, it was estimated that prices have interdependence. The outcomes indicate that the prices exhibit I(1) series behavior. The existence of an asymmetry in the pork meat market between producer and retail prices was proved, as well as in the Swiss market Abdulai [
14] and in the Czech pig market [
15]. The article’s discoveries are consistent with those of Serra et al. [
32] and Fousekis [
33]. Serra et al. [
32] demonstrated proof of asymmetric price transmission in four significant pork markets in the European Union (EU), while Fousekis [
33] detected a significant level of segmentation in 15 geographically distinct EU markets.
The results of Lim and Ahm [
34] proved the existence of market efficiency for the wholesale market and two types of retail markets in the distributional channel of pork in Korea. Their results show that the policy objective has been achieved in the traditional market due to a less asymmetric price transmission from the wholesale price. Rudinskaya [
15] found the inelastic price transmission of pork ham (input price is not fully transmitted to output price) in the first stage of the market chain with pork in the producer–processor relationship. Then, on the second stage, the elastic price transmission was detected (change in output price is transferred by more than one unit to the price in the previous stage of the pork chain). It seems that the retailer has an impact on LNAP, apparently through the processor.
The economic situation of Czech pig breeders was very difficult in the examined period. Pig breeding and fattening farms continuously reported a negative level of profitability. The support from national and European sources was established to mitigate the negative impact of external factors on the economic outcome of farms and to support their sustainability. At the time of the crisis in the pig sector, in 2018, the possibility to apply for funds to improve economic conditions in pig farming was introduced and allocated funds were significantly increased compared to the previous period. Pig farmers were also provided with EU financial support from the Rural Development Program in the period of 2014–2020. However, an important question is whether the allocated financial resources remained with the primary producers or whether they were transferred vertically to the processors. In the latter case, the support would not fulfill its purpose. Čechura and Šobrová [
4] suggested a long-term simultaneous relationship between agricultural and producer price and proposed that the pork market is characterized by demand-driven behavior. The model also suggests the existence of the oligopsony pig market structure, resulting in the distribution of the political support impact not only for producers but also for processors. Their dataset covers the 1995–2006 period before the financial crisis of 2008/2009. From this time, the Czech market went through many shocks, e.g., financial crisis, African swine fever in 2019, restrictions in 2020. Despite all these shocks, our findings working with datasets of stable years of 2013–2021 (occurring after the financial crisis and prior to the Ukraine war and pig farmers receiving EU financial support) are in line with their conclusions according to the dataset period after the crisis of 2008/2009, as well as with conclusions of Rudinskaya [
15] calculated for the dataset of 2006–2017, before African swine fever in 2019 and the many restrictions in 2020.
Results of the analysis show that there is an existence of the equilibrium relationship in vertical markets (the price of pig slaughter and ham) and this relationship is simultaneous. Furthermore, the decomposition of the variance has been applied for the long time period.
The overall analysis results suggest that the hypothesis of the paper cannot be rejected. The model contains one cointegrating vector in the third alternative on the level of significance of 5% (alternative with an intercept (no trend in the model) in the cointegrating vector and VAR). The response of LNPP to a one standard deviation shock to LNAP reaches long-run equilibrium from approx. 15–20 periods. The responses of LNAP to the unitary innovation in the LNPP shows that the responses are positive in all periods. In the long run, there is a new level of long-run change set up around 0.0015%. The response of LNAP to a one standard deviation shock to LNPP reaches long-run equilibrium from approx. 15–20 periods. In the long run, there is a new level of long-run change set up around 0.003%. Shocks to LNPP will have a positive impact on LNAP both in the short-run and long-run and vice versa.
The explanatory ability of LNPP decreases in favor of the explanatory ability of the variable LNAP, until the end of the 60th period. If longer forecast horizons would have been done, the explanatory ability of variables would change only very slightly. The decomposition of the variance of variable LNAP shows the gradually decreasing trend of the explanatory ability of variable LNAP and the increasing trend of variable LNPP. At the end of the forecast period, LNPP explains 36.69% of the 60th month ahead of the forecast error variance in LNAP and LNAP explains 63.30% of the 60th period ahead of the forecast error variance. That indicates that the pork agri-food market can be described as demand-driven. The study of Utnik-Banaś et al. [
35] investigates price transmission in the EU pork industry using data from Germany, Spain, and France. The authors find that the EU pork market is demand-driven. The study of Trienekens [
36] suggests that price transmission between producers and retailers is uneven. Retail prices respond more quickly to increases in producer prices than to decreases, implying a lack of market competitiveness.
Examination of the price elasticity confirmed that the pork ham suffers by the inelastic price transmission, which means that the change in the LNPP is not fully transmitted to LNAP. The coefficient at LNPP indicates that the market structure is not competitive and implies the price transmission asymmetry. The similar conclusions on the Czech pig meat market were suggested by Čechura and Šobrová [
4], Rudinskaya [
15], and Havlíček et al. [
5]. Furthermore, our findings tend towards the conclusions of [
4,
37] on the oligopsonic type of market.
The presented study contains certain limitations that need to be considered. The interpretation of the results should be done carefully, in particular if it is applied to another type of product. This study was conducted only about the pork ham market. For other products and countries, the conclusions may be different. Modeling of price transmission should take into account the individual conditions of the given market. The conclusions of this research cannot be generalized to other settings. This research was limited by the data as the adequate dataset for both prices was available only since 2013.
Assuming the imperfection of the Czech pig market, the foreigner trade of the input (slaughter pigs) exports and the output (processed product) imports should be considered. The national production covers just around 50% of the consumption and opens up large opportunities to the importers to influence the market.
Changes in consumer prices, however, may develop in a different trend or to a significantly greater extent than expected. Then, it is appropriate to continue research towards the investigation of other consumer price determinants. The inquiry may search whether the consumer prices of pork and products in stores are adequate, and whether the consumer pays a higher price because of the crisis or whether traders misuse their power to increase their margins. Given the structure of the pork market, described at the beginning of the paper, this often-discussed phenomenon can become a reality. The results of this study may contribute to the search for the answer to this question.
The contribution of novelties within the framework of the CAP is especially beneficial for use in setting the balance of the CAP income support measure for agricultural producers and processors of pig meat. Environmental policy increases the burden on farmers, ultimately forcing them to leave the pig production sector. However, the goal of the Czech agricultural policy is to increase the self-coverage of pork consumption from the current 51% to 80% in 2030. Therefore, it is necessary to find a balance that will ensure the long-term sustainability of this sector.
The paper contributes to the analysis of price transmission in the Czech Republic, and opens further topics for future research, e.g., to study price transmission in pork meat in a horizontal way or a comparison of significant changes before and after the war in Ukraine 2022, since data will be available. The findings suggest that the support provided to pig farmers, both from national and EU sources, may have been vertically transferred to processors, which could impact the intended purpose of the support. The insights gained from this study are particularly valuable in the context of the Common Agricultural Policy (CAP) income support measure for agricultural producers and processors of pig meat. Our paper endeavors to provide insights into the extent to which the final consumer price reflects the amplified costs and the contribution of trade margins to the overall increase in consumer prices. These insights could be used by policymakers and industry stakeholders to address the asymmetry in price transmission, potentially by implementing measures to increase market competition and improve price transmission efficiency.


 ,
, 


