Article

Spatiotemporal Evolution and Spatial Convergence Analysis of Total Factor Productivity of Citrus in China

1
College of Economics and Management, Huazhong Agriculture University, Wuhan 430070, China
2
Institute of Horticultural Economics, Huazhong Agriculture University, Wuhan 430070, China
3
Hubei Rural Development Research Center, Wuhan 430070, China
4
College of Business, Yancheng Teachers University, Yancheng 224002, China
5
Institute of Economics, Shanghai Academy of Social Sciences, Shanghai 200235, China
*
Author to whom correspondence should be addressed.
Agriculture 2023, 13(6), 1258; https://doi.org/10.3390/agriculture13061258
Submission received: 12 May 2023 / Revised: 3 June 2023 / Accepted: 15 June 2023 / Published: 16 June 2023

Abstract

:
In this study, the DEA–Malmquist index method was used to measure the total factor productivity of citrus in seven major mandarin-producing provinces and seven major tangerine-producing provinces in China from 2006 to 2020. Moran’s I index was used to test the spatial correlation of total factor productivity of mandarin and tangerine, and its σ convergence and β convergence characteristics were explored using coefficient of variation and spatial panel models. The results show that from the perspective of time series evolution, the growth rate of total factor productivity of mandarin and tangerine in China slowed down year by year after reaching the maximum value in 2008. Technological progress was the main factor affecting the total factor productivity of citrus. The total factor productivity growth of tangerine was more stable than that of mandarin, and the pure technical efficiency index and scale efficiency change index of mandarin and tangerine were not stable. From the perspective of regional differences, the total factor productivity of China’s main citrus-producing provinces all indicated positive growth, showing an increasing trend from east to west. The drivers of growth were mainly technological progress and scale efficiency. The regional differences in total factor productivity growth for mandarin were more obvious than for tangerine. The total factor productivity of mandarin and tangerine showed obvious spatial correlation characteristics; the positive spatial spillover effect was significant; and there were σ convergence, absolute β convergence, and conditional β convergence. Regional disparities in citrus industry development can be more objectively reflected by convergence analysis that takes spatial factors, economic and social factors, and other factors into account.

1. Introduction

China is one of the countries of origin of citrus and is the world’s largest producer and seller of citrus [1]. Citrus agriculture dates back to over 4000 years ago in China. The size of China’s citrus industry has grown steadily since the formation of the People’s Republic of China. According to China’s National Bureau of Statistics database, citrus planting area and production in China reached 2.832 million ha and 51.287 million tons, respectively, in 2020, overtaking apples to become China’s largest fruit in terms of planting area and production. The citrus industry has become a pillar industry in agriculture in the hilly areas, reservoir areas, and underdeveloped areas of southern China [2]. It is critical in raising the revenue of fruit producers and contributing to the reduction in national poverty [3]. However, in comparison to other developed countries, China’s citrus production per unit area has always been relatively low [4]. According to the FAO data, the unit area yield of Chinese citrus in 2020 was 14.88 t/ha, which was lower than the global average of 15.74 t/ha. With the annual increase in citrus planting area and yield in China, improving citrus total factor productivity is a priority due to the sector’s importance to the Chinese economy. Analyzing the total factor productivity of Chinese citrus objectively is an important part of determining the entire production capacity of Chinese citrus. What are the trends in total factor productivity of citrus in China’s primary citrus-producing areas? What has caused the increase in productivity in the citrus industry? Is it due to technological advancements or changes in efficiency? What are the differences in citrus TFP growth in different regions? Is there a spatial relationship between citrus TFP and region? Is the regional gap in citrus TFP narrowing? The answers to these questions will contribute to a thorough knowledge of the spatiotemporal evolution process of China’s citrus total factor productivity, and such knowledge will have major theoretical and practical implications for encouraging the citrus industry’s healthy and sustainable development in China.
Total factor productivity (TFP) refers to the portion of output growth minus the contribution of factor growth, and it is a comprehensive statistic employed in the neoclassical school’s economic development theory to evaluate the contribution of pure technological improvement in production [5]. According to existing research, TFP measurement methods can be classified as parametric or non-parametric. Parametric methods include the Solow residual method, the random frontier production function method, and the trans-log production function method, among others, while non-parametric methods include the Malmquist index method, the Tornqvist index method, and the undesirable slacks-based measurement (SBM) method. Po et al. analyzed the productivity growth in China’s agricultural sector over the period 1990–2003 [6]. Huang et al. measured the agricultural green TFP in China from 1998 to 2019 [7]. Namdari et al. calculated the energy use efficiency for citrus in Iran [8]. Xu et al. calculated the TFP of citrus in China [9]. He et al. found that the implementation of sustainable development policies has increased citrus TFP in China [10]. There are some Chinese researchers who used the DEA–Malmquist index method to measure the TFP of China overall and of some major citrus-producing areas and analyzed the trend of change [11,12,13]. These studies’ conclusions are not always consistent due to diverse study locations and time lengths. However, one common feature is that they have not systematically analyzed the spatiotemporal evolution and convergence of citrus TFP. Based on the pioneering study of Baumol, Barro, and Sala-i-Martin on the convergence of economic growth [14,15], more studies on the convergence of agricultural TFP are being conducted. Many scholars have analyzed the convergence of agricultural production efficiency in different countries [16,17,18,19,20].
Although there have been many studies on citrus TFP, agricultural TFP measurement, and convergence analysis, there is still room for research to be expanded. First, the present literature focuses on citrus TFP measurement and analysis, ignoring the spatial link between regions in terms of citrus TFP. Second, research studies have focused mostly on the convergence analysis of TFP in agriculture and selected agricultural products, but there is a dearth of research on the convergence analysis of TFP in citrus.
In light of this, this study selects Chinese citrus production cost and revenue data from 2006 to 2020, measures the TFP of citrus in China using the DEA–Malmquist index method, and analyzes its spatial and temporal variation characteristics and patterns. The Moran’s I index is used to evaluate the spatial correlation of TFP of citrus, and the neoclassical economic growth convergence theory is combined with spatial economics. Furthermore, the coefficient of variation is employed, and a spatial panel model is developed to investigate the σ convergence and β convergence characteristics of the TFP of citrus.

2. Materials and Methods

2.1. Materials

The output variables were chosen from the output value of citrus main products; the input variables were chosen from labor costs, land costs, fertilizer costs, pesticide costs, and other citrus costs. This could assure the consistency of material costs while also lowering the indicators based on the inclusion of diverse types of expenditures. In order to avoid omitting important control variables, we chose the following as the control variables: level of economic development, measured using GDP per capita; mechanization level, measured using total mechanical power; fruit cultivation structure, measured based on the proportion of citrus planting area to total fruit planting area in each province; agricultural geographic agglomeration, measured based on the share of citrus cultivation area in each province to the national citrus cultivation area; agricultural financial support to agriculture, defined as the proportion of total financial expenditure on agriculture to total financial expenditure in each province; and urbanization rate, defined as the number of urban residents divided by the total population at the end of the year in each province. Based on data availability and the fact that the National Compilation of Cost and Benefit Information on Agricultural Products divides citrus and tangerine, this study divided citrus into two categories, mandarin and tangerine, and selected cost and benefit-related data from 2006 to 2020 for seven citrus-producing provinces (districts and cities), respectively. The data came from the National Agricultural Cost–Benefit Information Compilation in China, which ran from 2006 to 2020. In prior years, the data came from the National Compilation of Cost and Benefit Information of Agricultural Products, the National Bureau of Statistics, the International Monetary Fund database, and the China Population and Employment Statistical Yearbook. Missing data were interpolated using the moving average method and the trend forecasting method, and all variables involving prices were deflated using the corresponding fixed-base price indices.

2.2. Methods

2.2.1. Measurement of TFP

The Malmquist index method was proposed by Malmquist in 1953 [21], and Cave et al. first used it as a production efficiency function; this method was then combined with the DEA theory to create what is referred to as the DEA–Malmquist index method [22]. Fare et al. updated the DEA–Malmquist index method by incorporating technical efficiency, which is divided into technical change and efficiency change [23]. Many scholars favor this method because it employs distance functions to construct the optimal frontier, employs linear programming, does not require a specific functional form, and can decompose TFP changes. As a result, using the DEAP2.1 software and the following equations, this study measured and decomposed the DEA–Malmquist index for Chinese citrus production based on constant payoffs of scale and output orientation:
M i ( x t + 1 ,   y t + 1 ;   x t ,   y t ) = [ D i t ( x t + 1 ,   y t + 1 ) D i t ( x t ,   y t ) × D i t + 1 ( x t + 1 ,   y t + 1 ) D i t + 1 ( x t ,   y t ) ] 1 2 = D i t + 1 ( x t + 1 ,   y t + 1 ) D i t ( x t ,   y t ) [ D i t ( x t + 1 ,   y t + 1 ) D i t + 1 ( x t + 1 ,   y t + 1 ) × D i t ( x t ,   y t ) D i t + 1 ( x t ,   y t ) ] 1 2 = E F F C H ( x t + 1 ,   y t + 1 ; x t ,   y t ) × T E C H ( x t + 1 ,   y t + 1 ;   x t ,   y t ) = P E C H × S E C H × T E C H
In Equation (1), xt and yt represent the input and output vectors of the citrus industry in the period t, respectively; D i t is the distance function; Mi(TFP) is the total factor productivity index; EFFCH is the technical efficiency change index; and TECH is the technological progress change index. The technical efficiency change index (EFFCH) can be further decomposed into pure technical efficiency index (PECH) and scale efficiency change index (SECH). A value of EFFCH greater than 1 represents an increase in technical efficiency, and a value of TECH greater than 1 represents a technological advancement or innovation; A value of PECH greater than 1 represents an increase in the level of technology, and vice versa; and a value of SECH greater than 1 represents a scale of production operation close to the optimal scale of production, and a scale deterioration if it is lower than 1.

2.2.2. Spatial Correlation Index

The spatial correlation index, which is frequently expressed as Moran’s I index, can be used to examine if there is spatial autocorrelation in the TFP of citrus throughout the entire space, and its calculation formula is as follows:
M o r a n s   I = n = 1 N m = 1 N ω n m ( x n x ¯ ) ( x m x ¯ ) S 2 n = 1 N m = 1 N ω n m
where xn and xm are the index values of variable x on the geographical unit of region n and region m, respectively; x ¯ is the average of the index values in each region; ωnm is the spatial weight matrix; ωnm = 1 when n and m provinces are contiguous, and 0 otherwise; S2 is the sample variance; and N is the total number of measured areas. In general, the range of the Moran’s I index is −1 to 1. An index greater than 0 indicates positive spatial autocorrelation, and the closer the index value is to 1, the stronger the spatial correlation and clustering of similar attributes. An index less than 0 indicates negative spatial autocorrelation, and the closer the index value is to −1, the stronger the spatial correlation and agglomeration of different attributes. An index close to 0 indicates that the spatial distribution is random and there is no spatial autocorrelation [24].

2.2.3. Convergence Model

There are three common convergence models: σ convergence, absolute β convergence, and conditional β convergence. The convergence of σ reflects a decreasing trend in the deviation of the sample values in each region over time. This study aimed to investigate whether the TFP of citrus tends to be in a horizontal state with the passage of time. If the convergence coefficient of σ decreases gradually over time, the growth of citrus TFP has σ convergence. In this study, the coefficient of variation was used to measure the convergence of σ, and the formula is as follows:
σ t = n = 1 N ( T F P n , t T F P t ¯ ) 2 / N T F P t ¯
TFPn,t is the citrus TFP of province n in year t; T F P t ¯ is the average of the TFP for all provinces in year t; and N is the number of major citrus-producing provinces.
Furthermore, β convergence means that the growth rate disparity in citrus TFP between regions gradually narrows over time, eventually settling at a stable growth rate. Meanwhile, convergence can be classified as absolute β convergence or conditional β convergence. Absolute β convergence means that citrus TFP tends to converge across regions without taking into account factors that can have a significant impact on citrus TFP. The formula for absolute β convergence is as follows:
ln ( T F P n , t + 1 T F P n , t ) = α + β ln ( T F P n , t ) + μ n + η t + ε n , t
ln T F P n , t + 1 T F P n , t is the growth rate of citrus TFP of n province in t + 1 period. β is the coefficient of convergence, with a significant negative β indicating that the citrus TFP is showing absolute β convergence, and the convergence speed V = ln β 1 / T . μ n ,   η n ,   and   ε t are the area effect, time effect, and random disturbance terms, respectively.
Considering the spatial correlation of citrus TFP and using the absolute β convergence model, the following three spatial measurement models were introduced: spatial lag model (SAR), spatial error model (SEM), and spatial Durbin model (SDM). The SDM model can be regarded as the general form of the other two models, and the spatial absolute β convergence formula is as follows:
S A R : ln ( T F P n , t + 1 T F P n , t ) = α + β ln ( T F P n , t ) + ρ m = 1 N ω n m ln ( T F P n , t + 1 T F P n , t ) + μ n + η t + ε n , t
S E M : ln ( T F P n , t + 1 T F P n , t ) = α + β ln ( T F P n , t ) + μ n + η t + u n , t ; u n , t = λ m = 1 N ω n m u n , t + ε n , t
S D M : ln ( T F P n , t + 1 T F P n , t ) = α + β ln ( T F P n , t ) + ρ m = 1 N ω n m ln ( T F P n , t + 1 T F P n , t ) + γ m = 1 N ω n m ln ( T F P n , t ) + μ n + η t + ε n , t
ρ is the spatial lag coefficient, representing the effect of the growth rate of citrus TFP in neighboring provinces on a province. λ is the space error coefficient and represents the space effect in the random perturbation term εn,t. γ is the spatial lag coefficient of the independent variable, representing the influence of the citrus TFP of neighboring provinces.
The conditional β convergence model adds a series of control variables on the basis of the absolute β convergence model to examine whether citrus TFP has a convergence trend after controlling for the effects of factors that may have an important impact on citrus TFP. The formulae for conditional β convergence and spatial conditional β convergence are as follows:
ln ( T F P n , t + 1 T F P n , t ) = α + β ln ( T F P n , t ) + δ X n , t + 1 + μ n + η t + ε n , t
S A R : ln ( T F P n , t + 1 T F P n , t ) = α + β ln ( T F P n , t ) + ρ m = 1 N ω n m ln ( T F P n , t + 1 T F P n , t ) + δ X n , t + 1 + μ n + η t + ε n , t
S E M : ln ( T F P n , t + 1 T F P n , t ) = α + β ln ( T F P n , t ) + δ X n , t + 1 + μ n + η t + u n , t               u n , t = λ m = 1 N ω n m u n , t + ε n , t
S D M : ln ( T F P n , t + 1 T F P n , t ) = α + β ln ( T F P n , t ) + ρ m = 1 N ω n m ln ( T F P n , t + 1 T F P n , t ) + γ m = 1 N ω n m ln ( T F P n , t ) + δ X n , t + 1 + μ n + η t + ε n , t

3. Spatial and Temporal Evolution of Citrus TFP

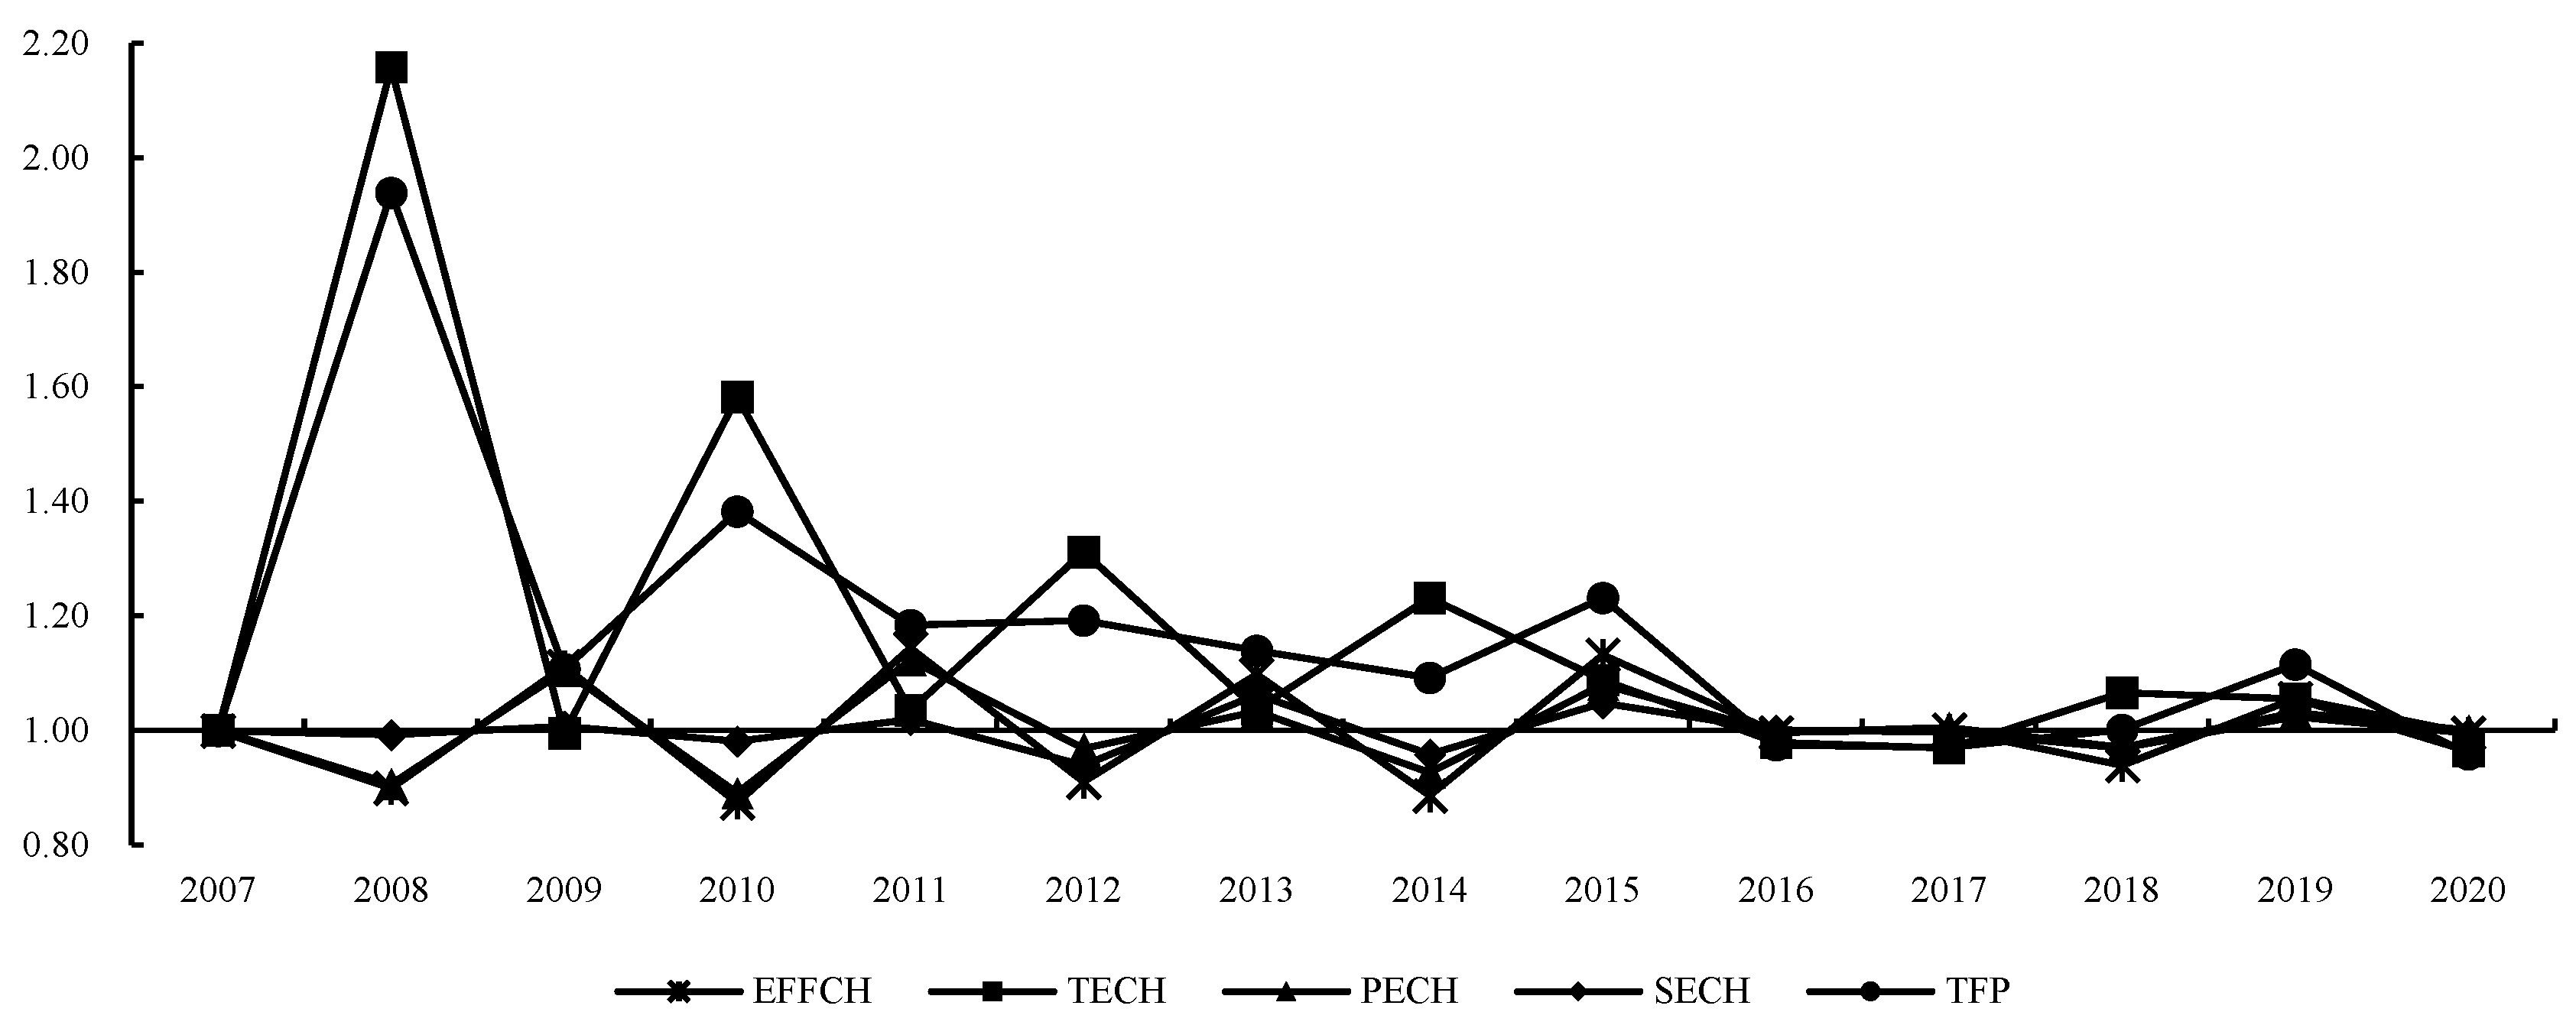
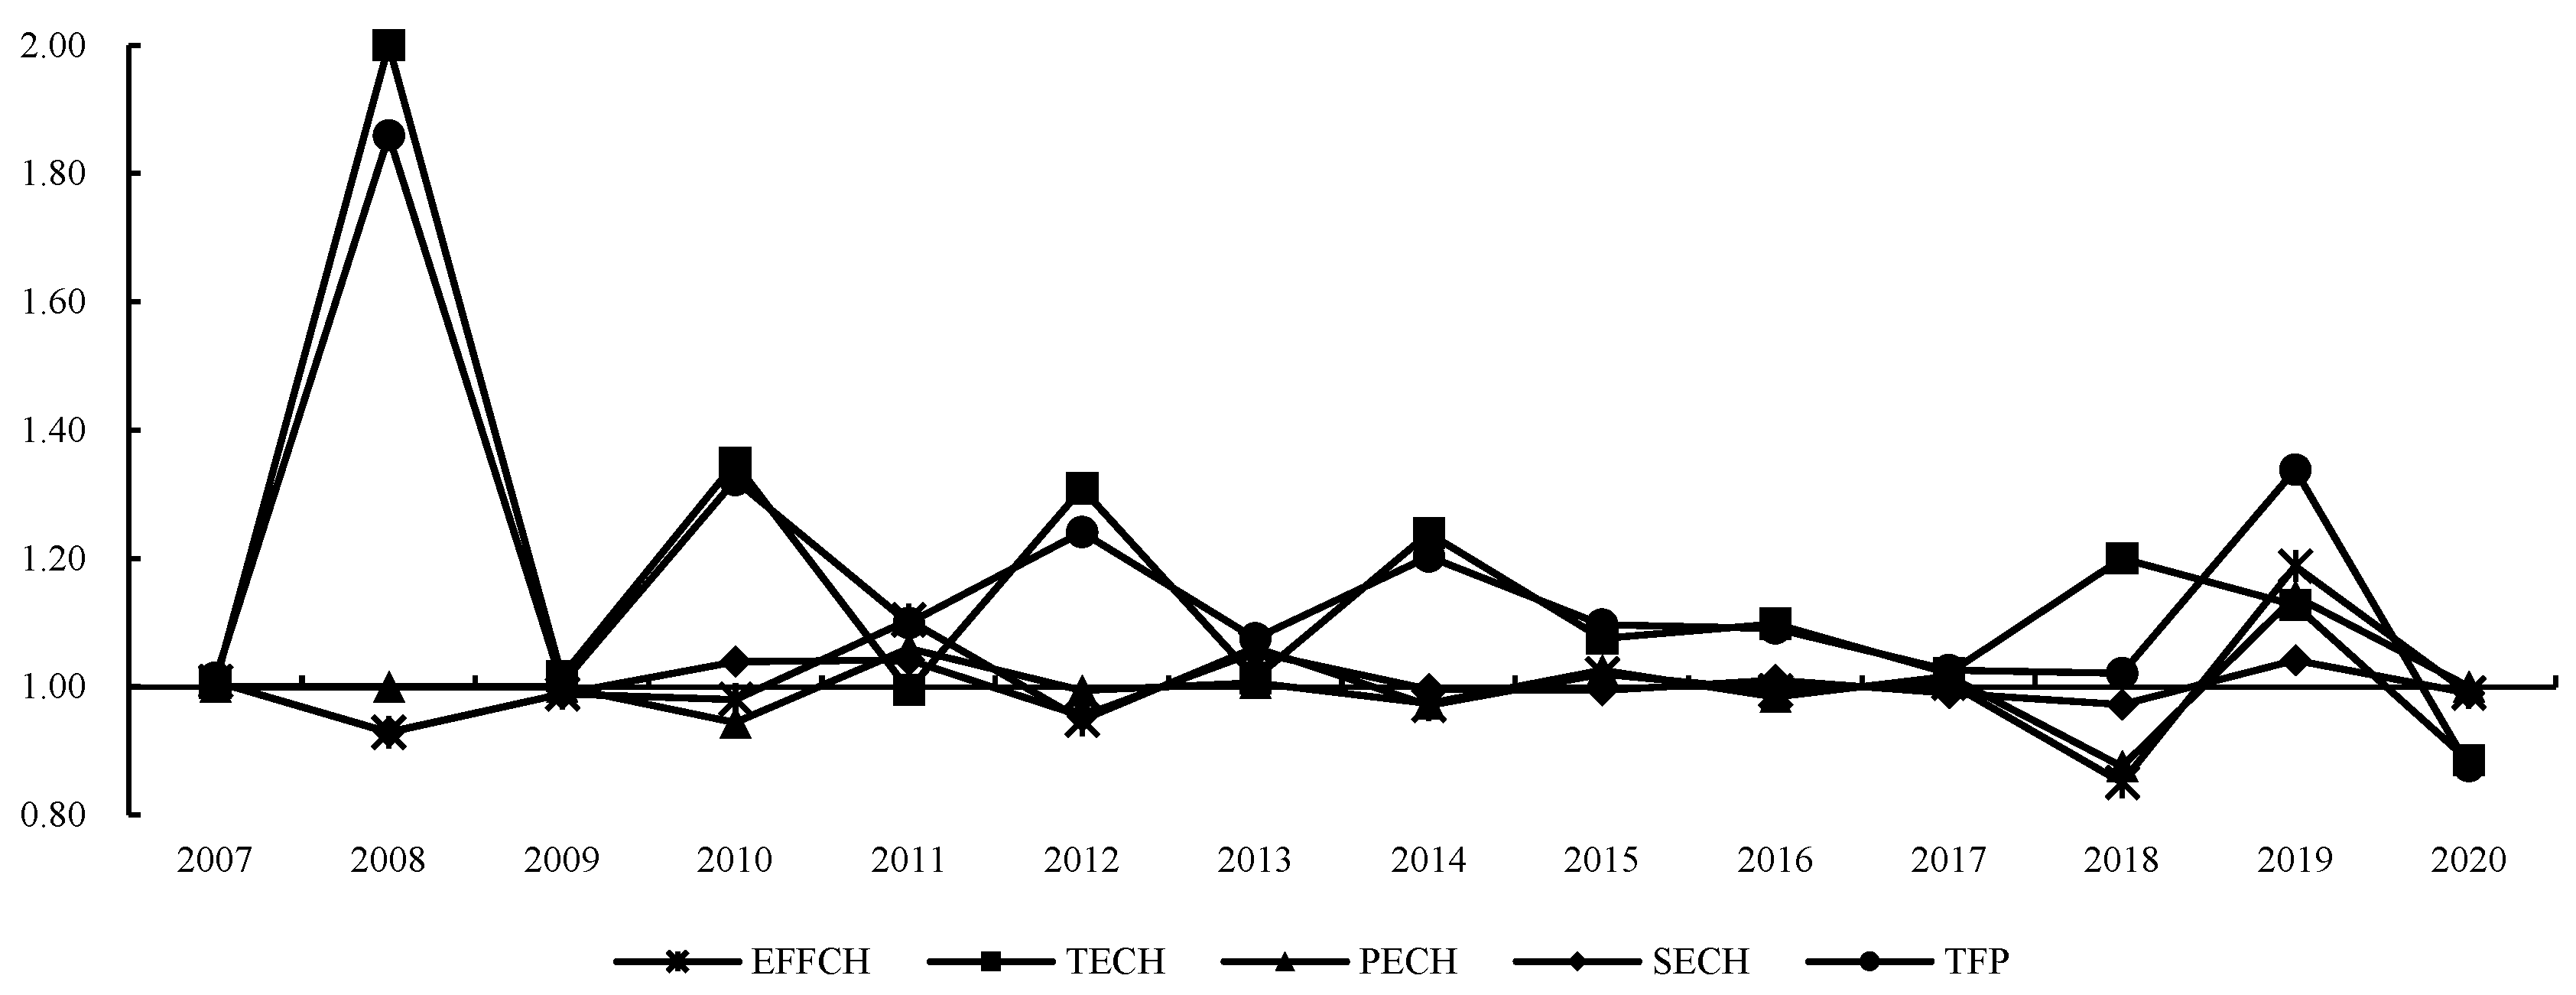
3.1. Time Series Evolution of Citrus TFP

Figure 1 and Figure 2 depict the changes in TFP and the deconstruction of mandarin and tangerine production in China from 2007 to 2020. As shown in Figure 1, mandarin’s TFP shows a fluctuating downward trend. It was 1 in 2007, increased to a maximum of 1.939 in 2008, and then gradually declined in the years that followed; specifically, the TFP of mandarin dropped to 1.107 in 2009; rebounded to 1.382 in 2010; fluctuated between 1.092 and 1.231 in 2011 to 2015; experienced a negative growth in 2016, with the TFP falling to 0.970 in 2017; rebounded to 1.001 in 2018 and further improved to 1.115 in 2019; and then fell again to 0.958 in 2020. Compared to the technological progress change (TECH), the TFP decreased while the TECH increased in 2014, and the TFP increased while the TECH decreased in 2019. The trends of the changes in these two indexes in other years are the same, with some differences in the magnitude of the increase or decrease of the changes. Thus, it can be concluded that there is a driving effect of mandarin’s technological progress change (TECH) on the growth in TFP. The patterns of fluctuation in the technical efficiency change index (EFFCH), the pure technical efficiency change index (PECH), and the scale efficiency change index (SECH) are highly similar, exhibiting both increases and decreases. This suggests that the pure technical efficiency change index (PECH) and the scale efficiency change index (SECH) are the primary determinants of fluctuations in the overall technical efficiency change (EFFCH).
Figure 1 and Figure 2 reveal that the variations in total TFP and the deconstruction of its components for mandarin and tangerine are highly similar. Specifically, the fluctuations in the TFP and technological progress change (TECH) of tangerine are the most conspicuous, and their trends follow a similar pattern. In comparison, the TFP of tangerine is marginally higher than that of mandarin, recording a value of 1.014 in 2007, peaking at 1.859 in 2008, declining to 1.005 in 2009, recovering to 1.322 in 2010, and, subsequently, exhibiting a gradual downward fluctuation between 1.021 and 1.241 from 2011 to 2018, before increasing to 1.338 in 2019. This trend deviates from what is observed for mandarin. When comparing the technological progress change (TECH), it can be observed that, apart from the year 2016 when the technological progress change (TECH) increased and the TFP decreased, the trends in both indexes are highly similar across the years. Moreover, the impact of technological progress change (TECH) on the TFP growth of tangerine is more pronounced than the impact seen in mandarin. The technical efficiency change (EECH), the pure technical efficiency change (PECH), and the scale efficiency change (SECH) exhibit similar patterns of increase and decrease, suggesting that changes in pure technical efficiency change (PECH) and scale efficiency change (SECH) are also influential drivers of technical efficiency change (EECH) for tangerine.
The growth in TFP and the deconstruction of its components for mandarin and tangerine production in China exhibit four key characteristics. Firstly, the TFP and the technological progress change (TECH) show similar patterns for both mandarin and tangerine, indicating that technological progress plays a vital role in driving the growth in TFP. Secondly, the TFP for both mandarin and tangerine peaked in 2008 before fluctuating downwards. This might be attributed to the initiation of the national citrus industry’s technological system in 2007 and the subsequent innovation chain that emerged around the citrus industry’s production chain. This promoted the level of citrus technological progress in China. However, over time, as technology was internalized and breakthroughs became more challenging, the driving effect of technological progress weakened, leading to the fluctuation in TFP for both mandarin and tangerine.
Thirdly, the growth in TFP for tangerine is more stable compared to the growth in TFP for mandarin. Mandarin’s TFP exhibited negative growth in 2016, 2017, and 2020, whereas tangerine’s TFP only exhibited negative growth in 2020 due to the COVID-19 pandemic. This is because tangerine is more prevalent in Chinese citrus cultivation and shows stronger research capabilities than mandarin. Fourthly, the pure technical efficiency change (PECH) and the scale efficiency change (SECH) for both mandarin and tangerine fluctuate, indicating that the actual technical level and planting scale of Chinese citrus planting process are unstable. This may be attributed to the fact that citrus fruits are mainly grown in mountainous areas in China, and the proportion of continuous centralized planting is low. Additionally, citrus yellow dragon disease is a constant threat to production, making it difficult for technology to be implemented effectively and for resource allocation to reach a reasonable state.

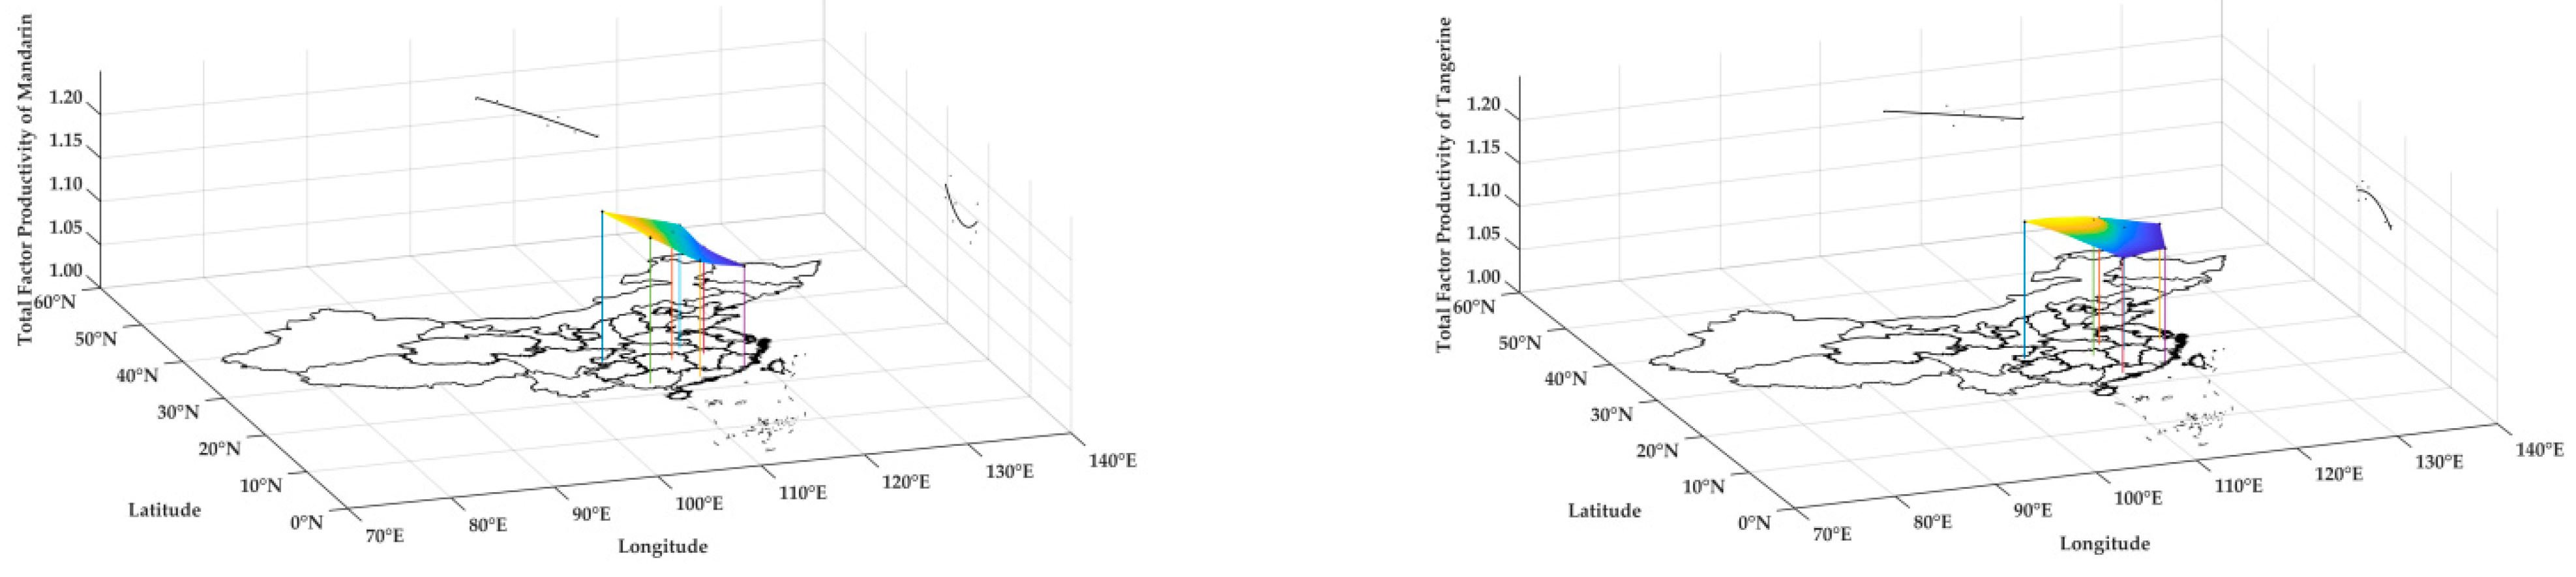
3.2. Regional Differences in TFP for Citrus

Regional differences in natural environment and resource endowment have resulted in variations in the TFP and its specific components for mandarin and tangerine among different provinces in China. Comparing the average TFP and its components in different provinces is of great practical significance for identifying the key factors that determine regional differences in citrus output and for promoting regional synergistic development of the citrus industry. Table 1 presents the average TFP and its composition for the major mandarin- and tangerine-producing provinces in China from 2007 to 2020.
Table 1 highlights several key characteristics that contribute to the regional divergence in TFP for China’s citrus industry. First, the average TFP of the major mandarin- and tangerine-producing provinces is positive, indicating a growth trend in the citrus industry. The province with the highest TFP growth rates for both mandarin and tangerine is Chongqing, while Fujian has the lowest TFP growth rates for both, although its rates are still positive.
Second, the regional divergence in mandarin’s average TFP growth is more pronounced than that of tangerine. Chongqing has the highest mandarin TFP growth rate, while Fujian has the lowest. This suggests that the industrial development of tangerine in China is more balanced compared to mandarin.
Third, from a geographical perspective, the average TFP of mandarin and tangerine tends to increase from east to west, reflecting an “east citrus to west” trend. The central and western regions have relatively more arable land resources, fewer non-farming employment opportunities, and higher production economic efficiency, thus resulting in a higher TFP. Additionally, the main citrus-producing areas in the southeast coast are more susceptible to Huanglong disease, resulting in a lower TFP.
Fourth, technological progress change (TECH) and scale efficiency change (SECH) are the primary factors affecting the TFP growth of each citrus-producing province. The growth rate of technological progress change (TECH) is highest in Chongqing for mandarin and tangerine, while the province’s scale efficiency change (SECH) growth rates are negative, indicating the importance of technological progress in TFP growth but also highlighting the need for optimizing production scale. In contrast, the growth rate of technological progress change (TECH) in Zhejiang for tangerine is lower than that of Guangdong, but the growth rate of scale efficiency change (SECH) is higher, leading to a higher TFP due to the optimization of production scale.
To gain further insight into regional differences in TFP in China’s citrus industry, spatial distribution trends of TFP were analyzed using the Matlab 2021b software. The results are presented in Figure 3. The analysis revealed significant regional differences in the spatial distribution of TFP for both mandarin and tangerine, indicating obvious non-equilibrium characteristics. In terms of fitting surfaces, mandarin and tangerine are different. The TFP of Chinese mandarin shows a spatial distribution pattern of high in the northwest, depressed in the center, and low in the southeast. The TFP of Chinese tangerine shows a spatial distribution pattern of high in the northwest, convex in the middle, and low in the southeast. This is closely related to the acreage and research strength of both. In terms of fitting curves, in the east–west direction, both mandarin and tangerine show a trend of high in the east and low in the west, which is the same as the trend of “east citrus to west”. In the north–south direction, mandarin shows a “U” shape, suggesting that the TFP of Chinese mandarin in the northern and southern regions is slightly higher than that in the central region during the same period. On the contrary, tangerine shows an inverted “U” shape, suggesting that the TFP of Chinese tangerine in the northern and southern regions is slightly lower than that in the central region during the same period.

3.3. Spatial Correlation Analysis of Citrus TFP

We employed the Stata software to compute global Moran’s I indices for both mandarin and tangerine based on their TFP panel data spanning from 2007 to 2020. Furthermore, we tested the significance level of the Moran’s I indices. The findings are presented in Table 2.
Table 2 shows that there is a positive spatial correlation in the TFP of mandarin in China from 2010 to 2013, and the global Moran’s I index tends to increase over time. This indicates that the spatial correlation of mandarin’s TFP in China has increased during the study period. The global Moran’s I index of tangerine TFP is also positive and significant except for some years, suggesting that China’s tangerine TFP also has a positive spatial correlation and the growth of tangerine TFP in neighboring provinces has gradually converged. Although the spatial correlation of China’s citrus TFP has some volatility, there is an overall positive spatial correlation, indicating that a positive spatial spillover effect has gradually formed. This effect has become a new development trend, which highlights the importance of cooperation and driving effect at the spatial level.
It is essential to consider spatial factors when conducting the β convergence test since it cannot be assumed that each citrus-producing province is independent of each other. Neglecting the spillover effects of neighboring producing provinces on the convergence of citrus TFP could lead to biased convergence test results. Therefore, taking into account spatial factors is crucial to avoid such biases.

4. Convergence Analysis of TFP of Citrus

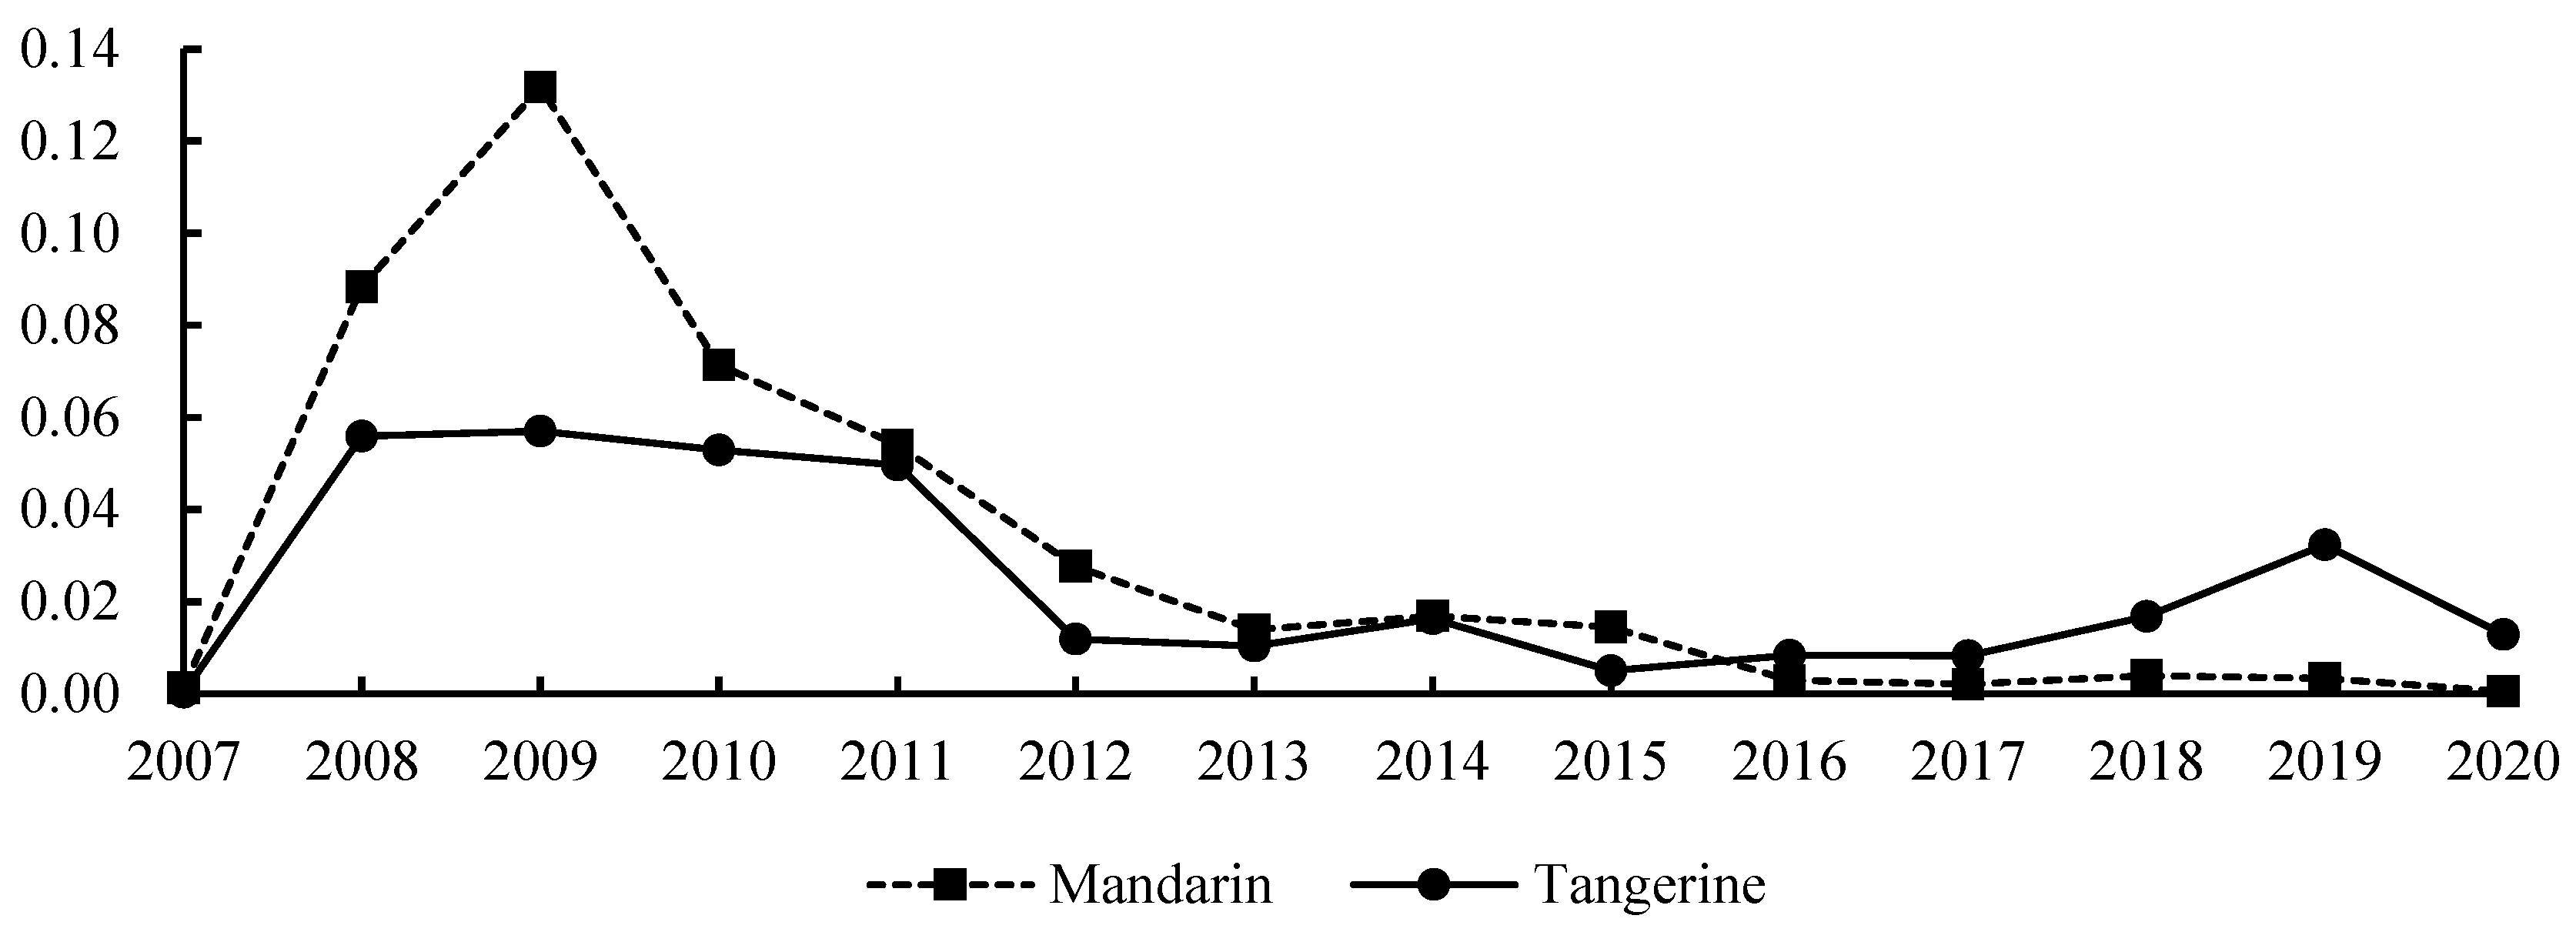
4.1. σ Convergence Test Result Analysis

As depicted in Figure 4, the σ value of the TFP of mandarin shows an increasing trend from 2007 to 2009, followed by a decreasing trend from 2009 to 2015, and eventually reaching its lowest value of 0.0005 in 2020, indicating that there is σ convergence in the TFP of mandarin. Similarly, the σ value of TFP of tangerine shows an increasing trend from 2007 to 2009 and then decreases steadily from 2009 to 2012. Although the σ value of TFP of tangerine increases in some years during the study period, the overall trend shows σ convergence. In summary, both mandarin and tangerine TFP values show σ convergence in China, suggesting that the disparities in TFP among the main producing province have gradually decreased over time.

4.2. Absolute β Convergence Test Result Analysis

Four models were used to estimate the absolute β convergence of TFP of mandarin and tangerine in China. These models included the absolute β convergence model (OLS), the spatial lag model (SAR), the spatial error model (SEM), and the spatial Durbin model (SDM). Additionally, a two-way fixed effects model was used to control for time and region effects during estimation. As shown in Table 3, the results indicate that there is significant absolute β convergence for both mandarin and tangerine TFP in China. The absolute β convergence coefficients of all models for both mandarin and tangerine are negative and pass the significance test at the 1% level, demonstrating a “catching-up effect” between the lower-producing provinces and the higher-producing provinces.
Moreover, the ρ and γ of all models are positive and pass the significance test at the 1% level, indicating that the TFP of citrus in the main producing provinces is simultaneously affected by the positive spatial spillover effect of citrus TFP and the TFP growth rates in other regions. Therefore, the spatial spillover effect between main producing provinces cannot be ignored, and the spatial interaction between neighboring main producing provinces needs to be considered.
Additionally, when spatial factors are considered, the convergence speed of both mandarin and tangerine TFP is significantly faster. The absolute β convergence rate of mandarin TFP increases to 16.9%, 4.4%, and 4% and that of tangerine TFP increases to 8.6%, 3.9%, and 4%. This suggests that cross-regional flows of labor, land, and capital among the main citrus-producing provinces have enhanced the mutual influence of neighboring citrus-producing provinces and increased the spatial convergence effect.
However, there is a difference in the convergence speed of mandarin and tangerine TFP with the addition of spatial factors. The spatial lag model (SAR) and the spatial error model (SEM) estimate the convergence rate of mandarin TFP to be 16.9% and 4.4%, respectively, which values are both higher than that of tangerine at 8.6% and 3.9%. This may be due to differences in economic development, mechanization level, fruit cultivation structure, agricultural geographic agglomeration, financial support for agriculture, and urbanization rate in each region. Therefore, further conditional β convergence analysis is needed to account for these differences.

4.3. Conditional β Convergence Test Result Analysis

Table 4 presents the results of the conditional β convergence analysis of TFP for mandarin and tangerine, using the same models as in the absolute β convergence analysis. The results indicate that there is significant conditional β convergence for both mandarin and tangerine TFP in China. Even after controlling for various economic and social factors, such as economic development level, mechanization level, fruit cultivation structure, agricultural geographic agglomeration, financial support for agriculture, and urbanization rate, the conditional β convergence coefficients of all models for both mandarin and tangerine remain statistically significantly negative at the 1% level, suggesting that the “catch-up effect” of TFP still exists. Additionally, the TFP values of citrus in the whole country and in the main producing provinces continue to converge to a uniform steady-state equilibrium value in the long run.
Consistent with the absolute β convergence analysis, the ρ and γ values of all models are positive and significant at the 10% level, indicating that the growth in TFP for mandarin and tangerine is not only influenced by their initial levels in a given region, but also by the positive spatial spillover effects of TFP and growth rates in neighboring regions. Furthermore, compared to the absolute β convergence analysis, the β convergence rates estimated by all models are reduced in the conditional β convergence analysis. Specifically, the convergence rates of mandarin and tangerine β coefficients estimated by the spatial lag model (SAR) decrease by 12.9% and 4.4%, respectively, while the decreases in the other models are minimal. This suggests that the control variables used in the analysis are effective and scientifically reasonable.
Finally, after considering the control variables, the convergence rate difference between mandarin and tangerine β coefficients estimated by each model is reduced, indicating that the conditional β convergence analysis takes a more comprehensive set of factors into consideration and produces more reasonable results than the absolute β convergence analysis. Overall, the results suggest that various economic and social factors play an important role in explaining the differences in TFP between regions, and that spatial spillover effects should be taken into account when designing policies to promote regional development and reduce regional disparities in citrus production.

5. Conclusions and Policy Implications

5.1. Conclusions

In this study, we used data on the production costs and revenues of Chinese citrus from 2006 to 2020 and the DEA–Malmquist index method to calculate the TFP and its specific components for citrus production in China overall and in its major producing provinces. We analyzed the spatiotemporal evolution characteristics of Chinese citrus TFP and used Moran’s I index and spatial convergence model to investigate the spatial correlation and convergence of citrus TFP. The main research findings are listed below.
First, from the perspective of temporal evolution, the change in the trend of Chinese citrus TFP from 2007 to 2020 is basically consistent with technological progress change (TECH), and technological progress is the main factor affecting citrus TFP. The growth rate of Chinese citrus TFP reached its maximum in 2008 and has been slowing down year by year. There are some differences in the TFP between mandarin and tangerine, with the former showing more stability in growth. The unstable pure technical efficiency change (PECH) and scale efficiency change (PECH) due to the high proportion of small-scale planting and the spread of diseases and pests, such as the Huanglong disease, have limited the growth in citrus TFP.
Second, from the perspective of regional differences, the TFP in major producing provinces have all increased, with Chongqing having the highest TFP of citrus. The regional differences in TFP growth for mandarin are more significant than for tangerine, which is related to the development of Chinese citrus with mandarin as the main product. Influenced by the flow of production factors and the Huanglong disease, the TFP of mandarin and tangerine shows an increasing trend from east to west, which is consistent with the trend of “citrus moving westward” in the production layout of Chinese citrus. The main sources of TFP growth for each major producing province of citrus are technological progress and scale efficiency.
Third, from the perspective of convergence characteristics, Chinese citrus TFP exhibits both σ convergence, absolute β convergence, and conditional β convergence. In terms of σ convergence, the σ value of citrus TFP shows a significant downward trend overall. In terms of absolute β convergence, the TFP of citrus in each major producing province is simultaneously affected by the positive spatial spillover effect of TFP and the growth rates of TFP of citrus in other regions, and the introduction of spatial effects into the convergence model significantly accelerates the convergence speed of mandarin and tangerine TFP, with mandarin having a higher convergence speed than tangerine. In terms of conditional β convergence, after adding the control variables, the convergence and positive spatial spillover effects of TFP of mandarin and tangerine are still significant, but the convergence speed decreases, and the difference in β convergence speed between mandarin and tangerine narrows.

5.2. Policy Implications

First of all, there is a need to further promote the national citrus industry’s technological system construction; increase scientific research investment in citrus breeding, planting, and processing; develop advanced and applicable technology according to the natural environment and resource endowment of each citrus-producing province; and improve the TFP of citrus by promoting technological progress. There is also a need to cultivate and develop new agricultural business entities; promote moderate-scale operation; and gradually form a new agricultural business system based on family contracting, with large professional households, family farms, farmers’ cooperatives, and leading agricultural industrialized enterprises as the backbone and other organizational forms as the supplement, while strengthening the prevention and control of citrus pests and diseases, such as the Huanglong disease, to improve the technical efficiency and scale efficiency of Chinese citrus production.
Additionally, using the positive spatial spillover effect of TFP of citrus, there is a need to increase the learning opportunities of underdeveloped areas of citrus industry development from developed areas; promote new technologies, such as labor-saving cultivation and water–fertilizer integration in advanced areas, through technology and management experience exchange; improve orchard mechanization and give full play to the role of radiation demonstration in advanced citrus-planting areas, while driving the latter development with the former development; and promote overall regional coordination for healthy and sustainable development.
Finally, the convergence effect of TFP of citrus should be valued; the allocation of scientific and technological inputs among citrus production regions should be optimized; regional differences should highlighted while the existence of cross-regional flows of factors, such as labor, land, and capital, should be strengthened; and institutional guarantees should be provided for effective cross-regional cooperation to provide conditions for narrowing the regional gap in the development of the citrus industry.

Author Contributions

Conceptualization, Y.G.; methodology, Y.G. and Y.D.; software, F.L.; validation, Q.L.; formal analysis, F.L.; resources, Y.G.; data curation, F.L. and Q.L.; writing—original draft preparation, Y.G.; writing—review and editing, Y.G. and Q.L.; visualization, Y.G. and Y.D.; supervision, C.Q.; project administration, C.Q.; and funding acquisition, C.Q. All authors have read and agreed to the published version of the manuscript.

Funding

This research was funded by the China Agriculture Research System (CARS-26-06BY); the Major Consulting Project of Jiangxi Research Institute for the Development Strategy of China Engineering Science and Technology (2022-DFZD-37); Major Science and Technology Special Program of Yunnan Provincial Science and Technology Department (202102AE090020).

Institutional Review Board Statement

Not applicable.

Data Availability Statement

The data presented in this study are available from the first author upon request.

Conflicts of Interest

The authors declare no conflict of interest.

References

  1. Deng, X.X. The development trend of citrus industry and the adjustment of citrus variety structure in Guilin. South. Hortic. 2020, 31, 1–4. (In Chinese) [Google Scholar]
  2. Qi, C.J.; Gu, Y.M.; Zeng, Y. Progress of citrus industry economy in China. J. Huazhong Agric. Univ. 2021, 40, 58–69. (In Chinese) [Google Scholar]
  3. He, Y.; Li, Z.P.; Fang, G.Z.; Qi, C.J. Study on spatial correlation effect of citrus price in main producing areas—Based on VAR model and SNA model. Chin. J. Agric. Resour. Reg. Plan. 2023, 44, 173–184. (In Chinese) [Google Scholar]
  4. Fang, G.Z.; Qi, C.J.; Lei, Q.Y. Calculation of total factor productivity of citrus in China and the difference of region—Based on the DEA-Malmquist index method. Chin. J. Agric. Resour. Reg. Plan. 2019, 40, 29–34. (In Chinese) [Google Scholar]
  5. Shi, Z. How to understand and calculate the growth of “total factor productivity”—Econometric analysis of evaluating a specific technical and economic problem. J. Quant. Technol. Econ. 1988, 4, 68–71. (In Chinese) [Google Scholar]
  6. Chen, P.C.; Yu, M.M.; Chang, C.C.; Hsu, S.H. Total factor productivity growth in China’s agricultural sector. China Econ. Rev. 2008, 19, 580–593. [Google Scholar] [CrossRef]
  7. Huang, X.; Feng, C.; Qin, J.; Wang, X.; Zhang, T. Measuring China’s agricultural green total factor productivity and its drivers during 1998–2019. Sci. Total Environ. 2022, 829, 154477. [Google Scholar] [CrossRef]
  8. Namdari, M.; Kangarshahi, A.A.; Amiri, N.A. Input-output energy analysis of citrus production in Mazandaran province of Iran. Afr. J. Agric. Res. 2011, 6, 2558–2564. [Google Scholar]
  9. Xu, X.; Yang, J.X. Change analysis of citrus total factor productivity in China. Acta Agric. Zhejiangensis 2018, 30, 470–478. [Google Scholar]
  10. He, Y.; Chen, W. Evaluation of Sustainable Development Policy of Sichuan Citrus Industry in China Based on DEA–Malmquist Index and DID Model. Sustainability 2023, 15, 4260. [Google Scholar] [CrossRef]
  11. Li, D.H.; Guo, J.Y.; Zhu, S.B. On all-factor productivity, technological advances and efficiency in China’s orange industry. J. Jiangxi Agric. Univ. Soc. Sci. Ed. 2010, 9, 43–47. (In Chinese) [Google Scholar]
  12. Xiong, W.; Qi, C.J. DEA analysis on citrus production efficiency in Hubei province. J. Huazhong Agric. Univ. Soc. Sci. Ed. 2012, 5, 36–40. [Google Scholar]
  13. Tang, L.R. The Research on Input and Output Efficiency of Citrus in China. Master’s Thesis, Northwest A&F University, Yangling, China, 2012. [Google Scholar]
  14. Barro, R.J.; Sala-i-Martin, X. Convergence. J. Political Econ. 1992, 100, 223–251. [Google Scholar] [CrossRef]
  15. Baumol, W.J. Productivity growth, convergence, and welfare: What the long-run data show. Am. Econ. Rev. 1986, 76, 1072–1085. [Google Scholar]
  16. Mcerlean, S.; Wu, Z. Regional agricultural labour productivity convergence in China. Food Policy 2003, 28, 237–252. [Google Scholar] [CrossRef]
  17. Gong, B. Agricultural productivity convergence in China. China Econ. Rev. 2020, 60, 101423. [Google Scholar] [CrossRef]
  18. Poudel, B.N.; Paudel, K.P.; Zilberman, D. Agricultural productivity convergence: Myth or reality? J. Agric. Appl. Econ. 2011, 43, 143–156. [Google Scholar] [CrossRef] [Green Version]
  19. Rezitis, A.N. Agricultural productivity and convergence: Europe and the United States. Appl. Econ. 2010, 42, 1029–1044. [Google Scholar] [CrossRef] [Green Version]
  20. Suhariyanto, K.; Thirtle, C. Asian agricultural productivity and convergence. J. Agric. Econ. 2001, 52, 96–110. [Google Scholar] [CrossRef]
  21. Malmquist, S. Index numbers and indifference surfaces. Trab. De Estadística 1953, 4, 209–242. [Google Scholar] [CrossRef]
  22. Caves, D.W.; Christensen, L.R.; Diewert, W.E. The economic theory of index numbers and the measurement of input, output, and productivity. Econ. J. Econ. Soc. 1982, 50, 1393–1414. [Google Scholar] [CrossRef]
  23. Färe, R.; Grosskopf, S.; Norris, M.; Zhang, Z. Productivity growth, technical progress, and efficiency change in industrialized countries. Am. Econ. Rev. 1994, 84, 66–83. [Google Scholar]
  24. Xue, P.F.; Li, G.J.; Luo, Q.Y.; Liu, S.; Chen, Y. Study on the Regional Difference and Spatial Structure of Agricultural Science and Technology Resources in China. J. Agrotech. Econ. 2021, 5, 108–120. [Google Scholar]
Figure 1. Changes in TFP and deconstruction of its components for China’s mandarin production from 2007 to 2020.
Agriculture 13 01258 g001
Figure 2. Changes in TFP and deconstruction of its components for China’s tangerine production from 2007 to 2020.
Agriculture 13 01258 g002
Figure 3. Spatial distribution of TFP of mandarin and tangerine in China, 2007–2020.
Agriculture 13 01258 g003
Figure 4. Convergence analysis of mandarin and tangerine TFP in China, 2007–2020.
Agriculture 13 01258 g004
Table 1. Average TFP and its composition for the major mandarin- and tangerine-producing provinces in China from 2007 to 2020.
ClassificationProvincesEFFCHTECHPECHSECHTFP
MandarinChongqing0.9981.1761.0000.9981.173
Guangxi0.9991.1691.0000.9991.168
Hunan0.9991.1471.0000.9991.146
Hubei0.9981.1451.0000.9981.142
Guangdong0.9991.1351.0000.9991.134
Jiangxi1.0001.1231.0001.0001.123
Fujian1.0001.1161.0001.0001.116
TangerineChongqing0.9991.1611.0000.9991.159
Hunan1.0001.1571.0001.0001.157
Hubei0.9981.1481.0000.9981.147
Jiangxi1.0001.1411.0001.0001.141
Zhejiang1.0011.1311.0001.0011.133
Guangdong0.9991.1341.0000.9991.133
Fujian1.0031.1301.0001.0031.132
Table 2. Global Moran’s I of mandarin and tangerine TFP from 2007 to 2020.
YearMandarinTangerine
Moran’s IzpMoran’s Izp
2007−0.0690.5650.286−0.299−0.8360.202
2008−0.0261.0780.140−0.192−0.1880.425
2009−0.0411.0510.147−0.0531.0490.147
20100.169 **1.7620.0390.199 **1.8500.032
20110.109 *1.4620.0720.136 *1.5950.055
20120.215 **1.9060.0280.280 **2.1710.015
20130.208 **1.8800.0300.0751.1870.118
20140.0741.2110.1130.384 ***2.6150.004
20150.0461.0490.1470.237 **2.2380.013
2016−0.0410.6960.2430.184 **1.7660.039
2017−0.184−0.0880.465−0.0840.4200.337
2018−0.274−0.7330.2320.118 **2.3030.011
2019−0.356−0.9910.161−0.185−0.1030.459
2020−0.1390.1600.4360.053 *1.3100.095
Note: “*”, “**”, and “***” indicate statistical significance at the 10%, 5%, and 1% level, respectively.
Table 3. Absolute β convergence of mandarin and tangerine TFP.
CoefficientMandarinTangerine
OLSSARSEMSDMOLSSARSEMSDM
β−1.699 ***
(0.0848)
−1.094 ***
(0.105)
−1.540 ***
(0.0885)
−1.571 ***
(0.0899)
−1.697 ***
(0.0900)
−1.301 ***
(0.102)
−1.576 ***
(0.0904)
−1.568 ***
(0.0939)
ρ or λ0.343 ***
(0.0727)
0.705 ***
(0.0544)
0.687 ***
(0.0565)
0.296 ***
(0.0594)
0.614 ***
(0.0654)
0.613 ***
(0.0655)
γ1.191 ***
(0.126)
0.939 ***
(0.149)
V0.0260.1690.0440.0400.0260.0860.0390.040
Time effectYESYESYESYESYESYESYESYES
Individual effectYESYESYESYESYESYESYESYES
R20.9190.6050.6750.6970.9280.7600.7810.781
Note: “***” indicate statistical significance at the 1% level. “YES” indicates that time and individual fixed effects have been controlled.
Table 4. Conditional β convergence of mandarin and tangerine TFP.
CoefficientMandarinTangerine
OLSSARSEMSDMOLSSARSEMSDM
β−1.716 ***
(0.0861)
−1.574 ***
(0.0872)
−1.646 ***
(0.0752)
−1.638 ***
(0.0807)
−1.701 ***
(0.0935)
−1.557 ***
(0.0883)
−1.674 ***
(0.0797)
−1.598 ***
(0.0877)
ρ or λ0.0997 *
(0.0604)
0.309 ***
(0.117)
0.198 *
(0.122)
0.151 ***
(0.0534)
0.349 ***
(0.106)
0.260 **
(0.107)
γ0.342 *
(0.212)
0.308
(0.207)
V0.0240.0400.0310.0320.0250.0420.0280.037
Control
variables
YESYESYESYESYESYESYESYES
Time
effect
YESYESYESYESYESYESYESYES
Individual effectYESYESYESYESYESYESYESYES
R20.9250.7250.6630.5350.9300.8690.8410.541
Note: “*”, “**”, and “***” indicate statistical significance at the 10%, 5%, and 1% level, respectively. “YES” indicates that time and individual fixed effects have been controlled.
Disclaimer/Publisher’s Note: The statements, opinions and data contained in all publications are solely those of the individual author(s) and contributor(s) and not of MDPI and/or the editor(s). MDPI and/or the editor(s) disclaim responsibility for any injury to people or property resulting from any ideas, methods, instructions or products referred to in the content.

