1. Introduction
The
Paris Climate Agreement [
1] has enhanced the political willingness to take serious remedies against climate change, and measures to fight it. Along with the various item points approved, there was encouragement to lower GHG emissions levels without compromising current standards of living. Hence, it is easy to understand how important the climate-change challenge will be for the entire industrial sector in the coming years. Rapid transformations are required; indeed, at the present time around 1.5 Earth Planets are necessary to support current social, economic, and demographic trends [
2]. Until a few years ago, the reference economic model and, consequently, all industrial actions were built on linear economy (LE) principles. The linear economy was developed in a context of ample resources and materials and, as a result, considered the product end-of-life (EOL) phase to be of little importance [
2]. For these reasons, a new concept of economic structure, introduced in the 1970s, has been reconsidered, namely, the circular economy (CE). The CE reconsiders the supply-chain model to maximize resource circularity [
3]. This kind of model aims to improve the EOL phase of a product according to a zero-waste vision [
4]. The circular economy, through this new “extraction-production-disposal” perspective [
5], assimilates very well the new trends in terms of sustainability and the green economy [
6]. Furthermore, the CE is considered the best way to pursue sustainable development [
7].
The link between agriculture and GHG emissions is noticeable. Indeed, the agricultural sector releases around 5.4 Gt CO
2 per year, which corresponds to 11% of total anthropogenic GHG emissions [
8]. At national levels, this percentage could be higher (up to 35% for developing countries) [
9,
10].
The agricultural machinery industry cannot be blind to these changes, and it is strongly implicated from this point of view. The main reasons are essentially two:
Agri-construction machinery accounts for between 20 and 30% of the entire GHG emissions referred to the agricultural sector [
11,
12];
The worldwide population is expected to reach 8.3-10.9 billion [
13] by 2050, so food production sustainability is crucial [
14].
Consequently, it can be easily explained why both the academic community and tractor manufacturers are trying to pursue sustainability through emissions control [
15] or alternative propulsion systems [
16,
17,
18].
In this context, a complete analysis of the entire life-cycle system of a tractor can be very useful to detect drawbacks to sustainability.
This work analyzes the carbon intensity of a compact orchard tractor operating in Europe and considers its entire life cycle. However, the entire life cycle impact of tractors should be considered to detect drawbacks towards sustainability. The current literature, to the authors knowledge, still has low attention on the entire life cycle of this kind of product system. For this reason, this work aims to deepen the analysis of the carbon intensity of the entire life cycle of a compact orchard tractor operating in Europe.
Orchard tractors play a fundamental role considering European agricultural sector. Indeed, 1295 thousand hectares of fruit-tree areas existed in Europe in 2017, with an increase of 5700 hectares between 2012 and 2017 [
19]. Furthermore, in 2021 almost 180 thousand agricultural tractors were registered in Europe, representing growth of 16.62% with respect to 2020, and the most frequently registered tractor power range was 60 to 75 kW, which is the most common engine size for orchard tractors [
20]. Hence, quantifying orchard/vineyard tractor emissions could be a strategic step towards GHG emissions reduction in European agriculture.
Environmental analyses of orchard tractors which take into account the entire life cycle, and hence the production, use, and EOL stages, are quite rare in the current literature. Some works are very dated considering the current environmental impact categories and technologies used for tractor manufacturing and dismantling. Lee et al. [
21] conducted an LCA analysis for very-small-size tractors (28 kW ICE) operating in Republic of Korea and considered an entire life span of 8 years. In this study, all the phases of the tractor life span were taken into account, from production to final disposal. What emerged from the paper, according to the ECO-Indicator 95 impact category, was the absolute predominance of the use phase environmental impact (85%) compared to those of the other most impactful processes, such as raw-material extraction and disposal.
Some studies have focused their attention mainly on one of the three main stages of the tractor life cycle. Mantoam et al. [
22] estimated the CO
2eq emissions due to the production and maintenance of tractors with different power ranges. What emerged from the study was that, for tractors with 55 kW and 90 kW engines, which are the most suitable engine sizes for orchard tractors, 5.7 kg CO
2eq. and 4.2 kg CO
2eq. are emitted for each vehicle kilogram, respectively. Furthermore, the authors proved that the GHGs emitted for each vehicle kilogram decreased with increasing engine size. Dyer et al. [
23] focused their study only on the manufacturing process of tractors and the relative farm machineries in Canada. The authors stated that, with the annual replacement of tractors, between 3 and 6 Tg of CO
2 are produced. Van Linden et al. [
24] developed a model to estimate fuel consumption for different tractor sizes and power ranges, and it turned out that orchard tractors had the highest fuel-consumption rate due to the low efficiency of specialized agricultural operations.
Other works considered the role of the tractor in a bigger context such as the estimation of orchards carbon footprints [
25]. Relloedo-Leiva et al. [
26], for example, conducted an analysis to evaluate the eco-efficiency of blueberry orchards in which they considered the manufacturing and use stages of orchard tractors and machineries whose CF contributions, together with pesticide and material use, in blueberry orchard operations were 9% on average. Bacenetti [
27] analyzed the impact of tractors in relation to their annual utilization and replacement times, comparing low annual utilization for a longer period with high annual utilization and consequent rapid tractor turnover. The author stated that in the second scenario better environmental performance was achieved.
According to the aforementioned studies and statistics, it can be stated that orchard tractors can be considered one of the most impactful classes of agricultural vehicles from an environmental point of view. Hence, a complete assessment of orchard tractors’ carbon intensity must be performed in order to improve their eco-efficiency.
There are several methodologies that can be used to assess the environmental impact of a product such as life cycle assessment, energy-balance analysis, and ecological-footprint analysis [
28]. In this study the LCA technique was adopted. LCA is probably the most used method to evaluate the environmental effects of a product system. It is a very useful tool because the results are presented according to well-defined impact categories, such as global warming potential (GWP), making it particularly suitable for carbon-footprint assessments. Furthermore, it is the only standardized method, defined by the
ISO 14040 standard; hence, it allows for more robust analyses and greater ease of understanding.
The assessment was executed by combining secondary data available in the literature, primary data (measurements from field tests), and a software database (Open LCA (v 1.10.3) software, Environmental Footprint (v 4) database) to simulate various production and dismantling processes. The paper is substantially divided into four parts. After a brief discussion of the environmental impact of state-of-the-art orchard tractors, the boundaries and hypothesis, the goal and scope, and the functional unit (FU) necessary to define the assessment perimeter are defined. The second part describes the life-cycle inventory procedure for production, service life, and end-of-life phases. In the last part, the results obtained are shown and discussed according to “gate-to-gate” and “cradle-to-grave” approaches.
2. Materials and Methods
As said in the previous section, life-cycle assessment analysis is a valid instrument to evaluate the environmental impact of a product or a service. It consists of a standardized method, according to which the entire impact of an asset, taking into account the whole of its life cycle, can be examined.
According to the
ISO 14040 series [
29], LCA is structured in four parts:
The goal and scope definition phase;
The life-cycle inventory (LCI) phase;
The impact assessment (LCA results) phase;
The interpretation phase.
Since the product supply-chain system is very intricate, the main goal of LCA is not to provide an accurate answer. Its aim is to enable comprehension of a huge problem and to identify potential solutions. For these reasons, this kind of investigation is a very important support tool to quantify and optimize the environmental performances of products or services which can be used during the design-phase decision procedure or in considering the waste-management process [
30].
2.1. Goal and Scope
This study aimed to make an environmental assessment of an orchard specialized tractor operating in Europe according to the LCA standard approach as defined in
ISO 14040 standard series. The interest in orchard tractors originated from the various tasks that this kind of vehicle can perform. Furthermore, orchard cultivation plays a fundamental role in European agriculture given the increase in areas under fruit-tree cultivation. Another reason concerns the activities of the research group to which the authors of this article belong; indeed, one of their main tasks is the design of innovative working vehicle powertrains to reduce GHG emissions [
31,
32,
33]. Measuring the environmental impact of an agricultural tractor is quite complex. The reasons that may explain this are numerous, such as the different typologies of agricultural tractors and the several operations that can be performed with the same vehicle. From this point of view, it seems clear that agricultural tractors’ contributions to global GHG emissions are not neglectable.
This evaluation work may be addressed to different individuals:
Environmental impact specialists or agricultural machinery researchers;
Tractor manufacturers, to help them during the decision-making process;
Government agencies that can use this kind of study as a support tool during law-making proceedings.
2.2. System Boundaries and the Functional Unit
The tractor typology under study is a specialized orchard tractor. This kind of vehicles is a small-sized tractor, used in specialized applications, such as orchards and vineyards. The main characteristics of orchard tractors are their compact shape and their ability to operate in tight spaces and on steep slopes.
The boundaries of the analysis are shown in
Figure 1.
The analysis focuses only on the tractor system according to a cradle-to-grave approach. The life cycle of the tractor is subdivided into three main parts:
The production or manufacturing phase: in this phase, all the processes necessary to produce one orchard tractor are considered: raw-material extraction, energy flows to process the components, and tractor assembly;
The use phase: in this stage, the service life of the vehicle is evaluated; hence, fuel consumption and degradable materials, such as lubricants, are considered, as well as routine maintenance;
The end-of-life phase: in this phase, the recycling processes and the waste treatments of materials are considered in order to avoid the production of raw materials and energy from primary resources.
Agricultural machineries employed during the use phase, along with some other support structures, are not considered in the analysis.
The functional unit was set to 1 · kg
vehicle−1 · year
−1 (shortened 1 · kg
v−1 · y
−1). Indeed, weight models which refer to the product mass are more useful for dissemination applications [
34]. In addition, the inclusion of a temporal reference permits enlargement of the stakeholder audience to which this study is addressed. The entire life cycle of the tractor was set to 10 years from production to dismantling and disposal. Furthermore, since the object of study was the characterization of the GWP of an orchard tractor, the analysis results are expressed in kg CO
2eq. · kg
vehicle−1 · year
−1.
2.3. Life Cycle Inventory (LCI)
This step of the assessment consists of the collection of the various elementary input and output flows that characterize the product system. This section is structured in three subsections corresponding to the main phases of the product life cycle:
The production phase;
The use phase;
The EOL phase.
The product system taken as a reference was a compact orchard tractor whose weight was between 2400 and 2600 kg (cab included) and which was powered by a 75 kW diesel combustion engine. More detailed information on the vehicle considered is shown in
Table 1.
2.3.1. Production Phase
In the production phase of the LCI, all the material and energy flows characterizing the product system were collected. The production phase starts with the mining and extraction of the raw materials required for the vehicle-assembly phase. The scope of this phase is the production of one tractor.
The life-cycle inventory of the production phase was modelled by merging:
Secondary data taken from the literature to determine the orchard tractor’s material composition;
An LCA software database (Environmental Footprint (v 4)) and secondary data from the literature to model the production processes required to obtain the agricultural vehicle.
The data collected to draft the tractor material composition were properly re-scaled in order to adapt them to the functional unit of the environmental impact assessment objective of the study. The product system was split into different subassemblies, with the aim of better understanding the tractor’s material composition (
Table 2).
For each subsystem, a list of materials and corresponding weights was produced.
The cab was modelled, taking as a reference, a standard orchard tractor Category 4 cab (
Table 3). The amount of paint listed in this table corresponds to the total amount necessary for the whole vehicle. The energy for the final assembly of the subsystem was considered in the form of electric energy. The pollutant emissions of the materials whose mass was less than 1 kg were neglected (around 2% of the total mass of the tractor).
The engine subsystem (
Table 4) was modelled considering the three main materials used to produce a common diesel combustion engine for this kind of application. The engine aftertreatment system (DPF/DOC) is not taken into account in this analysis, since its contribute is negligible for Carbon Footprint assessments as stated by Larsson et al. [
37] The energy for the final assembly of subsystem was considered in the form of electric energy.
The tyres (
Table 5) were modelled as 4 285/85 R20 tyres, these being commonly used for orchard tractors. The energy for the final assembly of the subsystem was considered in the form of electric energy.
The chassis and powertrain (
Table 6) subsystem was modelled considering only the two primary materials forming them: cast iron and steel. The assembly energy was not considered in this case, since it was counted in the final assembly energy for the entire vehicle.
The “other” category (
Table 7) was assumed to contain all the materials that constitute little subsystems of the tractor, such as the cooling-system radiators, the 12 V lead-acid battery, and the copper wires for the vehicle cabling. As electronic devices several components are considered such as PCBs, sensors, relays, fuses etc. Copper Wires and Electronic Devices inventory evaluation has been conducted on the basis of the multi-year experience of the research group, the authors are part of, in the field of working and agricultural vehicles design and construction. The values obtained are also compatible with the estimation made by Pradel [
38].
Globally, the overall input flows characterizing the production phase of the tractor are shown in
Table 8. The final value is referred to the FU adopted for this case study.
Concerning the GHG emissions data obtained for this study, both secondary data and an LCA software database were used. The production processes used for the assessment were of a more generalized nature due to the difficulty of determining them in depth [
34]. Furthermore, it must be remembered that the scope of LCA analysis is to give an overview of the environmental impacts of the different stages of the product life cycle.
For steel component production, secondary data were used for raw steel production [
39], whereas the data for the production of single components (steel wire, steel sheet, steel pipe) were estimated using software database. Cast-iron components were evaluated by reference to [
40]. The electronic components and devices were printed circuit boards, and their GHG emissions data were modelled according to [
41]. For all the other input flows, a database for general production processes was used (
Table 9).
The electric energy necessary to assemble the tractor has been estimated as 13% of the entire production energy necessary to produce the vehicle [
42]. This last was estimated at around 50 MJ/kg
vehicle [
22]. The electric energy input flow used referred to the EU electric energy grid mix. The other sources of energy in terms of heat and electricity were not evaluated separately because they were already counted in the production processes necessary to obtain the single components. The transport contribution required to produce single components was also taken into account in the single-part production processes, whereas the transportation of the components for the final assembly was evaluated by assuming that all the manufacturing plants of the single components were located within 250 km of the main production plants. For the transport-sector input flow, the European road transport mix was considered.
2.3.2. Use Phase
In this section, the global emissions of an orchard tractor during its service life were evaluated. The assumed scenario consisted of an annual working time of 1000 h [
27,
43]. The entire service life of the vehicle covered an overall period of 10 years for a total of 10,000 h of working time. The two main contributions in this phase were mainly due to fuel consumption and service maintenance. According to the scenario assumed, extraordinary maintenance due to unintended failures are quite rare. However, the authors aim to consider this parameter in future studies, also because it is strongly influenced by:
Tractor manufacturing quality;
Tractor operating environment;
Implements used;
Human factor that means the attention paid by the farmer during tractor operation.
Thus, service maintenance is characterized essentially by 3 operations:
Engine oil lubricant maintenance occurs every 300 h, hydraulic oil maintenance every 1500 h, and tyre maintenance every 2500 h [
44]. Service maintenance assessment was modelled entirely through software database. The data for tyres maintenance were the same as those used for the production phase (
Table 5 and
Table 7). The quantities of engine oil lubricant and hydraulic oil were assumed to be 6 and 15 l respectively.
Table 10 shows the input quantities referred to the FU.
The purpose of the fuel-consumption evaluation was to obtain an average value for the tractor’s diesel fuel consumption in terms of liters/hour (shortened to l/h). The aim was to achieve a fuel-consumption estimation in the most accurate possible way with respect to real life. Therefore, the value for the average amount of fuel consumed was obtained by combining primary data and secondary data extracted from the literature and fuel-consumption models. The first step was the definition of a reference duty cycle. Belogj et al. [
45] defined an average duty cycle profile scenario for a 76 kW orchard tractor based on 1000 h of operating time:
14.3% weeding (142 h);
14.3% spraying (143 h);
14.3% harvesting (143 h);
28.6% plant lifting and ploughing (286 h);
28.6% tying machining (286 h);
The fuel consumption data for the first two kinds of operations were empirically collected from the tractor. The measurements were conducted with an
Antonio Carraro TRG 10900 (
Figure 2) equipped with a
Kubota V3800DI-T-E3B ICE (
Table 11). This is a 74 kW vertical water-cooled 4-cycle turbocharged diesel engine. The tests took place in the Piedmont region (Northwest Italy).
The data-acquisition system was placed on the tractor and directly connected to the diesel-engine control unit. The instrumentation used was PCAN-GPS (
Figure 3) produced by PEAK System. The device consists of a programmable sensor module for position and orientation determination. It is fitted with a satellite receiver, a magnetic field sensor, an accelerometer, and a gyroscope. The data sampling time was 50 ms, and the acquired data were transmitted via a CAN-bus and logged on the internal memory card. Thanks to this system, a complete overview of the vehicle’s condition was captured.
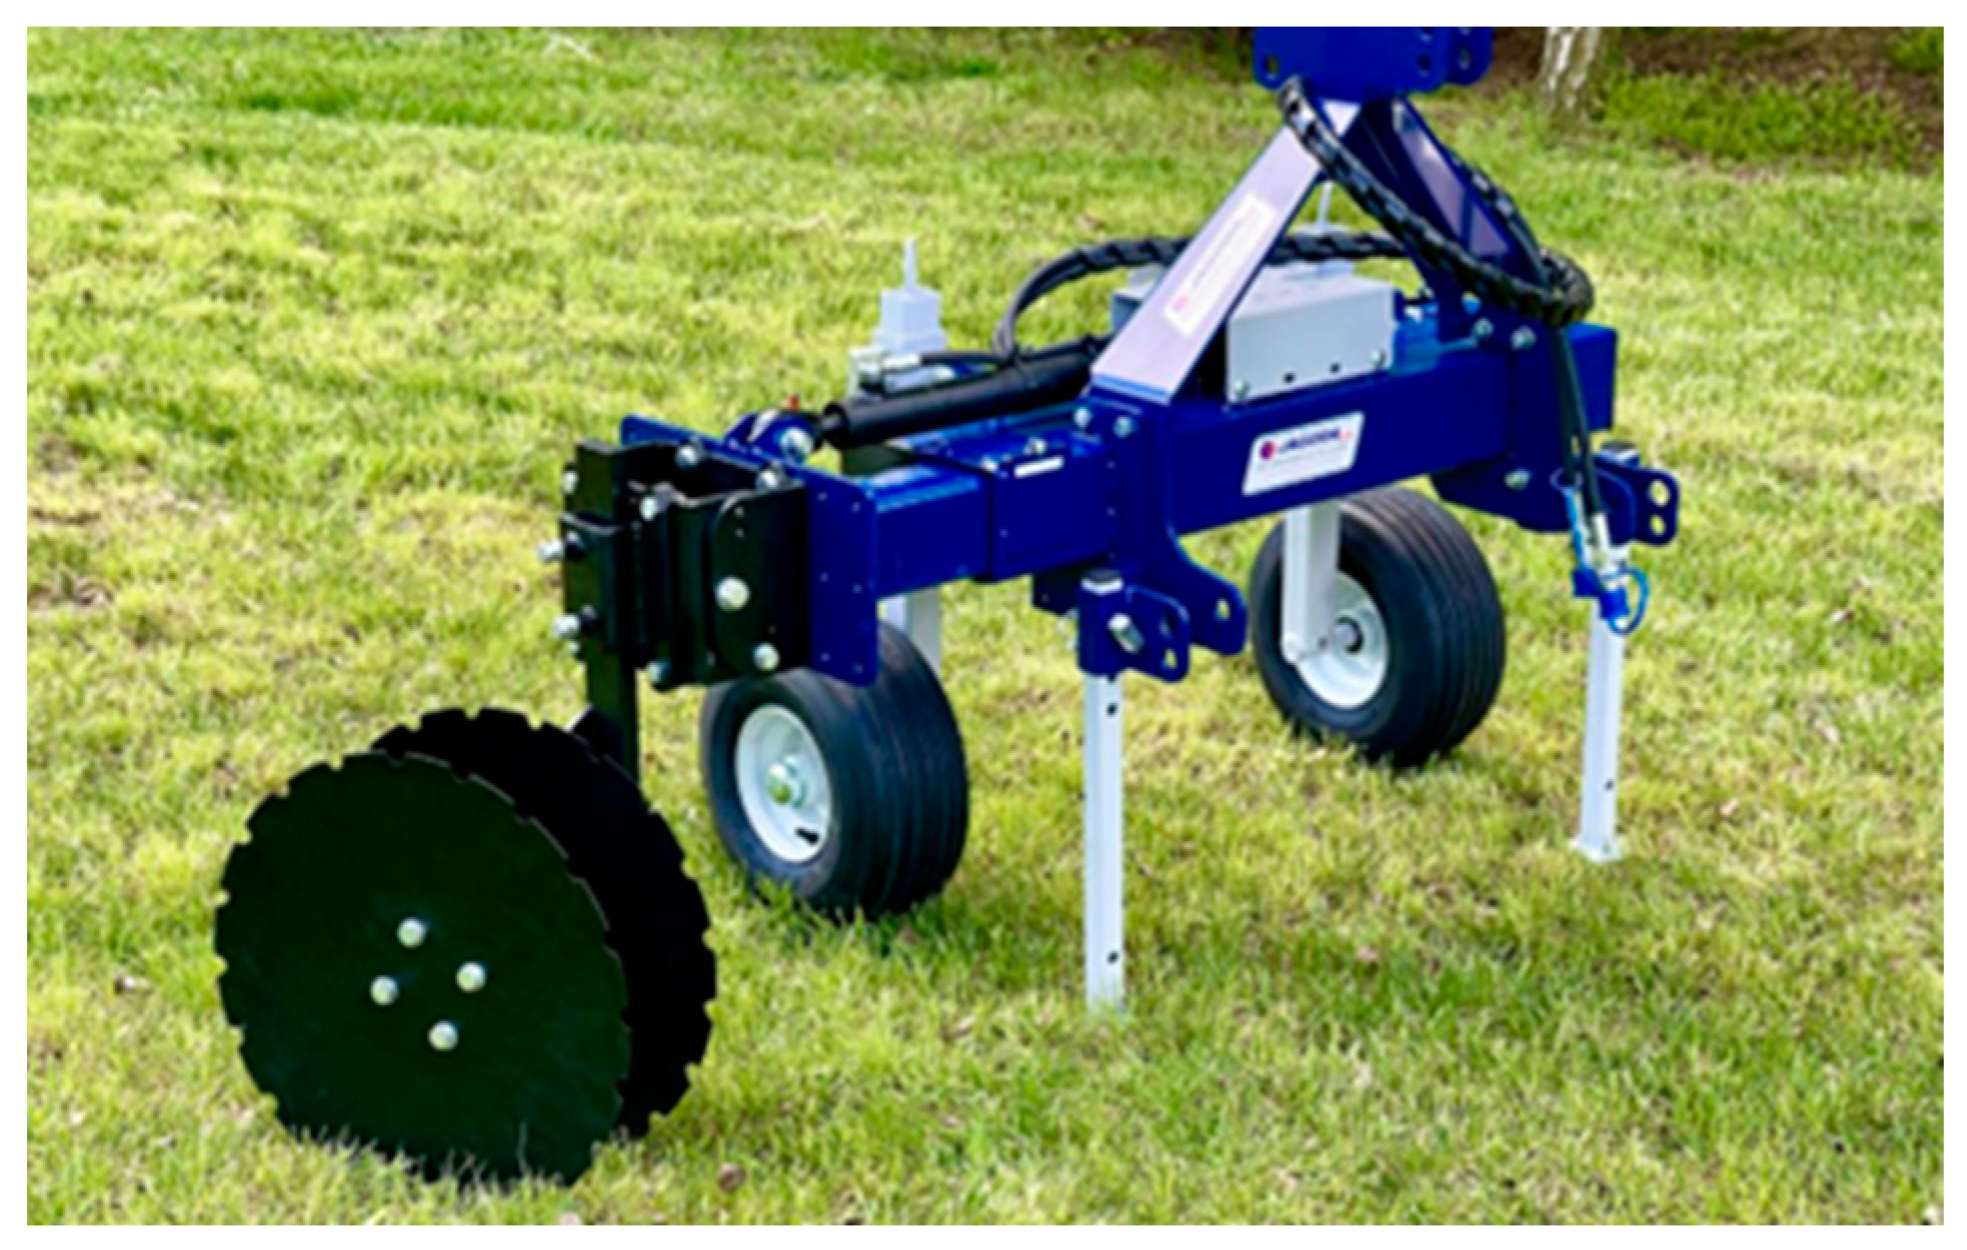
The weeding operation was executed with a mechanical weeder (
Figure 4).
The fuel rate recorded during the weeding operation is shown in the following chart (
Figure 5). For the purpose of this analysis, the data were filtered through a moving mean procedure every 500 data sampled.
The average fuel rate recorded during the operation was 2.9 l/h, and, considering the total number of hours per annum, the total fuel-consumption estimation obtained was 411.52 l per working year.
Concerning the spraying operation, the fuel rate recorded by the tractor is shown in
Figure 6. For the purposes of this analysis, the data were filtered through a moving mean procedure every 500 data sampled.
The sprayer used during the operation (
Figure 7) was an axial sprayer with 14 nozzles which were able to deliver a 160 l/min flow rate at 50 bar.
The average fuel rate during the operation was 8.03 l/h, and, considering the total number of hours per annum, the total fuel-consumption estimation obtained was 1147.86 l per working year.
The evaluations of the other three most common operations for orchard care were performed using a fuel-consumption model [
46,
47].
This model allows the estimation of fuel consumption in terms of brake-specific fuel consumption (BSFC) using a polynomial function:
where:
X is the normalized engine speed: .
Y is the normalized brake torque: .
Z is the normalized BSFC .
b
i variables are the polynomial coefficients (
Table 12).
The values for n
nom, T
nom, and BSFC
min were taken directly from engine curves and datasheets. The torque T was estimated considering the average power required for the tractor’s operation [
27] and assuming a working regime with PTO 540eco at an engine speed of 1600 rpm. The fuel rates evaluated are shown in
Table 13.
In
Figure 8, the average working points of the three operations are represented on the engine efficiency map to highlight the level of each type of workload compared to the maximum available torque capabilities.
The total amount of diesel burnt during a single year of work was estimated at around 4070 l, which means an average consumption of 4.07 l/h.
2.3.3. End-of-Life Phase
Once that tractor service life ends, it must be disposed of in order to recover some materials. In this subsection, orchard tractor disposal is described, assuming a high recycling scenario. The reason behind this choice relies on the purpose to show the full potential of tractor recycling with a view to a full-circular system, since the lack of statistical data and common scenarios about orchard tractor disposal. In this end-of-life stage, the ratio between recycled and recovered materials for recyclable materials was set to one. This means that for each kilogram of recycled material, the production of 1 kg of the same raw material was avoided. In
Table 8, all the metallic materials, glass, and thermoplastic polymers can be considered as recyclable materials. Among the unrecyclable materials are thermoset polymers and carbon black. Other components, such as the lead-acid battery and the electronic devices, require special processes of disposal.
All the disposal processes were modelled by combining secondary data with data from the LCA databases to estimate the emissions for the industrial recycling procedures. The drive points followed to model the EOL phase were:
Recyclable materials were taken as inputs to the recycling processes necessary to recover material, and the production of the same materials in rough states was avoided in a high recycling scenario;
Thermoset materials were inputs to incineration processes, and the production of heat from natural gas was avoided in the output [
48,
49];
Tyres were modelled according to waste-to-energy process [
50];
Glass components have been modelled according to a traditional recycling process [
51];
The lead-acid battery and electronic devices were modelled in order to recover lead components;
The electronic devices were modelled through an incineration process in order to avoid thermal energy production from natural gas and to recover copper and other precious metals; this step was modelled entirely using LCA software;
The amount of electric energy used for the disassembly of the vehicle was assumed to be the same as that used for its assembly (
Table 8);
The transport impact of moving the components to the recycling plants was assumed to be the same as that of the production phase (
Table 8).
The following table (
Table 14) shows the orchard-tractor materials’ end-of-life phase structure.
3. Results and Discussion
In this section, the results of the environmental analysis are presented. They are shown according to climate-change (CC) impact category (Environmental Footprint, Mid-Point indicator). This indicator estimates the global warming potential of a product in terms of kilograms of CO
2eq. produced over a 100-year time horizon [
52] and was developed by the European Commission’s Joint Research Centre (JRC) and based on the 2007 Intergovernmental Panel on Climate change (IPCC).
Firstly, the results obtained are shown from gate-to-gate point of view. Lastly overall outcomes accordingly to cradle-to-gate approach are illustrated.
3.1. Production Phase Results
In this sub-section Gate-to-Gate results, referred to production phase, are exposed. The manufacturing process considers all the steps necessary to produce one orchard tractor:
According to the impact indicator mentioned before the carbon footprint of the or-chard tractor is 2.25 × 10
−2 kg CO
2eq. · kg
vehicle−1 · year
−1. To better understand the impact of each factor the following pie chart (
Figure 9). shows their contributions as percentages.
From the chart, it can be seen that around two-thirds of the manufacturing-process emissions were related to the ferro-material parts production. Indeed, they are the two most important elements in terms of weight (around 80%), and their production processes are correlated with highly energy-intensive processes. A total of 13% of the total carbon-dioxide equivalent emissions were due to the electric energy necessary to assemble parts and the entire vehicle. This result was quite predictable because, according to the European electric energy grid mix, most of the energy is produced by burning natural gas, which has a high impact in terms of greenhouse-gas emissions. Polymeric materials (thermoset, thermoplastic, and tyres) covered around 8%. In the “other materials” category, all non-ferro-metal materials and particular components, such as electronic devices, are included. Despite representing only 5% of the total vehicle mass, their impact accounts for almost 8% of the total equivalent carbon-dioxide emissions; indeed, in this category are included some of the most energy-intensive production processes, such as aluminium and copper production but especially the printed-circuit-board production process, which is the most impactful in terms of kg CO2eq. for each kilogram of product manufactured.
3.2. Use-Phase Reuslts
The use phase includes all the processes involved in tractor service life. They essentially consist of:
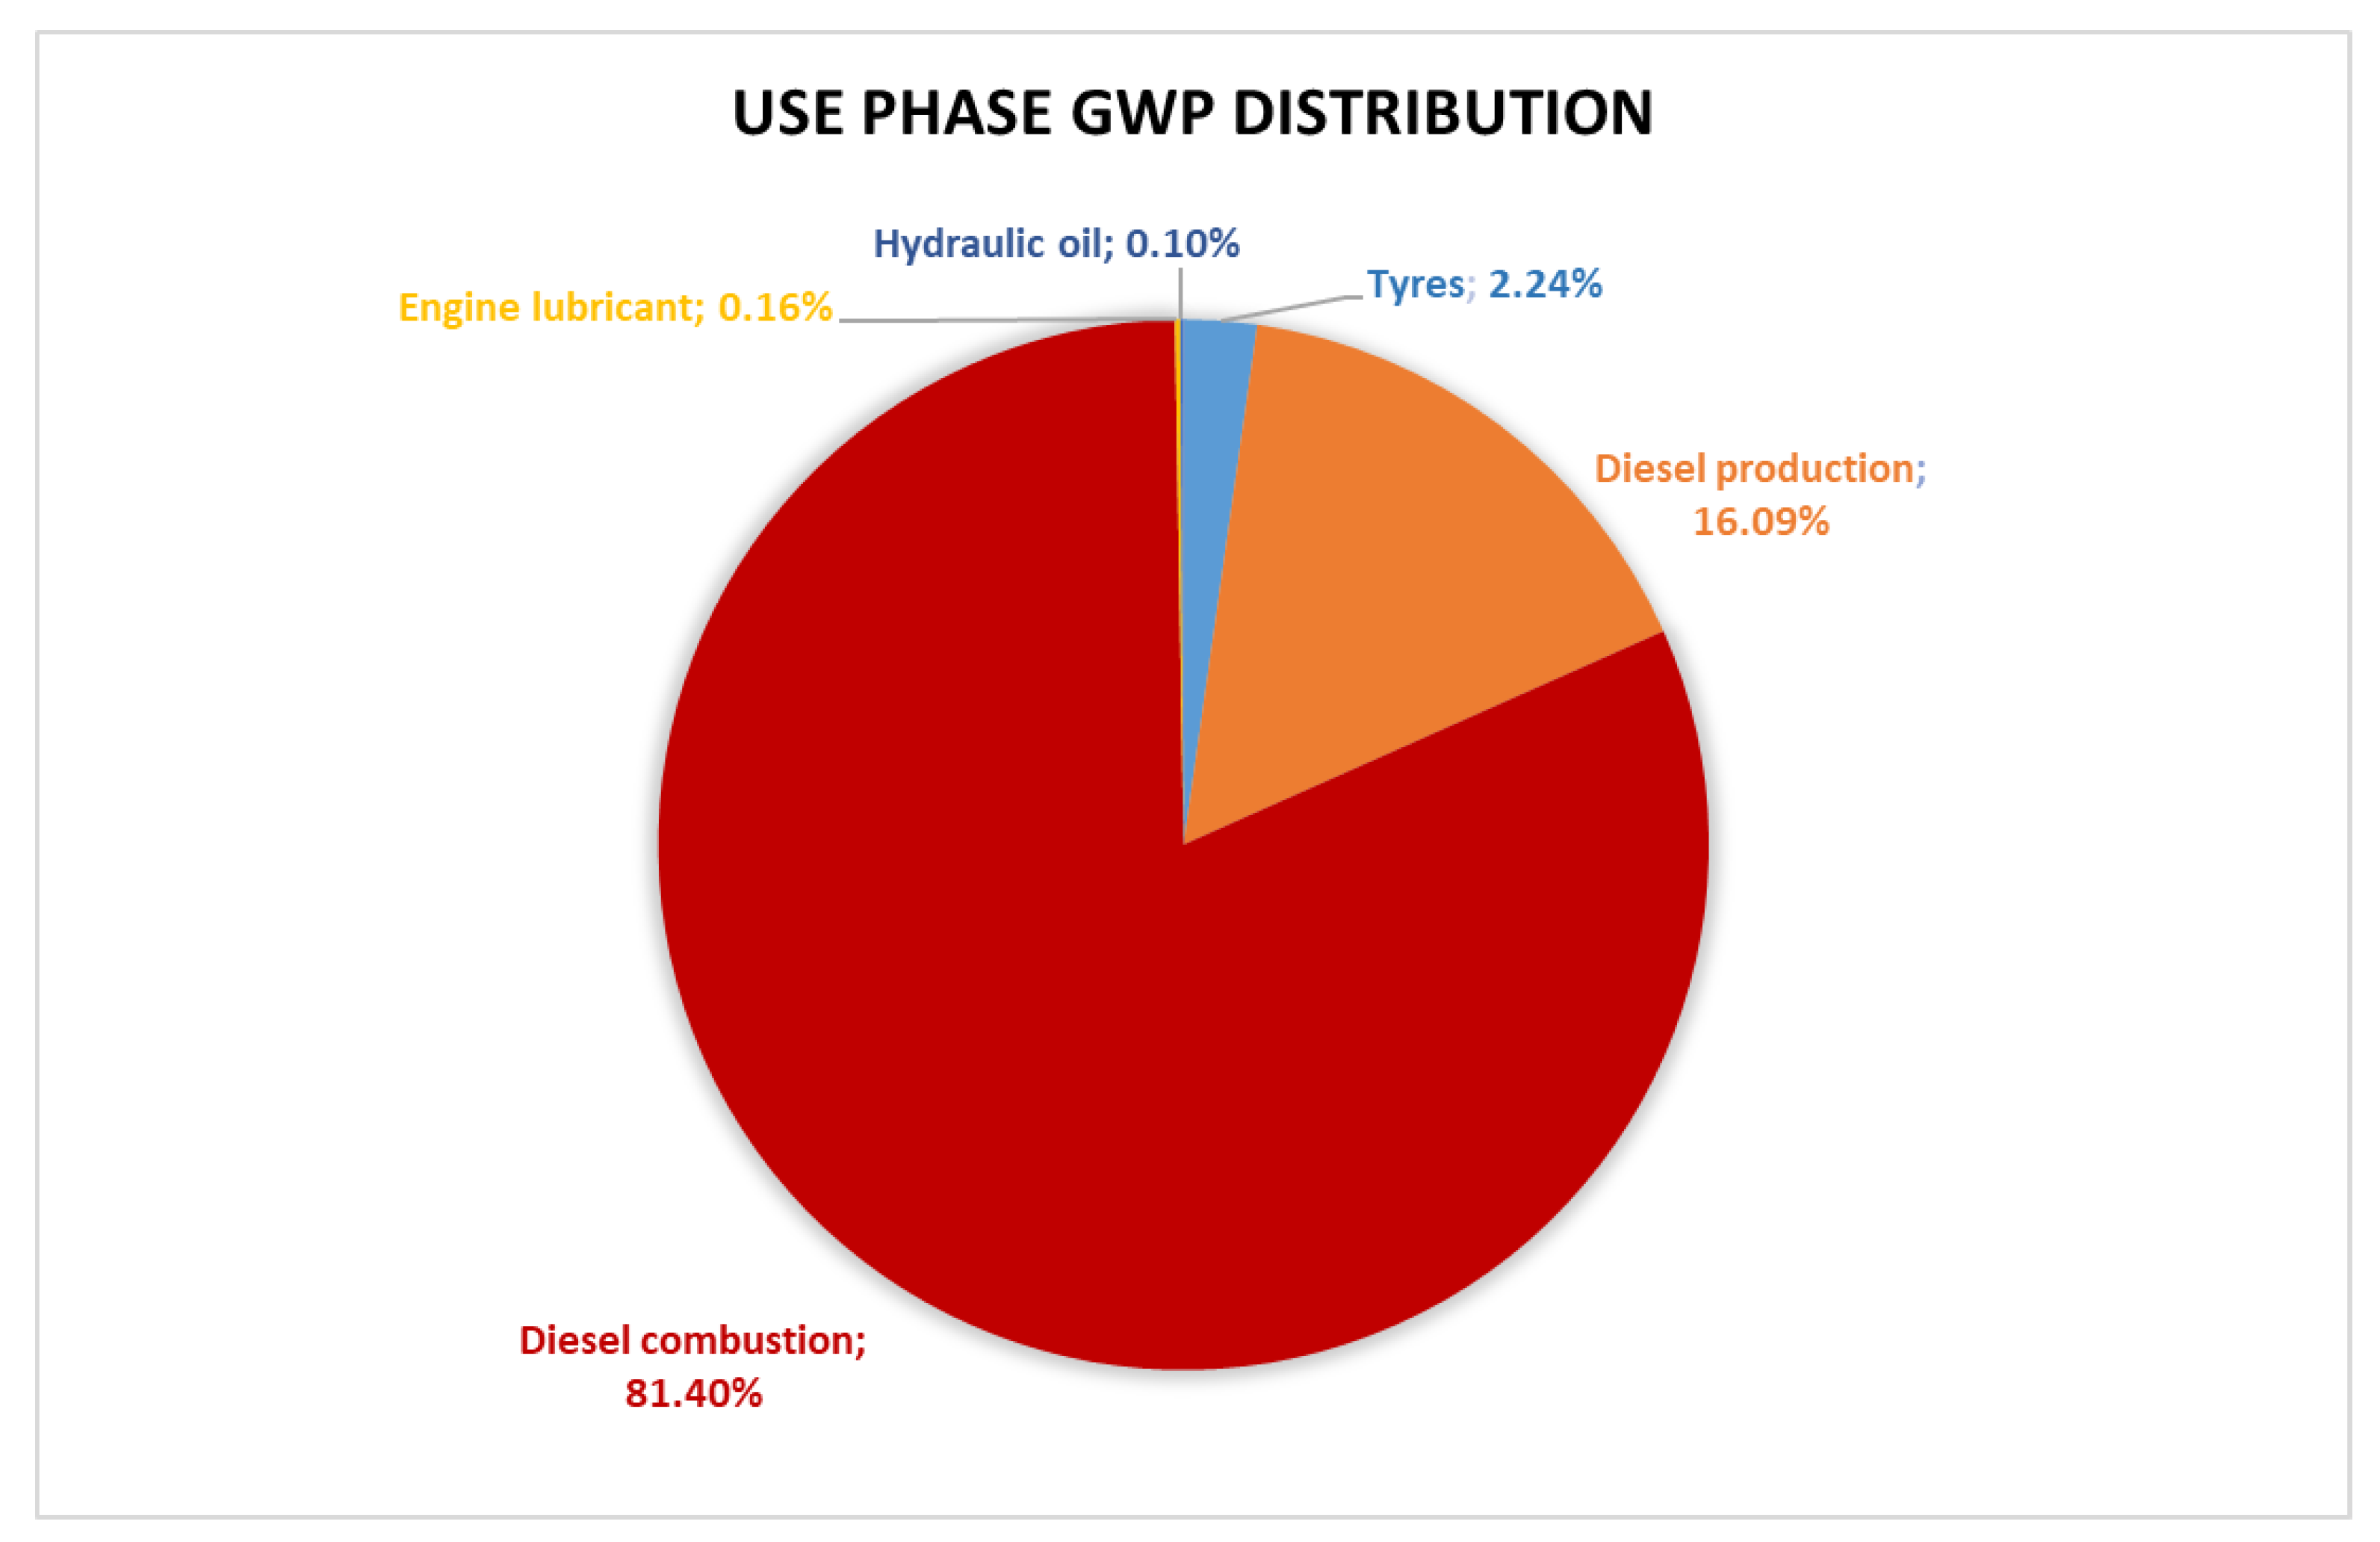
The GWP of the use phase, referred to the functional unit, is 5.25 kg CO
2eq. · kg
vehicle−1 · year
−1. The following pie chart could make clearer the contribution of each single phenomenon (
Figure 10).
Observing the chart, it is evident that almost all the GHG emissions related to the operation life of the orchard tractor are correlated with the diesel production and mostly combustion (around 98%). Diesel combustion was the most impactful elementary flow for two reasons: the amount of diesel used during tractor service life (1.36 l · kg
vehicle−1 · year
−1) and the direct emission of carbon-dioxide due to the combustion process which corresponds to 2.64 kg CO
2 produced for each litre of diesel fuel burnt [
53]. Lubricant oil impact is almost negligible for this kind of impact category assessed in this analysis. The remaining 2.2% represents the production of three complete sets of tyres. Indeed, for the whole tractor service life, four complete set of tyres were considered (one every 2500 h).
3.3. End-of-Life Results
In this subsection, gate-to-gate results referred to the end-of-life phase are presented. The disposal process includes all the steps necessary to recycle the vehicle:
The aim of the recycling process is to recover raw materials and energy, such as thermal energy to avoid their subsequent production from primary sources. The carbon footprint of the recycling process is of −1.45 × 10⁻² kg CO2eq. · kgvehicle−1 · year−1. In particular, the processes necessary for the recycling of materials produced emissions of 1.15 × 10⁻² kg CO2eq. · kgvehicle−1 · year−1, whereas the outputs of the same processes spared −1.56× 10⁻¹ kg CO2eq. · kgvehicle−1 · year−1 in future GHG emissions.
To better understand the impact of each element the following histogram chart (
Figure 11) shows their contributions as percentages.
From the chart, it can be seen that the sources of equivalent carbon-dioxide emissions are the electric energy necessary to disassemble the tractor and the transport to bring the different components to the respective dismantling plants (8.54 × 10
−2 kg CO
2eq. · kg
vehicle−1 · year
−1). The major contributors to carbon-dioxide recovery are ferro metals. In addition, aluminium recovery, despite the quite low presence in terms of weight of the tractor, plays an important role; indeed, aluminium production from primary resources has an extremely high impact [
54]. Also tyres recycling process, considering four set of tyres (800 kg) and assuming a waste to energy process [
50], is quite powerful in terms of energy recovery since it allows avoiding the production of thermal energy from natural gas. In the “other” category are included the recycling processes for copper, glass, lead-acid battery, and electronic scrap production. This last, together with the disassembly energy and transport, is the elementary flow that produces a negative contribution in terms of pollution.
3.4. Global Results
Globally, the impact of the tractor, according to climate-change impact category and the functional unit adopted per this analysis, is 5.75 kg CO
2eq. · kg
vehicle−1 · year
−1. This is the carbon-dioxide produced for kilogram of the tractor, considering a life span of ten years. The chart in
Figure 12 shows the single contribution of each stage of tractor life. The manufacturing phase produces 6.45 ×10
−1 kg CO
2eq. · kg
vehicle−1 · year
−1, use phase 5.25 kg CO
2eq. · kg
vehicle−1 · year
−1, and the disposal stage allows the recovery of 1.45 kg CO
2eq. · kg
vehicle−1 · year
−1 (
Figure 12).
The main contribution to emissions was made by diesel combustion during the use phase. It is interesting to observe that, according to the recycling scenario assumed, the end-of-life phase was able to recover almost 23% of the carbon-dioxide generated during the production phase.
Speaking in absolute terms, the production phase developed 16,117 kg CO
2eq.; during service life, 131,860 kg CO
2eq. was generated (considering a 10 year life span); and the end-of-life stage allowed the recovery of 3620 kg CO
2eq.. This is also noticeable in other works [
21], where the incidence of the use phase was about 85%. The results obtained in this work are referred to an average annual work usage of this type of tractors derived from the literature. Consequently, the different peculiar characteristics of each agricultural application where this class of tractors are used (orchards, vineyards, hazelnut fields, etc.) can affect the estimated quantity of CO
2 emissions related to the use phase. Future works will address more in details the variability of these results with the specific field of application of the tractor. Anyway, the overall distribution of the GWP impact category is not expected to change in reason of the average nature of the proposed work cycle.
Lastly, a sensitivity analysis has been conducted to demonstrate the consistency of the trend obtained from the environmental assessment. The sensitivity analysis consists of the evaluation of the results obtained from a model caused by the fluctuation of one or more input variables. For this study, the sensitivity analysis was carried out modifying the two most important variables susceptible to changes: diesel fuel-rate and the electric energy for assembling/disassembling the tractor.
Diesel fuel-rate can be considered the most important parameter of the entire analysis. Furthermore, the average diesel fuel-rate has been obtained combining primary and secondary data and it could be influenced by several external factors such as soil conditions or tractor way of use by the farmer. Electric assembling and disassembling energy have been selected because of different local energy grid mix used for its production and also because its effects impacts on manufacturing and disposal stages. For both the parameters a variance of ±10% with respect to the values obtained from the LCA assessment has been considered. The results of the sensitivity analysis are shown in
Figure 13.
Diesel fuel- rate variance influences not just the combustion process inside the ICE, but also its production. As it can be observed in
Figure 13, the percentage of diesel fuel-rate produces a variation of the carbon intensity of use phase between ±9.7%. In absolute terms, it corresponds to a variation of ±12,800 kg CO
2eq., a value very close to the GWP produced during the manufacturing process of one orchard tractor.
Concerning the electric energy necessary to assemble and to disassemble the tractor, it can be noted that in both cases the relationship between input and output deviations is purely linear, so the variation of the GWP is ±10% in both cases. In absolute terms the values GWP fluctuates in a range of ±1700 kg CO2eq.. This variation has a very low influence on the orchard tractor GWP.
The assessment of the orchard tractor considered in this work provides food for thought. To reduce vehicle GHG emissions, research must focus on tractor “efficiency”. In this case, the term “efficiency” should be interpreted in its wider meaning. Obviously the most important actions with respect to combatting carbon-dioxide production are related to the tractor service life. Since 90% of total GWP is due to the use phase, it is necessary to cut down diesel fuel emissions per unit of work done. This aim could be reached in different ways: engine and tractor transmission-efficiency improvement, cleaner diesel production, and vehicle mass optimization.
Engine and tractor transmission efficiency improvement is probably the most direct method to limit diesel fuel consumption. Indeed, the use of a diesel engine within its best efficiency range is surely the most direct method to limit diesel fuel consumption. In this regard, the investigation of alternative powertrains and propulsion systems is essential to pursue carbon containment [
55,
56]. Improvements in tractor transmission could lead to the optimization of tractor idle phases other than diesel fuel-rate reduction.
Cleaner diesel production aims to reduce diesel production emissions. In this sense, recourse to biofuel could be very important to de-link fuel production from fossil fuel energy [
57].
Vehicle mass optimization could have a dual effect: on the one hand, diesel consumption could be decreased, making a tractor lighter; on the other, mass optimization could improve production-phase GWP. Indeed, a lighter tractor means less use of materials and less energy to produce the materials that constitute it in particular, steel and cast iron, which are the major contributors in the manufacturing stage.
Lower GHG emissions could be reached and could improve the manufacturing and end-of-life phases. In this sense, important upgrades that can be executed include the use of secondary resources for materials production or regenerating processes to restore tractor components at the end of their service lives; the gradual abandonment of high-impact fossil fuels, such as coal, during production and dismantling processes; and the use of a short supply chain to cut down transport contributions.
4. Conclusions
This study aimed to illustrate the environmental impact of a specialized orchard tractor, considering its entire life cycle. The environmental assessment was conducted by considering the greenhouse-gas emissions developed during the tractor’s life cycle according to global-warming-potential criteria, as defined by the Intergovernmental Panel on Climate Change (IPCC).
The methodology used for this work falls within the LCA technique as defined in the ISO 1440 standard series. The functional unit adopted for the analysis was 1 · kgvehicle−1 · year−1, considering a tractor mass of 2500 kg and a life span of ten years. After the definition of the goal, scope, and functional unit, a life-cycle inventory was developed. This last took into account the three macro-stages of a tractor: production, service life, and disposal. The inventory was developed by considering secondary data taken from the literature, primary data, collected during field operations using the tractor, and database software data (Open LCA (v 1.10.3) software, Environmental Footprint (v 4) database). What emerged from the analysis was that almost all the emissions of an agricultural tractor are correlated with its use (around 90%). The production phase is also stressful from a carbon footprint point of view: 6.45 × 10⁻¹ kg CO2eq. · kgvehicle−1 · year−1 (around 16 tons of equivalent carbon dioxide for each tractor), whereas the recycling phase allowed the recovery of almost 23% of the global GHG emissions developed during manufacturing. A drastic diesel-fuel-rate reduction was identified as the best solution to decarbonize the orchard tractor life cycle. The strategies to cut down the diesel fuel rate can be grouped into three categories: engine and transmission-efficiency improvement, cleaner diesel production, and vehicle mass optimization. Furthermore, the orchard-tractor carbon footprint could be improved by rethinking the production and disposal phases, considering the use of secondary resources and regenerating processes, respectively. Although the assumptions made for this work, the resulting trends obtained in terms of GHG emissions obtained are not expected to drastically change if different orchard tractors are considered, because the data used for LCI are already the results of statistical or averaged data. Perhaps worst results could be obtained for the EOL phase if medium-low recycling scenario are considered, but one of the purposes of this study is also to show the full-potential of tractor recycling in view of circular system sustainability.
This kind of study could be the basis for future investigations of the impacts of alternative fuels or different powertrains using the same methodology in order to obtain comparable results. This work is addressed to the different stakeholders involved in the agricultural tractor field to help them during decision-making processes, such as tractor manufacturers or government agencies. Another important development of this study could be the utilization of more data in order to evaluate orchard-tractor impact according to other impact categories such as the “human toxicity” index, or to establish the impact of certain elementary, flows whose environmental performance has been shown to be negligible in carbon-footprint analysis, i.e., the impact of oil lubricant dispersion on soil quality.


