Article

Detection of Cattle Key Parts Based on the Improved Yolov5 Algorithm

1
Faculty of Information Engineering and Automation, Yunnan Province Key Laboratory of Computer, Kunming University of Science and Technology, Kunming 650500, China
2
Faculty of Modern Agricultural Engineering, Kunming University of Science and Technology, Kunming 650300, China
*
Author to whom correspondence should be addressed.
Agriculture 2023, 13(6), 1110; https://doi.org/10.3390/agriculture13061110
Submission received: 16 April 2023 / Revised: 2 May 2023 / Accepted: 11 May 2023 / Published: 23 May 2023
(This article belongs to the Special Issue Artificial Intelligence in Livestock Farming)

Abstract

:
Accurate detection of key body parts of cattle is of great significance to Precision Livestock Farming (PLF), using artificial intelligence for video analysis. As the background image in cattle livestock farms is complex and the target features of the cattle are not obvious, traditional object-detection algorithms cannot detect the key parts of the image with high precision. This paper proposes the Filter_Attention attention mechanism to detect the key parts of cattle. Since the image is unstable during training and initialization, particle noise is generated in the feature graph after convolution calculation. Therefore, this paper proposes an attentional mechanism based on bilateral filtering to reduce this interference. We also designed a Pooling_Module, based on the soft pooling algorithm, which facilitates information loss relative to the initial activation graph compared to maximum pooling. Our data set contained 1723 images of cattle, in which labels of the body, head, legs, and tail were manually entered. This dataset was divided into a training set, verification set, and test set at a ratio of 7:2:1 for training the model proposed in this paper. The detection effect of our proposed module is proven by the ablation experiment from mAP, the AP value, and the F1 value. This paper also compares other mainstream object detection algorithms. The experimental results show that our model obtained 90.74% mAP, and the F1 value and AP value of the four parts were improved.

1. Introduction

In recent years, intelligent monitoring systems for livestock, using artificial intelligence for video analysis, have been widely developed. For cattle livestock farms, intelligent monitoring technology plays an important role in promoting the welfare, growth, and development of cattle [1]. To meet the needs of the rapidly developing cattle-breeding industry, scientific theory and advanced equipment are needed to improve livestock development. Accurate detection of key body parts is required for identifying cattle behavior [2], using video analysis technology and individual cattle identification technology, such as detection of cattle lameness and accurate breeding. Therefore, deep-learning methods are being developed to address the fundamental and challenging problems of accurately detecting cattle body parts in complex natural environments.
Detection of the animal and identifiable parts of its body (including head, back, and legs) facilitates the collection of animal welfare information, and the relative position of the body parts can further reflect the individual’s posture and behavior [3]. Firstly, the body demonstrates information about its pattern, color, and shape. That biovisual information about the body can be used for studies, such as breed classification and individual identification [4,5]. Secondly, the head of cattle can reflect their facial features and facial information, and that information can be studied with cattle face recognition and animal emotion analysis [6,7]. The legs are the most common area for cattle diseases. For example, lameness is one of the most common wellness issues in cattle breeding, and severe lameness may lead to disability. Therefore, detecting the legs of cattle in image analysis is very meaningful [8,9]. Finally, tail information reflects the cattle’s rump depth and tail shape. In addition, the tail and tail profile correspond closely to the cow’s body condition score (BCS), which evaluates the cows’ body fat percentage and reflects their health status [10]. Huang et al. used cow tail testing to evaluate BCS, which is important for nutritional management. Accurate detection of key body parts is essential for Precision Livestock Farming (PLF) [11], especially for behavior monitoring, health care, and BCS assessment [12]. Therefore, using deep-learning algorithms to detect the key parts of animals is important for autonomous management and animal health monitoring in cattle livestock farms.
Before computer vision and image processing technology were widely developed, many scholars used intelligent sensor systems to detect cattle biological information. In 2016, Smith et al. proposed using intelligent sensors to collect relevant information about cattle, and they built mathematical models for data analysis [13]. However, methods involving wearable sensors may affect the welfare of the cattle. Practically, sensors are faced with problems, such as failure and loss, which directly lead to increased management costs [14]. As a contactless real-time data acquisition method, computer vision has the advantages of low cost and high efficiency in solving the task of cattle information acquisition in cattle livestock farms. Therefore, it is of tremendous research significance to use deep-learning models to realize tasks that are difficult to complete manually, such as detecting cattle key parts and monitoring disease. Zhao adopted an accurate detection method of cow targets with background subtraction in 2015, using the frame difference method to calculate the boundary rectangle of cows and to extract the local background, achieving a 24.85% performance improvement [15]. In 2017, Li Guoqiang proposed a method of decomposing cow limbs, based on skeleton characteristics, to detect the head, neck, forelimbs, hindlimbs, and tail of the cattle, obtaining a mAP of 95.09%, based on the verification set of 200 images [16]. Shao et al. constructed a convolutional neural network (CNNS) model for implementing body detection and counting cattle from UAV remote sensing images, in which the detection accuracy reached 95.7% [17]. In 2019, Jiang Bo et al. proposed the FLYOLO3 algorithm to detect cows’ key parts (back, head, and legs). Specifically, the author added the mean filtering algorithm to the backbone feature extraction network of YOLOV3 and obtained a 93.73% mAP on 1000 cow data sets. [18]. In the same year, Weizheng Shen et al. used a YOLO detector to extract cow objects and introduced them into the improved AlexNet network model for multi-part identification [19]. In 2022, Huang et al. embedded InceptionV4 into the SSD algorithm and proposed improving SSD with Inception-V4 for the cows’ tail detection and tracking, achieving 96.97% accuracy on its data setting [20]. In 2023, Qiao et al. embedded the ASFF module into the prediction part of the YOLO algorithm. This method achieved a precision of 96.2%, and a mAP at 0.5 of 94.7% on the dataset [21]. Although the above techniques demonstrate the feasibility of deep-learning-based animal detection, achieving accurate detection of key parts of cattle in complex farm environments (e.g., multiple cattle, differences in lighting, and noise) remains challenging.
Based on detecting key body parts of cattle, many scholars have begun to study individual recognition. Jianxing Xiao et al. first used the improved Mask-R-CNN to segment the pattern information of the back of cows in 2022. Secondly, the Fisher feature selection method is used for feature selection, which is preprocessed and binarized, then input into the SVM classifier for recognition. The recognition accuracy of 98.67% was achieved on a dataset, consisting of 8640 images [22]. In the same year, Zhi Weng et al. proposed a two-branch TB-CNN face recognition algorithm, which obtained 99.71% accuracy in the experiment on 18,200 mixed-data data sets. [23]. Xu et al. used transfer learning to optimize seven pre-trained CNN models and obtained 99.8% of mAP [24].
Object detection is a popular field in computer vision, which has applications in agriculture, industry, medicine, pedestrian detection, and transportation. Traditional object detection methods rely on sophisticated manual feature design and extraction, such as Histogram of Oriented Gradient (HOG) [25]. However, AlexNet has achieved great success in classification tasks, which has attracted the attention of researchers regarding the use of convolution neural network architecture [26].
The one-stage object detection algorithm converts the classification task into a regression prediction task, and it directly predicts the category and location information of the object in the input image. In addition, the one-stage strategy does well with regards to detection time. In 2016, J. Redmon et al. proposed the YOLO algorithm, which generates bounding box and classification confidence by directly predicting a single neuron [27]. In 2018, Joseph Redmon and Ali Farhadi proposed the Yolov3 algorithm, used DarkNet53 as the backbone feature extraction network, and introduced the FPN structure in the cross-scale feature fusion part [28]. The SSD (single-shot detector) object detection algorithm was proposed by W. Liu et al. in 2016 [29]. On this basis, Zhang, Y et al. proposed the DSSD static gesture recognition method, which solved the problem that the SSD algorithm was insensitive to small objects [30]. Two-stage target detection: Fast-R-CNN algorithm obtains fixed-size features through the RoI pooling layer as input for subsequent classification and bound box regression full-connection layer, but the detection time is slow [31]. Faster-R-CNN was proposed by S. Ren et al. to increase the detection accuracy by selectively searching the region of interest (RoI) and constructing a new region proposal network (RPN) [32]. In addition, CornerNet introduces the top left and bottom right corners for regression [33], while CenterNet directly predicts the center point of each object [34].
Regarding the cattle key parts detection, insensitivity to small objects (legs and tail) and overlap are found due to the dense distribution of cattle in livestock farms. In addition, the image is unstable in the training process and the initialization process, as well as in the particle noise and fragment noise introduced in the convolution calculation and downsampling operation, which caused the deterioration of detection performance. In this paper, the cattle body, head, legs, and tail are taken as detection objects, and many experiments have been performed by referring to previous studies, and they have achieved good results. However, the traditional algorithm cannot precisely recognize the head and the tail of cattle. Given the above problems and considering that a certain detection speed is required in practical applications, Yolov5 is our basic framework. The Filter_Attention attention mechanism is proposed to reduce the original and particle noise of images. The SoftPooling algorithm is introduced to improve the detection effect of small objects (leg and tail). The contribution of this paper is as follows:
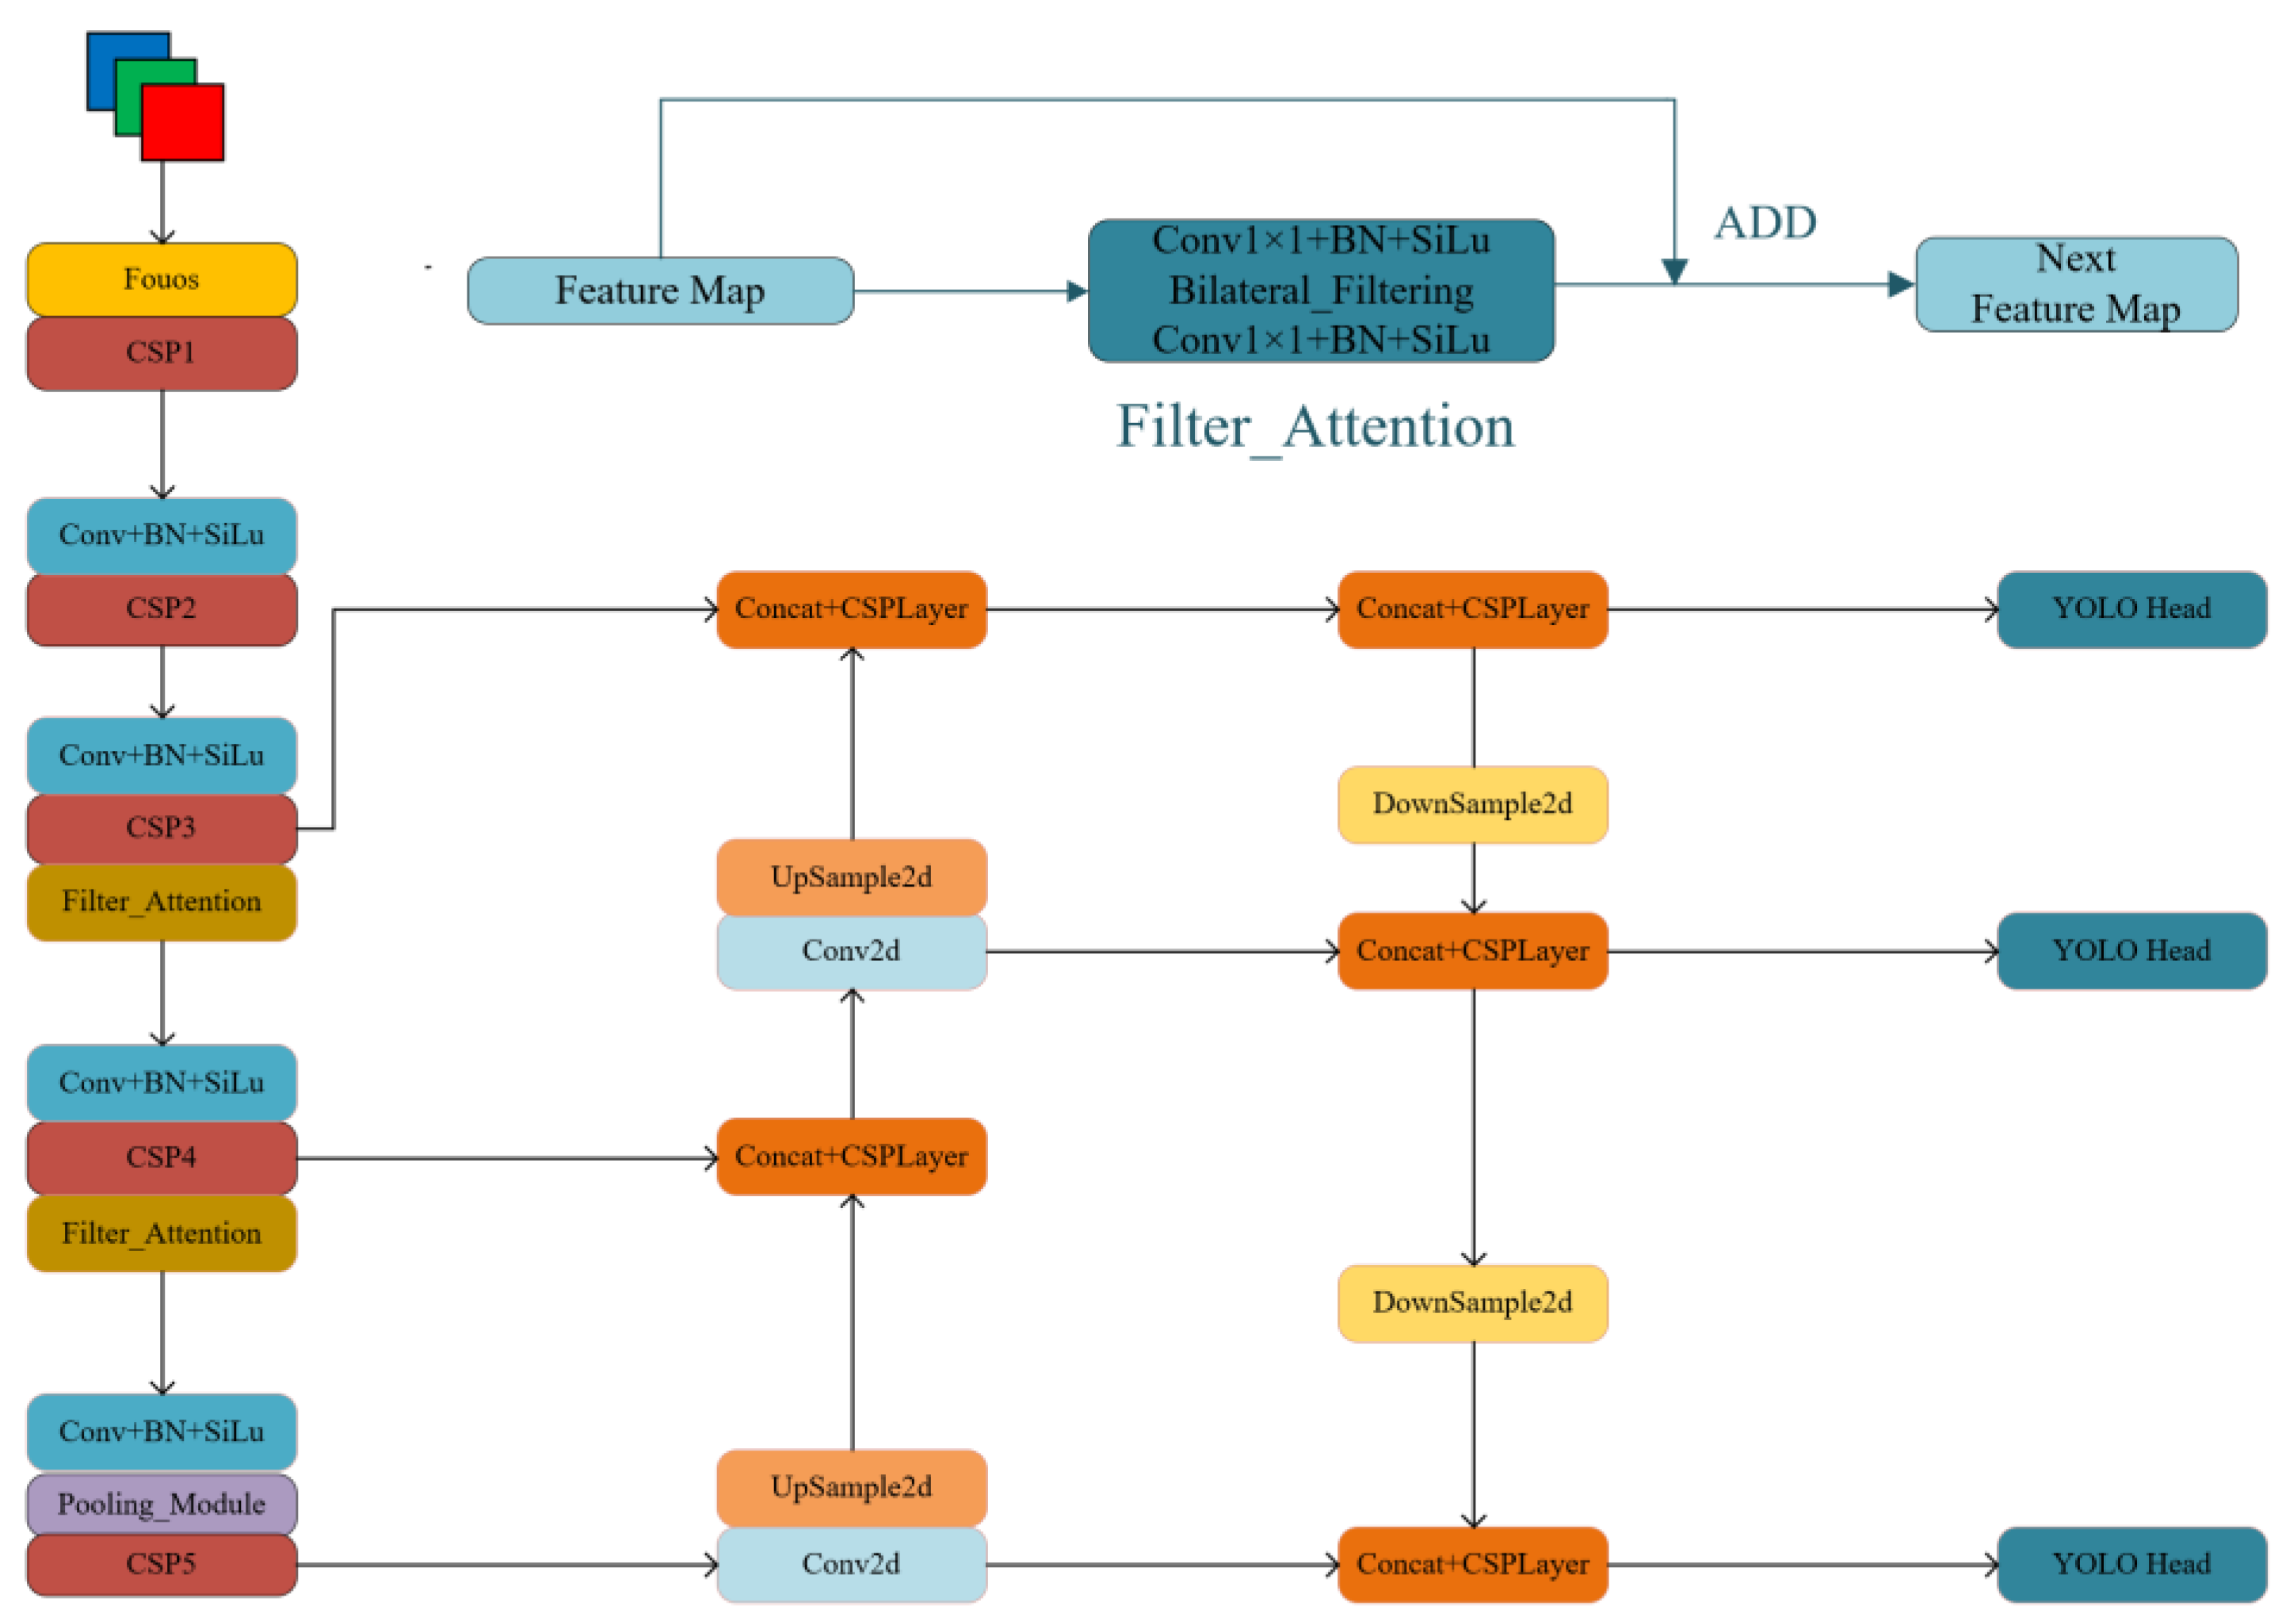
  • The complex environment of the cattle livestock farms and the input image with Gaussian noise, as well particle noise in the training stage of the model, harm the detection effect. This paper designs the Filter_Attention mechanism, based on a bilateral filtering algorithm, to reduce the noise interference in the training stage.
  • To solve the problem of image resolution loss associated with SPP structure, The SoftPooling algorithm is adopted to replace the SPP module. SoftPooling retains the defining activation features to the maximum extent. In Chapter 3, we designed ablation experiments to demonstrate that the method can improve the model’s sensitivity to small objects, especially for cattle head, legs, and tail.
  • An anchor box has a significant influence on the results. This work used the k-means ++ algorithm to cluster corresponding labels of relevant data to obtain anchor boxes more suitable for detecting cattle key parts.

2. Materials and Methods

2.1. Data Sources

The data set was collected from cattle livestock farms in Changtan village, Gold Ao, Changsha, Hunan Province, and manually labeled with Labelimg software. The camera is located in the cattle livestock farms, shooting from a downward angle, and the shooting range is the whole cattle livestock farm field. The video of cattle is transmitted to the cloud server through the network and can be downloaded by the software provided by the operator. The format is mp4, the resolution is 1920 pixels × 1080 pixels, and the frame rate is 24/s. The videos were screened, and the videos at night and without cattle were removed to extract the frames with apparent objects and different contents. Finally, a total of 1723 images of cattle were formed (as shown in Figure 1). All images are manually labeled in Pascal VOC format. A total of 8246 labels were obtained. The training, validation, and test sets are divided by 7:2:1.

2.2. Prediction and Classification of Bounding Boxes

The YOLO algorithm divides the input image into 13 × 13 grids. The prediction network generates the coordinates of the top left corner of the anchor box (xmin, ymin) and the right corner coordinates (xmax, ymax). If the center point of the anchor box predicted in each grid is offset from the center point of the grid, then the parameters of the bounding box are adjusted by Formulas (1)–(4).
b x = σ t x + c x
b y = σ t y + c y
b w = p w e t w
b h = p h e t h
where b x , b y , b w , and b h are the adjusted coordinates of the anchor box, σ is the sigmoid function; t x and t y are the coordinates of the center point of the grid;   c x and c y are the top-left coordinates of each grid; p w and p h are the height and width of the bounding box. Finally, e t h and e t w are adjustment coefficients.
The four coordinate values are trained according to Euclidean distance error loss. The YOLO algorithm predicts the confidence degree of each bounding box through logistic regression. If the predicted bounding box overlaps the true bounding box, and the predicted result is better than all other boundaries, the value of the box is “1”. Otherwise, the value is “0”. Classification prediction uses multi-label classification, and binary cross entropy loss was used for classification prediction during training.

2.3. Backbone Feature Extraction Network

This work used improved CSPDarkNet53 [35] as the backbone feature extraction network. CSP-Darknet53 is a local cross-stage residual network, and the input feature map is divided into PartA and PartB. In PartB, the feature map is activated by convolution, batch normalization [36], and activation function. Additionally, then, the activated feature map is input into the ResNet [37] network, and, at last, the output of PartB is directly added to PartA, without any processing, to make up the CSP module (the network is shown in Figure 2a). In the design of the backbone network, the receptive field of different dimensions is obtained by stacking CSP modules five times, which can extract more channel information and spatial information. The Foucus module downsamples the input image to obtain the appropriate size and to enter the backbone network. After the third and fourth CSP modules, Filter_Attention is added to effectively reduce the impact of particle noise and debris noise generated after convolution on the feature map, making each level of the feature layer smoother. After the fifth CSP module, the feature layer is input into the Pooling_Module, based on the soft pooling algorithm. The pooling sizes are 2, 3, and 5. Multiple receptive fields are fused to increase the semantic information of different dimensions.
In the feature fusion part, the semantic information of three scales in the backbone feature extraction network is aggregated to detect objects at different scales. FPN-PAN structure fuses the deep and shallow features and outputs the feature layers at 1/32, 1/16, and 1/8 of the original input feature map. For example, if the input image is 512 × 512, the three different scales of feature layers are 64 × 64, 32 × 32, and 16 × 16. The three scales of feature maps extracted by the backbone network are sent to the FPN-PAN structure for feature aggregation (as shown in Figure 2b), which improves the accuracy of cattle key parts. The FPN-PAN structure consists of bottom-up and top-down paths, as well as an effective multi-scale feature fusion method. The size of the feature layer is adjusted by upsampling and downsampling, and feature aggregation is mainly used to generate feature pyramids to enhance the detection of objects at different scales by the model and to achieve recognition of the same object at different sizes and scales.
We use these three feature layers at different scales to pass into Yolo_ Head to predict the location and classification information. Yolo_ Head contains two parts responsible for the classification and regression prediction; it directly gives the input image’s corresponding category and confidence level. Finally, Yolo_Head generates a prediction box based on the location information. The overall framework of our proposed model is shown in Figure 3.

2.3.1. Filter_Attention Module

Currently, convolution neural networks have been widely used in deep learning models. However, convolution computation and downsampling operations can frequently introduce too much particle noise, to the point of irreversible contamination of the extracted feature layers, directly leading to the detection effect’s degradation. To solve the above problems, this paper designed the Filter_Attention parameter to make the feature layers smoother. Bilateral filtering [38] is used to reduce the effect of particle noise on the detection results while maximizing the protection of edge information. Bilateral filtering is a weighted mean filtering algorithm, whose core is based on Gaussian filtering with the spatial information of pixel values (as shown in Equation (6)). The Filter_Attention module divides the input feature layer into two parts, FeatureA and FeatureB, where FeatureB undergoes 1 × 1 convolution, batch normalization, and an activation function to reduce the calculated cost, and, after this, theprocessed feature layer is denoised using the bilateral filtering algorithm, so that the edge information in the feature layer is effectively retained. Finally, the number of channels in the feature layer is adjusted to the original input channels by a 1 × 1 convolution, batch normalization, and activation function again. On the other hand, FeatureA, without any processing, directly adds to the feature map by the bilateral filtering algorithm, which is the output feature map of the Filter_Attention module (the structure of the Filter_Attention attention mechanism module is shown in Figure 4). The effectiveness of the Filter_Attention attention mechanism is given in the ablation experiment section in Chapter 3.
x 1 = x + B F x
B F I p = 1 W P q S G δ S   p q G δ r   I p I q I q
where x is the input feature layer, x 1 is the output for the Filter_Attention attention mechanism, B F x represents the bilateral filtering algorithm, including G δ S   p q weight information space; G δ r   I p I q is the area weight information; and 1 W P represents the normalization factor.

2.3.2. Pooling Layers

Convolution neural networks reduce the feature map size by erecting pooling layers. This step is significant for achieving local spatial invariance, so the pooling operation should reduce the computation effort while preserving the main features, preventing model overfitting, and reducing the redundancy of features; it should also engage in keeping the transformations undistorted, as well as maintaining rotation, translation, and scale invariance. The common pooling methods for convolution neural networks are average pooling (Avgpool) and maximum pooling (Maxpool). Avgpool averages all activation values, which balances all activation values and weakens the effect of peaks on the feature map; Maxpool only takes the maximum value in the pooling region, which may lead to a considerable loss of information. To make the network retain more helpful information during downsampling and perform better detection, Softpooling with exponentially weighted activation summation can be used. In the traditional Yolov5 structure, spatial pyramidal pooling (SPP) leads to a loss of feature map resolution, which increases the difficulty of detecting small objects. To enhance the feature extraction capability of the model, the softpool algorithm (structure shown in Figure 5) is introduced in this work [39], which can retain the descriptive activation features to the maximum extent and have better recognition capability for small objects.
  w i = e a i j R e a j
A = i R w i × a i
where; i and j are the subscripts of the pooling index, w i are the activation weights, e is the natural exponent constant, a i and a j denote the activation values of the pooling kernel of the feature map, R is the pooling kernel region, and A is the final output of the soft pooling.
Figure 5b shows that the soft pooling algorithm is based on the natural exponent “e”. The soft pooling algorithm selects a n × n pooling kernel region R, and then it calculates the activation weights, w i , of the pooling kernel region (as shown in Equation (7)), and it finally obtains the output of the algorithm by multiplying the weights, w i , of the calculated kernel regions with the activation mapping a i (as shown in Equation (8)). In this paper, we obtain different dimensions of semantic information and activation mapping by designing kernel regions with different values (2, 3, and 5). This paper fuses feature maps containing different semantic information to obtain more effective feature maps. This avoids the problem of information loss and gradient disappearance in back-propagation that exists in maximum pooling.
During the update phase of training, the gradients of all network parameters are updated according to the error derivatives calculated in the previous layer. At the same time, in the back-propagation phase of the network, since the softmax function is differentiable, each positive activation in the pooling kernel region can be assigned a minimum non-zero weight so that the gradient of each non-zero activation in the pooling kernel domain can be calculated, thus avoiding the problem of gradient disappearance in the maximum and random pools.

2.3.3. Optimized Design of the Anchor Box

Selecting the appropriate anchor box plays an important role in improving the effect of network training. Since the detection objects have the cattle body, cattle head, and cattle legs, their shape is different, and the initial anchor box obtained by the original Yolov5, based on the VOC data set, cannot meet the detection requirements. Although, the k-means algorithm randomly selects the initial value, resulting in poor clustering effect and stability. To reduce the error caused by the anchor box size, this paper selects the k-means++ algorithm to cluster data set labels and generate 9 groups of anchor boxes with different aspect ratios. The clustering results are shown in Figure 6. The clustering effect of this algorithm is more stable, and the anchor box generated is closer to the actual size distribution of the data set. The K-means++ algorithm proceeds as follows:
(a)
Randomly selects K objects from N samples, each of which represents the initial mean or center of mass of a cluster
(b)
Assigns the remaining objects to the closest cluster based on their Euclidean distance to the mean of each cluster
(c)
It uses the mean of the samples in each cluster as the new center of mass. Next, steps (b) and (c) are repeated sequentially until the cluster means no longer change, and the cluster centers no longer change.
where; the Euclidean distance d(x, y) between two n-dimensional vectors x = (x1, … ,xn) and y = (y1, … ,yn) is defined, as shown in Equation (9):
d x , y = i = 1 n x i y i 2

3. Experiments and Analyses

3.1. Experimental Platform Construction

The software environment and hardware environment configuration adopted for model training and testing in this paper are the Windows10 operating system, Pytorch deep Learning Framework, Cuda11.6, Cudnn8.1.1, OpenCV4.5.5, CPU-Intel i9-0000@1.80GHz, 16GBRAM, and GPU NVIDIA GeForce RTX 3080Ti.
In this experiment, the size of the input image was set as 416 × 416, and the image was scaled during model training. An amount of 500 iterations were carried out, and the training was divided into two stages. First, the backbone feature extraction network of the model was frozen, and 50 epochs were frozen. The batch size was set to 16, and the learning rate was set to 1 × 10⁻³. Then, unfreeze the backbone network and iterate the remaining 450 epochs. Set the batch_size of this stage to 8 and the learning rate to 1 × 10⁻⁴. In addition, the optimizer selects sdg; momentum is 0.937; weight decay is 5 × 10⁻⁵; data enhancement uses mosaic; num_works is 4.

3.2. Evaluation Indicators

In this paper, the intersection ratio (IoU) threshold between the prediction bounding box and the ground truth is greater than 0.5. The average accuracy (AP) is a comprehensive evaluation metric, combining precision and recall rate (area of P-R chart), mean average accuracy (mAP), and F1 value, which are selected as the evaluation metrics of the model. T P means that positive samples predicted by the model are positive classes;   F P indicates negative samples predicted by the model as positive classes;   F N denotes positive samples predicted by the model as negative classes. The calculation formula is as follows:
P = T P T P + F P
Precision indicates the ratio of the number of correct classifications among the results identified by the classifier on the entire test set, and it measures how well the classifier misclassifies the data set.
R = T P T P + F N
Recall represents the probability that all positive samples are correctly identified in the test set, and it measures how well the classifier misses the data set.
A P = 0 1 P R d R
m A P = i = 1 n A P n
The average precision is the area of the P-R chart, with recall on the horizontal axis and Precision on the vertical axis, and it is a value between 0 and 1. In practical applications, the AP metric curve is smoothed; for each point on the precision–recall curve, the accuracy value is taken as the maximum accuracy value to the right of that point. The mAP is the average value of the AP (average precision), and, when the values were higher, the detection effect of the algorithm was better.
F 1 = 2 P R P + R
The F1-score is the reconciled mean of precision and recall.

3.3. Ablation Experiments

Ablation experiments were conducted, based on the original Yolov5 algorithm, to verify the algorithm’s detection effect. Firstly, the anchor box, which is suitable for the cattle body, head, legs, and tail, is obtained by the k-means++ algorithm. The Filter_Attention attention mechanism is incorporated into the backbone feature extraction network. Secondly, based on the original feature extraction network, the SPP module is replaced by Pooling_Module. Finally, add both the Filter_Attention attention mechanism and the Pooling_Module. The experimental content and test results are shown in Table 1. Analyzing each improvement strategy’s contribution to the network shows that each module has improved the model’s overall performance to different degrees.
Where Yolov5 represents the traditional Yolov5 algorithm, and Yolov5a means that, based on the traditional Yolov5 algorithm, the k-means++ algorithm is used to obtain the experimental results of the more suitable anchor box. Yolov5b indicates that Filter_Attention is added to the backbone feature extraction network on the basis of Yolov5a. Yolov5b means that the SPP module is replaced by the Pooling_Module on the basis of Yolov5a. Finally, Ours means adding the Filter_Attention attention mechanism and the Pooling_Module pooling layer while adjusting the anchor box.
The traditional Yolov5 model is not sensitive to small objects, leading to insufficient cattle legs and tail detection ability. In the beginning, considering that the bounding box’s size significantly impacts detection results, this paper uses the K-means++ algorithm to cluster to obtain the suitable anchor box for this data set. Through the experiment, it was found that the mAP value of the model increased by 0.96% after adjusting the anchor box. In addition, the AP values of cattle body, legs, and tail increased by 1%, 1.21%, and 2.15%, respectively.
Secondly, the Yolov5b experiment added the Filter_Attention mechanism, based on the bilateral filter algorithm, to the backbone feature extraction network to remove the data noise in the input image, the particle noise, and the fragment noise generated in the convolution operation. The experiment shows that, after adding Filter_Attention, it is easy to find that introducing the attention mechanism successfully optimizes the recognition performance. The experiment showed that the performance of the model was improved after the addition of Filter_Attention, whose AP values of the body (95.17%), legs (88.06%), and tail (77.10%) of cattle prominently rose, and the mAP value was also increased by 3.2%.
The Yolov5c experiment introduced a soft pooling algorithm to replace the SPP module in the original model. According to the experimental results, mAP increased from 86.86% to 90.23%. Moreover, compared to the original model, the AP value and the F1 value are improved to some extent, and the tail detection performance is improved dramatically. This is due to the different kernels designed for the Pooling_Module module (2,3, and 5). The model can obtain different scale receptive fields and fuse different scale information, so the model is more sensitive. In this way, the gradient disappearance caused by computation underflow, caused by maximum pooling in backpropagation, is avoided, and more details are retained, effectively improving network performance.
Finally, the Ours method experiment added both the Filter_Attention attention mechanism and the Pooling_Module module to the backbone feature extraction network. The experimental results show that our method can improve the detection performance, and the AP value of the detection of cattle tail and cattle leg increases by 13.96% and 2.1%, and the F1 value increases by 0.22 and 0.05. In addition, the detection performance of individuals and the heads of cattle was further improved, with AP values of individuals and heads reaching 95.13% and 95.75%, and mAP values reached 90.74%. After the ablation experiments, it can be effectively demonstrated that our designed module can improve the performance of the original algorithm compared to the original model Yolov5. The improved model reduces error detection and omission detection.
Furthermore, to visualize the effectiveness of the proposed method, the visualization results of adding the Filter_Attention module and Pooling_Moudule module are shown in Figure 7. From top to bottom are the visualization results of our method and the traditional Yolov5 algorithm.

3.4. Comparative Experiments

The superiority of the model proposed in this paper is further verified, and the algorithm is compared with several object detection algorithms. These include Faster R-CNN, based on flexible non-maximum suppression and a feature pyramid in a two-stage detector, SSD with better comprehensive performance in a one-stage detector, and the CenterNet algorithm, based on a central point clustering algorithm. In the comparative experiment, the same super parameters are set on the data set of this paper for model training and testing. The experimental results are shown in Table 2. The SSD algorithm uses VGG16 as the backbone feature extraction network. Due to the depth of the network, it is not sensitive to small objects [29]. Although the SSD algorithm achieves 100% accuracy for cattle tail detection, the recall rate is only 4.29% which means that there are many missed detections, so the performance of the SSD algorithm could be better. Secondly, the core idea of the Effciendet algorithm proposes a bi-directional feature fusion strategy (Bi-FPN) to perform multi-feature cross-scale fusion faster. In this paper, ResNet50 is used as the backbone feature extraction network to train the Effcientdet algorithm. The experimental results show that the Effcientdet algorithm can accomplish result prediction quickly and accurately. Still, the Bi-FPN module introduces too much redundant information in the feature fusion part, which harms the module by introducing too much redundant information in the feature fusion part, which harms detecting small or obscured objects. Therefore, similar to the SSD algorithm, the performance is poor for legs and tails. As the representative of the two-stage objection detection algorithm, Faster-R-CNN (whose backbone is ResNet50) achieves the best recall of detection objects at the expense of too much detection time. Still, the overall detection accuracy could be higher. It means there is much false detection, which is not taken in practical applications. CenterNet, the object detection algorithm based on central-point clustering, has achieved good precision and recall rate, and the number of false and missed detections is within the acceptable range. However, our module has a 5.39% increase in mAP value compared with the CenterNet algorithm. The AP values of cattle body, cattle legs, cattle head, and cattle tail increased by 1.53%, 2.23%, 6.83%, and 10.98%, respectively.
Combined with the above experimental results, the algorithm proposed in this paper is an excellent key parts detection algorithm for cattle, with exceptional detection performance for each part, and it has a certain application value. In summary, our model considers detecting large and small objects and has a stable detection speed. It can be applied to the daily monitoring system of farms. The prediction results of different algorithms are shown in Figure 8, and, from left to right, are our method, the CenterNet algorithm, the Faster-R-CNN algorithm, and the SSD algorithm.

4. Discussion

With the development of deep learning, artificial intelligence has been widely used in agriculture. Key parts detection is not only applicable to cattle, but also to other livestock. References [40,41] use Faster-R-CNN and Yolov3-tiny algorithms to detect the body, head, and tail of pigs [42]. The extraction of dog face information was completed using the Yolov3 detector, and breed classification was completed using deep learning algorithms. Detecting animal key parts is the basis for research into automatic BCS, individual recognition, and behavior recognition [43,44]. A computer vision system was used to assess the fat cover on the back of cows and automatically determine the BCS [45]. A combination of machine learning and deep learning algorithms detected the face and eyes of pigs in the input image and then completed individual pig recognition using a classification algorithm [46]. The RIOS frame-level detector first detects the cattle in the video. Features are extracted by spatial–temporal context, and finally, spatial–temporal behavior recognition is completed. Table 3 compares our proposed method and other animal key parts detection methods.
The method proposed in this paper has achieved the detection of key parts of cattle to a certain extent. However, overlap, congestion, and lights change in the cattle livestock farms can make accurate detection difficult. Therefore, it is significant to overcome the overlap and congestion in the cattle livestock farms and to realize the detection of key parts of beef cattle at night. In addition, detection speed is also an integral part of the application. Further improvements and optimizations are needed in future work to obtain a cattle key parts detection algorithm with high detection speed and accuracy.

5. Conclusions

To achieve cattle key parts detection in natural scenes, this work proposed the Filter_Attention mechanism, based on bilateral filtering, and the Pooling_Module, based on the soft pooling algorithm, to locate and identify cattle key parts accurately. The Filter_Attention mechanism was added to the backbone feature extraction network to remove the Gaussian noise in the input image, as well as the particle and fragment noise generated during the convolution operation. The SPP module was replaced by the Pooling_Module, based on the soft pooling algorithm. The problem of gradient disappearance, caused by the maximum pooling algorithm, is eliminated, and more details are retained, increasing the model’s detection ability for small objects. Finally, to obtain an anchor box that is more suitable for the detection of key parts of cattle through the k-means ++ algorithm, we reduced the influence of the bounding box on detection results.
Experiments show that the proposed model has 90.74% mAP on the data set, and the AP and F1 values of each part have been improved to varying degrees. The model can accurately and widely identify the cattle key parts. Compared with other object detection algorithms, the model proposed in this paper has excellent advantages in comprehensive performance and can meet the requirements for identifying cattle key parts in the natural scenes of livestock farms. Future work is to improve the model’s detection speed and generalization ability while ensuring the accuracy and recall rate, so that it can be applied to the relevant cattle supervision system.

Author Contributions

Conceptualization, Z.H. and K.S.; methodology, D.S., Z.H. and H.F.; software, Z.H.; validation, D.S., Z.H. and H.F.; investigation, Z.H.; data curation, K.S.; writing—original draft preparation, Z.H.; writing—review and editing, D.S. and H.F.; visualization, Z.H.; supervision, D.S. and H.F.; funding acquisition, D.S. All authors have read and agreed to the published version of the manuscript.

Funding

This work is supported by National Natural Science Foundation of China (Grant NO.62266025).

Institutional Review Board Statement

Not applicable.

Informed Consent Statement

Informed consent was obtained from all subjects involved in the study.

Data Availability Statement

The data presented in this study are available from the corresponding author upon reasonable request.

Acknowledgments

We wish to provide thanks for the data provided by Changsha Golden cattle breeding livestock.

Conflicts of Interest

The authors declare no conflict of interest.

References

  1. Bai, Q.; Gao, R.; Zhao, C.; Li, Q.; Wang, R.; Li, S. Multi-scale behavior recognition method for dairy cows based on improved YOLOV5s network. Trans. Chin. Soc. Agric. Eng. 2022, 38, 163–172. [Google Scholar]
  2. Wang, R.; Gao, Z.; Li, Q.; Zhao, C.; Gao, R.; Zhang, H.; Li, S.; Feng, L. Detection Method of Cow Estrus Behavior in Natural Scenes Based on Improved YOLOv5. Agriculture 2022, 12, 1339. [Google Scholar] [CrossRef]
  3. Beggs, D.S.; Jongman, E.C.; Hemsworth, P.H.; Fisher, A.D. Lame cows on Australian dairy farms: A comparison of farmer-identified lameness and formal lameness scoring, and the position of lame cows within the milking order. J. Dairy Sci. 2019, 102, 1522–1529. [Google Scholar] [CrossRef] [PubMed]
  4. Duraiswami, N.R.; Bhalerao, S.; Watni, A.; Aher, C.N. Cattle Breed Detection and Categorization Using Image Processing and Machine Learning. In Proceedings of the 2022 International Conference on Advancements in Smart, Secure and Intelligent Computing (ASSIC), Bhubaneswar, India, 19–20 November 2022; pp. 1–6. [Google Scholar] [CrossRef]
  5. Yılmaz, A.; Uzun, G.N.; Gürbüz, M.Z.; Kıvrak, O. Detection and Breed Classification of Cattle Using YOLO v4 Algorithm. In Proceedings of the 2021 International Conference on Innovations in Intelligent Systems and Applications (INISTA), Kocaeli, Turkey, 25–27 August 2021; pp. 1–4. [Google Scholar] [CrossRef]
  6. Xu, B.; Wang, W.; Guo, L.; Chen, G.; Li, Y.; Cao, Z.; Wu, S. CattleFaceNet: A cattle face identification approach based on RetinaFace and ArcFace loss. Comput. Electron. Agric. 2022, 193, 106675. [Google Scholar] [CrossRef]
  7. Neethirajan, S. Happy Cow or Thinking Pig? WUR Wolf—Facial Coding Platform for Measuring Emotions in Farm Animals. AI 2021, 2, 342–354. [Google Scholar] [CrossRef]
  8. Kang, X.; Zhang, X.D.; Liu, G. Accurate detection of lameness in dairy cattle with computer vision: A new and individualized detection strategy based on the analysis of the supporting phase. J. Dairy Sci. 2020, 103, 10628–10638. [Google Scholar] [CrossRef]
  9. Gardenier, J.; Underwood, J.; Clark, C. Object Detection for Cattle Gait Tracking. In Proceedings of the 2018 IEEE International Conference on Robotics and Automation (ICRA), Brisbane, QLD, Australia, 21–25 May 2018; pp. 2206–2213. [Google Scholar] [CrossRef]
  10. Song, X.; Bokkers, E.; van Mourik, S.; Koerkamp, P.G.; van der Tol, P. Automated body condition scoring of dairy cows using 3-dimensional feature extraction from multiple body regions. J. Dairy Sci. 2019, 102, 4294–4308. [Google Scholar] [CrossRef]
  11. Tzanidakis, C.; Tzamaloukas, O.; Simitzis, P.; Panagakis, P. Precision Livestock Farming Applications (PLF) for Grazing Animals. Agriculture 2023, 13, 288. [Google Scholar] [CrossRef]
  12. Huang, X.; Li, X.; Hu, Z. Cow tail detection method for body condition score using faster R-CNN. In Proceedings of the IEEE International Conference on Unmanned Systems and Artificial Intelligence (ICUSAI), Xi’an, China, 22–24 November 2019; pp. 347–351. [Google Scholar]
  13. Smith, D.; Little, B.; Greenwood, P.I.; Valencia, P.; Rahman, A.; Ingham, A.; Bishop-Hurley, G.; Shahriar, M.S.; Hellicar, A. A study of sensor derived features in cattle behaviour classification models. In Proceedings of the 2015 IEEE SENSORS, Busan, Republic of Korea, 1–4 November 2015; IEEE: New York, NY, USA, 2015; pp. 1–4. [Google Scholar]
  14. Wang, K.; Wu, P.; Cui, H.; Xuan, C.; Su, H. Identification and classification for sheep foraging behavior based on acoustic signal and deep learning. Comput. Electron. Agric. 2021, 187, 106275. [Google Scholar] [CrossRef]
  15. Zhao, K.X.; He, D.J. Target detection method for moving cows based on background subtraction. Int. J. Agric. Biol. Eng. 2015, 8, 42–49. [Google Scholar]
  16. Li, G.; He, D.; Zhao, K.; Lei, Y. Decomposing of Cows’ Body Parts based on Skeleton Feature. J. Agric. Sci. Technol. 2017, 19, 87–94. [Google Scholar] [CrossRef]
  17. Shao, W.; Kawakami, R.; Yoshihashi, R.; You, S.; Kawase, H.; Naemura, T. Cattle detection and counting in UAV images based on convolutional neural networks. Int. J. Remote Sens. 2020, 41, 31–52. [Google Scholar] [CrossRef]
  18. Jiang, B.; Wu, Q.; Yin, X.; Wu, D.; Song, H.; He, D. FLYOLOv3 deep learning for key parts of dairy cow body detection. Comput. Electron. Agric. 2019, 166, 104982. [Google Scholar] [CrossRef]
  19. Shen, W.; Hu, H.; Dai, B.; Wei, X.; Sun, J.; Jiang, L.; Sun, Y. Individual identification of dairy cows based on convolutional neural networks. Multimed. Tools Appl. 2020, 79, 14711–14724. [Google Scholar] [CrossRef]
  20. Huang, X.; Hu, Z.; Qiao, Y.; Sukkarieh, S. Deep Learning-Based Cow Tail Detection and Tracking for Precision Livestock Farming. IEEE/ASME Trans. Mechatron. 2022. early access. [Google Scholar] [CrossRef]
  21. Qiao, Y.; Guo, Y.; He, D. Cattle body detection based on YOLOv5-ASFF for precision livestock farming. Comput. Electron. Agric. 2023, 204, 107579. [Google Scholar] [CrossRef]
  22. Xiao, J.; Liu, G.; Wang, K.; Si, Y. Cow identification in free-stall barns based on an improved Mask R-CNN and an SVM. Comput. Electron. Agric. 2022, 194, 106738. [Google Scholar] [CrossRef]
  23. Weng, Z.; Meng, F.; Liu, S.; Zhang, Y.; Zheng, Z.; Gong, C. Cattle face recognition based on a Two-Branch convolutional neural network. Comput. Electron. Agric. 2022, 196, 106871. [Google Scholar] [CrossRef]
  24. Xu, B.; Wang, W.; Guo, L.; Chen, G.; Wang, Y.; Zhang, W.; Li, Y. Evaluation of Deep Learning for Automatic Multi-View Face Detection in Cattle. Agriculture 2021, 11, 1062. [Google Scholar] [CrossRef]
  25. Dalal, N.; Triggs, B. Histograms of oriented gradients for human detection. In Proceedings of the 2005 IEEE Computer Society Conference on Computer Vision and Pattern Recognition (CVPR’05), San Diego, CA, USA, 20–25 June 2005; Volume 1, pp. 886–893. [Google Scholar] [CrossRef]
  26. Krizhevsky, A.; Sutskever, I.; Hinton, G.E. ImageNet classification with deep convolutional neural networks. Commun. ACM 2017, 60, 84–90. [Google Scholar] [CrossRef]
  27. Redmon, J.; Divvala, S.; Girshick, R.; Farhadi, A. You Only Look Once: Unified, Real-Time Object Detection. In Proceedings of the 2016 IEEE Conference on Computer Vision and Pattern Recognition (CVPR), Las Vegas, NV, USA, 27–30 June 2016; pp. 779–788. [Google Scholar] [CrossRef]
  28. Redmon, J.; Farhadi, A. YOLOv3: An incremental improvement. arXiv 2018, arXiv:1804.02767. [Google Scholar]
  29. Liu, W.; Anguelov, D.; Erhan, D.; Szegedy, C.; Reed, S.; Fu, C.-Y.; Berg, A.C. SSD: Single shot multibox detector. In Proceedings of the Computer Vision—ECCV, Amsterdam, The Netherlands, 11–14 October 2016; Leibe, B., Matas, J., Sebe, N., Welling, M., Eds.; Springer: Cham, Switzerland, 2016; pp. 21–37. [Google Scholar]
  30. Zhang, Y.; Zhou, W.; Wang, Y.; Xu, L. A real-time recognition method of static gesture based on DSSD. Multimed. Tools Appl. 2020, 79, 17445–17461. [Google Scholar] [CrossRef]
  31. Girshick, R. Fast R-CNN. In Proceedings of the IEEE International Computer Vision (ICCV), Santiago, Chile, 7–13 December 2015; pp. 1440–1448. [Google Scholar]
  32. Ren, S.; He, K.; Girshick, R.; Sun, J. Faster R-CNN: Towards real-time object detection with region proposal networks. IEEE Trans. Pattern Anal. Mach. Intell. 2017, 39, 1137–1149. [Google Scholar] [CrossRef] [PubMed]
  33. Law, H.; Deng, J. CornerNet: Detecting Objects as Paired Keypoints. Int. J. Comput. Vis. 2020, 128, 642–656. [Google Scholar] [CrossRef]
  34. Duan, K.; Bai, S.; Xie, L.; Qi, H.; Huang, Q.; Tian, Q. CenterNet: Keypoint Triplets for Object Detection. In Proceedings of the 2019 IEEE/CVF International Conference on Computer Vision (ICCV), Seoul, Republic of Korea, 27 October–2 November 2019; pp. 6568–6577. [Google Scholar] [CrossRef]
  35. Wang, C.-Y.; Liao, H.-Y.M.; Wu, Y.-H.; Chen, P.-Y.; Hsieh, J.-W.; Yeh, I.-H. CSPNet: A New Backbone that can Enhance Learning Capability of CNN. In Proceedings of the 2020 IEEE/CVF Conference on Computer Vision and Pattern Recognition, Seattle, WA, USA, 13–19 June 2020. [Google Scholar]
  36. Singh, S.; Krishnan, S. Filter Response Normalization Layer: Eliminating Batch Dependence in the Training of Deep Neural Networks. arXiv 2019, arXiv:1911.09737. [Google Scholar] [CrossRef]
  37. He, K.; Zhang, X.; Ren, S.; Sun, J. Deep Residual Learning for Image Recognition. In Proceedings of the 2016 IEEE Conference on Computer Vision and Pattern Recognition (CVPR), Las Vegas, NV, USA, 27–30 June 2016; pp. 770–778. [Google Scholar] [CrossRef]
  38. Tomasi, C.; Manduchi, R. Bilateral filtering for gray and color images. In Proceedings of the Sixth International Conference on Computer Vision (IEEE Cat. No.98CH36271), Bombay, India, 7 January 1998; pp. 839–846. [Google Scholar] [CrossRef]
  39. Stergiou, A.; Poppe, R.; Kalliatakis, G. Refining activation downsampling with SoftPool. In Proceedings of the 2021 IEEE/CVF International Conference on Computer Vision (ICCV), Montreal, BC, Canada, 11–17 October 2021; pp. 10337–10346. [Google Scholar] [CrossRef]
  40. Xiao, D.Q.; Lin, S.C.; Liu, Y.F.; Yang, Q.M.; Wu, H.L. Group-housed pigs and their body parts detection with Cascade Faster R-CNN. Int. J. Agric. Biol. Eng. 2022, 15, 203–209. [Google Scholar] [CrossRef]
  41. Ocepek, M.; Žnidar, A.; Lavrič, M.; Škorjanc, D.; Andersen, I.L. DigiPig: First Developments of an Automated Monitoring System for Body, Head and Tail Detection in Intensive Pig Farming. Agriculture 2022, 12, 2. [Google Scholar] [CrossRef]
  42. Wang, C.; Wang, J.; Du, Q.; Yang, X. Dog Breed Classification Based on Deep Learning. In Proceedings of the 2020 13th International Symposium on Computational Intelligence and Design (ISCID), Hangzhou, China, 12–13 December 2020; pp. 209–212. [Google Scholar] [CrossRef]
  43. Wu, Y.; Guo, H.; Li, Z.; Ma, Q.; Zhao, Y.; Pezzuolo, A. Body Condition Score for Dairy Cows Method Based on Vision Transformer. In Proceedings of the 2021 IEEE International Workshop on Metrology for Agriculture and Forestry (MetroAgriFor), Trento-Bolzano, Italy, 3–5 November 2021; pp. 37–41. [Google Scholar] [CrossRef]
  44. Zhao, K.X.; Shelley, A.N.; Lau, D.L.; Dolecheck, K.A.; Bewley, J.M. Automatic body condition scoring system for dairy cows based on depth-image analysis. Int. J. Agric. Biol. Eng. 2020, 13, 45–54. [Google Scholar] [CrossRef]
  45. Marsot, M.; Mei, J.; Shan, X.; Ye, L.; Feng, P.; Yan, X.; Li, C.; Zhao, Y. An adaptive pig face recognition approach using Convolutional Neural Networks. Comput. Electron. Agric. 2020, 173, 105386. [Google Scholar] [CrossRef]
  46. Fuentes, A.; Yoon, S.; Park, J.; Park, D.S. Deep learning-based hierarchical cattle behavior recognition with spatio-temporal information. Comput. Electron. Agric. 2020, 177, 105627. [Google Scholar] [CrossRef]
  47. Hu, H.; Dai, B.; Shen, W.; Wei, X.; Sun, J.; Li, R.; Zhang, Y. Cow identification based on fusion of deep parts features. Biosyst. Eng. 2020, 192, 245–256. [Google Scholar] [CrossRef]
Figure 1. (a) Represents the structure of cattle livestock farms and the data acquisition process. (b) Samples of manual labeling of cattle key parts. The Chinese sentence in the upper left corner indicates the picture’s date.
Agriculture 13 01110 g001
Figure 2. (a) Shows the construct of the CSPNet Module. (b) Shows the FPN-PAN structure.
Agriculture 13 01110 g002
Figure 3. The construct of improved Yolov5.
Agriculture 13 01110 g003
Figure 4. The construct of the Filter_Attention attention mechanism.
Agriculture 13 01110 g004
Figure 5. (a) Represents the construct of the Pooling_Module, based on the soft pooling algorithm. (b) The details of soft pooling algorithm: the original image is subsampled with a 2 × 2 (k = 2) kernel. The output is based on the exponentially weighted sum of the original pixels within the kernel region.
Agriculture 13 01110 g005
Figure 6. The updated anchor box was obtained using the k-means ++ algorithm. The black cross mark in the figure indicates the size of the anchor box obtained after clustering. They are: (37,62); (23,116); (47,131); (30,193); (51,247); (95,209); (134,141); (225,369); and (523,533).
Agriculture 13 01110 g006
Figure 7. Visual illustration of our methods.
Agriculture 13 01110 g007
Figure 8. Prediction results of different object detection algorithms. From left to right are our method, the CenterNet algorithm, the Faster-R-CNN algorithm, and the SSD algorithm.
Agriculture 13 01110 g008
Table 1. Detection results of the ablation experiments.
AlgorithmAPF1mAP
CowHeadLegTailCowHeadLegTail
Yolov593.0294.3686.0270.190.870.910.800.5685.90
Yolov5a94.0293.8087.2172.340.880.900.810.6786.86
Yolov5b95.1796.0988.0677.100.910.910.810.7289.10
Yolov5c95.9195.9989.0880.730.920.910.810.7190.23
Ours95.1395.7588.1283.960.900.920.850.7890.74
Table 2. Detection results of the ablation experiments.
AlgorithmPartsAPF1RecallPrecisionmAP
SSD-VGG16Cow92.880.8689.7282.5577.35
Haed94.340.9090.0989.32
Leg78.500.7059.3186.12
Tail43.680.084.29100
Effcientdet-ResNet50Cow94.560.9190.5191.6071.72
Head92.040.9088.7990.75
Leg74.120.5741.9189.53
Tail26.170.137.14100
Faster-R-CNN-ResNet50Cow92.040.8296.0571.4781.45
Head92.900.8792.6782.69
Leg79.870.6985.0558.12
Tail61.010.6170.0054.44
CenterNet-ResNet50Cow93.600.9087.7592.5085.35
Head93.520.9290.5294.17
Leg81.290.7973.2886.67
Tail72.980.6854.2990.48
OursCow95.130.9292.0988.2690.74
Head95.750.9289.6694.12
Leg88.120.8579.6690.53
Tail83.960.7867.1492.16
Table 3. It shows the detection performance comparison between Ours, related methods, and existing works on the same evaluation metric.
ReferencesPrecision%AP%Detection Parts/Species
[18]-90.91; 99.45; 90.83Head + Trunk + Leg/cow
[19]-80.51; 97.44; 86.67Head + Trunk + Leg/cow
[47]-72.88; 93.98; 84.86Head + Trunk + Leg/cow
[40]-92.5; 90.5; 96.5Head + Back + Tail/pig
[41]96; 66; 76-Pig + Head + Tail/pig
Ours94.12; 88.26; 90.5395.13; 95.75; 88.12Head + Trunk + Leg/cattle
Disclaimer/Publisher’s Note: The statements, opinions and data contained in all publications are solely those of the individual author(s) and contributor(s) and not of MDPI and/or the editor(s). MDPI and/or the editor(s) disclaim responsibility for any injury to people or property resulting from any ideas, methods, instructions or products referred to in the content.

