
Eco-Efficiency and Its Determinants: The Case of the Italian Beef Cattle Sector

Abstract
:1. Introduction
- (1)
- Determination of the eco-efficiency level and the potential output increase (input reduction) in inefficient Decision-Making Units (DMUs), under the hypothesis of different returns to scale;
- (2)
- Analysis of the effects on efficiency scores of structural and environmental factors characterizing farm management.
2. Materials and Methods
2.1. Data Collection
2.2. Two-Stage DEA Framework
2.2.1. First Stage: DEA Method
2.2.2. Estimation Environmental Pressure Abatement Potentials
2.2.3. Second Stage: Censored Regression Analysis
- (1)
- the marginal effects for the expected value of conditional on being uncensored,
- (2)
- the marginal effects for the unconditional expected value of [66]. Such an approach allows us to account for differences, between inefficient and efficient farms, in the effects of the covariates on the efficiency scores. The Stata 12 package was used to carry out all the statistical analyses.
3. Results and Discussions
3.1. Descriptive Statistics of the First- and Second-Stage Variables
3.2. First Stage: DEA Results
3.2.1. Eco-Efficiency Estimation
3.2.2. Polluting Inputs Potential Reductions
3.2.3. Second Stage: Eco-Efficiency Determinants
4. Conclusions
Author Contributions
Funding
Institutional Review Board Statement
Informed Consent Statement
Data Availability Statement
Acknowledgments
Conflicts of Interest
References
- Intergovernmental Panel on Climate Change Climate Change and Land. In IPCC Special Report on Climate Change, Desertification, Land Degradation, Sustainable Land Management, Food Security, and Greenhouse Gas Fluxes in Terrestrial Ecosystems, 1st ed.; Cambridge University Press: Cambridge, UK, 2022; ISBN 978-1-00-915798-8.
- IEA. Energy and Air Pollution; World Energy Outlook 2016 Special Report; IEA: Paris, France, 2016. [Google Scholar]
- FAO. Transforming Food and Agriculture to Achieve the SDGs: 20 Interconnected Actions to Guide Decision-Makers; Food and Agriculture Organization of the United Nations: Rome, Italy, 2018. [Google Scholar]
- Mariantonietta, F.; Alessia, S.; Francesco, C.; Giustina, P. GHG and Cattle Farming: CO-Assessing the Emissions and Economic Performances in Italy. J. Clean. Prod. 2018, 172, 3704–3712. [Google Scholar] [CrossRef]
- Manlay, R.J.; Ickowicz, A.; Masse, D.; Feller, C.; Richard, D. Spatial Carbon, Nitrogen and Phosphorus Budget in a Village of the West African Savanna—II. Element Flows and Functioning of a Mixed-Farming System. Agric. Syst. 2004, 79, 83–107. [Google Scholar] [CrossRef]
- Commission, E. The European Green Deal. Eur. Comm. 2019, 53, 24. [Google Scholar]
- Zhou, C.; Shi, C.; Wang, S.; Zhang, G. Estimation of Eco-Efficiency and Its Influencing Factors in Guangdong Province Based on Super-SBM and Panel Regression Models. Ecol. Indic. 2018, 86, 67–80. [Google Scholar] [CrossRef]
- Staniszewski, J. Attempting to Measure Sustainable Intensification of Agriculture in Countries of the European Union. J. Environ. Prot. Ecol. 2018, 19, 949–957. [Google Scholar]
- Stępień, S.; Czyżewski, B.; Sapa, A.; Borychowski, M.; Poczta, W.; Poczta-Wajda, A. Eco-Efficiency of Small-Scale Farming in Poland and Its Institutional Drivers. J. Clean. Prod. 2021, 279, 123721. [Google Scholar] [CrossRef]
- Martinsson, E.; Hansson, H. Adjusting Eco-Efficiency to Greenhouse Gas Emissions Targets at Farm Level—The Case of Swedish Dairy Farms. J. Environ. Manag. 2021, 287, 112313. [Google Scholar] [CrossRef]
- Soteriades, A.D.; Foskolos, A.; Styles, D.; Gibbons, J.M. Maintaining Production While Reducing Local and Global Environmental Emissions in Dairy Farming. J. Environ. Manag. 2020, 272, 111054. [Google Scholar] [CrossRef]
- Pérez Urdiales, M.; Lansink, A.O.; Wall, A. Eco-Efficiency Among Dairy Farmers: The Importance of Socio-Economic Characteristics and Farmer Attitudes. Environ. Resour. Econ. 2016, 64, 559–574. [Google Scholar] [CrossRef]
- Herrero, M.; Havlík, P.; Valin, H.; Notenbaert, A.; Rufino, M.C.; Thornton, P.K.; Blümmel, M.; Weiss, F.; Grace, D.; Obersteiner, M. Biomass Use, Production, Feed Efficiencies, and Greenhouse Gas Emissions from Global Livestock Systems. Proc. Natl. Acad. Sci. USA 2013, 110, 20888–20893. [Google Scholar] [CrossRef]
- Kuosmanen, T.; Kortelainen, M. Measuring Eco-efficiency of Production with Data Envelopment Analysis. J. Ind. Ecol. 2005, 9, 59–72. [Google Scholar] [CrossRef]
- Herrero, M.; Thornton, P.K.; Gerber, P.; Reid, R.S.; Bank, F.A.O.W.; Herrero, M.; Thornton, P.K.; Gerber, P.; Reid, R.S. Livestock, Livelihoods and the Environment: Understanding the Trade-Offs. Curr. Opin. Environ. Sustain. 2009, 1, 111–120. [Google Scholar] [CrossRef]
- Opio, C.; Gerber, P.; Mottet, A.; Falcucci, A.; Tempio, G.; MacLeod, M.; Vellinga, T.; Henderson, B.; Steinfeld, H. Greenhouse Gas Emissions from Ruminant Supply Chains–A Global Life Cycle Assessment; FAO: Rome, Italy, 2013; ISBN 978-92-5-107945-4. [Google Scholar]
- Li, L.-B.; Hu, J.-L. Ecological Total-Factor Energy Efficiency of Regions in China. Energy Policy 2012, 46, 216–224. [Google Scholar] [CrossRef]
- Choi, Y.; Zhang, N.; Zhou, P. Efficiency and Abatement Costs of Energy-Related CO2 Emissions in China: A Slacks-Based Efficiency Measure. Appl. Energy 2012, 98, 198–208. [Google Scholar] [CrossRef]
- Asmare, E.; Begashaw, A. Review on Parametric and Nonparametric Methods of Efficiency Analysis. Biostat. Bioinform. 2018, 2, 1–7. [Google Scholar]
- Charnes, A.; Cooper, W.; Lewin, A.Y.; Seiford, L.M. Data Envelopment Analysis Theory, Methodology and Applications. J. Oper. Res. Soc. 1997, 48, 332–333. [Google Scholar] [CrossRef]
- Charnes, A.; Cooper, W.W.; Rhodes, E. Measuring the Efficiency of Decision Making Units. Eur. J. Oper. Res. 1978, 2, 429–444. [Google Scholar] [CrossRef]
- Lansink, A.O.; Wall, A. Frontier Models for Evaluating Environmental Efficiency: An Overview. Econ. Bus. Lett. 2014, 3, 43–50. [Google Scholar] [CrossRef]
- Khan, S.; Ramli, R.; Baten, M.D. A Slack Based Enhanced DEA Model with Undesirable Outputs for Rice Growing Farmers Efficiency Measurement. Int. J. Suppl. Chain. Manag. 2018, 7, 194–200. [Google Scholar]
- Ramli, N.A. Modeling Undesirable Factors in Efficiency Evaluation with an Application to the Malaysian Manufacturing Sector/Noor Asiah Bt Ramli. PhD Thesis, University of Malaya, Kuala Lumpur, Malaysia, 2013. [Google Scholar]
- Scheel, H. Undesirable Outputs in Efficiency Valuations. Eur. J. Oper. Res. 2001, 132, 400–410. [Google Scholar] [CrossRef]
- Iribarren, D.; Hospido, A.; Moreira, M.T.; Feijoo, G. Benchmarking Environmental and Operational Parameters through Eco-Efficiency Criteria for Dairy Farms. Sci. Total Environ. 2011, 409, 1786–1798. [Google Scholar] [CrossRef] [PubMed]
- Zhang, B.; Bi, J.; Fan, Z.; Yuan, Z.; Ge, J. Eco-Efficiency Analysis of Industrial System in China: A Data Envelopment Analysis Approach. Ecol. Econ. 2008, 68, 306–316. [Google Scholar] [CrossRef]
- Reinhard, S.; Lovell, C.A.K.; Thijssen, G. Analysis of Environmental Efficiency Variation. Am. J. Agric. Econ. 2002, 84, 1054–1065. [Google Scholar] [CrossRef]
- Lovell, C.K.; Pastor, J.T. Units Invariant and Translation Invariant DEA Models. Oper. Res. Lett. 1995, 18, 147–151. [Google Scholar] [CrossRef]
- Golany, B.; Roll, Y. An Application Procedure for DEA. Omega 1989, 17, 237–250. [Google Scholar] [CrossRef]
- Heinrichs, A.J.; Jones, C.M.; Gray, S.M.; Heinrichs, P.A.; Cornelisse, S.A.; Goodling, R.C. Identifying Efficient Dairy Heifer Producers Using Production Costs and Data Envelopment Analysis. J. Dairy Sci. 2013, 96, 7355–7362. [Google Scholar] [CrossRef] [PubMed]
- D’Haese, M.; Speelman, S.; Alary, V.; Tillard, E.; D’Haese, L. Efficiency in Milk Production on Reunion Island: Dealing with Land Scarcity. J. Dairy Sci. 2009, 92, 3676–3683. [Google Scholar] [CrossRef]
- Stokes, J.R.; Tozer, P.R.; Hyde, J. Identifying Efficient Dairy Producers Using Data Envelopment Analysis. J. Dairy Sci. 2007, 90, 2555–2562. [Google Scholar] [CrossRef]
- Balcombe, K.; Fraser, I.; Kim, J.H. Estimating Technical Efficiency of Australian Dairy Farms Using Alternative Frontier Methodologies. Appl. Econ. 2006, 38, 2221–2236. [Google Scholar] [CrossRef]
- Mbaga, M.D.; Romain, R.; Larue, B.; Lebel, L. Assessing Technical Efficiency of Quebec Dairy Farms. Can. J. Agric. Econ. Can. Daposagroeconomie 2003, 51, 121–137. [Google Scholar] [CrossRef]
- Hosseinzadeh-Bandbafha, H.; Safarzadeh, D.; Ahmadi, E.; Nabavi-Pelesaraei, A. Optimization of Energy Consumption of Dairy Farms Using Data Envelopment Analysis–A Case Study: Qazvin City of Iran. J. Saudi Soc. Agric. Sci. 2018, 17, 217–228. [Google Scholar] [CrossRef]
- Wettemann, P.J.C.; Latacz-Lohmann, U. An Efficiency-Based Concept to Assess Potential Cost and Greenhouse Gas Savings on German Dairy Farms. Agric. Syst. 2017, 152, 27–37. [Google Scholar] [CrossRef]
- Berre, D.; Blancard, S.; Boussemart, J.-P.; Leleu, H.; Tillard, E. Finding the Right Compromise between Productivity and Environmental Efficiency on High Input Tropical Dairy Farms: A Case Study. J. Environ. Manag. 2014, 146, 235–244. [Google Scholar] [CrossRef] [PubMed]
- Shortall, O.K.; Barnes, A.P. Greenhouse Gas Emissions and the Technical Efficiency of Dairy Farmers. Ecol. Indic. 2013, 29, 478–488. [Google Scholar] [CrossRef]
- Toma, L.; March, M.; Stott, A.W.; Roberts, D.J. Environmental Efficiency of Alternative Dairy Systems: A Productive Efficiency Approach. J. Dairy Sci. 2013, 96, 7014–7031. [Google Scholar] [CrossRef]
- Hernández-Sancho, F.; Molinos-Senante, M.; Sala-Garrido, R. Energy Efficiency in Spanish Wastewater Treatment Plants: A Non-Radial DEA Approach. Sci. Total Environ. 2011, 409, 2693–2699. [Google Scholar] [CrossRef]
- Pishgar-Komleh, S.H.; Čechura, L.; Kuzmenko, E. Investigating the Dynamic Eco-Efficiency in Agriculture Sector of the European Union Countries. Environ. Sci. Pollut. Res. 2021, 28, 48942–48954. [Google Scholar] [CrossRef]
- Coluccia, B.; Valente, D.; Fusco, G.; De Leo, F.; Porrini, D. Assessing Agricultural Eco-Efficiency in Italian Regions. Ecol. Indic. 2020, 116, 106483. [Google Scholar] [CrossRef]
- Xing, Z.; Wang, J.; Zhang, J. Expansion of Environmental Impact Assessment for Eco-Efficiency Evaluation of China’s Economic Sectors: An Economic Input-Output Based Frontier Approach. Sci. Total Environ. 2018, 635, 284–293. [Google Scholar] [CrossRef]
- Picazo-Tadeo, A.J.; Beltrán-Esteve, M.; Gómez-Limón, J.A. Assessing Eco-Efficiency with Directional Distance Functions. Eur. J. Oper. Res. 2012, 220, 798–809. [Google Scholar] [CrossRef]
- Gołaś, M.; Sulewski, P.; Wąs, A.; Kłoczko-Gajewska, A.; Pogodzińska, K. On the Way to Sustainable Agriculture—Eco-Efficiency of Polish Commercial Farms. Agriculture 2020, 10, 438. [Google Scholar] [CrossRef]
- Eder, A.; Salhofer, K.; Scheichel, E. Land Tenure, Soil Conservation, and Farm Performance: An Eco-Efficiency Analysis of Austrian Crop Farms. Ecol. Econ. 2021, 180, 106861. [Google Scholar] [CrossRef]
- Cecchini, L.; Venanzi, S.; Pierri, A.; Chiorri, M. Environmental Efficiency Analysis and Estimation of CO2 Abatement Costs in Dairy Cattle Farms in Umbria (Italy): A SBM-DEA Model with Undesirable Output. J. Clean. Prod. 2018, 197, 895–907. [Google Scholar] [CrossRef]
- Grassauer, F.; Herndl, M.; Nemecek, T.; Guggenberger, T.; Fritz, C.; Steinwidder, A.; Zollitsch, W. Eco-Efficiency of Farms Considering Multiple Functions of Agriculture: Concept and Results from Austrian Farms. J. Clean. Prod. 2021, 297, 126662. [Google Scholar] [CrossRef]
- Dakpo, K.H.; Latruffe, L. Agri-Environmental Subsidies and French Suckler Cow Farms’ Technical Efficiency Accounting for GHGs. In Proceedings of the 90th Annual Conference of the Agricultural Economics Society (AES), Coventry, UK, 4–6 April 2016; 31p. [Google Scholar]
- Balmann, A.; Czasch, B.; Odening, M. Employment and Efficiency of Farms in Transition: An Empirical Analysis for Brandenburg. In Proceedings of the 1997 Conference, Sacramento, CA, USA, 10–16 August 1997. [Google Scholar]
- Liu, J.S.; Lu, L.Y.Y.; Lu, W.M.; Lin, B.J.Y. A Survey of DEA Applications. Omega UK 2013, 41, 893–902. [Google Scholar] [CrossRef]
- Picazo-Tadeo, A.J.; Gómez-Limón, J.A.; Reig-Martínez, E. Assessing Farming Eco-Efficiency: A Data Envelopment Analysis Approach. J. Environ. Manag. 2011, 92, 1154–1164. [Google Scholar] [CrossRef] [PubMed]
- Tobin, J. Estimation of Relationships for Limited Dependent Variables. Econometrica 1958, 26, 24. [Google Scholar] [CrossRef]
- Banker, R.D.; Charnes, A.; Cooper, W.W. Some Models for Estimating Technical and Scale Inefficiencies in Data Envelopment Analysis. Manag. Sci. 1984, 30, 1078–1092. [Google Scholar] [CrossRef]
- Intriligator, M.D. Mathematical Optimization and Economic Theory; SIAM: Philadelphia, PA, USA, 2002; ISBN 0-89871-511-3. [Google Scholar]
- Hu, J.-L.; Wang, S.-C. Total-Factor Energy Efficiency of Regions in China. Energy Policy 2006, 34, 3206–3217. [Google Scholar] [CrossRef]
- Cameron, A.C.; Trivedi, P.K. Microeconometrics: Methods and Applications, 1st ed.; Cambridge University Press: Cambridge, UK, 2005; ISBN 978-0-521-84805-3. [Google Scholar]
- Simar, L.; Wilson, P.W. Estimation and Inference in Two-Stage, Semi-Parametric Models of Production Processes. J. Econom. 2007, 136, 31–64. [Google Scholar] [CrossRef]
- McDonald, J. Using Least Squares and Tobit in Second Stage DEA Efficiency Analyses. Eur. J. Oper. Res. 2009, 197, 792–798. [Google Scholar] [CrossRef]
- Dalgic, A.; Demircan, V.; Ormeci Kart, C.; Yilmaz, H. Technical Efficiency of Goat Farming in Turkey: A Case Study of Isparta Province. Econ. Eng. Agric. Rural Dev. 2018, 18, 65–72. [Google Scholar] [CrossRef]
- Bravo-Ureta, B.E.; Solís, D.; Moreira López, V.H.; Maripani, J.F.; Thiam, A.; Rivas, T. Technical Efficiency in Farming: A Meta-Regression Analysis. J. Product. Anal. 2007, 27, 57–72. [Google Scholar] [CrossRef]
- Latruffe, L.; Balcombe, K.; Davidova, S.; Zawalinska, K. Determinants of Technical Efficiency of Crop and Livestock Farms in Poland. Appl. Econ. 2004, 36, 1255–1263. [Google Scholar] [CrossRef]
- Coelli, T.J.; Rao, D.S.P.; O’Donnell, C.J.; Battese, G.E. An Introduction to Efficiency and Productivity Analysis; Springer Science & Business Media: Berlin/Heidelberg, Germany, 2005; ISBN 0-387-24265-1. [Google Scholar]
- Sigelman, L.; Zeng, L. Analyzing Censored and Sample-Selected Data with Tobit and Heckit Models. Polit. Anal. 1999, 8, 167–182. [Google Scholar] [CrossRef]
- Amore, M.D.; Murtinu, S. Tobit Models in Strategy Research: Critical Issues and Applications. Glob. Strategy J. 2021, 11, 331–355. [Google Scholar] [CrossRef]
- García-Gudiño, J.; Angón, E.; Blanco-Penedo, I.; Garcia-Launay, F.; Perea, J. Targeting Environmental and Technical Parameters through Eco-Efficiency Criteria for Iberian Pig Farms in the Dehesa Ecosystem. Agriculture 2022, 13, 83. [Google Scholar] [CrossRef]
- Gómez-Limón, J.A.; Picazo-Tadeo, A.J.; Reig-Martínez, E. Eco-Efficiency Assessment of Olive Farms in Andalusia. Land Use Policy 2012, 29, 395–406. [Google Scholar] [CrossRef]
- Alirezaee, M.R.; Howland, M.; van de Panne, C. Sampling size and efficiency bias in data envelopment analysis. J. Appl. Math. Decis. Sci. 1998, 2, 51–64. [Google Scholar] [CrossRef]
- Baležentis, T.; Dabkienė, V.; Štreimikienė, D. Eco-Efficiency and Shadow Price of Greenhouse Gas Emissions in Lithuanian Dairy Farms: An Application of the Slacks-Based Measure. J. Clean. Prod. 2022, 356, 131857. [Google Scholar] [CrossRef]
- Czyżewski, B.; Matuszczak, A.; Grzelak, A.; Guth, M.; Majchrzak, A. Environmental Sustainable Value in Agriculture Revisited: How Does Common Agricultural Policy Contribute to Eco-Efficiency? Sustain. Sci. 2021, 16, 137–152. [Google Scholar] [CrossRef]
- Minviel, J.J.; Latruffe, L. Effect of Public Subsidies on Farm Technical Efficiency: A Meta-Analysis of Empirical Results. Appl. Econ. 2017, 49, 213–226. [Google Scholar] [CrossRef]
- Kumbhakar, S.C.; Lien, G. Impact of Subsidies on Farm Productivity and Efficiency. In The Economic Impact of Public Support to Agriculture; Springer: New York, NY, USA, 2010; pp. 109–124. [Google Scholar]
- Van Passel, S.; Van Huylenbroeck, G.; Lauwers, L.; Mathijs, E. Sustainable Value Assessment of Farms Using Frontier Efficiency Benchmarks. J. Environ. Manag. 2009, 90, 3057–3069. [Google Scholar] [CrossRef] [PubMed]


| Outputs/Inputs | Variable | Unit | Mean | Standard Deviation | Min | Max |
|---|---|---|---|---|---|---|
| Output | Global Production | Euro | 55,639 | 133,138 | 980.00 | 1,138,400 |
| Input | Expenditure on fuels | Euro | 2512 | 6479 | 0.00 | 57,683 |
| Input | Expenditure on electricity and heating | Euro | 5479 | 8021 | 0.00 | 85,142 |
| Input | Expenditure on fertilizers | Euro | 1837 | 2719.22 | 0.00 | 20,186.00 |
| Input | Livestock Unit | LSU | 27.52 | 42.72 | 1.30 | 344.20 |
| Farm Area | Intensity of Farming | Labor Hours per Livestock Unit | Farm Payment | Animal Welfare Subsidy | Environmental Subsidy | |
|---|---|---|---|---|---|---|
| MEAN | 27.66 | 3875 | 82.62 | 7604 | 1280 | 3925 |
| DV. ST. | 42.98 | 11,386 | 131.47 | 10,626 | 4692 | 5560 |
| MIN | 0.30 | 76.92 | 0.56 | 0.00 | 0.00 | 0.00 |
| MAX | 344.20 | 113,032 | 1000 | 107,012 | 33,100 | 56,417 |
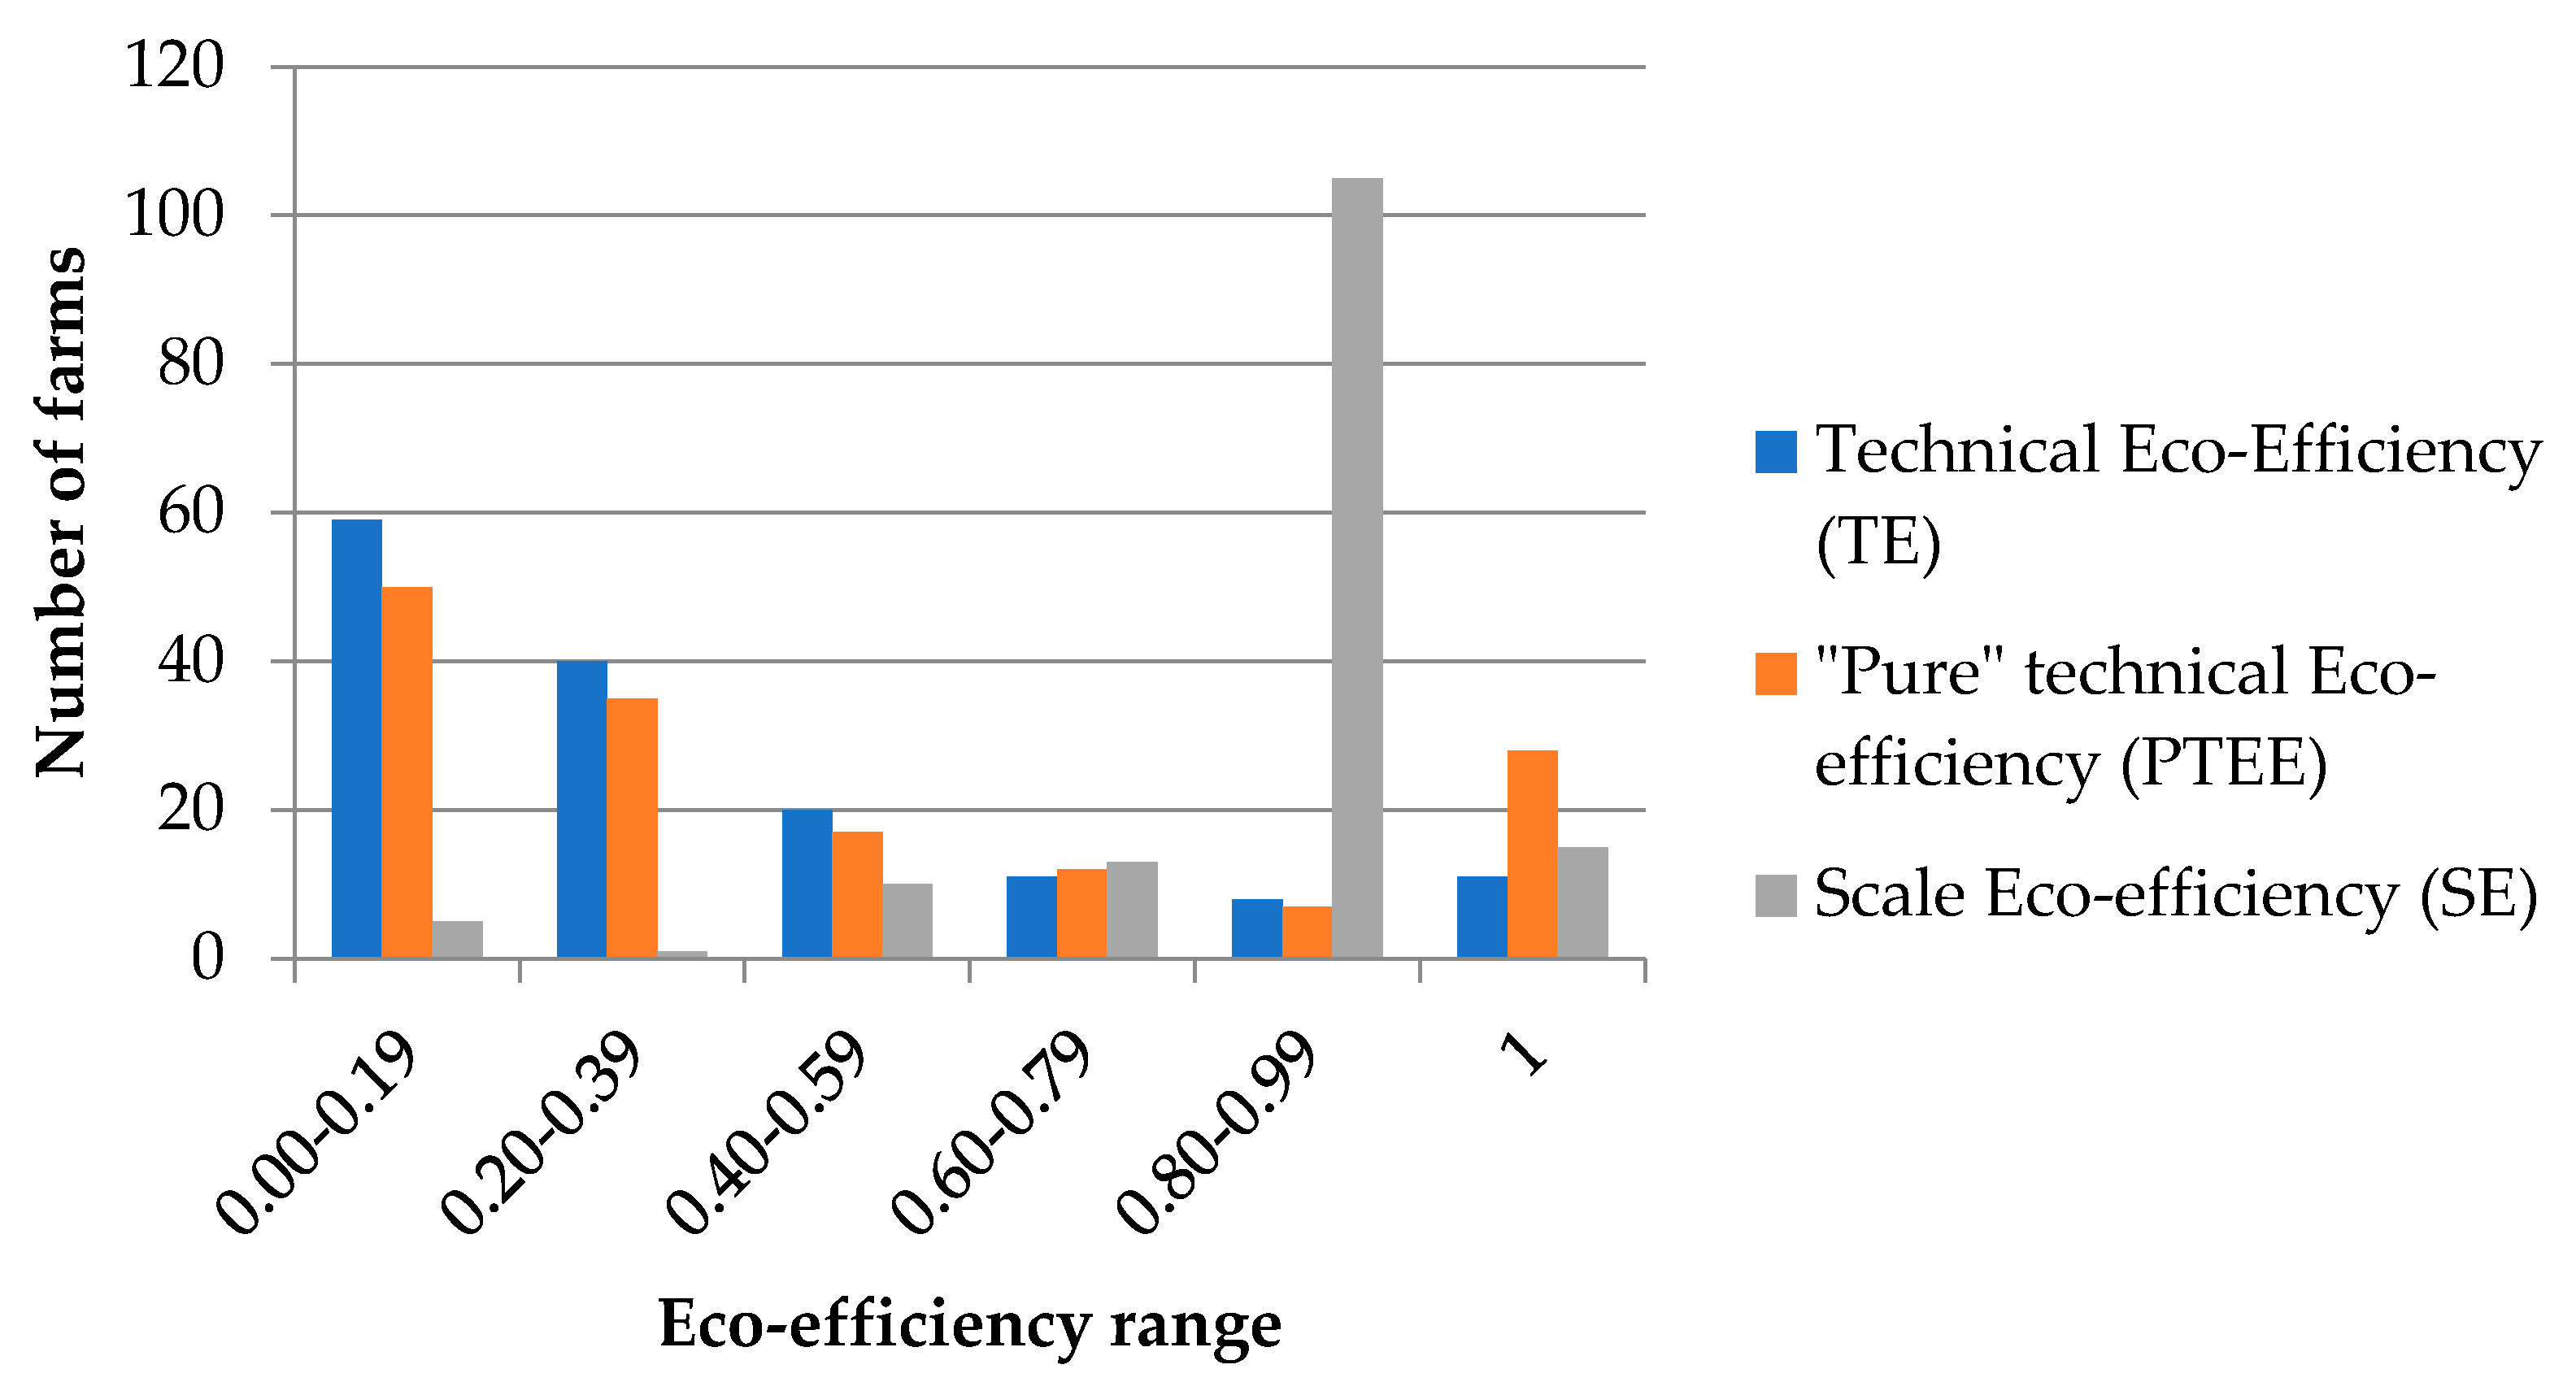
| Technical Eco-Efficiency (TEE) | “Pure” Technical Eco- Efficiency (PTEE) | Scale Eco-Efficiency (SEE) | |||||||
|---|---|---|---|---|---|---|---|---|---|
| Eco-Efficiency Range | Mean | n. | % | Mean | n. | % | Mean | n. | % |
| 0.00–0.19 | 0.095 | 59 | 40% | 0.098 | 50 | 34% | 0.111 | 5 | 3% |
| 0.20–0.39 | 0.285 | 40 | 27% | 0.399 | 35 | 23% | 0.271 | 1 | 1% |
| 0.40–0.59 | 0.486 | 20 | 13% | 0.641 | 17 | 11% | 0.444 | 10 | 7% |
| 0.60–0.79 | 0.678 | 11 | 7% | 0.839 | 12 | 8% | 0.680 | 13 | 9% |
| 0.80–0.99 | 0.929 | 8 | 5% | 0.987 | 7 | 5% | 0.929 | 105 | 70% |
| 1 | 1.000 | 11 | 7% | 1.000 | 28 | 19% | 1.000 | 15 | 10% |
| Total | 0.396 | 148 | 100% | 0.439 | 148 | 100% | 0.850 | 148 | 100% |
| No. of farms with Constant Returns to Scale (CRS) | 15 | 10% | |||||||
| No. of farms with Increasing Returns to Scale (IRS) | 133 | 90% | |||||||
| Fuels Expenditure | Fertilizers Expenditure | Electricity and Heating Expenditure | Livestock Units | |||||
|---|---|---|---|---|---|---|---|---|
| VRS | CRS | VRS | CRS | VRS | CRS | VRS | CRS | |
| Farms with slacks | 64 | 86 | 57 | 63 | 27 | 31 | 10 | 0 |
| % of farms with slacks | 43% | 58% | 38% | 42% | 18% | 21% | 7% | 0% |
| Average value of slack (entire sample) | 1753 | 1984 | 2267 | 1794 | 415 | 401 | 1.95 | 0.00 |
| Average value of slack (farms with slack) | 2411 | 2851 | 4824 | 3224 | 1803 | 1177 | 28.95 | 0.00 |
| Full eco-efficient farms with slack | 1 | 0 | 1 | 0 | 0 | 0 | 0 | 0 |
| % of Full eco-efficient farms with slack | 0.67% | 0% | 0.67% | 0% | 0% | 0% | 0% | 0% |
| Variable | Min | Max | Mean | Standard Deviation | ||||
|---|---|---|---|---|---|---|---|---|
| VRS | CRS | VRS | CRS | VRS | CRS | VRS | CRS | |
| Expenditure on fuels | 0.00 | 0.01 | 1.00 | 1 | 0.65 | 0.58 | 0.37 | 0.35 |
| Expenditure on fertilizers | 0.00 | 0.10 | 1.00 | 1 | 0.82 | 0.80 | 0.28 | 0.29 |
| Expenditure on electricity and heating | 0.04 | 0.11 | 1.00 | 1 | 0.93 | 0.91 | 0.21 | 0.21 |
| Livestock Unit | 0.33 | 1.00 | 1.00 | 1 | 0.97 | 1.00 | 0.09 | 0.00 |
| Expenditure on Fuels | Expenditure on Fertilizers | Expenditure on Electricity and Heating | Livestock Units | |||||
|---|---|---|---|---|---|---|---|---|
| Farm Size Classes (LSU) | VRS | CRS | VRS | CRS | VRS | CRS | VRS | CRS |
| <9 | 40.95 | 52.65 | 15.40 | 28.62 | 6.78 | 10.41 | 0.00 | 0.00 |
| 9–19.9 | 29.26 | 37.14 | 14.20 | 13.57 | 3.40 | 10.76 | 0.00 | 0.00 |
| 20–49.9 | 30.22 | 32.96 | 19.84 | 13.11 | 6.85 | 7.33 | 1.10 | 0.00 |
| 50–99.9 | 54.96 | 31.90 | 11.10 | 6.70 | 4.55 | 4.63 | 8.86 | 0.00 |
| ≥100 | 18.00 | 37.13 | 40.10 | 24.63 | 21.45 | 0.00 | 30.31 | 0.00 |
| Variable | Technical Eco-Efficiency (TEE) | Pure Technical Eco-Efficiency (PTEE) | ||||
|---|---|---|---|---|---|---|
| Coef. | p-Value | Coef. | p-Value | |||
| Intensity of livestock system (Global production per LU) | 0.0034 | *** | 0.000 | 0.0036 | *** | 0.000 |
| Farm payment | −0.00063 | ** | 0.012 | −0.00064 | ** | 0.038 |
| Farm area | 0.024 | *** | 0.000 | 0.036 | *** | 0.000 |
| Labor intensity (Hours per LU) | −0.0012 | *** | 0.006 | |||
| _cons | 0.242 | *** | 0.000 | 0.165 | *** | 0.003 |
| Log pseudolikelihood | −15.362 | −57.562 | ||||
| Number of obs | 148 | 148 | ||||
| F-statistics | 12.52 | 12.49 | ||||
| Prob > F | 0.000 | 0.000 | ||||
| Number of censored observations | 11 right-censored observations | 28 right-censored observations | ||||
| Pseudo R2 | 0.7161 | 0.4142 | ||||
| Variables | Technical Eco-Efficiency (TEE) | Pure Technical Efficiency (PTEE) | ||
|---|---|---|---|---|
| MEs for the Expected Value of TEE Conditional on Being Uncensored | MEs for the Unconditional Expected Value of TEE | MEs for the Expected Value of PTEE Conditional on Being Uncensored | MEs for the Unconditional Expected Value of TEE | |
| Intensity of livestock system (Global production per LU) | 0.00317 | 0.00328 | 0.00537 | 0.00611 |
| Farm payment | −0.00058 | −0.00060 | −0.00050 | −0.00057 |
| Farm area | 0.022 | 0.023 | 0.028 | 0.032 |
| Labour intensity (Hours per LU) | - | - | 0.009 | 0.010 |
Disclaimer/Publisher’s Note: The statements, opinions and data contained in all publications are solely those of the individual author(s) and contributor(s) and not of MDPI and/or the editor(s). MDPI and/or the editor(s) disclaim responsibility for any injury to people or property resulting from any ideas, methods, instructions or products referred to in the content. |
© 2023 by the authors. Licensee MDPI, Basel, Switzerland. This article is an open access article distributed under the terms and conditions of the Creative Commons Attribution (CC BY) license (https://creativecommons.org/licenses/by/4.0/).
Share and Cite
Cecchini, L.; Romagnoli, F.; Chiorri, M.; Torquati, B. Eco-Efficiency and Its Determinants: The Case of the Italian Beef Cattle Sector. Agriculture 2023, 13, 1107. https://doi.org/10.3390/agriculture13051107
Cecchini L, Romagnoli F, Chiorri M, Torquati B. Eco-Efficiency and Its Determinants: The Case of the Italian Beef Cattle Sector. Agriculture. 2023; 13(5):1107. https://doi.org/10.3390/agriculture13051107
Chicago/Turabian StyleCecchini, Lucio, Francesco Romagnoli, Massimo Chiorri, and Biancamaria Torquati. 2023. "Eco-Efficiency and Its Determinants: The Case of the Italian Beef Cattle Sector" Agriculture 13, no. 5: 1107. https://doi.org/10.3390/agriculture13051107