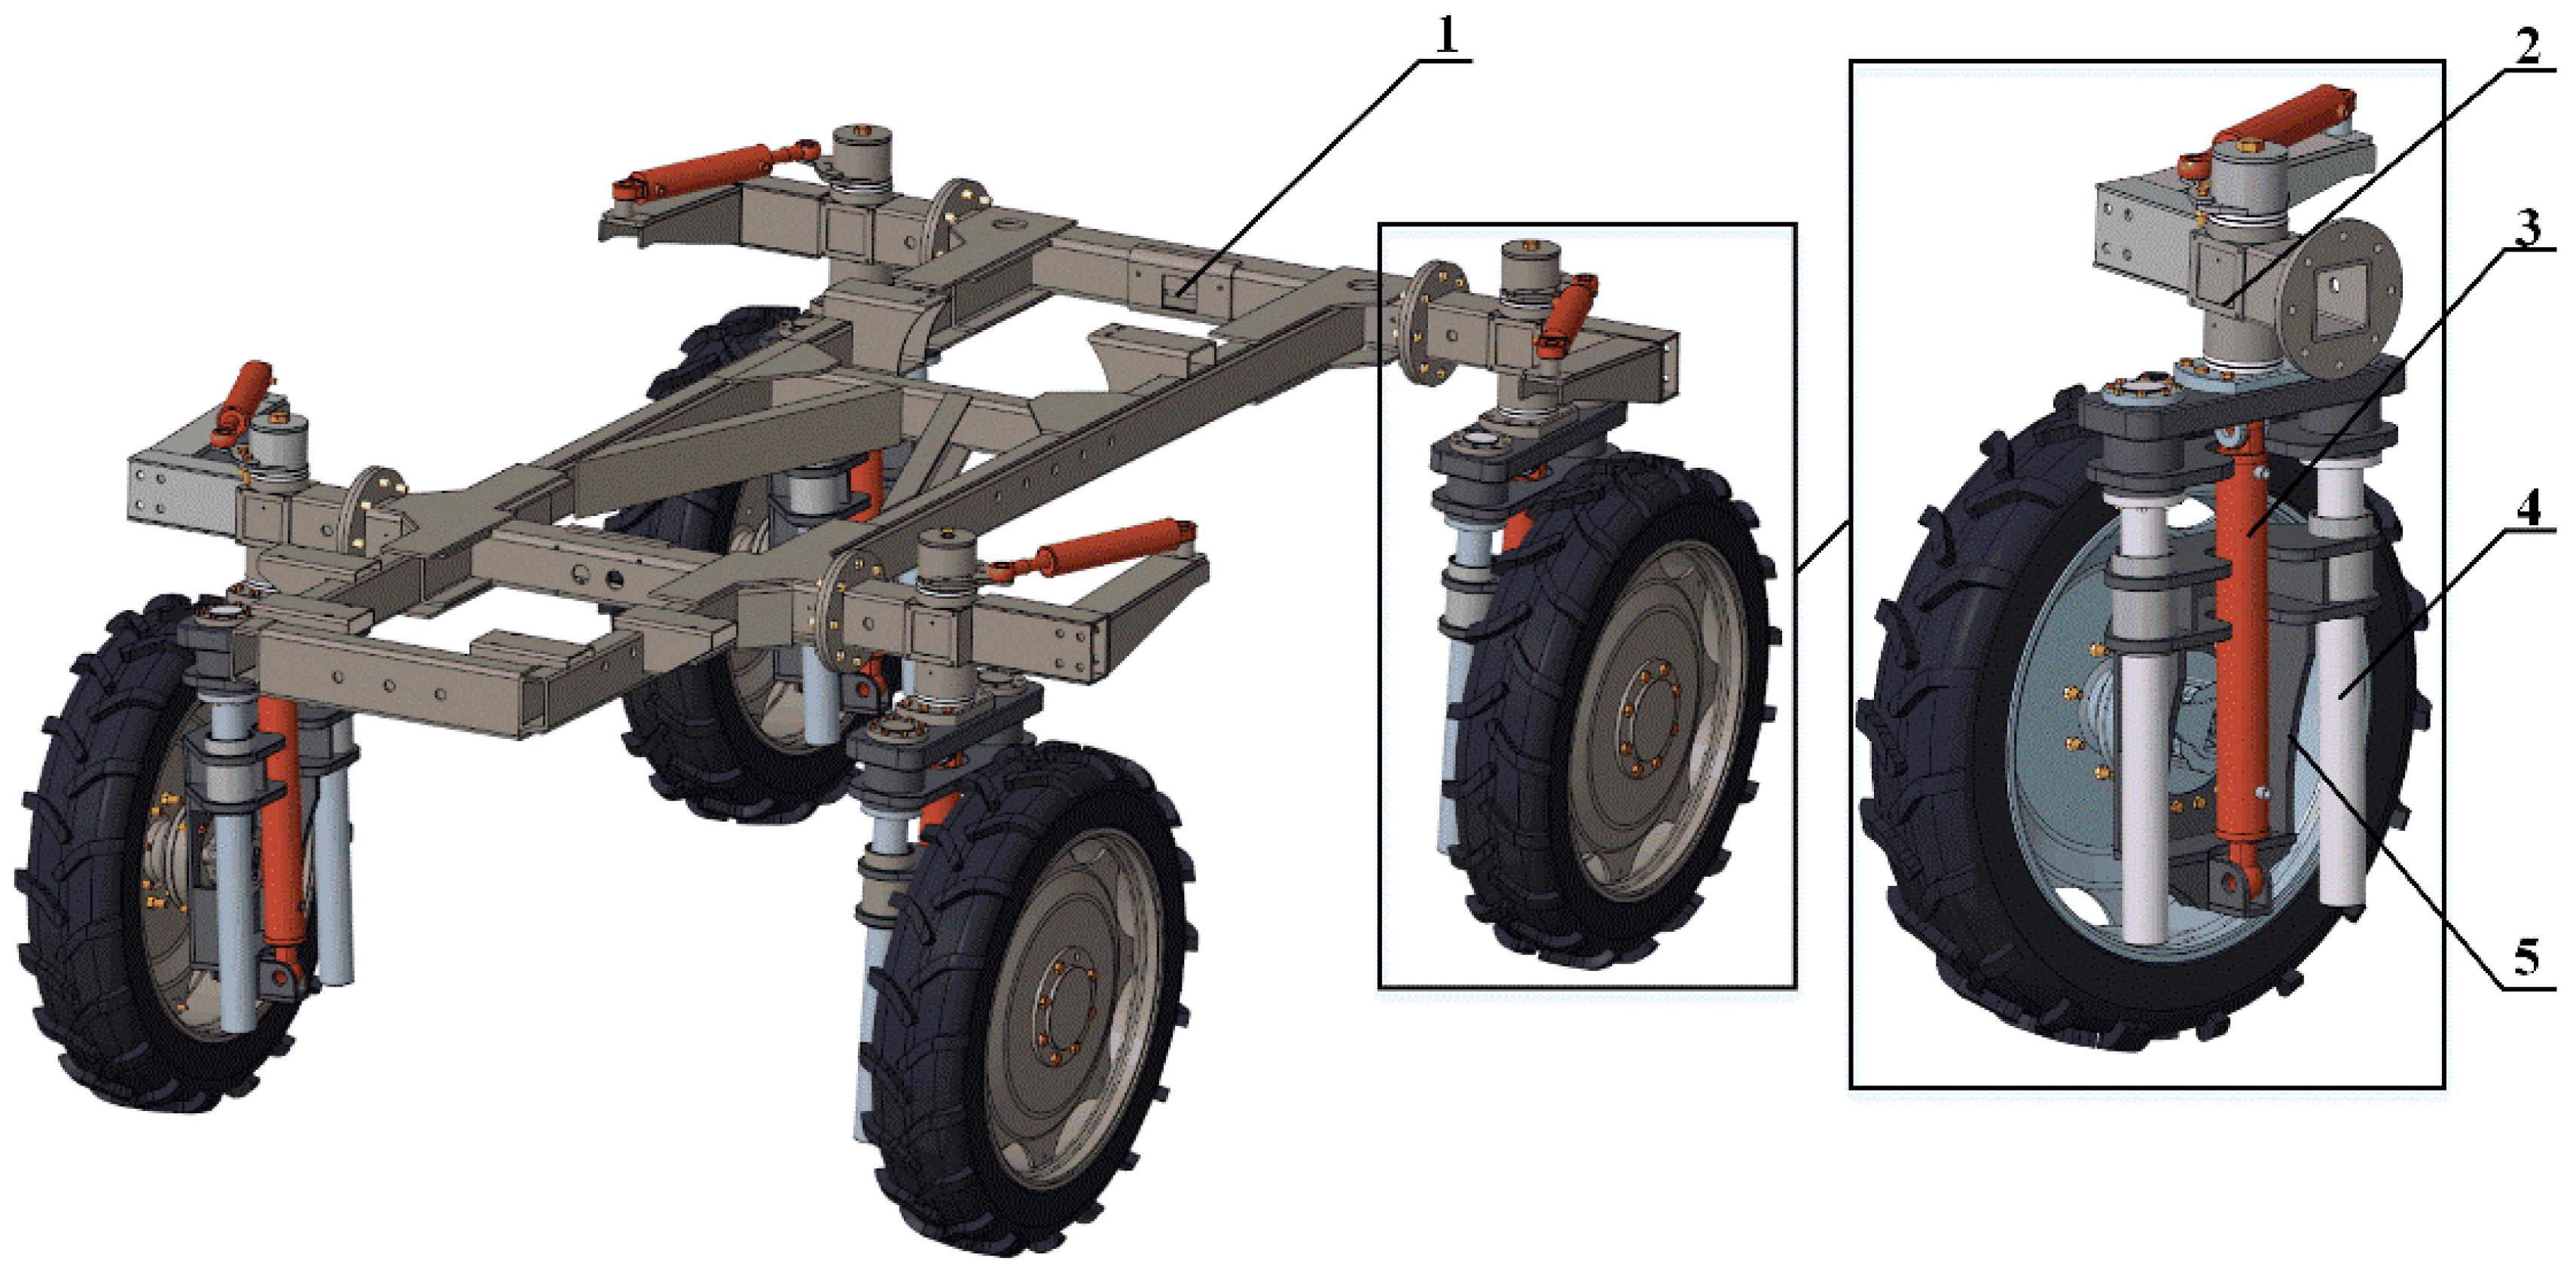
Article

Innovative Design Method of Hydro-Pneumatic Suspension for Large High-Clearance Sprayer Based on Improved NSGA-II Algorithm

1
College of Engineering, China Agricultural University, Beijing 100083, China
2
School of Engineering, The Open University of China, Beijing 100039, China
*
Author to whom correspondence should be addressed.
Agriculture 2023, 13(5), 1071; https://doi.org/10.3390/agriculture13051071
Submission received: 23 April 2023 / Revised: 8 May 2023 / Accepted: 15 May 2023 / Published: 17 May 2023

Abstract

:
Large high-clearance sprayers are widely used in the field of plant protection due to their high work efficiency. Influenced by the characteristics of a large ground clearance, fast driving speed and constantly changing sprung mass, how to solve the contradiction between the vibration reduction performance of a large sprayer and the friendliness of farmland roads has become a current research hotspot. In order to improve the driving performance of the sprayers, the design, optimization and verification scheme of the hydro-pneumatic suspension of a large sprayer based on the improved NSGA-II algorithm was completely constructed in this study. The hydro-pneumatic suspension system of a sprayer was mainly designed and a real-time time-varying model under field road excitation was established. The NSGA-II algorithm was improved by introducing the adaptive crossover operator and DE mutation operator, and a real-time interactive interface between the time-varying model was established for multi-objective optimization. Finally, system simulation analysis was conducted and a vibration test bench was built for experimental verification. The results show that vibration reduction indicators improved by 19.4%, 10.7% and 4.0%, respectively, compared with those before optimization. The performance of the designed hydro-pneumatic suspension was better than that of the ordinary suspension.

1. Introduction

Large high-clearance self-propelled plant protection machinery (referred to as a large high-clearance sprayer) plays an important role in the spraying process of crops with different plant heights due to its advantages of having a strong adaptability to farmland operations, high plant protection efficiency and low resource waste rate [1,2,3].
Different from the working scenarios faced by non-road vehicles such as military vehicles and engineering vehicles, the farmland operating environment is sensitive and fragile, and subtle vibrations and unstable movements of agricultural machinery may cause irreversible damage to the plant growth environment. At the same time, there are great uncertainties between crops and field soil, all of which pose unprecedented challenges to the comfort and maneuverability of large-scale high-end agricultural equipment [4].
A vehicle vibration reduction system is used to absorb and buffer the impact and distortion of road roughness on the body. It is one of the core indicators for measuring the vibration reduction performance of the vehicle. Due to the differences in field conditions and functional requirements, the performance requirements of the sprayer’s suspension system are also different from those of other vehicles [5,6,7,8]. Most of the chassis systems of large sprayers are modified from the vibration reduction systems of other non-road vehicles. With the improvement of operating requirements, coupled with the significant characteristics of a time-varying spring mass, high driving speed and complex and fragile field conditions, the traditional air spring suspension and spiral spring suspension cannot meet the operation requirements of a sprayer under multiple working conditions due to the limited vibration reduction performance and the adjustment in ground clearance height [9,10,11,12]. As a high-performance suspension design scheme, hydro-pneumatic suspension has a compact structure, excellent vibration reduction performance and the ability to automatically adjust the height of the ground clearance according to different crops [13,14,15]. It is the development trend of large self-propelled boom sprayers in the future.
The hydro-pneumatic suspension system has the characteristics of a large adjustable range of stiffness and damping characteristics, but there are many design parameters in the structure that affect the vibration reduction effect, and each parameter has a different degree of influence on the performance of the suspension. Especially under the excitation of the field road, the hydraulic system exhibits strong nonlinear characteristics, and the change in each design parameter will cause nonlinear changes in the damping and stiffness characteristics of the suspension [16]. Therefore, the traditional method of analyzing the performance of hydro-pneumatic suspension by using linear damping and stiffness cannot reveal its vibration reduction characteristics well.
The uncertainty of design parameters and the complexity of multi parameter combination make it difficult to analyze the characteristics of hydro-pneumatic suspension, which has not been widely used in the field of sprayer suspension. Therefore, it is very important to analyze the characteristics of the hydro-pneumatic suspension system, establish the complex real-time relationship between the covering sprayer oil circuit system and the vibration reduction dynamic model under random road excitation, optimize the structure parameters of the hydro-pneumatic suspension and propose a hydro-pneumatic suspension system with an excellent vibration effect on the sprayer.
In order to clarify the vibration reduction characteristics of hydro-pneumatic suspension and improve the suspension performance, researchers have carried out a large number of optimization and experimental studies. Wu et al. established a non-linear mathematical model of hydro-pneumatic suspension to study the energy reduction capacity of hydro-pneumatic suspension for a mining dump truck and analyzed the influence of different stiffness and damping values on the loss power [17]. Solomon et al. simulated the stiffness and damping characteristics of hydro-pneumatic suspension to verify the effects of gas compression and damping holes on the smoothness of tracked vehicles [18]. Mohsen et al. identified ride comfort and driving performance as optimization objectives for trucks and optimized the driving performance and ride comfort through genetic algorithms [19]. Zhao et al. optimized the root mean square of the vertical acceleration and pitch acceleration of a half-car based on the artificial fish swarm algorithm [20]. The analysis and optimization of these characteristics all provide solutions for the design and optimization of the hydro-pneumatic suspension of the sprayer, but the above-mentioned design of the hydro-pneumatic suspension of the military and engineering vehicles mostly adopts the genetic algorithm to optimize the multiple conflicting indicators that affect the vibration reduction performance, which is limited by the inaccurate optimization solution set and slow convergence speed of traditional algorithms. Researchers have tried to reduce conflicting objective functions, set optimization weights or focus optimization on a certain indicator [21]. However, this method is not suitable for the field operation requirements of the sprayer and cannot meet the comprehensive requirements of the sprayer for driving smoothness, handling stability and especially road friendliness. Considering that there are few studies on the optimal design of sprayers and that the contradictory relationship between the evaluation indicators is uncertain, this paper should focus on clarifying the characteristics of the multi-objective optimization of the sprayer chassis system and find the optimal comprehensive effect between the evaluation indicators of the hydro-pneumatic suspension suitable for farmland operations.
As a variant of the genetic algorithm, the NSGA-II algorithm is a fast non-dominated sorting genetic algorithm proposed by Deb et al. on the basis of the non-dominated sorting genetic algorithm (NSGA) [22]. It is widely used in power system planning, pipe network optimization design and other fields [23]. However, the algorithm still has some problems, such as a slow convergence speed and poor population distribution of complex models, though scholars have made many improvements on this basis. Li et al. introduced orthogonal decomposition technology to describe environmental parameters due to the uncertainty of coupling between environmental factors in a greenhouse and proposed a rapid optimization scheme of a greenhouse environmental system to effectively improve the environmental conditions of crop growth [24]. Winiczenko et al. studied the influence of drying temperature and wind speed on the quality of apples, put forward the NSGA-II algorithm based on an artificial neural network and obtained a unique solution under specified constraints [25]. Zhang et al. designed an improved NSGA-II algorithm to overcome the shortcomings of the NSGA-II algorithm in elite selection strategy, and used AHP to select the best compromise solution to solve the flexible job shop scheduling problem [26]. Zhao et al. proposed an NSGA-II algorithm based on an adaptive stochastic test (FSCS-ART) and adaptive strategy to solve the problem of poor precision in the measurement of main bearing non-roundness [27]. Liu et al. improved the championship selection mechanism due to the contradiction between the two goals of riding comfort and handling stability [28]. Fu et al. introduced a normal distribution operator and differential evolution operator to improve the population distribution of the NSGA-II algorithm and realize the optimal matching of a tractor power transmission system, which provides reference for tractor power transmission system optimization [23]. All of these methods put forward improved methods for the defects of the NSGA-II algorithm, but the above traditional objective functions are all static models, and the particularity of field operation makes the optimization design of a sprayer hydro-pneumatic suspension system need to consider the influence of a complex field road input in real time. When the static model without considering the road excitation is used as the optimization objective, it is difficult to accurately describe the vibration reduction effect. On the contrary, establishing a time-varying model based on the input of the field road will greatly increase the workload of the algorithm. For the sprayer vibration reduction system with too many targets in the time-varying model and high complexity after the hydraulic model is connected to the dynamic model, it is difficult for the traditional improved algorithm to achieve a high-precision suspension optimization effect. It still cannot solve the problems of slow convergence and falling into the local optimum. Therefore, it is particularly important to propose an optimization algorithm that simultaneously meets the requirements of the field operation of a large high-clearance sprayer.
Based on this, a high-performance vibration reduction system under the premise of being friendly to the field environment was designed, and a complete design process of suspension design, intelligent optimization and performance verification was established. The main contents include: (1) the vibration reduction method of hydro-pneumatic suspension based on three damping holes is proposed, and the chassis configuration of the hydro-pneumatic suspension of a large sprayer with adjustable ground clearance is innovatively designed; (2) a time-varying model for the complex excitation of field operations is established, and the optimization algorithm of the hydro-pneumatic suspension structure is studied based on this; (3) a performance test bench is built to carry out a bench test.

2. Materials and Methods

2.1. Structural Design and Modeling

The hydro-pneumatic suspension in the field of military vehicles and engineering vehicles has excellent vibration reduction effect under its typical working conditions, but it cannot cope with the development direction of the multi-functional operation of the sprayer in the field and the variable operation requirements of the chassis when applying pesticides to crops of different plant heights. Therefore, the chassis of the sprayer and the hydro-pneumatic suspension system were designed and are shown in Figure 1. The chassis structure includes the frame 1, the steering system 2, the hydro-pneumatic suspension hydraulic cylinder 3, the guide mechanism 4, connecting housing of hydro-pneumatic suspension 5, the tire and the motor. The guide mechanism 4 is not subject to the vertical force, while the hydro-pneumatic spring itself can only transmit the vertical force. Therefore, the steering and other moments are transmitted by the guide mechanism 4. As the core of the vibration damping system, the hydraulic cylinder 3 can adjust the ground clearance of the sprayer chassis according to the working state by using its large stroke. (1) When the sprayer is transported on the asphalt road, the vibration reduction hydraulic cylinder 3 is retracted to reduce the height of the vehicle body and improve the handling stability. (2) When the sprayer is operating in the field, the hydraulic cylinder 3 automatically raises or lowers the chassis to adapt to different crops. The final suspension system ground clearance adjustment range is set between 1.5 m and 2.1 m. The design has a compact structure, which is conducive to vehicle handling, solves the problem of the large volume occupied by the traditional air suspension and reduces the risk of interfering with crops during application.
According to the structural design and working characteristics, a 1/4 suspension model of the sprayer based on the three-damping-hole structure of the hydro-pneumatic suspension oil system was established. As shown in Figure 2, the model is composed of 1/4 suspension system and hydro-pneumatic suspension oil circuit system. The 1/4 suspension model includes tire model, unsprung mass model and sprung mass model. The tire model is defined as linear spring and damper. The hydro-pneumatic suspension system consists of hydraulic cylinder 2, damping holes 4, 6 and 7, check valve 5, electromagnetic on-off valve 8 and accumulator 9. The working principle is mainly divided into the following two stages. When the vehicle body is raised, the working principle of the three-damping-hole structure is the same as that of the common hydro-pneumatic suspension oil circuit system. When the vehicle body is lowered, a part of the oil enters the accumulator 9 through the damping hole 6. The hydro-pneumatic suspension system provides damping force through the damping hole and elastic force through the accumulator 9. Compared with the traditional hydro-pneumatic suspension system with two damping holes, the system adds check valve 5 and damping hole 6. When the suspension is in the compression process, hydraulic oil passes through damping holes 4, 6 and 7. At this time, the elastic force generated by the compressed gas in the accumulator suppresses the reciprocating motion of the hydraulic cylinder. When the suspension is in the extension process, check valve 5 is closed and hydraulic oil only flows through damping holes 4 and 6. Therefore, the flow rate is relatively high, and the system can generate a large damping force, which is equivalent to the damper in traditional suspension. Because the damping force is time-varying with the moving speed of the hydraulic cylinder, the three-damping-hole structure can increase the damping time-varying range of hydro-pneumatic suspension, provide a larger parameter optimization range for the multi-objective optimization of the suspension performance in the following and effectively improve the ability of the sprayer to resist the interference of the external complex road environment.
In this study, combined with the basic parameters and functional requirements of the self-developed 3 WPG-3000 large sprayer [29], under the premise of ensuring sufficient structural strength and rigidity, the parameters of the suspension system were calculated and set and are shown in Table 1.

2.2. Time-Varying Model of Hydro-Pneumatic Suspension

As the objective function of suspension optimization algorithm, the accuracy of model establishment is directly related to the accuracy of algorithm optimization. The objective function of traditional optimization is mostly statically optimized based on the established mathematical relationship, and there is no input of uncertainty as interference, which does not meet the design requirements of the sprayer suspension for the interaction between soil and chassis in field operations. In order to establish the objective function accurately, this paper introduces the revised road surface model into the objective function and quantifies the correspondence between the random excitation and the objective function.

2.2.1. Mathematical Model of Hydro Pneumatic Suspension

In the case of fully considering the structure of the sprayer suspension, parameters such as accumulator inflation pressure and volume, tire damping and stiffness and damping valve opening were introduced, and the following prerequisites were set: (1) ignore the friction between piston and cylinder barrel; (2) ignore external disturbances and load changes; (3) ignore the leakage flow of the cylinder barrel during the reciprocating movement of the piston to ensure good air tightness of the system; (4) assume that the gas in the accumulator is an ideal gas; (5) regard the tire as a linear spring damper and ignore its nonlinear effect on vibration reduction so as to facilitate the optimal design of a single object for the hydro-pneumatic suspension. According to the 1/4 hydro-pneumatic suspension model of the sprayer established in Figure 2, the basic dynamic equations with linear spring and damper were obtained:
m s x ¨ s = k s ( x s x u ) c s ( x ˙ s x ˙ u ) m u x ¨ u = k s ( x s x u ) + c s ( x ˙ s x ˙ u ) k t ( x u w ) c t ( x ˙ u w ˙ )
where ms and mu are body mass and unsprung mass; xs, xu and w are displacement of the sprung mass, unsprung mass and pavement excitation; ks and kt are the stiffness coefficients of hydro-pneumatic suspension and tire; cs and ct are the damping coefficients of hydro-pneumatic suspension and tire.
In order to obtain an accurate nonlinear model, the suspension output force during damping was calculated:
F = P 2 A 2 P 1 A 1 = k s ( x s x u ) + c s ( x ˙ s x ˙ u )
where P1 and P2 are the pressure of the two chambers of the hydraulic cylinder; A1 and A2 are the stress area of the two chambers of the hydraulic cylinder.
The damping hole 4 in the system is regarded as a thick wall orifice, and the damping holes 6 and 7 are regarded as slender orifices. Without considering the compressibility of oil and the influence of oil temperature rise, the calculation formulas of stiffness coefficient and damping coefficient of the hydro-pneumatic suspension were established as follows:
k s ( x ) = r 0 P 0 V 0 r ( A 2 A 1 ) 2 [ V 0 ( A 2 A 1 ) x ] r + 1
c s ( x ˙ ) = ρ A 2 3 x ˙ s i g n ( x ˙ ) [ C q A z + π d j 4 128 μ L ( 1 2 + 1 2 s i g n ( x ˙ ) ] 2 + 128 μ L A 1 ( A 2 + A 1 ) π d j 4
where r0 is the gas polytropic index, recorded as 1.4; Cq can be regarded as 0.82; Az is the flow area of damping hole, m2; μ is the dynamic viscosity; L is the length of damping hole, m.

2.2.2. Modified Time Domain Excitation Model of Random Pavement

As input to the time-varying model of sprayer suspension, road roughness plays a vital role in vehicle ride comfort, handling stability and road friendliness [30]. The international standard document ISO/TC108/SC2N67 divides the pavement into 8 grades in the spatial frequency range of 0.011 m−1 to 2.83 m−1 according to the pavement power spectral density [31], and the fitting expression of pavement displacement power spectral density, speed power spectral density and the mean square difference of pavement is shown in Formula (5):
G w ( n ) = G w ( n 0 ) n n 0 λ G w ˙ ( n ) = 2 π n G w ( n ) σ w = 1 T 0 T x 2 t d t
where n is the spatial frequency, m−1; n0 is the reference spatial frequency, n0 = 0.1 m−1; Gw(n0) is the road roughness coefficient, m2/m−1; λ is the frequency index, taken as 2. In order to facilitate the analysis of suspension characteristics, the frequency domain characteristics were converted into more intuitive time domain characteristics, and the vertical displacement power spectrum and time–frequency power spectrum density were obtained, as shown in Equation (6):
G w ( f ) = G w ( n 0 ) n 0 2 u f 2 G w ˙ ( f ) = 4 π 2 n 0 2 G w ( f ) = 4 π 2 n 0 2 u G w ( n 0 )
where u is the speed, m/s; f is time frequency, Hz. The elevation change of pavement was abstracted as random white noise satisfying certain conditions, and the spatial cut-off frequency nd0 and modified parameters of pavement α, β [32] were introduced to obtain the time domain mathematical model expression of the corrected filtered white noise:
w ˙ ( t ) = 2 π n d 0 u α w ( t ) + 2 π n 0 β G w ( n 0 ) u q ( t )
where w(t) is the pavement displacement input, m; nd0 is the spatial cut-off frequency of pavement, which was taken as near 0.011 m−1 to ensure that the generated pavement input was as consistent as possible with the actual pavement spectrum. In order to verify the correctness of the mathematical model, the white noise module was set with noise power of 0.01 m2, sampling time of 0.01 s, simulation time of 100 s and vehicle speed of 40 km/h. Taking road classes B, D and F as examples, the simulated root mean square value of road roughness time domain signal and power spectral density curve were obtained, as shown in Table 2 and Figure 3, and the generated random pavement surfaces are shown in Figure 4. The power spectral density curve and the random elevation mean square error value of the time domain model are in good agreement with the standard value, which verifies the correctness of the time domain model.

2.2.3. Establishment of Time-Varying Model of Sprayer

Considering the nonlinearity of the combination of the hydraulic system model and the dynamic model, it is difficult to accurately describe the motion state of the sprayer by directly establishing the mathematical relationship between the objective function and the optimization parameters, so the time-varying model containing random road surface was used as the objective function, and the assignin and sim functions were used to realize the data exchange between the m file of the algorithm and the time-varying model. The established time-varying model is shown in Figure 5.

2.3. Analysis of Nonlinear Characteristics of Hydro-Pneumatic Suspension

The vibration reduction characteristics of hydro-pneumatic suspension will vary greatly with the change in parameter design. In order to determine the suspension parameters that affect the ride comfort, handling stability and road friendliness of the sprayer, based on the mathematical model established in Section 2.2.2, the nonlinear stiffness and damping characteristics of hydro-pneumatic suspension were analyzed by selecting the key parameters.

2.3.1. Stiffness Characteristic Analysis

According to Formula (3), the stiffness coefficient K of hydro-pneumatic suspension is related to the initial pressure P0 of accumulator, the accumulator volume of V0 and the effective area of the hydraulic cylinder. The initial pressure P0 of accumulator is determined by the structural parameters of the sprayer and cannot be changed. Therefore, when other parameters remain unchanged, the suspension stiffness characteristics were analyzed under 2 Hz sine signal by changing parameters other than the initial pressure P0.
By consulting the mechanical design manual, under the condition that other parameters remain unchanged, the volume of the accumulator was adjusted by 0.5~5 L, the hydraulic cylinder inner diameter was adjusted by 45~90 mm and the piston rod diameter was adjusted by 25~45 mm, as shown in Figure 5, and the variation trend of elastic force and stiffness coefficient was obtained.
It can be seen from Figure 6a–d that changing the volume of the accumulator and the piston rod diameter can affect the magnitude of the elastic force, and the stiffness coefficient decreases with their increase. It can be seen from Figure 6e that the change in the inner diameter of the hydraulic cylinder has little effect on the elastic force (it is important to note that the six curves in Figure 6e are completely overlapping, so only one of the curves can be shown). In order to clarify whether the influence of hydraulic cylinder inner diameter on stiffness coefficient is significant, statistical analysis method was used to analyze the curve in Figure 6f. According to statistics, the variances of the curves in Figure 6f are not homogeneous. Therefore, K-W test was used for statistical analysis, and the results are shown in Figure 7.
Through SPSS software (IBM SPSS Statistics 22) calculation, a significance of 0.993 was obtained. By observing Figure 7, the numerical differences of each curve are not significant, and the impact on the stiffness coefficient of the suspension can be ignored. In conclusion, within a certain adjustment range, the accumulator volume and piston rod diameter have a great influence on the elastic force of hydro-pneumatic suspension. Therefore, the structure that has a great influence on the stiffness characteristics will be one of the optimization focuses in this paper.

2.3.2. Damping Characteristic Analysis

The damping characteristics of the suspension determine the ability of the suspension system to attenuate vibration. According to Formula (4), the damping coefficient of the suspension model is related to the effective area of the hydraulic cylinder and the flow area of the damping hole. Due to the strong nonlinearity of the damping coefficient and the chaotic output image, this paper obtained the relationship between the damping force of hydro-pneumatic suspension and the parameters by changing the damping hole diameters dz and dj, piston rod diameter d1 and hydraulic cylinder inner diameter d2, as shown in Figure 8.
The horizontal axis in Figure 8 represents the operating speed of the hydraulic cylinder. As vibration reduction is a reciprocating process, positive and negative values were added to distinguish the elongation and retraction processes of the hydraulic cylinder. It can be seen from Figure 8 that the suspension damping force changes nonlinearly with the change in moving speed, the change rate of damping force decreases with the increase in damping hole diameter and increases with the increase in hydraulic cylinder inner diameter and the piston rod diameter has no effect on the damping force (it is important to note that the six curves in Figure 8d are completely overlapping, so only one of the curves can be shown). Therefore, the structure that has a great influence on the damping characteristics will also be one of the optimization focuses of this paper.

2.3.3. Comparison of Damping Characteristics

In order to verify that the damping adjustable range of the 3-orifice oil circuit system proposed in this paper is better than that of the traditional hydro-pneumatic suspension, based on the same premise as the other parameters, the check valve 5 and the damping hole 6 were removed, and the damping characteristics of the two suspensions were compared and analyzed by changing the damping hole 4 and the cylinder diameter, where the results are shown in Figure 9.
It can be seen from the figure that, under the premise of controlling variables, the damping force of the 3-damping hole hydro-pneumatic suspension has a larger variation range, which is more adaptable to the complex driving environment in the field, and provides a larger parameter optimization range for the subsequent intelligent parameter optimization of suspension performance.

2.4. Improvement of NSGA-II Algorithm

The optimization design of the hydro-pneumatic suspension was one of the focuses of this research. This paper introduces the NSGA-II algorithm to explore its optimal parameter combination. The evolution of NSGA-II algorithm is too conservative in the process of crossover and mutation, but as the objective function of the sprayer time-varying model, the optimization results change in real time with the road surface excitation in the simulation process. It is difficult for the fixity and conservatism of the traditional algorithm to accurately describe the optimization results. In this study, an adaptive crossover operator was designed to follow up the time-varying model, and a DE operator was introduced to improve the locality of the optimization results so as to avoid the optimization results concentrated in a certain area. Furthermore, it is difficult to obtain the omni-directional optimal solution of the vibration reduction system of the sprayer. Finally, an improved NSGA-II algorithm based on adaptive operator and DE operator was proposed to deal with the dynamic objective function of the sprayer that changes in real time, intelligently improve the ability of the algorithm to search for spatial optimal solutions and local optimal solutions and realize the strategy of real-time adaptive optimization of the target value for the model.

2.4.1. Adaptive Hybrid Crossover Operator

In the original algorithm, simulated binary crossover (SBX) is used for gene crossover. Considering p1 and p2 of the parent generation and x1 and x2 of the i-th generation, the new individual generation method of SBX is shown in Formula (8):
x 1 , i = 1 2 ( 1 β S B X ) p 1 , i + ( 1 + β S B X ) p 2 , i x 2 , i = 1 2 ( 1 + β S B X ) p 1 , i + ( 1 β S B X ) p 2 , i
The random variable βSBX is obtained from Formula (9):
β S B X = ( 2 φ ) 1 γ + 1                                   ,   φ 0.5           2 ( 1 φ ) 1 γ + 1             ,   φ > 0.5  
where φ is a random number uniformly distributed in the interval (0,1) and γ is a self-defined non-negative number. The congestion distance calculation mechanism of NSGA-II algorithm only considers local information, so the algorithm cannot guarantee the population distribution and it is easy to make the result fall into local optimum. Researchers use normal distribution crossover (NDX) to improve SBX operator. NDX operator further improves the global search ability of the algorithm on the basis of ensuring the quality of non-dominated solution. The crossover process of NDX operator is as follows:
x 1 , i = p 1 , i + p 2 , i 2 + 1.481 ( p 1 , i p 2 , i ) N ( 0 , 1 ) 2 , φ 0.5 p 1 , i + p 2 , i 2 1.481 ( p 1 , i p 2 , i ) N ( 0 , 1 ) 2 , φ > 0.5
x 2 , i = p 1 , i + p 2 , i 2 1.481 ( p 1 , i p 2 , i ) N ( 0 , 1 ) 2 , φ 0.5 p 1 , i + p 2 , i 2 + 1.481 ( p 1 , i p 2 , i ) N ( 0 , 1 ) 2 , φ > 0.5
where |N(0,1)| is a normally distributed random variable. The elite strategy of NSGA-II algorithm retains the excellent individuals in the parent generation and combines with the child generation to form a new population. The increase in the population directly leads to a significant increase in the calculation amount of the algorithm; furthermore, the convergence speed of NDX operator is slower than SBX operator, and the convergence time of the algorithm is further increased.
In view of the above problems, it is necessary to increase the global search range in the early stage of algorithm iteration to ensure the uniformity and diversity of population distribution. In the later stage of the algorithm iteration, most of the solutions are close to the Pareto frontier. At this time, the search space should be appropriately reduced to improve the local search ability and ensure the convergence speed while optimizing the Pareto solution. Based on the above ideas, this paper combines the advantages of strong global search ability of NDX operator and strong local search ability and rapid convergence of SBX operator and proposes an adaptive adjustment factor. The factor can increase the proportion of NDX operator in the early stage of algorithm iteration and appropriately increase the proportion of SBX operator in the final stage of iteration, where an adaptive hybrid crossover operator based on NDX algorithm and supplemented by SBX operator was obtained. The method of generating the next generation of individuals is as follows:
x 1 , i = η 2 ( X + β S B X Y ) + 1 - η 2 ( X + 1.481 N ( 0 , 1 ) Y ) , φ 0.5 η 2 ( X + β S B X Y ) + 1 - η 2 ( X 1.481 N ( 0 , 1 ) Y ) , φ 0.5
x 2 , i = η 2 ( X β S B X Y ) + 1 - η 2 ( X 1.481 N ( 0 , 1 ) Y ) , φ > 0.5 η 2 ( X β S B X Y ) + 1 - η 2 ( X + 1.481 N ( 0 , 1 ) Y ) , φ > 0.5
X = p 1 , i + p 2 , i Y = p 1 , i p 2 , i
η = 1 5 + 1 1 + e lg 1 G g + 1
where η is the adaptive adjustment factor, g is the current number of iterations and G is the total number of iterations.

2.4.2. DE Mutation Operator

Differential evolution (DE) is a population-based optimization method [33]. Through the differential local search of the optimal non-inferior solution of the offspring population, a new individual is generated, and the optimal non-inferior solution is adjusted by the crowding operator. This method makes it easier for the algorithm to jump out of the local optimum by intervening in the direction of individual evolution.
Firstly, the distance threshold is determined and the adjacent individuals that need differential search are selected. A new individual is generated through the DE operator, and it is judged whether the new individual meets the non-dominated relationship with the original individual. The dominated individuals are discarded and the non-dominated individuals are put into the parent’s population set to form a new set F(1)′, and then the individuals meeting the crowding distance are retained and the rest are discarded. Assuming that the above-mentioned adjacent parents pa and pb belong to the population p, the new offspring p′ generated by the DE operator can be calculated by Formula (16):
p = r p a + ( 1 r ) p b ,           0 r 1
The greater the r in the formula, the higher the influence of parents on the mutation direction.
By sorting the parent individuals according to the child target i, if the distance between adjacent parents is greater than the distance threshold of the child target i, and the target values of adjacent parents in other child targets are different by at least one pair, the adjacent parents perform differential local search. When calculating the distance threshold of child target i, it is necessary to determine the distance Di of the extreme endpoint of child target i, and the distance threshold δi is shown in Formula (17):
δ i = 2 D i F 1 1
where |F(1)| is the number of individuals of the optimal non-inferior rank in the parent population, and the dynamic adjustment of the distance threshold ensures the uniformity of the Pareto solution.

2.4.3. Optimization Method of Hydro-Pneumatic Suspension Based on Improved Algorithm

At present, the optimization design of suspension system is improved through the existing algorithm. Researchers in some fields improve the algorithm according to the corresponding working characteristics so that the algorithm can match the suspension model better and the processing speed is faster. However, the suspension system of the sprayer almost imitates the suspension design of military vehicles. Different application scenarios make the suspension of the sprayer unable to adapt well to the comprehensive adaptability of farmland operation and asphalt pavement transportation, which often causes great soil damage and poor spraying stability. In this paper, the NSGA-II algorithm was adaptively improved for the established time-varying model, and the improved NSGA-II algorithm flow is shown in Figure 10.
Specifically, the hydraulic system parameters were input into the algorithm, and the random population pt(t = 0) of the time-varying model was used as the solution set of the initial vibration reduction indicator, with a scale of N. The non-dominated level of the population was calculated, the solution set was selected and then the improved adaptive operator was executed to deal with the impact of road roughness. The elite strategy was adopted for the solution set qt of the offspring to generate a new species group St. The i-th front-end Fi was obtained by calculating the crowding degree and eliminating the value with too high approximation of the solution set. The offspring were placed in pt+1. If the number was greater than the population number N, the above operations were repeated until the sum of pt+1 and Fi was not greater than N. It was calculated whether the solution set distribution of the time-varying model was too centralized through the DE local search introduced in the algorithm, intervention was conducted to make it jump out of the local optimum and the solution with higher overall uniformity was selected to enter pt+1. At this time, if t did not reach the maximum number of iterations, the adaptive crossover and DE mutation operations were simultaneously performed on the time-varying model to synthesize a new population qt and re-enter the algorithm loop. If t reached the maximum number of iterations, the optimal vibration reduction indicator solution set was output.

2.5. Scheme Design of Intelligent Optimization Based on Improved Algorithm

At present, the determination of the structural parameters of the large sprayer suspension is mostly based on the structural parameters of construction machinery and military vehicles. However, few researchers have studied the optimization methods, optimization objectives and optimization variables of the sprayer vibration reduction system from its operating characteristics and working environment. In this study, the improved NSGA-II algorithm was used to determine the optimization objectives and optimization variables to improve the vibration reduction effect of sprayer hydro-pneumatic suspension from three indicators.
In order to quantify the performance of the large sprayer vibration reduction system, it is necessary to convert the abstract vibration reduction effect into a concrete objective function so that it can be optimized and adjusted. ISO 2631 proposes judging ride comfort by acceleration. Sun et al. [34] pointed out that when the tire dynamic load increases by 10%, the road damage increases by 50%, and excessive tire dynamic load will compact the soil and destroy the crop growth environment [35]. Therefore, this paper takes the tire dynamic load as the evaluation indicator of road friendliness. Handling stability can reflect the ability of the vehicle to recover to its original state after being disturbed by the outside world, and the suspension recovery ability is closely related to the suspension dynamic deflection. Therefore, the suspension dynamic deflection was taken as the evaluation indicator of handling stability.
As a widely used mathematical method, root mean square can not only reflect the dispersion of data but also reflect the average level of samples. Therefore, this paper takes the root mean square of sprung mass acceleration, the root mean square of suspension dynamic deflection and the root mean square of tire dynamic load as the objective functions of ride comfort, handling stability and road friendliness. According to the analysis of suspension characteristics in Section 2.3.1 and Section 2.3.2, the structure that has a great impact on the damping and stiffness characteristics can be used as an important parameter for multi-objective optimization to solve the contradiction between sprung mass acceleration, suspension dynamic deflection and tire dynamic load so as to achieve the optimal vibration reduction effect. By improving NSGA-II algorithm, this paper optimizes the optimal combination of accumulator inflation volume, hydraulic cylinder inner diameter, piston rod diameter and damping hole diameter, and determines the optimal combination scheme among the three objective functions to improve the performance of hydro-pneumatic suspension system.
According to the design requirements of the whole vehicle and based on the premise of ensuring driving safety, the dynamic deflection of the suspension is less than one third of the stroke of the hydraulic cylinder. The range of optimization parameters based on sprayer structure parameters and design experience was determined and is shown in Table 3.

2.6. Test Device and Method

2.6.1. Test Device

The simulation test ignored many external factors in the actual operation of the suspension, resulting in the problem of idealization of the results. In order to further verify the performance of the hydro-pneumatic suspension system and explore the rationality of the algorithm for the optimization of the hydro-pneumatic suspension system, a vibration test bench based on the hydro-pneumatic suspension system and the air suspension system was built according to the vehicle parameters of the sprayer, and the structure of the test bench is shown in Figure 11 (it should be noted that the only difference between hydro-pneumatic suspension test bench and air suspension test bench is that the damping elements are hydraulic cylinder and air spring, respectively, whereas the structure of other parts is completely consistent. Therefore, in the technical diagram in Figure 11, we only show the hydro-pneumatic suspension test bench). The test bench was composed of acceleration sensor 1, displacement sensors 2 and 3, steel plate 4 used to simulate the sprung mass, hydraulic cylinder (can be replaced by air spring) 5, simulated tire 6 and servo actuator 7.
The simulated tire 6 was composed of coil spring and damper, and the stiffness and damping coefficient were 6 × 10⁵ N/mm and 5700, respectively. The frequency response range of servo actuator 7 was 0.1–200 Hz, and the structural form of axial static pressure support was adopted to increase the dynamic performance and anti-overturning ability of the system. Its dynamic output force was not less than 100 kN and its stroke was ±100 mm. Actuator 7 was used to simulate field road inputs. During the test, the computer sent the simulated road signal to the actuator as the excitation input of the system, and the test bench completely simulated the sprayer vibration reduction process and monitored the sprung mass acceleration, suspension dynamic deflection and tire dynamic displacement in real time through acceleration sensor 1 and displacement sensors 2 and 3. The models and parameters of sensors used in the test are shown in Table 4.

2.6.2. Test Method

In order to ensure the reliability of the test data, the structural parameters of the hydro-pneumatic suspension are the same as those of the previous simulation. The parameters of the selected air spring refer to the same type of large sprayer, and the specific parameters are shown in Table 5.
Before the test, the road signal sent by the computer was set to level D and the transmission time was set to 200 s. The suspension position of the test bench was replaced by the original hydro-pneumatic suspension (hydro-pneumatic suspension before optimization), the optimized hydro-pneumatic suspension and the air suspension in turn. After each test, we waited for the suspension system to stand still before proceeding to the next test, recorded the data with a computer and compared the vibration reduction effects of the three groups of tests.

3. Results

3.1. Verification of Improved Algorithm

In order to verify the effect of the improved NSGA-II algorithm in Section 2.4, the MOP test functions ZDT1, ZDT2, ZDT3 and ZDT6 were substituted into the algorithm (ZDT1, ZDT2, ZDT3 and ZDT6 are standard multi-objective optimization algorithm effect test functions that can accurately test the effect of the algorithm), and the spatial distribution uniformity index SP (the full name is spacing, which can measure the standard deviation of the minimum distance from each solution to other solutions. The smaller the sp value, the more uniform the solution set) was used to test the uniformity of the solution set [36], where the smaller the SP, the better the effect. In MATLAB R2020b, the initial population of the program was set to 50, the number of evolutions was set to 3000, the crossover probability was set to 0.9 and the mutation probability was set to 0.1. The operation effects of the improved NSGA-II algorithm and the original NSGA-II algorithm were compared, and the results are shown in Figure 12.
It can be seen from Figure 12 that, compared with the original NSGA-II algorithm, the optimal non-inferior solution set of the improved NSGA-II algorithm is closer to the Pareto frontier and has better convergence. At the same time, the results of the original algorithm are unevenly distributed and the individuals in some areas are too dense, whereas the improved algorithm does not have the problem of the individual distribution in some areas being too concentrated, and the distribution uniformity is better than the original NSGA-II algorithm. The result proves that the original algorithm has a poor global search effect and is prone to local optimization, which has been well solved after the improvement.
The two algorithms were run 10 times each, and the SP mean and standard deviation results of the two algorithms were obtained, as shown in Table 6. It was found that the improved algorithm is better than the original algorithm in population uniformity and stability. The advantages of the improved algorithm in this paper have been well verified.
The particle swarm optimization algorithm (PSO) has become one of the most widely used optimization algorithms due to its advantages of having simple computation and fast convergence. Compared to the particle swarm optimization algorithm, the NSGA-II algorithm has certain advantages regarding its global search ability. In order to verify whether the improved NSGA-II algorithm has a stronger performance, the index GD was used to evaluate the convergence performance of the three algorithms. The formula can be expressed as:
G D = y P min x P d i s x , y 2 P
where P is the solution set, P* is the uniformly distributed reference set and dis(x,y) is the Euclidean distance from point y in the solution set to point x in the reference set. Using the ZDT1 function as a benchmark, each algorithm was iterated 3000 times, and the optimization results of each algorithm are shown in Figure 13.
From Figure 13, it can be seen that the GD curve trend of the improved NSGA-II algorithm is basically consistent with that of the particle swarm optimization algorithm, and it is significantly better than the classical NSGA-II algorithm in terms of convergence speed. After the GD value stabilizes, the improved NGSA-II algorithm has the smallest GD value, a high algorithm accuracy and good convergence. Compared with the widely used particle swarm optimization algorithm and NSGA-II algorithm, it has certain advantages and a good comprehensive performance.

3.2. Comparison and Analysis of Suspension Parameter Optimization Results

3.2.1. Comparison of Optimization Results of the Algorithm

In order to further improve the performance of the hydro-pneumatic suspension designed in this study, based on the optimization model established in Section 2.4, the original NSGA-II algorithm and the improved NSGA-II algorithm were used to optimize the objective function built by MATLAB/Simulink, respectively. In the optimization, the random pavement model established in Section 2.2.2 was used to create level D pavement, the initial population was 200, the evolution time was 200 and other algorithm parameters were the same as those set in Section 3.1. The two algorithms were tested 10 times each, and the best one was selected. Finally, the optimized Pareto frontier is shown in Figure 14.
Figure 14a is the optimization result of the PSO algorithm, Figure 14b is the optimization result of the original NSGA-II algorithm and Figure 14c is the optimization result of the improved NSGA-II algorithm. It can be seen from Figure 14 that the individual distributions of the Pareto fronts of the original NSGA-II algorithm and classical PSO algorithm have poor uniformity and fall into a local optimum; the Pareto fronts of the improved NSGA-II algorithm have a more uniform distribution, which proves the effectiveness of the improved NSGA-II algorithm in optimizing complex models.

3.2.2. Determination of Suspension Parameters Based on Algorithm

When the sprayer runs, based on the premise that the dynamic load of the tire does not increase significantly, the ride comfort determines the comfort of the driver, where the complex pavement condition of the sprayer makes the ride comfort the highest priority. The suspension dynamic deflection, which determines the handling stability, is second in importance. According to the properties of the algorithm, all points on the Pareto front are optimal solutions. Since it is difficult to directly analyze the data in the figure, the K-means clustering algorithm was used to iterate the sprung mass acceleration and suspension dynamic deflection data according to the similarity, and the data were divided into different clusters to minimize the objective function of the two. Based on the standardization of spatial distance, the number of cluster centers was set to three, and the result of the K-means algorithm is shown in Figure 15.
The points in the shape of asterisks in Figure 15a are the cluster centers of each cluster, and the cluster centers of each cluster are extracted to Figure 15b and displayed as a three-dimensional radar map. It can be seen from the figure that the farther from the intersection of the coordinate axes, the larger the target value; that is, the worse the corresponding vibration reduction indicator effect. In order to ensure the road friendliness of field operations, the tire dynamic load should not be too large, so the center point of the Class-I area was selected as the optimization result.
Based on the above principle, the final structural parameters optimized by the improved algorithm were determined according to the basic principles of mechanical design. Table 7 is obtained by comparing the suspension parameters set in Section 2.1 with the improved parameters.
According to Table 7, the original parameters and the parameters optimized by the improved algorithm were used as the input of the MATLAB/Simulink model, respectively, for simulation. The changes in sprung mass acceleration, suspension dynamic deflection and tire dynamic load were checked before and after optimization, and the comparison results of performance indexes obtained by the simulation are shown in Figure 16.
It can be seen from Figure 16 that the improved sprung mass acceleration decreases greatly, the suspension dynamic deflection also improves significantly and the tire dynamic load increases slightly. Two thousand points were taken evenly on the curve to obtain the root mean square value and promotion rate before and after optimization, which are shown in Table 8. Under the premise of ensuring the good effect of spring mass acceleration, the tire dynamic load did not deteriorate. The result is in accordance with the basic principle of the highest priority of ride comfort, and the vibration reduction performance of sprayer hydro-pneumatic suspension is obviously improved.

3.3. Test Data and Analysis

According to the test device and method in Section 2.6, a performance test was carried out on the hydro-pneumatic suspension test bench and the air suspension test bench, respectively. After the test, the data recorded by the computer were exported, data processing and analysis were conducted, and the 10 s data with the best effect in each group of tests were intercepted. The tire dynamic displacement was converted into tire dynamic load, and the data comparison of the three kinds of suspensions is shown in Figure 17.
The sprung mass acceleration, suspension dynamic deflection and tire dynamic load data obtained by the test were analyzed using the root mean square (the method is the same as that used to obtain the data in Table 8), and the corresponding results are shown in Table 9.
The following conclusions can be drawn from the test data and analysis: (1) compared with the air suspension system, the hydro-pneumatic suspension system before and after optimization has a better performance in terms of sprung mass acceleration, suspension dynamic deflection and tire dynamic load, and has obvious advantages in vibration reduction; (2) the data obtained from the test are consistent with the trend of the simulation data, which verifies the effectiveness of the simulation results; (3) compared with the original hydro-pneumatic suspension system, the hydro-pneumatic suspension system optimized by the improved NSGA-II algorithm increased by 19.4%, 10.7% and 4.0%, respectively, in the three evaluation indicators.

4. Conclusions

In view of the significant difference between the working conditions of the sprayer and other vehicles, this paper analyzed the work requirements of the sprayer chassis for field operations and proposed the design, configuration optimization and verification methods for the sprayer vibration reduction system. The concrete conclusions are as follows:
(1)
The configuration of the sprayer’s hydro-pneumatic suspension system was proposed, a three-damping-hole oil circuit scheme for the sprayer suspension was established and a time-varying model was established to adapt to the actual working characteristics of the suspension.
(2)
The NSGA-II algorithm was improved in a targeted manner, which provides a solution for the original algorithm to solve the difficult problem of complex time-varying models. Through function verification, it was proved that the improved algorithm has a better optimization effect.
(3)
Aiming at the influencing factors of the performance of the sprayer’s hydro-pneumatic suspension, the optimization effect of the suspension performance of the improved NSGA-II algorithm was analyzed, and the optimal solutions with different weights for the actual working conditions of the sprayer were obtained. The results show that, compared with the original hydro-pneumatic suspension, the performance of sprung mass acceleration, suspension dynamic deflection and tire dynamic load in the simulation is improved by 26.9%, 8.2% and 1.9%, respectively, which verifies the effectiveness of the improved algorithm.
(4)
The vibration test benches of air suspension and hydro-pneumatic suspension were built, respectively, to verify the vibration reduction effect of suspension. Compared with the hydro-pneumatic suspension before optimization, each evaluation indicator increased by 19.4%, 10.7% and 4.0%, respectively. The test results are in accordance with the simulation results trend, which verifies the reliability of the scheme. According to the characteristics of farmland operations, the scheme optimizes the structure of the hydro-pneumatic suspension, introduces it into the design of the sprayer and improves the contradictory relationship between the ride comfort, handling stability and road friendliness of existing large high-clearance sprayers. This research process provides solutions for sprayer suspension design.

Author Contributions

Conceptualization, F.Y. and Y.D.; methodology, F.Y.; software, F.Y.; validation, F.Y. and W.L.; formal analysis, Y.D.; investigation, E.M. and Z.Z.; resources, E.M. and Z.L.; writing—original draft preparation, F.Y.; writing—review and editing, E.M. and Y.D.; visualization, Y.D. All authors have read and agreed to the published version of the manuscript.

Funding

This research was funded by Major scientific and Technological Innovation Projects of Shan Dong Province, grant number 2019JZZY010728-01; This research was funded by The Xinjiang Production and Construction Corps, grant number 2022DB001; This research was funded by Innovative Platform of Intelligent Agricultural Equipment Design and Manufacturing, grant number 2021XDRHXMPT29.

Institutional Review Board Statement

Not applicable.

Informed Consent Statement

Not applicable.

Data Availability Statement

Not applicable.

Conflicts of Interest

The authors declare no conflict of interest.

References

  1. Lu, L.; Liu, B.; Mao, E.; Song, Z.; Chen, J.; Chen, Y. Design and Optimization of High Ground Clearance Self-Propelled Sprayer Chassis Frame. Agriculture 2023, 13, 233. [Google Scholar] [CrossRef]
  2. He, X. Research and development of crop protection machinery and chemical application technology in China. China J. Pestic. Sci. 2019, 21, 921–930. [Google Scholar]
  3. Feng, Y.N.; Pei, L.; Li, Y.; Chen, X.B.; Gong, Y.; Chen, X. Industry status and development trend of self-propelled boom spray. J. Chin. Agric. Mech. 2019, 40, 56–59. [Google Scholar]
  4. Xue, T.; Li, W.; Du, Y.F.; Mao, E.R.; Wen, H.J. Adaptive fuzzy sliding mode control of spray boom active suspension for large high-clearance sprayer. Trans. CSAE 2018, 34, 47–56. [Google Scholar]
  5. Zhang, J.Q.; Ou, J.P.; Wang, G.Y.; Lu, D.G. Vibration isolation analysis for vehicle semi-active control suspension systems. J. Harbin Inst. Technol. 2003, 35, 912–915. [Google Scholar]
  6. Lun, G.D. Summary of Vehicles Shock Absorption Technology. Tract. Farm Transp. 2007, 34, 3–4. [Google Scholar]
  7. Feng, X.; Liu, Z. Development and current situation of automotive hydraulic shock absorber technology. J. Wuhan Univ. Technol. 2003, 27, 340–343. [Google Scholar]
  8. Zhou, C.C.; Ren, C.B. Optimum design of throttle slice thickness and its characteristic test for telescopic damper with damping matching. J. Vib. Eng. 2009, 22, 54–59. [Google Scholar]
  9. Munzert, A.; Wahl, G.; Schote, N. Independent Wheel Suspension for a Steerable Wheel. EP1864887, 2007. [Google Scholar]
  10. Press, R.U. Raised Axle and Suspension System. U.S. Patent 8162335B1, 24 April 2012. [Google Scholar]
  11. Buschena, J. Combination Drive and Suspension System for a Vehicle. U.S. Patent 8172032, 8 May 2012. [Google Scholar]
  12. Jia, W.D.; Zhang, L.J.; Yan, M.D.; Xue, X.Y. Current situation and development trend of boom sprayer. J. Chin. Agric. Mech. 2013, 34, 19–22. [Google Scholar]
  13. Félez, J.; Vera, C. Bond graph assisted models for hydro-pneumatic suspensions in crane vehicles. Veh. Syst. Dyn. 2007, 16, 313–332. [Google Scholar]
  14. Zhen, L.X.; Zhang, W.M. Research on simulation and experiment of hydro-pneumatic suspension with single gas cell. J. Mech. Eng. 2009, 45, 290–294. [Google Scholar] [CrossRef]
  15. Ma, G.; Tan, R.; Wu, R. Non-linear mathematic model of hydro-pneumatic suspensionin crane vehicles and its simulation. J. Mech. Eng. 2002, 38, 95–99. [Google Scholar] [CrossRef]
  16. Chen, K.; He, S.; Xu, E.; Tang, R.; Wang, Y. Research on ride comfort analysis and hierarchical optimization of heavy vehicles with coupled nonlinear dynamics of suspension. Measurement 2020, 165, 108142. [Google Scholar] [CrossRef]
  17. Wu, W.; Zhang, S.; Zhang, Z. Mathematical simulations and on-road experimentations of the vibration energy harvesting from mining dump truck hydro-pneumatic suspension. Shock. Vib. 2019, 2019, 4814072. [Google Scholar] [CrossRef]
  18. Solomon, U.; Padmanabhan, C. Hydro-gas suspension system for a tracked vehicle: Modeling and analysis. J. Terramechanics 2011, 48, 125–137. [Google Scholar] [CrossRef]
  19. Mohsen, M.; Kamel, H.; Sharaf, A.M.; El-Demerdash, S.M. Optimal design of passive suspension system of a 6 × 6 multi-wheeled all-terrain vehicle using genetic algorithm. Int. J. Heavy Veh. Syst. 2018, 25, 508–533. [Google Scholar] [CrossRef]
  20. Zhao, Y.; Xu, H.; Deng, Y.; Wang, Q. Multi-objective optimization for ride comfort of hydro-pneumatic suspension vehicles with mechanical elastic wheel. Proc. Inst. Mech. Eng. Part D J. Automob. Eng. 2019, 233, 2714–2728. [Google Scholar] [CrossRef]
  21. Nagarkar, M.P.; Patil, G.; Patil, R. Optimization of nonlinear quarter car suspension–seat–driver model. J. Adv. Res. 2016, 7, 991–1007. [Google Scholar] [CrossRef]
  22. Deb, K.; Pratap, A.; Agarwal, S.; Meyarivan, T. A fast and elitist multiobjective genetic algorithm: NSGA-II. IEEE Trans. Evol. Comput. 2002, 6, 182–197. [Google Scholar] [CrossRef]
  23. Fu, S.H.; Li, Z.; Du, Y.F.; Mao, E.R.; Zhu, Z.X. Matching Optimization for Tractor Powertrain Based on Improved NSGA-II Algorithm. Nongye Jixie Xuebao/Trans. Chin. Soc. Agric. Mach. 2018, 49, 349–357. [Google Scholar]
  24. Li, K.; Sha, Z.; Xue, W.; Chen, X.; Mao, H.; Tan, G. A fast modeling and optimization scheme for greenhouse environmental system using proper orthogonal decomposition and multi-objective genetic algorithm. Comput. Electron. Agric. 2020, 168, 105096. [Google Scholar] [CrossRef]
  25. Winiczenko, R.; Górnicki, K.; Kaleta, A.; Martynenko, A.; Janaszek-Mańkowska, M.; Trajer, J. Multi-objective optimization of convective drying of apple cubes. Comput. Electron. Agric. 2018, 145, 341–348. [Google Scholar] [CrossRef]
  26. Zhang, C.Y.; Dong, X.; Wang, X.J.; Li, X.Y.; Liu, Q. Improved NSGA-II for the multi-objective flexible job-shop scheduling problem. J. Mech. Eng. 2010, 46, 156–164. [Google Scholar] [CrossRef]
  27. Zhao, X.; Su, T.; Liu, X.; Zhang, X. Multi-objective optimization of main bearing assembly structure based on improved NSGA-II. Energy Sci. Eng. 2022, 10, 43–63. [Google Scholar] [CrossRef]
  28. Liu, W.; Shi, W.K.; Gui, L.M.; Fang, D.G.; Guo, F.X. Multi-objective optimization of suspension system based on vehicle ride comfort and handling stability. J. Jilin Univ. (Eng. Technol. Ed.) 2011, 41, 1199–1204. [Google Scholar]
  29. Mao, E.R.; Chen, Y.; Du, Y.F.; Zhu, Z.X.; Xue, T.; Liu, B. A High Clearance Self-Propelled Boom Sprayer with Ground Clearance and Wheel Spacing Adjustment Device. CN106305681B, 9 April 2017. [Google Scholar]
  30. Liang, G.Q.; Zhao, T.; Wang, Y.; Wei, Y.T. Road Unevenness Identification Based on LSTM Network. Automot. Eng. 2021, 43, 509–517+628. [Google Scholar]
  31. Lu, J.L. Study on Simulation of Vehicle Semi-Active Suspension under Road Surface Exitation. Master’s Thesis, Henan Agricultural University, Zhengzhou, China, 2009. [Google Scholar]
  32. Wu, Z.C.; Chen, S.Z.; Yang, L.; Zhang, B. Model of road roughness in time domain based on rational function. Trans. Beijing Inst. Technol. 2009, 29, 795–798. [Google Scholar]
  33. Storn, R.; Price, K. Differential evolution–a simple and efficient heurdistic for global optimization over continuous spaces. J. Glob. Optim. 1997, 11, 341–359. [Google Scholar] [CrossRef]
  34. Sun, L.; Cai, X.; Yang, J. Genetic algorithm-based optimum vehicle suspension design using minimum dynamic pavement load as a design criterion. J. Sound Vib. 2007, 301, 18–27. [Google Scholar] [CrossRef]
  35. Zheng, E.; Zhong, X.; Zhu, R.; Xue, J.; Cui, S.; Gao, H.; Lin, X. Investigation into the vibration characteristics of agricultural wheeled tractor-implement system with hydro-pneumatic suspension on the front axle. Biosyst. Eng. 2019, 186, 14–33. [Google Scholar] [CrossRef]
  36. Schott, J.R. Fault Tolerant Design Using Single and Multicriteria Genetic Algorithm Optimization. Ph.D. Thesis, Massachusetts Institute of Technology, Cambridge, MA, USA, 1995. [Google Scholar]
Figure 1. Design of sprayer hydro-pneumatic suspension chassis: (1) the frame, (2) the steering system, (3) the hydro-pneumatic suspension hydraulic cylinder, (4) the guide mechanism and (5) connecting housing of hydro-pneumatic suspension.
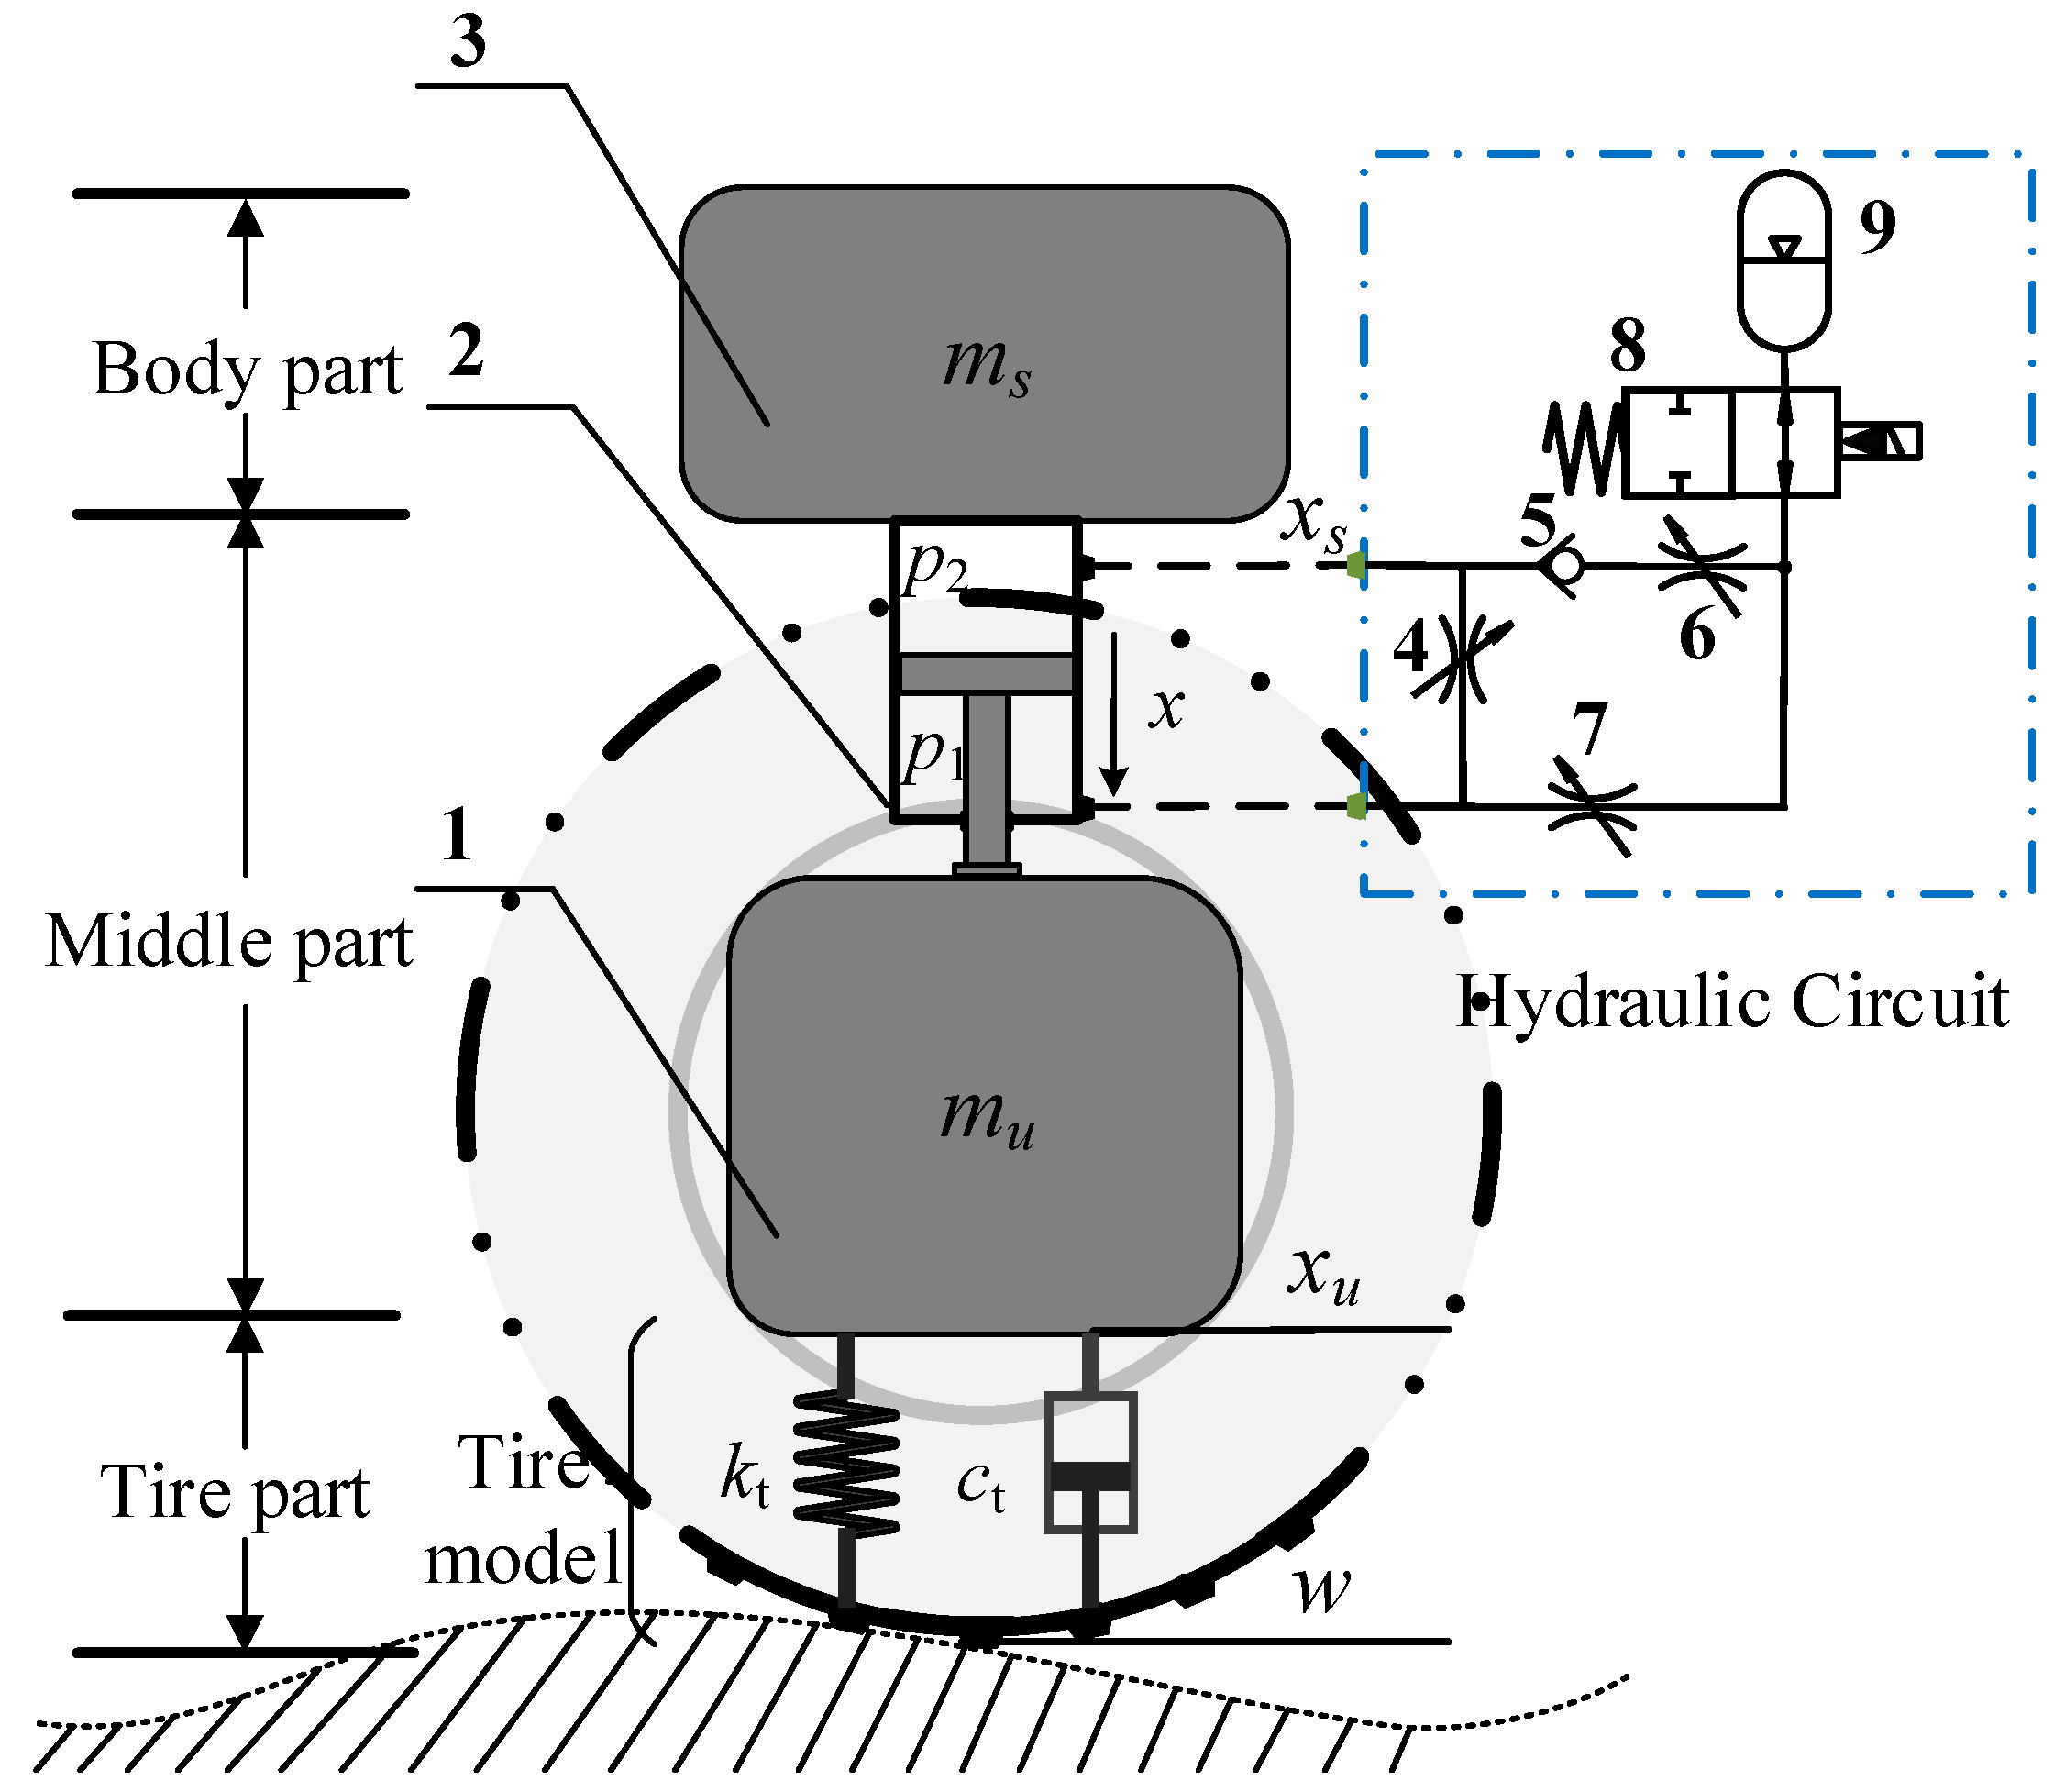
Agriculture 13 01071 g001
Figure 2. Quarter hydro-pneumatic suspension model: (1) unsprung mass, (2) hydraulic cylinder, (3) sprung mass, (4) damping hole, (5) check valve, (6) damping hole, (7) damping hole, (8) electromagnetic on-off valve and (9) accumulator.
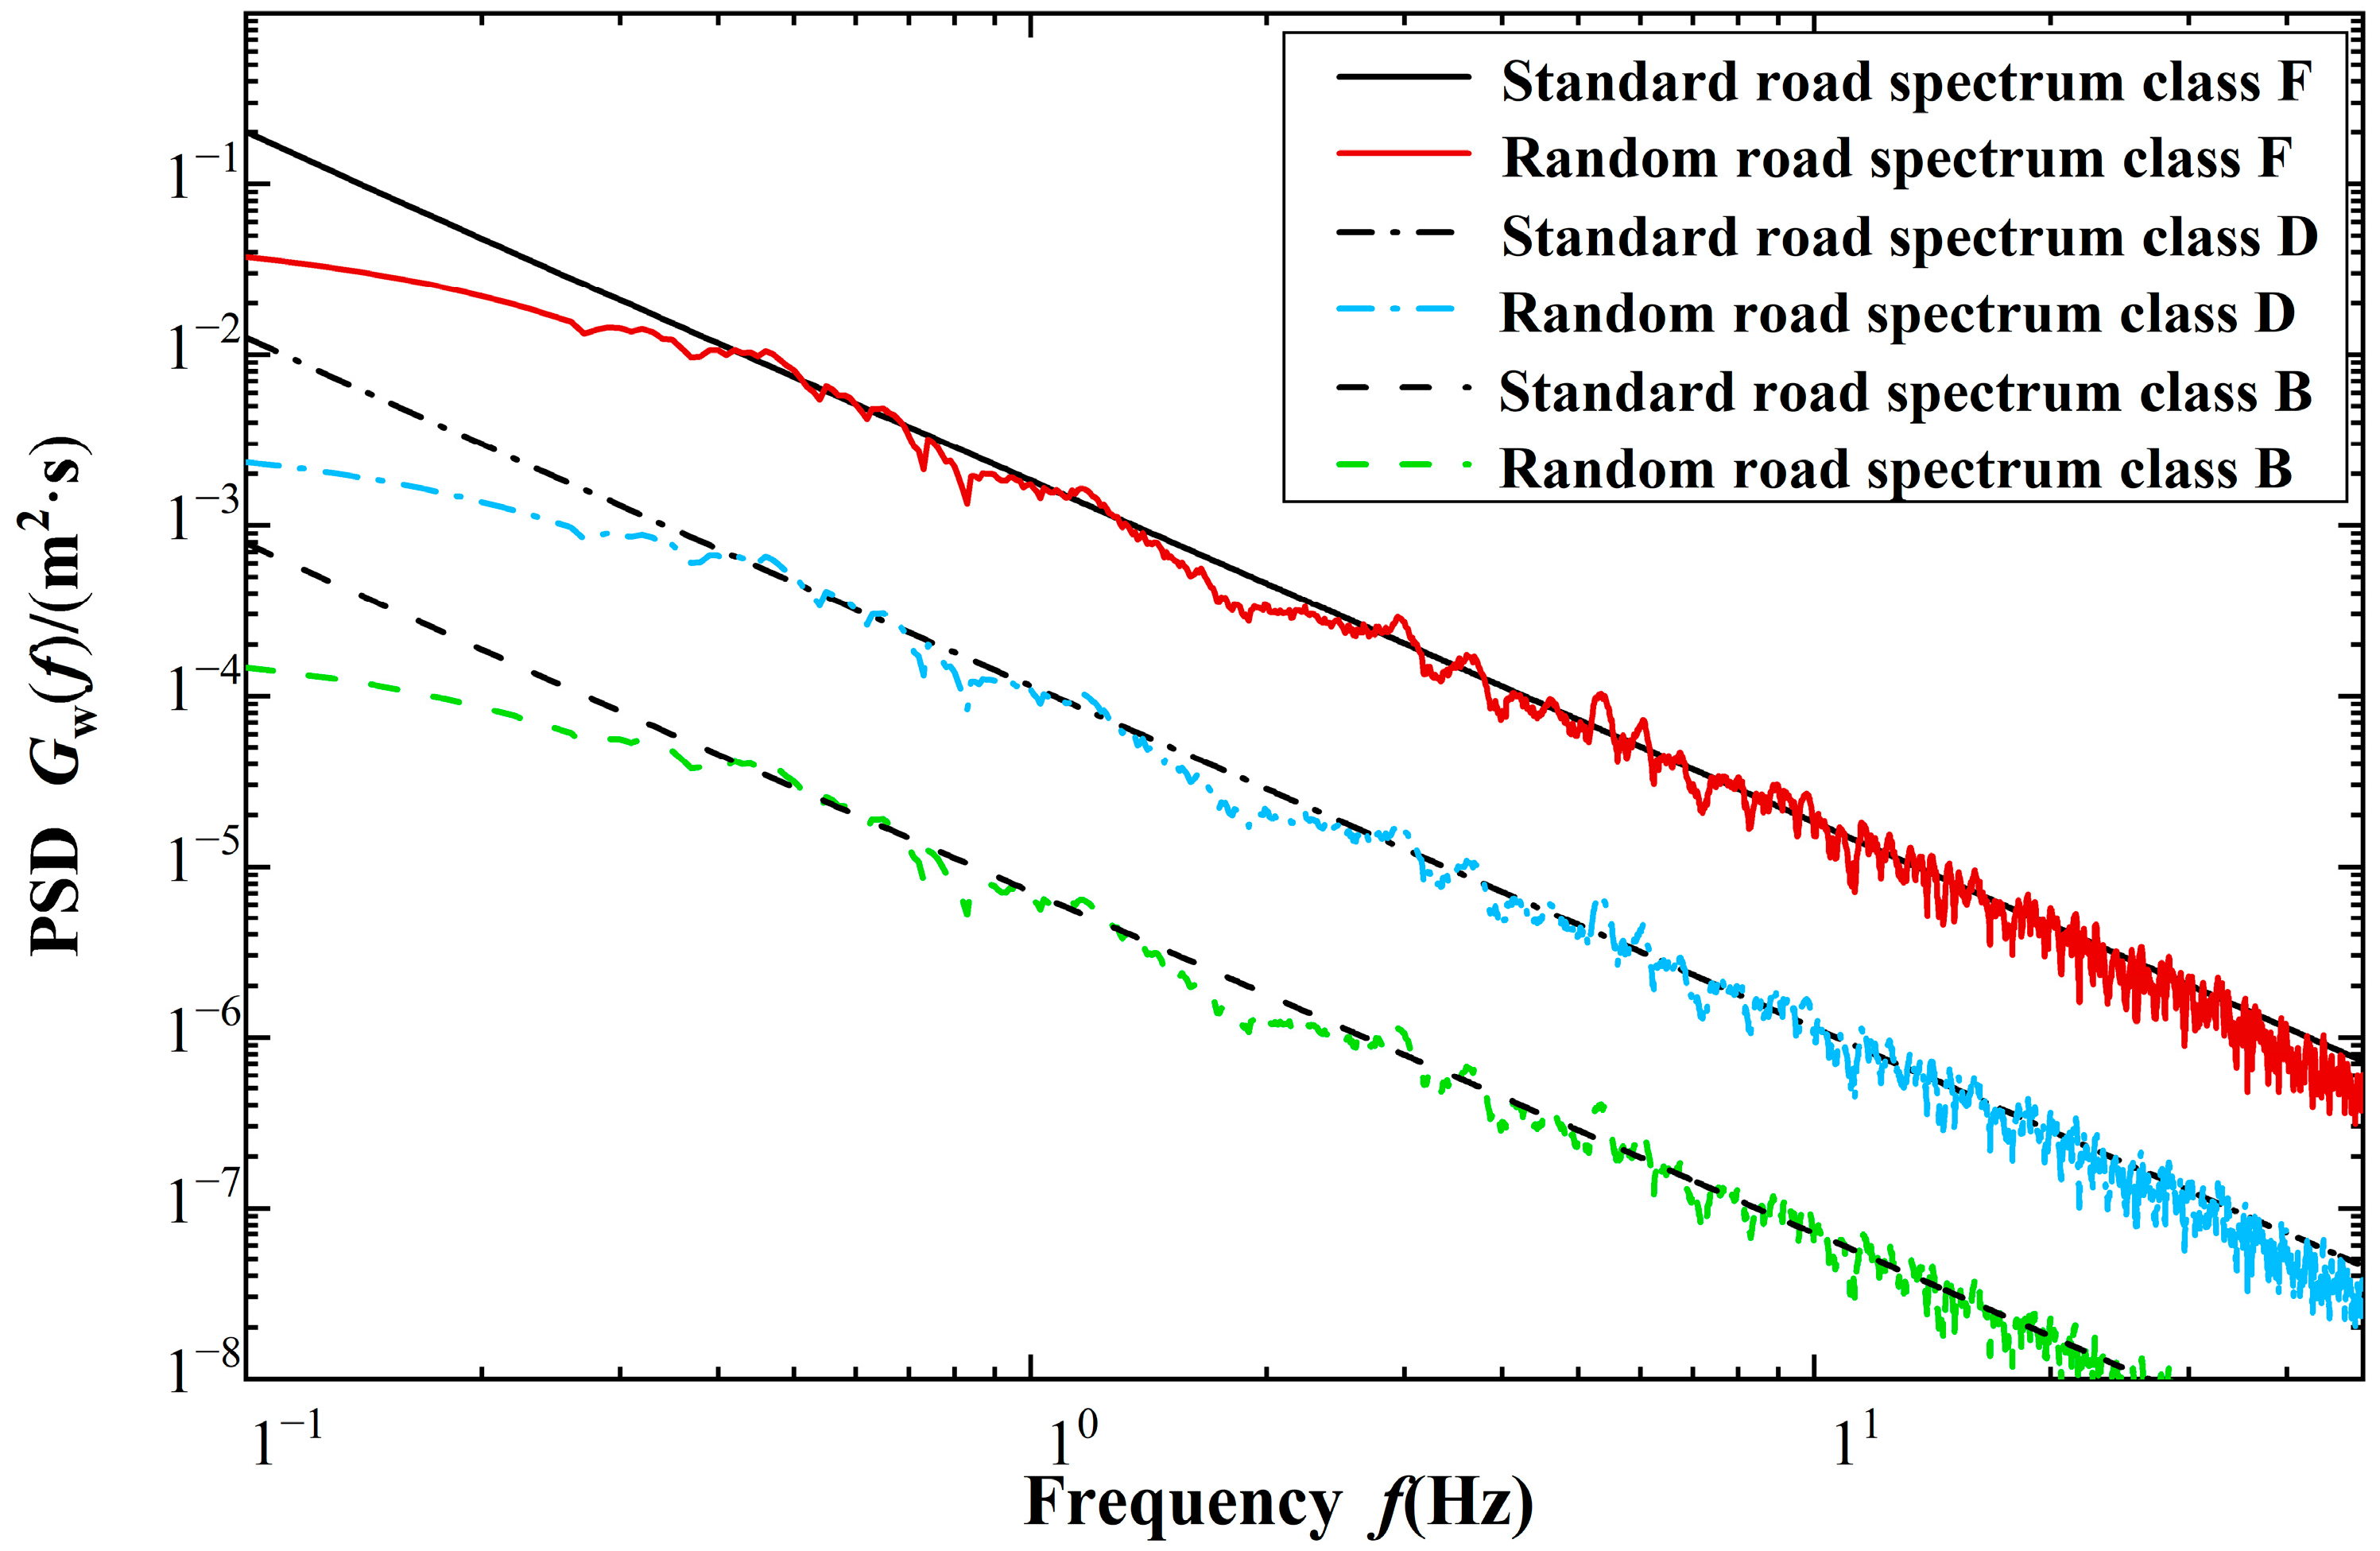
Agriculture 13 01071 g002
Figure 3. Comparison of PSD curve between random road and standard road.
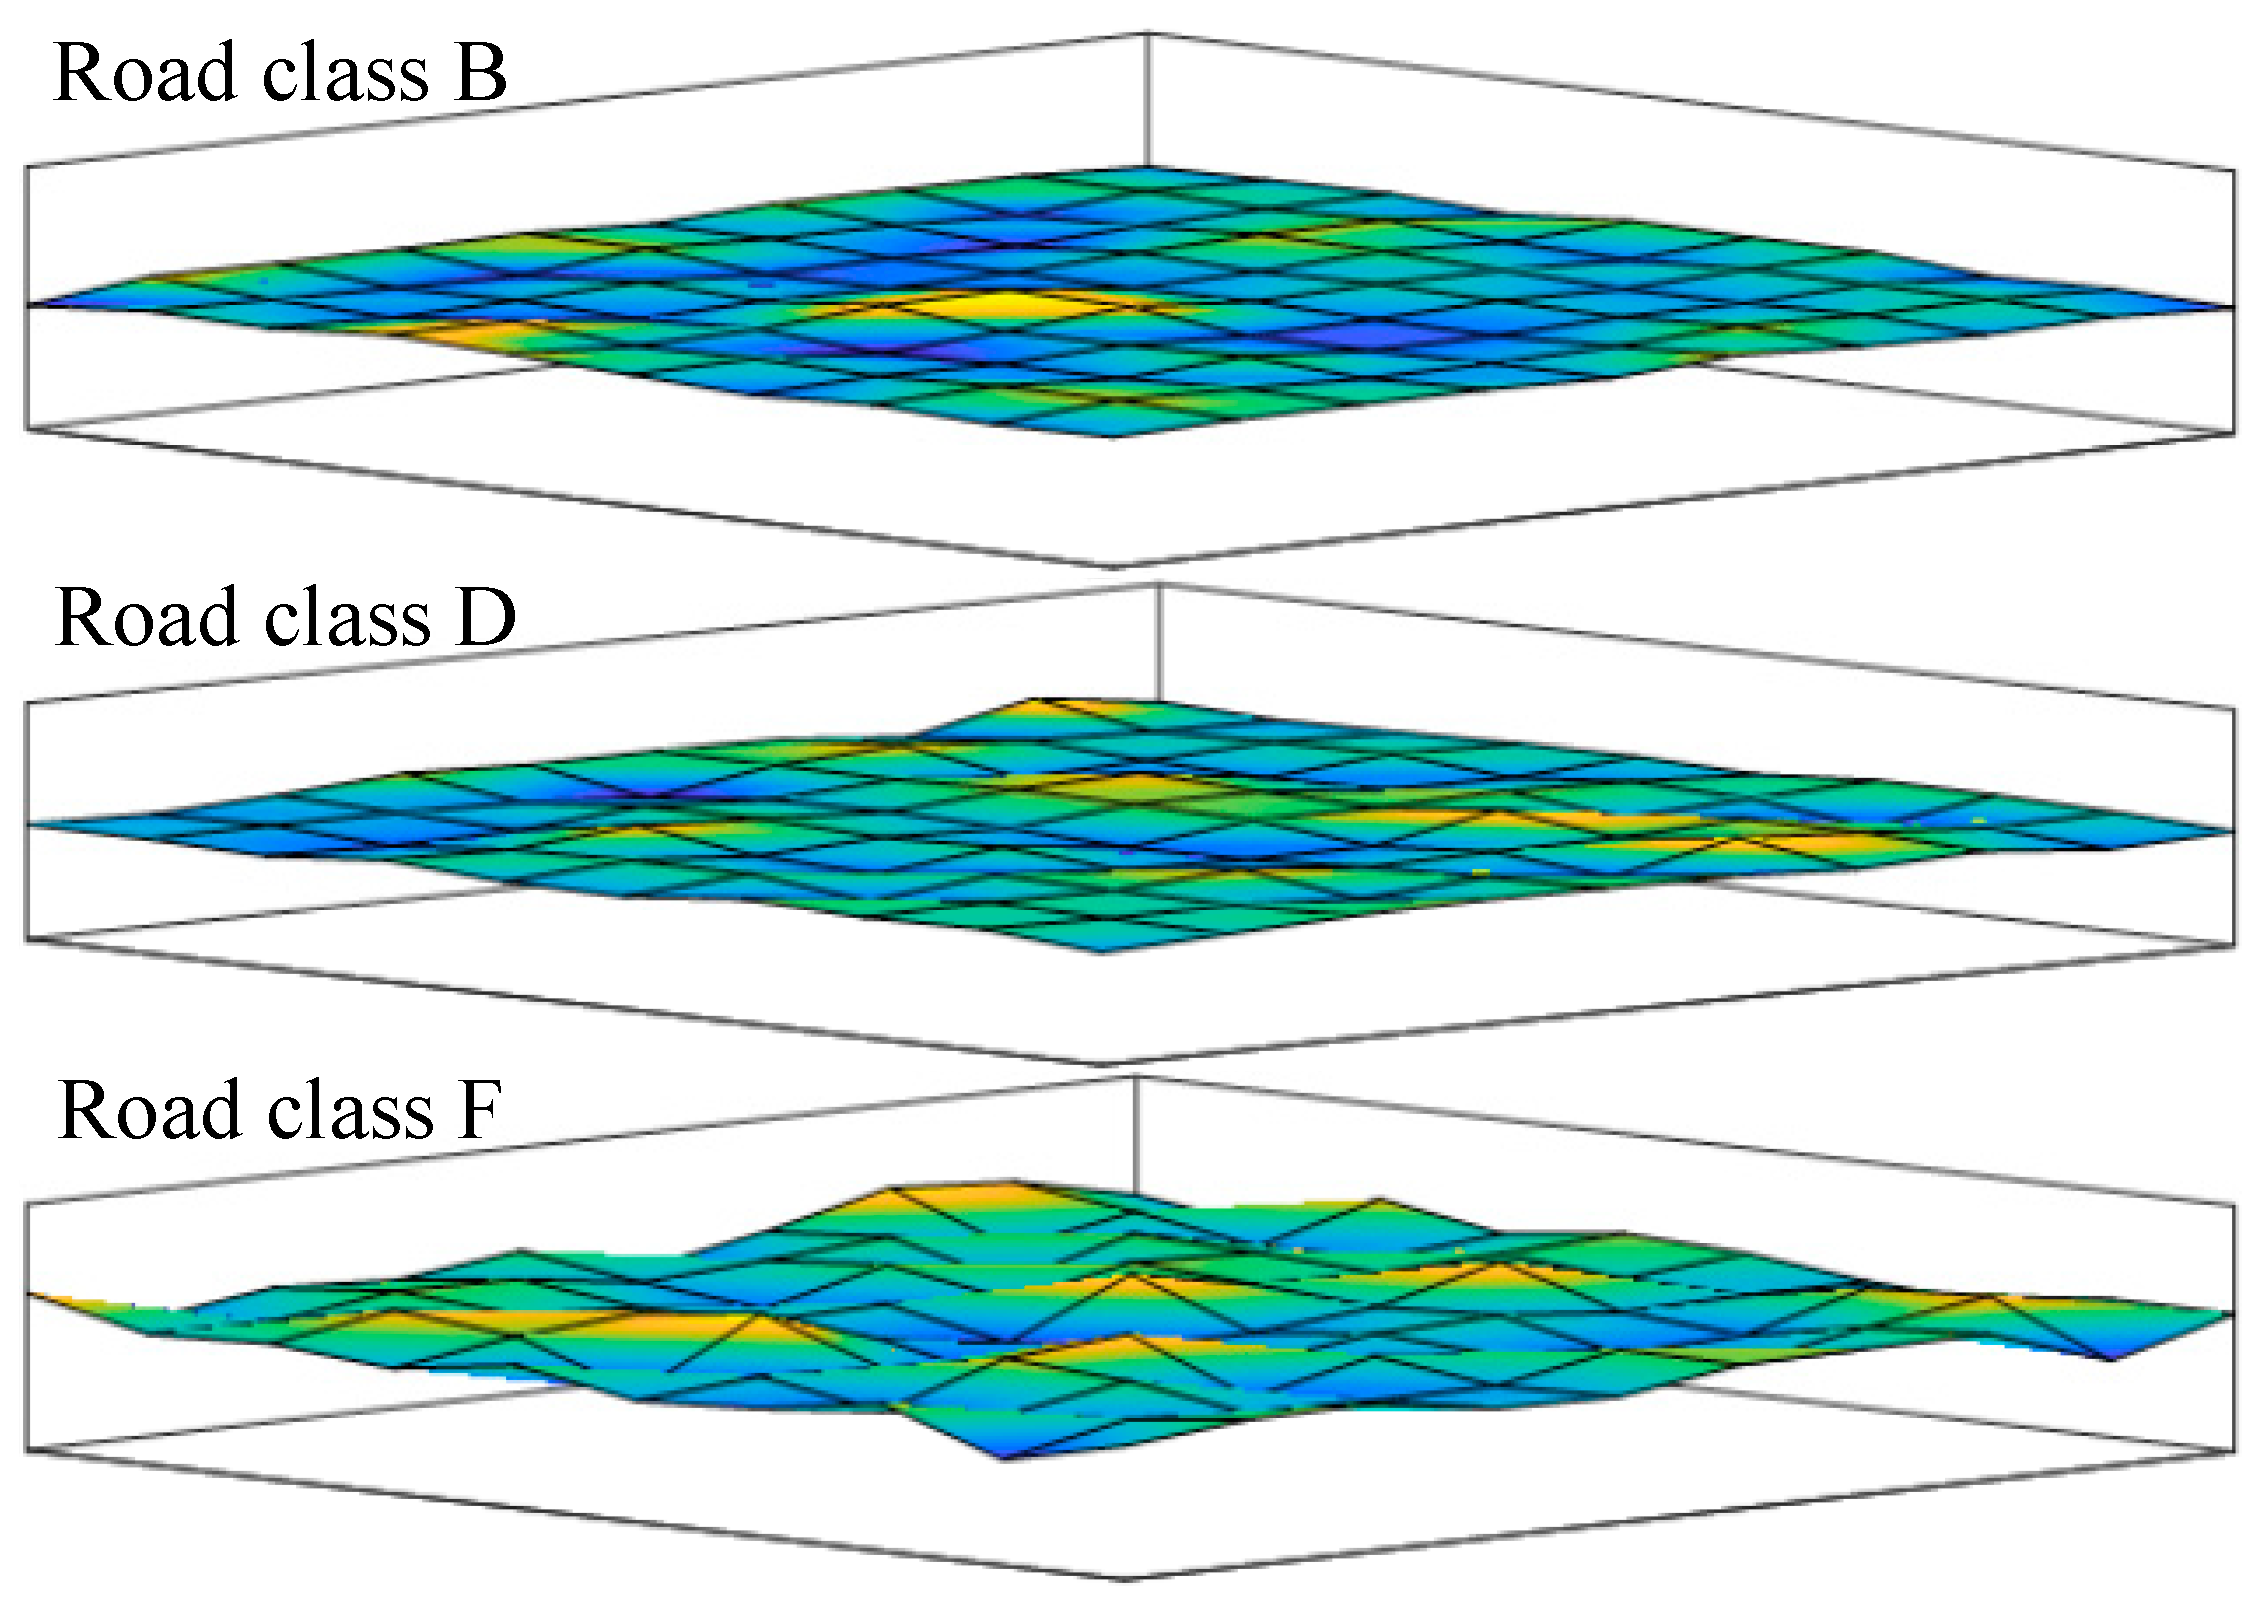
Agriculture 13 01071 g003
Figure 4. Representation of the random surfaces for road classes B, D and F.
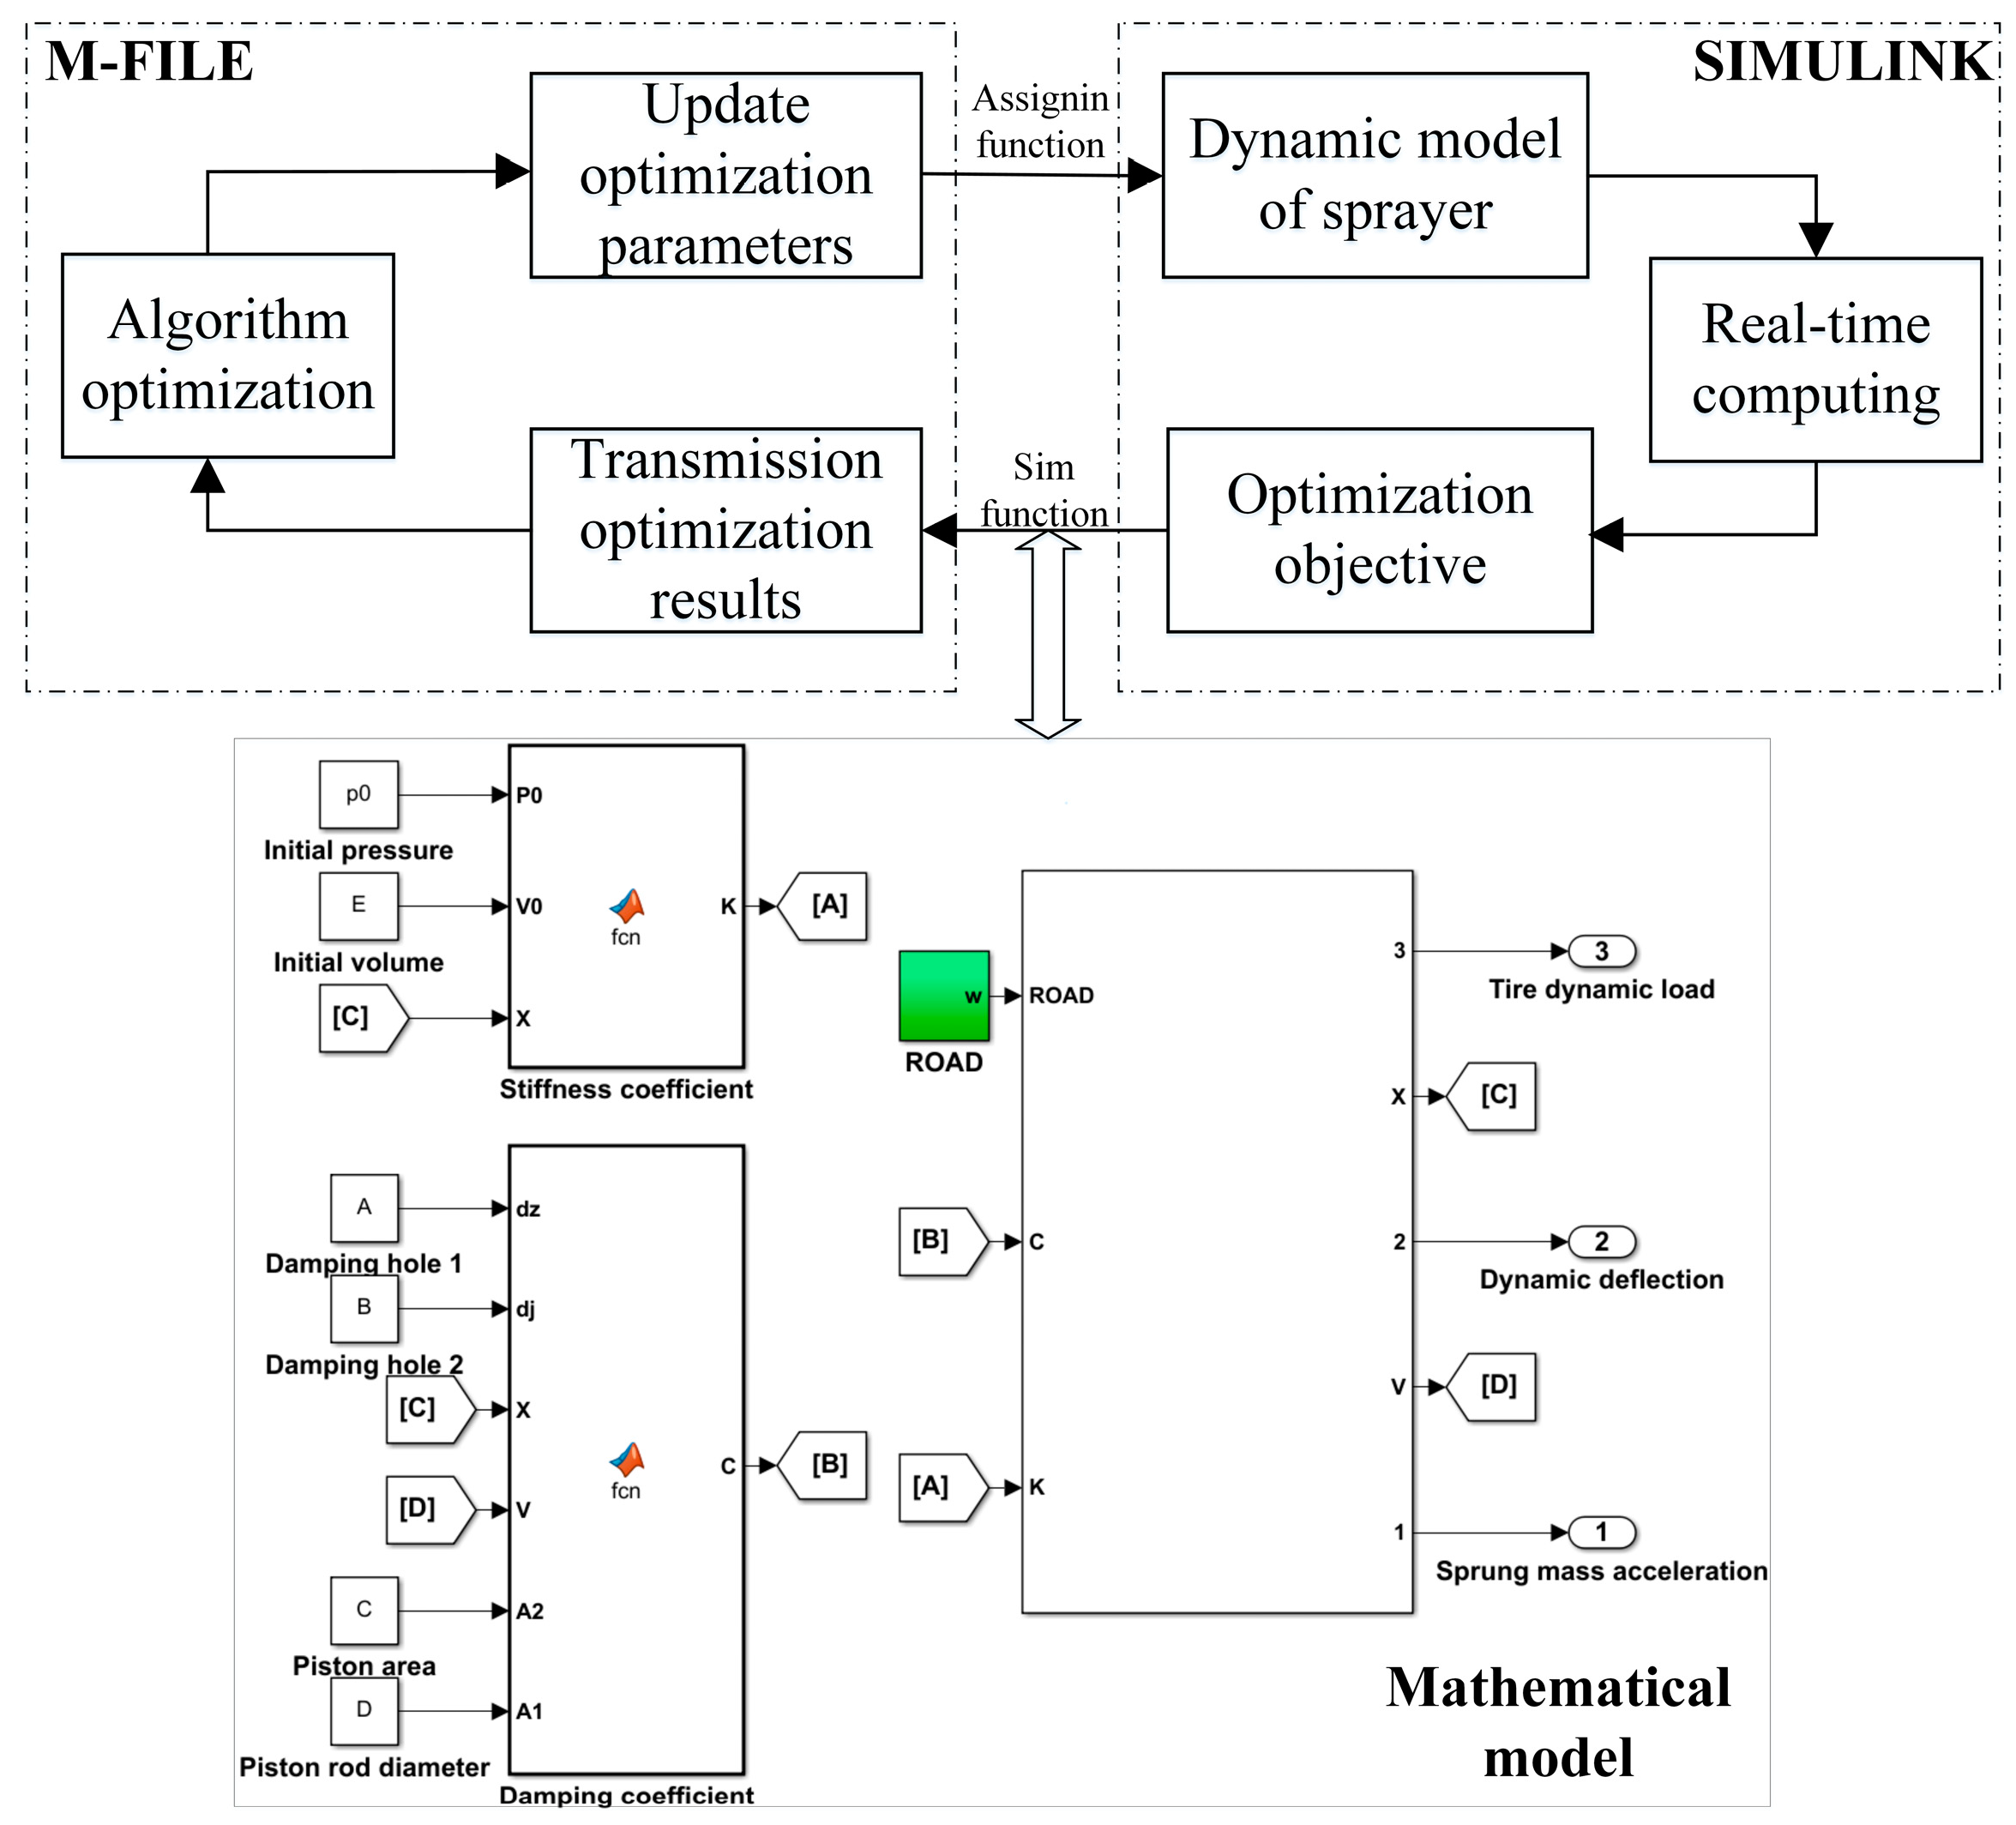
Agriculture 13 01071 g004
Figure 5. Real-time time-varying model.
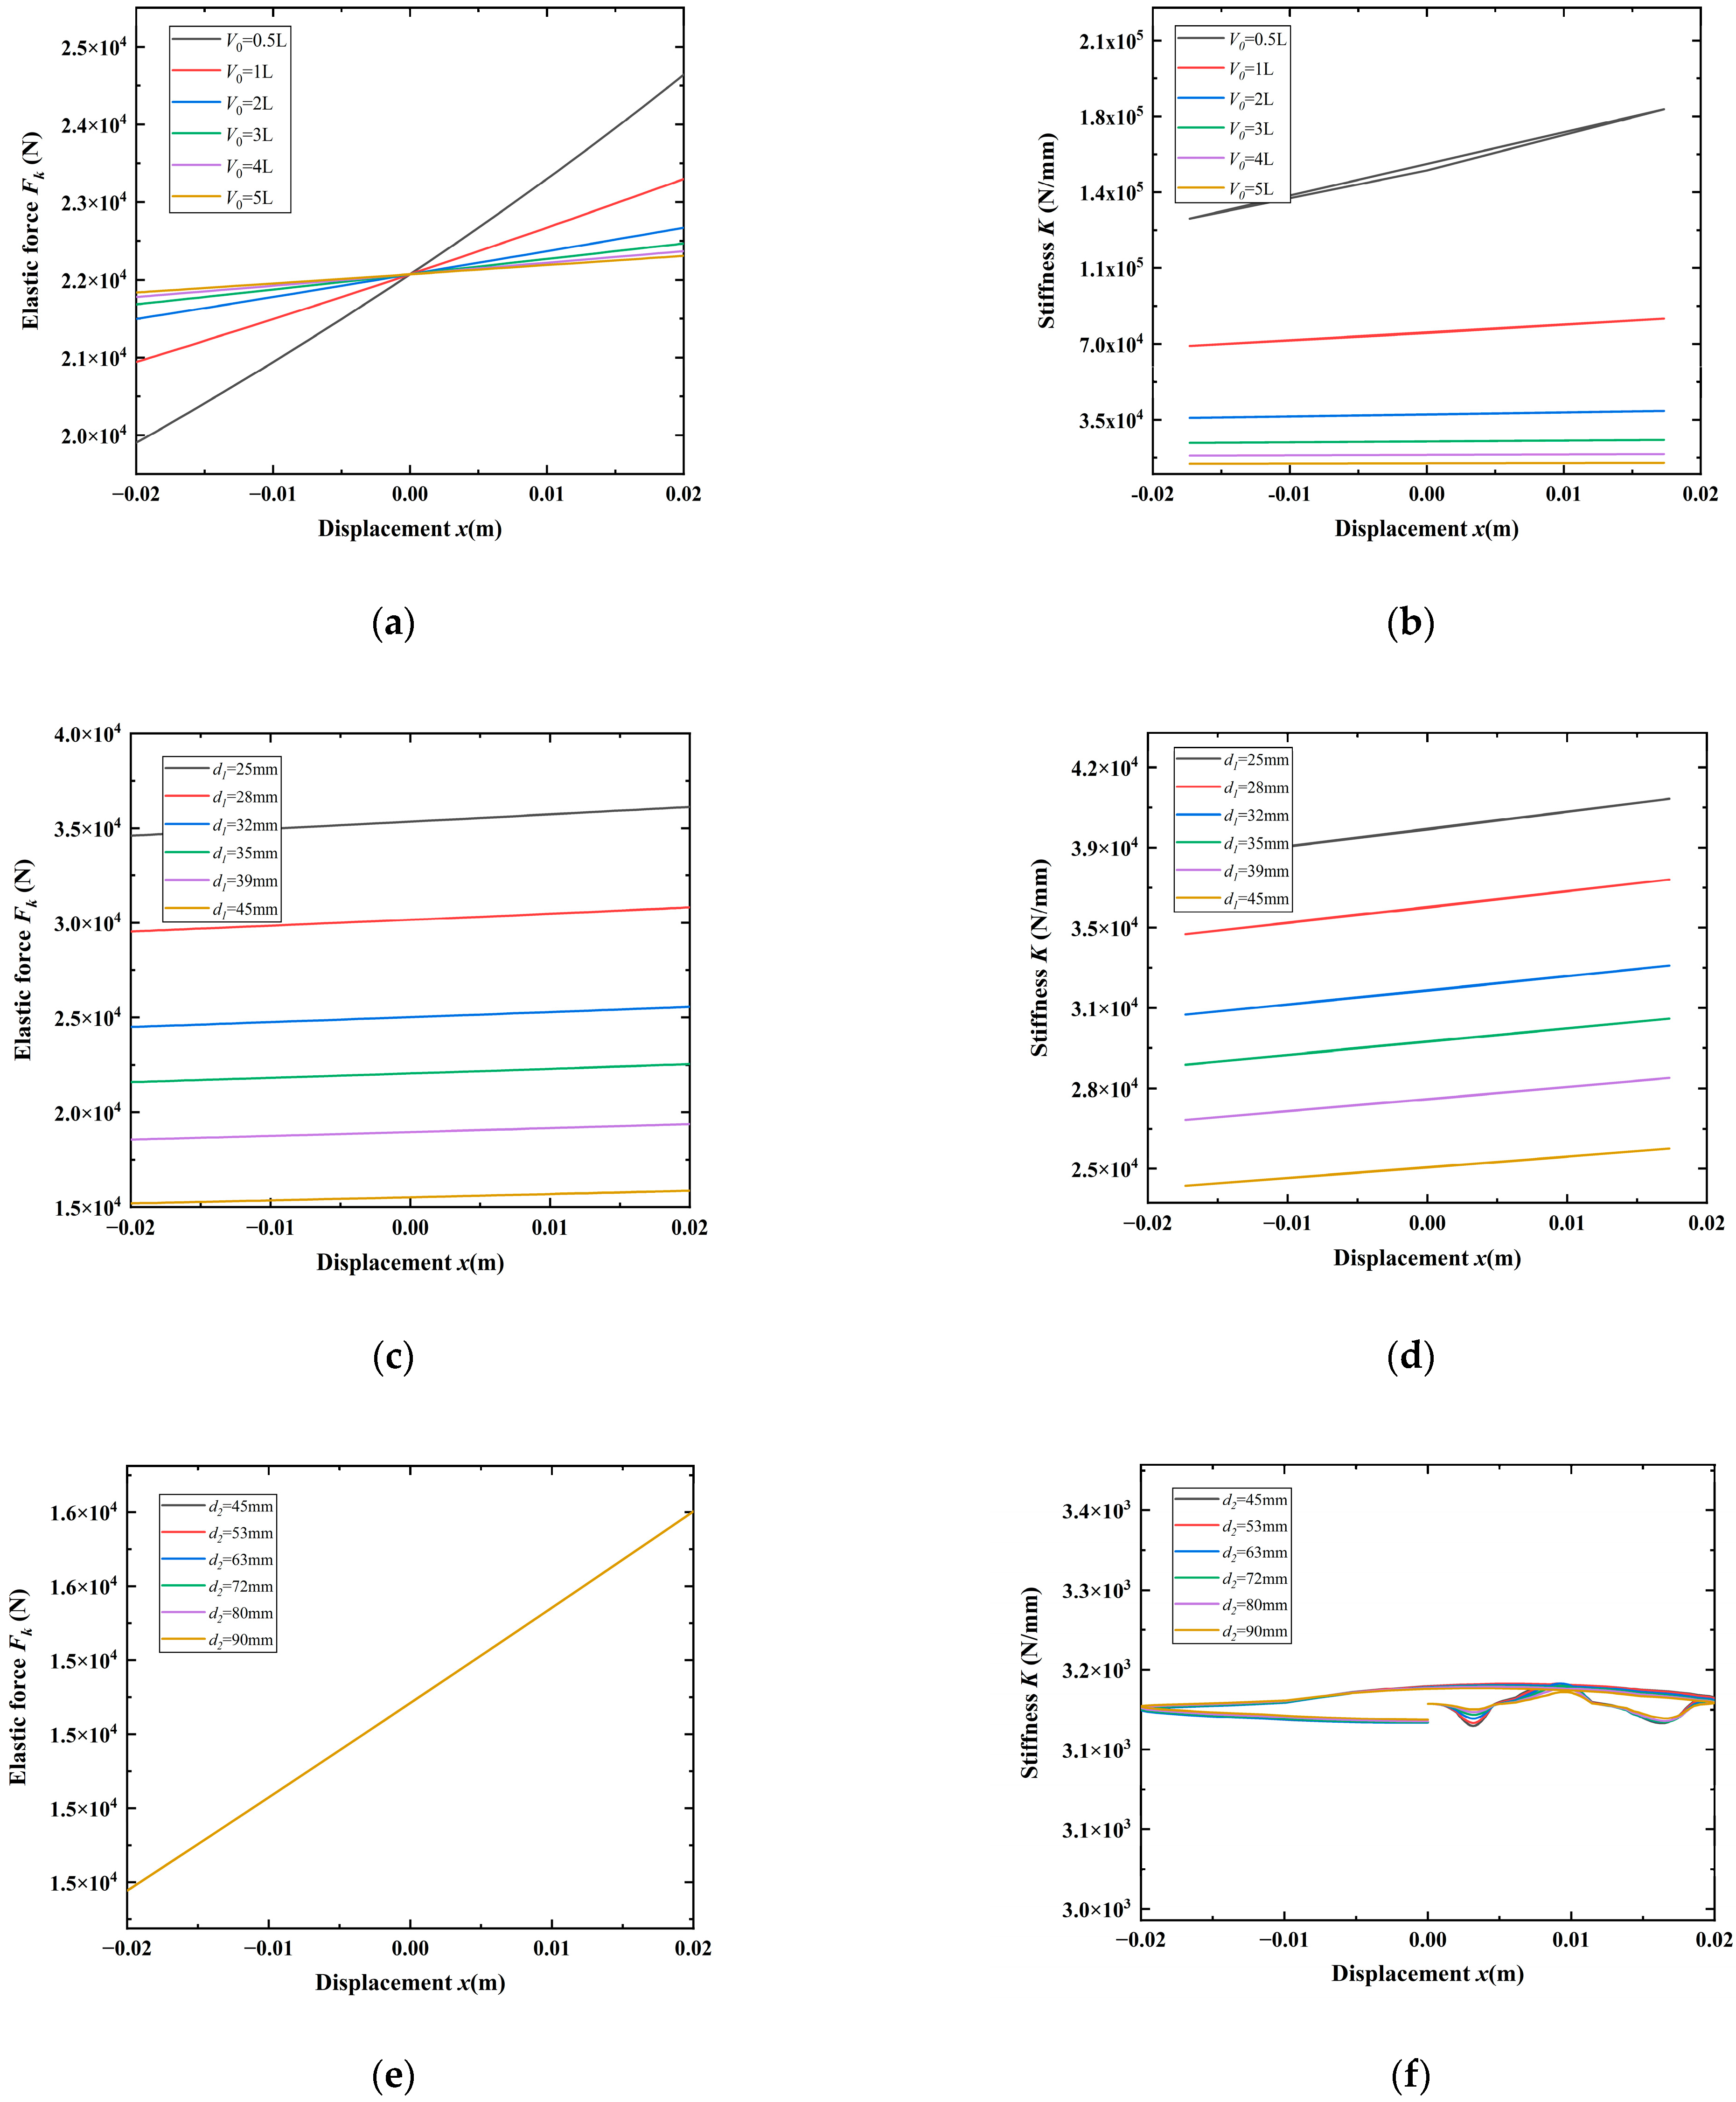
Agriculture 13 01071 g005
Figure 6. Relationship between elastic force and stiffness with parameters: (a) relationship between elastic force and V0, (b) relationship between stiffness and V0, (c) relationship between elastic force and d1, (d) relationship between stiffness and d1, (e) relationship between elastic force and d2 and (f) relationship between stiffness and d2.
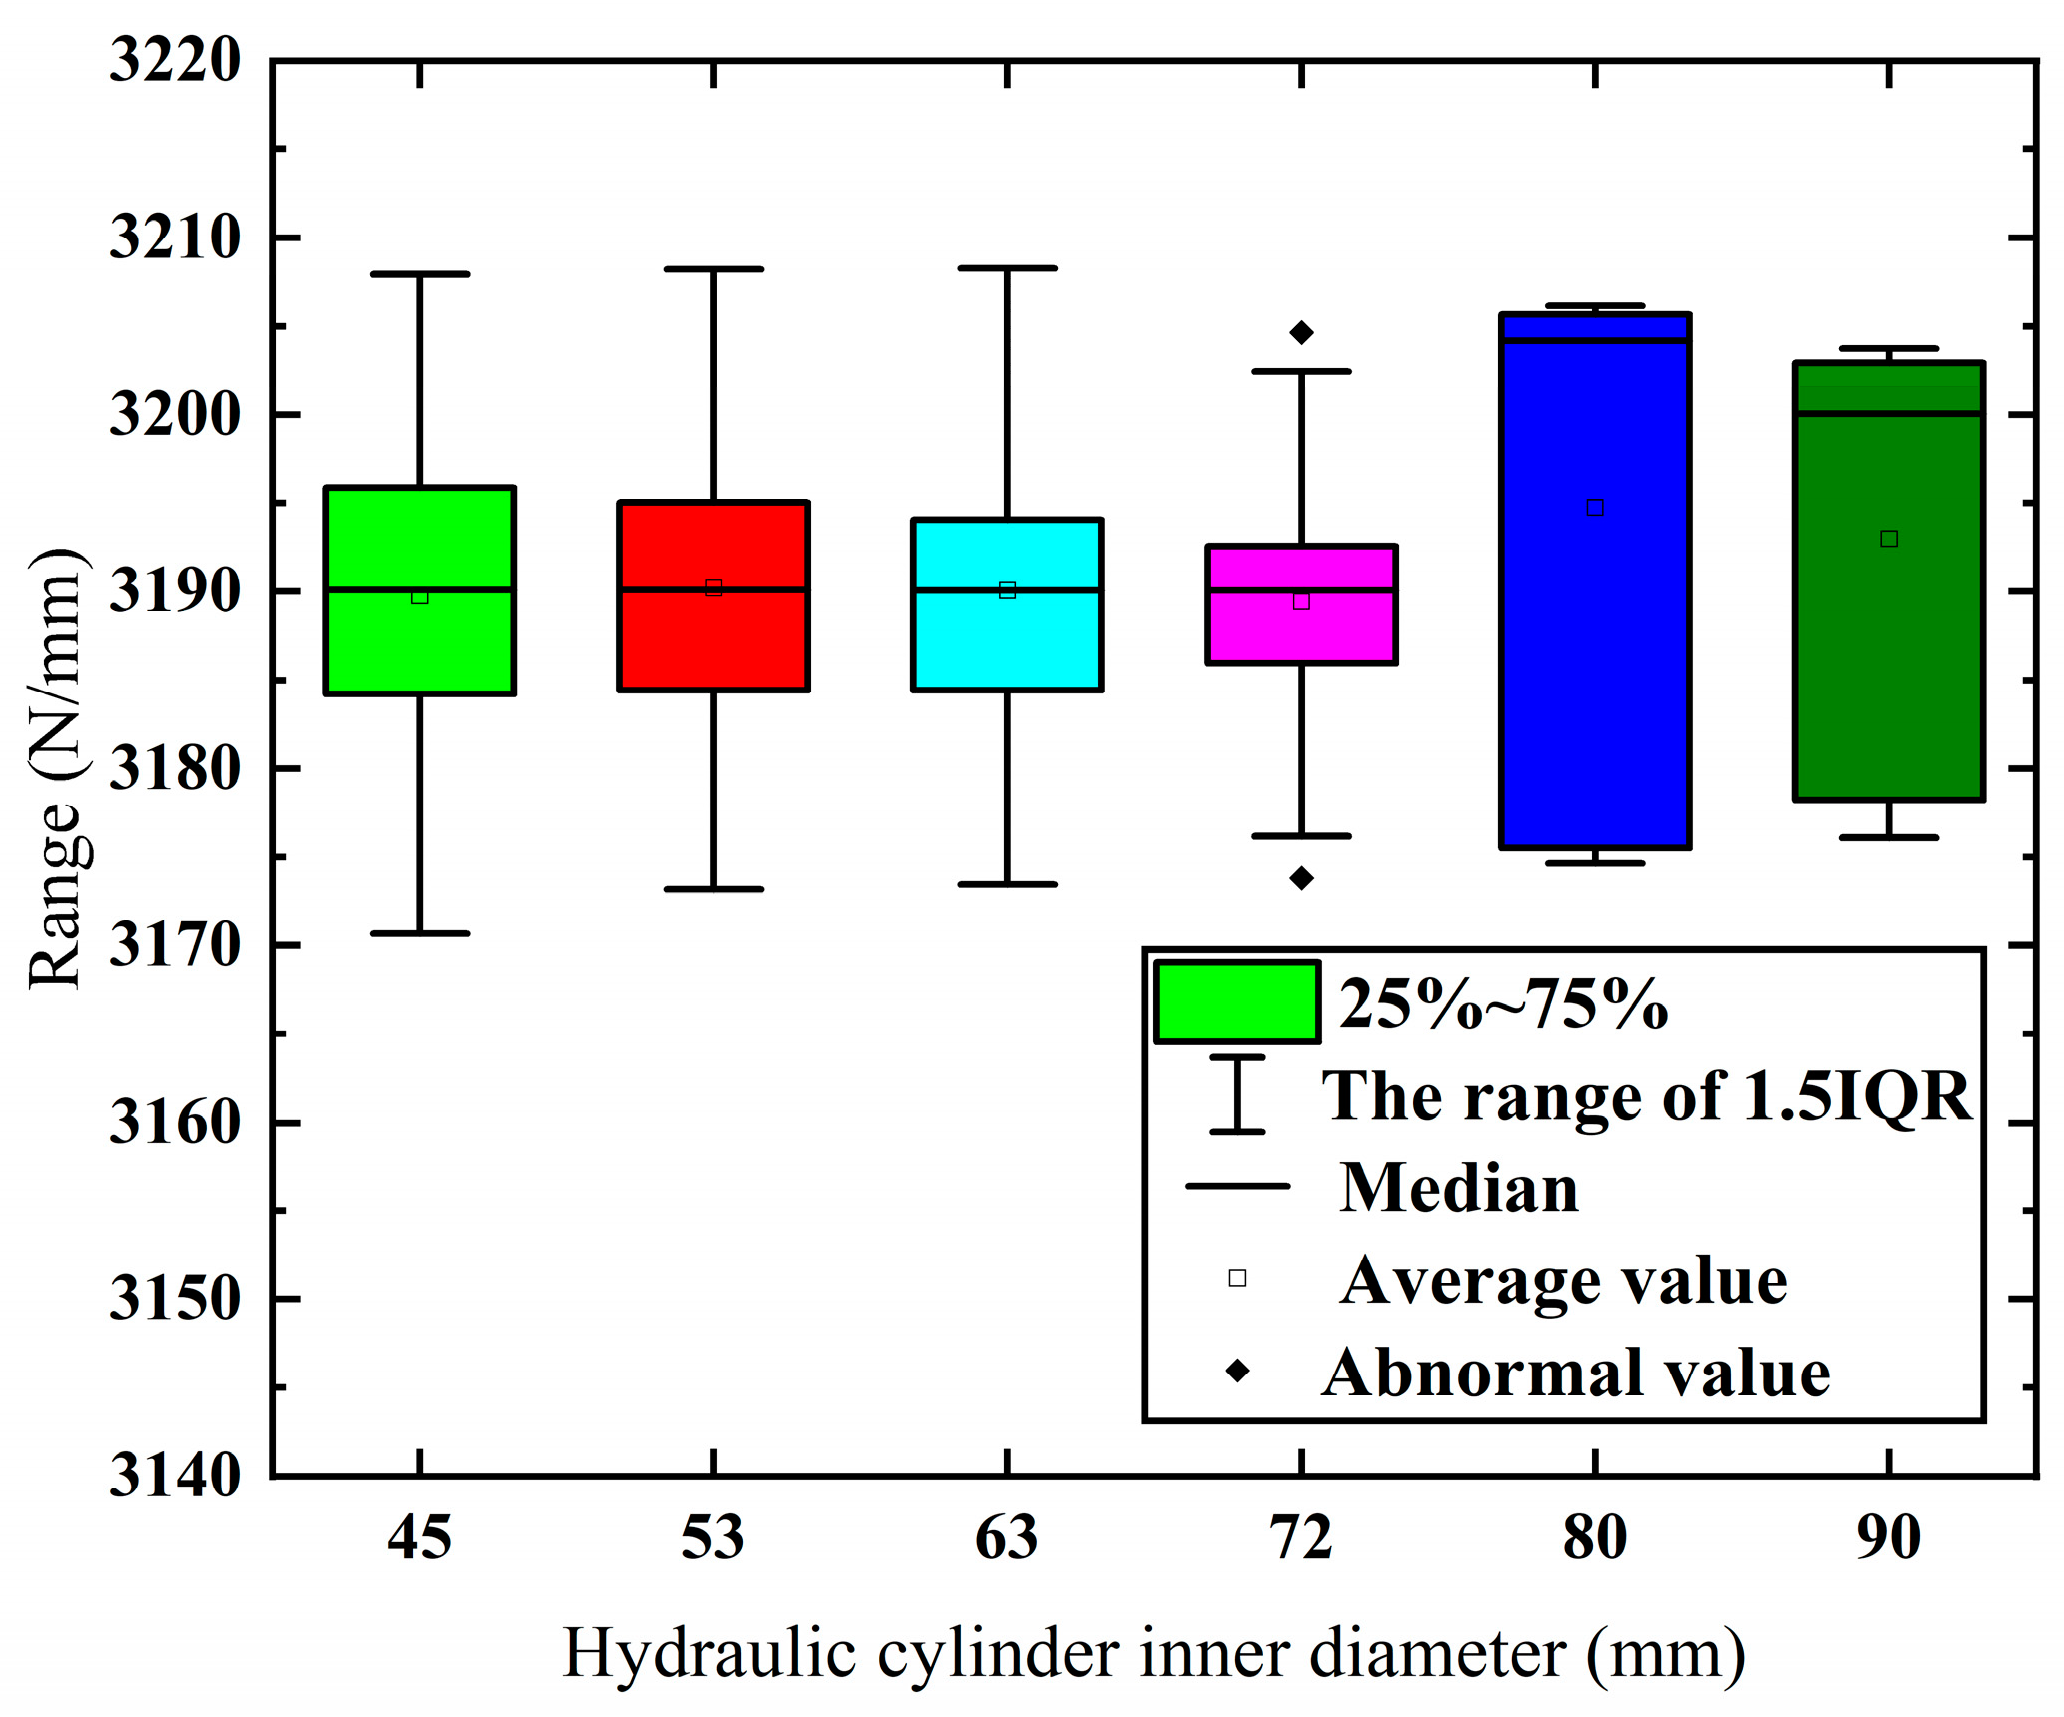
Agriculture 13 01071 g006
Figure 7. Boxplot of K-W test results: The six colored lines from left to right represent the six curves in Figure 6f, respectively.
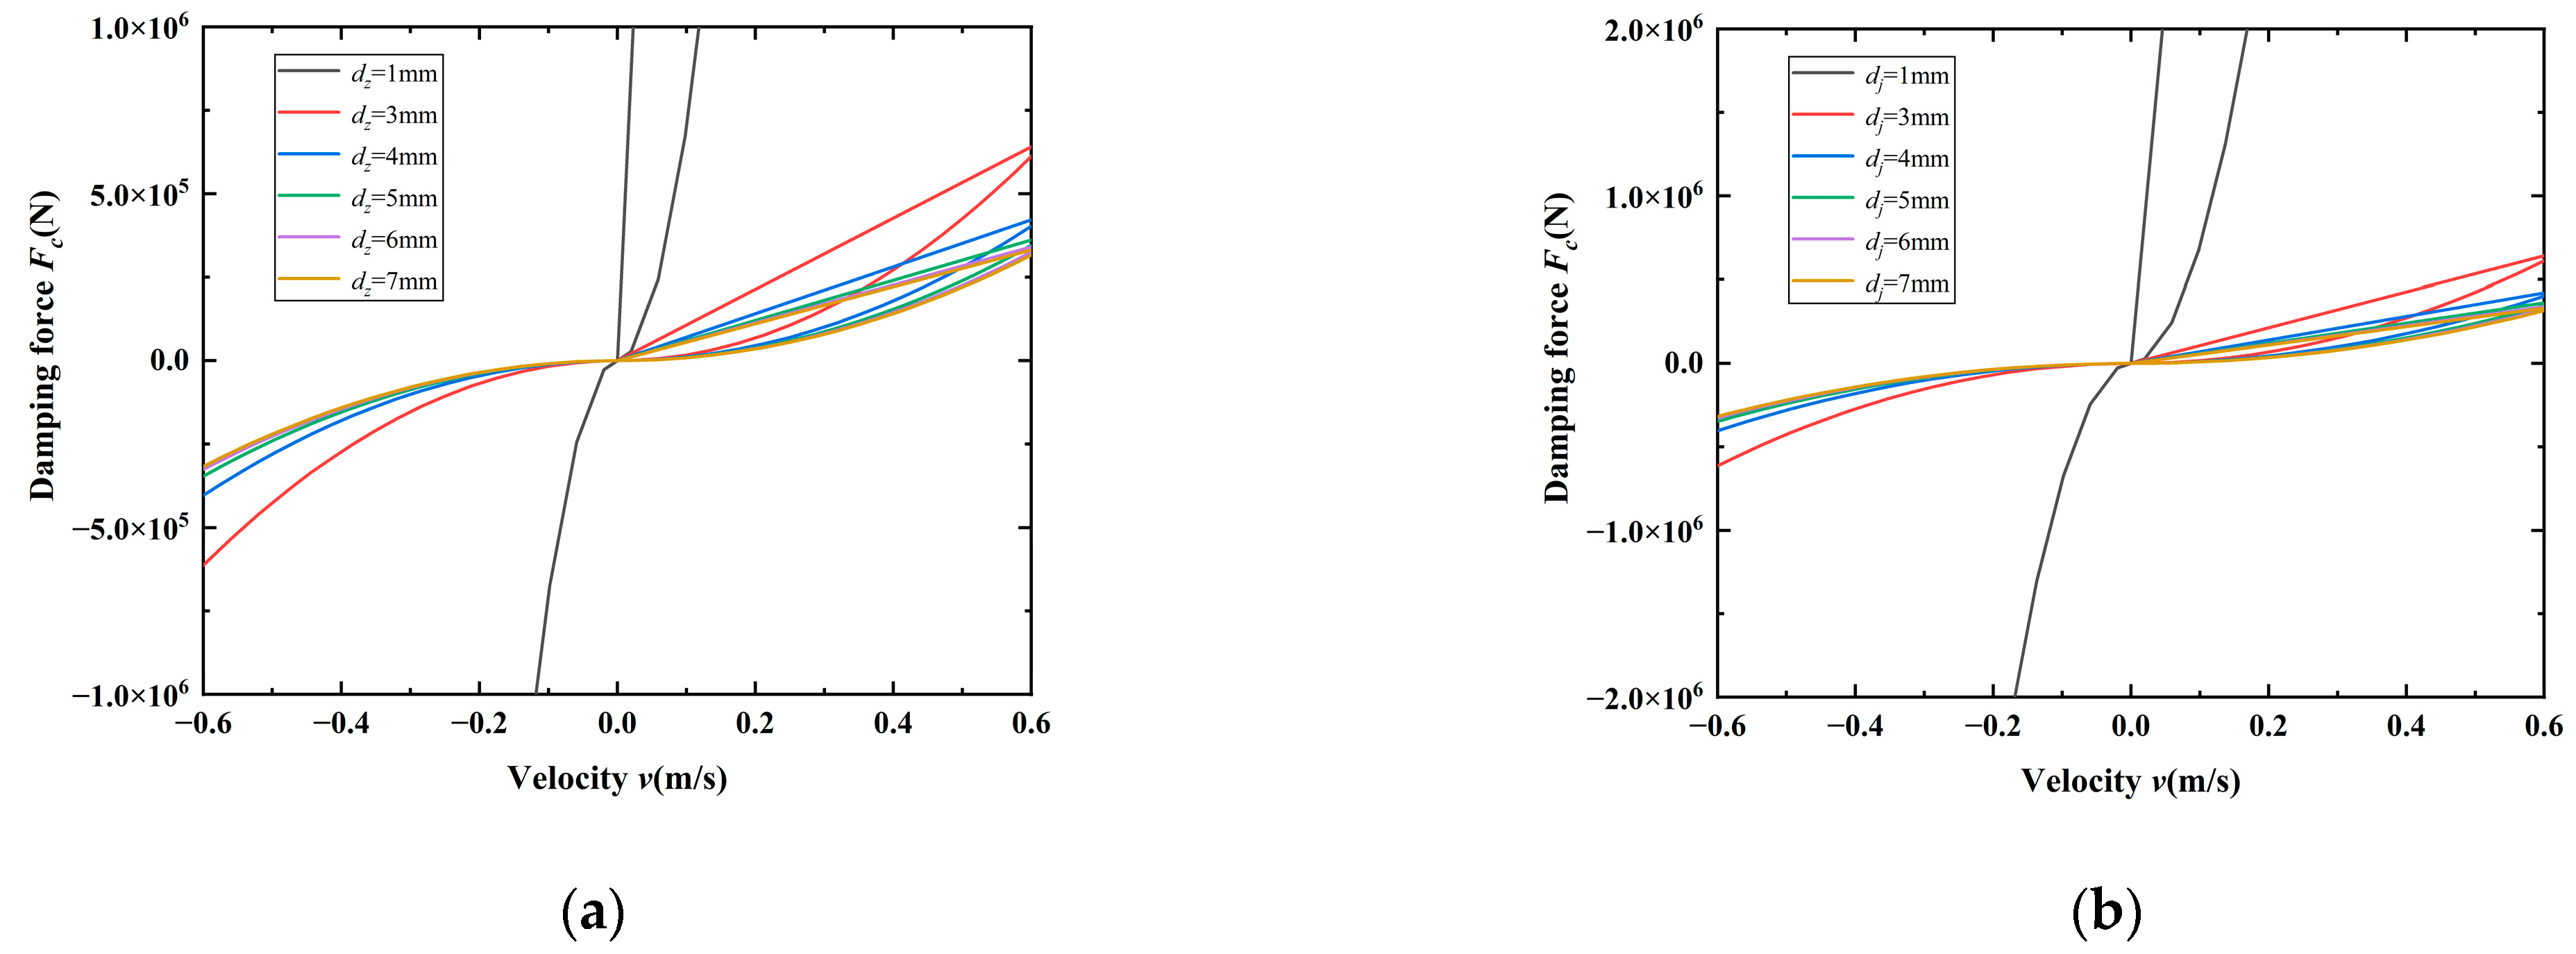
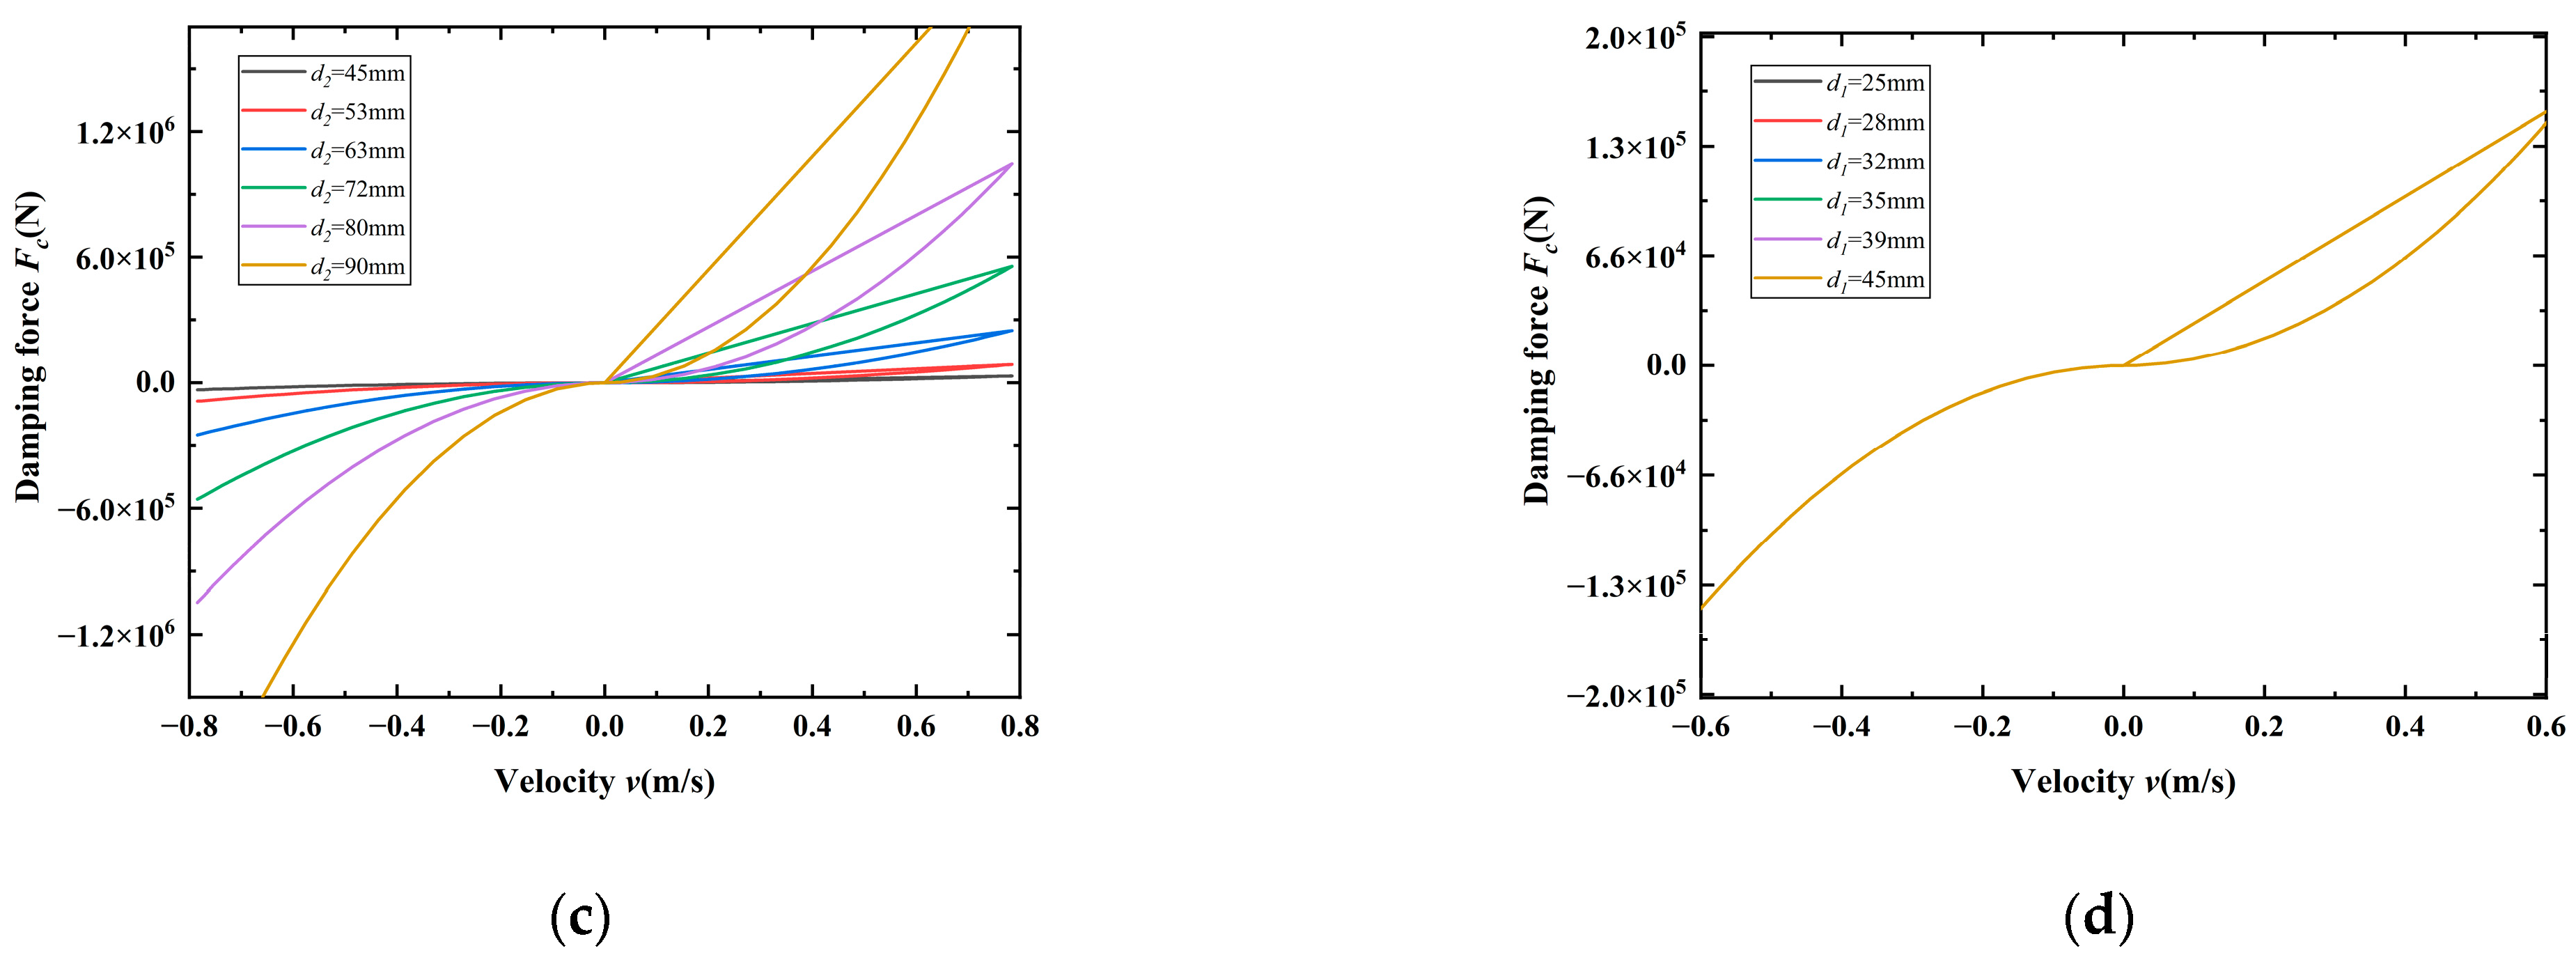
Agriculture 13 01071 g007
Figure 8. Relationship between damping force and parameters: (a) relationship with dz, (b) relationship with dj, (c) relationship with d2 and (d) relationship with d1.
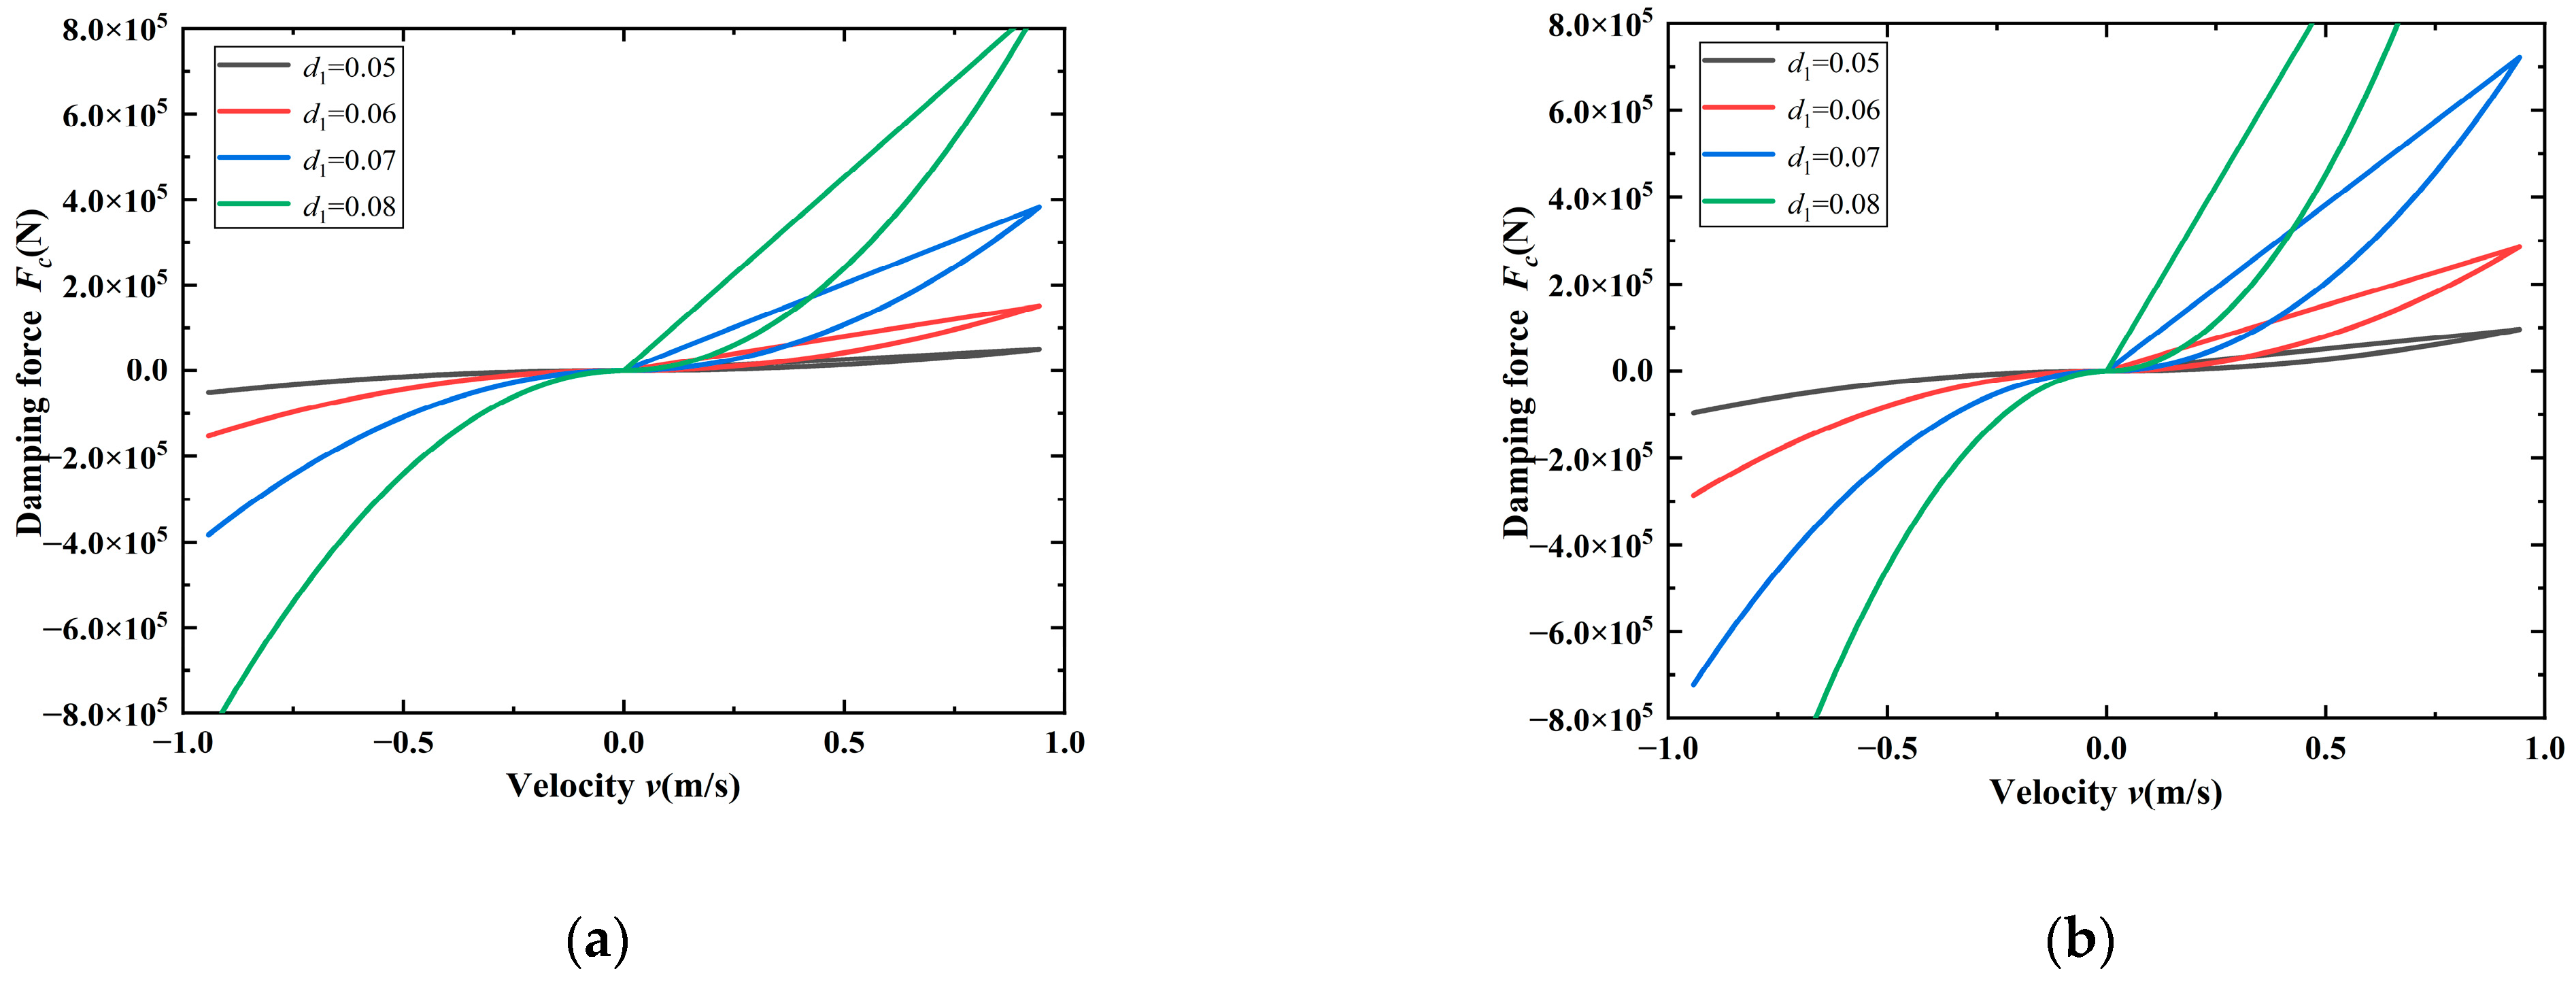
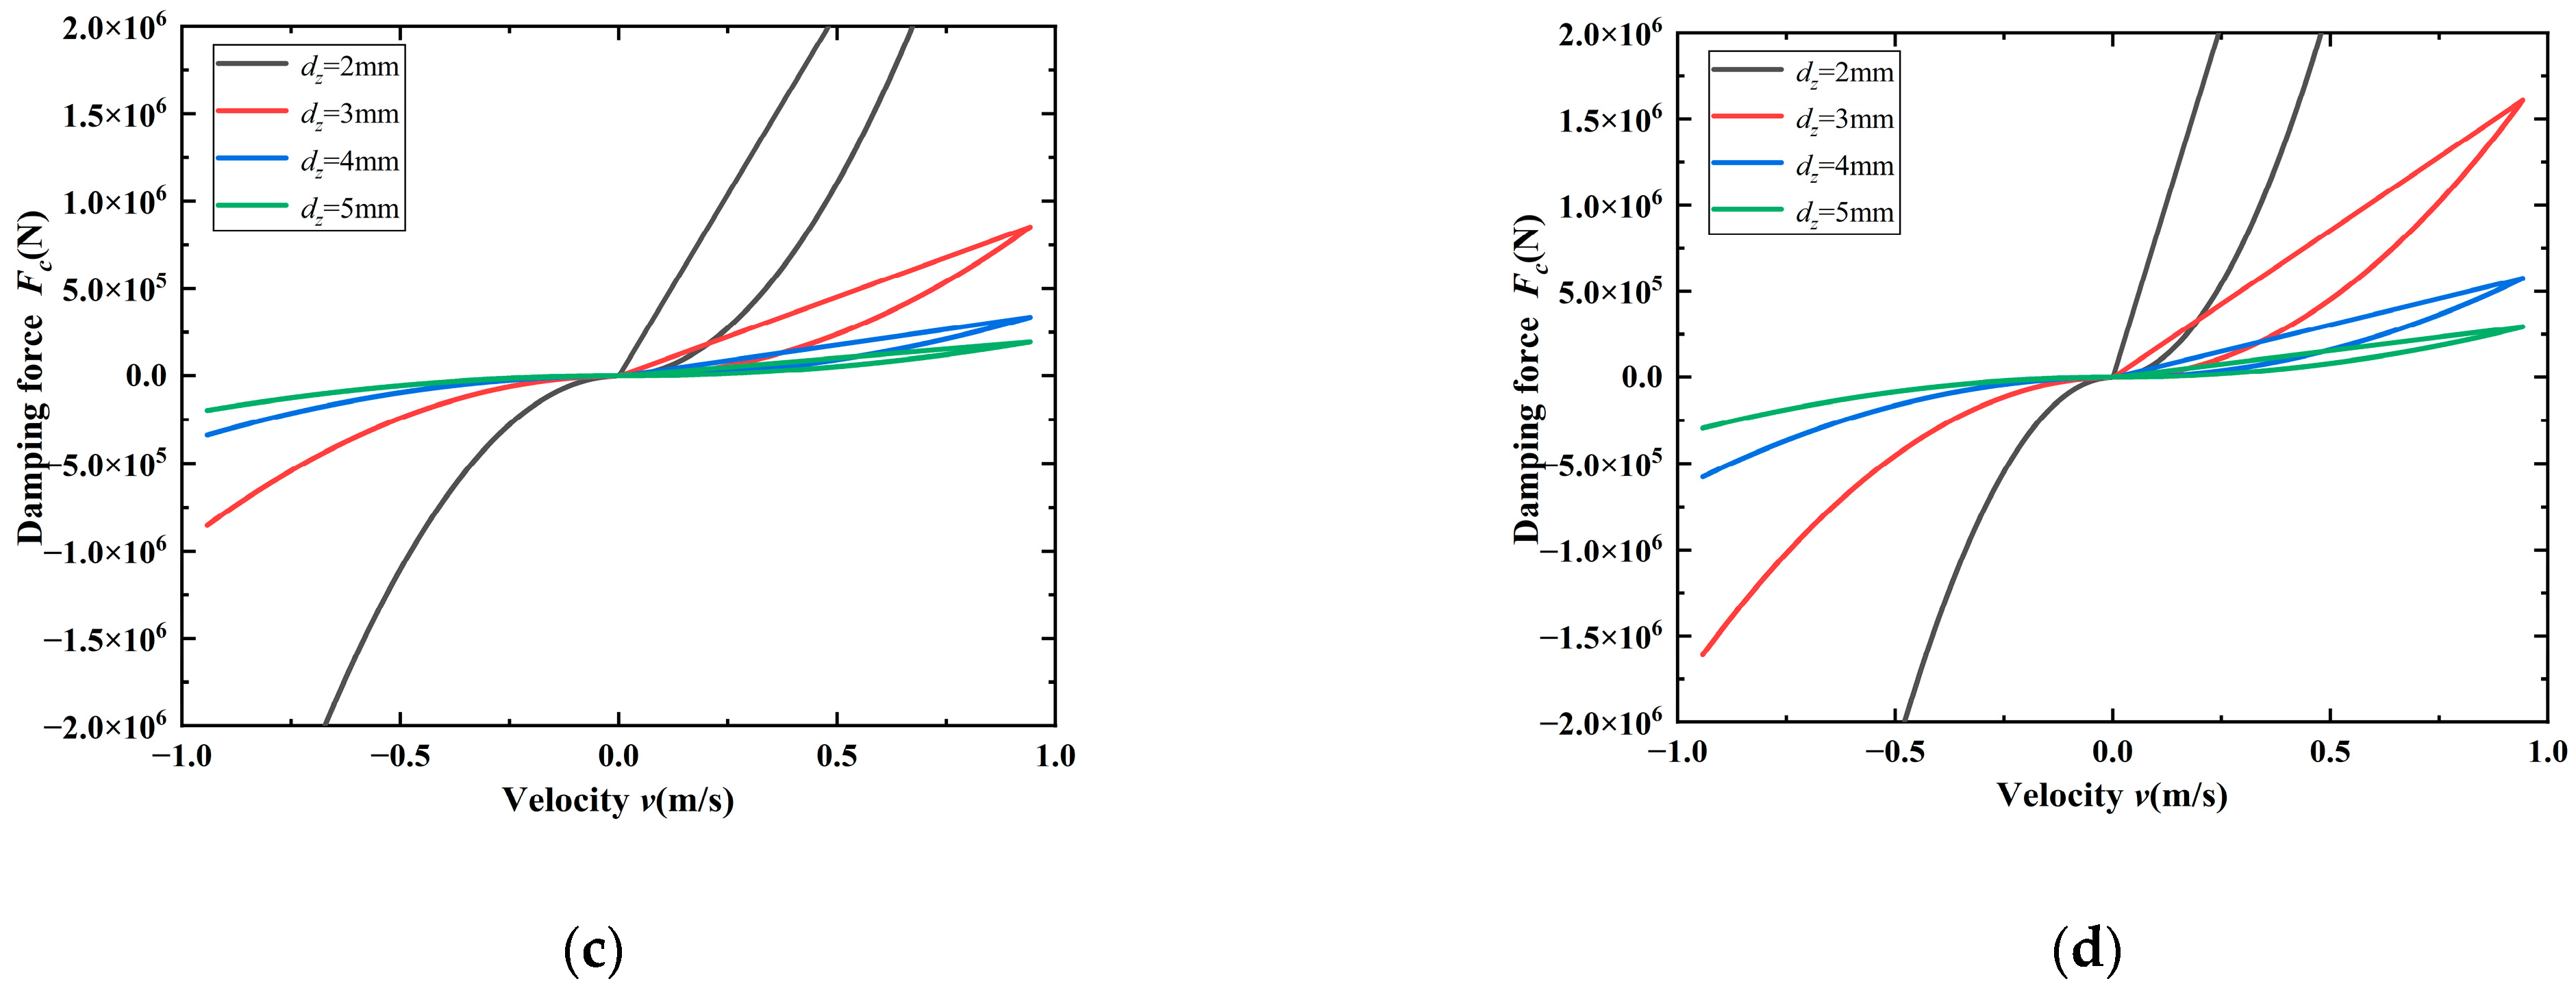
Agriculture 13 01071 g008aAgriculture 13 01071 g008b
Figure 9. Variation in damping force with parameters: (a,b) are the changing trends of the damping force of traditional hydro-pneumatic suspension and 3-damping hole hydro-pneumatic suspension with the cylinder diameter of the hydraulic cylinder; (c,d) are the changing trends of damping force of traditional hydro-pneumatic suspension and 3-damping hole hydro-pneumatic suspension with damping aperture.
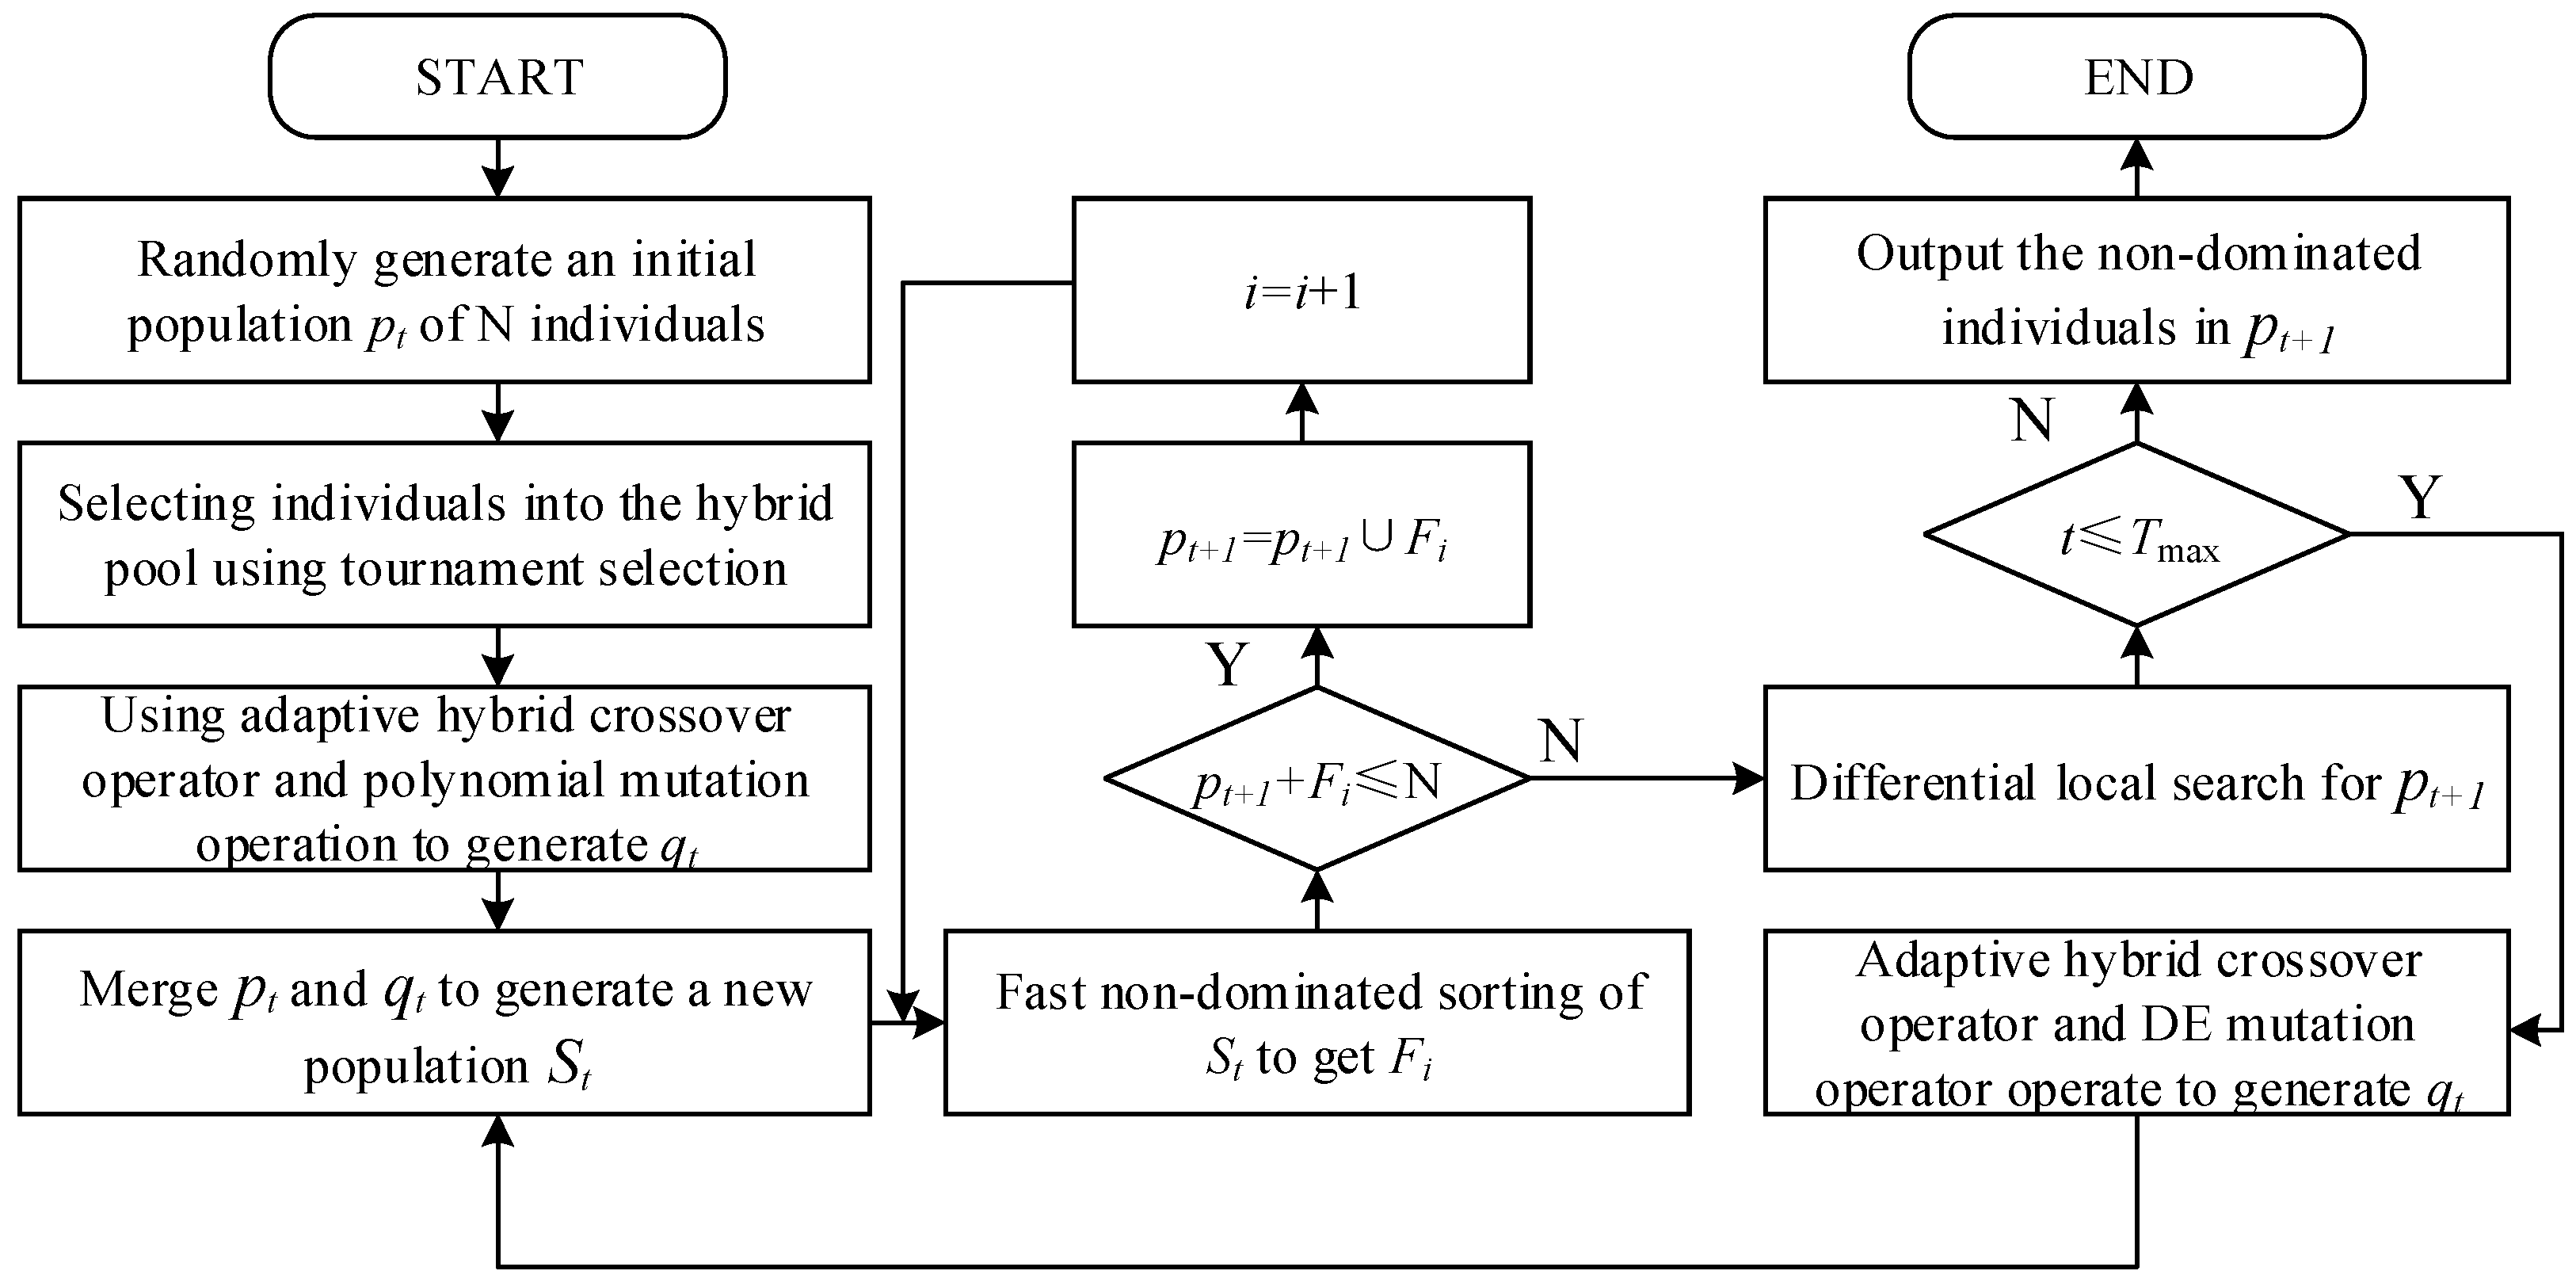
Agriculture 13 01071 g009aAgriculture 13 01071 g009b
Figure 10. Flow chart of improved algorithm.
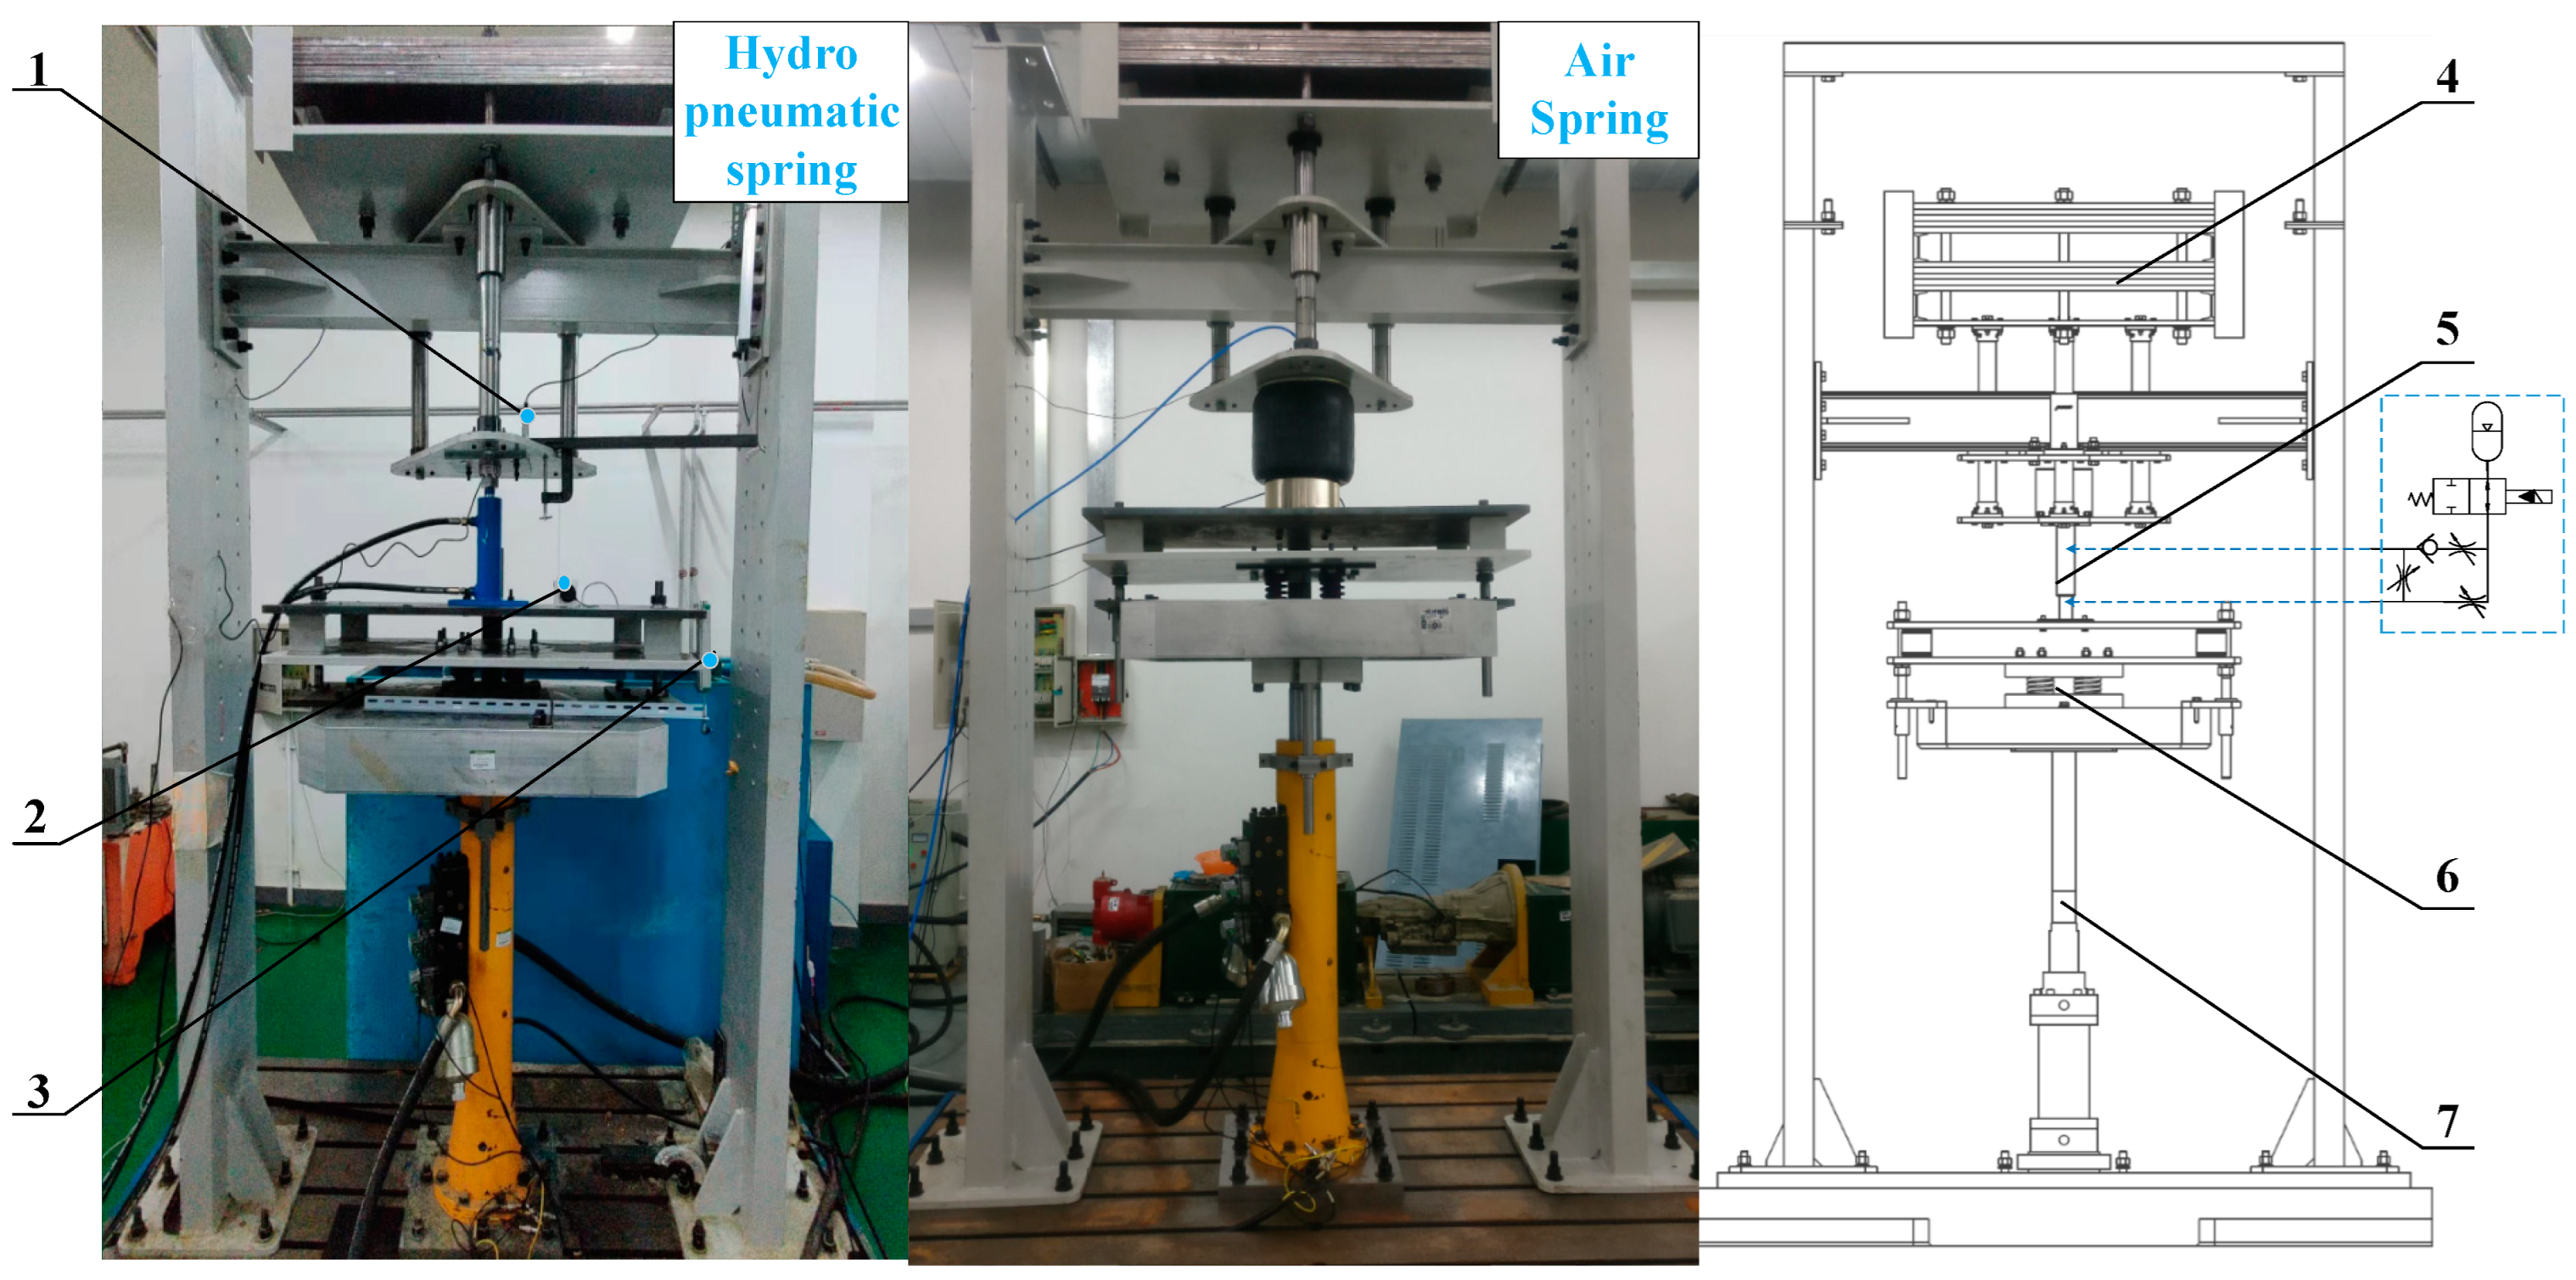
Agriculture 13 01071 g010
Figure 11. Vibration test bench based on air spring and hydro-pneumatic spring: (1) acceleration sensor, (2) displacement sensors, (3) displacement sensors, (4) steel plate, (5) hydraulic cylinder, (6) tire and (7) servo actuator.
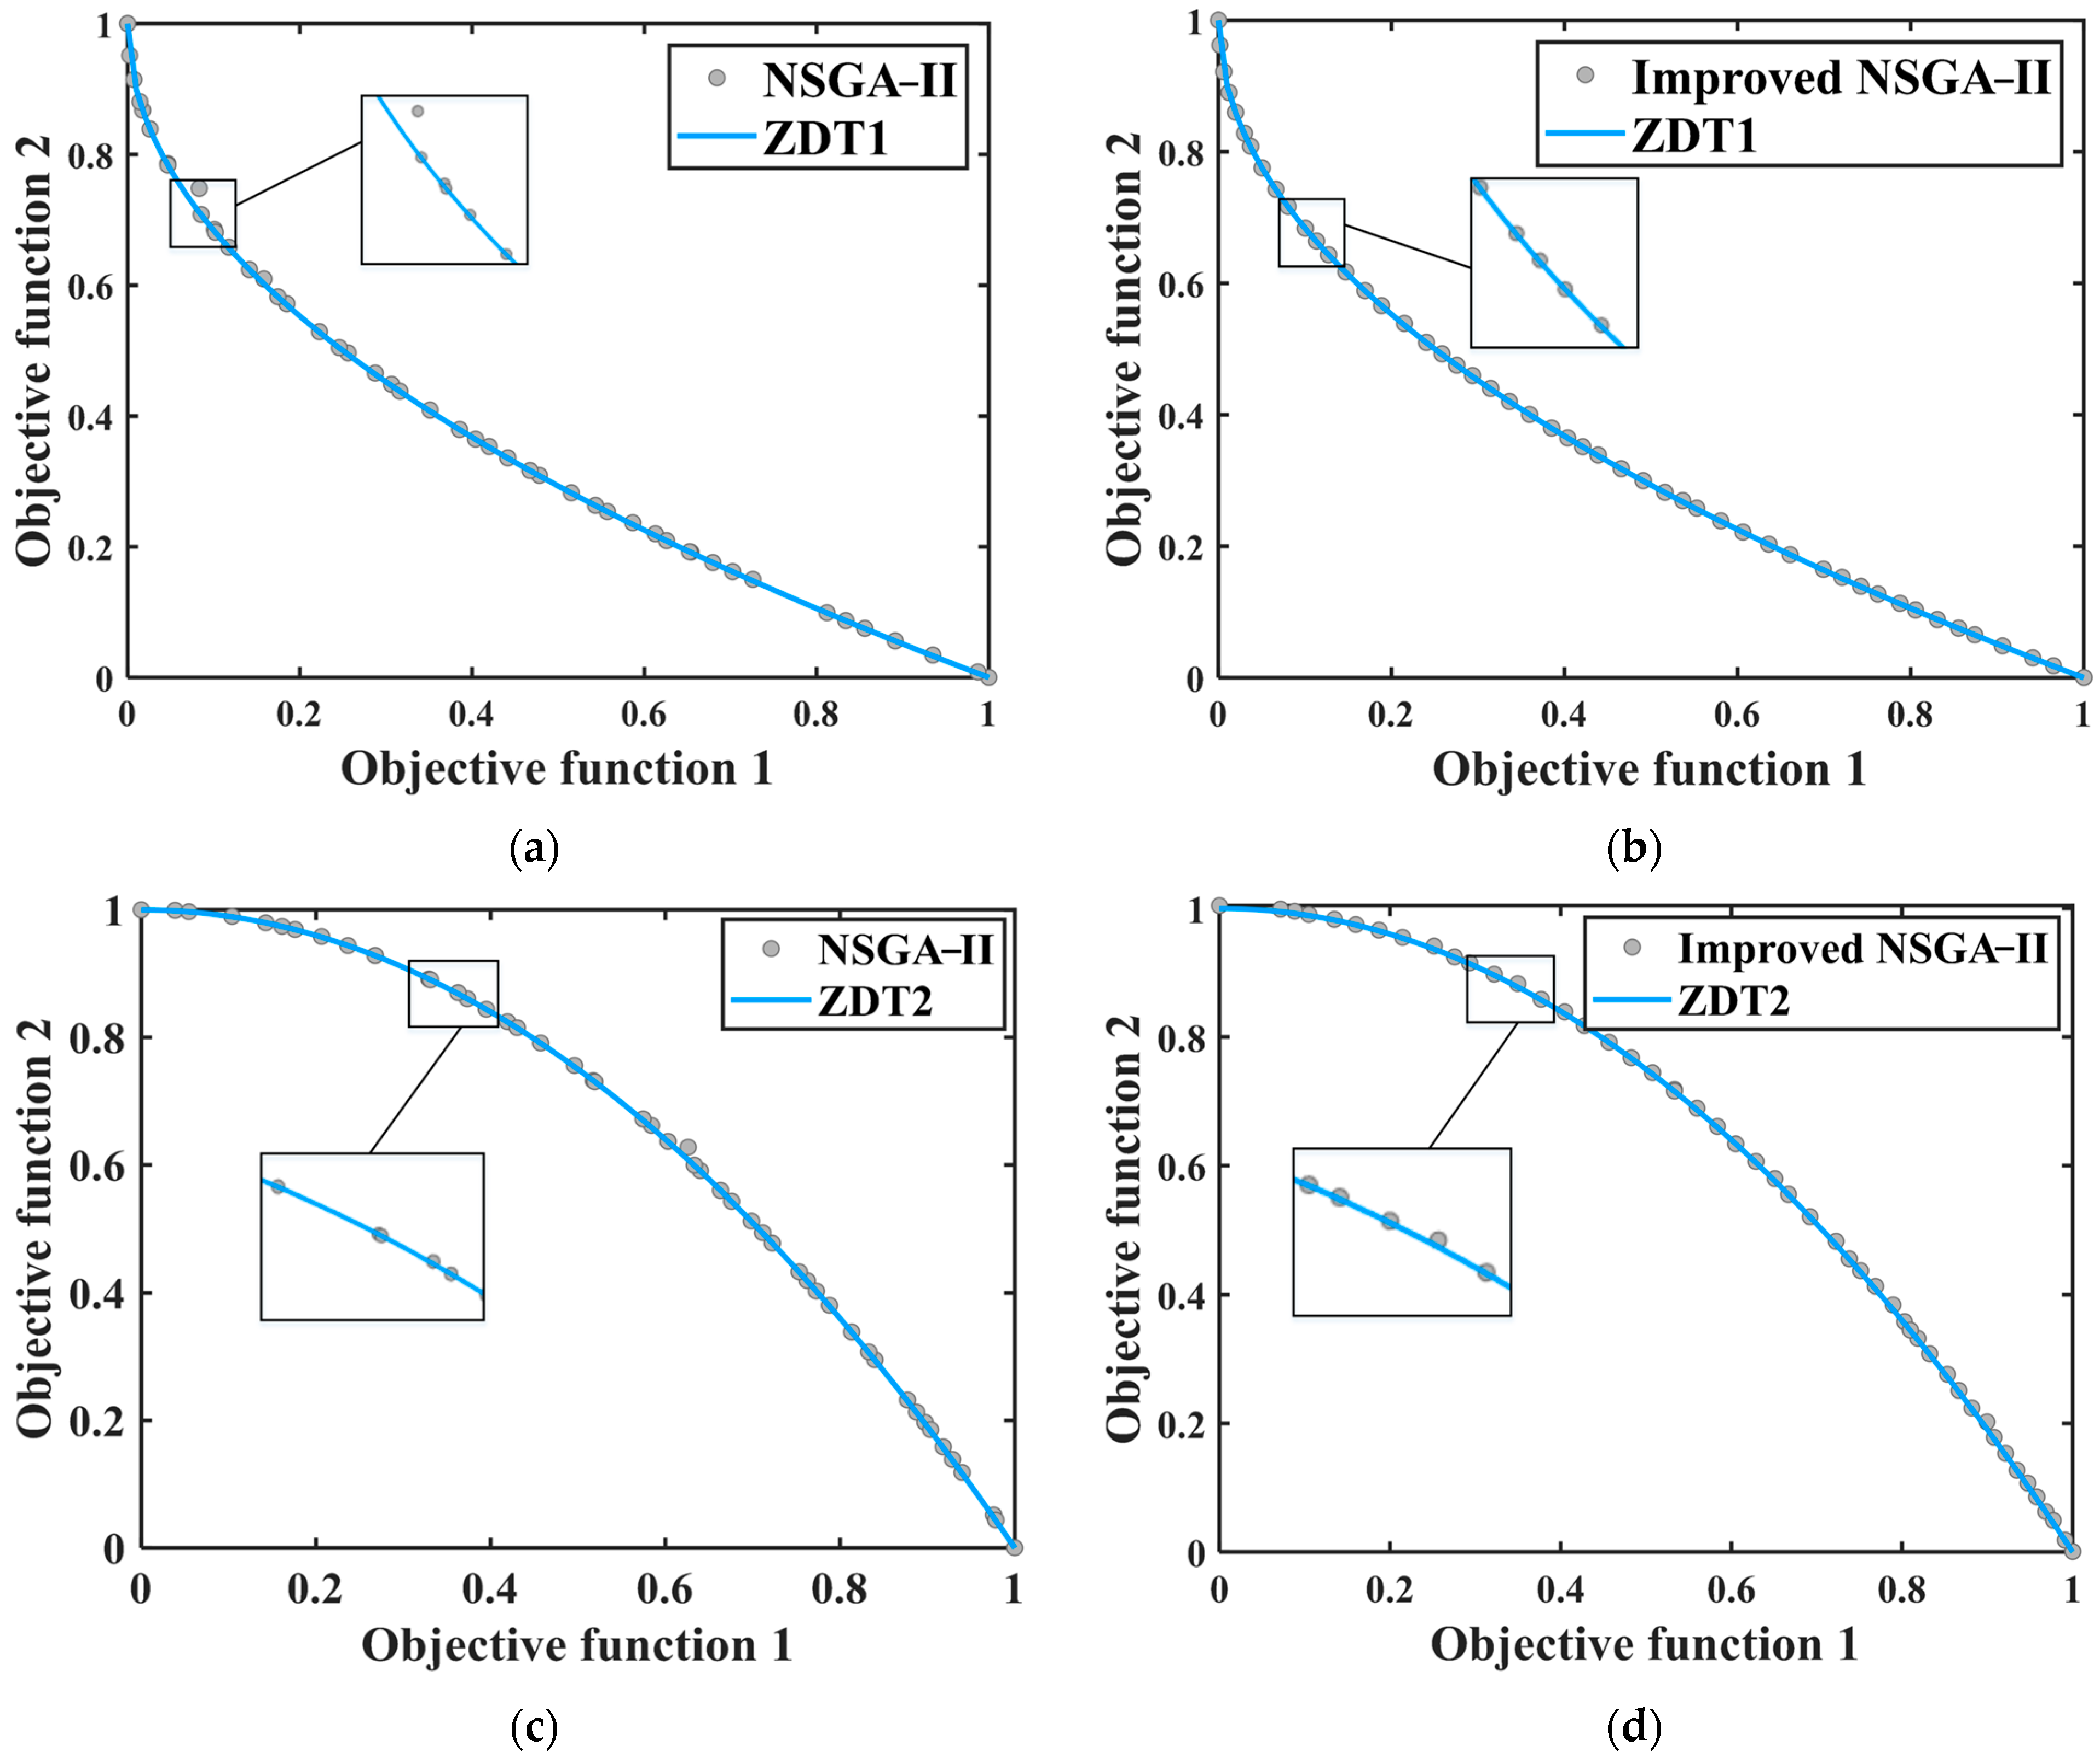
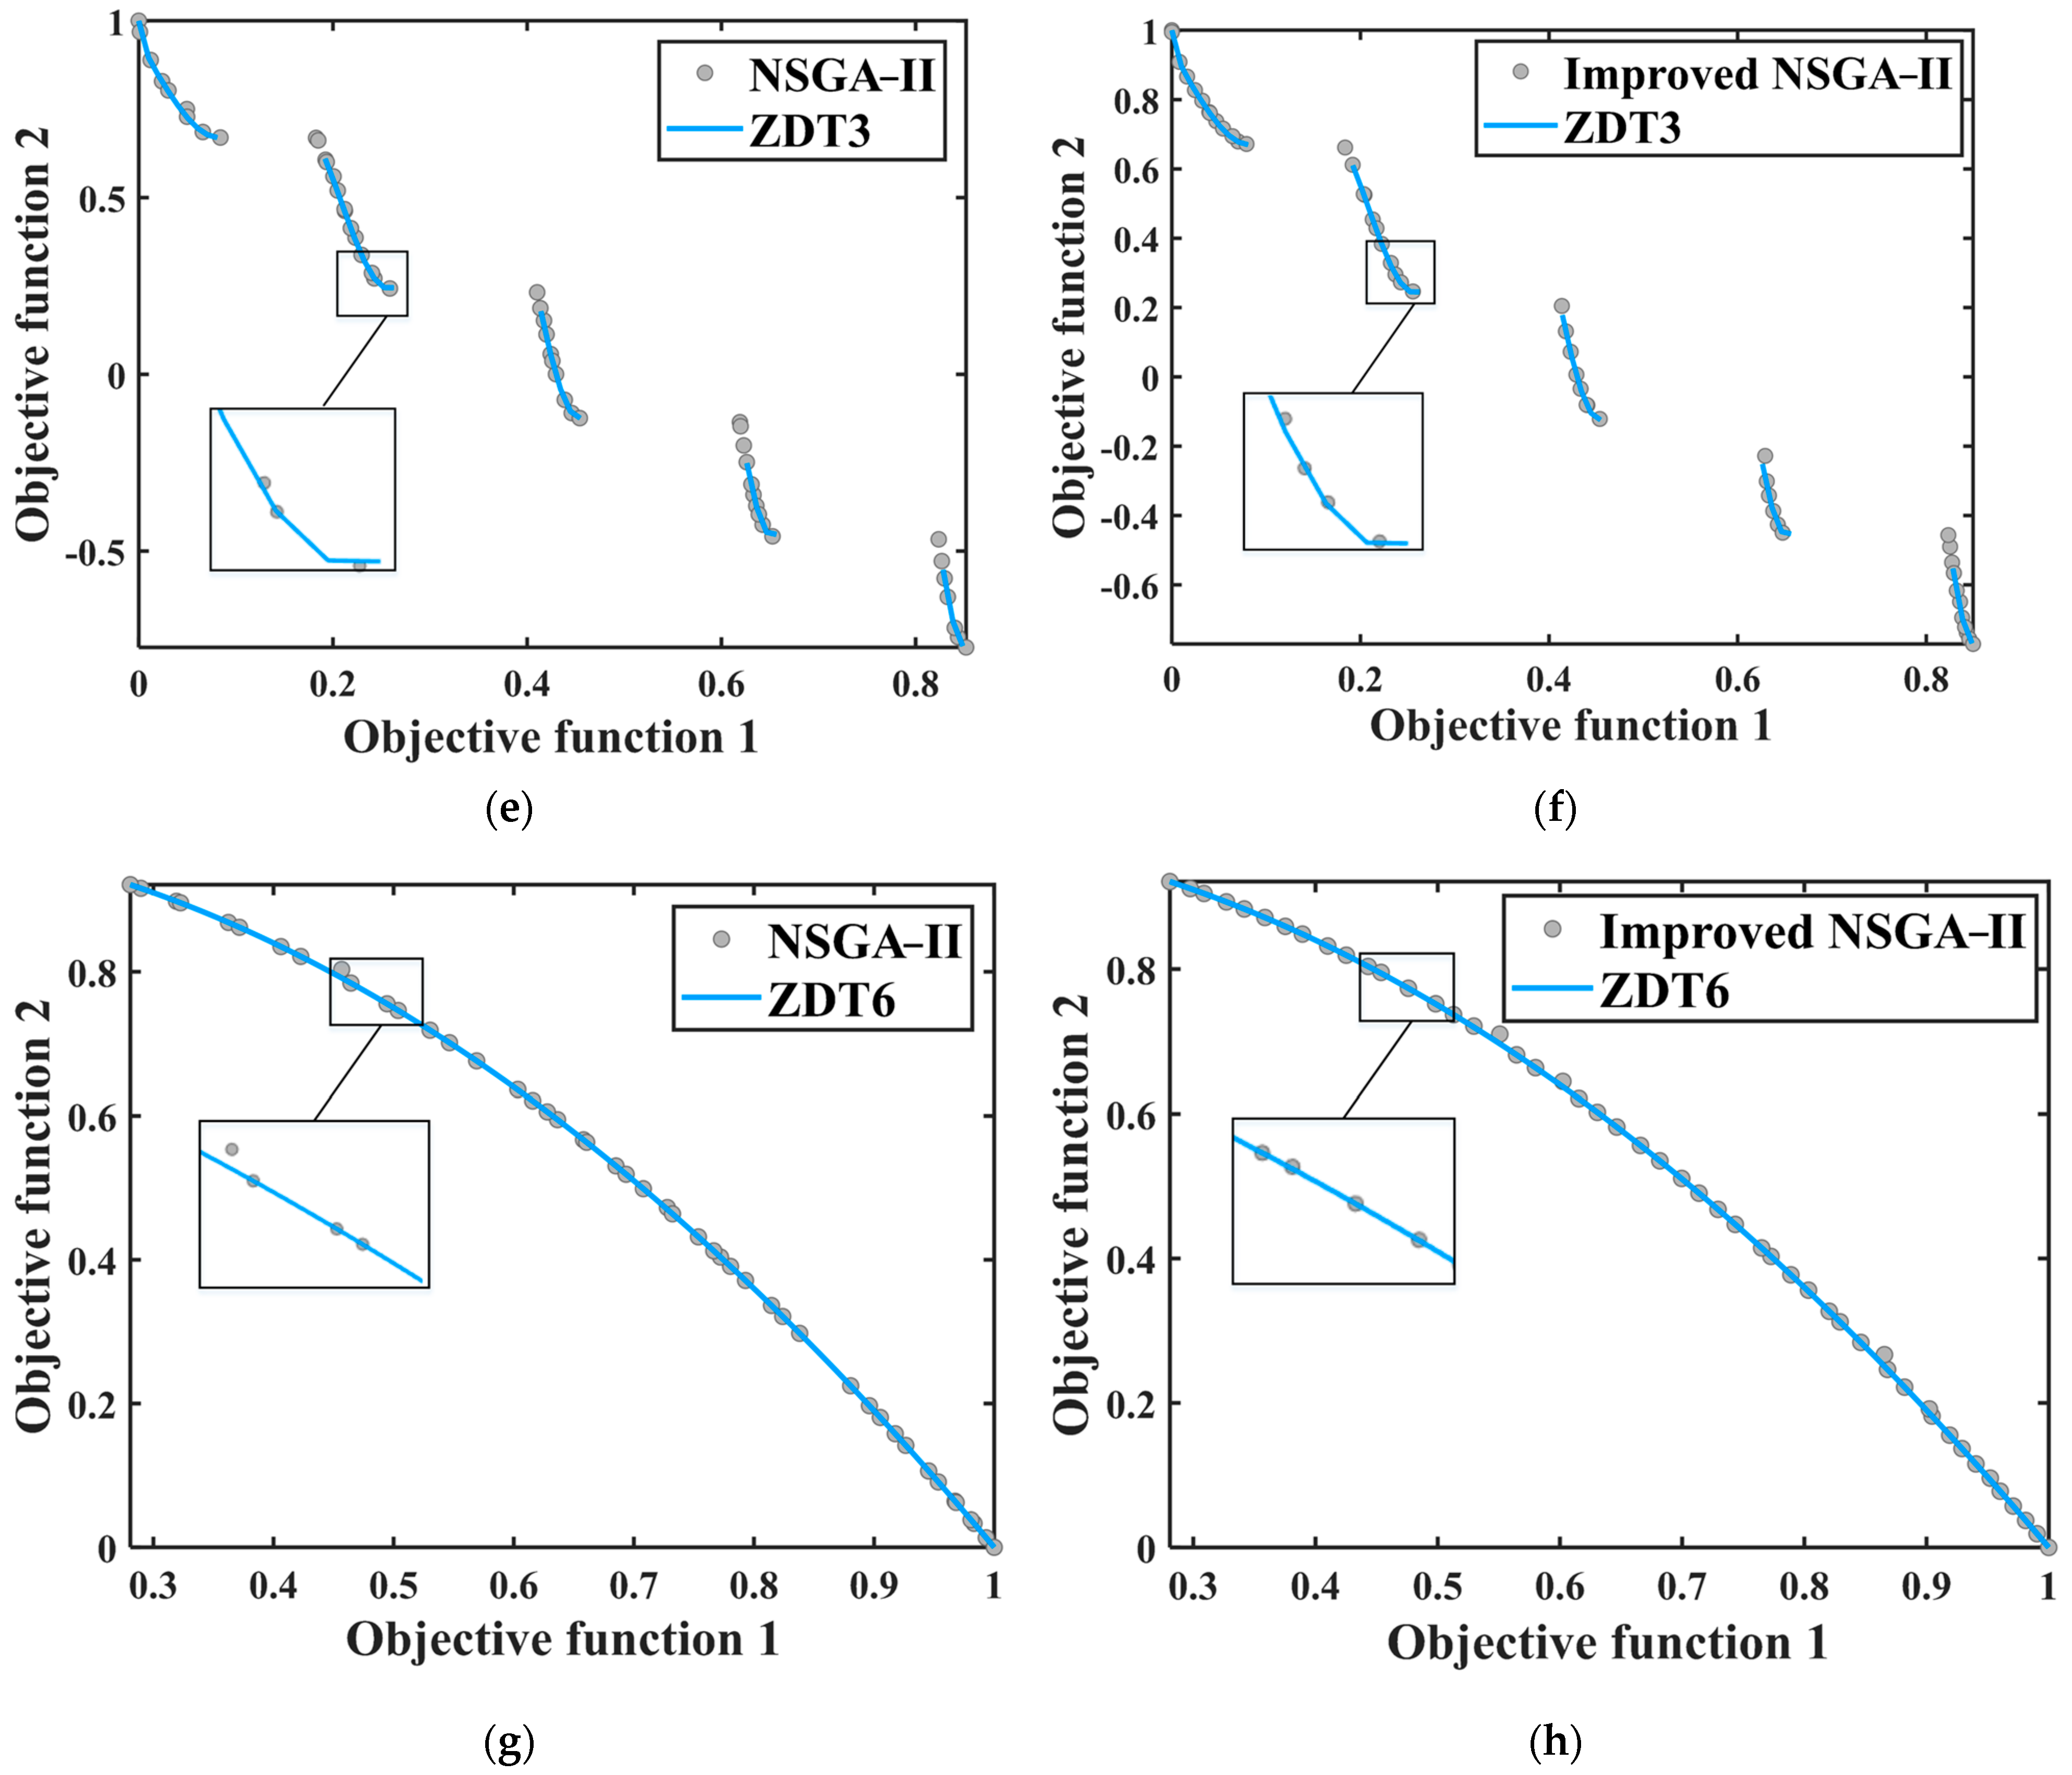
Agriculture 13 01071 g011
Figure 12. Comparison of Pareto fronts of NSGA-II and improved NSGA-II under different test functions: (a,b) are the simulation lines of the ZDT1 function before and after algorithm improvement, (c,d) are the simulation lines of the ZDT2 function before and after algorithm improvement, (e,f) are the simulation lines of the ZDT3 function before and after algorithm improvement, (g,h) are the simulation lines of the ZDT3 function before and after algorithm improvement.
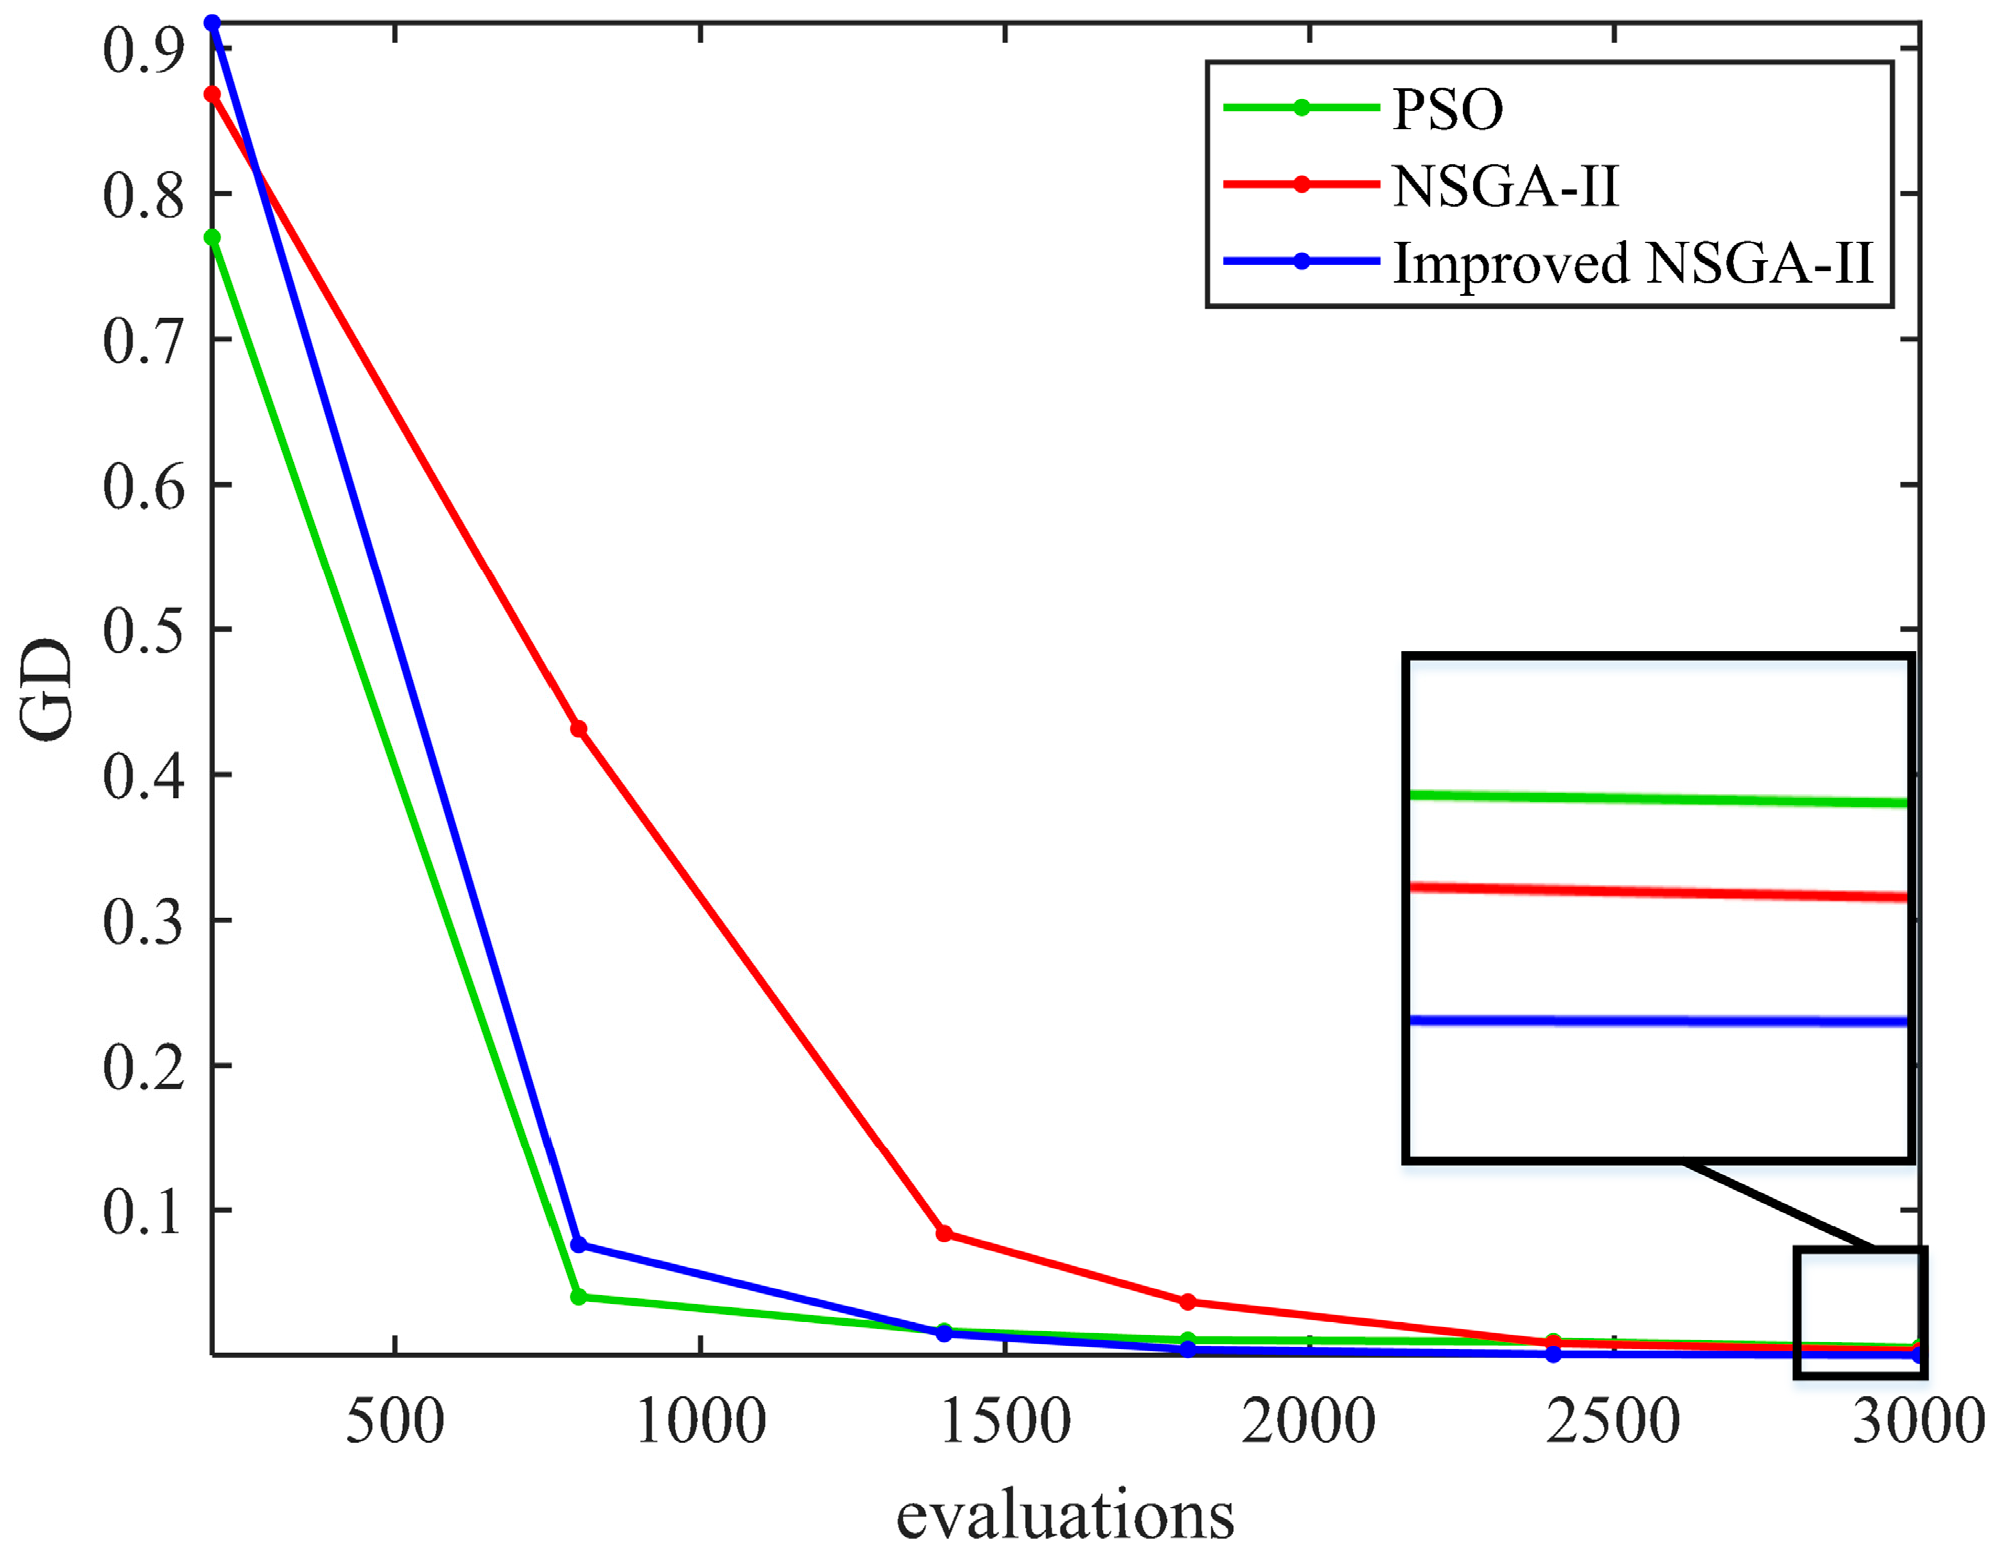
Agriculture 13 01071 g012aAgriculture 13 01071 g012b
Figure 13. Comparison of GD values of three algorithms.
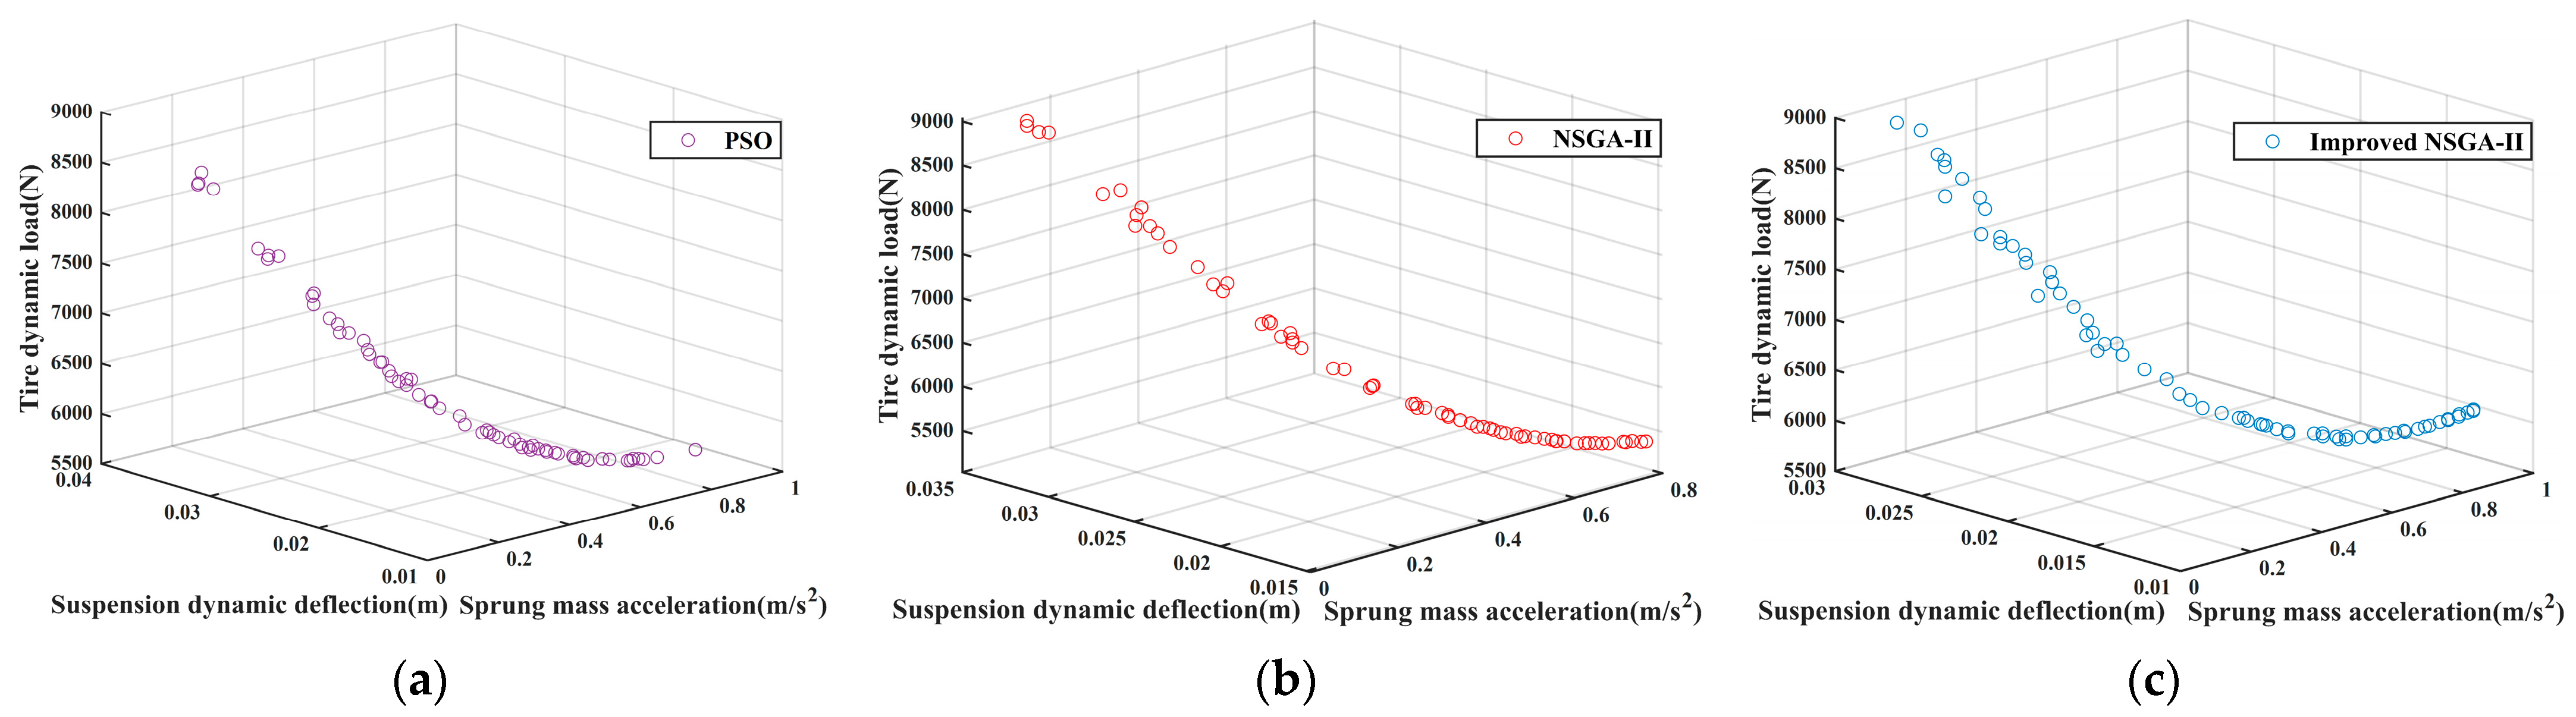
Agriculture 13 01071 g013
Figure 14. Comparison of Pareto fronts of PSO, NSGA-II and improved NSGA-II: (a) is the Pareto fronts of the PSO algorithm, (b) is the Pareto fronts of the NSGA-II algorithm, (c) is the Pareto fronts of the improved NSGA-II algorithm.
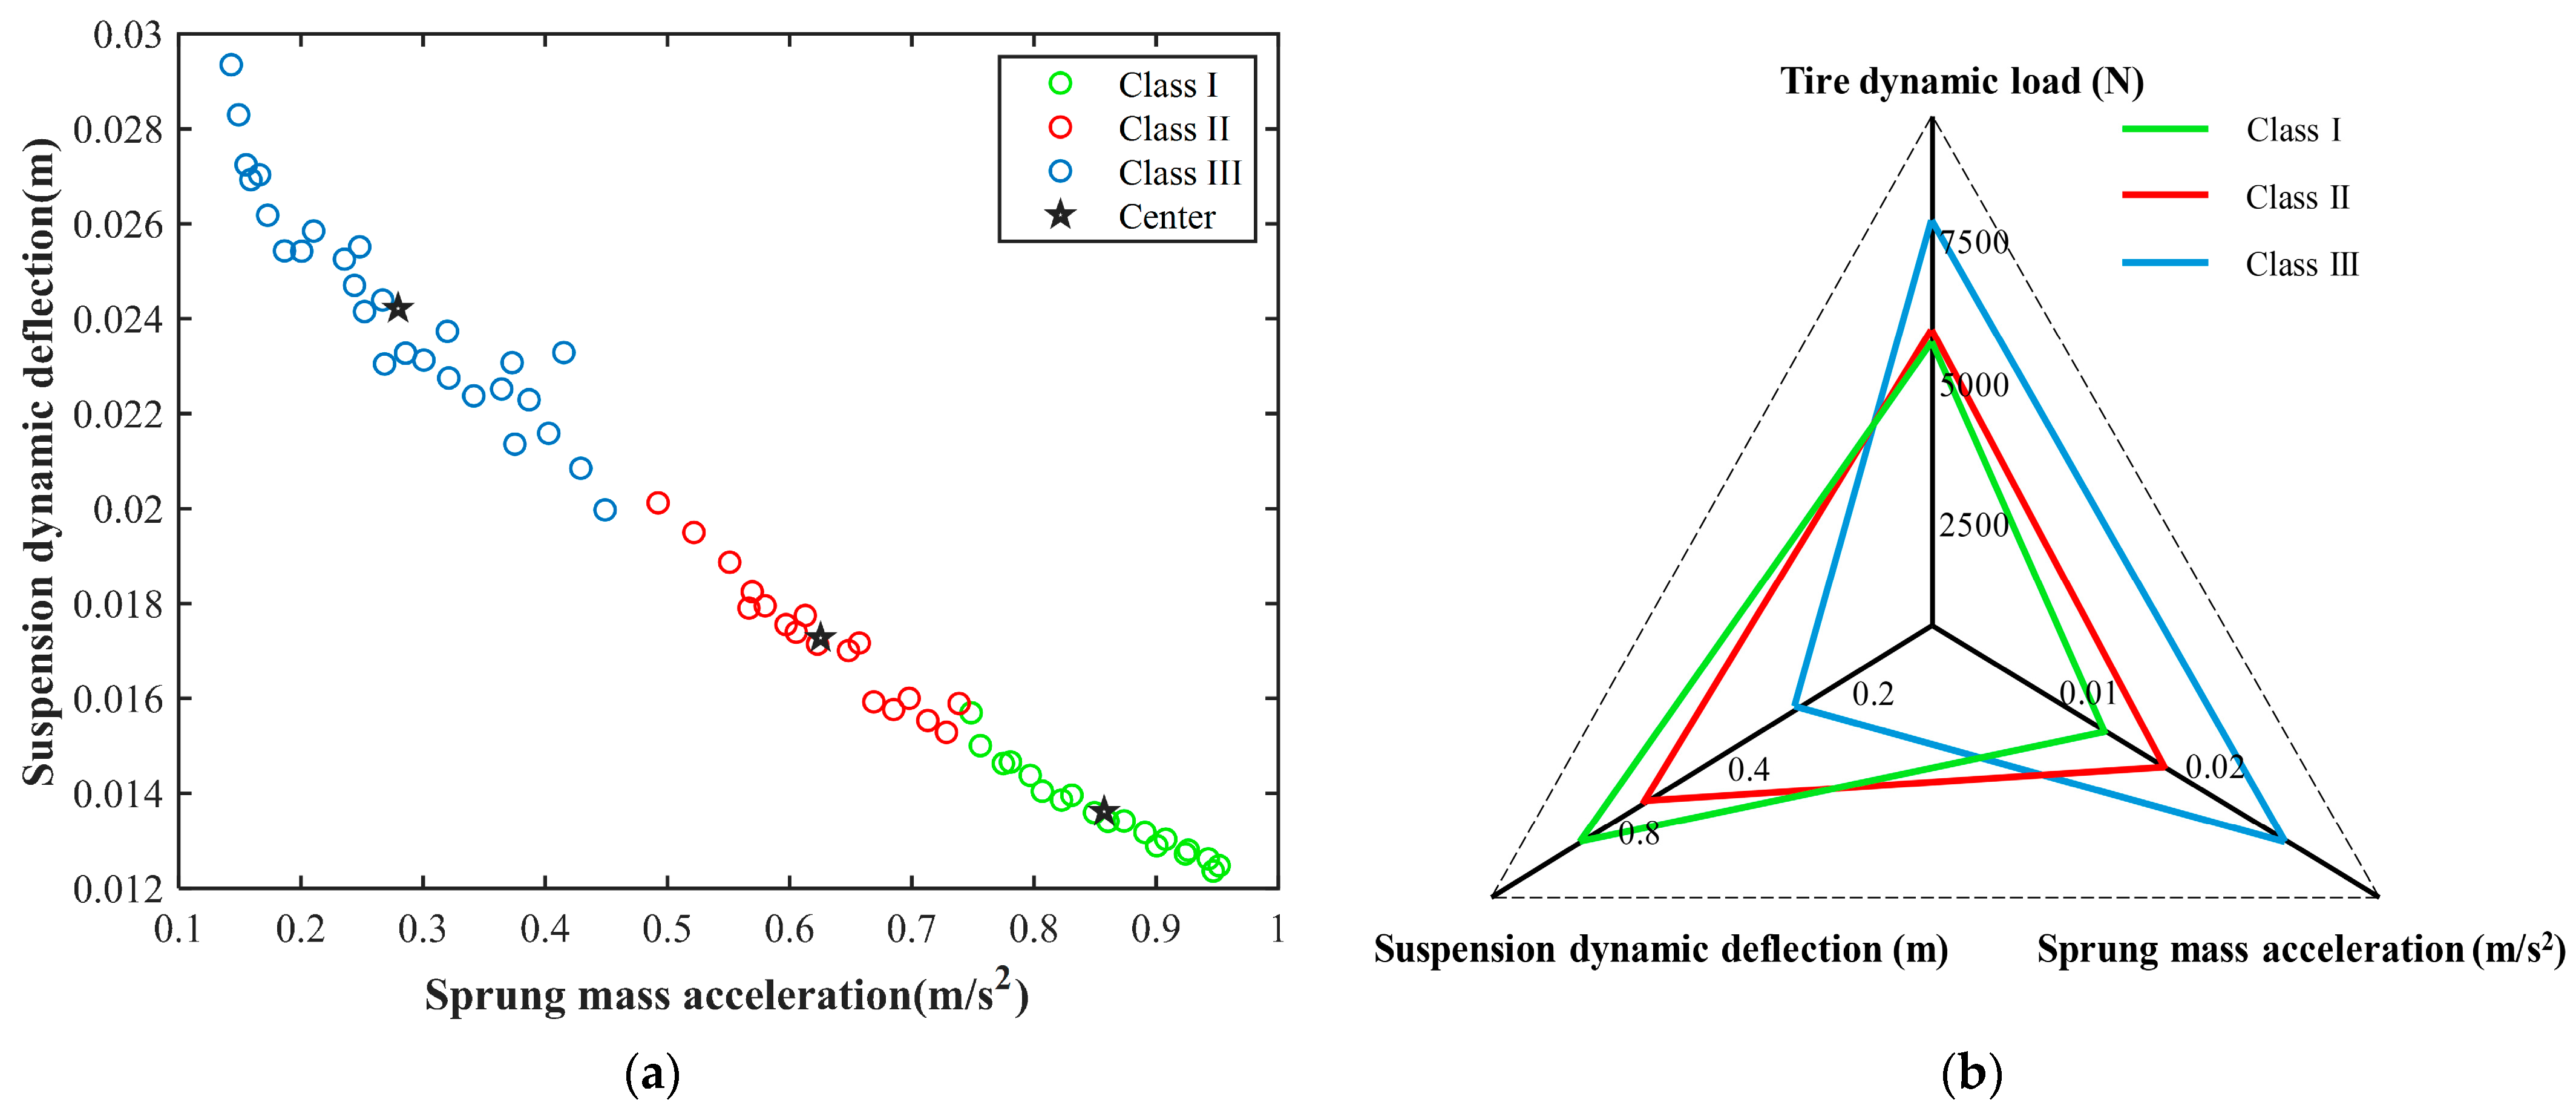
Agriculture 13 01071 g014
Figure 15. K-means algorithm analysis results: (a) is the result graph of the K-means algorithm, (b) is the intuitive curve of the cluster center.
Agriculture 13 01071 g015
Figure 16. Comparison of simulation results before and after parameter optimization.
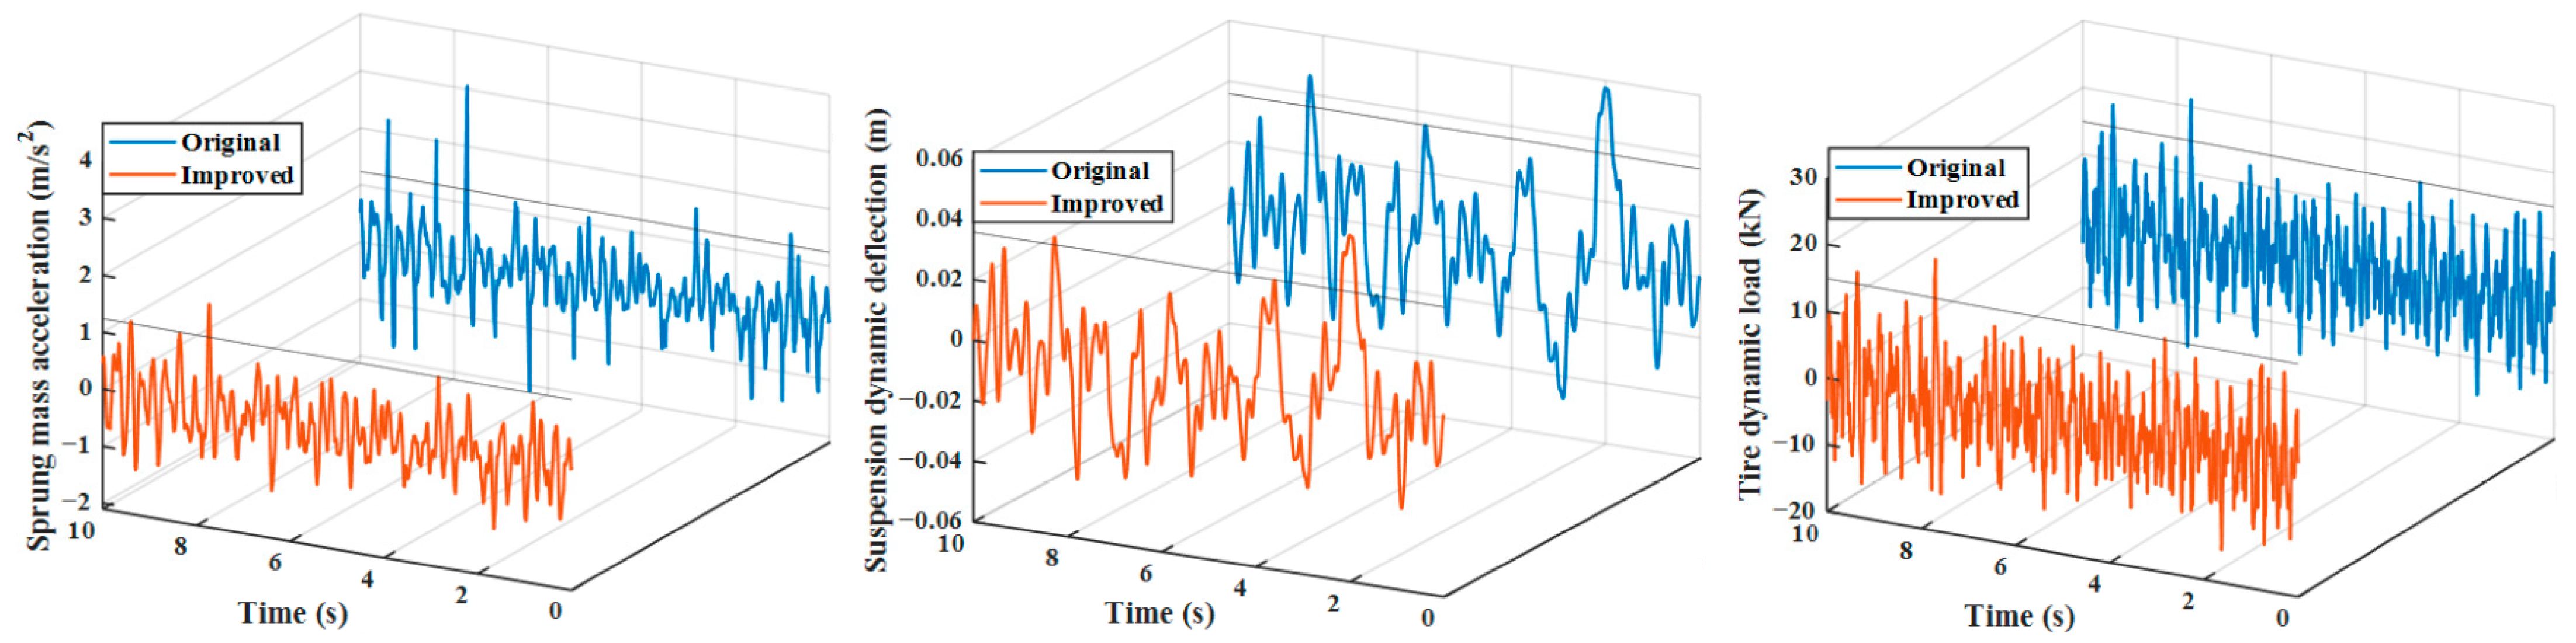
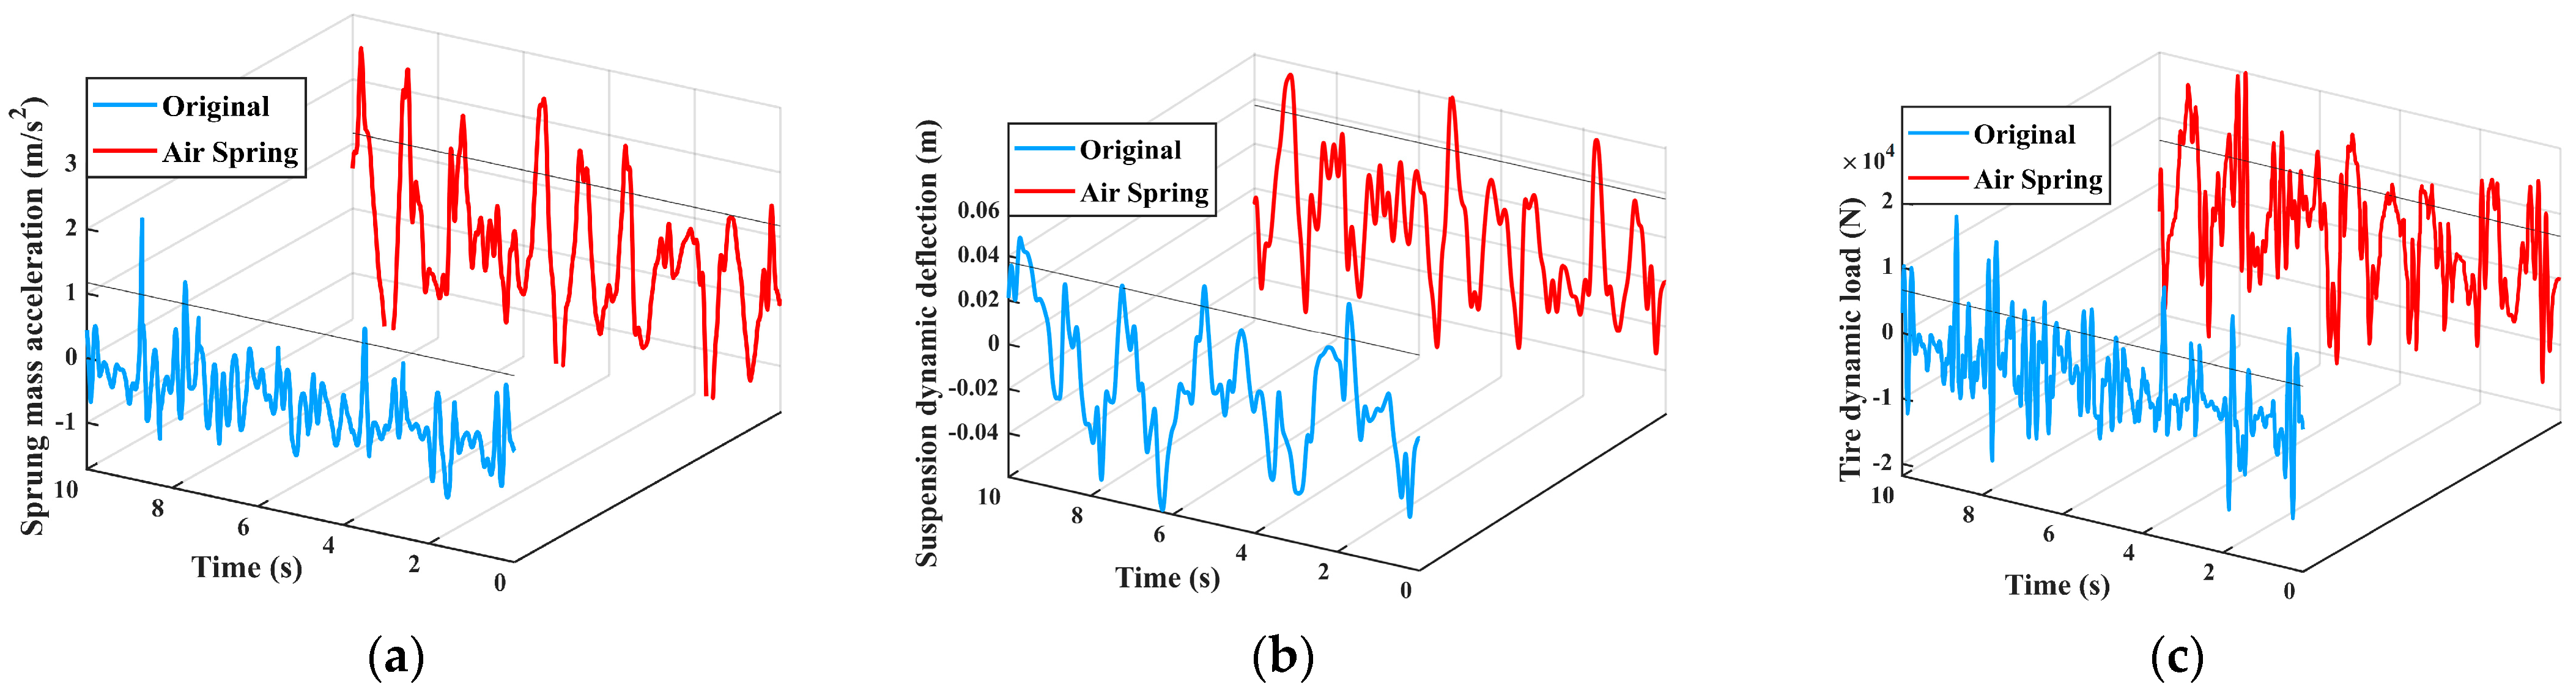
Agriculture 13 01071 g016
Figure 17. 
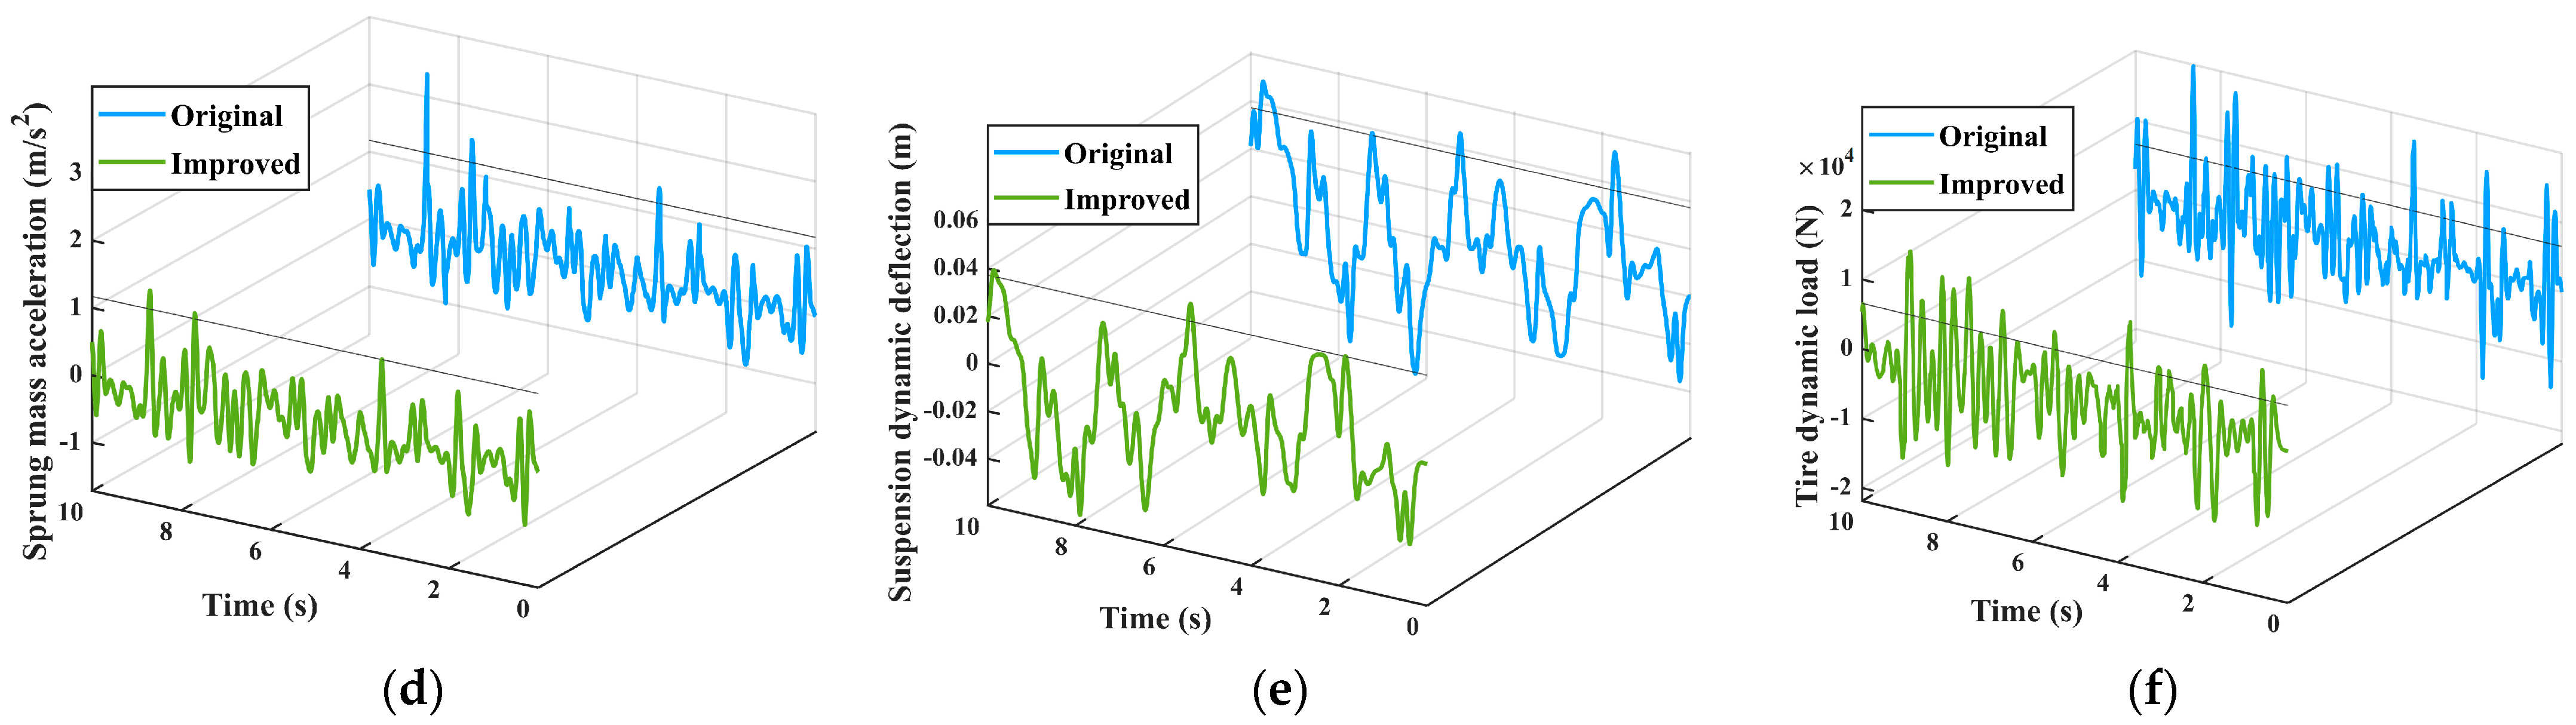
Comparison of test results of three kinds of suspension: (ac) are the comparison between air suspension and original hydro-pneumatic suspension in terms of sprung mass acceleration, suspension dynamic deflection, and tire dynamic load, (df) are the comparison between the improved hydro-pneumatic suspension and the original hydro-pneumatic suspension in terms of sprung mass acceleration, suspension dynamic deflection, and tire dynamic load.
Agriculture 13 01071 g017aAgriculture 13 01071 g017b
Table 1. Design parameters of hydro-pneumatic suspension.
Parameter SymbolMeaningNumerical Value
ms/kgSprung mass of single wheel2400
mu/kgUnsprung mass of single wheel300
d1/mmPiston rod diameter35
d2/mmInner diameter of hydraulic cylinder63
dz/mmDiameter of damping hole 43
dj/mmDiameter of damping holes 6 and 73
P0/MPaInitial pressure of accumulator12
V0/LInitial volume of accumulator2.5
S/mmHydraulic cylinder stroke600
Table 2. Simulation values compared with standard values.
Road ClassMean Square Error σw × 10−3 m
Standard Value40 km/h
B7.617.91
D30.4531.07
F121.80119.63
Table 3. Optimization range of parameters.
ParameterLower LimitUpper Limit
Volume V0/L2.57
Inner diameter d2/mm5590
Piston rod diameter d1/mm2050
Damping hole diameter dz/mm39
Damping hole diameter dj/mm39
Table 4. Sensor model and parameters.
NameModel and SpecificationMeasure Range
Acceleration sensor 1Triaxial accelerometer±5 g
Displacement sensor 2Pull wire displacement sensor0~250 mm
Displacement sensor 3Pull rod displacement sensor0~100 mm
Table 5. Parameters of air spring for test.
Air Spring ParametersNumerical Value
Static height/mm380
Initial gauge pressure/MPa0.518
Static working volume/L19.1
Diameter of throttle orifice/mm4.5
Additional chamber volume/L19.1
Table 6. Comparison of SP mean and SP standard deviation of functions under two algorithms.
Test FunctionsNSGA-IIImproved NSGA-II
SP(Avg)SP(σ)SP(Avg)SP(σ)
ZDT10.017270.003640.012430.00138
ZDT20.021430.005080.015610.00210
ZDT30.017920.003390.016560.00257
ZDT60.023590.007640.018070.00292
Table 7. Comparison between the original suspension parameters and the parameters of the improved algorithm.
ParameterOriginalImproved NSGA-IIFinal Design Parameters
Initial volume V0/L2.53.984.00
Inner diameter d2/mm6379.3780.00
Piston rod diameter d1/mm3543.2745.00
Damping hole diameter dz/mm35.565.50
Damping hole diameter dj/mm34.494.50
Table 8. Evaluation indicator value and promotion rate.
Evaluation IndicatorOriginalImprovedPromotion Rate
RMS of sprung mass acceleration/(m/s2)0.780.5726.9%
RMS of suspension dynamic deflection/m0.01940.01788.2%
RMS of tire dynamic load/N6077.855963.171.9%
Table 9. Comparison of test data.
Evaluation IndicatorAir SpringOriginal Hydro-Pneumatic SuspensionOptimized Hydro-Pneumatic SuspensionPromotion Rate
RMS of sprung mass acceleration/(m/s2)1.420.930.7519.4%
RMS of suspension dynamic deflection/m0.0350.0280.02510.7%
RMS of tire dynamic load/N7535.696391.526136.074.0%
Disclaimer/Publisher’s Note: The statements, opinions and data contained in all publications are solely those of the individual author(s) and contributor(s) and not of MDPI and/or the editor(s). MDPI and/or the editor(s) disclaim responsibility for any injury to people or property resulting from any ideas, methods, instructions or products referred to in the content.

