Article

Effect of Dietary Starch-to-Fat Ratio on Lipid Metabolism, Inflammation, and Microbiota of Multiparous Sow and Newborn Piglets

State Key Laboratory of Animal Nutrition, College of Animal Science and Technology, China Agricultural University, Beijing 100193, China
*
Author to whom correspondence should be addressed.
These authors contributed equally to this work.
Agriculture 2023, 13(5), 1069; https://doi.org/10.3390/agriculture13051069
Submission received: 23 April 2023 / Revised: 10 May 2023 / Accepted: 12 May 2023 / Published: 16 May 2023
(This article belongs to the Special Issue Effects of Dietary Interventions on Pig Production)

Abstract

:
This experiment aimed to evaluate the effects of dietary starch-to-fat ratio on reproductive performance and lipid metabolism of sows and newborn piglets. A total of 75 Landrace × Yorkshire multiparous sows at d 84 of gestation were selected and randomly divided into three groups based on body weight. From d 85 of gestation to farrowing, sows were fed one of three dietary starch-to-fat ratios (20:1, 10:1, and 5:1). Dietary high starch-to-fat ratio increased the birth weight of piglets (p < 0.05). The apparent total digestibility of dry matter, organic matter, and gross energy of sows was improved by an increasing starch-to-fat ratio during gestation (p < 0.05). Decreased dietary starch-to-fat ratio increased the concentration of plasma triglycerides, total cholesterol, and GSH-Px in sows (p < 0.05). During parturition, sows had increased plasma interleukin (IL) -1β, IL-6, and tumor necrosis factor α in the low ratio group (p < 0.05). The relative abundance of Streptococcaceae in the low ratio group was significantly higher (p < 0.05). The medium dietary starch-to-fat ratio significantly increased the concentrations of short chain fatty acids. In conclusion, this study suggested that for sows a diet with ahigh starch to fat ratio could ameliorate lipid metabolism disorder and maternal inflammation during late gestation.

1. Introduction

The fetus grows fast during late gestation indicating an active exchange of nutrients between the fetus and placenta [1]. Fat and starch are common sources of energy in diets, although starch possesses a lower caloric density than fat [2]. To satisfy the rapid growth of the fetus, sows undergo many physiological changes [3], such as an increased circulating concentration of hormones [4]. Increased estrogen levels in late pregnancy reduce insulin sensitivity and insulin receptor expression in insulin-dependent tissues, leading to insulin resistance that significantly affects lipoprotein lipase (LPL) activity [5,6]. Decreased LPL activity results in increased triglyceride and low density lipoprotein (LDL-C) concentration [7]. Maternal blood lipid levels in late pregnancy are thus higher than those in early pregnancy [8]. These dynamic changes in the lipids profile promote fetal growth [9]. The active metabolic state during pregnancy increases the production of reactive oxygen species which attack linoleates of LDL-C, leading to lipid peroxidation [10,11]. Thus, even normal pregnancy is considered as a state of oxidative stress [12].
During gestation, the mother switches between anti-inflammatory and pro-inflammatory states [13]. In late gestation, the immune response is not exaggerated, the fetus grows rapidly, and the mother is in an anti-inflammatory state [14]. Pro-inflammation plays a significant role in parturition [15]. Inflammation can lead to metabolic syndrome, including insulin resistance and lipid metabolism disorder [14]. Excessive energy intake-induced obesity can lead to an increased inflammatory response by secreting inflammatory factors such as TNF-α [16]. Dietary fat supplementation improves milk fat and yield [17], promoting the development of sucking piglets [18]. On the other hand, high dietary fat exacerbates oxidative stress and increases inflammatory signaling [19].
Gut microbiota play a significant role in nutrient metabolism, antimicrobial protection, immunomodulation, and integrity of the gut barrier [20]. Changes in inflammation and immune status during pregnancy alters the composition and function of gut microbiota [21]. Body weight during the physiological stages of pregnancy affects gut microbiota composition [22]. The composition of gut microbiota changes with the different stages of gestation, lactation, and the empty phase in Landrace sows [23]. Microbial changes are also related to maternal diet during pregnancy. A high-fat diet during pregnancy increases the abundance of bacteria species associated with fatty acid, ketone body, and bile acid metabolism [24].
For the same amount of energy intake, a dietary low starch-to-fat ratio increases weight loss, resulting in nitrogen imbalance [25]. Dietary fat supplementation is associated with oxidative stress and inflammation [17]. In this study, sows during late gestation were fed diets with three ratios of starch to fat and the daily energy intake of the sows in different treatments was consistent. We hypothesized that maternal intake of high starch rather than high fat during late gestation could enhance body weight and blood lipid, alleviating oxidative stress. The goal of this study was to investigate how the maternal diet affected oxidative stress, inflammation, and microbial flora of sows and newborn piglets.

2. Materials and Methods

The experiment was carried out at the FengNing Swine Research Unit of China Agricultural University (Academician Workstation in Chengdejiuyun Agricultural and Livestock Co., Ltd., Hebei, China). The experimental protocol used in the present study was approved by the Institutional Animal Care and Use Committee at China Agricultural University, No. AW12211202-1-2.

2.1. Animals, Diets, and Experimental Design

A total of 75 Landrace × Yorkshire multiparous sows (body weight: 259.7 ± 2.68 kg, parity: 4.5 ± 0.07) were used for the experiment. Based on body weight, sows were divided into three groups and fed one of three dietary treatments on d 84 of gestation. These diets were designed according to starch-to-fat ratio: High (20:1), Medium (10:1), and Low (5:1) [26]. The experiment was carried out from d 85 of gestation to farrowing. Ingredient and chemical composition of the experimental diets are shown in Table 1. Sows were fed three times a day at 0500, 1130, and 1630 h from d 85 of gestation until parturition and had free access to water. The feed was offered at 3.0 kg/day per treatment, and one third of the daily feed was given at each meal. The sows were brought into the farrowing house and put in separate farrowing crates about 7 days before their expected farrowing date.

2.2. Sow Performance

Multiparous sows’ body weight and backfat thickness were measured on d 84 and d 107 of gestation, as well as within 24 h after parturition. The thickness of backfat was measured using an ultrasound scanner (Mylab Touch Vet, ESANTE, Florence, Italy) at the P2 position (65 mm right of the midline at last rib). At farrowing, the total number of piglets born, born alive, and stillborn were counted. The weight of piglets was recorded at birth.

2.3. Sample Collection

On d 110 of gestation, a total of 36 sows (12 sows per treatment) were used for blood sampling by jugular venipuncture. A total of 36 neonatal piglets (12 piglets per treatment) were used for blood sampling by jugular venipuncture after parturition. The blood samples were collected into vacuum tubes containing sodium heparin and centrifuged at 3000 rpm at 4 °C for 15 min. Plasma was aliquoted and stored at −20 °C for further analysis.
On d 114 of gestation, a backfat biopsy was performed on each sow using an auto-percutaneous needle (CR Bard Inc., Murray Hill, NJ, USA). Sows were anesthetized with an intramuscular injection of lidocaine hydrochloride (does as 2 mL, China Agricultural University, Beijing, China). A backfat sample was taken at the right P2 point and immediately frozen in liquid nitrogen before being stored at −80 °C for further analysis.
Colostrum was collected (20 mL) from the first teat to the last teat on the left of each sow just after the birth of the first piglet. Colostrum samples were gently mixed, frozen immediately, and stored at −20 °C until analysis.
To determine the digestibility of nutrients in sows, the above three dietaries with different starch-to-fat ratios were formulated with 0.3% chromium trioxide as an inert marker. Then the fresh fecal samples were collected from 18 sows on d 107 of gestation. Additionally, the fresh feces of piglets from 18 sows were collected after birth. Feces were immediately frozen in liquid nitrogen and stored at −80 °C for further analysis.

2.4. Diets and Feces Nutrients Analysis

Before analysis, these dried feces and feed samples were ground so they would pass through a 1-mm sieve, and then they were analyzed for dry matter, crude protein, ash, and ether extract [27]. Neutral detergent fiber (NDF) and acid detergent fiber (ADF) were determined using a fiber analyzer (Ankom Technology, Macedon, NY, USA) [28]. The gross energy in feed and fecal samples was measured using an automatic isoperibolic oxygen bomb calorimeter (Parr1281, Automatic Energy Analyzer; Moline, IL, USA) assay. Organic matter (OM) was calculated using the following equation: OM = DM − ash. The chromium contents of diets and feces were measured by wet digestion flame atomic absorption spectrophotometry (SpectraAA 220FS/220Z, Varian Medical Systems Inc., Palo Alto, CA, 3100 Hansen Way US). The apparent total tract digestibility (ATTD) of nutrients were determined using the indicator method as follows: ATTD (%) = [1 − (DC × FN)/(FC × DN)] × 100 [29], where ATTD is the apparent total tract digestibility of the target nutrient, DC is the content of chromium in the diets, FN is the content of the target nutrient in the feces, FC is the content of chromium in the feces, and DN is the content of the target nutrient in the diets.

2.5. Metabolic Biomarkers Analysis

The TG, TC, HDL-C, LDL-C, nonestesterified fatty acid (NEFA), and glucose of plasma were measured by an automatic biochemical analyzer (Hitachi 7020, Tokyo, Japan). Insulin, leptin, adiponectin, and inflammatory cytokines were measured using specific commercially available enzymatic assays (Nanjing Jiancheng Bioengineering Institute, Nanjing, China). Indirect methods were used to evaluate insulin sensitivity using the homeostasis model assessment, HOMA-IR = [(fasting insulin, mIU/L)] × (fasting glucose, mmol/L)]/22.5 [30]. The colostrum samples were analyzed for protein, fat, and lactose composition, which were estimated by a milk analyzer at Beijing Dairy Cow Center (Beijing, China).
The contents of SCFAs in the feces were detected. Samples of about 0.5 g of fresh feces were mixed with 1.0 mL of 0.10 mol/L HCL sterile water, placed in ice for 30 min, and then centrifuged at 15,000× g at 0 °C for 15 min. Additionally, 1.0 mL of the supernatant was passed through a 0.22 mm Nylon Membrane Filter (Millipore, Bed-ford, OH, USA) to a gas chromatograph sample bottle. The SCFAs were measured by the Gas Chromatographic System (Agilent HP 6890 Series, Santa Clara, CA, USA).

2.6. Fecal Microbiota Analysis

DNA extraction kits (Omega Biotech Co., Ltd., Beijing, China) were used to extract the total genomic DNA of microorganisms in feces. The contents of DNA were quantified by Nanodrop (Thermo Scientific, 81 Wyman Street, Waltham, MA, USA), and the quality of DNA was checked using 1.2% agarose gel electrophoresis. PCR amplification was performed on the V3-V4 region of 16S rRNA. The PCR amplified product was quantified using the Quant-iT PicoGreen dsDNA Assay Kit by Microplate reader. Sequencing libraries were prepared using the TruSeq Nano DNA LT Library Prep Kit. The illumina platform was used for paired-end sequencing of community DNA fragments (Personal Biotechnology, Shanghai, China). Microbiome bioinformatics analysis was performed according to the QIIME 2 (2019.4) process. Sequences were quality filtered, denoised, merged, and chimera re-moved using the DADA2 plugin. The data were analyzed through the free online platform of the Personal Cloud Platform (https://www.genescloud.cn/home, accessed on 7 May 2021). The 16S rRNA gene sequence data were deposited in the National Centre for Bio-technology Information (NCBI) Sequence Read Archive (SRA) under the accession number PRJNA791467.

2.7. Statistical Analyses

Data generated in the present experiment were analyzed by SPSS Statistics 20 program (IBM Corporation. Somers, NY, USA). The individual sow and piglet were used as the experimental unit for all response variables in the model. One-way ANOVA was used to analyze the performance of sows and piglets. Tukey’s test was performed for multiple comparisons. The results were expressed as mean ± SEM. Kruskal-Wallis was applied for the analysis of microbial differences. Differences were considered statistically significant at p < 0.05, with a trend toward significance at 0.05 ≤ p ≤ 0.10.

3. Results

3.1. Sow Performance

Table 2 indicates the effects of dietary starch-to-fat ratio on sow performance. The body weight and backfat thickness of sows did not differ significantly from d 85 of gestation to postpartum (p > 0.05). The total numbers of piglets born, born alive, stillbirths, and mummy did not differ significantly (p > 0.05). The high dietary starch-to-fat ratio significantly improved mean birth weight and litter weight of piglets compared with medium ratio (p < 0.05). Dietary high starch-to-fat ratio significantly increased lactose content in colostrum and decreased the fat content compared to medium ratio (p < 0.05, Table 3). Dietary high starch-to-fat ratio increased (p < 0.05) the ATTD of dry matter, organic, gross energy, neutral detergent fiber, and acid detergent fiber matter of sows during late gestation (Table 4).

3.2. Parameters Related to Glucolipid Metabolism

The consequences of plasma parameters related to the glucolipid metabolism of sows are displayed in Table 5. On d 107 of gestation, the plasma concentrations of TC, TG, glucose, and HOMA-IR were significantly higher for sows fed a low starch-to-fat ratio diet (p < 0.05). During parturition, sows fed a low starch-to-fat ratio diet significantly enhanced plasma LDL-C and leptin levels, and decreased NEFA and adiponectin levels (p < 0.05). The three different diets did not have an effect on sow backfat, leptin, and adiponectin. (p > 0.05, Table 6). Table 6 shows the plasma parameters of newborn piglets. The plasma lipids were not different (p > 0.05). Sows fed a low starch-to-fat ratio diet had increased contents of insulin, leptin, and HOMA-IR, alongside decreased adiponectin content of their newborn piglets (p < 0.05, Table 7).

3.3. Antioxidant Enzymes and Inflammatory Cytokines

Table 8 indicates the effects of dietary starch-to-fat ratio on antioxidant enzymes in the plasma of sows and newborn piglets. On d 107 of gestation, sows fed a low starch-to-fat ratio had significantly increased GSH-Px levels in plasma samples (p < 0.05). The levels of T-AOC, SOD, GSH-PX, and MDA did not differ in the plasma of sows during parturition (p > 0.05). Similarly, these indexes of newborn piglets were not affected by maternal dietary starch-to-fat ratio (p > 0.05).
The consequence of inflammatory cytokines in the plasma of sows and newborn piglets affected by the dietary starch-to-fat ratio are shown in Table 9. On d 107 of gestation, the plasma inflammatory cytokines of sows were not significantly different (p > 0.05). During parturition, sows fed a low starch-to-fat ratio diet had significantly increased IL-1β, IL-6, and TNF-α contents in plasma samples (p < 0.05). Furthermore, maternal dietary low starch-to-fat ratio had increased the plasma IL-1β and IL-6 contents of newborn piglets (p < 0.05). The inflammatory cytokines of the backfat of sows did not differ among the three treatments (p > 0.05, Table 10).

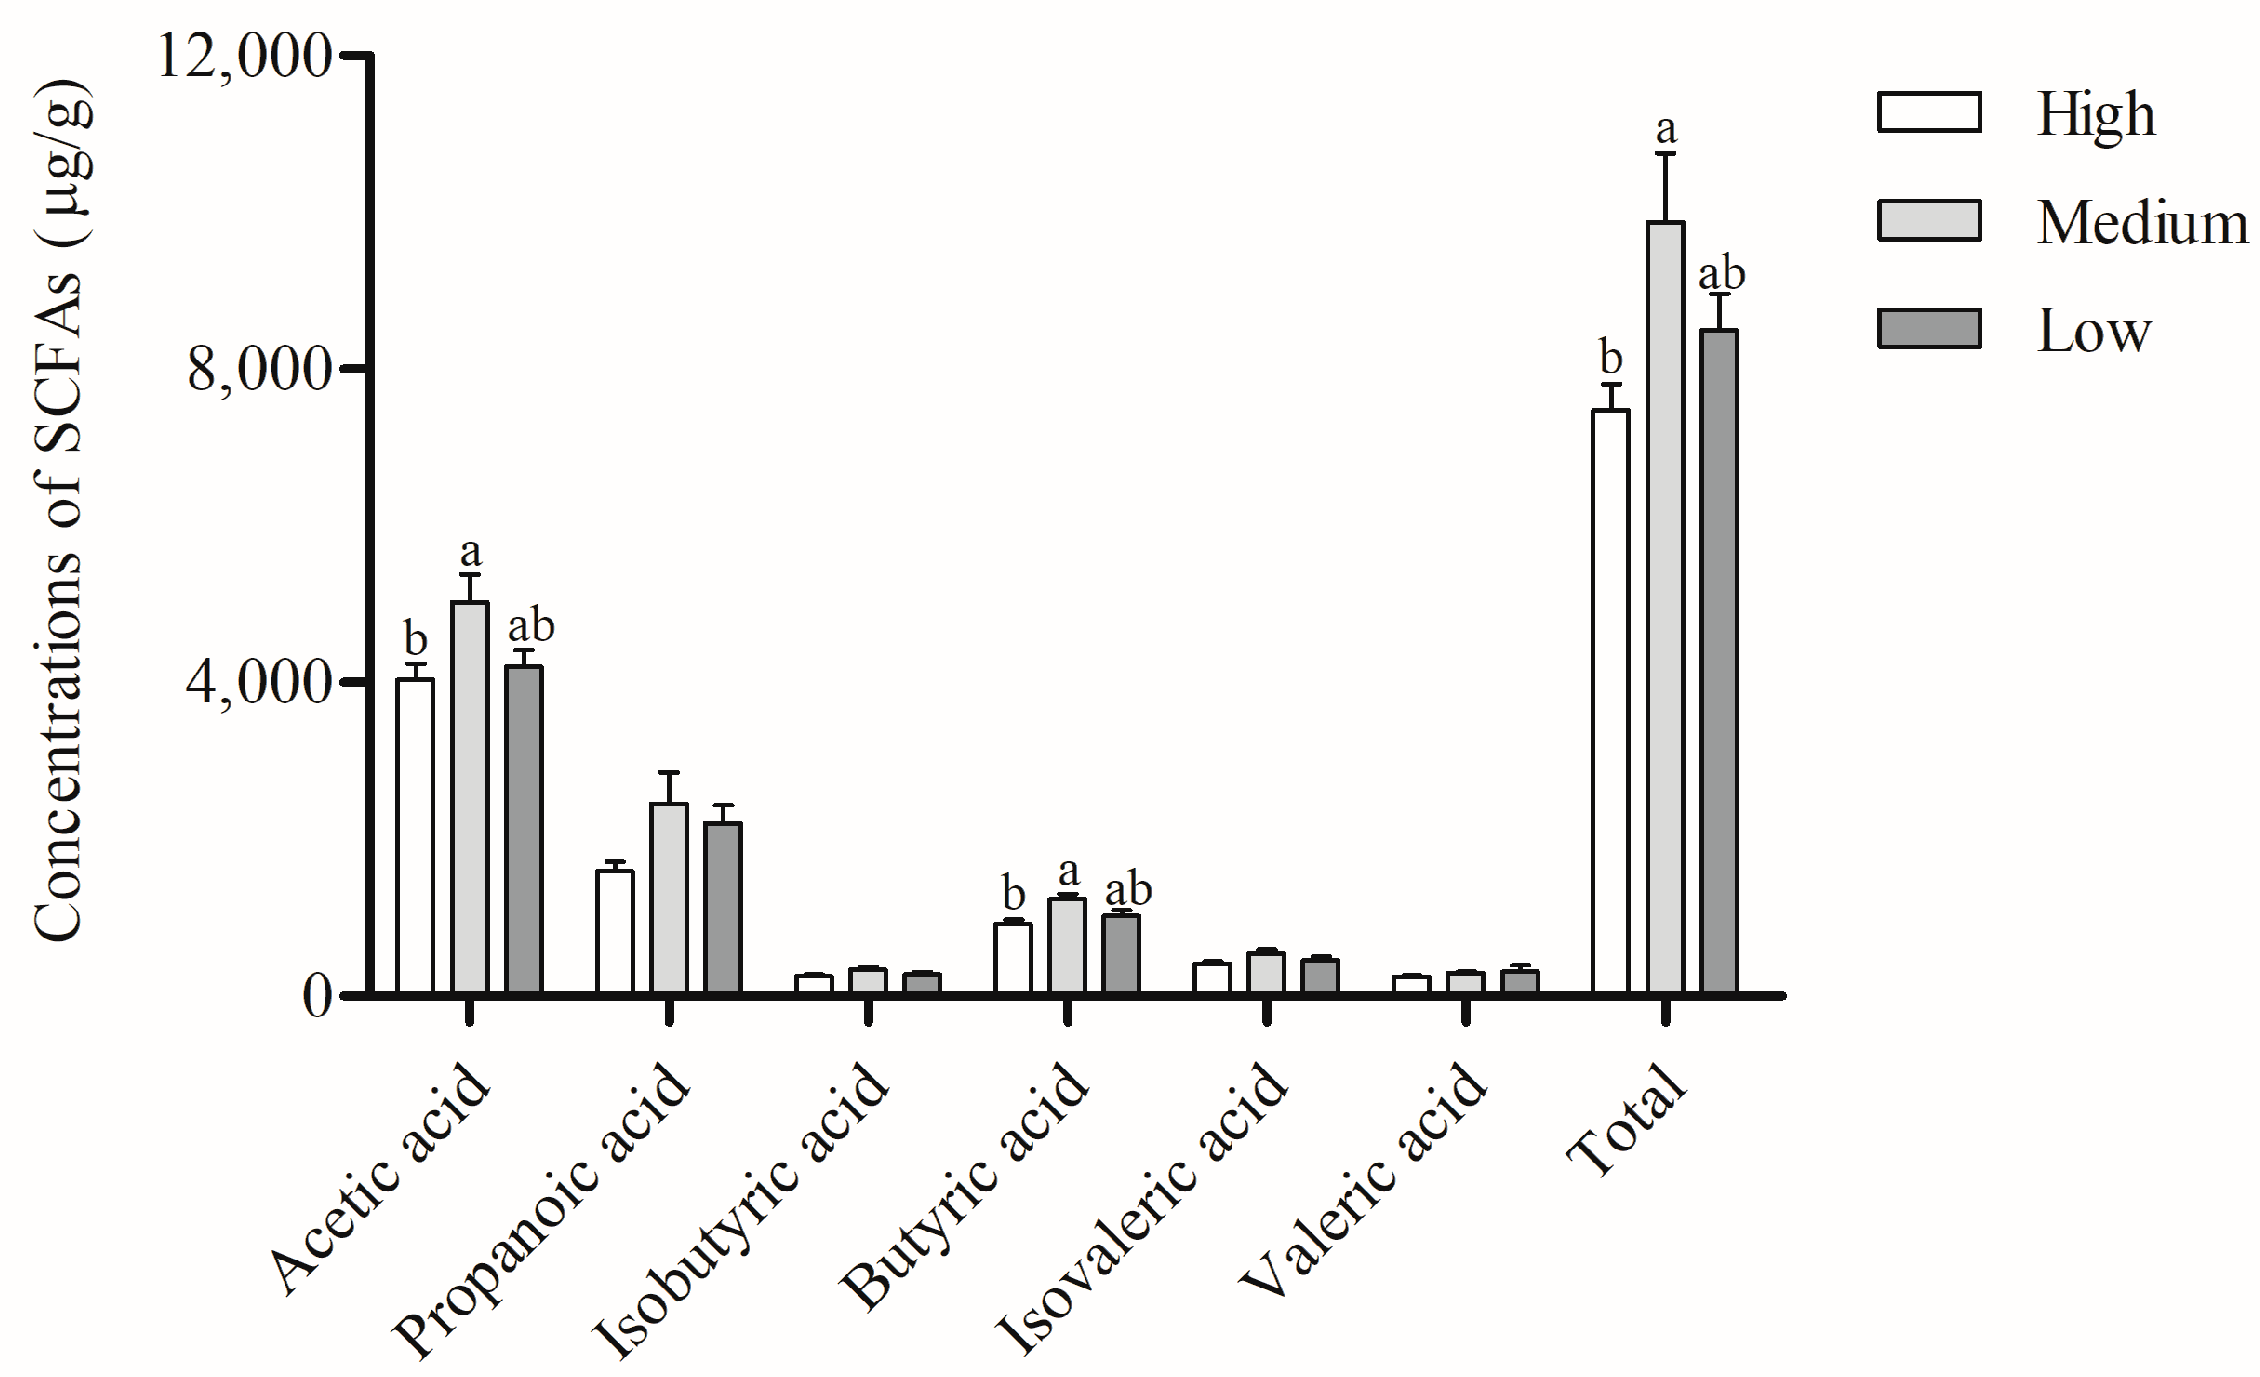
3.4. SCFAs in Feces of Sows

On d 107 of gestation, the medium starch-to-fat ratio diet significantly increased the acetate, butyrate, and total SCFAs of feces (p < 0.05, Figure 1).

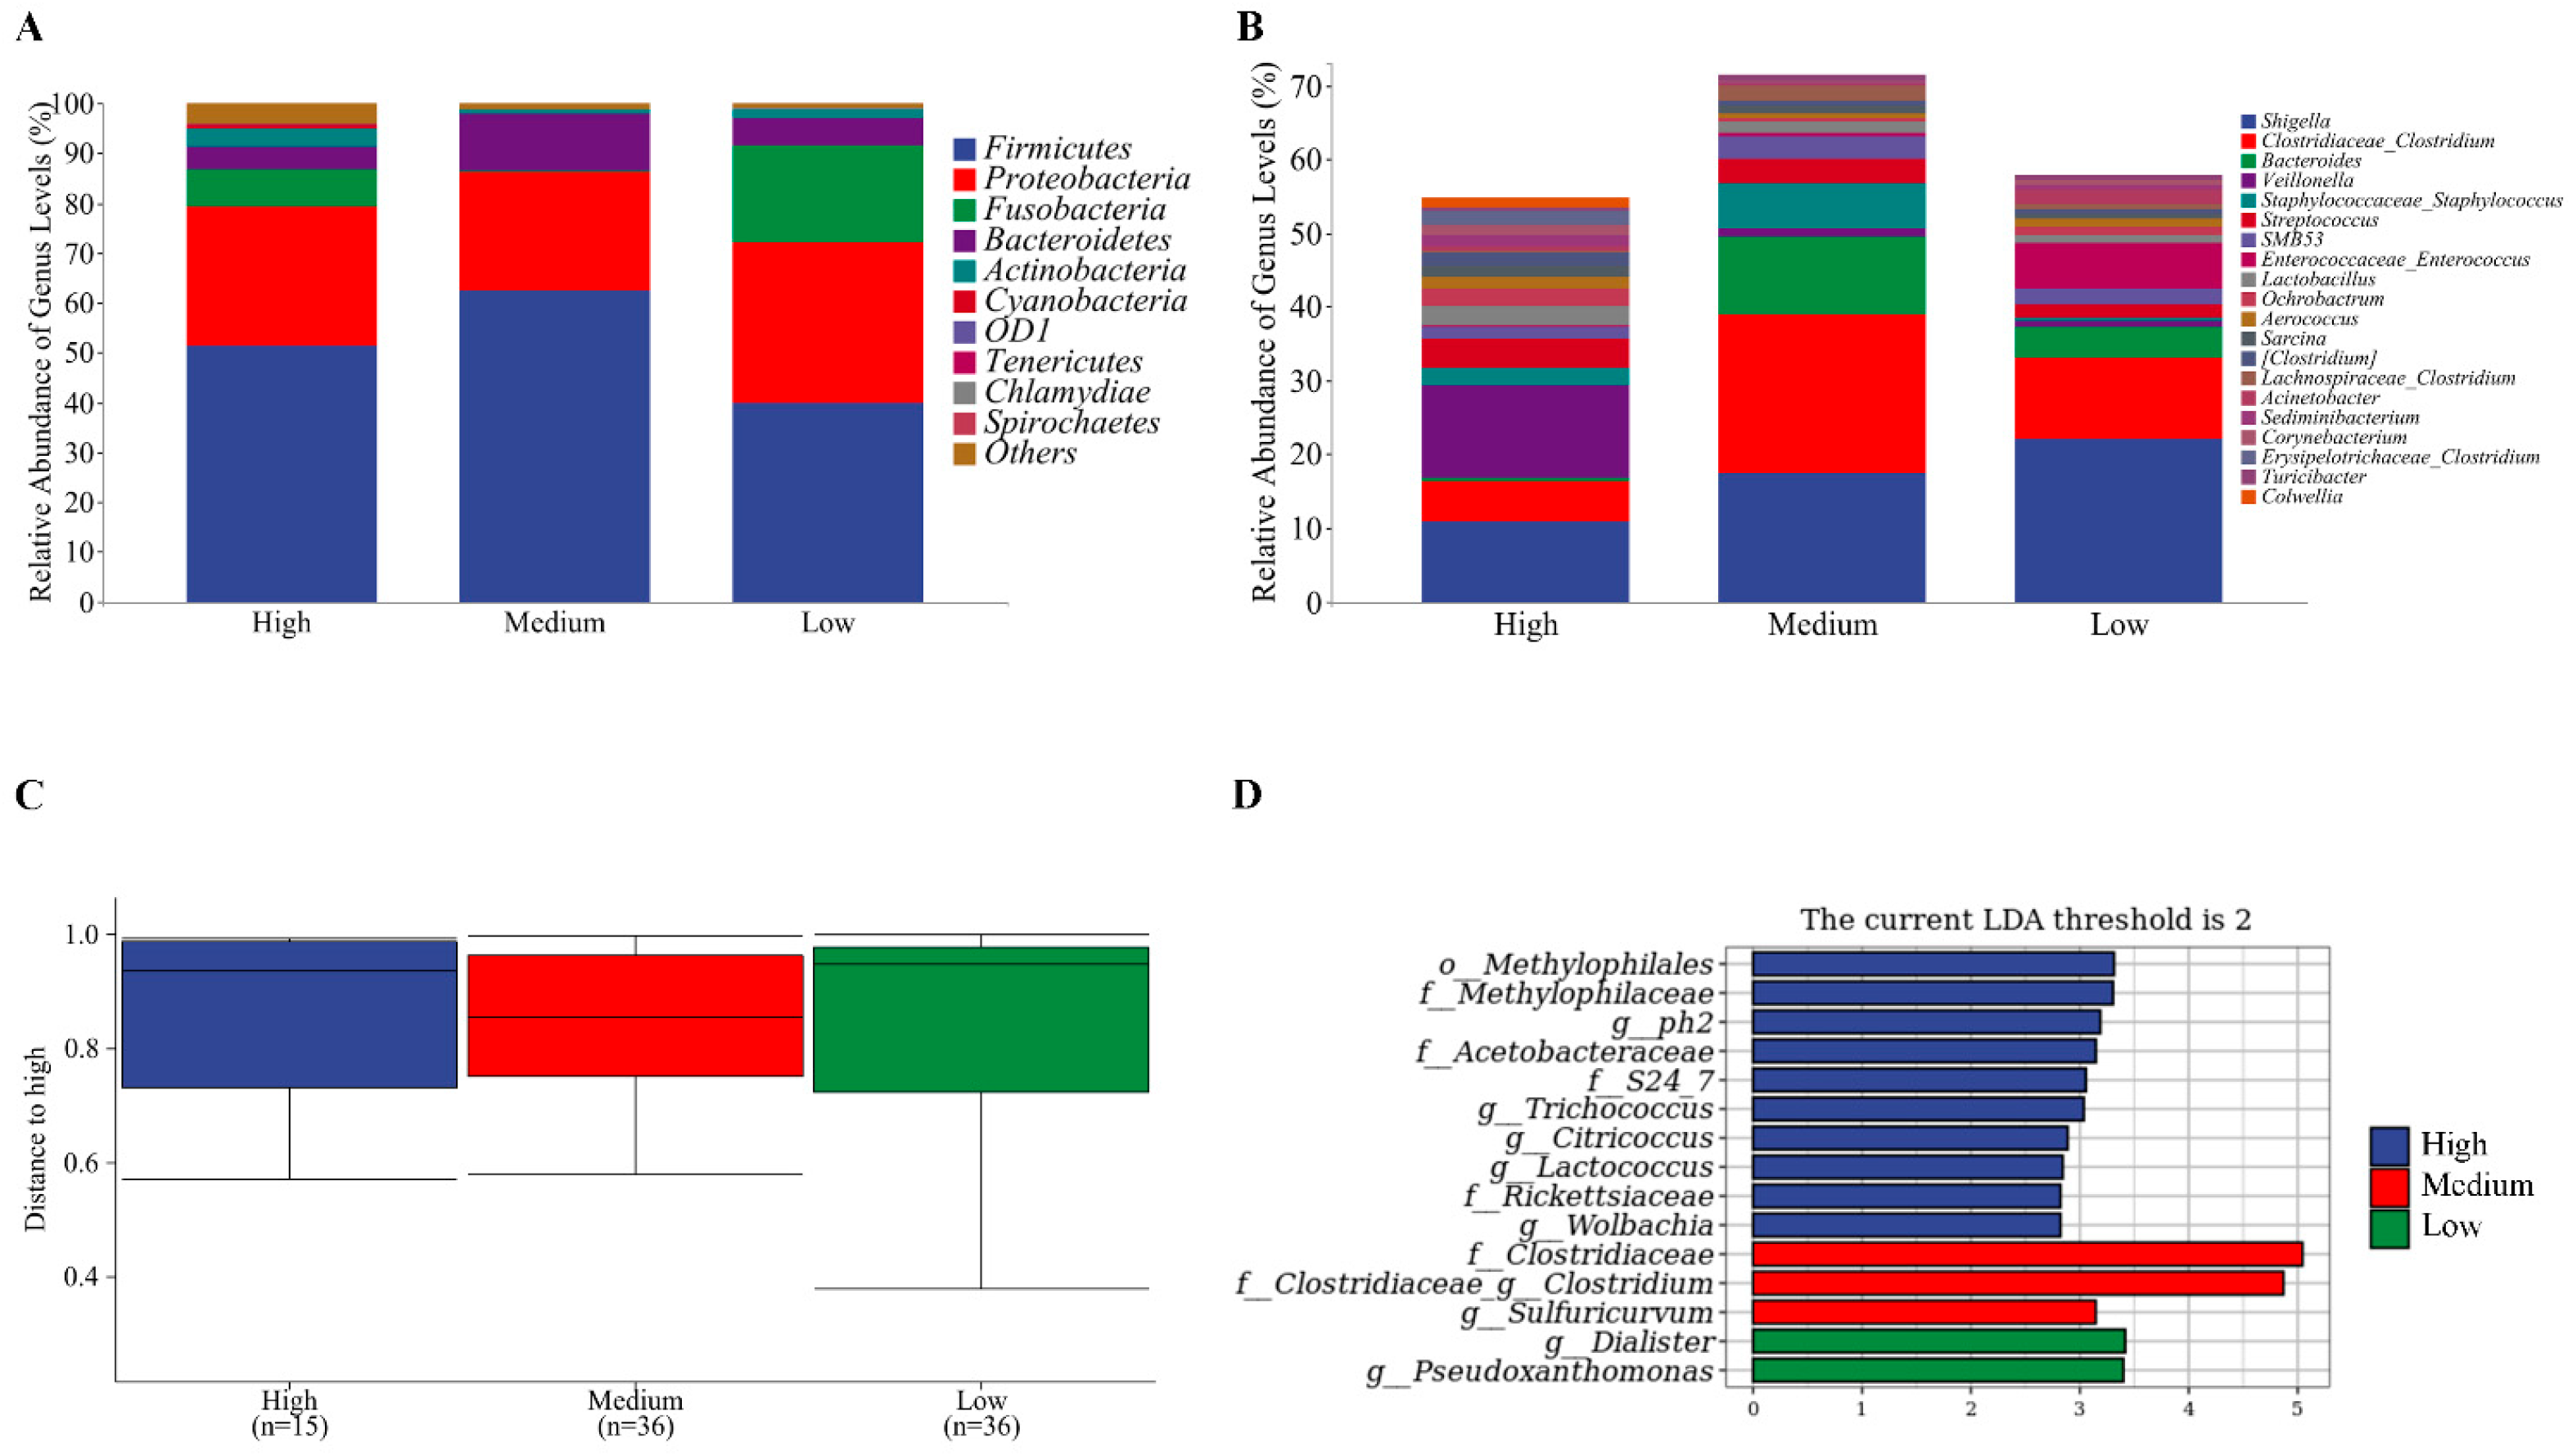
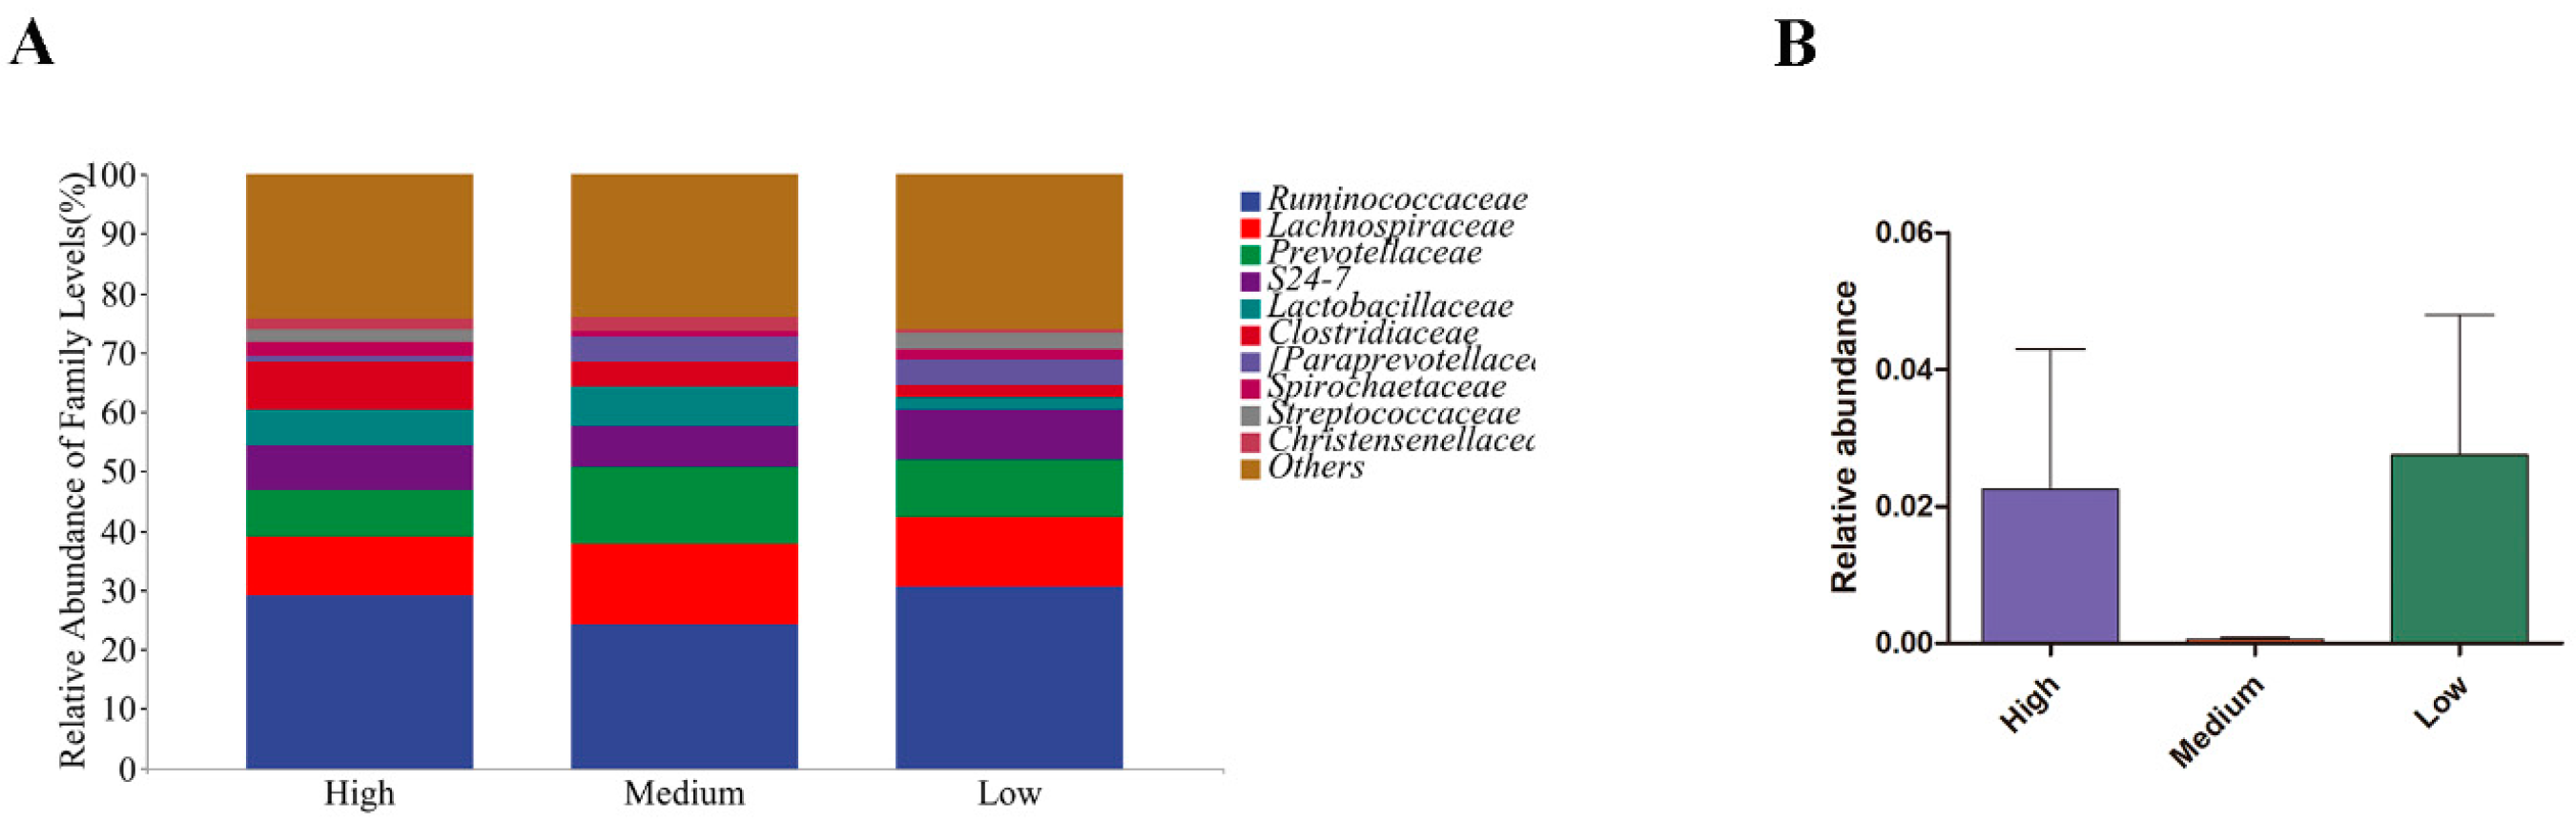
3.5. Microbial Flora of Sows and Newborn Piglets

The differences in the compositions of bacterial communities in the three groups of sows were studied. An amount of 1,352,108 high-quality sequences were gained in 18 samples. Based on 100% sequence similarity, 4030 amplicon sequence variants (ASVs) were identified and then allocated to 10 phylum, 18 classes, 25 orders, 39 families, 52 genus, and 34 species. An amount of 1,565,181 high-quality sequences were gained in 18 piglets. Based on 100% sequence similarity, 1101 ASVs were detected and then assigned to 14 phyla, 25 classes, 39 orders, 67 families, 99 genus, and 64 species.
Among sows, Firmicutes and Bacteroidetes were the most dominant phyla in the column chart of microbiota composition (Figure 2A). At the genus level, Bacteroides and Lactobacillus were the dominate microbiota in the high and medium treatment groups, whereas Bacteroides and Oscillospira were the dominate microbiota in the low treatment group (Figure 2B). Firmicutes and Proteobacteria were the most dominant phyla in piglets (Figure 3A). At the genus level, Shigella and Clostridium were the dominated microbiota in the medium and low treatment groups, whereas Shigella and Veillonella were the dominate microbiota in the high treatment group (Figure 3B).
As to the alpha-diversity of sow bacteria (Table 11), Simpson indexes had a tendency to be increased in the medium treatment group compared to the high treatment group (p = 0.08), whereas there were no differences in Chao index, Observed species index, and Simpson index. As for newborn piglets, alpha-diversity was not significantly different among the three groups. For the β diversity of sow bacteria, the Bray-Curtis distance showed a significant difference between the high treatment group and the low treatment group (Figure 3C, Adonis, p = 0.03), which indicated that each group hosted its own distinct bacterial community microbiota.
LEfSe analysis (LDA > 2, p < 0.05) can simultaneously identify the specific taxa across the phylum, class, order, family, and genus levels. There were nine discriminative features of the sows in the high treatment group. The top five species with the most considerable differences were Sarcina, Chloroplast, Streptophyta, Methylotenera, and Methylococcales. The relative abundance of Verrucomicrobiales, Verrucomicrobiae, Verrucomicrobiaceae, Akkermansia, Olsenella, and Succiniclasticum was significantly higher in the medium treatment group. The top five species with the most considerable differences in the low treatment group were Streptococcaceae, Streptococcus Veillonellaceae, Prevotella, and Butyricicoccus (Figure 2D). The top four species of piglet bacteria with the most significant differences in the high treatment group were Methylophilales, Methylophilaceae, ph2, and Acetobacteraceae. The relative abundance of Clostridiaceae, Clostridium, and Sulfuricurvum was significantly higher in the medium treatment group, while Dialister and Pseudoxanthomonas were significantly higher in the low treatment group (Figure 3D). Sows fed a low dietary starch-to-fat ratio diet had a considerably higher relative abundance of Streptococcus in their feces (p < 0.05, Figure 4).

4. Discussion

4.1. Sow Performance

Dietary energy intake affects the reproductive performance of sows. Fat and starch are common sources of energy in diets [23]. Fat is usually used as an energy substance to study the effects of different energy intakes on the reproductive performance of sows [31,32]. The aim of this study was to investigate the influence of starch and fat on energy metabolism, under the condition of the same energy intake but different starch-to-fat ratios. In the present study, starch provided 8.7, 3.8, and 2.1 times as much energy as fat, respectively. After parturition, a dietary low starch-to-fat ratio tended to reduce the backfat thickness of sows. The low ATTD of gross energy indicated that a low starch-to-fat ratio led to lower energy utilization. A low carbohydrate-to-fat ratio could increase fat oxidation and body fat loss [25]. Low carbohydrate intake can alter metabolic fuel selection and increase fat oxidation, thereby reducing body fat deposition [33]. Starch is more efficient than fat in energy generation [34]. In the present investigations, piglet birth weight was significantly increased by dietary high starch-to-fat ratio, which indicated that piglets tend to use starch as energy for development [35].

4.2. Glucolipid Metabolism

A blood biochemical index can reflect the nutritional metabolism of sows. With the decrease of starch content and the increase of fat content, the lipid content in the plasma of sows was increased. Sows with a low starch-to-fat ratio diet increased the contents of total cholesterol and triglyceride in serum [36]. The synthesis of triglycerides and cholesterol, and the oxidation of fatty acids, affect the accumulation of animal fat. The plasma insulin concentration and HOMA-IR of sows fed a low starch-to-fat ratio diet were increased compared to the high and medium treatment groups. Elevated circulating lipid concentrations decrease insulin sensitivity and induce glucose intolerance [37]. Supplementing additional energy from starch for gestating sows improved their glucose tolerance [38]. If women gain too much weight during pregnancy and this is accompanied by dyslipidemia, they might eventually have gestational diabetes [39]. On the other hand, fat supplementation of sows in late gestation significantly increased fat composition in colostrum. This is beneficial to improve the survival rate and growth performance of piglets [40]. In addition to insulin resistance, leptin resistance is also predisposed to occur late in pregnancy [41]. Leptin, secreted by adipose tissue, plays a major role in regulating energy balance [42]. The placenta also secretes leptin during gestation; thus, increased plasma leptin content in sows with high fat intake might be explained by how leptin facilitates nutrient transport to the fetus [43]. In our study, a high fat intake for sows reduced the adiponectin content of plasma during parturition, suggesting the presence of glucose metabolism disorders. This is because adiponectin can regulate energy balance and glycolipid metabolism, such as insulin resistance [44,45].

4.3. Antioxidant Enzymes and Inflammatory Cytokines

Pregnancy is considered a state of oxidative stress [10]. High fat diets result in fat deposits in the placenta and liver, exacerbating oxidative stress [46]. In the present study, by contrast, the T-AOC, SOD, GSH-Px, and MDA levels in the plasma of the sows were not significantly different among the three groups. Metabolic disorder may lead to oxidative stress [47]. In the present study, a high fat diet induced inflammation in sows through elevated blood lipid levels. Previous studies have found that fat deposition caused immune-related genes to be upregulated, leading to an inflammatory response in fat tissue [48]. Starch, as the main energy source of sows, is divided into amylose and amylopectin [49]. The amylose of common yellow corn is about 25% [50], and it is an excellent source of resistant starch [51]. The supplementation of resistant starch reduced the pro-inflammatory factors [52]. Inflammation is also associated with energy intake. Excessive intake of energy in the body leads to obesity, which increases the secretion of inflammatory factors in adipose tissue and exacerbates the inflammatory response [46]. In this experiment, the energy intake was consistent, and the starch and fat intake was different. Fat rich in unsaturated fatty acids is prone to oxidation, which intensifies oxidative stress and increases inflammatory signal transduction.
The composition of gut microbiota changes with different stages of sow gestation, lactation, and the empty phase [21]. An increase in maternal plasma total cholesterol levels during late gestation affected some bacteria from the Coriobacteriaceae family [53]. Gut microbes play a role in pregnancy, short-chain fatty acids, inflammation, and obesity [20]. Resistant starch could modulate the microbiota composition of pigs, resulting in the production of SCFAs [54]. In the present study, high fat intake reduced the SCFAs in the feces of sows, which is usually associated with decreased relative abundances of SCFA producing genera [55]. SCFAs-producing bacteria mainly include Bacteroides, Bifidobacterium, Eubacteria, Streptococcus, and Lactobacillus [56]. Although low dietary starch-to-fat ratio diets considerably increased the relative abundance of Streptococcaceae in feces, the changes in SCFAs content were not consistent with microbial changes. In this experiment, the dietary fiber content was similar among the treatment groups, which was the energy substance of the microbiota. Starch and fat were highly absorbed in the small intestine and had little influence on microbiota in the colon.

5. Conclusions

In conclusion, dietary high starch-to-fat ratio during late gestation increased the birth weight of piglets. Compared with a low starch-to-fat ratio diet, a high starch-to-fat ratio diet increased the ATTD of the nutrients of sows during late gestation, and decreased the concentration of lipid metabolites, inflammatory cytokines, and HOMA-IR. Dietary high starch intake could ameliorate lipid metabolism disorders, inflammation, and insulin resistance of sows and improve the birth weight of piglets.

Author Contributions

Conceptualization, F.W. and H.L.; Methodology, W.W. and Z.Y.; Formal analysis, W.W.; Investigation, Z.Y.; Data curation, W.W. and Z.Y.; Writing—original draft, W.W., Z.Y., X.Y., Z.W., S.X., C.S. and J.Z.; Funding acquisition, F.W. and H.L. All authors have read and agreed to the published version of the manuscript.

Funding

This study was financially supported by Natural Science Foundation of Shandong Province of China (ZR2021QC016), National Key R&D Program of China (NO. 2021YFD1300201, 2021YFD1300202), Shaanxi Provincial Land Engineering Construction Group Co. (202205510410747).

Institutional Review Board Statement

The experimental protocol used in the present study was approved by the Institutional Animal Care and Use Committee at China Agricultural University, No. AW12211202-1-2.

Data Availability Statement

Data available on request due to restrictions eg privacy or ethical. The data presented in this study are available on request from the corresponding author. The data are not publicly available due to following study.

Acknowledgments

We would like to thank Lee Johnston for revising the manuscript.

Conflicts of Interest

The authors declare that this research was conducted in the absence of any commercial or financial relationships that could be construed as a potential conflict of interest.

References

  1. Barker, D.J.P. The malnourished baby and infant. Br. Med. Bull. 2001, 60, 69–88. [Google Scholar] [CrossRef]
  2. Staessen, T.W.O.; Verdegem, M.C.J.; Nederlof, M.A.J.; Eding, E.H.; Schrama, J.W. Effect of type of dietary non-protein energy source (starch vs. fat) on the body bile acid pool size and composition, faecal bile acid loss and bile acid synthesis in rainbow trout (Oncorhynchus mykiss). Aquac. Nutr. 2021, 27, 865–879. [Google Scholar] [CrossRef]
  3. Morris, D.L.; Brown-Brandl, T.M.; Hales, K.E.; Harvatine, K.J.; Kononoff, P.J. Effects of high-starch or high-fat diets formulated to be isoenergetic on energy and nitrogen partitioning and utilization in lactating Jersey cows. J. Dairy Sci. 2020, 103, 4378–4389. [Google Scholar] [CrossRef] [PubMed]
  4. Abbassi-Ghanavati, M.; Greer, L.G.; Cunningham, F.G. Pregnancy and Laboratory Studies A Reference Table for Clinicians. Obstet. Gynecol. 2009, 114, 1326–1331. [Google Scholar] [CrossRef] [PubMed]
  5. Panarotto, D.; Remillard, P.; Bouffard, L.; Maheux, P. Insulin resistance affects the regulation of lipoprotein lipase in the postprandial period and in an adipose tissue-specific manner. Eur. J. Clin. Investig. 2002, 32, 84–92. [Google Scholar] [CrossRef]
  6. Gonzalez, C.G.; Alonso, A.; Balbin, M.; Diaz, F.; Fernandez, S.; Patterson, A.M. Effects of pregnancy on insulin receptor in liver, skeletal muscle and adipose tissue of rats. Gynecol. Endocrinol. 2002, 16, 193–205. [Google Scholar] [CrossRef]
  7. Ikeoka, D.; Krusinova, E. Insulin resistance and lipid metabolism. Rev. Assoc. Med. Bras. 2009, 55, 234. [Google Scholar] [CrossRef]
  8. Garduno-Alanis, A.; Vazquez-de Anda, G.; Valdes-Ramos, R.; Talavera, J.O.; Herrera-Villalobos, J.E.; Huitron-Bravo, G.G.; Hernandez-Garduno, E. Predictors of hyperlipidemia during the first half of pregnancy in Mexican women. Nutr. Hosp. 2015, 31, 508–513. [Google Scholar] [CrossRef]
  9. McMullin, T.S.; Lowe, E.R.; Bartels, M.J.; Marty, M.S. Dynamic changes in lipids and proteins of maternal, fetal, and pup blood and milk during perinatal development in CD and wistar rats. Toxicol. Sci. 2008, 105, 260–274. [Google Scholar] [CrossRef]
  10. Hu, X.-Q.; Song, R.; Zhang, L. Effect of Oxidative Stress on the Estrogen-NOS-NO-K-Ca Channel Pathway in Uteroplacental Dysfunction: Its Implication in Pregnancy Complications. Oxid. Med. Cell Longev. 2019, 2019, 9194269. [Google Scholar] [CrossRef]
  11. Spiteller, P.; Kern, W.; Reiner, J.; Spiteller, G. Aldehydic lipid peroxidation products derived from linoleic acid. Biochim. Biophys. Acta Mol. Cell Biol. Lipids 2001, 1531, 188–208. [Google Scholar] [CrossRef] [PubMed]
  12. Pereira, R.D.; De Long, N.E.; Wang, R.C.; Yazdi, F.T.; Holloway, A.C.; Raha, S. Angiogenesis in the Placenta: The Role of Reactive Oxygen Species Signaling. BioMed Res. Int. 2015, 2015, 814543. [Google Scholar] [CrossRef] [PubMed]
  13. Mor, G. Inflammation and pregnancy-The role of toll-like receptors in trophoblast-immune interaction. In Assessment of Human Reproductive Function; Bulletti, C., Guller, S., DeZiegler, D., Lockwood, C.J., Eds.; Annals of the New York Academy of Sciences: Cambridge, MA, USA, 2008; Volume 1127, pp. 121–128. [Google Scholar]
  14. Heerwagen, M.J.R.; Miller, M.R.; Barbour, L.A.; Friedman, J.E. Maternal obesity and fetal metabolic programming: A fertile epigenetic soil. Am. J. Physiol. Regul. Integr. Comp. Physiol. 2010, 299, R711–R722. [Google Scholar] [CrossRef]
  15. Challis, J.R.; Lockwood, C.J.; Myatt, L.; Norman, J.E.; Strauss, J.F., III; Petraglia, F. Inflammation and Pregnancy. Reprod. Sci 2009, 16, 206–215. [Google Scholar] [CrossRef]
  16. Jordan, S.; Tung, N.; Casanova-Acebes, M.; Chang, C.; Cantoni, C.; Zhang, D.; Wirtz, T.; Naik, S.; Rose, S.; Brocker, C.; et al. Dietary intake regulates the circulating inflammatory monocyte pool. Eur. J. Immunol. 2019, 49, 178. [Google Scholar] [CrossRef] [PubMed]
  17. Laws, J.; Amusquivar, E.; Laws, A.; Herrera, E.; Lean, I.J.; Dodds, P.F.; Clarke, L. Supplementation of sow diets with oil during gestation: Sow body condition, milk yield and milk composition. Livest. Sci. 2009, 123, 88–96. [Google Scholar] [CrossRef]
  18. Rosero, D.S.; Odle, J.; Mendoza, S.M.; Boyd, R.D.; Fellner, V.; van Heugten, E. Impact of dietary lipids on sow milk composition and balance of essential fatty acids during lactation in prolific sows. J. Anim. Sci. 2015, 93, 2935–2947. [Google Scholar] [CrossRef] [PubMed]
  19. White, C.L.; Pistell, P.J.; Purpera, M.N.; Gupta, S.; Fernandez-Kim, S.-O.; Hise, T.L.; Keller, J.N.; Ingram, D.K.; Morrison, C.D.; Bruce-Keller, A.J. Effects of high fat diet on Morris maze performance, oxidative stress, and inflammation in rats: Contributions of maternal diet. Neurobiol. Dis. 2009, 35, 3–13. [Google Scholar] [CrossRef]
  20. Jandhyala, S.M.; Talukdar, R.; Subramanyam, C.; Vuyyuru, H.; Sasikala, M.; Reddy, D.N. Role of the normal gut microbiota. World J. Gastroenterol. 2015, 21, 8787–8803. [Google Scholar] [CrossRef] [PubMed]
  21. Edwards, S.M.; Cunningham, S.A.; Dunlop, A.L.; Corwin, E.J. The maternal gut microbiome during pregnancy. MCN Am. J. Matern. Child Nurs. 2017, 42, 310–316. [Google Scholar] [CrossRef]
  22. Collado, M.C.; Isolauri, E.; Laitinen, K.; Salminen, S. Distinct composition of gut microbiota during pregnancy in overweight and normal-weight women. Am. J. Clin. Nutr. 2008, 88, 894–899. [Google Scholar] [CrossRef] [PubMed]
  23. Liu, H.; Hou, C.; Li, N.; Zhang, X.; Zhang, G.; Yang, F.; Zeng, X.; Liu, Z.; Qiao, S. Microbial and metabolic alterations in gut microbiota of sows during pregnancy and lactation. FASEB J. 2019, 33, 4490–4501. [Google Scholar] [CrossRef] [PubMed]
  24. Gohir, W.; Whelan, F.J.; Surette, M.G.; Moore, C.; Schertzer, J.D.; Sloboda, D.M. Pregnancy-related changes in the maternal gut microbiota are dependent upon the mother’s periconceptional diet. Gut. Microbes. 2015, 6, 310–320. [Google Scholar] [CrossRef] [PubMed]
  25. Hall, K.D.; Bemis, T.; Brychta, R.; Chen, K.Y.; Courville, A.; Crayner, E.J.; Goodwin, S.; Guo, J.; Howard, L.; Knuth, N.D.; et al. Calorie for Calorie, Dietary Fat Restriction Results in More Body Fat Loss than Carbohydrate Restriction in People with Obesity. Cell Metab. 2015, 22, 427–436. [Google Scholar] [CrossRef]
  26. Wang, W.; Wang, Z.; Ming, D.; Huang, C.; Xu, S.; Li, Z.; Wang, Z.; Liu, H.; Zeng, X.; Wang, F. Effect of maternal dietary starch-to-fat ratio and daily energy intake during late pregnancy on the performance and lipid metabolism of primiparous sows and newborn piglets. J. Anim. Sci. 2022, 100, skac033. [Google Scholar] [CrossRef] [PubMed]
  27. Van Soest, P.J.; Robertson, J.B.; Lewis, B.A. Methods for dietary fiber, neutral detergent fiber, and nonstarch polysaccharides in relation to animal nutrition. J. Dairy Sci. 1991, 74, 3583–3597. [Google Scholar] [CrossRef]
  28. Association of Official Analytical Chemists. Official Methods of Analysis, 18th ed.; Association of Official Analytical Chemists: Arlington, VA, USA, 2007. [Google Scholar]
  29. Adeola, O.; Lewis, A.; Southern, L. Digestion and Balance Techniques in Pigs. In Swine Nutrition, 2nd ed.; CRC Press LLC, Inc.: Boca Raton, FL, USA, 2001; Chapter 40; p. 899. [Google Scholar]
  30. Matthews, D.R.; Hosker, J.P.; Rudenski, A.S.; Naylor, B.A.; Treacher, D.F.; Turner, R.C. Homeostasis model assessment: Insulin resistance and beta-cell function from fasting plasma glucose and insulin concentrations in man. Diabetologia 1985, 28, 412–419. [Google Scholar] [CrossRef]
  31. Jin, S.S.; Jin, Y.H.; Jang, J.C.; Hong, J.S.; Jung, S.W.; Kim, Y.Y. Effects of dietary energy levels on physiological parameters and reproductive performance of gestating sows over three consecutive parities. Asian-Australas. J. Anim. Sci. 2018, 31, 410–420. [Google Scholar] [CrossRef]
  32. Noblet, J.; Etienne, M. Effect of energy-level in lactating sows on yield and composition of milk and nutrient balance of piglets. J. Anim. Sci. 1986, 63, 1888–1896. [Google Scholar] [CrossRef]
  33. Westman, E.C.; Feinman, R.D.; Mavropoulos, J.C.; Vernon, M.C.; Volek, J.S.; Wortman, J.A.; Yancy, W.S.; Phinney, S.D. Low-carbohydrate nutrition and metabolism. Am. J. Clin. Nutr. 2007, 86, 276–284. [Google Scholar] [CrossRef]
  34. Kim, J.S.; Hosseindoust, A.; Ju, I.K.; Yang, X.; Lee, S.H.; Noh, H.S.; Lee, J.H.; Chae, B.J. Effects of dietary energy levels and β-mannanase supplementation in a high mannan-based diet during lactation on reproductive performance, apparent total tract digestibility and milk composition in multiparous sows. Ital. J. Anim. Sci. 2017, 17, 128–134. [Google Scholar] [CrossRef]
  35. Yang, Y.; Hu, C.J.; Zhao, X.; Xiao, K.; Deng, M.; Zhang, L.; Qiu, X.; Deng, J.; Yin, Y.; Tan, C. Dietary energy sources during late gestation and lactation of sows: Effects on performance, glucolipid metabolism, oxidative status of sows, and their offspring1. J. Anim. Sci. 2019, 97, 4608–4618. [Google Scholar] [CrossRef]
  36. Ci, L.; Sun, H.; Huang, Y.; Guo, J.; Albrecht, E.; Zhao, R.; Yang, X. Maternal dietary fat affects the LT muscle fatty acid composition of progeny at weaning and finishing stages in pigs. Meat Sci. 2014, 96, 1141–1146. [Google Scholar] [CrossRef]
  37. Wang, Y.; Miura, Y.; Kaneko, T.; Li, J.; Qin, L.Q.; Wang, P.Y.; Matsui, H.; Sato, A. Glucose intolerance induced by a high-fat/low-carbohydrate diet in rats-Effects of nonesterified fatty acids. Endocrine 2002, 17, 185–191. [Google Scholar] [CrossRef] [PubMed]
  38. Yang, Y.; Deng, M.; Chen, J.; Zhao, X.; Xiao, K.; He, W.; Qiu, X.; Xu, Y.; Yin, Y.; Tan, C. Starch supplementation improves the reproductive performance of sows in different glucose tolerance status. Anim. Nutr. 2021, 7, 1231–1241. [Google Scholar] [CrossRef] [PubMed]
  39. O’Malley, E.G.; Reynolds, C.M.E.; Killalea, A.; O’Kelly, R.; Sheehan, S.R.; Turner, M.J. Maternal obesity and dyslipidemia associated with gestational diabetes mellitus (GDM). Eur. J. Obstet. Gynecol. Reprod. Biol. 2020, 246, 67–71. [Google Scholar] [CrossRef] [PubMed]
  40. Jin, C.; Fang, Z.; Lin, Y.; Che, L.; Wu, C.; Xu, S.; Feng, B.; Li, J.; Wu, D. Influence of dietary fat source on sow and litter performance, colostrum and milk fatty acid profile in late gestation and lactation. Anim. Sci. J. 2017, 88, 1768–1778. [Google Scholar] [CrossRef] [PubMed]
  41. Saleri, R.; Sabbioni, A.; Cavalli, V.; Superchi, P. Monitoring blood plasma leptin and lactogenic hormones in pregnant sows. Animal 2015, 9, 629–634. [Google Scholar] [CrossRef]
  42. Forhead, A.J.; Fowden, A.L. The hungry fetus? Role of leptin as a nutritional signal before birth. J. Physiol. 2009, 587, 1145–1152. [Google Scholar] [CrossRef] [PubMed]
  43. Pérez-Pérez, A.; Vilariño-García, T.; Guadix, P.; Dueñas, J.L.; Sánchez-Margalet, V. Leptin and Nutrition in Gestational Diabetes. Nutrients 2020, 12, 1970. [Google Scholar] [CrossRef]
  44. Yamauchi, T.; Kamon, J.; Minokoshi, Y.; Ito, Y.; Waki, H.; Uchida, S.; Yamashita, S.; Noda, M.; Kita, S.; Ueki, K.; et al. Adiponectin stimulates glucose utilization and fatty-acid oxidation by activating AMP-activated protein kinase. Nat. Med. 2002, 8, 1288–1295. [Google Scholar] [CrossRef] [PubMed]
  45. Arita, Y.; Kihara, S.; Ouchi, N.; Takahashi, M.; Maeda, K.; Miyagawa, J.; Hotta, K.; Shimomura, I.; Nakamura, T.; Miyaoka, K.; et al. Paradoxical decrease of an adipose-specific protein, adiponectin, in obesity. Biochem. Biophys. Res. Commun. 1999, 257, 79–83. [Google Scholar] [CrossRef] [PubMed]
  46. Zhou, Y.; Xu, T.; Cai, A.; Wu, Y.; Wei, H.; Jiang, S.; Peng, J. Excessive backfat of sows at 109 d of gestation induces lipotoxic placental environment and is associated with declining reproductive performance. J. Anim. Sci. 2018, 96, 250–257. [Google Scholar] [CrossRef] [PubMed]
  47. Feillet-Coudray, C.; Fouret, G.; Vigor, C.; Bonafos, B.; Jover, B.; Blachnio-Zabielska, A.; Rieusset, J.; Casas, F.; Gaillet, S.; Landrier, J.F.; et al. Long-Term Measures of Dyslipidemia, Inflammation, and Oxidative Stress in Rats Fed a High-Fat/High-Fructose Diet. Lipids 2019, 54, 81–97. [Google Scholar] [CrossRef]
  48. Yang, X.; Ma, X.; Wang, L.; Gao, K.; Jiang, Z. A high-fat diet expands body fat mass and up-regulates expression of genes involved in adipogenesis and inflammation in a genetically lean pig. J. Anim. Sci. 2017, 95, 223. [Google Scholar] [CrossRef]
  49. Chung, Y.L.; Lai, H.M. Molecular and granular characteristics of corn starch modified by HCl-methanol at different temperatures. Carbohydr. Polym. 2006, 63, 527–534. [Google Scholar] [CrossRef]
  50. Sandhu, K.S.; Singh, N. Some properties of corn starches II: Physicochemical, gelatinization, retrogradation, pasting and gel textural properties. Food Chem. 2007, 101, 1499–1507. [Google Scholar] [CrossRef]
  51. Yan, H.; Lu, H.; Almeida, V.V.; Ward, M.G.; Adeola, O.; Nakatsu, C.H.; Ajuwon, K.M. Effects of dietary resistant starch content on metabolic status, milk composition, and microbial profiling in lactating sows and on offspring performance. J. Anim. Physiol. Anim. Nutr. 2017, 101, 190–200. [Google Scholar] [CrossRef]
  52. Klingbeil, E.A.; Cawthon, C.; Kirkland, R.; de La Serre, C.B. Potato-Resistant Starch Supplementation Improves Microbiota Dysbiosis, Inflammation, and Gut-Brain Signaling in High Fat-Fed Rats. Nutrients 2019, 11, 2710. [Google Scholar] [CrossRef]
  53. Martínez, I.; Perdicaro, D.J.; Brown, A.W.; Hammons, S.; Carden, T.J.; Carr, T.P.; Eskridge, K.M.; Walter, J. Diet-induced alterations of host cholesterol metabolism are likely to affect the gut microbiota composition in hamsters. Appl. Environ. Microbiol. 2013, 79, 516–524. [Google Scholar] [CrossRef] [PubMed]
  54. Haenen, D.; Zhang, J.; Souza da Silva, C.; Bosch, G.; van der Meer, I.M.; van Arkel, J.; van den Borne, J.J.; Pérez Gutiérrez, O.; Smidt, H.; Kemp, B.; et al. A diet high in resistant starch modulates microbiota composition, SCFA concentrations, and gene expression in pig intestine. J. Nutr. 2013, 143, 274–283. [Google Scholar] [CrossRef] [PubMed]
  55. Gohir, W.; Kennedy, K.M.; Wallace, J.G.; Saoi, M.; Bellissimo, C.J.; Britz-McKibbin, P.; Petrik, J.J.; Surette, M.G.; Sloboda, D.M. High-fat diet intake modulates maternal intestinal adaptations to pregnancy and results in placental hypoxia, as well as altered fetal gut barrier proteins and immune markers. J. Physiol. 2019, 597, 3029–3051. [Google Scholar] [CrossRef] [PubMed]
  56. Layden, B.T.; Angueira, A.R.; Brodsky, M.; Durai, V.; Lowe, W.L., Jr. Short chain fatty acids and their receptors: New metabolic targets. Transl. Res. 2013, 161, 131–140. [Google Scholar] [CrossRef] [PubMed]
Figure 1. Effects of dietary starch-to-fat ratio on the fecal SCFAs concentrations of sows (n = 6). a,b means without common letters differ at p < 0.05.
Agriculture 13 01069 g001
Figure 2. Changes of bacterial community in the feces of sows. (A). Microbial composition at phylum level. (B) Microbial composition at genus level. (C). Differences in bacterial community structures. (D). Linear discriminant analysis coupled with effect size (LEfSe). n = 6 per group. * means the high treatment group is significant different with the low treatment group at p < 0.05.
Agriculture 13 01069 g002
Figure 3. Changes of bacterial community in the feces of newborn piglets. (A). Microbial composition at phylum level. (B) Microbial composition at genus level. (C). Differences in bacterial community structures. (D). Linear discriminant analysis coupled with effect size (LEfSe). n = 6 per group.
Agriculture 13 01069 g003
Figure 4. The differences of microbiota at family level. (A). The top 10 microbial composition at family level. (B). the relative abundance of Streptococcaceae among three treatments.
Agriculture 13 01069 g004
Table 1. Composition and nutrient content of experimental diets (%, as-fed basis).
ItemStarch-to-Fat Ratio
20:110:15:1
Ingredients
 Corn43.2053.0053.20
 Soybean meal13.1017.0014.10
 Wheat bran10.0013.0021.30
 Fish meal4.600.000.00
 Soybean oil0.002.005.60
 Corn starch25.009.000.00
 Oil powder1.002.301.30
 Limestone1.001.301.50
 Dicalcium phosphate1.101.401.00
 Salt0.300.300.30
 Vitamin and mineral premix 10.500.500.50
 Choline chloride0.200.200.20
 L-Lysine HCL0.000.001.00
Total100.00100.00100.00
Analyzed levels
 ME, MJ/kg213.9013.9213.91
 Gross energy, MJ/kg15.5415.8816.80
 Crude protein14.6814.6514.97
 Ether extract2.866.419.16
 Starch57.4550.2142.53
 Neutral detergent fiber16.1416.6116.98
 Acid detergent fiber3.725.425.37
 Calcium0.890.870.85
 Total phosphorus0.640.630.73
 Amino acids 2
  Lys0.790.730.71
  Met0.260.230.23
  Thr0.530.530.52
  Trp0.150.160.16
1 Vitamin-mineral premix supplied the following nutrients per kilogram of diet: vitamin A, 12,500 IU; vitamin D3, 1500 IU; vitamin E, 15 IU; vitamin K3, 2.0 mg; thiamine 1.0 mg, ribofla-vin 3.0 mg, pyridoxine 1.5 mg, VB12 0.015 mg, pantothenic acid 15 mg, nicotinic acid 30 mg, bi-otin 0.2 mg, folic acid 1.5 mg, Zn (ZnO) 70 mg, Fe (FeSO4·H2O) 55 mg, Mn (MnO) 12 mg, Cu (CuSO4·5H2O) 10 mg, I (KI) 0.5 mg, Se (Na2SeO3) 0.4 mg. 2 ME and AA content of the diets were calculated.
Table 2. Effects of dietary starch-to-fat ratio on performance of sows.
ItemStarch-to-Fat RatioSEMp Value
20:110:15:1
Number of sows252525
Average of parity4.54.34.6
Body weight, kg
 D 85 of gestation249.1247.2251.42.680.819
 D 107 of gestation277.8276.4282.72.740.623
 Gain during gestation28.729.231.31.110.605
 Postpartum261.2258.8254.42.580.986
Backfat thickness, mm
 D85 of gestation19.1118.0518.730.660.807
 D107 of gestation19.1719.3019.220.630.996
 Gain during gestation0.061.260.490.380.439
 Postpartum20.3618.2617.150.590.072
No. of pigs per litter
 Total piglets born15.815.816.70.350.508
 Piglets born alive14.615.114.40.300.569
 Stillbirth0.90.61.10.110.221
 Mummy0.30.10.20.060.399
Piglet birth weight1.45 a1.29 b1.35 ab0.020.010
Litter birth weight, kg21.22 a19.11 b20.81 a0.380.045
a,b means without common letters differ at p < 0.05.
Table 3. Effects of dietary starch-to-fat ratio on colostrum ingredients of sows (n = 10).
Item, %Starch-to-Fat RatioSEMp Value
20:110:15:1
 Fat5.27 b5.74 ab6.46 a0.200.046
 Protein16.6117.5516.740.370.558
 Lactose2.28 a1.78 b1.99 ab0.080.027
a,b means without common letters differ at p < 0.05.
Table 4. Effects of dietary starch-to-fat ratio on apparent total tract digestibility of nutrients in diets (n = 6).
Item, %Starch-to-Fat RatioSEMp Value
20:110:15:1
 Dry matter85.88 a82.37 b78.27 c0.008<0.001
 Crude protein85.5183.8783.980.0030.093
 Ether extracts64.9368.2261.930.0170.365
 Gross energy86.88 a83.61 b79.58 c0.008<0.001
 Neutral detergent fiber51.32 a38.59 b41.41 b0.016<0.001
 Acid detergent fiber44.62 a39.59 a20.39 b0.027<0.001
 Organic matter88.29 a85.64 b81.15 c0.008<0.001
a,b,c means without common letters differ at p < 0.05.
Table 5. Effects of dietary starch-to-fat ratio on plasma parameters of sows (n = 12).
Item, mmol/LStarch-to-Fat RatioSEMp Value
20:110:15:1
D 107 of gestation
 Total cholesterol2.53 b2.57 b3.08 a0.090.019
 Triglyceride0.62 b0.87 ab1.36 a0.100.017
 HDL-C0.640.710.680.020.299
 LDL-C1.621.581.700.040.371
 Glucose4.05 b4.18 ab4.62 a0.090.014
 NEFA, μmol/L155.19167.73165.182.340.066
 Insulin, mIU/mL24.3133.4133.531.900.072
 HOMA-IR4.38 b6.26 ab7.02 a0.530.044
 Leptin1.882.042.040.030.101
 Adiponectin1.631.681.700.030.544
Parturition
 Total cholesterol1.971.952.230.060.079
 Triglyceride0.320.360.370.020.708
 HDL-C0.490.570.60.020.077
 LDL-C1.17 b1.22 b1.41 a0.030.004
 Glucose5.115.375.350.160.782
 NEFA, μmol/L236.22 a232.72 a165.92 b6.480.001
 Insulin, mIU/mL25.0926.8328.372.130.828
 HOMA-IR5.636.066.710.460.638
 Leptin1.78 b1.84 b1.99 a0.030.008
 Adiponectin2.05 a2.08 a1.78 b0.040.012
a,b means without common letters differ at p < 0.05.
Table 6. Effects of dietary starch-to-fat ratio on parameters measured in the backfat of sows (n = 6).
ItemStarch-to-Fat RatioSEMp Value
20:110:15:1
 lipoprotein lipase (U/g)42.7048.8047.032.490.619
 Leptin (ng/mg)0.861.030.950.040.175
 Adiponectin (μg/mg)0.770.940.880.040.133
Table 7. Effects of dietary starch-to-fat ratio on plasma parameters of newborn piglets (n = 12).
Item, mmol/LStarch-to-Fat RatioSEMp Value
20:110:15:1
 Total cholesterol2.392.752.850.190.607
 Triglyceride1.211.581.610.120.350
 HDL-C0.440.540.620.050.349
 LDL-C1.461.651.730.080.281
 Glucose6.146.467.130.200.110
 NEFA, μmol/L180.28184.23190.002.740.361
 Insulin, mIU/mL47.91 ab44.55 b66.38 a4.130.039
 HOMA-IR13.14 b13.36 b21.23 a1.610.042
 Leptin1.43 b1.50 ab1.56 a0.020.033
 Adiponectin1.76 a1.67 ab1.61 b0.020.014
a,b means without common letters differ at p < 0.05.
Table 8. Effects of dietary starch-to-fat ratio on antioxidant enzymes in the plasma of sows and newborn piglets (n = 12).
ItemStarch-to-Fat RatioSEMp Value
20:110:15:1
D 107 of gestation
 T-AOC, U/mL10.3410.3110.290.180.995
 SOD, U/mL244.70232.25249.845.670.444
 GSH-Px, umol/L21.51 b25.61 a27.40 a0.610.001
 MDA, nmol/mL1.491.531.650.050.392
Parturition
 T-AOC, U/mL9.6810.0510.580.240.301
 SOD, U/mL243.20269.97245.505.450.080
 GSH-Px, umol/L26.9425.0626.810.530.282
 MDA, nmol/mL1.431.631.520.050.208
Newborn piglets
 T-AOC, U/mL10.4210.7110.310.200.740
 SOD, U/mL258.34250.69264.594.010.424
 GSH-Px, umol/L13.0213.4814.860.680.441
 MDA, nmol/mL1.511.481.370.040.355
a,b means without common letters differ at p < 0.05.
Table 9. Effects of dietary starch-to-fat ratio on inflammatory cytokines in the plasma of sows and newborn piglets (n = 12).
Item, ng/LStarch-to-Fat RatioSEMp Value
20:110:15:1
D 107 of gestation
 Interleukin-1β87.1293.0088.651.640.326
 Interleukin-644.7044.6744.200.760.957
 Interleukin-1021.3821.3221.940.330.718
 Tumor necrosis factor-α47.3949.7250.790.790.201
Parturition
 Interleukin-1β85.21 b91.24 a90.94 a1.110.039
 Interleukin-641.41 b42.29 b45.10 a0.580.022
 Interleukin-1022.4321.6121.710.360.608
 Tumor necrosis factor-α49.59 b54.83 a56.21 a0.830.001
Newborn piglets
 Interleukin-1β71.22 b75.60 ab78.04 a1.050.022
 Interleukin-633.51 b35.22 ab36.18 a0.340.003
 Interleukin-1016.3617.2617.860.300.264
 Tumor necrosis factor-α50.0949.2749.040.660.803
a,b means without common letters differ at p < 0.05.
Table 10. Effects of dietary energy intake and starch-to-fat ratio on inflammatory cytokines in the backfat of sows (n = 6).
Item, ng/LStarch-to-Fat RatioSEMp Value
20:110:15:1
D 107 of gestation
 Interleukin-1β35.86 b41.08 ab45.26 a1.620.049
 Interleukin-616.1019.2418.400.690.162
 Interleukin-108.8810.859.090.420.108
 Tumor necrosis factor-α27.2132.3530.131.290.275
a,b means without common letters differ at p < 0.05.
Table 11. Effects of dietary starch-to-fat ratio on α-diversity on fecal microbiota of sows and newborn piglets (n = 6).
ItemStarch-to-Fat Ratiop Value
20:110:15:1
Sow
 Chao14261.785347.264597.680.281
 Faith_pd142.44161.13158.730.368
 Goods_coverage0.960.950.960.343
 Observed_species3733.484459.723913.870.182
 Pielou_e0.830.840.830.423
 Shannon9.8110.209.860.082
 Simpson0.990.990.990.653
Newborn piglets
 Chao11231.971513.941042.040.402
 Faith_pd682.00194.83162.290.291
 Goods_coverage0.990.990.990.135
 Observed_species1114.271293.00893.600.423
 Pielou_e0.630.630.480.476
 Shannon6.386.504.780.532
 Simpson0.870.930.730.470
Disclaimer/Publisher’s Note: The statements, opinions and data contained in all publications are solely those of the individual author(s) and contributor(s) and not of MDPI and/or the editor(s). MDPI and/or the editor(s) disclaim responsibility for any injury to people or property resulting from any ideas, methods, instructions or products referred to in the content.

