
Proper Delay of Phosphorus Application Promotes Wheat Growth and Nutrient Uptake under Low Phosphorus Condition
 ,
,
Abstract
:1. Introduction
2. Materials and Methods
2.1. Experimental Set-Up
2.2. Harvest and Measurements
2.3. Soil Phosphatase Collection
2.4. Calculations and Statistics
3. Results
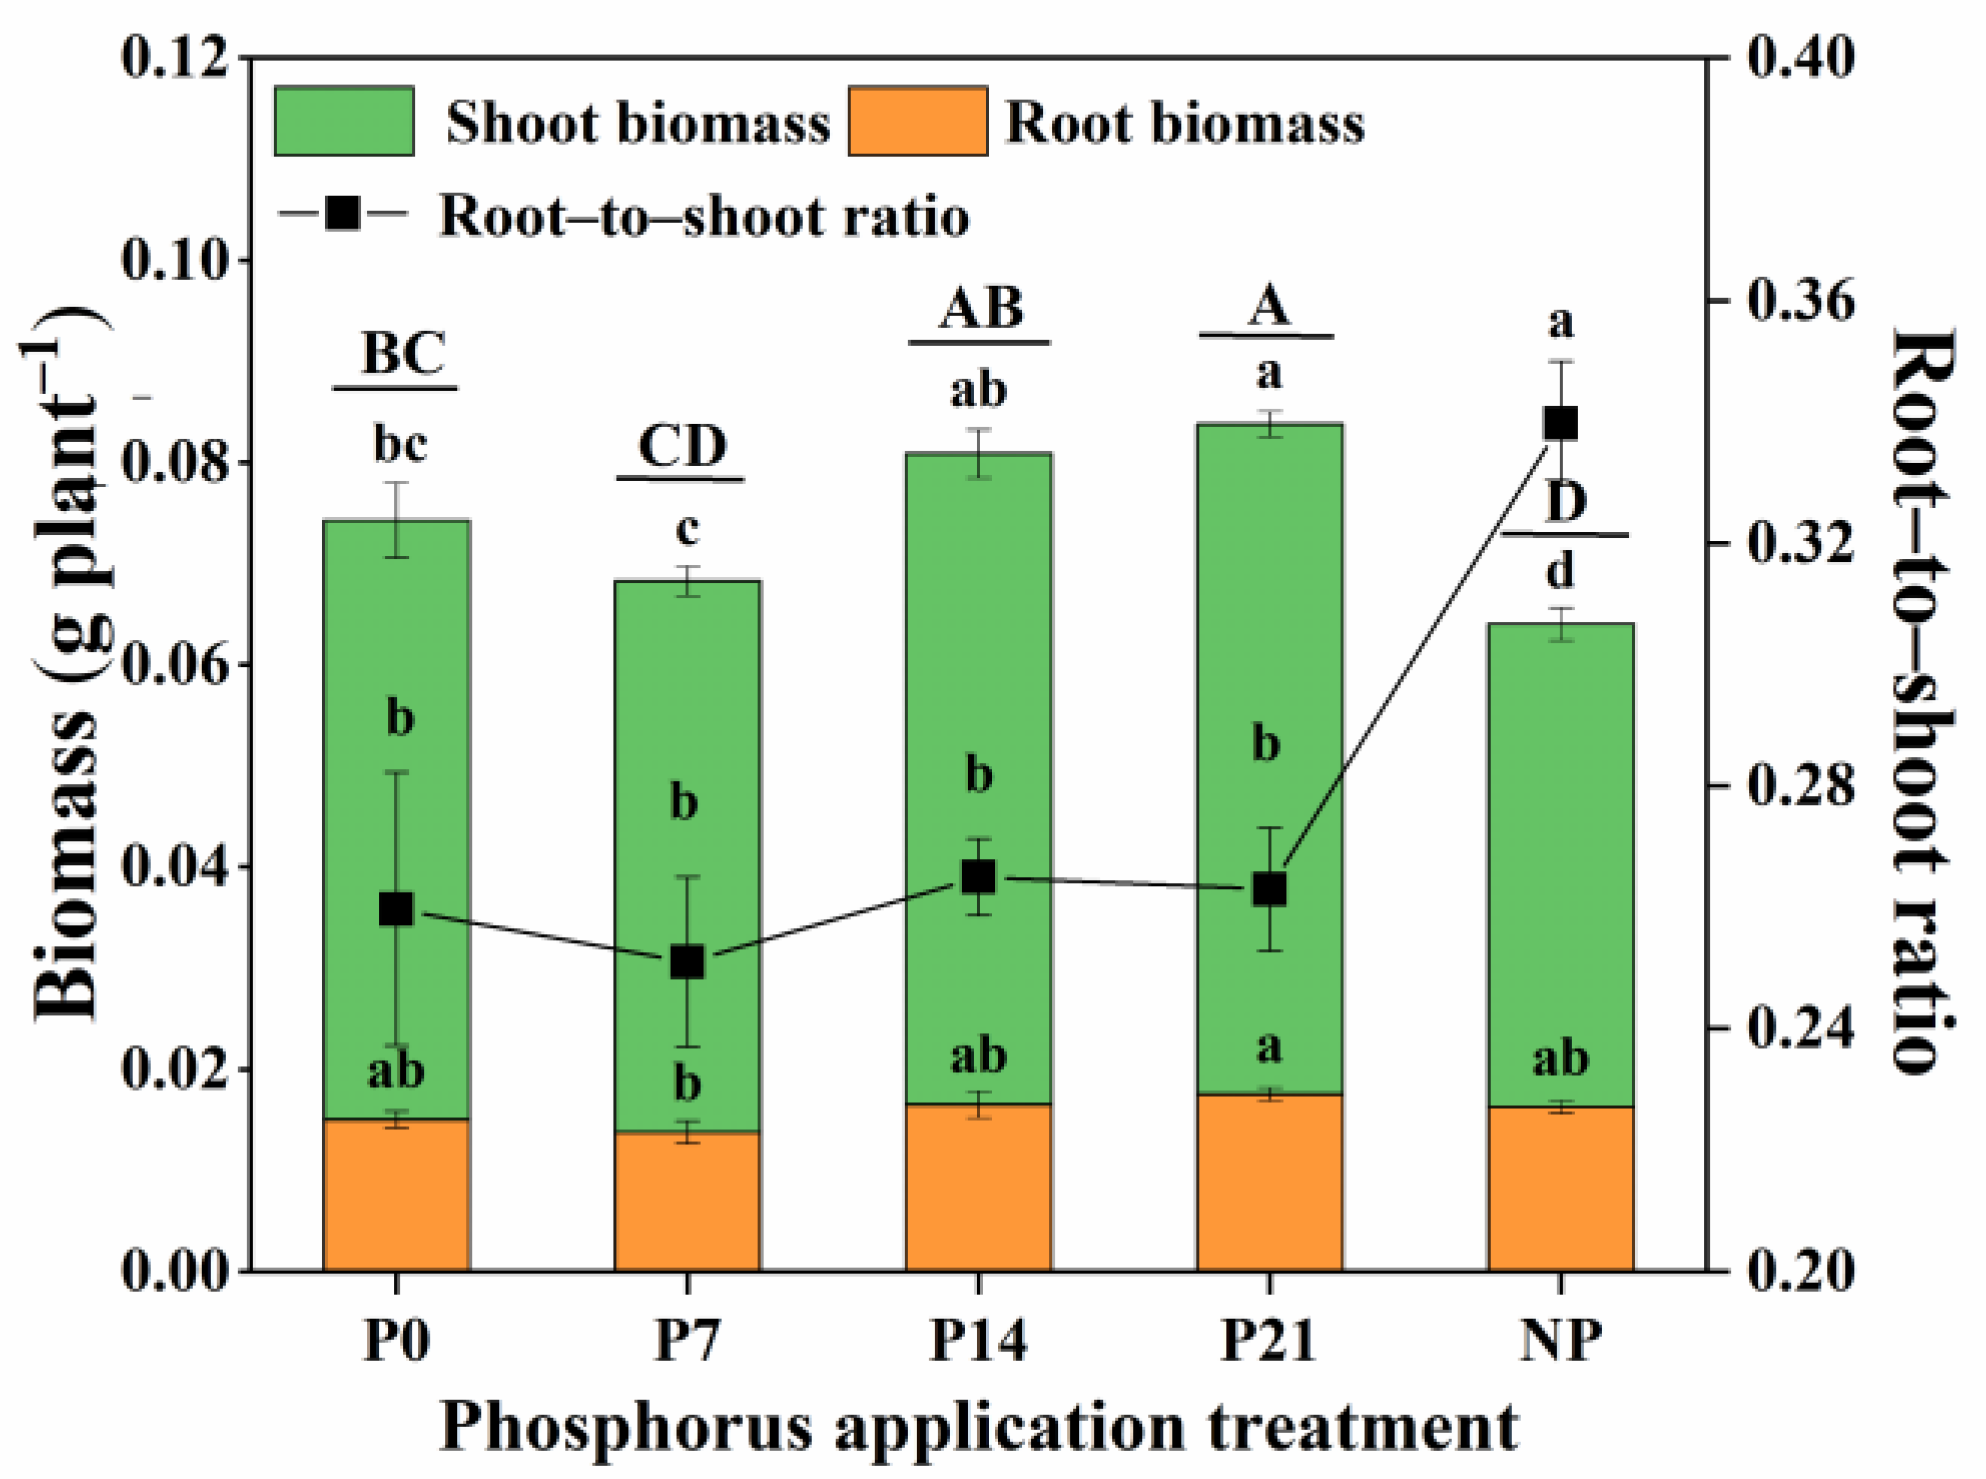
3.1. Plant Growth
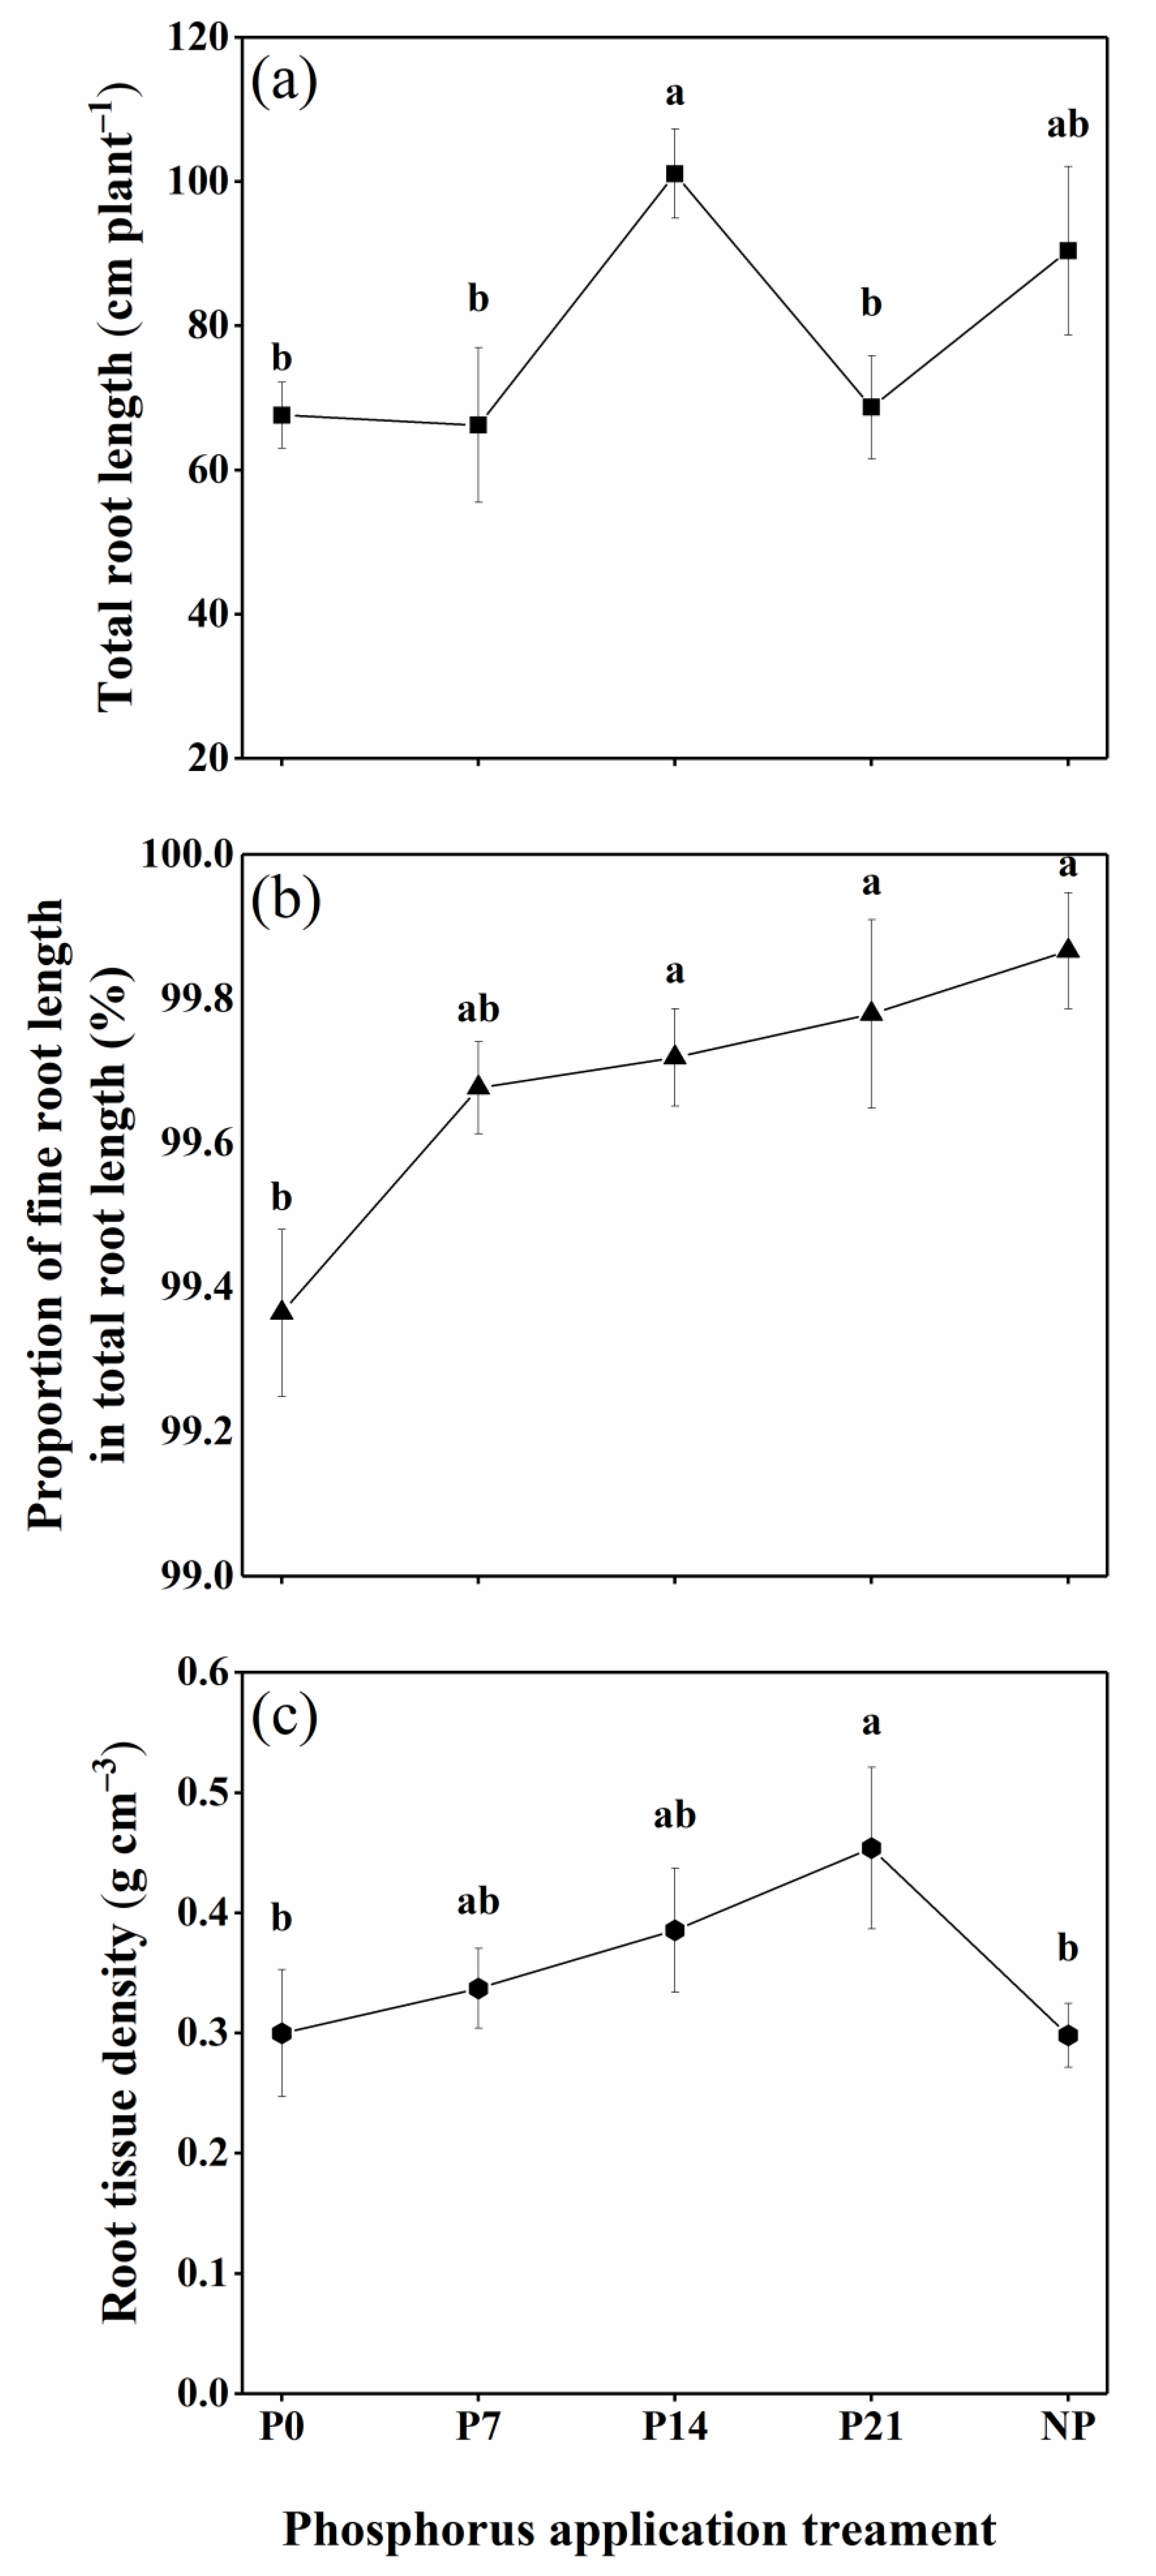
3.2. Root Morphology
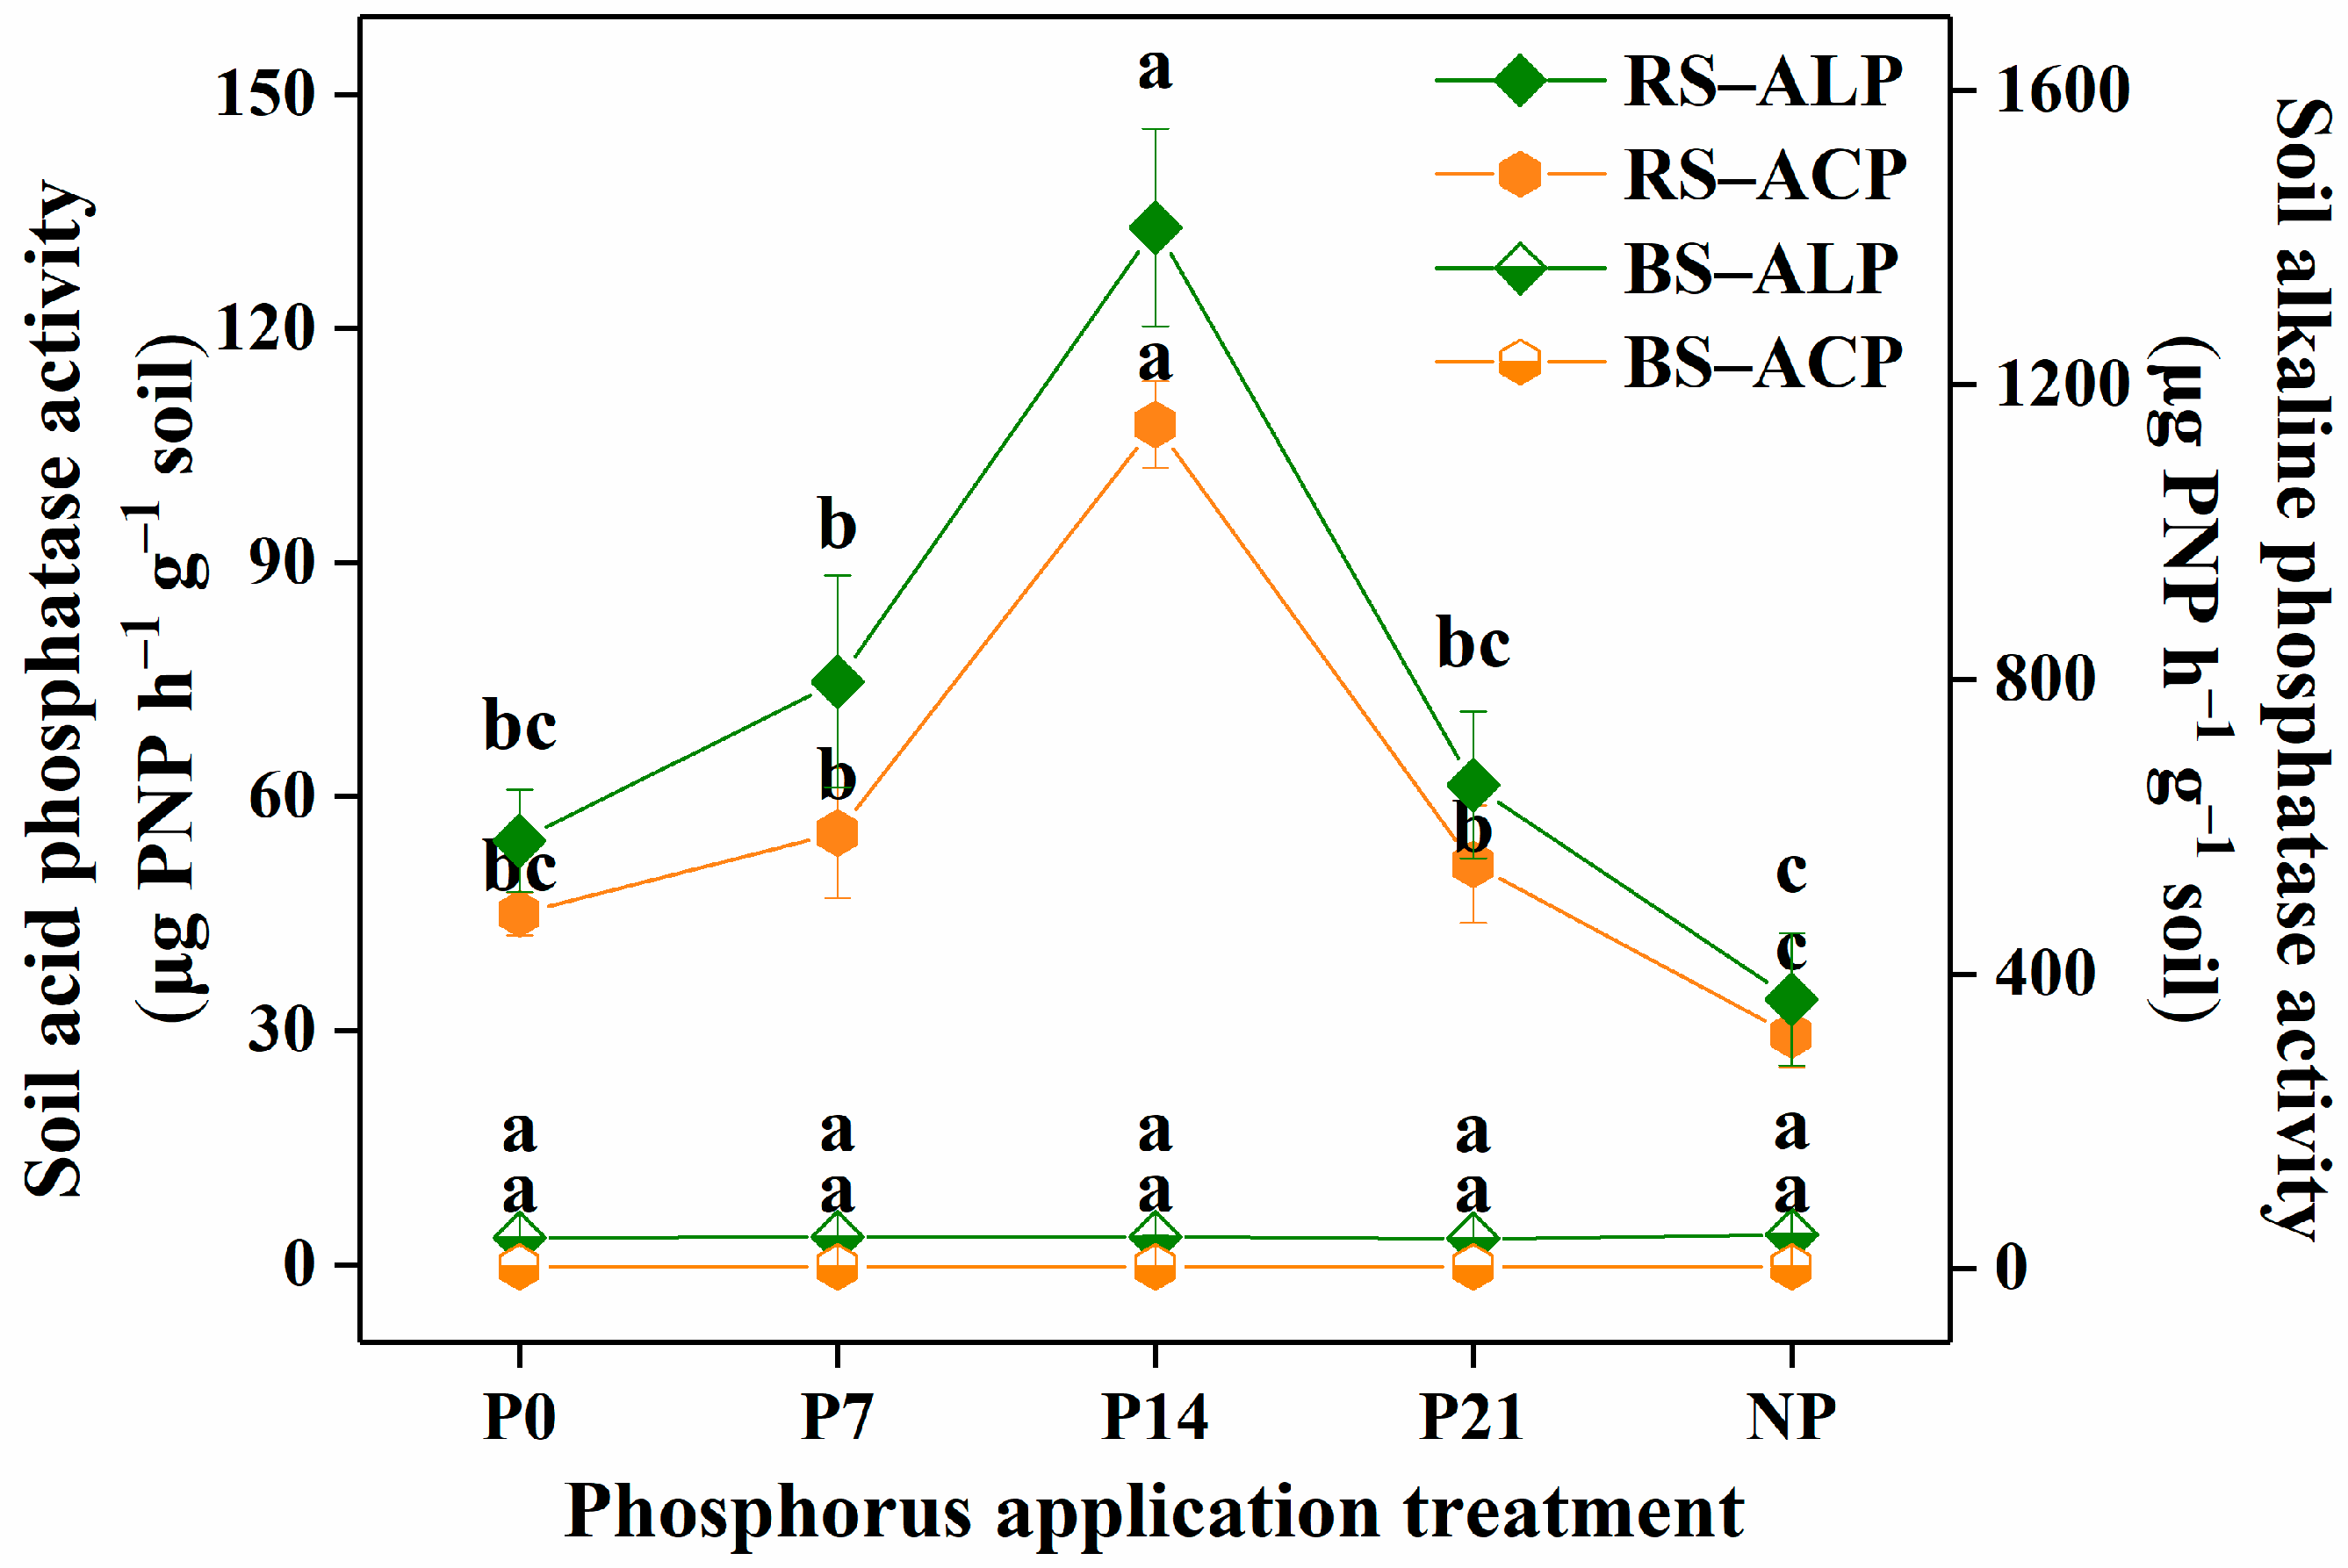
3.3. Soil Phosphatase Activity
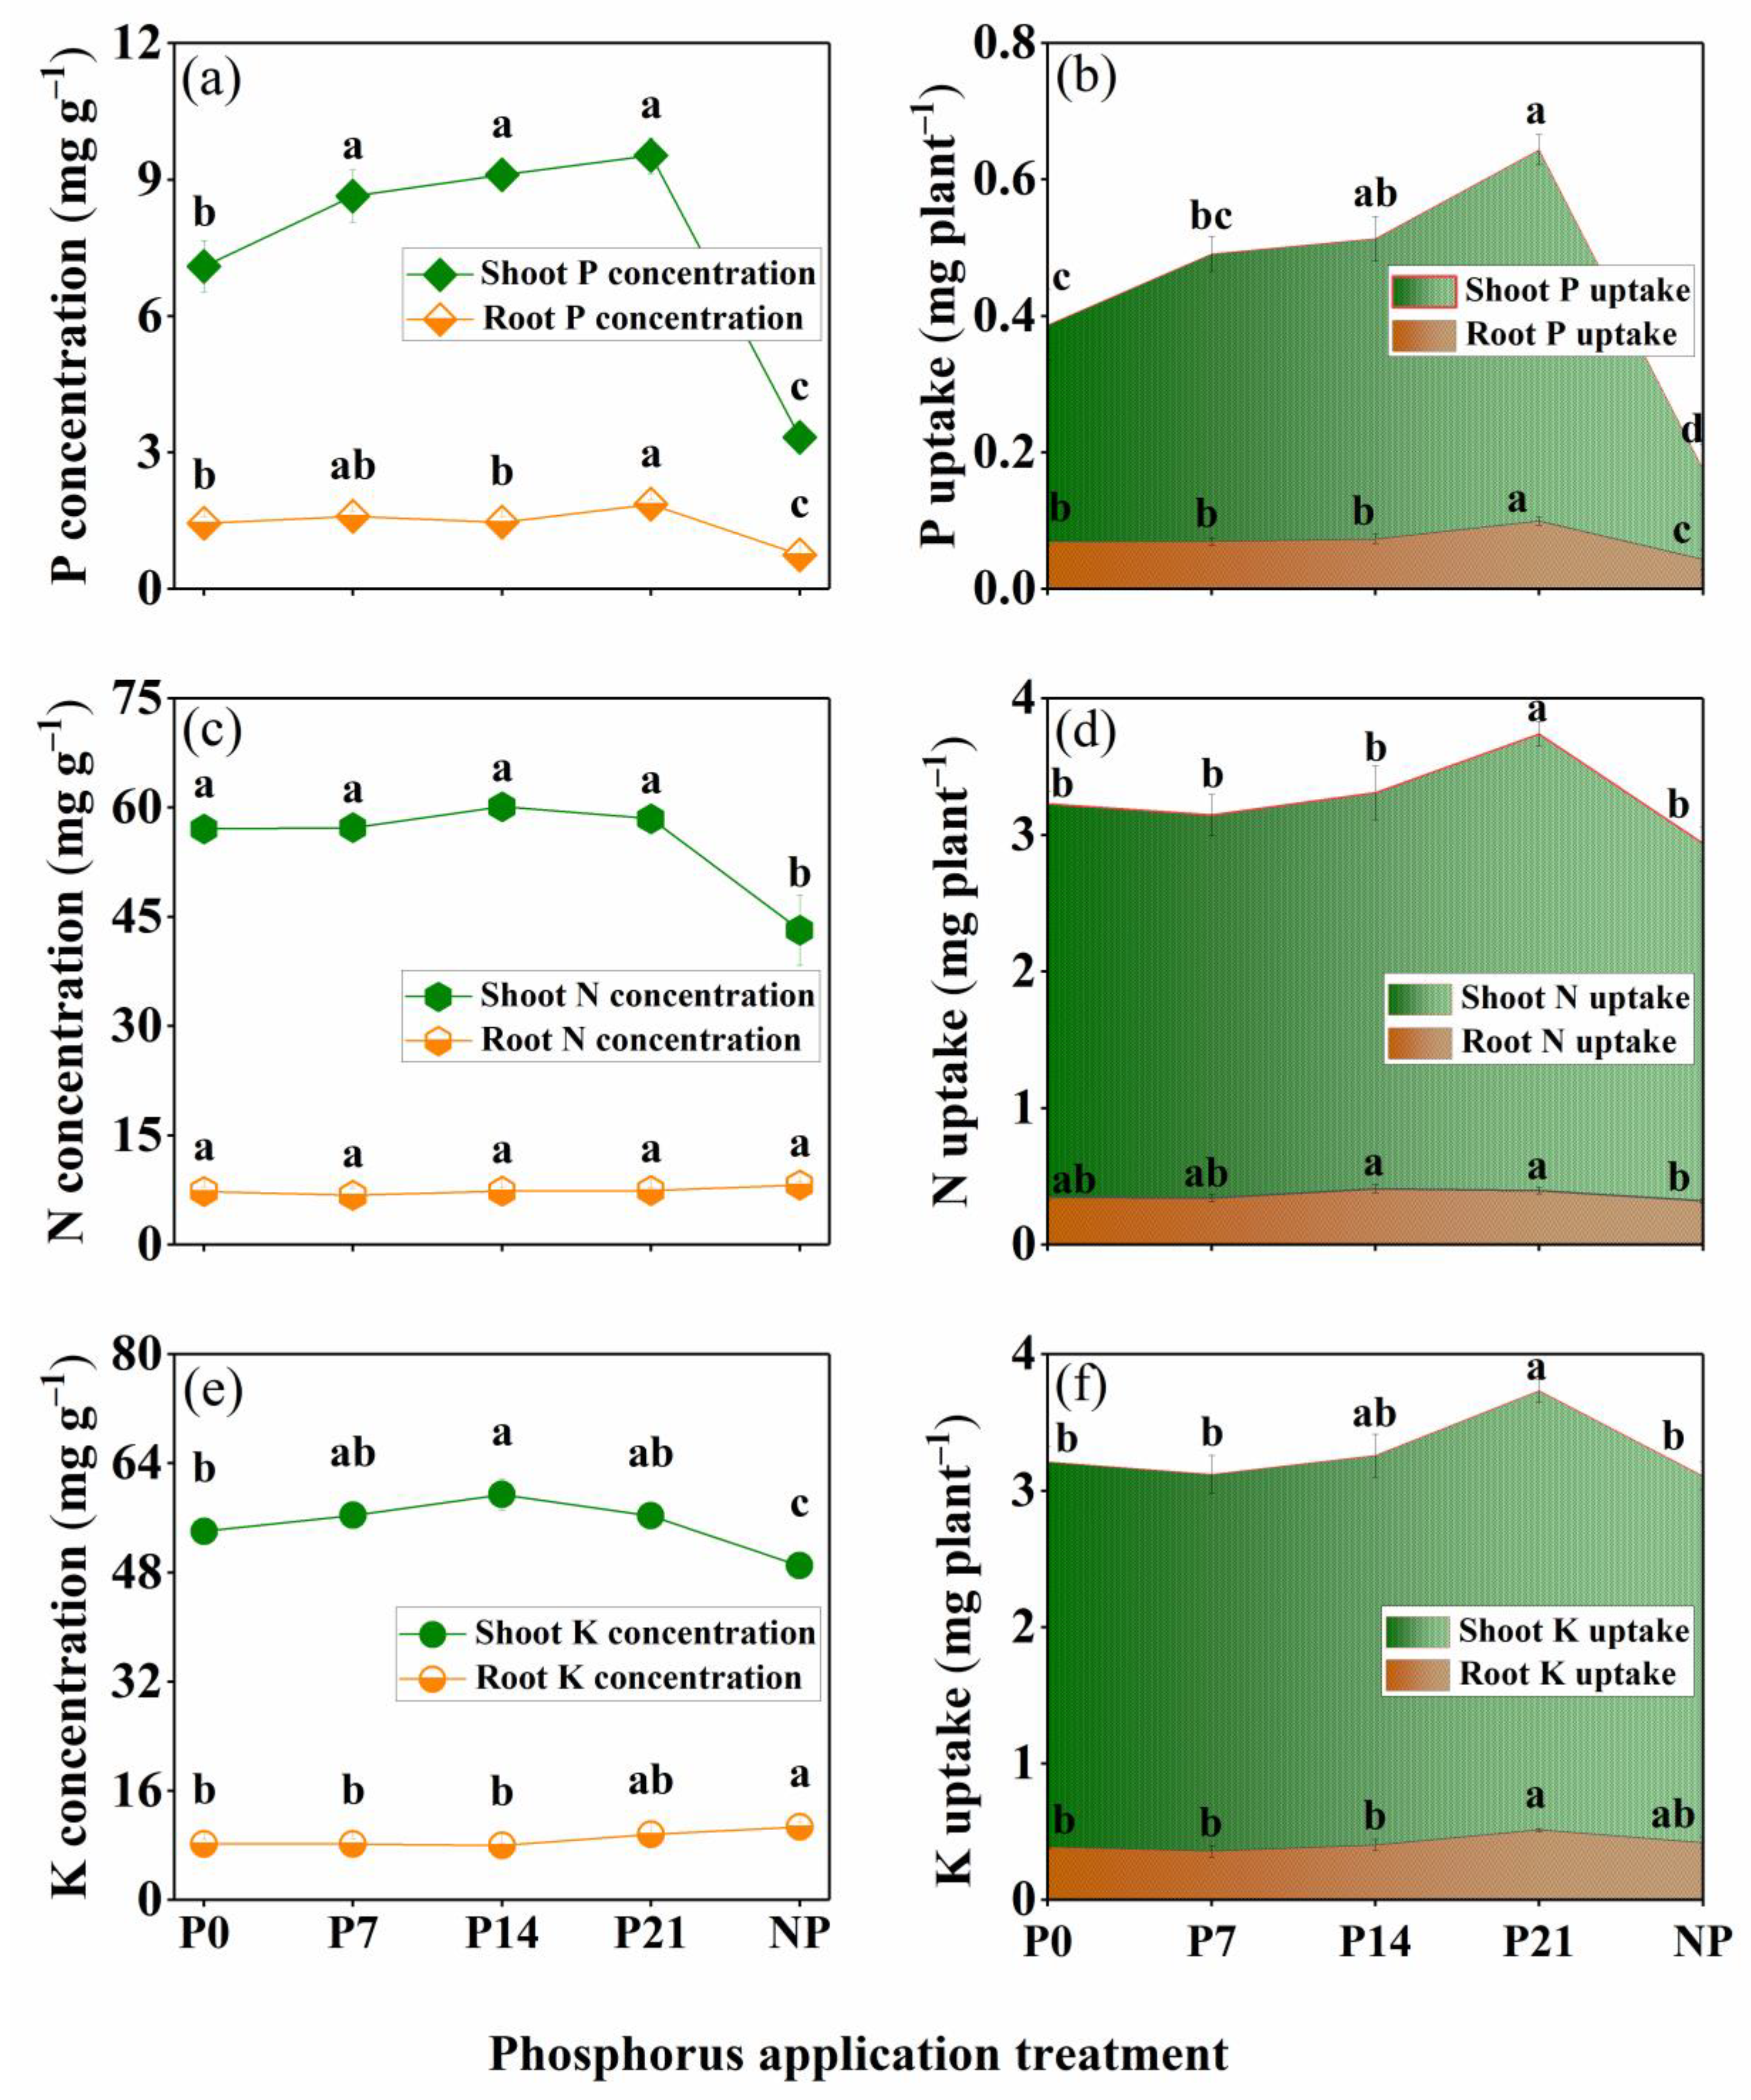
3.4. Nutrient Uptake
3.4.1. P Uptake
3.4.2. N Uptake
3.4.3. K Uptake
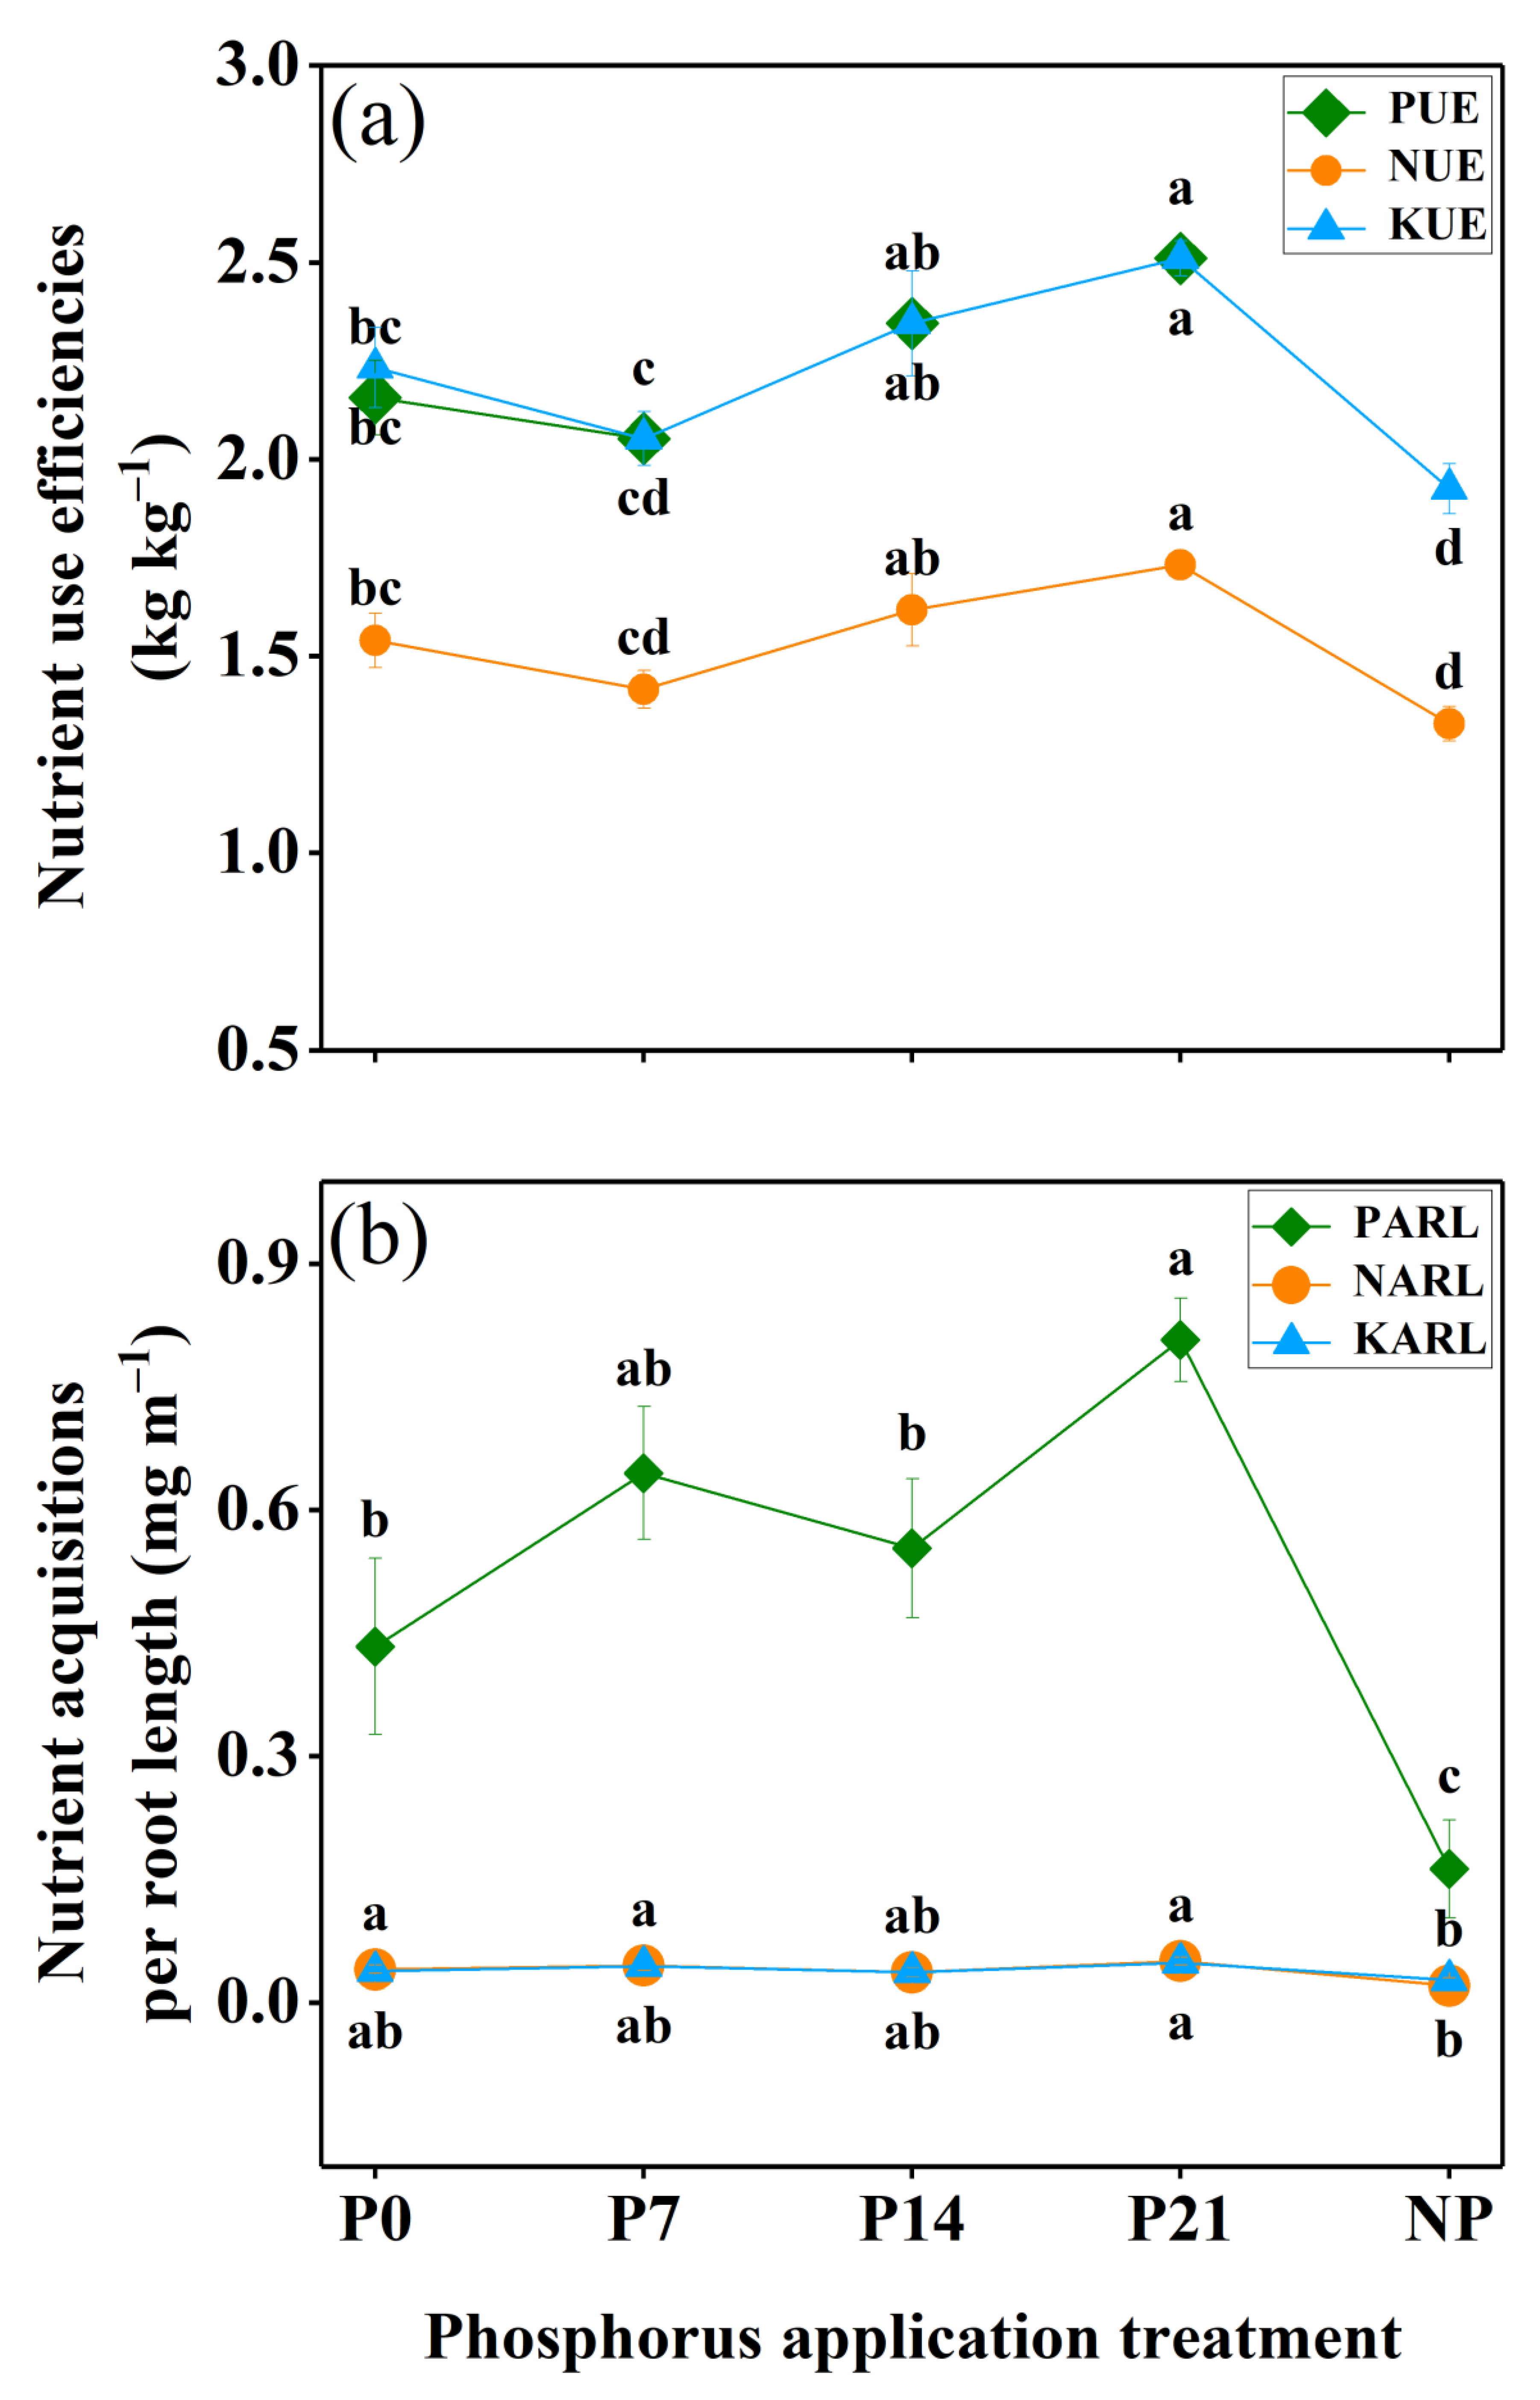
3.5. Nutrient Utilization
4. Discussion
4.1. Plant Growth
4.1.1. Plant Biomass and the Root-to-Shoot Ratio
4.1.2. Root Morphology
4.1.3. Soil Phosphatase Activity
4.2. Nutrient Uptake as Affected by P Application Time
4.3. Nutrient Utilization as Affected by P Application Time
5. Conclusions
Supplementary Materials
Author Contributions
Funding
Institutional Review Board Statement
Data Availability Statement
Acknowledgments
Conflicts of Interest
References
- Ashley, K.; Cordell, D.; Mavinic, D. A brief history of phosphorus: From the philosopher’s stone to nutrient recovery and reuse. Chemosphere 2011, 84, 737–746. [Google Scholar] [CrossRef]
- Amtmann, A.; Hammond, J.P.; Armengaud, P.; White, P.J. Nutrient Sensing and Signalling in Plants: Potassium and Phosphorus. In Advances in Botanical Research; Academic Press: New York, NY, USA, 2005; pp. 209–257. [Google Scholar]
- Lopez-Arredondo, D.L.; Leyva-Gonzalez, M.A.; Gonzalez-Morales, S.I.; Lopez-Bucio, J.; Herrera-Estrella, L. Phosphate nutrition: Improving low-phosphate tolerance in crops. Annu. Rev. Plant Biol. 2014, 65, 95–123. [Google Scholar] [CrossRef]
- Malhotra, H.; Vandana; Sharma, S.; Pandey, R. Phosphorus Nutrition-plant Growth in Response to Deficiency and Excess. In Plant Nutrients and Abiotic Stress Tolerance; Springer: Singapore, 2018; pp. 171–190. [Google Scholar]
- Ojeda-Rivera, J.O.; Alejo-Jacuinde, G.; Najera-Gonzalez, H.R.; Lopez-Arredondo, D. Prospects of genetics and breeding for low-phosphate tolerance: An integrated approach from soil to cell. Theor. Appl. Genet. 2022, 135, 4125–4150. [Google Scholar] [CrossRef] [PubMed]
- Song, T.; Xu, F.; Yuan, W.; Chen, M.; Hu, Q.; Tian, Y.; Zhang, J.; Xu, W. Combining alternate wetting and drying irrigation with reduced phosphorus fertilizer application reduces water use and promotes phosphorus use efficiency without yield loss in rice plants. Agr. Water Manag. 2019, 223, 105686. [Google Scholar] [CrossRef]
- Yu, X.; Keitel, C.; Dijkstra, F.A. Global analysis of phosphorus fertilizer use efficiency in cereal crops. Glob. Food Secur.-Agr. 2021, 29, 100545. [Google Scholar] [CrossRef]
- Shen, Q.; Wen, Z.H.; Dong, Y.; Li, H.G.; Miao, Y.X.; Shen, J.B. The responses of root morphology and phosphorus-mobilizing exudations in wheat to increasing shoot phosphorus concentration. Aob. Plants 2018, 10, ply054. [Google Scholar] [CrossRef]
- Liu, H.T.; White, P.J.; Li, C.J. Biomass partitioning and rhizosphere responses of maize and faba bean to phosphorus deficiency. Crop Pasture Sci. 2016, 67, 847–856. [Google Scholar] [CrossRef]
- Wen, Z.; Li, H.; Shen, Q.; Tang, X.; Xiong, C.; Li, H.; Pang, J.; Ryan, M.H.; Lambers, H.; Shen, J. Tradeoffs among root morphology, exudation and mycorrhizal symbioses for phosphorus-acquisition strategies of 16 crop species. New Phytol. 2019, 223, 882–895. [Google Scholar] [CrossRef] [PubMed]
- Liu, D. Root developmental responses to phosphorus nutrition. J. Integr. Plant Biol. 2021, 63, 1065–1090. [Google Scholar] [CrossRef]
- Gordon, W.S.; Jackson, R.B. Nutrient concentrations in fine roots. Ecology 2000, 81, 275–280. [Google Scholar] [CrossRef]
- Yuan, Z.Y.; Chen, H.Y. A global analysis of fine root production as affected by soil nitrogen and phosphorus. Proc. R. Soc. B Biol. Sci. 2012, 279, 3796–3802. [Google Scholar] [CrossRef]
- Wen, Z.H.; Li, H.G.; Shen, J.B.; Rengel, Z. Maize responds to low shoot P concentration by altering root morphology rather than increasing root exudation. Plant Soil. 2017, 416, 377–389. [Google Scholar] [CrossRef]
- Wen, Z.; White, P.J.; Shen, J.; Lambers, H. Linking root exudation to belowground economic traits for resource acquisition. New Phytol. 2022, 233, 1620–1635. [Google Scholar] [CrossRef] [PubMed]
- Bergmann, J.; Weigelt, A.; Plas, F.V.D.; Laughlin, D.C.; Kuyper, T.W.; Guerrero-Ramirez, N.; Valverde-Barrantes, O.J.; Bruelheide, H.; Freschet, G.T.; Iversen, C.M.; et al. The fungal collaboration gradient dominates the root economics space in plants. Sci. Adv. 2020, 6, eaba3756. [Google Scholar] [CrossRef] [PubMed]
- Kitajima, K.; Poorter, L. Tissue-level leaf toughness, but not lamina thickness, predicts sapling leaf lifespan and shade tolerance of tropical tree species. New Phytol. 2010, 186, 708–721. [Google Scholar] [CrossRef] [PubMed]
- Liu, J.; Ma, Q.; Hui, X.; Ran, J.; Ma, Q.; Wang, X.; Wang, Z. Long-term high-P fertilizer input decreased the total bacterial diversity but not phoD-harboring bacteria in wheat rhizosphere soil with available-P deficiency. Soil Biol. Biochem. 2020, 149, 107918. [Google Scholar] [CrossRef]
- Lu, J.L.; Jia, P.; Feng, S.W.; Wang, Y.T.; Zheng, J.; Ou, S.N.; Wu, Z.H.; Liao, B.; Shu, W.S.; Liang, J.L.; et al. Remarkable effects of microbial factors on soil phosphorus bioavailability: A country-scale study. Glob. Chang. Biol. 2022, 28, 4459–4471. [Google Scholar] [CrossRef]
- Nannipieri, P.; Giagnoni, L.; Landi, L.; Renella, G. Role of Phosphatase Enzymes in Soil. In Phosphorus in Action; Springer: Berlin/Heidelberg, Germany, 2011; pp. 215–243. [Google Scholar]
- Hebrien, S.A.; Neal, J.L. Soil pH and phosphatase activity. Commun. Soil Sci. Plant Anal. 1990, 21, 439–456. [Google Scholar]
- Acuña, J.J.; Ogram, A.; Durán, P.; Lagos, L.M.; Mora, M.D.L.L.; Jorquera, M.A. Bacterial alkaline phosphomonoesterase in the rhizospheres of plants grown in Chilean extreme environments. Biol. Fert. Soils 2016, 52, 763–773. [Google Scholar] [CrossRef]
- Delgado-Baquerizo, M.; Maestre, F.T.; Gallardo, A.; Bowker, M.A.; Wallenstein, M.D.; Quero, J.L.; Ochoa, V.; Gozalo, B.; Garcia-Gomez, M.; Soliveres, S.; et al. Decoupling of soil nutrient cycles as a function of aridity in global drylands. Nature 2013, 502, 672–676. [Google Scholar] [CrossRef]
- Bergkemper, F.; Schoeler, A.; Engel, M.; Lang, F.; Krueger, J.; Schloter, M.; Schulz, S. Phosphorus depletion in forest soils shapes bacterial communities towards phosphorus recycling systems. Environ. Microbiol. 2016, 18, 1988–2000. [Google Scholar] [CrossRef] [PubMed]
- Luo, G.; Ling, N.; Nannipieri, P.; Chen, H.; Raza, W.; Wang, M.; Guo, S.; Shen, Q. Long-term fertilisation regimes affect the composition of the alkaline phosphomonoesterase encoding microbial community of a vertisol and its derivative soil fractions. Biol. Fert. Soils 2017, 53, 375–388. [Google Scholar] [CrossRef]
- Chen, X.; Jiang, N.; Condron, L.M.; Dunfield, K.E.; Chen, Z.; Wang, J.; Chen, L. Impact of long-term phosphorus fertilizer inputs on bacterial phoD gene community in a maize field, Northeast China. Sci. Total Environ. 2019, 669, 1011–1018. [Google Scholar] [CrossRef] [PubMed]
- Wei, X.; Hu, Y.; Razavi, B.S.; Zhou, J.; Shen, J.; Nannipieri, P.; Wu, J.; Ge, T. Rare taxa of alkaline phosphomonoesterase-harboring microorganisms mediate soil phosphorus mineralization. Soil. Biol. Biochem. 2019, 131, 62–70. [Google Scholar] [CrossRef]
- Zhang, D.; Zhang, C.; Tang, X.; Li, H.; Zhang, F.; Rengel, Z.; Whalley, W.R.; Davies, W.J.; Shen, J. Increased soil phosphorus availability induced by faba bean root exudation stimulates root growth and phosphorus uptake in neighbouring maize. New Phytol. 2016, 209, 823–831. [Google Scholar] [CrossRef]
- Römer, W.; Schilling, G. Phosphorus requirements of the wheat plant in various stages of its life cycle. Plant Soil. 1986, 91, 221–229. [Google Scholar] [CrossRef]
- Grant, C.A.; Flaten, D.N.; Tomasiewicz, D.J.; Sheppard, S.C. The importance of early season phosphorus nutrition. Can. J. Plant Sci. 2001, 81, 211–224. [Google Scholar] [CrossRef]
- Slaton, N.A.; Wilson, C.E.; Norman, R.J.; Ntamatungiro, S.; Frizzell, D.L. Rice response to phosphorus fertilizer application rate and timing on alkaline soils in Arkansas. Agron. J. 2002, 94, 1393–1399. [Google Scholar] [CrossRef]
- Nadeem, M.; Mollier, A.; Morel, C.; Vives, A.; Prud’homme, L.; Pellerin, S. Relative contribution of seed phosphorus reserves and exogenous phosphorus uptake to maize (Zea mays L.) nutrition during early growth stages. Plant Soil. 2011, 346, 231–244. [Google Scholar] [CrossRef]
- Rideout, J.W.; Gooden, D.T. Effects of starter fertilizer, granular phosphorus fertilizer, time of fertilization, and seedling phosphorus concentration on flue-cured tobacco growth and nutrition. Tob. Regul. Sci. 2000, 44, 19–26. [Google Scholar] [CrossRef]
- Duijnen, R.; Uther, H.; Härdtle, W.; Temperton, V.M.; Kumar, A. Timing matters: Distinct effects of nitrogen and phosphorus fertilizer application timing on root system architecture responses. Plant-Environ. Interact. 2021, 2, 194–205. [Google Scholar] [CrossRef]
- Pansu, M.; Gautheyrou, J. Inorganic Analysis. In Handbook of Soil Analysis: Mineralogical, Organic and Inorganic Methods; Springer: Berlin/Heidelberg, Germany, 2006; pp. 551–974. [Google Scholar]
- Freschet, G.T.; Pages, L.; Iversen, C.M.; Comas, L.H.; Rewald, B.; Roumet, C.; Klimesova, J.; Zadworny, M.; Poorter, H.; Postma, J.A.; et al. A starting guide to root ecology: Strengthening ecological concepts and standardising root classification, sampling, processing and trait measurements. New Phytol. 2021, 232, 973–1122. [Google Scholar] [CrossRef]
- Westerman, R.L. Soil Testing and Plant Analysis. In Soil Testing and Plant Analysis, 3rd ed.; Soil Science Society of America: Madison, WI, USA, 1991; pp. 217–264. [Google Scholar]
- Alvey, S.; Bagayoko, M.; Neumann, G.; Buerkert, A. Cereal legume rotations affect chemical properties and biological activities in two West African soils. Plant Soil. 2001, 231, 45–54. [Google Scholar] [CrossRef]
- Neumann, G. Quantitative Determination of Acid Phosphatase Activity in the Rhizosphere and on the Root Surface. In Handbook of Methods Used in Rhizosphere Research; Swiss Federal Research Institute WSL: Birmensdorf, The Switzerland, 2006; pp. 79–85. [Google Scholar]
- Gu, R.; Chen, F.; Long, L.; Cai, H.; Liu, Z.; Yang, J.; Wang, L.; Li, H.; Li, J.; Liu, W.; et al. Enhancing phosphorus uptake efficiency through QTL-based selection for root system architecture in maize. J. Genet. Genom. 2016, 43, 663–672. [Google Scholar] [CrossRef] [PubMed]
- Weih, M.; Hamnér, K.; Pourazari, F. Analyzing plant nutrient uptake and utilization efficiencies: Comparison between crops and approaches. Plant Soil. 2018, 430, 7–21. [Google Scholar] [CrossRef]
- Balemi, T.; Negisho, K. Management of soil phosphorus and plant adaptation mechanisms to phosphorus stress for sustainable crop production: A review. J. Soil. Sci. Plant Nut. 2012, 12, 547–561. [Google Scholar] [CrossRef]
- Carstensen, A.; Szameitat, A.E.; Frydenvang, J.; Husted, S. Chlorophyll a fluorescence analysis can detect phosphorus deficiency under field conditions and is an effective tool to prevent grain yield reductions in spring barley (Hordeum vulgare L.). Plant Soil. 2019, 434, 79–91. [Google Scholar] [CrossRef]
- Hou, E.; Luo, Y.; Kuang, Y.; Chen, C.; Lu, X.; Jiang, L.; Luo, X.; Wen, D. Global meta-analysis shows pervasive phosphorus limitation of aboveground plant production in natural terrestrial ecosystems. Nat. Commun. 2020, 11, 637. [Google Scholar] [CrossRef] [PubMed]
- Ven, A.; Verlinden, M.S.; Verbruggen, E.; Vicca, S.; Hart, M. Experimental evidence that phosphorus fertilization and arbuscular mycorrhizal symbiosis can reduce the carbon cost of phosphorus uptake. Funct. Ecol. 2019, 33, 2215–2225. [Google Scholar] [CrossRef]
- Mollier, A.; Pellerin, S. Maize root system growth and development as influenced by phosphorus deficiency. J. Exp. Bot. 1999, 50, 487–497. [Google Scholar] [CrossRef]
- Zhang, Y.; Yu, P.; Peng, Y.F.; Li, X.X.; Chen, F.J.; Li, C.J. Fine root patterning and balanced inorganic phosphorus distribution in the soil indicate distinctive adaptation of maize plants to phosphorus deficiency. Pedosphere 2012, 22, 870–877. [Google Scholar] [CrossRef]
- Yuan, H.M.; Blackwell, M.; McGrath, S.; George, T.S.; Granger, S.J.; Hawkins, J.M.B.; Dunham, S.; Shen, J.B. Morphological responses of wheat (Triticum aestivum L.) roots to phosphorus supply in two contrasting soils. J. Agr. Sci. 2016, 154, 98–108. [Google Scholar] [CrossRef]
- Kramer-Walter, K.R.; Bellingham, P.J.; Millar, T.R.; Smissen, R.D.; Richardson, S.J.; Laughlin, D.C.; Mommer, L. Root traits are multidimensional: Specific root length is independent from root tissue density and the plant economic spectrum. J. Ecol. 2016, 104, 1299–1310. [Google Scholar] [CrossRef]
- Brinch-Pedersen, H.; Sørensen, L.D.; Holm, P.B. Engineering crop plants-getting a handle on phosphate. Trends Plant Sci. 2002, 7, 118–125. [Google Scholar] [CrossRef] [PubMed]
- Tarafdar, J.C.; Jungk, A. Phosphatase activity in the rhizosphere and its relation to the depletion of soil organic phosphorus. Biol. Fert. Soils 1987, 3, 199–204. [Google Scholar] [CrossRef]
- Joshi, S.R.; Morris, J.W.; Tfaily, M.M.; Young, R.P.; McNear, D.H. Low soil phosphorus availability triggers maize growth stage specific rhizosphere processes leading to mineralization of organic P. Plant Soil. 2021, 459, 423–440. [Google Scholar] [CrossRef]
- Lambers, H.; Shane, M.W.; Cramer, M.D.; Pearse, S.J.; Veneklaas, E.J. Root structure and functioning for efficient acquisition of phosphorus: Matching morphological and physiological traits. Ann. Bot. 2006, 98, 693–713. [Google Scholar] [CrossRef]
- Qiu, H.; Liu, C.; Yu, T.; Mei, X.; Wang, G.; Wang, J.; Cai, Y. Identification of QTL for acid phosphatase activity in root and rhizosphere soil of maize under low phosphorus stress. Euphytica 2014, 197, 133–143. [Google Scholar] [CrossRef]
- Razavi, B.S.; Zarebanadkouki, M.; Blagodatskaya, E.; Kuzyakov, Y. Rhizosphere shape of lentil and maize: Spatial distribution of enzyme activities. Soil. Biol. Biochem. 2016, 96, 229–237. [Google Scholar] [CrossRef]
- Boeye, D.; Verhagen, B.; Haesebroeck, V.V.; El-Kahloun, M. Phosphorus fertilization in a phosphorus-limited fen: Effects of timing. Appl. Veg. Sci. 1999, 2, 71–78. [Google Scholar] [CrossRef]
- Zavisic, A.; Yang, N.; Marhan, S.; Kandeler, E.; Polle, A. Forest soil phosphorus resources and fertilization affect ectomycorrhizal community composition, beech P uptake efficiency, and photosynthesis. Front. Plant Sci. 2018, 9, 463. [Google Scholar] [CrossRef]
- Graciano, C.; Goya, J.F.; Frangi, J.L.; Guiamet, J.J. Fertilization with phosphorus increases soil nitrogen absorption in young plants of Eucalyptus grandis. Forest Ecol. Manag. 2006, 236, 202–210. [Google Scholar] [CrossRef]
- Mariotte, P.; Cresswell, T.; Johansen, M.P.; Harrison, J.J.; Keitel, C.; Dijkstra, F.A. Plant uptake of nitrogen and phosphorus among grassland species affected by drought along a soil available phosphorus gradient. Plant Soil. 2020, 448, 121–132. [Google Scholar] [CrossRef]
- Islam, M.A.; Islam, M.R.; Sarke, A.B.S. Effect of phosphorus on nutrient uptake of japonica and indica rice. J. Agric. Rural Dev. 2008, 6, 7–12. [Google Scholar] [CrossRef]
- Schjørring, J.K. Nitrate and Ammonium Absorption by Plants growing at A Sufficient or Insufficient Level of Phosphorus in Nutrient Solutions. In Fundamental, Ecological and Agricultural Aspects of Nitrogen Metabolism in Higher Plants; Springer: Dordrecht, The Netherlands, 1986; pp. 53–58. [Google Scholar]
- Tairo, E.V.; Ndakidemi, P.A. Macronutrients uptake in soybean as affected by bradyrhizobium japonicum inoculation and phosphorus (P) supplements. Am. J. Plant Sci. 2014, 5, 488–496. [Google Scholar] [CrossRef]
- Meng, X.; Chen, W.W.; Wang, Y.Y.; Huang, Z.R.; Ye, X.; Chen, L.S.; Yang, L.T. Effects of phosphorus deficiency on the absorption of mineral nutrients, photosynthetic system performance and antioxidant metabolism in Citrus grandis. PloS ONE 2021, 16, 0146944. [Google Scholar] [CrossRef]
- Mitran, T.; Meena, R.S.; Lal, R.; Layek, J.; Kumar, S.; Datta, R. Role of Soil Phosphorus on Legume Production. In Legumes for Soil Health and Sustainable Management; Springer: Singapore, 2018; pp. 487–510. [Google Scholar]
- Wang, L.; Ding, L.; Wang, P.; Zhao, L.; Yu, Q. Production of dallisgrass in response to NPK fertilizer in southwest China and its implications for cultivation. Grassl. Sci. 2021, 67, 285–298. [Google Scholar] [CrossRef]
- Tariq, A.; Sardans, J.; Peñuelas, J.; Zhang, Z.; Graciano, C.; Zeng, F.; Olatunji, O.A.; Ullah, A.; Pan, K. Intercropping of leguminous and non-leguminous desert plant species does not facilitate phosphorus mineralization and plant nutrition. Cells 2022, 11, 998. [Google Scholar] [CrossRef] [PubMed]
- Yan, F.; Sun, Y.; Hui, X.; Jiang, M.; Xiang, K.; Wu, Y.; Zhang, Q.; Tang, Y.; Yang, Z.; Sun, Y. The effect of straw mulch on nitrogen, phosphorus and potassium uptake and use in hybrid rice. Paddy Water Environ. 2019, 17, 23–33. [Google Scholar] [CrossRef]
- Lynch, J.P. Root phenes for enhanced soil exploration and phosphorus acquisition: Tools for future crops. Plant Physiol. 2011, 156, 1041–1049. [Google Scholar] [CrossRef]


| Soil Texture | Total N (g kg−1) | Total P (g kg−1) | Olsen–P (mg kg−1) | Total K (g kg−1) | SOC (g kg−1) | pH | EC (ds m−1) |
|---|---|---|---|---|---|---|---|
| Loam | 1.90 | 0.76 | 5.44 | 32.3 | 10.0 | 8.05 | 0.11 |
Disclaimer/Publisher’s Note: The statements, opinions and data contained in all publications are solely those of the individual author(s) and contributor(s) and not of MDPI and/or the editor(s). MDPI and/or the editor(s) disclaim responsibility for any injury to people or property resulting from any ideas, methods, instructions or products referred to in the content. |
© 2023 by the authors. Licensee MDPI, Basel, Switzerland. This article is an open access article distributed under the terms and conditions of the Creative Commons Attribution (CC BY) license (https://creativecommons.org/licenses/by/4.0/).
Share and Cite
Yi, H.; Hu, S.; Zhang, Y.; Wang, X.; Xia, Z.; Lei, Y.; Duan, M. Proper Delay of Phosphorus Application Promotes Wheat Growth and Nutrient Uptake under Low Phosphorus Condition. Agriculture 2023, 13, 884. https://doi.org/10.3390/agriculture13040884
Yi H, Hu S, Zhang Y, Wang X, Xia Z, Lei Y, Duan M. Proper Delay of Phosphorus Application Promotes Wheat Growth and Nutrient Uptake under Low Phosphorus Condition. Agriculture. 2023; 13(4):884. https://doi.org/10.3390/agriculture13040884
Chicago/Turabian StyleYi, Huixuan, Shengchao Hu, Yulin Zhang, Xudong Wang, Zhenqing Xia, Yuting Lei, and Min Duan. 2023. "Proper Delay of Phosphorus Application Promotes Wheat Growth and Nutrient Uptake under Low Phosphorus Condition" Agriculture 13, no. 4: 884. https://doi.org/10.3390/agriculture13040884