Article

Improving Phosphorus Availability and Wheat Yield in Saline Soil of the Lake Urmia Basin through Enriched Biochar and Microbial Inoculation

by
Roghayeh Mousavi
1,
MirHassan Rasouli-Sadaghiani
1,*,
Ebrahim Sepehr
1,
Mohsen Barin
1 and
Ramesh Raju Vetukuri
2,*
1
Department of Soil Science, Faculty of Agriculture, Urmia University, Urmia 5756151818, Iran
2
Department of Plant Breeding, Swedish University of Agricultural Sciences, SE-234 22 Lomma, Sweden
*
Authors to whom correspondence should be addressed.
Agriculture 2023, 13(4), 805; https://doi.org/10.3390/agriculture13040805
Submission received: 22 February 2023 / Revised: 27 March 2023 / Accepted: 28 March 2023 / Published: 31 March 2023
(This article belongs to the Section Crop Production)

Abstract

:
To reduce requirements for conventional chemical fertilizer and alleviate salinity stress in soils, a glasshouse experiment was conducted to assess the effects of enriched biochar on phosphatase activity, microbial respiration and wheat yield in non-saline and saline soils from the Lake Urmia basin (electrical conductivities 2 dS.m−1 and 15 dS.m−1, respectively). Nine treatments were tested: control, 1:1 mixture of apple and grape biochars (BC), phosphate solubilizing bacteria (PSB), BC plus PSB (BC-PSB), BC plus rock phosphate (BC-RP), BC enriched by rock phosphate and bacteria (BC-RP-PSB), BC enriched by rock phosphate and HCl (BC-RP-HCl) or H3PO4 (BC-RP-H3PO4) and chemical fertilizer (TSP). The addition of enriched biochar decreased the soil pH (by 0.5–0.9 units) and increased available phosphorus (>7-fold). In both the saline and non-saline soils, the highest alkaline phosphatase activity was obtained for BC-H3PO4-RP and BC-HCl-RP. Wheat growth parameters were reclaimed after enriched biochar application, indicating superior dry matter yields compared to the control and non-enriched biochar treatments and significantly higher yields compared to TSP. Beneficial effects on soil pH, phosphatase activity, soil respiration and biomass yield demonstrated that enriched biochar could partly substitute chemical fertilizers and increase plant growth in salt stress conditions. However, further field studies are needed to understand the benefits of enriched biochar in different soils and climates.

1. Introduction

The addition of organic matter to amend saline or sodic soils is important, especially in arid and semi-arid areas with low organic matter content, such as in Iran. Yearly, millions of tons of various agricultural waste are generated in the country, which can be effective in providing soil organic matter; it is extremely important that this waste should be managed properly [1]. Biochar is made by thermal heating of organic material in the partial or total absence of O2 to produce a C-based residue [2]. In recent years, the use of biochar as a renewable modifier and environmentally friendly strategy for recycling organic waste has received much attention [3,4]. In addition to soil physicochemical properties, biochar can also be used as a carbon-sequestering soil amendment, and the interest in using biochar as a soil amendment stems from its ability to improve soil quality [5]. Soil biochemical and microbiological properties are the most important soil quality indicators. Biochemical properties of soil, such as microbial biomass, basic microbial respiration, substrate-induced respiration and enzyme activity, are used to evaluate soil quality. The effect of biochar on the soil’s biochemical properties depends on the type of biochar and soil and their properties, the type of biomass, and the thermophilic conditions of biochar [5,6]. The transformation of plant biomass into biochar at temperatures ~400 °C leads to the conversion of organic phosphorus to inorganic phosphorus (orthophosphates and potassium pyrophosphate, calcium and magnesium). Therefore, biochar can be considered a source of phosphorus for low-fertility soils [4,7]. The results of studies indicated that biochar addition could improve soil quality.
The enrichment of biochar to modify its properties has become an important topic in the greenhouse of biochar research. Enriched biochar (EB) is generally produced by coating biochar particles in clay, manure, calcium carbonate and minerals, then heating at 200–240 °C [8]. Some studies reported that enrichment by certain chemicals might raise the antioxidant property of a lignocellulosic substance to increase the stability of biochar. This promotes bonding between the minerals and organic phases, resulting in a high concentration of exchangeable cations [9,10]. Chen et al. [11] noted that enrichment of swine manure biochar with H3PO4 at 25 °C for 24 h increased the number of micropores and mesoporous in the unit area, while rice straw enriched with H3PO4 indicated no modification. The enrichment process not only increases the number of aromatic-carbon, oxygen-containing functional groups and Lewis acid and base sites but also increases the formation of organic-mineral complexes [12]. In addition, EB may have a longer half-life than organo-mineral complexes without biochar. A half-life of more than 100 years is an important qualitative indicator that would ensure the high stability of EB and stable transfer of its beneficial effects into the soil. However, EB production is a costly and energy-intensive process compared to conventional biochar formation and requires additional operational equipment for torrefaction. Nevertheless, the improved properties of EB make it a promising alternative. Therefore, it is important to develop methods and organo-mineral compounds that can be used to synthesize EB [12].
Previous reports have shown that soil microbial communities play a key role in biotic and abiotic stress management. Recently, the application of salt-tolerant plant-growth-promoting rhizobacteria (PGPRs) has been suggested as a promising strategy to reduce salinity stress [13,14]. Isolation and characterization of salt-tolerant plant-growth-promoting rhizobacteria (ST-PGPR) from salt-affected soils can be useful for the rapid selection of effective strains and use as bio-fertilizer under salinity stress conditions. In most studies, the effects of phosphate solubilizing bacteria (PSB) or biochar on soil phosphorus availability have been investigated separately, whereas their combined effect has rarely been examined. In addition, data on whether EB application affects the availability of phosphorus in saline soils are scarce. The aim of the present research was to investigate the effects of apple and grape biochar enriched by various mineral acids (H3PO4 and HCl), phosphate rock and PSB on phosphorus availability, enzymatic activity and microbial respiration in saline soils.

2. Materials and Methods

2.1. Enriched Biochar Production

Biochar samples were prepared from apple and grape tree pruning remains. Pyrolysis was carried out in an electric furnace with temperature ramped at a rate of 9 °C/min to 350 °C and held at that temperature for 120 min [8]. To alter the surface characteristics of the biochar, phosphoric acid (H3PO4) and hydrochloric acid (HCl) were used, whereas to prepare EBs, rock phosphate (RP) and PSB were used. All EBs were prepared using a mixture of apple and grape biochars in a ratio of 1:1.
Phosphoric acid and HCl (5.2 N) were used to prepare acidic biochars. The non-enriched apple and grape biochar mixture (1:1 ratio) was mixed with either 10% H3PO4 or 10% HCl (1:1 biochar:acid). After 2 h shaking, the acidic biochars were separately oven-dried at 75 °C for 24 h [8]. To enrich the acidic biochars (EB) with RP (BC-H3PO4-RP/BC-HCl-RP), they were mixed in a 4:1 ratio (4 g acidic biochar:1 g RP), boiling water was added in a 20:6 ratio, the mixture was shaken for 2 h, then oven dried and pyrolysis was conducted at 220 °C [8]. The measured physical and chemical properties of the prepared biochars are shown in Table 1.

2.2. Greenhouse Experiments

Twenty-five soil samples were collected from the surface layer (0–30 cm) around Lake Urmia. Of those, two soil samples (non-saline labeled S1 and saline labeled S2) were selected for further study based on measured electrical conductivity (EC) and Olsen-p values. After air drying and sieving, physiochemical properties of the soils were analyzed, including soil texture by hydrometer method [15], electrical conductivity (EC) and pH of a soil saturation extract, cation exchange capacity (CEC) by ammonium acetate method [16], percentage of organic carbon (OC%) [17], calcium carbonate equivalent (CCE) [18] and Olsen-P [19]. To measure the pH and EC of the biochars, a 1:5 w/v biochar:deionized distilled water mixture was prepared and shaken for 30 min [20]. The carbon (C), hydrogen (H) and nitrogen (N) composition was analyzed using an ECS 4010 CHNSO elemental analyzer.
A greenhouse experiment was conducted using a factorial, completely randomized design (CRD). The factors included soil type based on EC at two levels (S1 = 2 dS.m−1, S2 = 15 dS.m−1) and nine treatments to consider the effects of non-enriched and enriched biochars (control (Cont), 1:1 mixture of apple and grape biochars (BC), phosphate solubilizing bacteria (PSB), biochar and PSB (BC-PSB), biochar and rock phosphate (BC-RP), biochar enriched by RP and bacteria (BC-RP-PSB), RP and HCl (BC-RP-HCl), and RP and H3PO4 (BC-RP-H3PO4). The treatments were applied according to the soils’ standard phosphorus requirement (SPR). Briefly, based on the Langmuir adsorption isotherm, the amount of phosphorus required to achieve an equilibrium concentration of 0.3 mg P/L was determined as the SPR [20]. SPR for S1 was 45 mg P/kg soil, and for S2, 36 mg P/kg soil. The applied treatment amounts are reported in Table 2. Three replicates were prepared for each treatment and the control, resulting in a total of 54 pots. To each pot, 3 kg of soil was added. Before planting wheat, the nutrient elements were added according to the soil testing results (Table 3). The moisture content of the soils was maintained at close to 70% of the field capacity by measuring and replacing the daily water loss.
Pseudomonas aeruginosa, Pseudomonas fluorescens and Stenotrophomonas maltophilia bacteria were used to prepare the microbial treatments. In previous research, these bacteria were isolated from saline soils around Lake Urmia and screened based on plant-growth-promoting properties (PGPs), including indole acetic acid (IAA), hydrogen cyanide (HCN), siderophore and exopolysaccharide (EPS) production and ability to solubilize zinc and phosphate compounds (Table 4). The bacteria were cultured in a nutrient broth (NB) medium until they reached a colony-forming unit (CFU)/mL value of 108. Wheat seeds were soaked in the bacterial inoculation for 2 h, and at the time of planting, 1 mL of the inoculation was added to the seed cavity. Eight seeds were planted in each pot, and only 4 plants were thinned after planting. After 60 days, the total dry matter and P amounts of each plant were measured [21]. The pH and Olsen-P of the soils were measured by standard methods.
After harvesting, one gram of moist soil around the root system was used to measure the activity of acid and alkaline phosphatase enzymes [22]. The basal respiration and substrate-induced respiration rates were assessed in three repetitions using a previously described method [23].

2.3. Statistical Analysis

The statistical significance of differences between the bacterial strains and control, as well as between-strain differences, was assessed using analysis of variance (ANOVA) in the SAS package (SAS, 1999). Mean comparisons were conducted using a least significant difference (LSD) test (p = 0.05). Standard error and LSD results were calculated.

3. Results

According to measurements (Table 5), both studied soils had a clay loam texture, pH > 7.0 and >5% calcium carbonate. Therefore, based on the FAO soil classification, S1 soil was classed as calcareous soil and S2 soil with EC > 4 and ESP < 15 as saline soil (Table 5).

3.1. Characterization of Biochars

Elemental analysis of the biochars indicated that the total N content (TN) increased significantly to 2.5% and 1.7% in the BC-RP-HCl and BC-RP-H3PO4 samples (Table 1). The O/C ratios of BC-RP-HCl and BC-RP-H3PO4 were also higher than those of BC. O/C and H/C ratios indicate the degree of polarity and aromaticity.
The apple and grape biochars were alkaline, with pH values of 7.6 and 8.2, respectively. After being modified by H3PO4 and HCl, the pH of the EBs reduced significantly to 5.1 for BC-RP-H3PO4 and 4.9 for BC-RP-HCl (Table 1). The EC values of the apple and grape biochars were 1.2 and 1.6 ds m−1, respectively, which were not significantly different from those of BC-RP-H3PO4 and BC-RP-HCl. The available P of the EBs increased significantly to 48 mg kg−1 for BC-RP-H3PO and (27 mg kg−1) for BC-RP-HCl (Table 1).

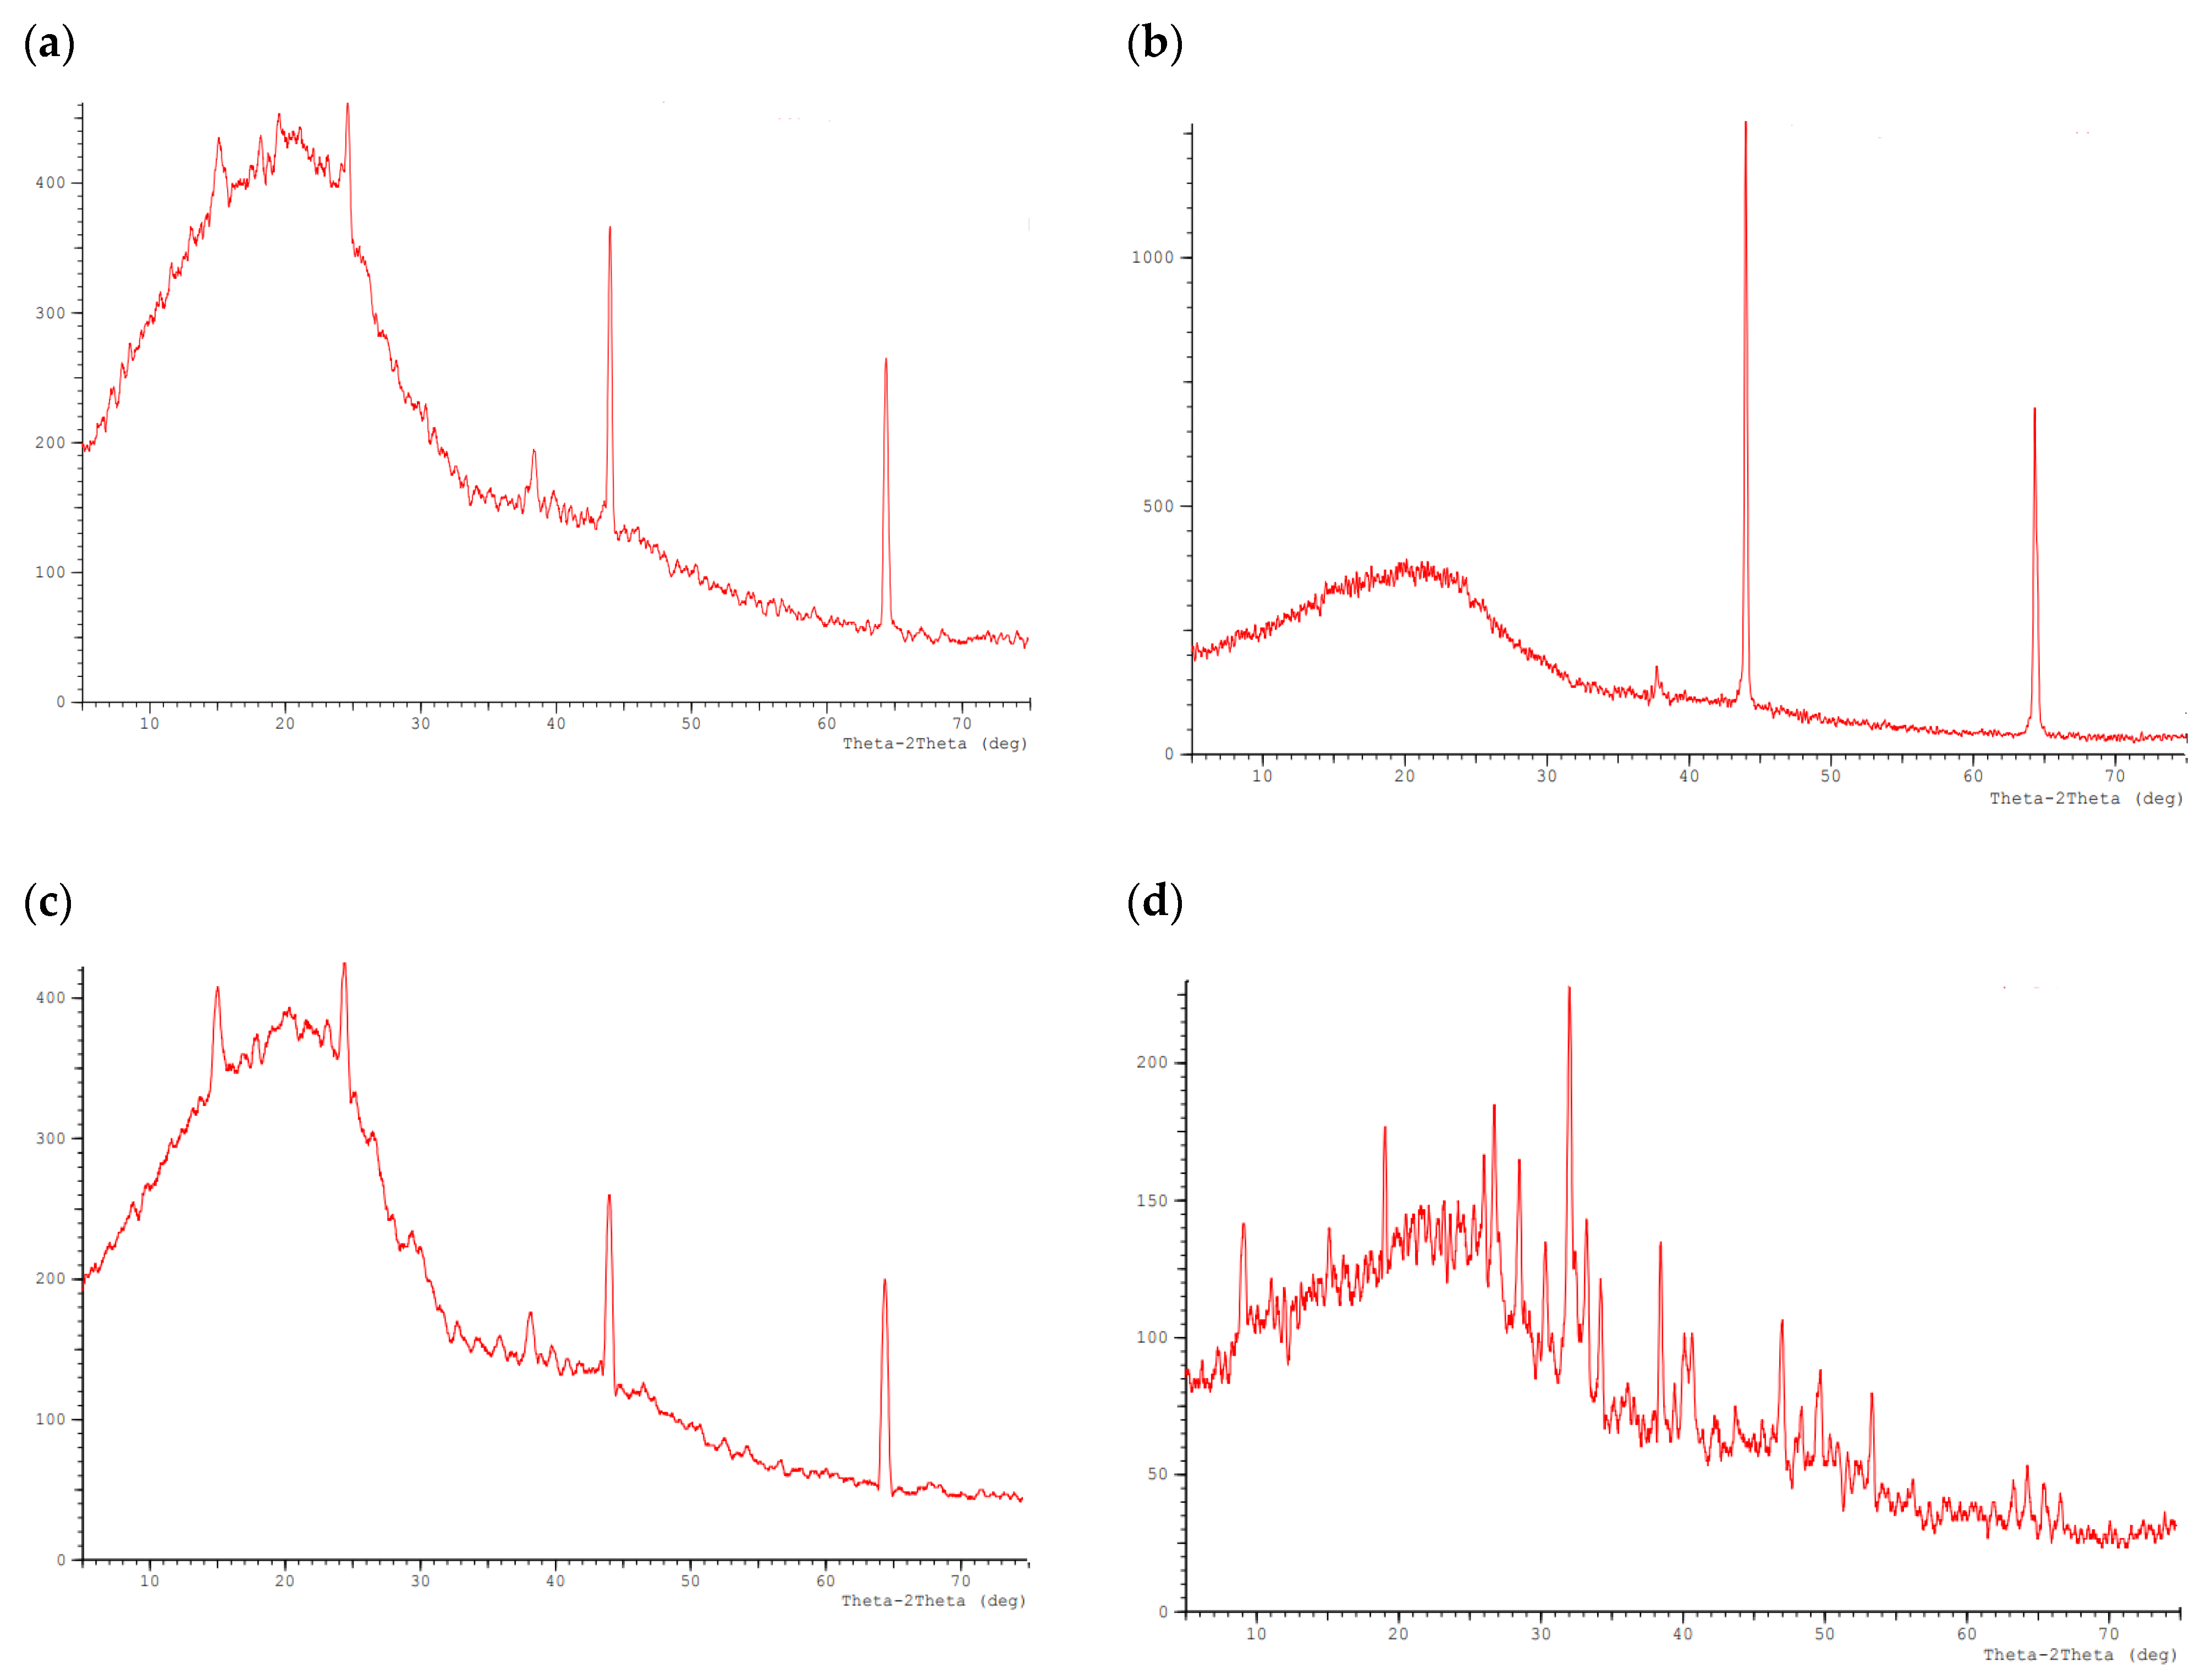
3.2. X-ray Diffraction

X-ray diffraction (XRD) patterns revealed crystalline structures for the EB samples (Figure 1) with the presence of minerals KCl, MgO and CaCO3 at 2θ of 37.7, 43.9, 64.3 and 24.3, respectively. In the acid-treated biochar samples, new peaks were observed at 2θ of 75, 15 and 23, which could be related to various Ca-P calcium phosphate compounds.

3.3. Effects of Biochars on Soils

The type of biochar influenced the pH, EC and available P of the soils. Soil available P was significantly (p < 0.01) affected by the main and interaction effects of the experimental factors (treatment and soil types) (Table 6). The results of the mean comparison indicated that Olsen-P was much higher in BC-H3PO4-RP and BC-RP-HCl than in the other treatments. The Olsen-P concentrations in BC-H3PO4-RP and BC-HCl-RP for S1 were 58.7 and 41 mg kg−1, respectively, and for S2, 67.4 and 38.6 mg kg−1, respectively. According to Figure 2, in both soils, Olsen- P was significantly higher in BC-RP-PSB than in the control and TSP treatments.
Results of ANOVA clearly indicated that experimental treatments significantly (p < 0.01) affected the soil pH but not EC (Table 6). The BC-H3PO4-RP, BC-HCl-RP and BC-RP-PSB treatments significantly reduced the pH of soils. The pH of S1 and S2 was reduced by 0.6 and 1.1 units, respectively, for BC-H3PO4-RP and by 0.65 and 1.16 units, respectively, for BC-HCl-RP (Table 7).

3.4. Effect of Biochars on Plant Biomass and Plant P Content

ANOVA results indicated that the main effect of experimental factors and their interaction effects on the wheat dry matter yield (DMY) and phosphorus content were significant (p < 0.01). In both soils, the highest and lowest DMY values were obtained in the BC-H3PO4-RP and BC treatments, respectively, showing that the biochar had no effect on the dry wheat biomass (Figure 3).
Results of the mean comparison showed that in S1 soil, the plant P content in the BC-H3PO4-RP, BC-HCl-RP and BC-RP-PSB treatments was not significantly different (Figure 4). Despite the strong effect of the BC-H3PO4-RP and BC-HCl-RP treatments on DMY, due to the dilution effect, the total P uptake in these treatments was significantly lower than in the BC-RP-PSB treatment. However, in S2 soil, the P content in the BC-H3PO4-RP and BC-HCl-RP treatments was statistically higher than in the BC-RP-PSB treatment and was more than 0.25%. In S1, the plant P content in the TSP treatment was more than 0.25%, whereas in S2, the P content was less than 0.25% and was significantly different from that of the control and other treatments (Figure 4).

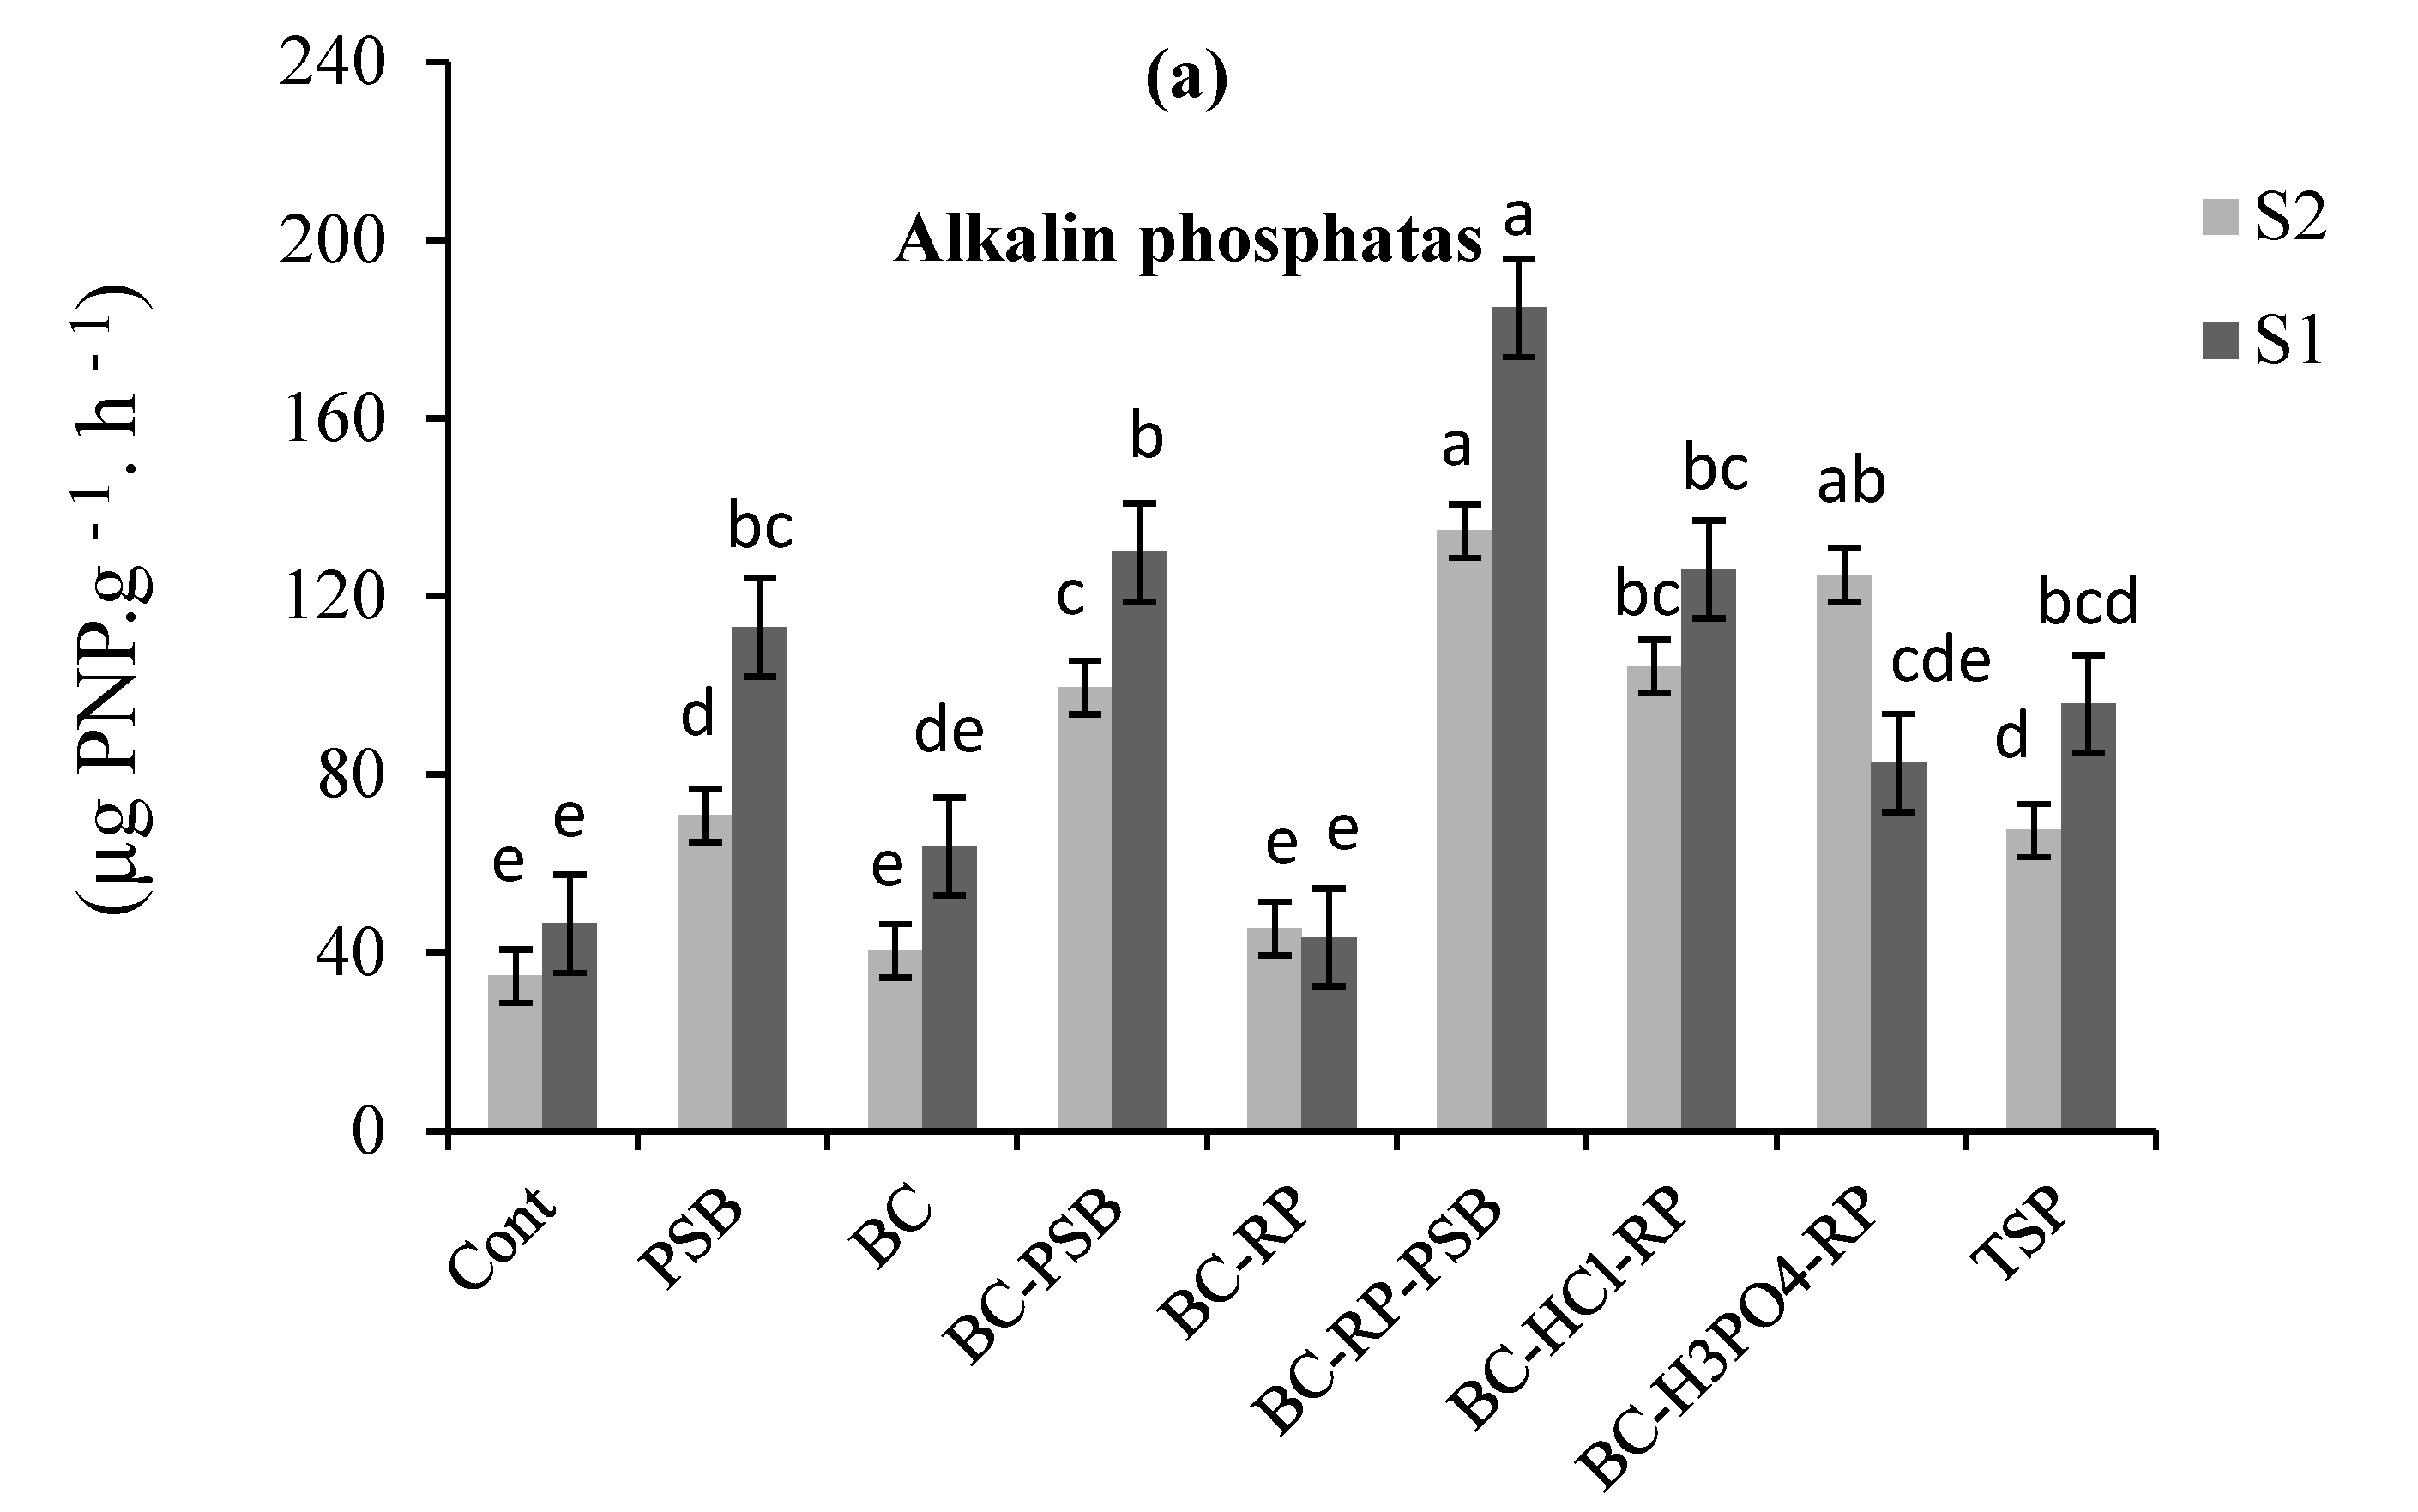
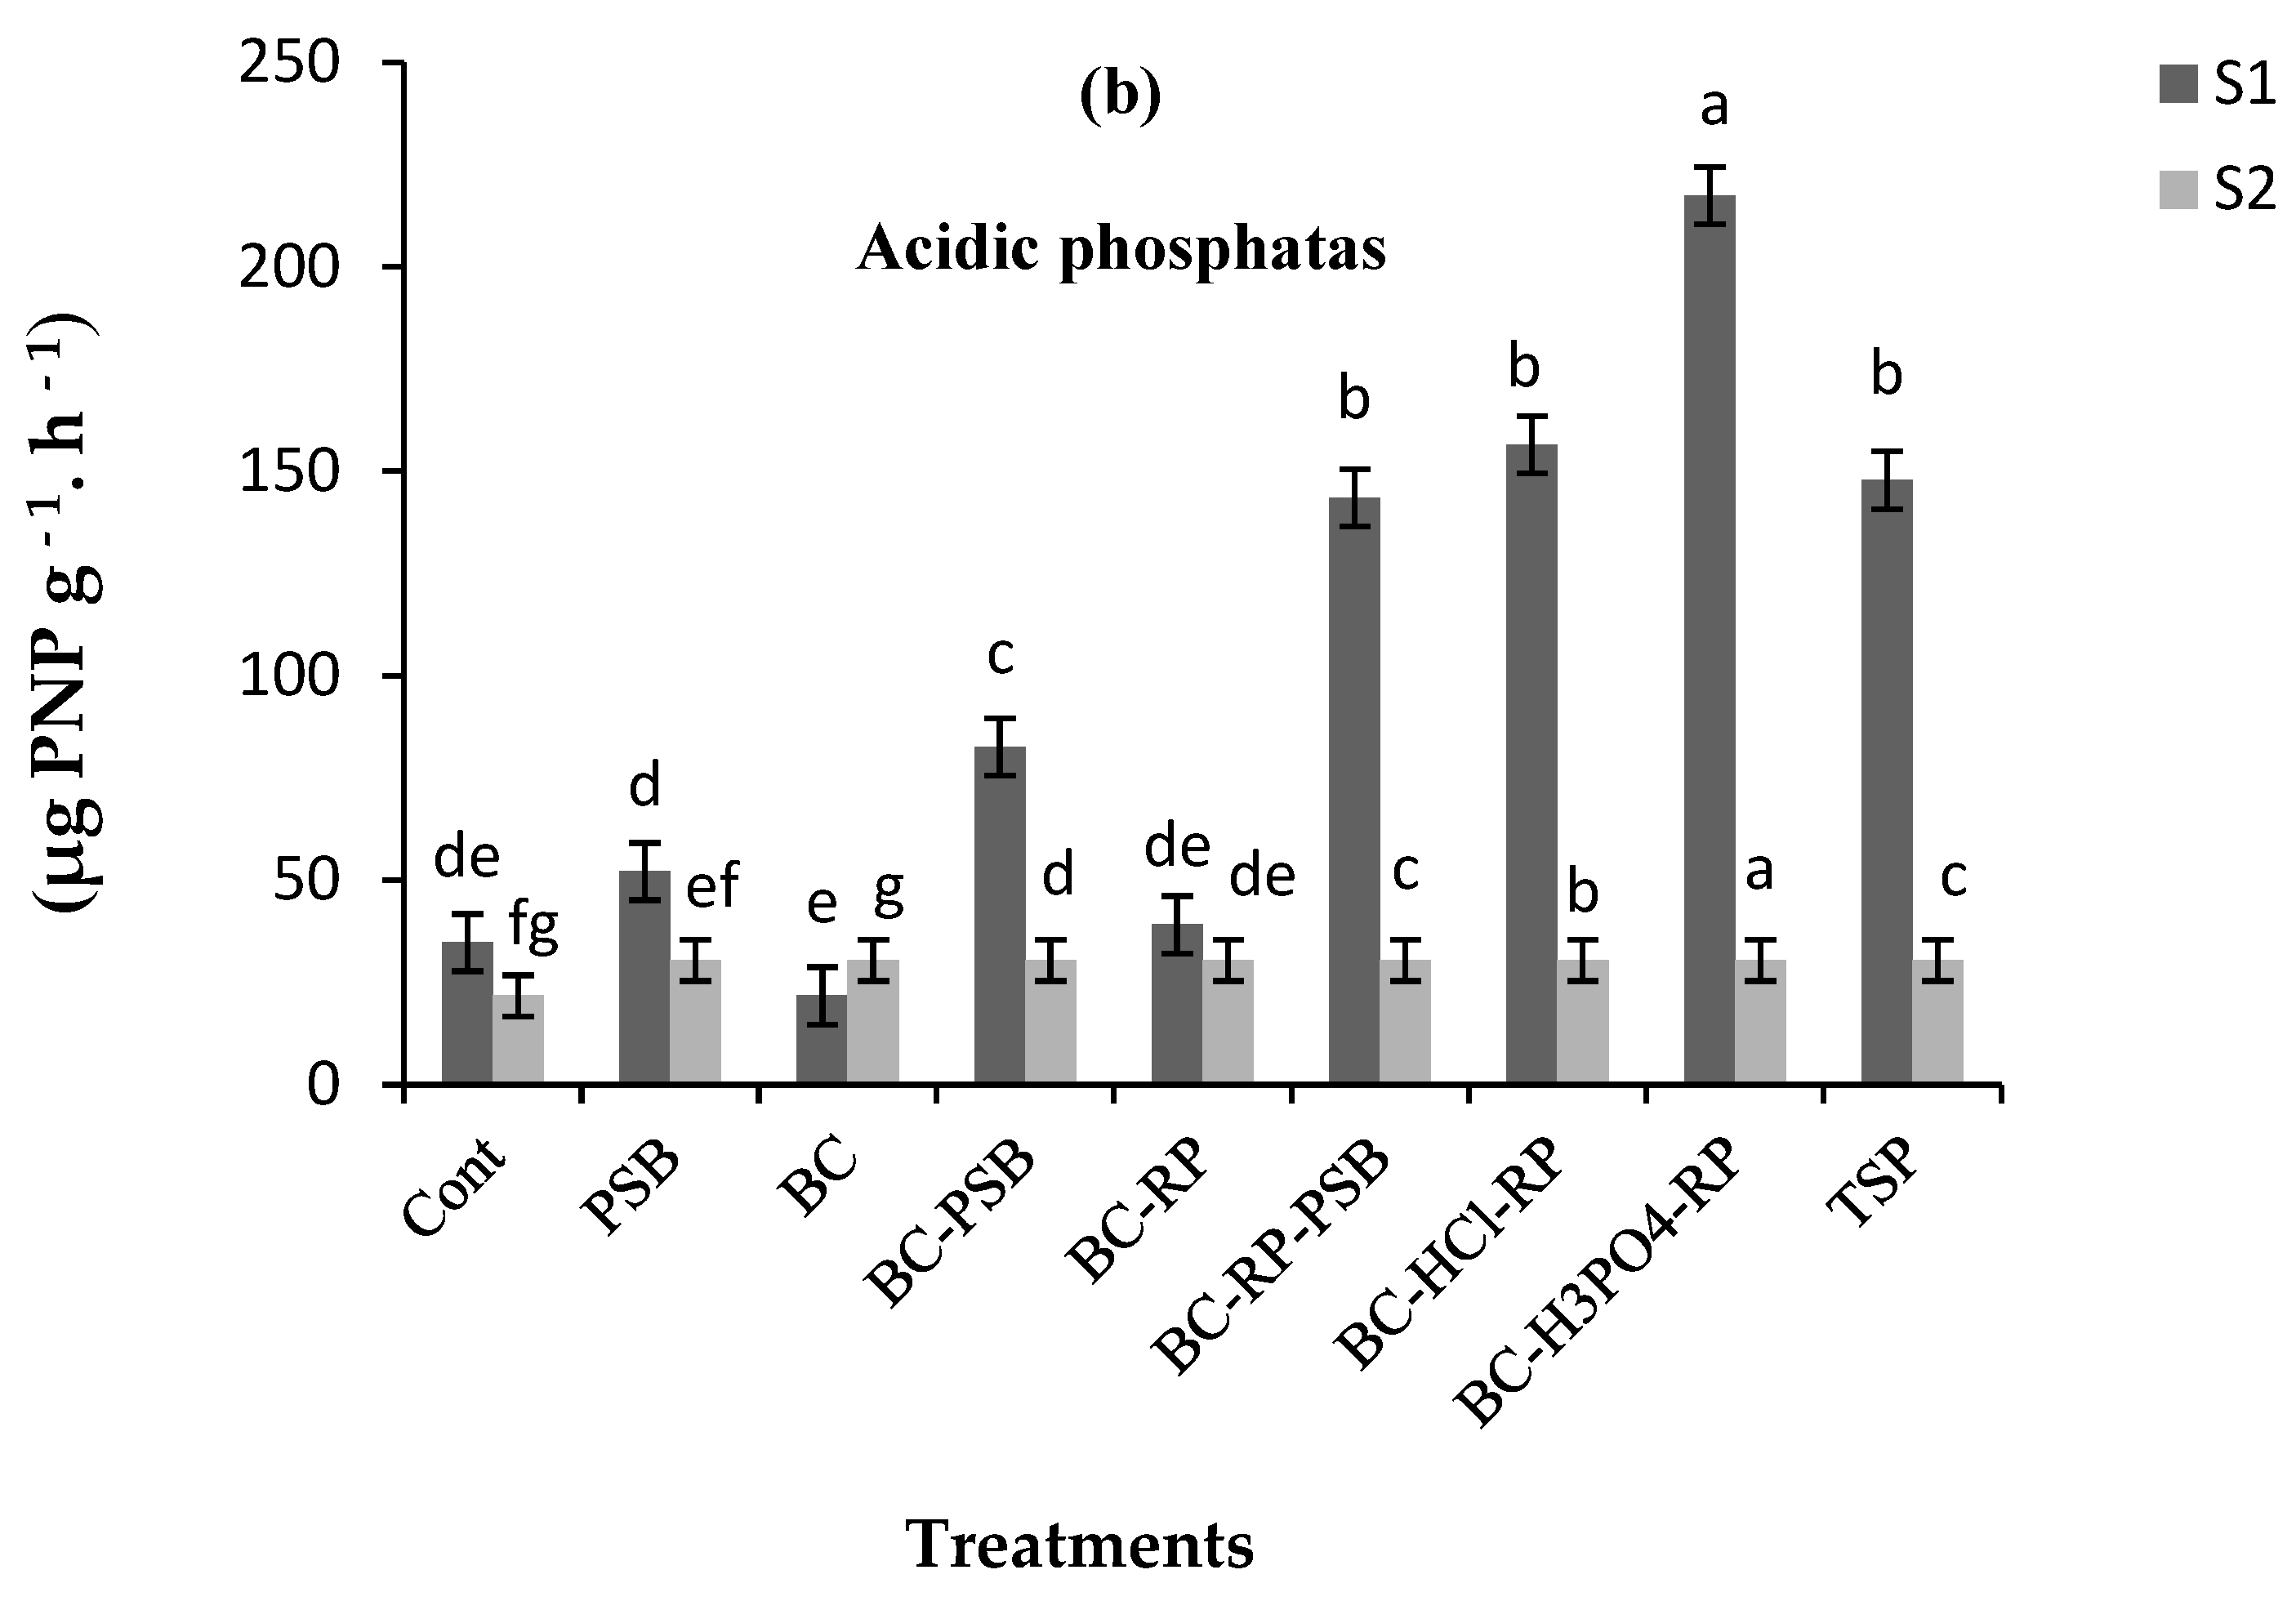
3.5. Effects of Biochars on Phosphatase Activity

ANOVA results indicated that acidic and alkaline phosphatase activities were significantly (p < 0.01) influenced by the treatments, soil type and their interaction effect (Table 6). In both soils, alkaline phosphatase activity was higher in BC-RP-PSB than in the other treatments. In both soils, acid phosphatase activity significantly increased after EB addition, and the highest values were recorded in the BC-H3PO4-RP and BC-HCl-RP treatments (Figure 5).

3.6. Effect of Biochars on Basal Respiration (BR) and Substrate-Induced Respiration (SIR)

ANOVA results revealed that the treatment, soil type and their interaction significantly affected BR (p < 0.01) but not SIR (Table 6). In both soils, the highest BR rate was obtained in BC-PSB-RP. Unlike in S2, the BC-H3PO4-RP treatment in S1 did not generate any statistically significant differences in respiration rates compared to the control (Figure 6). According to the results, there was a significant difference between the two soils in SIR: the highest value of SIR was in S1 (132 mg CO2-C kg−1 day−1), and the lowest was in S2 (89 mg CO2-C kg−1 day−1). There was a significant difference among the treatments in SIR. In S1, the highest (163 mg CO2-C kg−1 day−1) and lowest (129 mg CO2-C kg−1 day−1) SIR values were obtained in the BC-PSB-RP and BC treatments, respectively, whereas in S2, the highest value was in BC-PSB-RP (154 mg CO2-C kg−1 day−1) and the lowest value was in the control (89 mg CO2-C kg−1 day−1). In soil S1 ‘Compared to the control, the PSB and BC-PSB treatments led to an increase of 13 and 15% in SIR in soil S1, compared to 54 and 57% in soil S2, respectively.

4. Discussion

Elemental analysis results (Table 1) of the biochars indicated that the ratio of H/C and O/C increased with enrichment. Functional groups largely contain O or H. Therefore, the O/C and H/C ratios showed the presence of functional groups that increase the desorption capacity of EB [24]. Previous research has indicated that acid treatment can increase the number of oxygen-containing functional groups in biochar, thereby increasing H/C and O/C [25,26,27]. H/C and O/C ratios of biochars can be used to indicate the aromaticity, hydrophilicity and polarity of carbon materials [28,29]. Our results indicated that the aromaticity and hydrophilicity of the enriched biochar decreased slightly, whereas the polarity increased rather than.
XRD analysis (Figure 1) showed that the surface of the non-enriched biochars contained inorganic components, such as potassium and magnesium oxide and calcium carbonate. The acid-treated biochars exhibited a new peak at 2θ = 26.6°. This is in line with results reported in [30] and could be related to metaphosphates, C-O-PO3 and C-PO3 groups [31,32].
Soil pH plays a crucial role in controlling the solubility and availability of some essential plant nutrients [33]. The addition of EBs to the saline and non-saline soils had the strongest positive effect on the pH (Table 7). The average pH in S1 was higher than that in S2. S1 had a higher cation exchange capacity (CEC) and percentage of clay and lime, which would increase the buffering capacity of the soil and its resistance to pH change. He et al. [34] reported that the buffering capacity improved with the addition of HNO3/H2SO4 and H2O2-modified BC. They noted that soil resistance to acidification is controlled by surface functional groups. They suggested that treatment with HNO3/H2SO4 modified BC led to a higher number of carboxyl functional groups than H2O2, which is why it showed more soil resistance to acidification. Lehmann and Joseph [35] suggested that biochar application may decrease the soil pH due to the oxidation of carboxyl groups in the biochar or increase the soil pH due to the dissolution of alkaline minerals. Wali et al. [36] found that soil pH was barely affected by the addition of EB with different levels of P. Previous studies have found that biochars produced at higher temperatures are basic due to the loss of acidic functional groups [37,38]. Mobilization of microbial communities and the removal of acidic constituents and carboxylic groups from biochar have been suggested as possible reasons for the reduction of pH associated with EB addition [39].
In general, in this study, the application of EB significantly increased the plant-available P content in both the saline and non-saline soils. However, in most studies, simple biochar has been found to be the most effective for improving P availability in acidic soils. This has been explained by the increased soil pH and decreased P sorption onto Fe and Al oxides [40]. In our study, lowering the pH of the soils by adding the acidic EBs and subsequent dissolution of their ash and RP may have increased P availability. Similarly, in a study of the short-term effects of maize residue biochar (0, 2, 4 and 8%) on phosphorus availability in two soils with different phosphorus adsorption capacities, the addition of biochar increased the Olsen-P soil equivalent to 118 kg P ha−1 KH2PO4 fertilizer [41]. El-Sharkawy [42] reported that acidified biochar enhanced soil-available nutrients, possibly due to the increased CEC and adsorption capacity of acid-treated biochar and changes in functional groups induced by biochar acidification. In our study, the high Olsen-p values in the microbial treatments (especially BC-RP-PSB) compared to the TSP treatment were unexpected (Figure 2) but likely due to the ability of the bacteria to solubilize soil insoluble phosphate and the enhancement of PSB activity in the presence of organic matter (biochar). The bacteria used in this study were plant-growth-promoting bacteria which, in addition to P solubilization, can produce IAA, siderophores, EPS and HCN, as well as solubilize insoluble Zn compounds (Table 4). On the other hand, heating of RP during the enrichment process at 220 °C probably also released P.
Our data on plant yield showed that the addition of EB enhanced DMY compared to simple biochar (Figure 3). These results disagree with Yakout et al. [26], who investigated the acidification of biochar and found that simple and modified biochar augmented grain and straw yields of maize and wheat compared to the control. They also reported that acidification had no significant effect on straw yield compared to simple biochar. In our study, in soil S2, DMY was significantly higher in the BC-RP-PSB treatment than in the TSP treatment. These results may indicate the importance of using PGPB with organic matter to improve plant growth conditions in saline soils. Owing to the economic importance of plant dry matter, its amount is considered a determining factor in increasing the yield. Therefore, any factor that improves plant growth increases the plant’s dry matter. Some studies have reported neutral or negative effects of biochar on plant performance [43,44]. However, many studies have suggested that increased plant growth after applying modified biochar could be due to improvements in soil CEC [30], Na+/K+ ratio under saline conditions [41], photosynthesis, nutrient uptake and soil physical and chemical properties [24,29,30]. We showed that the application of EB increased the P content of wheat plants. in agreement with [45], who found that acidification of biochar with combined acid (H3PO4 + HNO3) increased the total maize nutrient contents by 52.50%, 63.64% and 17.60% for N, P and K, respectively, compared to the control. Recent studies have suggested that biochar increases crop yield by reducing the pH and P adsorption capacity, thereby increasing the availability of P and some micronutrients [46,47].
In both soils, the highest alkaline phosphatase enzyme value was recorded for the BC-PSB-RP treatment (Figure 5). The alkaline phosphatase enzyme is only secreted by soil microorganisms. Thus, the high activity of this enzyme in the latter treatment reflects the higher organic matter content, which stimulates and increases the activity of microorganisms and increases soil enzymatic activities. Soil phosphorus concentration is one of the key factors controlling soil phosphatase activity. Several studies have reported decreased phosphatase activity and, consequently, decreased microorganism activity after applying high amounts of phosphorus fertilizer [48,49,50]. Our results demonstrated that the TSP treatment significantly enhanced phosphatase activity (p < 0.01) (Figure 5). This may be explained by the low Olsen-p values in the soils or the balanced usage of phosphate fertilizer (TSP and RP). Indeed, previous studies have shown that the balanced application of chemical fertilizers increases soil phosphatase activity [50]. Although an inverse relationship has been reported between phosphatase activity and soil phosphorus [51], in our study, the highest phosphatase activity was obtained in the BC-H3PO4-RP, BC-HCl-RP and BC-RP-PSB treatments (Figure 5). In both soils, the highest acid phosphatase activity was recorded in the BC-H3PO4-RP and BC-HCl-RP treatments. This may be because this treatment altered the soil pH, which is one of the most important factors affecting the stability and activity of soil phosphatases. The optimum acid phosphatase activity has been reported to be at pH = 7 and alkaline phosphatase at pH = 11 [52]. In the present study, biochar application did not influence soil phosphatase activity, possibly because the biochars were applied in small quantities (0.4% to S1 and 0.32% to S2).
Salinity is one of the main factors affecting soil phosphatase activity. In our study, salinity caused a significant reduction in soil phosphates activity at 1% probability level (Table 6). The phosphatase content of S2 (EC = 15 dS/m) was lower than that of S1 (EC = 2 dS/m), which may be associated with the different ECs. Differences in phosphatase activity may also reflect differences in the type and composition of the soil microbial community. Similar results have been reported by [53,54,55].
The bacteria used in this study were effective in improving soil respiration, particularly in saline soil. The BC-PSB-RP treatment was the most effective at increasing the soil respiration rate, implying greater respiratory activity of the bacteria (Pseudomonas aeruginosa, Pseudomonas fluorescens and Stenotrophomonas maltophilia) in saline conditions. Under stressful conditions, the microorganisms’ activity increases, increasing the respiration rate with increasing salinity. However, there is a limit to which microorganisms can withstand such conditions before their physiological activity becomes disordered, decreasing microbial respiration [56]. Therefore, it can be concluded that the salinity of S2 (15 dS/m) was not higher than the tolerance threshold of the bacteria used in this study because they were not disturbed physiologically and did not show decreased respiration.
In both soils, non-enriched biochar (BC) application had no effect on soil respiration, which might be because only low amounts of biochar (0.4% in S1 and 0.32% in S2) were used. In contrast, Moradi [57] showed that usage of non-enriched and enriched biochar (2%) increased the BR during incubation (70 days). Several studies have shown a short-term increase in CO2 emissions following biochar usage related to the initial effect of biochar soluble C on the decomposition of native organic C [58]. Mitchel et al. [54] after 5 months and Zhou et al. [59] after 6 months observed a significant increase in soil respiration after treatment with biochar. Rutigliano et al. [60] also showed a significant change in soil respiration rate compared to the control after 3 months but no difference after 14 months. Our results agree with the experimental findings of Ameloot et al. [61], who reported no significant difference between the respiration rates of the samples and the control. The effect of biochar on soil carbon sequestration depends on time, biochar type, pyrolysis conditions and soil properties, especially soil texture [48]. Hence, different effects on soil respiration are not unreasonable. We observed a significantly negative effect on SIR in the saline compared to non-saline soil (Figure 5), indicating that the added substrate (glucose) was not readily available for microbial utilization [61]. Soil respiration is reduced by salinity stress. However, the application of the BC-PSB-RP treatment significantly increased soil BR to 79.54 mg CO2-C kg−1 day−1 and 62 mg CO2-C kg−1 day−1 for S1 and S2, respectively.

5. Conclusions

Our results showed that applying EB has positive effects on the phosphatase activity and microbial respiration of soils as BC-HCl-RP treatment increased alkaline phosphatase activity (63–66%), and BC-H3PO4-RP treatment increased alkaline phosphatase activity (43–72%) more than the unenriched biochar and control treatments in S1 and S2 soils, respectively. Moreover, EB application significantly decreased the pH of soils and increased phosphorus availability. The pH of S1 and S2 was reduced by 0.6 and 1.1 units, respectively, for BC-H3PO4-RP and by 0.65 and 1.16 units, respectively, for BC-HCl-RP. The BC-H3PO4-RP treatment increased the Olsen-p values of both soils by more than 11 times. In general, the application of enriched biochar attained higher dry matter yield, which was between 8.5 to 46% of what was achieved using TSP fertilizer. Consequently, EB-treated soils showed higher microbial respiration rates than the other treatments. EB amendment was found to mediate soil phosphate activity involved in P cycling, which controls soil phosphorus dynamics and fluxes and biomass yield during greenhouse studies. Therefore, EB could partly replace the demand for chemical fertilizer and promote organic farming. However, further extensive field studies are required to confirm this.

Author Contributions

Conceptualization: M.R.-S., E.S., R.R.V. and M.B.; formal analysis: R.M.; utilization of software: R.M.; methodology: R.M., M.R.-S., E.S. and M.B.; investigation: R.M.; validation: M.R.-S. and M.B.; data curation: M.R.-S., R.M. and M.B.; original draft preparation: R.M.; review and editing: M.R.-S., R.R.V. and R.M. All authors have read and agreed to the published version of the manuscript.

Funding

We gratefully acknowledge support from the Department of Soil Science, Urmia University and SLU’s Centre for Biological Control. RV was supported by the Swedish Research Council for Environment, Agricultural Sciences and Spatial Planning (FORMAS) (grant number 2019-01316), SLU’s Centre for Biological Control and the Swedish Research Council (grant number 2019-04270).

Institutional Review Board Statement

Not applicable.

Informed Consent Statement

Not applicable.

Data Availability Statement

The data presented in this study are available on request from the corresponding author.

Conflicts of Interest

The authors declare that they have no conflict of interest.

References

  1. Farzadkia, M.; Fallah Jokandan, S.; Yegane Badi, M. Compost Management in Iran: Opportunities and Challenges. J. Environ. Health Eng. 2015, 2, 211–223. (In Farsi) [Google Scholar] [CrossRef]
  2. Yuan, J.H.; Xu, R.-K.; Zhang, H. The forms of alkalis in the biochar produced from crop residues at different temperatures. Bioresour. Technol. 2011, 102, 3488–3497. [Google Scholar] [CrossRef] [PubMed]
  3. Lehmann, J.; Rillig, M.C.; Thies, J.; Masiello, C.A.; Hockaday, W.C.; Crowley, D. Biochar effects on soil biota—A review. Soil Biol. Biochem. 2011, 43, 1812–1836. [Google Scholar] [CrossRef]
  4. Joseph, S.; Peacocke, C.; Lehmann, J.; Munroe, P. Developing a biochar classification and test methods. Biochar Environ. Manag. Sci. Technol. 2009, 1, 107–126. [Google Scholar]
  5. Zhang, Y.; Wang, J.; Feng, Y. The effects of biochar addition on soil physicochemical properties: A review. Catena 2021, 202, 105284. [Google Scholar] [CrossRef]
  6. Siedt, M.; Schäffer, A.; Smith, K.E.; Nabel, M.; Roß-Nickoll, M.; van Dongen, J.T. Comparing straw, compost, and biochar regarding their suitability as agricultural soil amendments to affect soil structure, nutrient leaching, microbial communities, and the fate of pesticides. Sci. Total Environ. 2020, 751, 141607. [Google Scholar] [CrossRef]
  7. Li, H.; Li, Y.; Xu, Y.; Lu, X. Biochar phosphorus fertilizer effects on soil phosphorus availability. Chemosphere 2020, 244, 125471. [Google Scholar]
  8. Chia, C.H.B.P.; Singh, S.; Joseph, E.R.; Graber, P.; Munroe, P. Characterization of an enriched biochar. J. Anal. Appl. Pyrolysis 2014, 108, 26–34. [Google Scholar] [CrossRef]
  9. Wang, T.; Camps-Arbestain, M.; Hedley, M.; Bishop, P. Predicting phosphorus bioavailability from high-ash biochars. Plant Soil 2012, 357, 173–187. [Google Scholar] [CrossRef]
  10. Kim, K.H.J.Y.; Kim, T.S.; Cho, J.; Choi, W. Influence of pyrolysis temperature on physicochemical properties of biochar obtained from the fast pyrolysis of pitch pine (Pinus rigida). Bioresour. Technol. 2012, 118, 158–162. [Google Scholar] [CrossRef]
  11. Chen, T.; Luo, L.; Deng, S.; Shi, G.; Zhang, S.; Zhang, Y.; Deng, O.; Wang, L.; Zhang, J.; Wei, L. Sorption of tetracycline on H3PO4 modified biochar derived from rice straw and swine manure. Bioresour. Technol. 2018, 267, 431–437. [Google Scholar] [CrossRef]
  12. Blackwell, P.; Joseph, S.; Munroe, P.; Anawar, H.M.; Storer, P.; Gilkes, R.J.; Solaiman, Z.M. Influences of biochar and biochar-mineral complex on mycorrhizal colonisation and nutrition of wheat and sorghum. Pedosphere 2015, 25, 686–695. [Google Scholar] [CrossRef]
  13. Matoso, S.C.G.; Wadt, P.G.S.; Souza, V.S.D.; Pérez, X.L.O. Synthesis of enriched biochar as a vehicle for phosphorus in tropical soils. Acta Amaz. 2019, 49, 268–276. [Google Scholar] [CrossRef]
  14. Yao, F.X.; Arbestain, M.C.; Virgel, S.; Blanco, F.; Arostegui, J. Simulated geochemical weathering of a mineral ash-rich biochar in a modified soxhlet reactor. Chemosphere 2010, 80, 724–732. [Google Scholar] [CrossRef]
  15. Klute, A. Methods of Soil Analysis. In Part I: Physical and Mineralogical Methods; ASA, Inc. and Soil Science Society of American: Madison, WI, USA, 1986. [Google Scholar]
  16. Chapman, H.D. Cation-exchange capacity. Agronomy 1965, 9, 891–901. [Google Scholar]
  17. Nelson, D.W.; Sommers, L.E.; Page, A.L.; Miller, R.H.; Keeney, P.R. Total carbon, organic carbon and organic matter. Methods of Soil Analysis, Part 2, Chemical and Micobiological Properties. Soil Sci. Soc. Am. 1982, 539–580. [Google Scholar] [CrossRef]
  18. Nelson, R.E. Carbonate and gypsum. In Methods of Soil Analysis; Page, A.L., Miller, R.H., Keeney, D.R., Eds.; American Society of Agronomy: Madis, WI, USA, 1982; pp. 181–197. [Google Scholar]
  19. Olsen, S.R.; Sommers, L.E. Phosphorus. In Methods of Soil Analysis. Part 2. Chemical and Microbiological Properties, 2nd ed.; Page, A.L., Miller, R.H., Keeney, D.R., Eds.; Agron. Monogr. 9; ASA and SSSA: Madison, WI, USA, 1982; pp. 403–430. [Google Scholar]
  20. Zhao, S.-X.; Ta, N.; Wang, X.-D. Effect of temperature on the structural and physicochemical properties of biochar with apple tree branches as feedstock material. Energies 2017, 10, 1293. [Google Scholar] [CrossRef]
  21. Halford, I.C.R. Evaluation of soil phosphate buffering indices. Aust. J. Soil Res. 1979, 17, 495–504. [Google Scholar] [CrossRef]
  22. Harborne, J.B. Methods of plant analysis. In Phytochemical Methods: A Guide to Modern Techniques of Plant Analysis; Springer: Dordrecht, The Netherlands, 1973; pp. 1–32. [Google Scholar]
  23. Anderson, C.R.; Condron, L.M.; Clough, T.J.; Fiers, M.; Stewart, A.; Hill, R.A.; Sherlock, R.R. Biochar induced soil microbial community change: Implications for biogeochemical cycling of carbon, nitrogen and phosphorus. Pedobiologia 2011, 54, 309–320. [Google Scholar] [CrossRef]
  24. Zhang, X.; Gao, B.; Zheng, Y.; Hu, X.; Creamer, A.E.; Annable, M.D.; Li, Y. Biochar for volatile organic compound (VOC) removal: Sorption performance and governing mechanisms. Bioresour. Technol. 2017, 245, 606–614. [Google Scholar] [CrossRef]
  25. Yakout, S.M.; Daifullah, A.M.; El-Reefy, S.A. Pore structure characterization of chemically modified biochar derived from rice straw. Environ. Eng. Manag. J. 2015, 14, 473–480. [Google Scholar] [CrossRef]
  26. Zhao, L.; Cao, X.; Zheng, W.; Kan, Y. Phosphorus-assisted biomass thermal conversion: Reducing carbon loss and improving biochar stability. PLoS ONE 2014, 9, e115373. [Google Scholar] [CrossRef] [PubMed]
  27. Wang, Z.; Li, J.; Zhang, G.; Zhi, Y.; Yang, D.; Lai, X.; Ren, T. Characterization of acid-aged biochar and its ammonium adsorption in an aqueous solution. Materials 2020, 13, 2270. [Google Scholar] [CrossRef] [PubMed]
  28. LeCroy, C.; Masiello, C.A.; Rudgers, J.A.; Hockaday, W.C.; Silberg, J.J. Nitrogen, biochar, and mycorrhizae: Alteration of the symbiosis and oxidation of the char surface. Soil Biol. Biochem. 2013, 58, 248–254. [Google Scholar] [CrossRef]
  29. Ahmad, A.; Chowdhary, P.; Khan, N.; Chaurasia, D.; Varjani, S.; Pandey, A.; Chaturvedi, P. Effect of sewage sludge biochar on the soil nutrient, microbial abundance, and plant biomass: A sustainable approach towards mitigation of solid waste. Chemosphere 2022, 287, 132112. [Google Scholar] [CrossRef]
  30. Neina, D. The role of soil pH in plant nutrition and soil remediation. Appl. Environ. Soil Sci. 2019, 1–9. [Google Scholar] [CrossRef]
  31. He, X.; Hong, Z.-N.; Shi, R.-Y.; Cui, J.-Q.; Lai, H.-W.; Lu, H.-L.; Xu, R.-K. The effects of H2O2-and HNO3/H2SO4-modified biochars on the resistance of acid paddy soil to acidification. Environ. Pollut. 2021, 293, 118588. [Google Scholar] [CrossRef]
  32. Xie, Y.; Dong, C.; Chen, Z.; Liu, Y.; Zhang, Y.; Gou, P.; Zhao, X.; Ma, D.; Kang, G.; Wang, C.; et al. Successive biochar amendment affected crop yield by regulating soil nitrogen functional microbes in wheat-maize rotation farmland. Environ. Res. 2021, 194, 110671. [Google Scholar] [CrossRef]
  33. Peiris, C.; Wathudura, P.D.; Gunatilake, S.R.; Gajanayake, B.; Wewalwela, J.J.; Abeysundara, S.; Vithanage, M. Effect of acid modified tea-waste biochar on crop productivity of red onion (Allium cepa L.). Chemosphere 2022, 288, 132551. [Google Scholar] [CrossRef]
  34. Farouk, S.; Al-Huqail, A.A. Sustainable biochar and/or melatonin improve salinity tolerance in borage plants by modulating osmotic adjustment, antioxidants, and ion homeostasis. Plants 2022, 11, 765. [Google Scholar] [CrossRef]
  35. Ur Rehman, M.Z.; Batool, Z.; Ayub, M.A.; Hussaini, K.M.; Murtaza, G.; Usman, M.; Naeem, A.; Khalid, H.; Rizwan, M.; Ali, S. Effect of acidified biochar on bioaccumulation of cadmium (Cd) and rice growth in contaminated soil. Environ. Technol. Innov. 2020, 19, 101015. [Google Scholar] [CrossRef]
  36. Sahin, O.; Taskin, M.B.; Kaya, E.C.; Atakol, O.; Emir, E.; Inal, A.; Gunes, A. Effect of acid modification of biochar on nutrient availability and maize growth in a calcareous soil. Soil Use Manag. 2017, 33, 447–456. [Google Scholar] [CrossRef]
  37. Lehmann, J.; Kuzyakov, Y.; Pan, G.; Ok, Y.S. Biochars and the plant-soil interface. Plant Soil 2015, 395, 1–5. [Google Scholar] [CrossRef]
  38. Wali, F.; Sardar, S.; Naveed, M.; Asif, M.; Nezhad, M.T.K.; Baig, K.S.; Mustafa, A. Effect of consecutive application of phosphorus-enriched biochar with different levels of P on growth performance of maize for two successive growing seasons. Sustainability 2022, 14, 1987. [Google Scholar] [CrossRef]
  39. Ahmad, M.; Lee, S.S.; Dou, X.; Mohan, D.; Sung, J.; Yang, J.E. Effects of pyrolysis temperature on soybean stover- and peanut shell-derived biochar properties and TCE adsorption in water. Bioresour. Technol. 2012, 118, 536–544. [Google Scholar] [CrossRef]
  40. Cantrell, K.B.; Hunt, P.G.; Uchimiya, M.; Novak, J.M.; Ro, K.S. Impact of pyrolysis temperature and manure source on physicochemical characteristics of biochar. Bioresour. Technol. 2012, 107, 419–428. [Google Scholar] [CrossRef]
  41. Chintala, R.; Schumacher, T.E.; McDonald, L.M.; Clay, D.E.; Malo, D.D.; Papiernik, S.K.; Clay, S.A.; Julson, J.L. Phosphorus sorption and availability from biochars and soil/biochar mixtures. Clean—Soil Air Water 2014, 42, 626–634. [Google Scholar] [CrossRef]
  42. Zhai, L.; CaiJi, Z.; Liu, J.; Wang, H.; Ren, T.; Gai, X.; Liu, H. Short-term effects of maize residue biochar on phosphorus availability in two soils with different phosphorus sorption capacities. Biol. Fertil. Soils 2015, 51, 113–122. [Google Scholar] [CrossRef]
  43. El-Sharkawy, M.; El-Naggar, A.H.; AL-Huqail, A.A.; Ghoneim, A.M. Acid-modified biochar impacts on soil properties and biochemical characteristics of crops grown in saline-sodic soils. Sustainability 2022, 14, 8190. [Google Scholar] [CrossRef]
  44. Major, J.; Rondon, M.; Molina, D.; Riha, S.J.; Lehmann, J. Maize yield and nutrition during 4 years after biochar application to a Colombian savanna oxisol. Plant Soil 2010, 333, 117–128. [Google Scholar] [CrossRef]
  45. Gaskin, J.W.; Speir, R.A.; Harris, K.; Das, K.C.; Lee, R.D.; Morris, L.A.; Fisher, D.S. Effect of peanut hull and pine chip biochar on soil nutrients, corn nutrient status, and yield. Agron. J. 2010, 102, 623–633. [Google Scholar] [CrossRef]
  46. Anwar, S.A.; Ibrahim, M.; Ishaq, M.; Ahmed, N. Use of sulphuric acid on normal calcareous soils. In Proceedings of the Abstracts 10th International Congress of Soil Science Society of Pakistan, Tandojam, Pakistan, 13 September 2004. [Google Scholar]
  47. Zia, M.H.; Ghafoor, A.; Saifullah, T.H.; Boers, M. Comparison of sulphurous acid generator and alternate amendments to improve the quality of saline-sodic water for sustainable rice yields. Paddy Water Environ. 2006, 4, 153–162. [Google Scholar] [CrossRef]
  48. Ghoularata, M.; Raeisi, F.; Nadian, H. Salinity and phosphorus interactions on growth yield and nutrient uptake by Berseem. Clover (Trifolium alexandrinum L.). Field Crops Res. 2006, 6, 117–126. [Google Scholar]
  49. Nannipieri, P.; Giagnoni, L.; Renella, G.; Puglisi, E.; Ceccanti, B.; Masciandaro, G.; Fornasier, F.; Moscatelli, M.C.; Marinari, S. Soil enzymology: Classical and molecular approaches. Biol. Fertil. Soils 2012, 48, 743–762. [Google Scholar] [CrossRef]
  50. Kiss, S.; Stefanic, G.; Dragan-Bularda, M. Soil Enzymology in Romania. Part II Contrib. Bot. Clul. 1974, 32, 197–207. [Google Scholar]
  51. Dick, W.A.; Tabatabai, M.A. Significance and potential use of soil enzymes. Soil Microb. Ecol. 1994, 14, 95–127. [Google Scholar]
  52. Tabatabai, M.A. Soil enzymes. In Methods of Soil Analysis. Part 2—Microbiological and Biochemical Properties; Weaver, R.W., Angle, J.S., Bottomley, P.S., Eds.; Soil Science Society of America and American Society of Agronomy: Madison, WI, USA, 1994; pp. 775–833. [Google Scholar]
  53. Sardinha, M.; Müller, T.; Schmeisky, H.; Joergensen, R.G. Microbial performance in soils along a salinity gradient under acidic conditions. Appl. Soil Ecol. 2003, 23, 237–244. [Google Scholar] [CrossRef]
  54. Rietz, D.N.; Haynes, R.J. Effects of irrigation-induced salinity and sodicity on soil microbial activity. Soil Biol. Biochem. 2003, 35, 845–854. [Google Scholar] [CrossRef]
  55. Wu, H.; Zeng, G.; Liang, J.; Zhang, J.; Cai, Q.; Huang, L.; Shen, S. Changes of soil microbial biomass and bacterial community structure in Dongting Lake: Impacts of 50,000 dams of Yangtze River. Ecol. Eng. 2013, 57, 72–78. [Google Scholar] [CrossRef]
  56. Moradi, S.; Rasouli-Sadaghiani, M.H.; Sepehr, E.; Khodaverdiloo, H.; Barin, M. Soil nutrients status affected by simple and enriched biochar application under salinity conditions. Environ. Monit. Assess. 2019, 191, 1–13. [Google Scholar] [CrossRef]
  57. Luo, Y.; Zang, H.; Yu, Z.; Chen, Z.; Gunina, A.; Kuzyakov, Y.; Brookes, P.C. Priming effects in biochar enriched soils using a three-source-partitioning approach: 14C labelling and 13C natural abundance. Soil Biol. Biochem. 2017, 106, 28–35. [Google Scholar] [CrossRef]
  58. Mitchell, P.J.; Simpson, A.J.; Soong, R.; Simpson, M.J. Shifts in microbial community and water-extractable organic matter composition with biochar amendment in a temperate forest soil. Soil Biol. Biochem. 2016, 81, 244–254. [Google Scholar] [CrossRef]
  59. Zhou, G.; Zhou, X.; Zhang, T.; Du, Z.; He, Y.; Wang, X.; Xu, C. Biochar increased soil respiration in temperate forests but had no effects in subtropical forests. For. Ecol. Manag. 2017, 405, 339–349. [Google Scholar] [CrossRef]
  60. Rutigliano, F.A.; Romano, M.; Marzaioli, R.; Baglivo, I.; Baronti, S.; Miglietta, F.; Castaldi, S. Effect of biochar addition on soil microbial community in a wheat crop. Eur. J. Soil Biol. 2014, 60, 9–15. [Google Scholar] [CrossRef]
  61. Ameloot, N.; Maenhout, P.; De Neve, S.; Sleutel, S. Biochar-induced N2O emission reductions after field incorporation in a loam soil. Geoderma 2016, 267, 10–16. [Google Scholar] [CrossRef]
Figure 1. X-ray diffraction (XRD) spectra of apple biochar (a), grape biochar (b), mixture of apple and grape biochars (1:1) (c), HCl modified biochar (d), H3PO4 modified biochar (e) and rock phosphate modified biochar (f).
Agriculture 13 00805 g001aAgriculture 13 00805 g001b
Figure 2. Mean comparison of Olsen-p values for different soil treatments. PSB: phosphate solubilizing bacteria, BC: biochar, BC-PSB: biochar with phosphate solubilizing bacteria, BC-PSB-RP: biochar enriched with PSB and RP, BC-HCl-PSB: biochar enriched with HCl -RP, BC-H3PO4-RP: biochar enriched with H3PO4-RP, TSP: triple super phosphate, Cont: control. Means with similar letters are not significantly different at 1% probability level according to LSD test. Error bars are standard deviation of the means (n = 3), S1 and S2: soil 1 with EC = 2 dS.m−1 and soil 2 with EC = 15 dS.m−1, respectively.
Agriculture 13 00805 g002
Figure 3. Effect of different treatments on dry matter yield of wheat. PSB: phosphate solubilizing bacteria, BC: biochar, BC-PSB: biochar with phosphate solubilizing bacteria, BC-PSB-RP: biochar enriched with PSB and RP, BC-HCl-PSB: biochar enriched with HCl -RP, BC-H3PO4-RP: biochar enriched with H3PO4-RP, TSP: triple super phosphate, Cont: control. Means with similar letters are not significantly different at 1% probability level according to LSD test. Error bars are standard deviation of the means (n = 3), S1 and S2: soil 1 with EC = 2 dS.m−1 and soil 2 with EC = 15 dS.m−1, respectively.
Agriculture 13 00805 g003
Figure 4. Effect of different treatments on total P content of wheat. PSB: phosphate solubilizing bacteria, BC: biochar, BC-PSB: biochar with phosphate solubilizing bacteria, BC-PSB-RP: biochar enriched with PSB and RP, BC-HCl-PSB: biochar enriched with HCl -RP, BC-H3PO4-RP: biochar enriched with H3PO4-RP, TSP: triple super phosphate, Cont: control. Means with similar letters are not significantly different at 1% probability level according to LSD test. Error bars are standard deviation of the means (n = 3), S1 and S2: soil 1 with EC = 2 dS.m−1 and soil 2 with EC = 15 dS.m−1, respectively.
Agriculture 13 00805 g004
Figure 5. Effect of different treatments on phosphatase activity of soils, (a): alkaline phosphatase (AlP) and (b) acidic phosphatase (AcP), respectively. PSB: phosphate solubilizing bacteria, BC: biochar, BC-PSB: biochar with phosphate solubilizing bacteria, BC-RP-PSB: biochar enriched with PSB and RP, BC-HCl-PSB: biochar enriched with HCl-RP, BC-H3PO4-RP: biochar enriched with H3PO4-RP, TSP: triple super phosphate, Cont: control. Means with similar letters are not significantly different at 1% probability level according to LSD test. Error bars are standard deviation of the means (n = 3), S1 and S2: soil 1 with EC = 2 dS.m−1 and soil 2 with EC = 15 dS.m−1, respectively.
Agriculture 13 00805 g005aAgriculture 13 00805 g005b
Figure 6. Effect of different treatments on soil respiration indices. (a): Basal respiration; (b): Substrate-Induced Respiration. PSB: phosphate solubilizing bacteria, BC: biochar, BC-PSB: biochar with phosphate solubilizing bacteria, BC-PSB-RP: biochar enriched with PSB and RP, BC-HCl-PSB: biochar enriched with HCl -RP, BC-H3PO4-RP: biochar enriched with H3PO4-RP, TSP: triple super phosphate, Cont: control. Means with similar letters are not significantly different at 1% probability level according to LSD test. Error bars are standard deviation of the means (n = 3), S1 and S2: soil 1 with EC = 2 dS.m−1 and soil 2 with EC = 15 dS.m−1, respectively.
Agriculture 13 00805 g006
Table 1. Physical and chemical properties of biochars (BC).
pHEC
(dS.m−1)
P-ava (mg kg−1)CEC
(cmol+kg−1)
C
%
H/CO/CTN
%
Apple BC7.61.27.264/5660.490.160.7
Grape BC8.21.61259760.580.210.85
BC-RP-H3PO45.11.848-560.830.922.5
BC-RP-HCl4.92.127-610.690.491.7
EC; Electrical Conductivity, P-ava; Available P, CEC; Cation Exchangeable Capacity, C; Carbon, H/C; Hydrogen/Carbon Ratio, O/C; Oxygen/Carbon Ratio, TN; Total Nitrogen.
Table 2. Amounts of phosphate fertilizer forms used (g P/100 gsoil).
SoilPSBBCBC-PSBBC-RPBC-RP-PSBBC-HCl-RPBC-H3PO4-RPTSP
S1-4.14.11.91.91.90.830.073
S2-3.33.31.51.51.50.70.06
PSB: phosphate solubilizing bacteria, BC: biochar, BC-PSB: biochar with phosphate solubilizing bacteria, BC-RP-PSB: biochar enriched with PSB and RP, BC-HCl-PSB: biochar enriched with HCl-RP, BC-H3PO4-RP: biochar enriched with H3PO4-RP, TSP: triple super phosphate, Cont: control, S1 and S2: soil 1 with EC = 2 dS.m−1 and soil 2 with EC = 15 dS.m−1, respectively.
Table 3. Nutrients required based on soil test results.
NutrientsRate (mg kg−1 Soil)Source
N100Urea
K100K2SO4
Fe10EDDHA-Fe
Mn10MnSO4
Zn10ZnSO4
Cu2CuSO4
B1H3BO3
Table 4. PGP properties of studied bacteria.
IsolatesIAAEPSHCNSiderophoreP-SolubilizationZn-Solubilization
Pseudomonas aeruginosa++++ +
Pseudomonas fluorescens+++++ +
Stenotrophomonas maltophilia+++ +
Table 5. Physical and chemical properties of the soils.
SoilpHEC
(dS.m−1)
CEC
(cmol+kg−1)
CCE
%
SAR
(meq L−1)
ESP
%
OC
%
P-ava
(mg kg−1)
Clay
%
Silt
%
Sand
%
S18.1219.211.52.0830.165363034
S27.61515.88.56.790.097303040
EC: Electrical Conductivity, CCE: Calcium Carbonate Equivalent, SAR: Sodium adsorption ratio, ESP: Exchangeable Sodium Percentage, OC: Organic Carbon, P-ava: Available-P, S1 and S2: soil 1 with EC = 2 dS.m−1 and soil 2 with EC = 15 dS.m−1, respectively.
Table 6. Analysis of variance for Olsen-P and some soils biological indicator.
MS
DFAl-PAc-POlsen-PpHECDMP-ContentBRSIR
Soil121,808 **14,568 **156 **6.8 **2283 **5.48 **0.035 **0.01 **0.101 ns
Treat813,858 **20,208 **1528 **1.1 **0.015 ns79.7 **0.44 **0.05 **0.049 ns
Soil × Treat83654 **851 **40.8 **0.15 **0.012 ns4.5 **0.006 **0.011 **0.005 ns
Error34400.715713.90.010.0090.20.0010.0120.003
CV (%) 2215.3121.31.1815.79.510.9
Al-P: alkaline phosphatase (µg PNP.g−1.h−1), Ac-P: acid phosphatase (µg PNP.g−1.h−1), EC: dS.m−1, Olsen-P (mg kg−1), DM: dry matter weight (g/pot), BR: basal respiration (mg CO2-C kg−1 day−1), SIR: substrate-induced respiration (mg CO2-C kg−1 day−1), P-content (%), ** and ns: significant at probability (0.05) and (0.01) and not significant, respectively.
Table 7. Effect of treatments on soil pH during the incubation.
Experimental TreatmentsS1 SoilS2 Soil
pHECpHEC
Control8.1ab2b7.5ab15ab
PSB8.0b2b7.4b14.9bc
BC8.1b2.1b7.6a15ab
BC-PSB8.0c2b7.4b14.9bc
BC-RP8.06b2b7.6a15ab
BC-RP-PSB7.8c2b7.1c15ab
BC-HCl-RP7.5d2b6.4d15ab
BC-H3PO4-RP7.54d2b6.34d15.1a
TSP8.2a2.16a7.5ab15.1a
LSD0.120.130.20.13
CV (%)344.64
PSB: phosphate solubilizing bacteria, BC: biochar, BC-PSB: biochar with phosphate solubilizing bacteria, BC-PSB-RP: biochar enriched with PSB and RP, BC-HCl-PSB: biochar enriched with HCl-RP, BC-H3PO4-RP: biochar enriched with H3PO4-RP, TSP: triple super phosphate, Cont: control. Means with similar letters are not significantly different at 1% probability level according to LSD test, S1 and S2: soil 1 with EC = 2 dS.m−1 and soil 2 with EC = 15 dS.m−1, respectively.
Disclaimer/Publisher’s Note: The statements, opinions and data contained in all publications are solely those of the individual author(s) and contributor(s) and not of MDPI and/or the editor(s). MDPI and/or the editor(s) disclaim responsibility for any injury to people or property resulting from any ideas, methods, instructions or products referred to in the content.

