Article

Design and Experimental Verification of Targeted and Variable Sprayer for the Potato

College of Mechanical and Electronic Engineering, Northwest A&F University, Xianyang 712100, China
*
Author to whom correspondence should be addressed.
Agriculture 2023, 13(4), 797; https://doi.org/10.3390/agriculture13040797
Submission received: 7 March 2023 / Revised: 27 March 2023 / Accepted: 28 March 2023 / Published: 30 March 2023
(This article belongs to the Section Agricultural Technology)

Abstract

:
For potatoes, a crop with a specific plant spacing and a large row spacing, continuous spray has problems including low spraying accuracy and washability. In order to improve the utilisation of this crop, this manuscript designed a targeted and variable sprayer. To ensure that the spray function is achieved, the design and verification of the vehicle body and the targeting device of the sprayer were carried out. To guarantee that the automation and precision of spray are improved, the autonomous marching system based on the Ultra-wideband (UWB) module and the targeted and variable spray system based on the Open machine vision (Open MV) module, were built. The experiments showed that the sprayer could follow a preset route, correct its marching direction in time, and provide feedback on its position. The targeted and variable spray was influential on the surface and back of the leaf (about 66%) and more uniform than the general spray mode. Moreover, the sprayer’s targeted and variable spray mode reduced the amount of liquid applied by 37.9% compared to the continuous spray mode, significantly improving the liquid utilisation rate.

1. Introduction

Pesticides have helped save humanity from immeasurable losses due to plant diseases [1,2]. However, the history of pesticide use has always been characterised by high application and low utilisation rates [3,4]. According to statistics, the pesticide utilisation rate of China’s three major food crops has only reached about 40% after decades of improvement. The development of sprayers and technology directly impacts food security and ecological safety. Large upland boom sprayers and plant protection drones have a high penetration rate in developed countries such as Europe and the USA. They are essential technical equipment for plant protection operations [5,6] and the preferred devices for spraying operations. Both boom sprayers and UAVs use continuous spray, which is more suitable for densely grown crops such as wheat, where the spacing between plants is small, and droplet drift is not a concern. Unlike wheat, however, the potato is a typical monopoly crop with large spacing between plants and rows. These sprayers do not adjust to the spacing between plants and rows of potatoes but spray the entire planted area continuously without discrimination, resulting in many droplets being lost to the surrounding environment, low pesticide utilization, and severe environmental pollution.
Precision variable spray technology has been proposed to address the issues mentioned above with continuous spray. Precision variable spray technology aims for optimal pest control with the least pesticides [7]. Its core objective is to obtain information on small areas and apply advanced technology to spray crops as needed. It not only effectively improves pesticide utilisation but also enhances crop quality. In recent years, it has developed rapidly. Berenstein et al. [8] presented a human–robot collaborative sprayer designed for site-specific targeted spraying. Xiang et al. [9] have summed up technologies such as ultrasonic target detection to develop the 3WPZ-4 sprayer, which has increased the relative deposition rate of liquid by 17.2%. Baltazar [10] has developed a crop sensing system for the sprayer, which enables precise spraying by detecting crop leaf density. Changjie et al. [11] obtained crop offset information using central line geometry and established a row offset compensation model. They designed a row spraying control system that kept the row error of cabbage crops within 1.54 cm. However, there are significant limitations to applying precision variable spraying technology for field crops. The high cost of detection hardware and the fact that different technologies may only be suitable for one or a few crops has increased the cost of plant pest control.
Based on the above, this manuscript considers the potato field’s terrain characteristics and disease prevention and control requirements. Moreover, this paper combines precision variable spray technology and proposes the following requirements: (1) low cost, stable and reliable, and able to march independently along preset routes; (2) able to detect crop position and perform targeted and variable spray accurately.
This manuscript uses plane positioning technology and machine vision methods to coordinate the operation of the sprayer, information acquisition, target tracking, and variable spraying control to meet these requirements. It develops an autonomous marching system and targeted and variable spray system, designs a targeted and variable sprayer, and conducts performance tests to promote the reduction of plant protection operations while increasing efficiency.

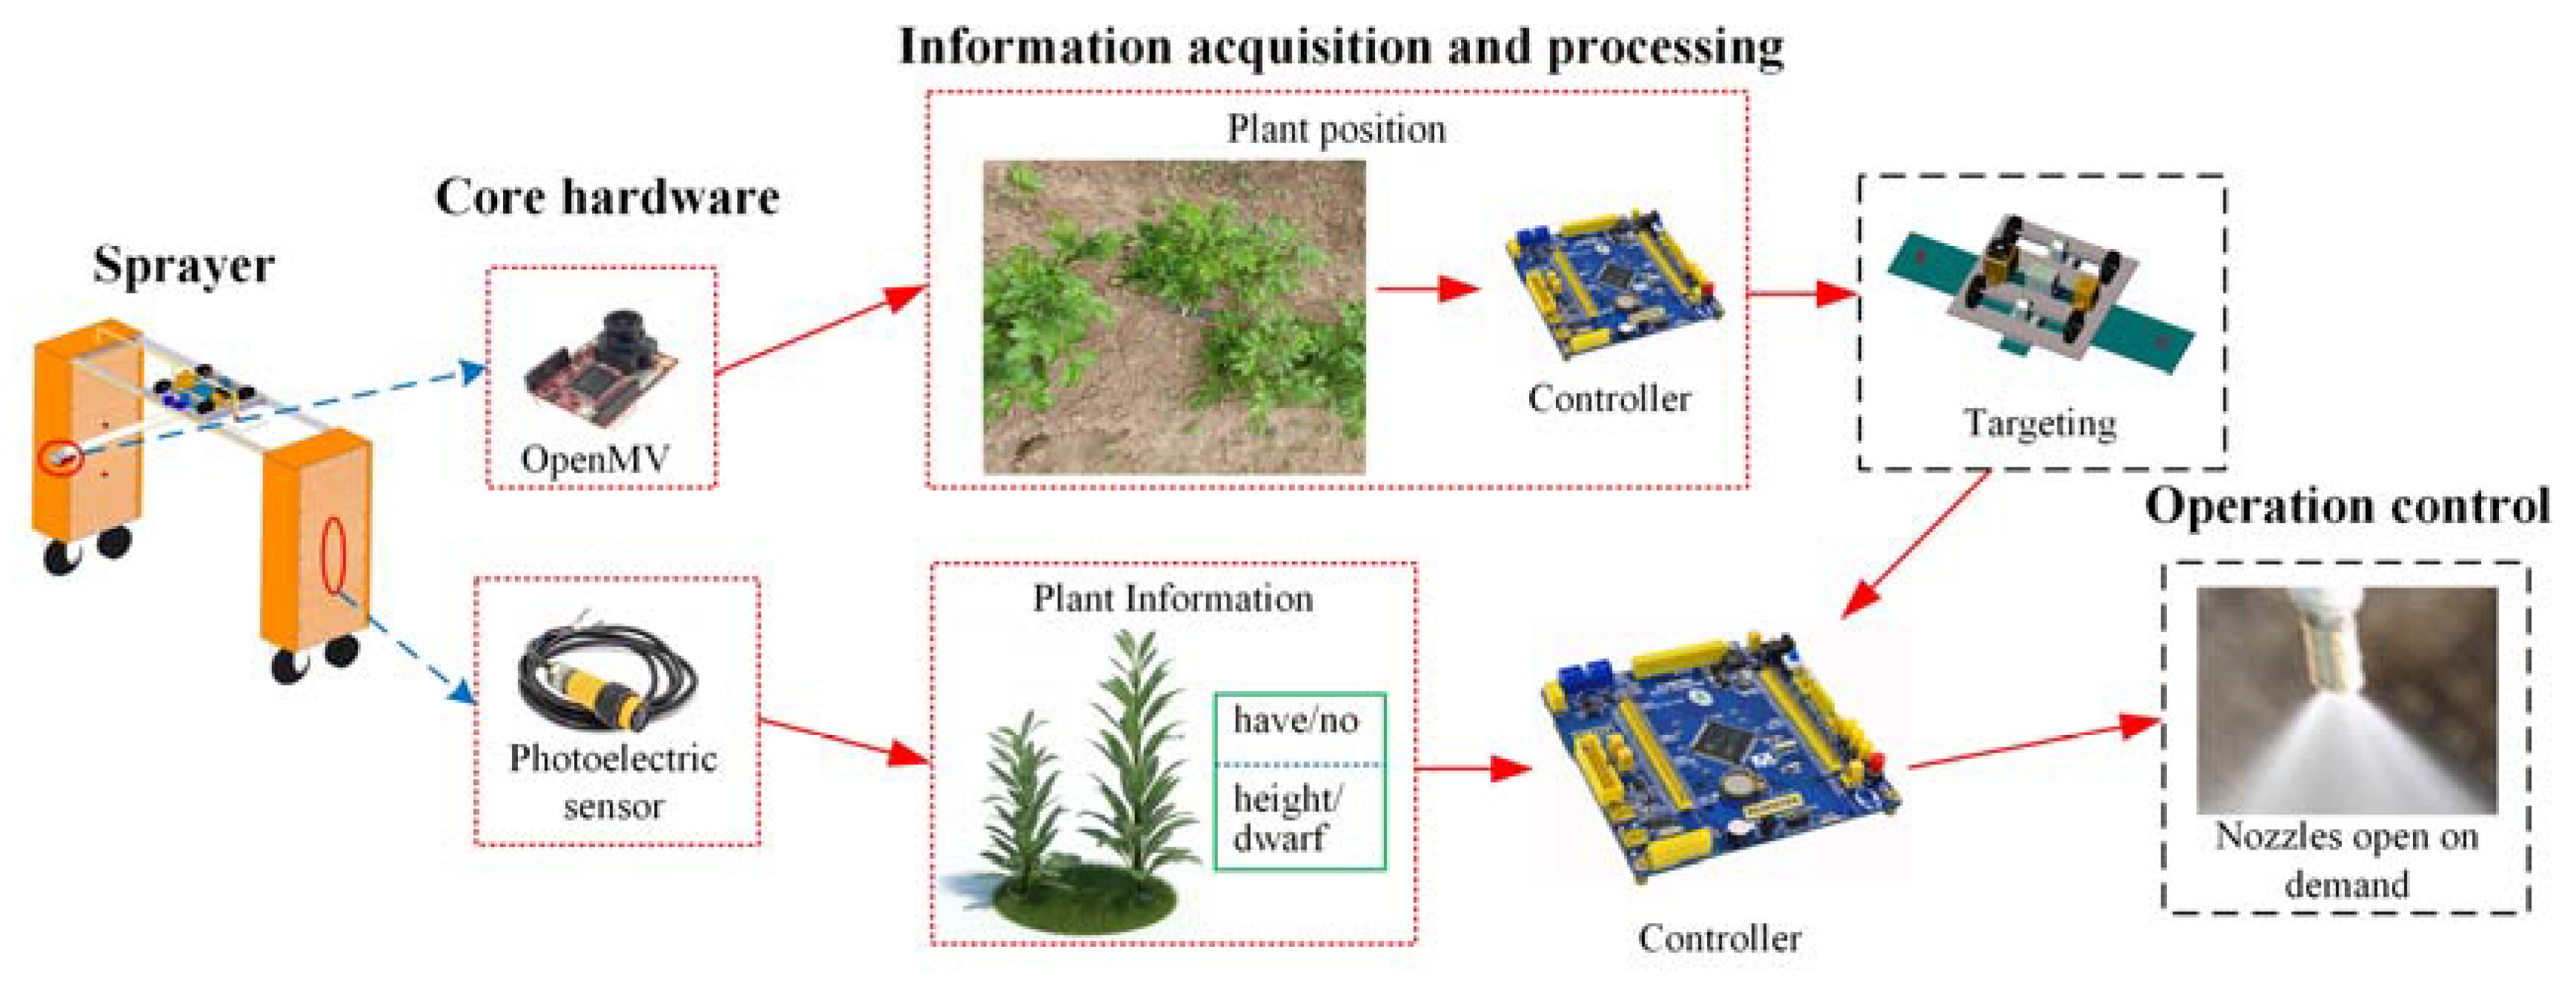
2. Machine Structure and Working Principle

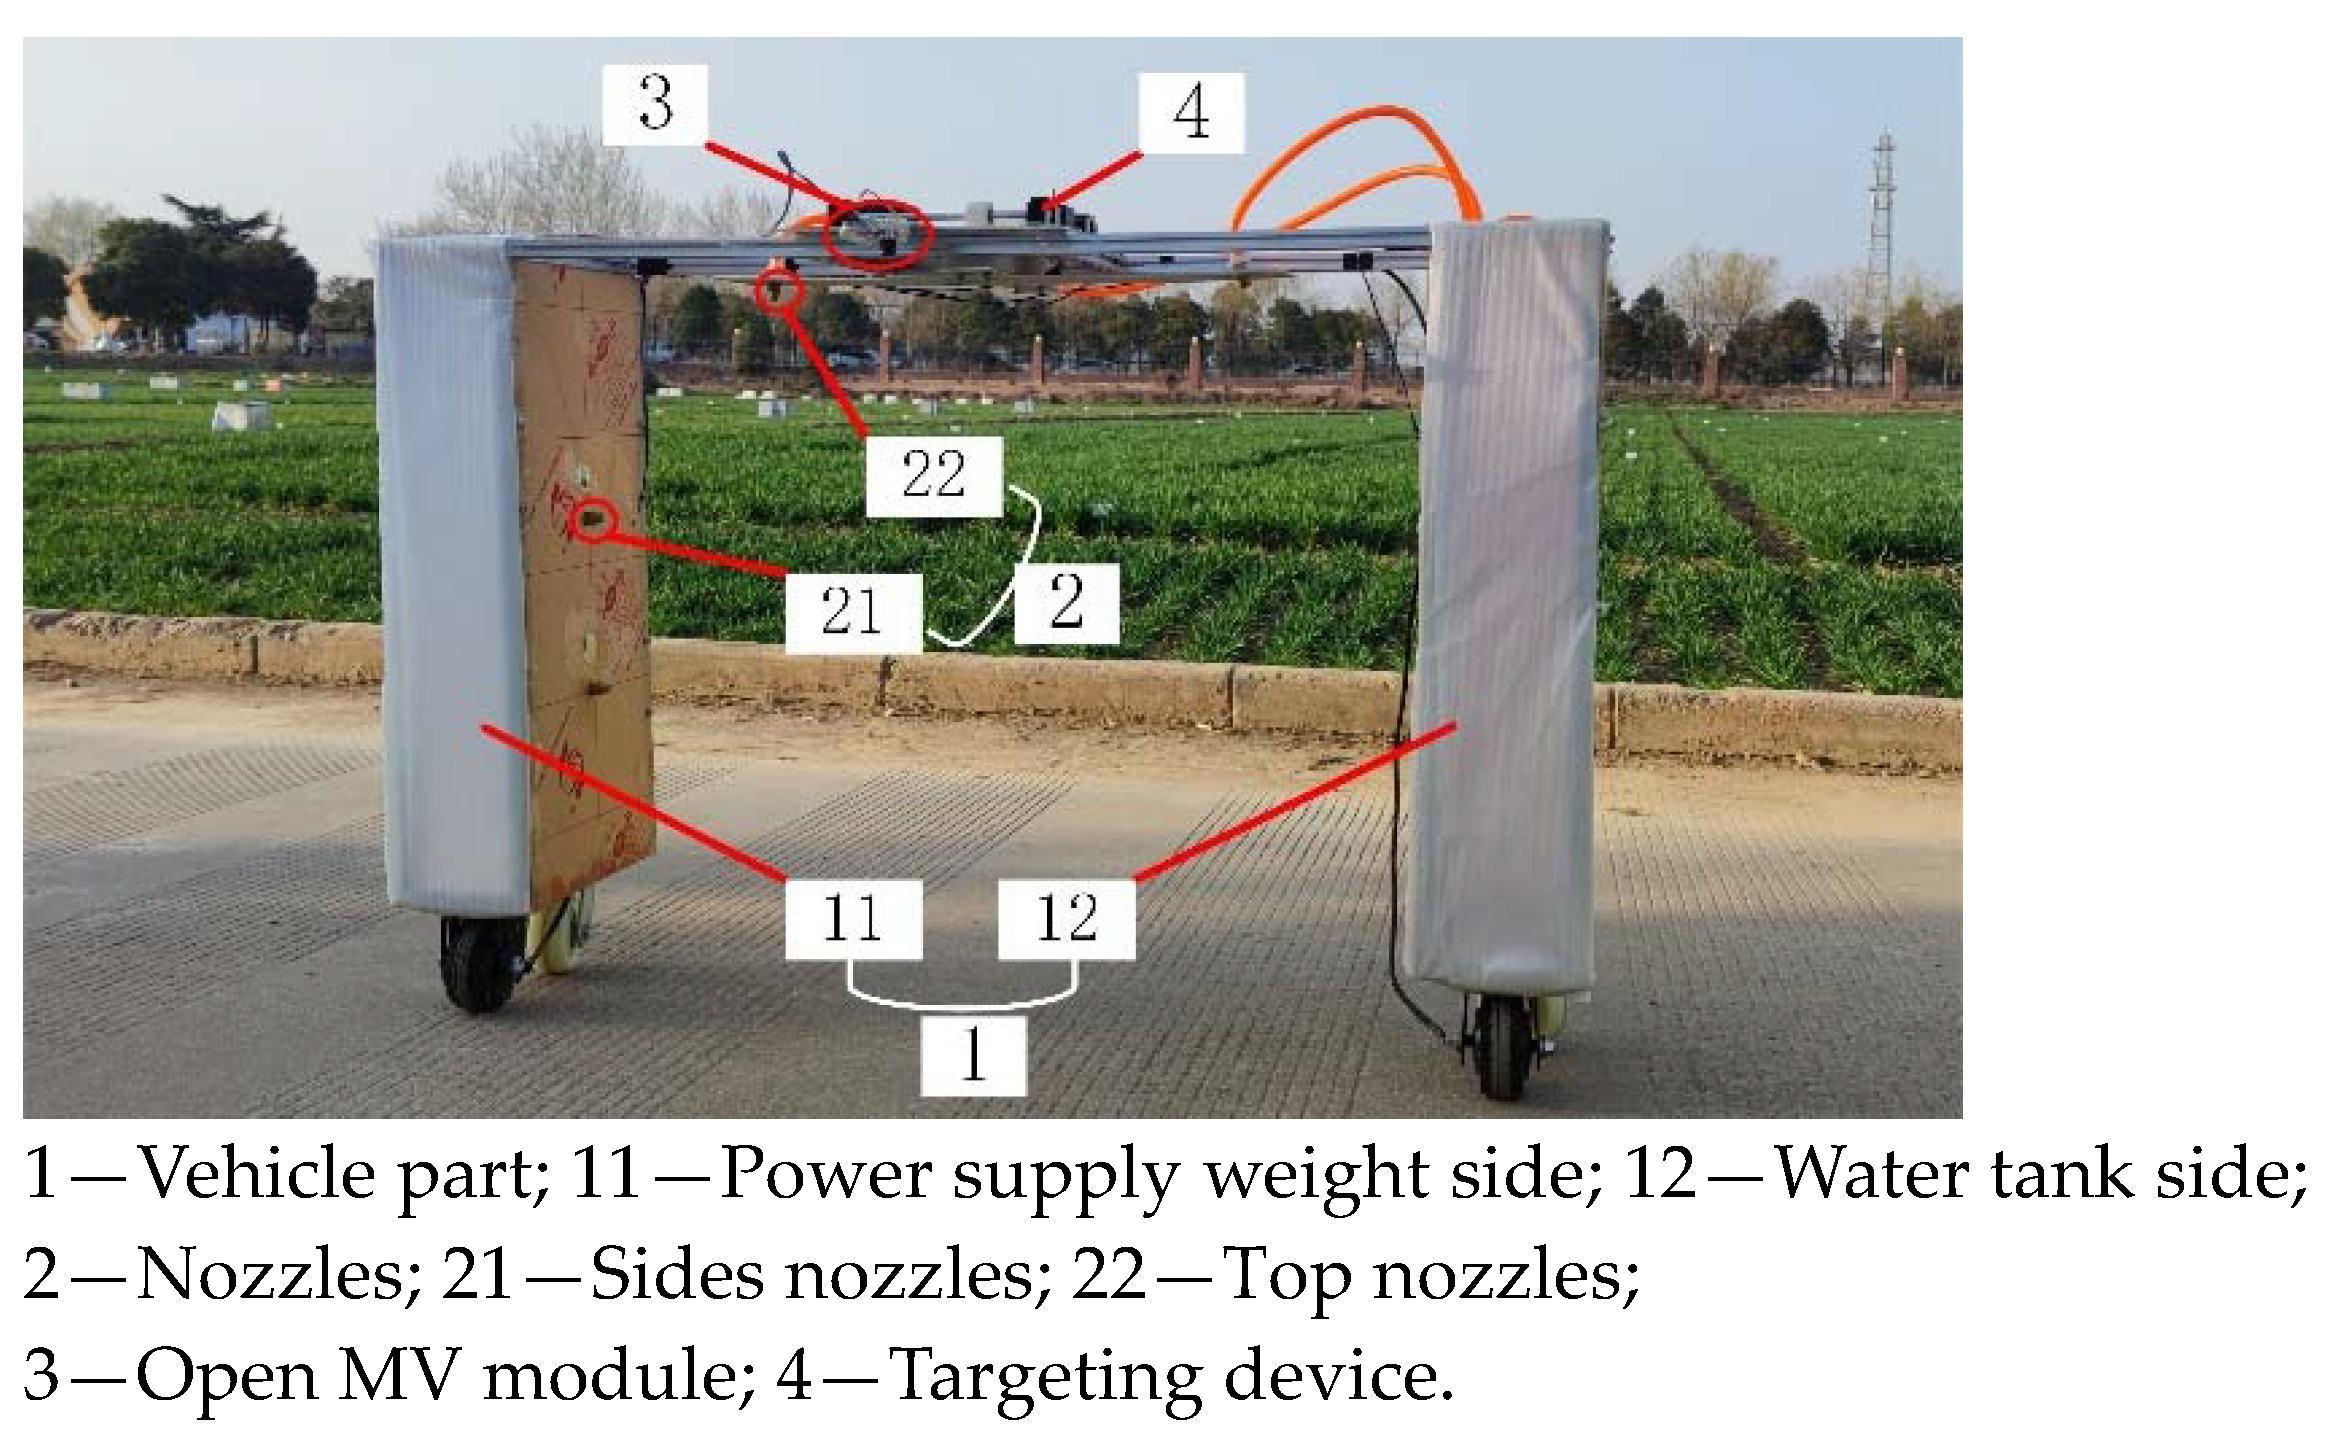
2.1. Machine Structure

In order to achieve functions of droplets moving from the outside to the inside and from top to bottom as well as the autonomous marching of the sprayer, the targeted and variable sprayer designed in this manuscript is mainly composed of a targeted and variable spray system, autonomous marching system, and vehicle part. The machine’s overall structure is in a “∏” shape, as shown in Figure 1. The vehicle part of the frame is mainly built with aluminium profiles, which ensure high strength while being easy to adjust, lightweight and low price.

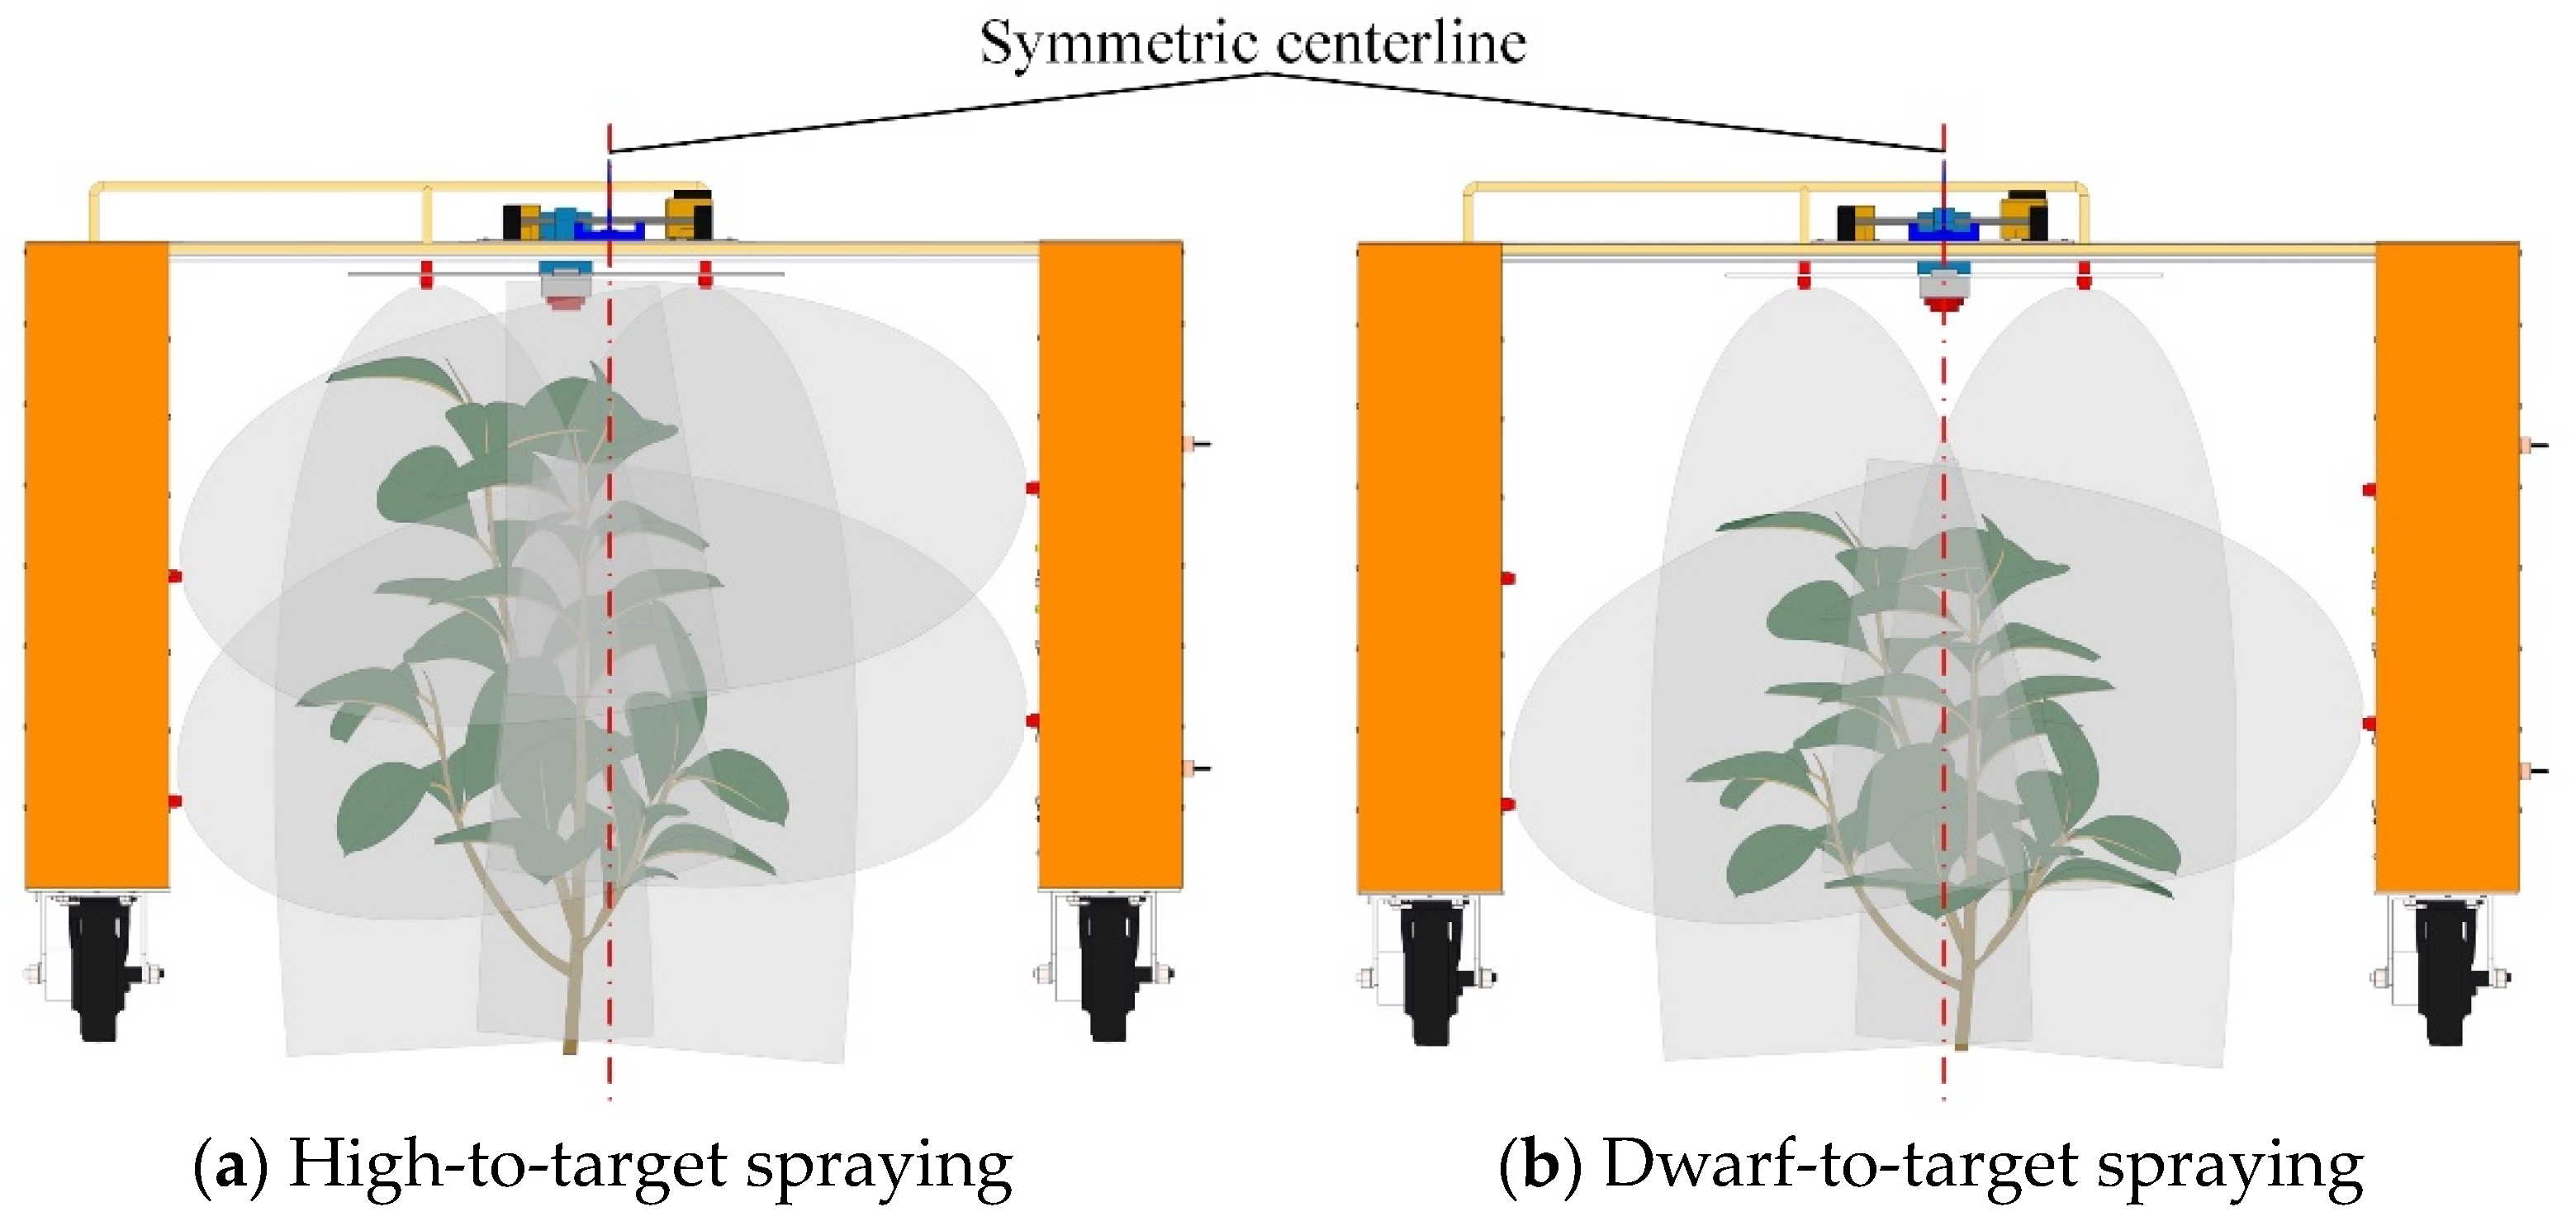
2.2. Working Principle

The sprayer is operated by cross-row self-propulsion, powered by a battery. Hub motors and various systems enable the coordinated operation of the liquid pump, walking device, and targeting the device at the designed power and speed. The flat positioning module is used to obtain the real-time location information of the sprayer in the field. The machine vision module recognises the position of the crop, compares it with the preset route and spraying parameters, and calculates the targeted and variable spray that the sprayer needs to perform. The spray system adjusts its working state according to the instructions of the control system, achieving precise spraying of pesticides to reduce environmental pollution caused by the drifting of droplets.
The top nozzles of the sprayer can move laterally with the targeting device. At the same time, the OpenMV module is fixed on the front side of the vehicle body to reserve reaction time for the targeting movement of the targeting device. During operation, the UWB module locates the sprayer, and the gyroscope determines the heading deviation of the sprayer, allowing it to march along the preset route. As shown in Figure 2, during marching, the controller determines whether work is needed and how to perform it based on the plant position information feedback from the OpenMV module and the plant height information feedback from the photoelectric sensor. The sprayer only aligns the top nozzle with the geometric centre of the plant (targeting) and controls the corresponding nozzle to open (spray start) when there is a plant. The spray ends (spray end) when the photoelectric sensor feedback shows no plant.
The main technical parameters of the sprayer are shown in Table 1.

3. The Essential Components of Design

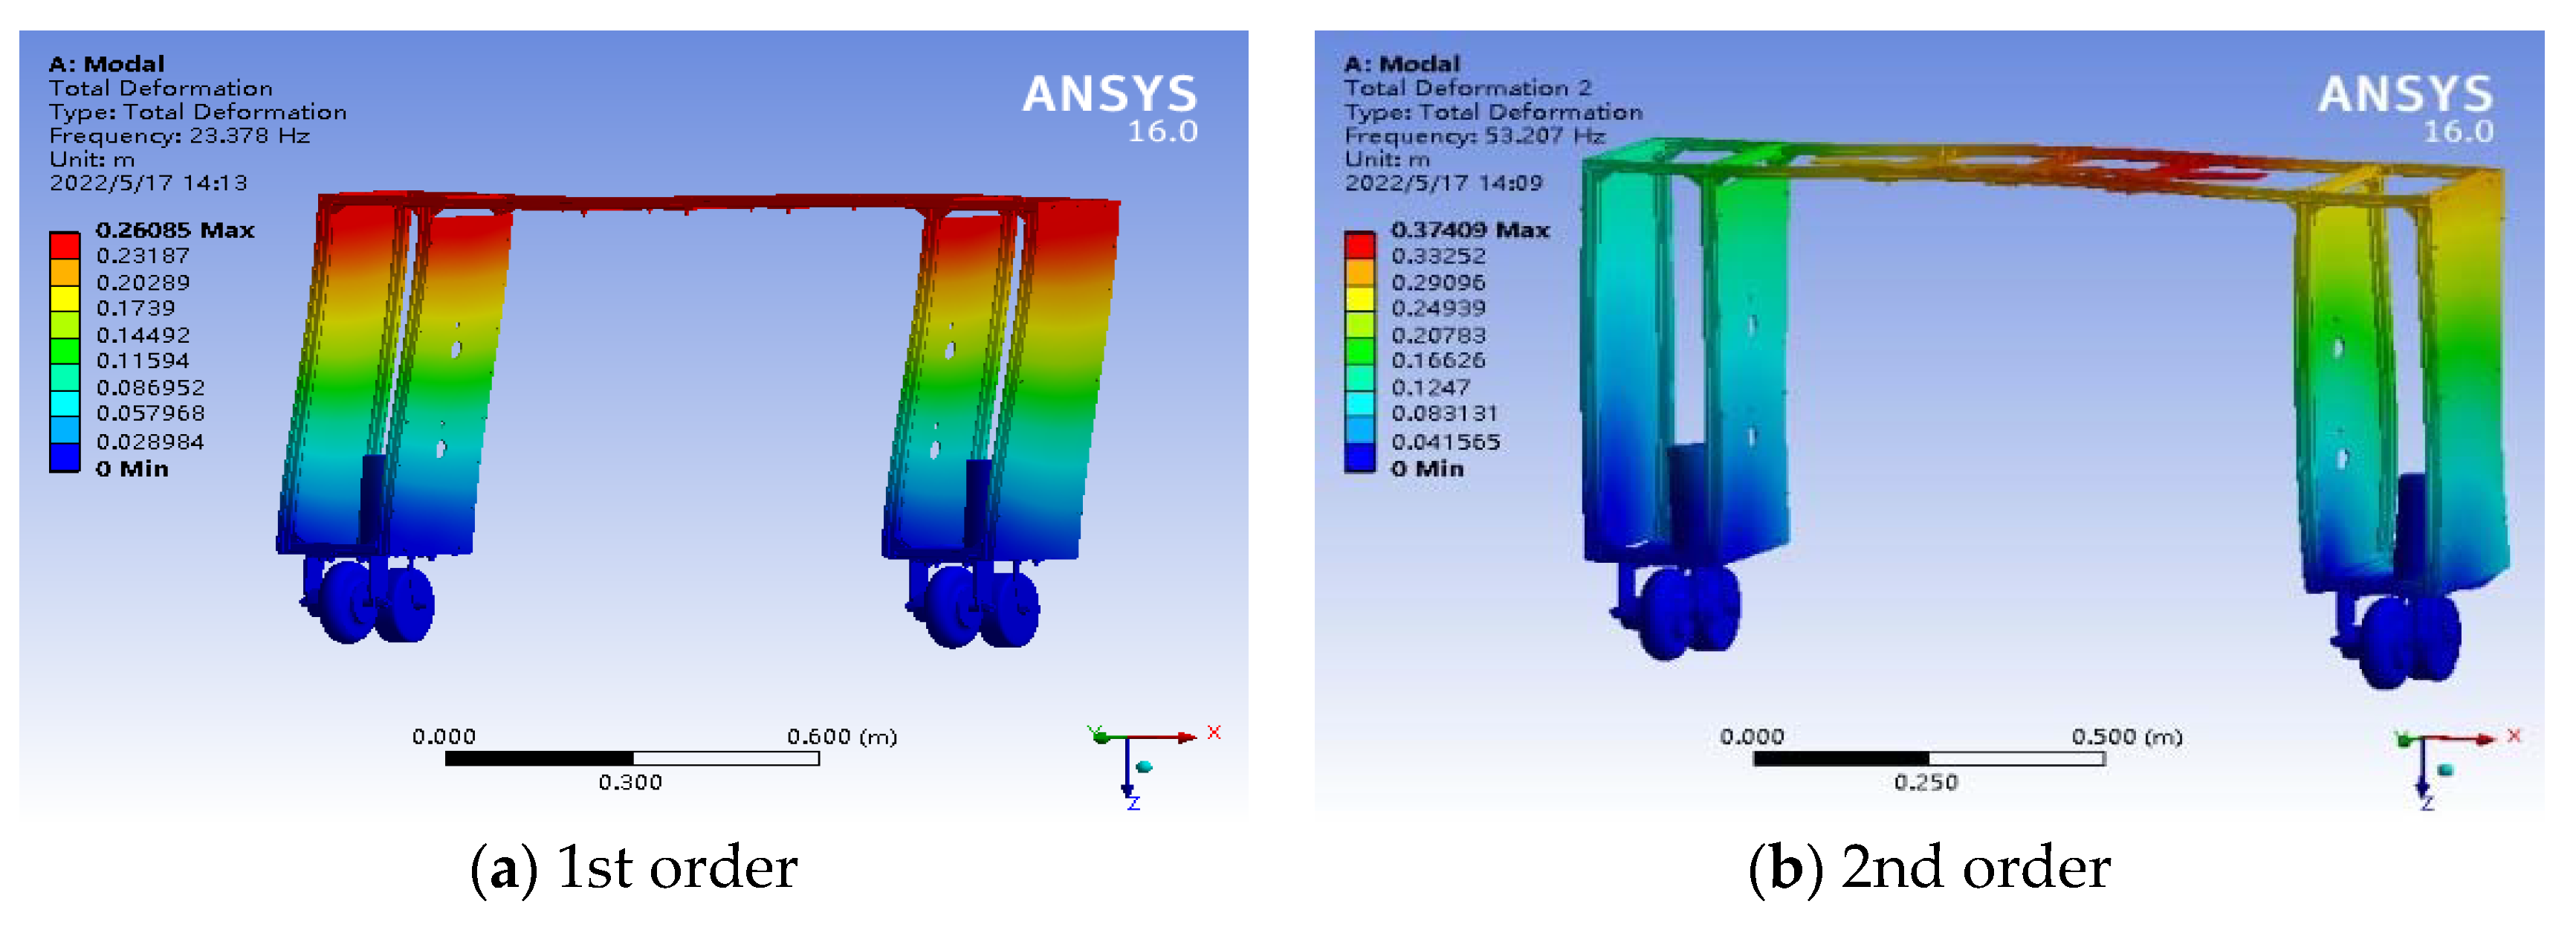
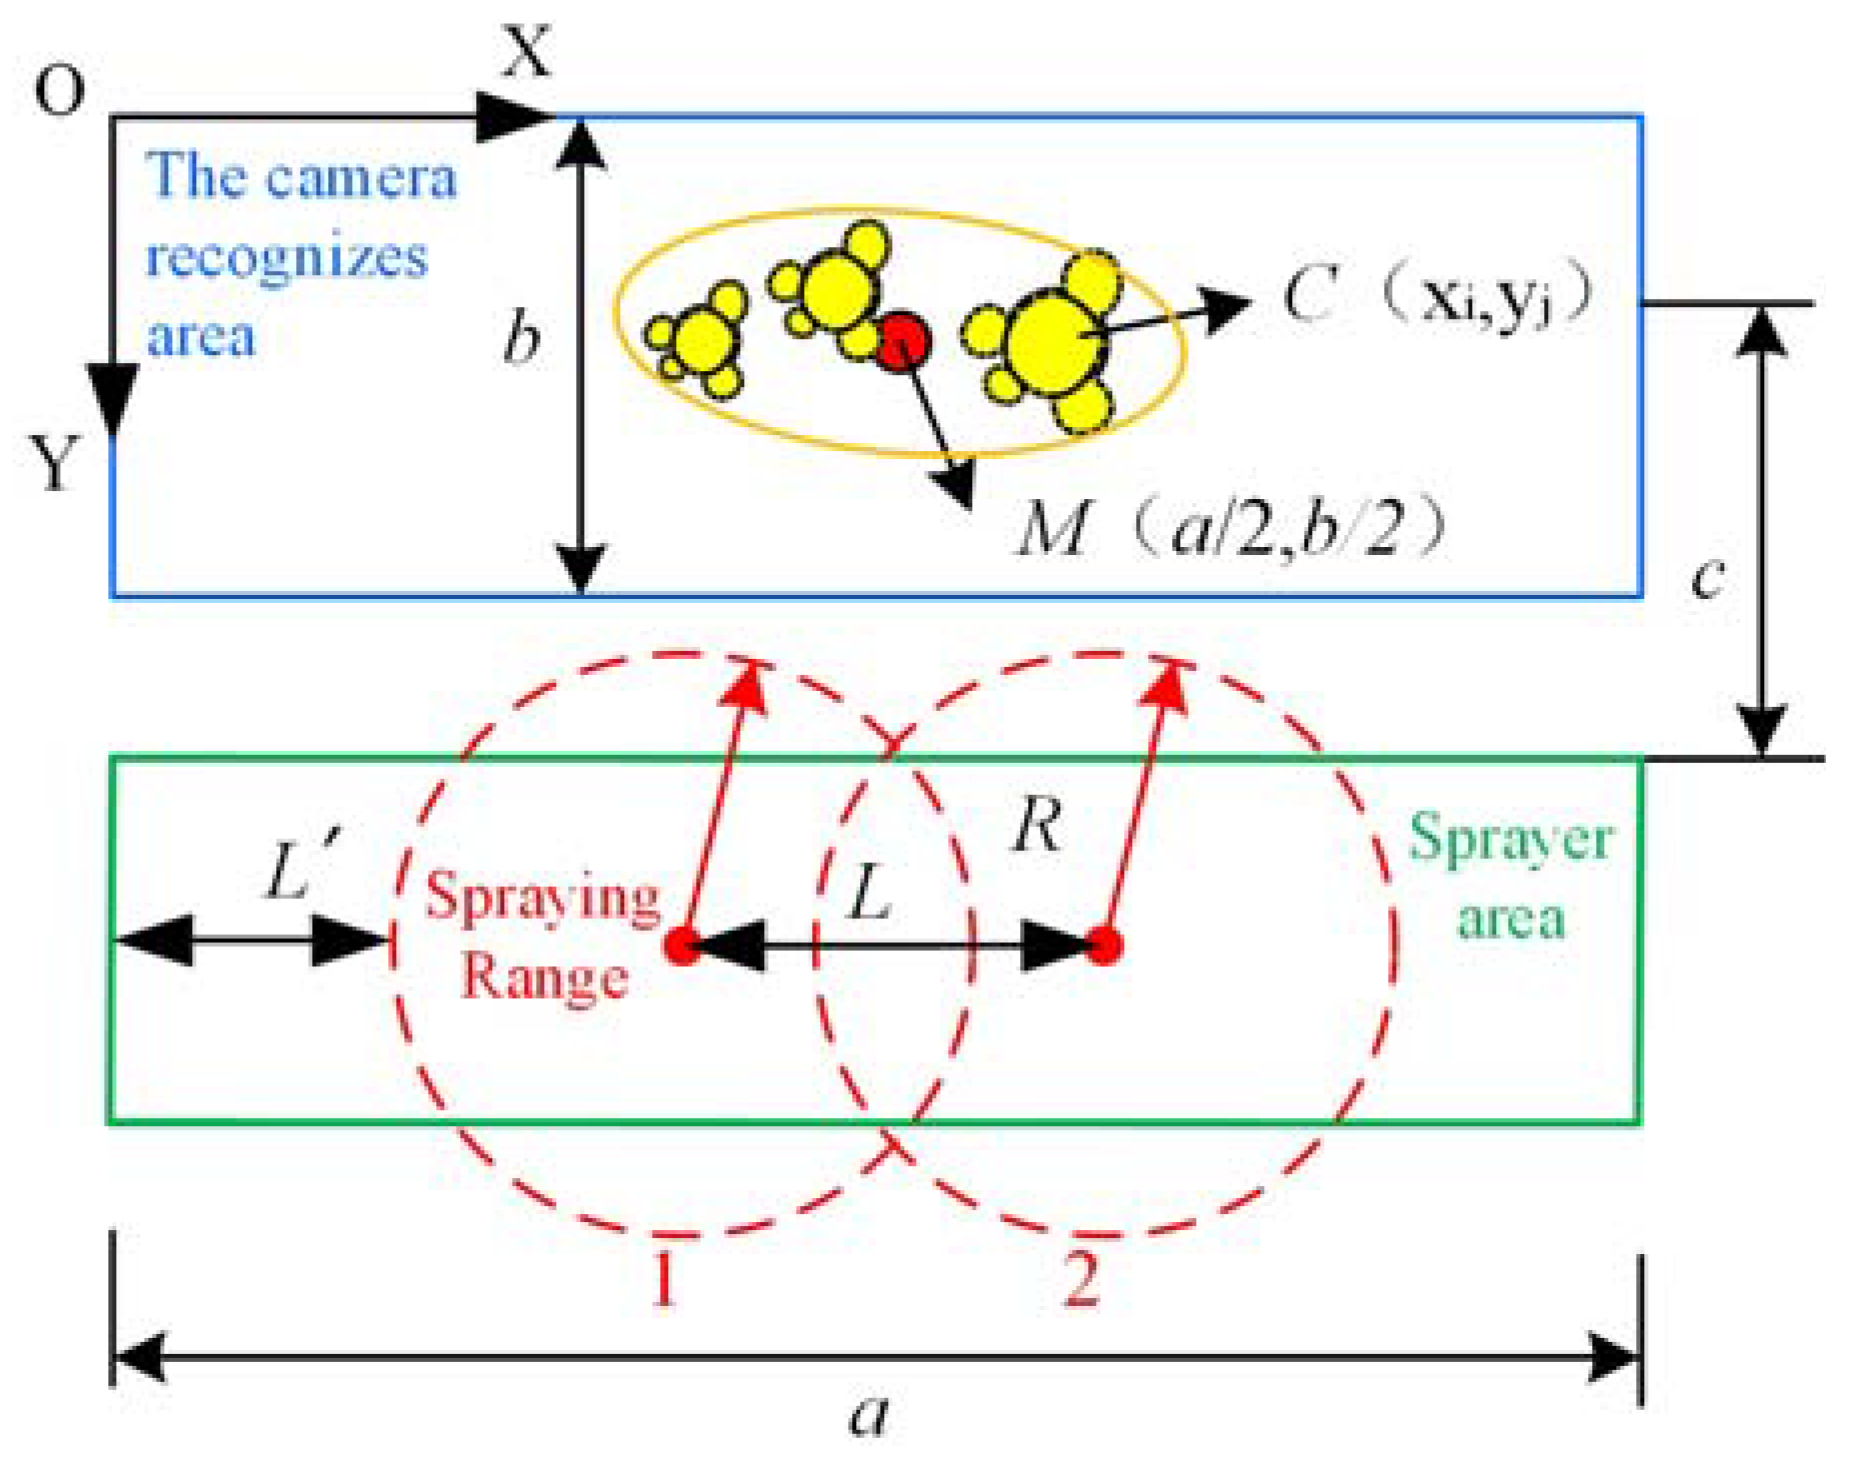
3.1. Vehicle Part Design and Verification

The resonance phenomena may cause damage to components. In order to avoid it, a modal analysis approach is used to obtain the modal parameters of the vehicle body [12,13,14,15,16]. It is because there is a high probability of resonance occurring when the inherent frequency of the vehicle body is close to the frequency of an external vibration source, which can increase the amplitude of the vehicle body [17].
The forced vibration differential Equation is:
M x + C x + K x = p ( t )
In the Equation: M , C , K —the mass, damping, and stiffness matrices of the system structure, respectively; x , x , x —the acceleration, velocity, and displacement matrices, respectively; p ( t ) —the external excitation matrix.
Under a fixed frequency excitation and with no external force input, the response of the vehicle body is fixed, and the vehicle body is an underdamped system. Thus, C = 0 , p ( t ) = 0 . The vehicle body is driven by the wheel hub motor and can be considered a harmonic oscillator. We can take the mode shape vector ϕ and the modal frequency and ω then have the following:
x = ϕ e j ω t
Thus, rearranging Equation (1), obtain:
( K ω 2 M ) ϕ = 0
If there exists a non-zero solution to Equation (3), then the natural frequency and mode shape expressions of the vehicle body part are given by:
K ω 2 M = 0
Modal analysis was performed on the vehicle body using ANSYS 16.0 software. Since low-frequency vibrations significantly impact the structure’s dynamic characteristics, the first four natural frequencies and corresponding mode shapes of the sprayer were obtained, as shown in Table 2.
The corresponding vibration patterns for the first 4 orders of the vehicle part are shown in Figure 3.
During the movement of the sprayer, the primary influence is in the Y direction, with less influence in the X and Z directions. The analysis results show that the deformation of the vehicle body in the Y direction is relatively small, so there will be no blatant interference, and the mode shape is reasonable. The external vibration source of the vehicle body is the motor, with an excitation frequency of 15 Hz. With the increase of the order, the natural frequency of the sprayer increases gradually, even the 1st order with the smallest natural frequency reaches 23.387 Hz. However, the excitation frequency of the external vibration source of the spray is 15 Hz, which means that the excitation frequency of the external vibration source can never reach the natural frequency of the sprayer, so the possibility of resonance is very slight, which can meet the actual use requirements.
The dimensions of the vehicle structure should meet the spray requirements. According to the theory of optimal particle size for biological applications [18], the optimal particle size for plant disease control is between 30–150 μm. Based on this, it can be inferred that the amount of liquid sprayed should be between 4.5–450 L/ha, and the working pressure of the small spray machine should be less than 0.6 MPa. They used formula (5) to calculate the required pump flow rate Q [19].
Q = A   W   V / 600
The variables in the formula are: A —Liquid application rate, L/ha; W—Spray width, m; V—Move speed, km/h.
The trajectory of the spray from the lateral nozzle is a parabolic curve due to the effect of gravity. To ensure effective spray deposition on the plants, verifying the spray’s flow velocity at the nozzle after selecting the liquid pump is necessary. The feasibility is determined by comparing the velocity ( v s ) of the spray at the nozzle with the spray’s horizontal coverage velocity ( v x m i n ).
Use the mechanical relationship, t = 2 g Δ h , v x = Δ x / t , to obtain the actual minimum horizontal speed required v x m i n .
The pesticide is pressurised by the pump and connected to the same diameter three-way pipe (ignoring the resistance along the way). In which 2 and 3 are the outlet, their parameters are identical, which is the initial position of the required solution so that the initial current speed can be directly obtained v c = Q / 2 S . According to the Bernoulli equation:
P 1 + ρ g h 1 + ρ v 1 2 / 2 = P 2 + P 3 + ρ g h 2 + ρ g h 3 + ρ v 2 2 / 2 + ρ v 3 2 / 2
The smaller h can be neglected, and the same diameter three-way pipe is substituted into Equation (6) to obtain:
P c = ( P 1 + ρ v c 2 ) / 2
The Reynolds factor should satisfy the following:
22.2 μ 8 / 7 < Re < 597 μ 9 / 8 Re = v c d / v μ = d / Δ
where: v —pesticide viscosity, Pa·s; d—inner diameter of rubber hose, mm; Δ —absolute roughness.
The pesticide inside the rubber hose is in the transition zone, with Formula (9):
λ = 0.11 Δ / d + 68 / Re 0.25 1 / λ 1 = 2 lg Δ / 3.7 d + 2.51 / Re λ
After the pesticide is sprayed by the nozzle, according to the Darcy equation:
Δ P = P c P O Δ P = l λ ρ v 2 / 2 d ρ v 2 / 2 = ρ v s 2 / 2 + ρ g l
Comparison of the actual flow rate of the liquid in the water pipe, v s , with the required minimum horizontal velocity, v x m i n , get v s v x m i n , meet the needs.

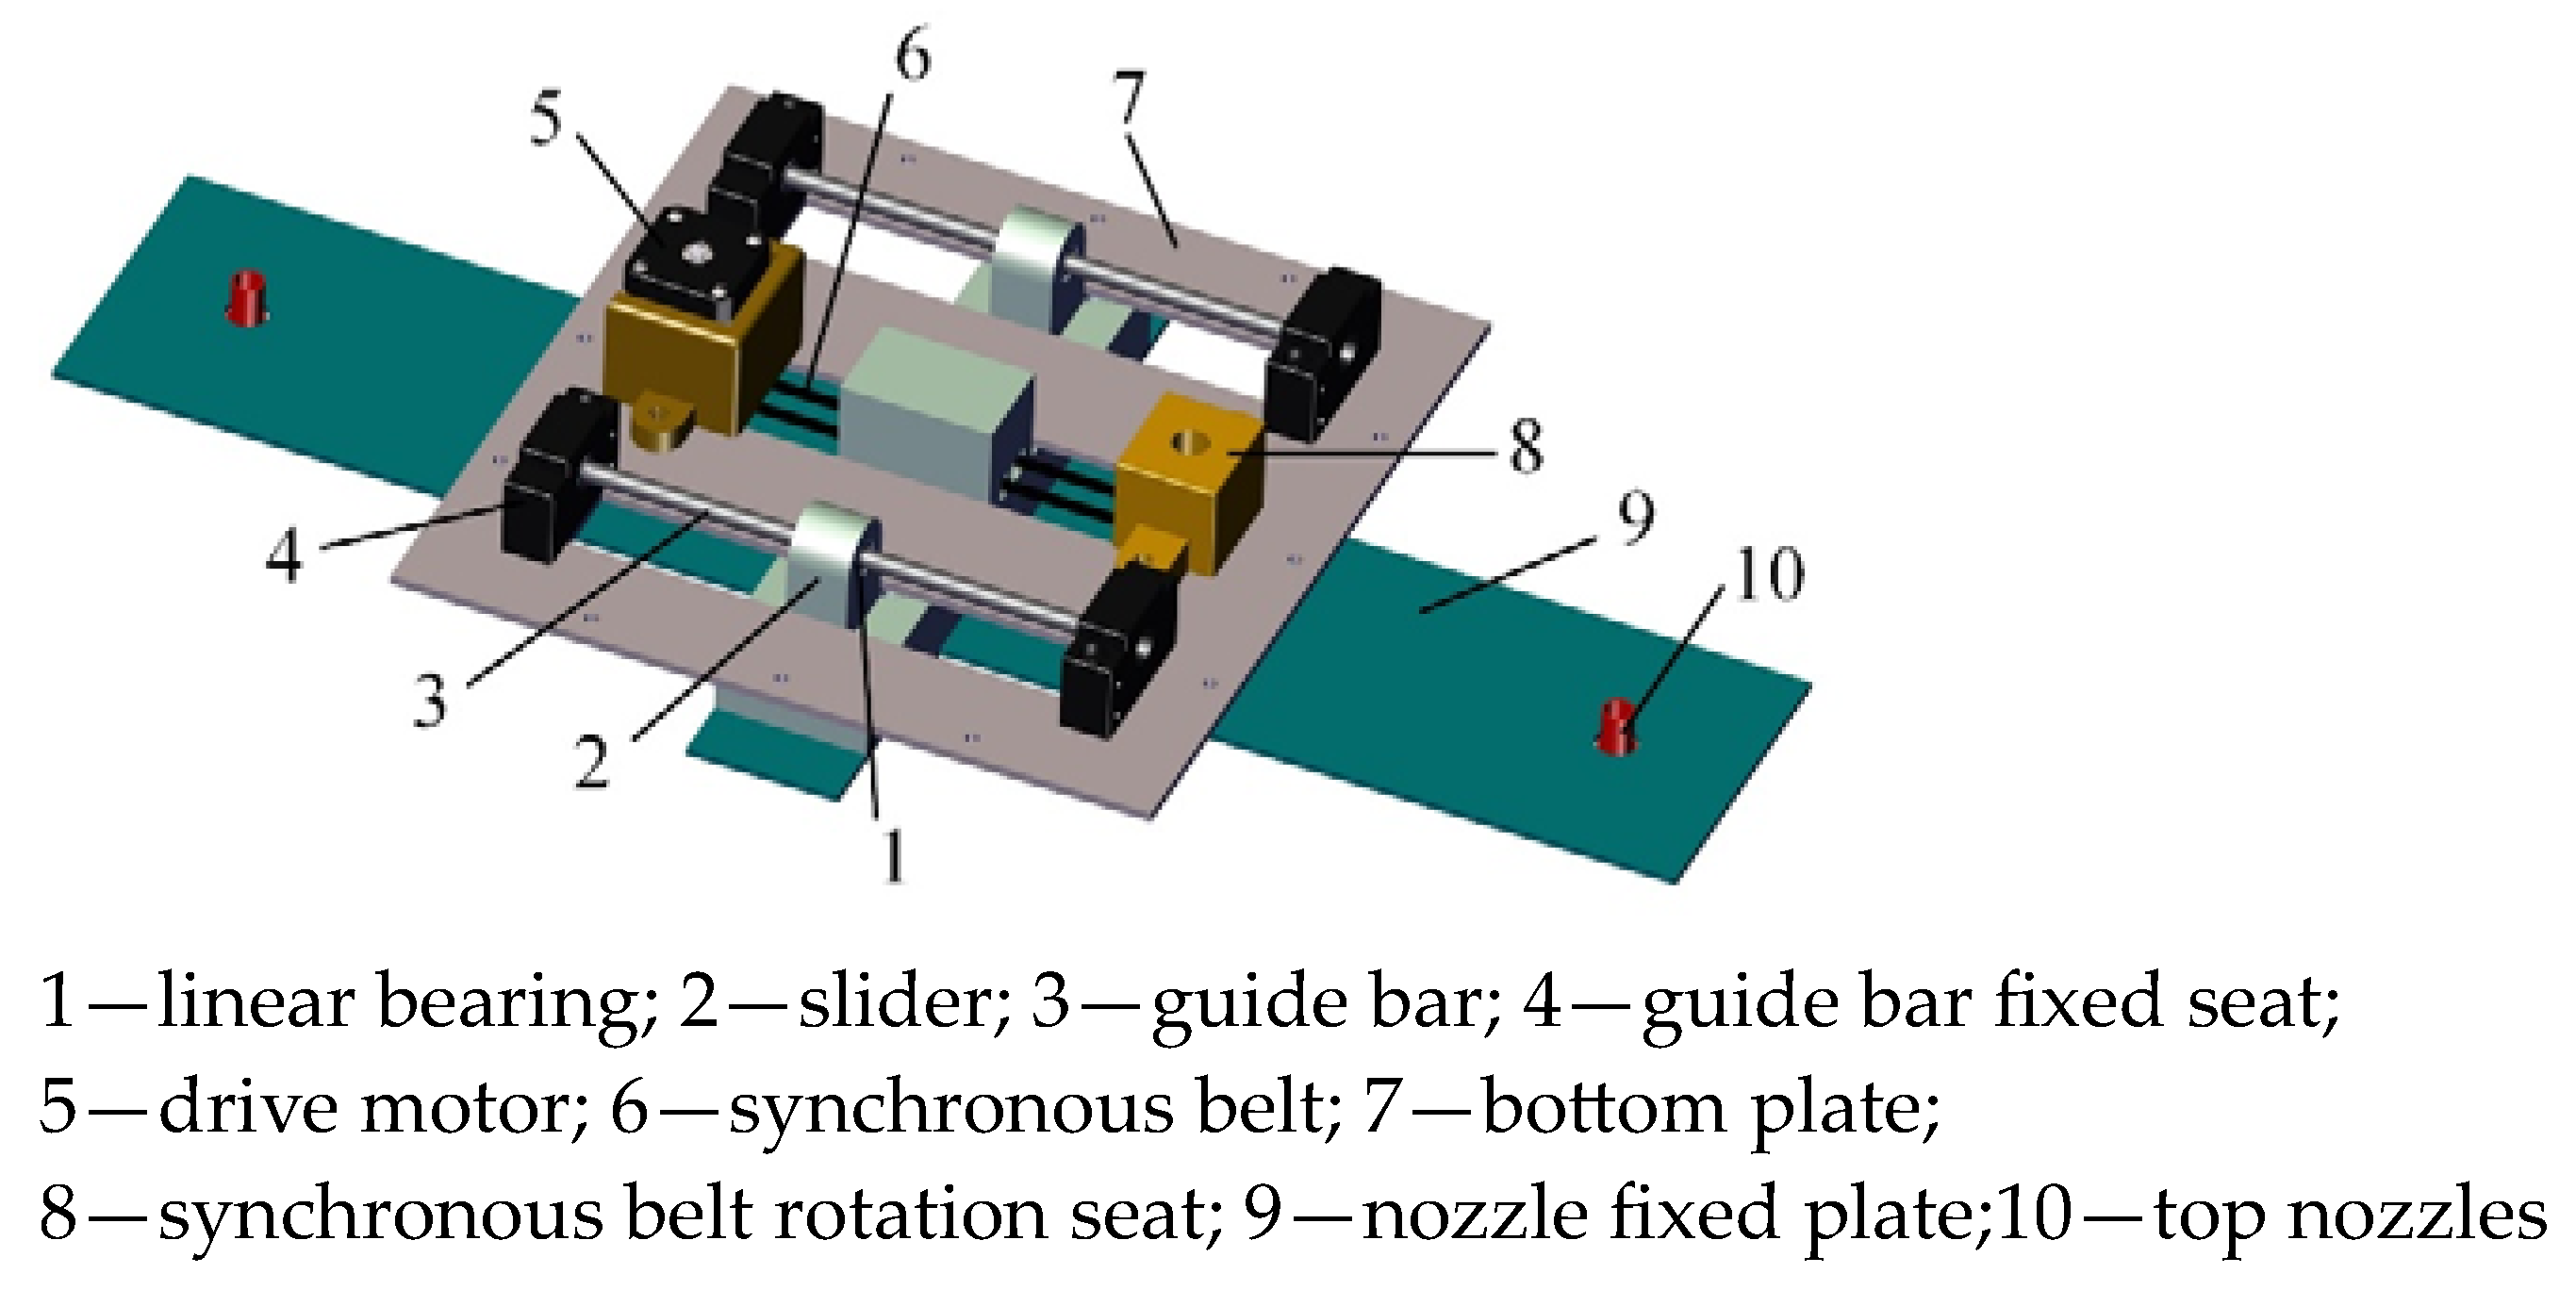
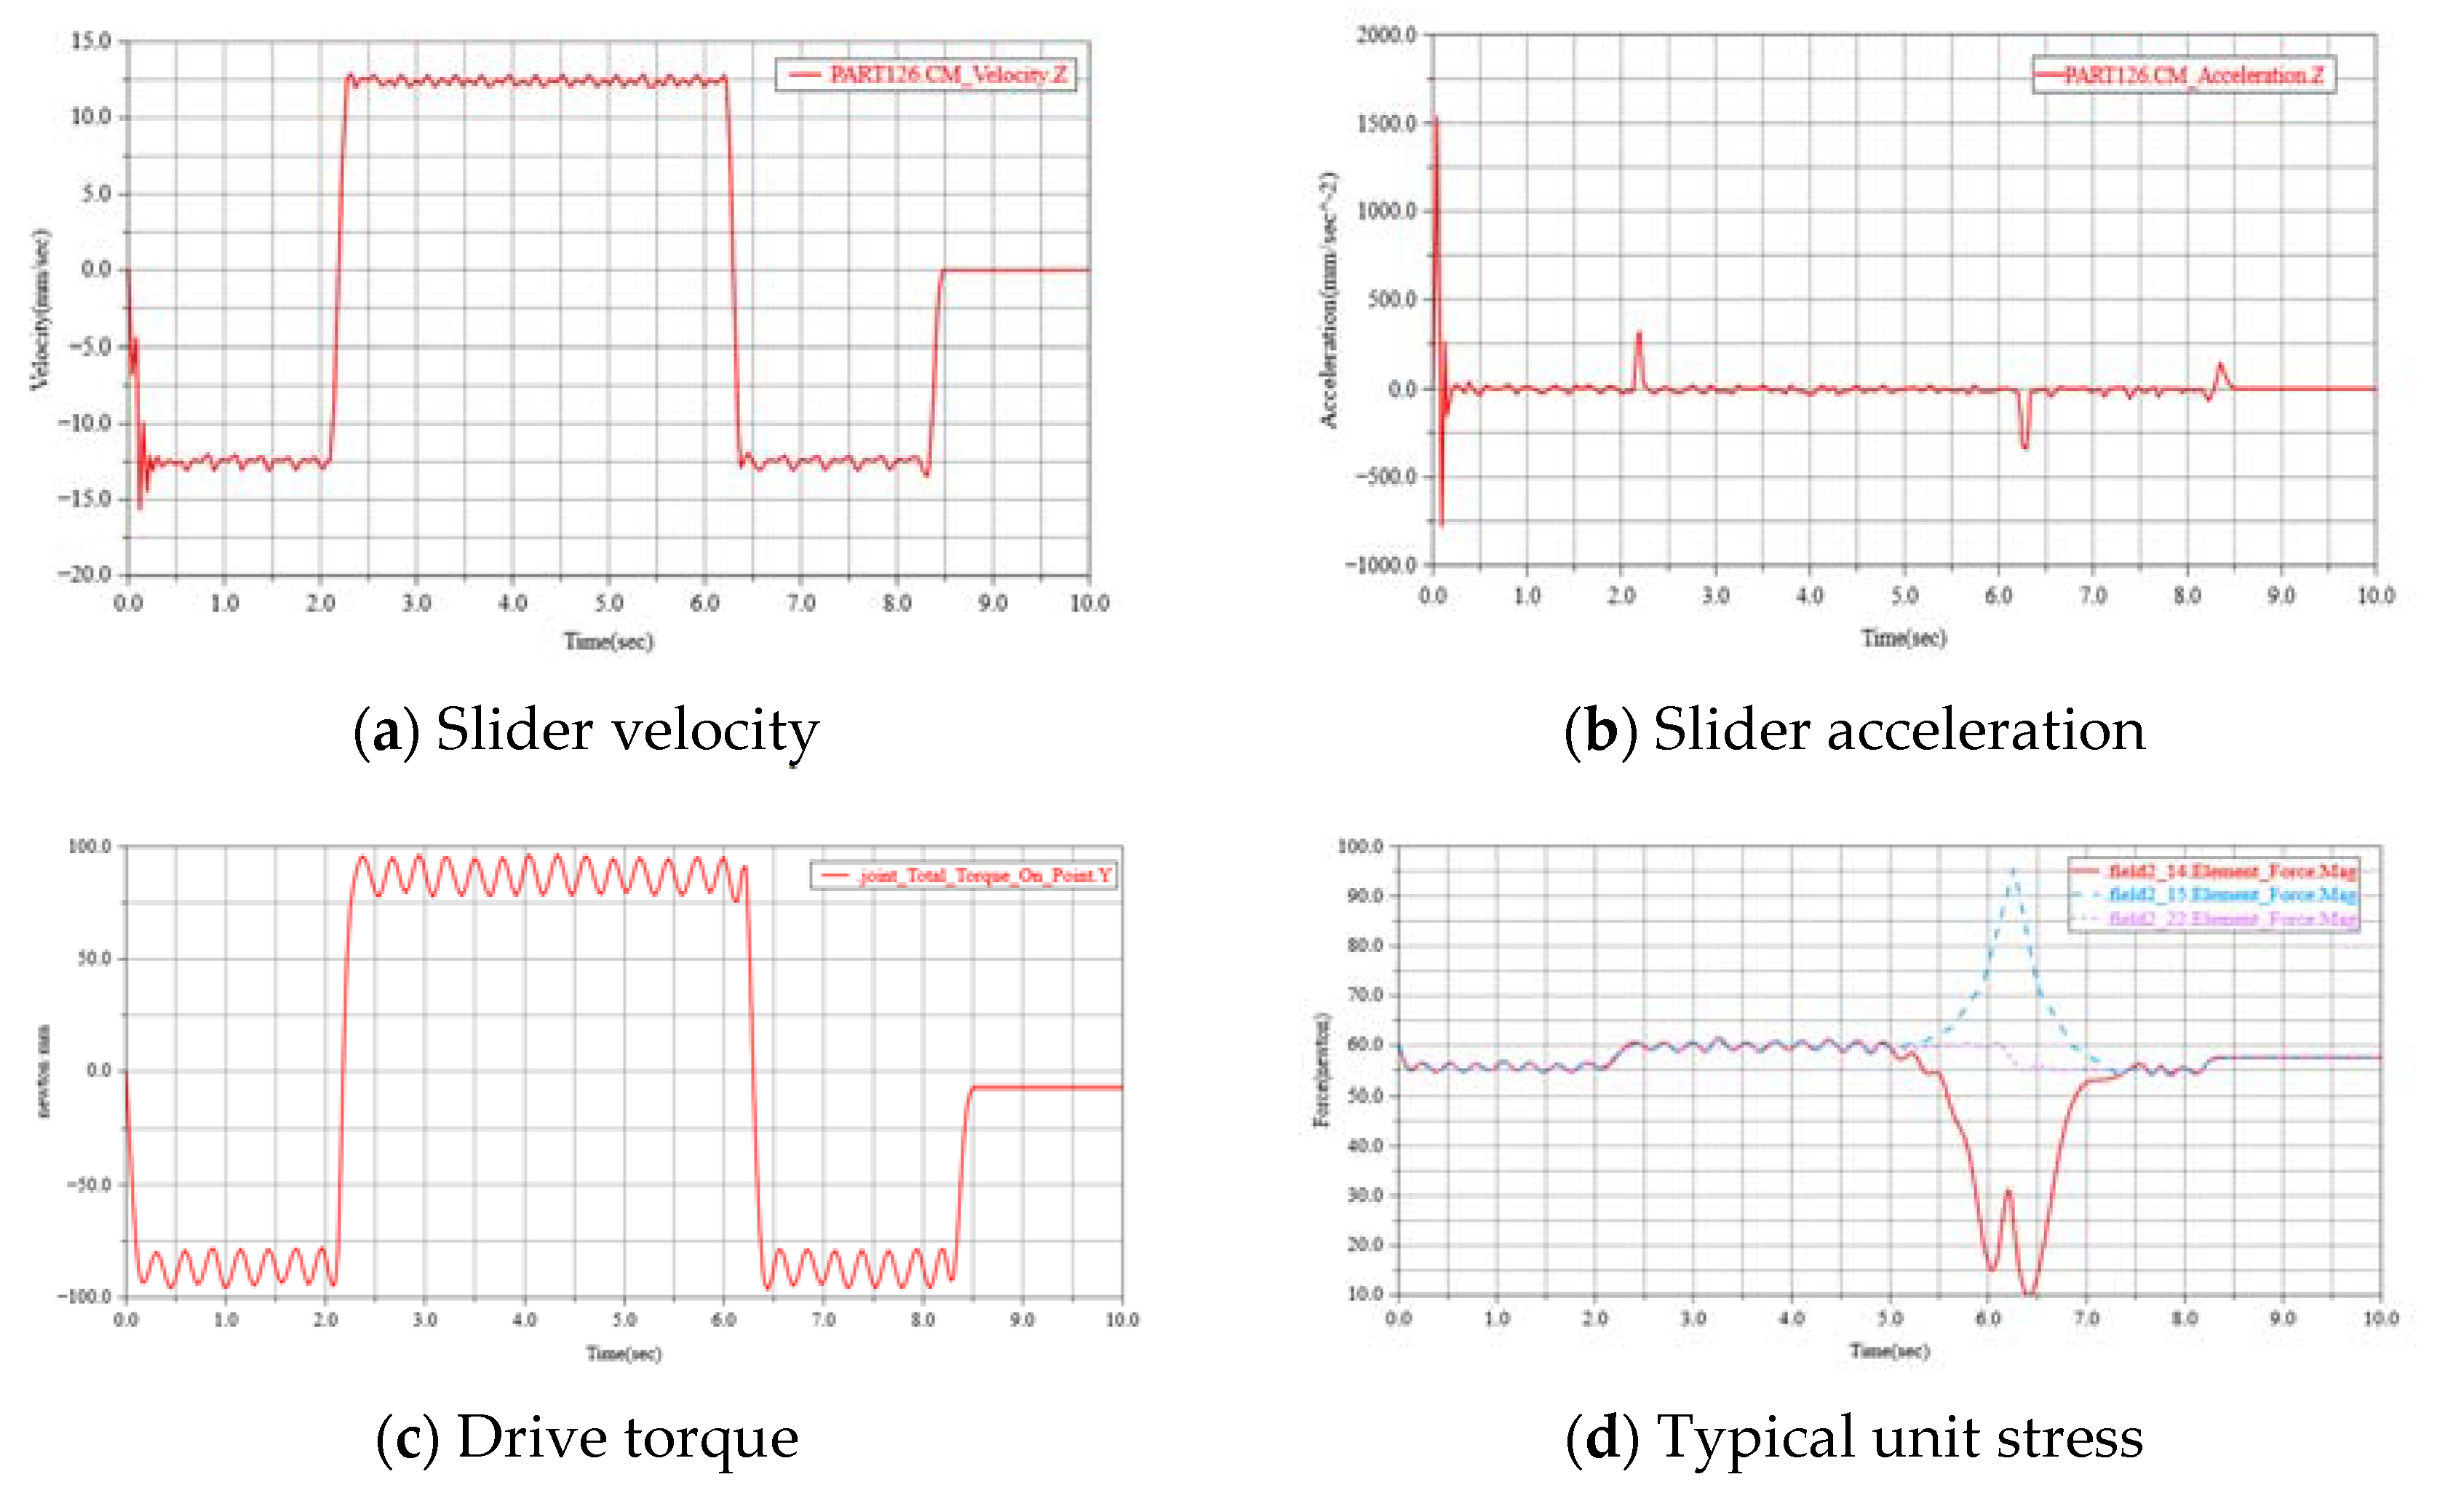
3.2. Targeting Device Design and Verification

To ensure that the targeting function of the sprayer is achieved, it is required that the targeting device can be adjusted promptly according to the actual position of the crop. The synchronous belt is widely used in 3D printers, which require high precision and small transmission devices. It has the advantages of smooth transmission, adjustable length, and reliable accuracy. Due to the widespread use and mass production, the price of synchronous belts and their supporting parts are also very low. The sprayer has a small range of adjustments for the targeting device, so the synchronous belt suits this application. The targeting device mainly consists of a synchronous belt section, nozzle section, etc. As shown in Figure 4, the sprayer adjusts the position of the top nozzles through the synchronous belt to achieve the targeting function. The slider, nozzle fixing plate, and top nozzles are relatively fixed to form a whole. During operation, the motor drives the synchronous belt to rotate, causing the slider to move horizontally along the guide rail, realising the position adjustment of the top nozzle.
In order to verify the safety and reliability of the material of the targeting device, the device’s internal state under possible external forces is analysed. The synchronous belt part of the targeting device frequently starts and stops and generates displacement. The motion of the synchronous belt part directly acts on the slider, so the slider is chosen as the object of displacement study. Taking the speed and acceleration of the slider as the starting point, verify whether the components of the synchronous belt part meet the requirements for use.
The impact function method calculates the contact force between two mutually contacting members through an impact function consisting mainly of an elastic and damping force. The elastic force is the Hertz contact force, and the damping force is a function of the collision indentation displacement δ and the collision velocity υ , calculated as:
F n = K δ n + S T E P ( δ , 0 , 0 , δ max , c max ) υ ; δ > 0 0 ; δ 0
Under the Hertz contact assumption, n is taken to be 1.5, and the instantaneous damping factor is:
S T E P ( δ , 0 , 0 , δ max , c max ) = c max δ / δ max 2 3 2 δ / δ max ; 0 < δ < δ max c max ; δ δ max
where, c max —maximum damping factor; δ max —maximum collision indentation displacement.
According to the friction model of Coulomb’s model, the friction factor can be dynamically modified by introducing two limiting velocities, which are calculated as:
F t = μ F n = 0 ; v t v s F n μ d ( v t v s ) ; v s < v t < v d F n μ d ; v d < v t
where, μ d —the coefficient of dynamic friction; v s —the static slip velocity.
Set the pulley parameters and driving pulley speed in ADAMS 2020 software, and get the speed of the slider as shown in Figure 5a. The slight fluctuation of the speed is because the synchronous belt is not fixed in the vertical direction, which belongs to normal fluctuation. The acceleration is shown in Figure 5b, with a uniform overall velocity and transient acceleration only during the change of direction.
After obtaining the slider motion law, the driving torque of the synchronous belt part is obtained in Figure 5c, which requires a maximum driving torque of about 90 N·mm, while the maximum torque of the drive motor is 420 N·mm, which meets the requirements. As shown in Figure 5d, the field2_14 is the force at the meshing position between the synchronous belt and the front end of the slider, the field2_15 is the force at another meshing position between the synchronous belt and the slider, and the field2_22 is the force on the synchronous belt itself. The typical unit stress on the synchronous belt is different at different positions during the reciprocating movement of the slider. The unit stress at the location where the synchronous belt is in direct contact with the pulley is the largest (the diagram only distinguishes between positive and negative directions), up to about 100 N, but this is much less than the permissible tension of the synchronous belt, 245 N.
After analysis and verification, it is clear that the targeting device meets the requirements for use.

4. Sprayer Control System Construction

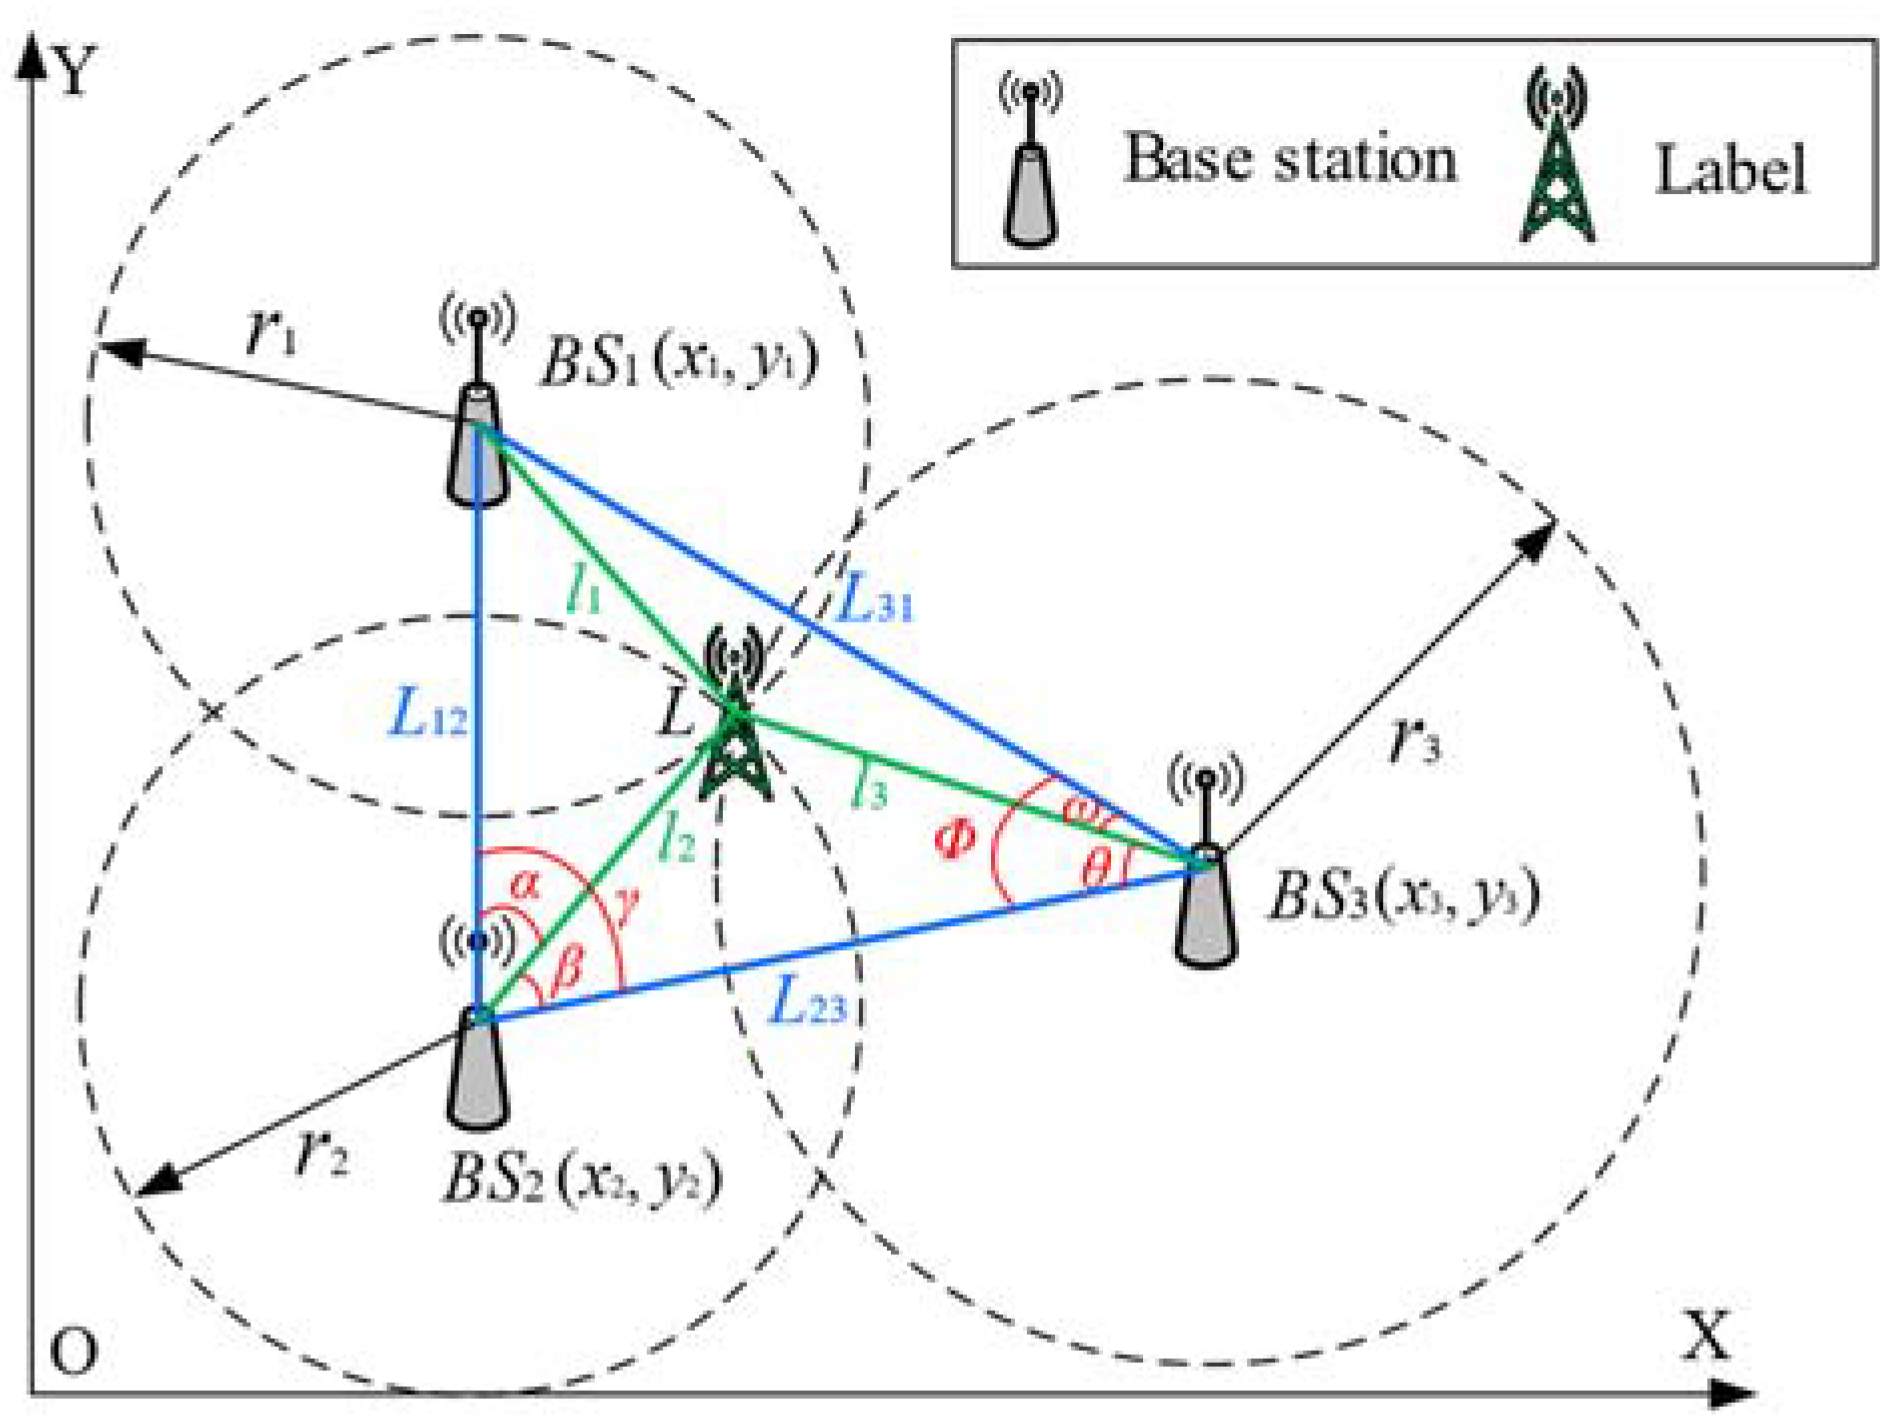
4.1. Autonomous Marching System

Autonomous marching is one of the critical functions for the automation of the sprayer [20], and it is a prerequisite for achieving the following targeted and variable spray functions. To ensure that autonomous marching function is achieved under the principle of economy, this manuscript uses pulse width modulation (PWM) to control the wheel motor and thus control the sprayer’s marching, steering, and turning; as well, this paper adopts ultra-wideband positioning technology (UWB) for the sprayer’s plane positioning; and uses a gyroscope to correct errors during the sprayer’s marching.
UWB technology is one of the research hotspots in positioning worldwide. It has high accuracy (centimetre-level) and low power consumption. The fundamental principle of the plane positioning technology used in this paper is flight time ranging. The time of Arrival (TOA) algorithm converts time signals into distance information [21,22]. Positioning the label is achieved by detecting the change in distance. The principle of the TOA algorithm is shown in Figure 6.
According to the above positioning principle, the label is mounted at the top of the sprayer so that the three base stations are at the same height, and the three base stations, together with a label, form a UWB module [23]. The measured value of the distance between the base station BS1 and the label L is l ˜ 1 , and the actual value is l 1 . Since the base station and the label cannot always be aligned in the vertical direction, we have l 1 l ˜ 1 . It can be derived from the following:
l 1 = L 31 2 + l 3 2 2 L 31 l 3 cos ω L 12 2 + l 2 2 2 L 12 l 2 cos α
According to the trigonometric relationship, it can be deduced that the angle ϕ between the base station BS1 and BS2 should satisfy the following:
ϕ = arccos [ ( L 31 2 + L 23 2 L 12 2 ) / 2 L 31 L 23 ]
Similarly, other angle relations can be obtained:
θ = arccos [ ( l 3 2 + L 23 2 l 2 2 ) / 2 l 3 L 23 ]
β = arccos [ ( l 2 2 + L 23 2 l 3 2 ) / 2 l 2 L 23 ]
γ = arccos [ ( L 12 2 + L 23 2 L 31 2 ) / 2 L 12 L 23 ]
Denote by ω ˜ the value ω calculated by measuring distance l ˜ 1 , then:
ω ˜ = arccos [ ( L 31 2 + l 3 2 l ˜ 1 2 ) / 2 L 13 l 3 ]
Similarly, we have:
α ˜ = arccos [ ( L 12 2 + l 2 2 l ˜ 1 2 ) / 2 L 12 l 2 ]
However, these angles will change as the label moves. Especially when the label is outside the triangle formed by the base stations, the angle changes become more significant. However, due to the constraint of relative relationships, the formula for the positions of the label remains the same. The position coordinates of the label can be obtained directly from the UWB module by outputting the above principle, and the process of obtaining them is as follows: The coordinates of the three base stations are known as x 1 , y 1 , x 2 , y 2 , x 3 , y 3 and the coordinates of the labels are x , y , which gives:
r 1 2 = x 1 x 2 + y 1 y 2 r 2 2 = x 2 x 2 + y 2 y 2 r 3 2 = x 3 x 2 + y 3 y 2
Converting to matrix yields Equation (22):
2 x 2 x 1 2 y 2 y 1 2 x 3 x 1 2 y 3 y 1 x y = x 2 2 + y 2 2 y 1 2 + y 1 2 + r 1 2 r 2 2 x 3 2 + y 3 2 x 1 2 + y 1 2 + r 1 2 r 3 2
The label’s coordinates can be obtained from Equation (22). However, in most cases, due to the three-dimensional environment, the signal coverage area of the actual base station is a sphere instead of a circle. When the base station heights differ, the three signal areas do not intersect precisely at one point. Therefore, N base stations are needed to locate the label better, and we can get the following:
r 1 = x 1 x 2 + y 1 y 2 + z 1 z 2 r 2 = x 2 x 2 + y 2 y 2 + z 2 z 2 r N = x N x 2 + y N y 2 + z N z 2
According to Equation (23) can be found:
2 [ ( x 1 x i ) x + ( y 1 y i ) y + ( z 1 z i ) z ] = r i 2 r 1 2 + x 1 2 + y 1 2 + z 1 2 ( x i 2 + y i 2 + z i 2 )
Write the N−1 similar equations obtained for N base stations as:
M I = D
Therefore, the label coordinates can be obtained:
M = I 1 D
In which,
I = 2 x 1 x 2 y 1 y 2 z 1 z 2 x 1 x 3 y 1 y 3 z 1 z 3 x 1 x N y 1 y N z 1 z N
D = 2 r 2 2 r 1 2 + x 1 2 + y 1 2 + z 1 2 ( x 2 2 + y 2 2 + z 2 2 ) r 3 2 r 1 2 + x 1 2 + y 1 2 + z 1 2 ( x 3 2 + y 3 2 + z 3 2 ) r N 2 r 1 2 + x 1 2 + y 1 2 + z 1 2 ( x N 2 + y N 2 + z N 2 )
Due to the bumpy terrain in the field, when sprayers march, the vehicle inevitably deviates from the preset route and the orientation of the vehicle changes. At this moment, the gyroscope fixed on the frame can play a role. The angle of the gyroscope will change with the vehicle’s deviation. The navigation controller can compare the changed angle of the gyroscope with the initial angle to obtain the deviation direction of the vehicle posture, thus correcting the vehicle posture.
The autonomous marching system of the sprayer is shown in Figure 7. The system’s accuracy is affected by the layout error of the UWB base station and the fluctuation of the position of the UWB label during the movement. Therefore, post-correction processing is used for error correction [24], and the marching route of the sprayer will be transmitted to the client in real-time.
The real-time pose detection module of the sprayer consists of a UWB base station group, UWB table, and gyroscope. Both base stations and the table use UWB mini 3s Plus (Yanchuang Internet of Things Technology Co., Ltd., Wenzhou, China), and STM32F103T8U6 (Weihetong Digital Accessories Flagship Store, Shenzhen, China) is the main control chip. The peripheral circuit includes a DW1000 chip, power system, etc., which follows the UWB standard in 802.15.4-2011 protocol; Gyroscope is JY61 Kalman Filter MPU6050 Six-axis Attitude Gyroscope (Weite Intelligent Technology Co., Ltd., Shenzhen, China).

4.2. Targeted and Variable Spray System

A targeted and variable spray system is the key to improving pesticide utilisation and directly embodies the precise variable spray technology applied in this sprayer. This system is the “eyes” of the sprayer [25], which can transmit adequate information about the environment to the controller [26] and change the spraying mode, reflecting the intelligence of the system. The core of this system is to obtain plant information through photoelectric sensors and plant position information through the OpenMV module.
The spraying process is shown in Figure 8. In the first step, the OpenMV module detects the plant position information and controls the top nozzle’s targeting. Then, the photoelectric sensor feeds the plant information, and the controller controls the nozzles for variable spray.
OpenMV4 H7 Cam camera and E18-D80NK diffuse reflective photoelectric sensor were selected as the system’s core hardware. The camera is fixed at the top of the sprayer in an outward position. Two photoelectric sensors are evenly distributed vertically on the outside of the sprayer’s right end, with their lens facing inside the sprayer. The diffuse reflectance photoelectric sensor combines a transmitter and a receiver. When a plant is detected, the object reflects enough light from the photoelectric sensor transmitter to the receiver to generate a switching signal.
The specific feedback signal of the photoelectric sensor is shown in Table 3, where: 0—not recognised and 1—recognised.
Nozzles at different heights of the spraying range have a certain difference, the overall inverted “bowl” shape. The ground was regarded as a reference surface to obtain the region of interest. The camera identifies the region as the actual detection area, using the projection method to obtain the coordinates of the spraying range.
As shown in Figure 9, each component has a reaction time in actual operation, so the camera is extended a distance c to balance the reaction time. In order to simplify the analysis model, the distance between the camera recognition area and the sprayer area in the Y direction is ignored. The upper left corner of the image identified by the camera is used as the origin to establish the coordinate system, and 1 and 2 correspond to the spraying range of the two top nozzles, respectively. The coordinates of the centre of mass of the leaf in the nozzle coordinate system are obtained:
X i Y j 1 = u x i y j 1
where: (xi, yj)—Coordinates under the camera coordinate system; (Xi, Yj)—Coordinates under nozzle coordinate system; u—Scale factor.
In the nozzle coordinate system, the detected blades are normalised to n blade centre-of-mass coordinates and output as one coordinate:
D ( x , y ) = u C ( x i , y j ) / n
When the plant centre of mass is located in the camera recognises area, the controller controls the targeting device to align the centre point M (a/2, b/2) of the camera recognition area with the horizontal coordinates D (x, y) of the plant centre of mass to the maximum extent. After alignment, the spraying operation is carried out with the plant information from the photoelectric sensors. The expression for the spraying range of the top nozzles is:
R 2 ( x L R ) 2 + ( y b / 2 ) 2 ; 0 x < L + R ( x L R L ) 2 + ( y b / 2 ) 2 ; L + R x < L + R + L

5. Sprayer Performance Testing Experiments

In order to verify the operational performance of the targeting and variable sprayer, the autonomous marching experiment and the targeting and variable spraying experiment were conducted at the “regional potatoes chemical fertiliser and chemical pesticide application reduction technology integration and demonstration” base; the autonomous marching experiment and targeted variable spray experiment were conducted, respectively. During the experiments, the marching speed is 0.5 m/s, and the natural wind speed is less than 0.5 m/s. Relevant parameters are shown in Table 4.

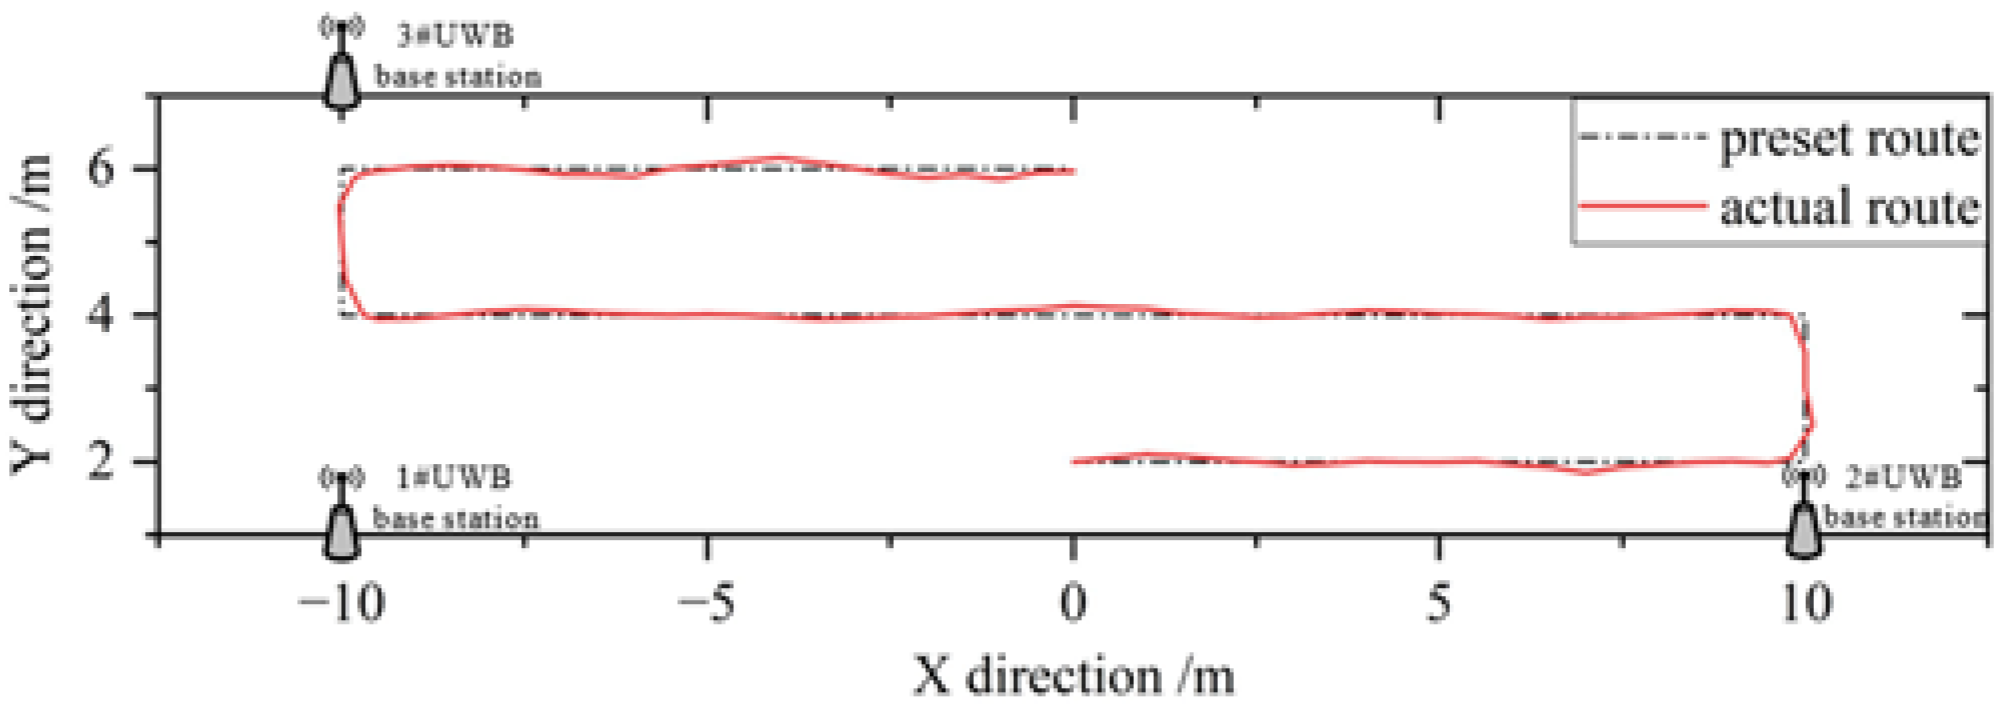
5.1. Autonomous Marching Experiment

In order to test whether the sprayer can march along the preset route, a test environment was built according to the autonomous marching principle described earlier. A spirit level was used to reduce experimental errors to ensure that the heights of the three UWB base stations were the same. The test area was rectangular, 20 m long and 4 m wide, with coordinates measured by a laser rangefinder, as shown in Figure 10 for the X and Y axes. After balancing the weights on both sides of the sprayer, the system was powered on for testing, and the three UWB base stations transmitted label positioning data to the computer in real-time. In the test, the coordinates of the three UWB base stations are (−10, 1), (10, 1), and (−10, 7). The test route was set from point (0, 2) to point (0, 6), including necessary actions such as straight running, left turns, and right turns.
From Figure 10, it can be seen that the sprayer runs relatively stable and can achieve an autonomous marching function. The maximum deviation between the actual route and the preset route is about 18 cm, which can meet the actual needs in the field. The leading causes of the error are:
(1)
Uneven ground surface causes a specific deviation in the driving angle of the sprayer.
(2)
The shaking of the medicine in the tank during the sprayer’s movement, combined with the vibration produced by the sprayer, affects the label fixed on the top of the sprayer, thus affecting the test results.
The experiment shows that the sprayer can give real-time feedback on its position information, correct its marching direction after a certain angle deviation, march according to the predetermined route, and reduce the operator’s labour intensity.

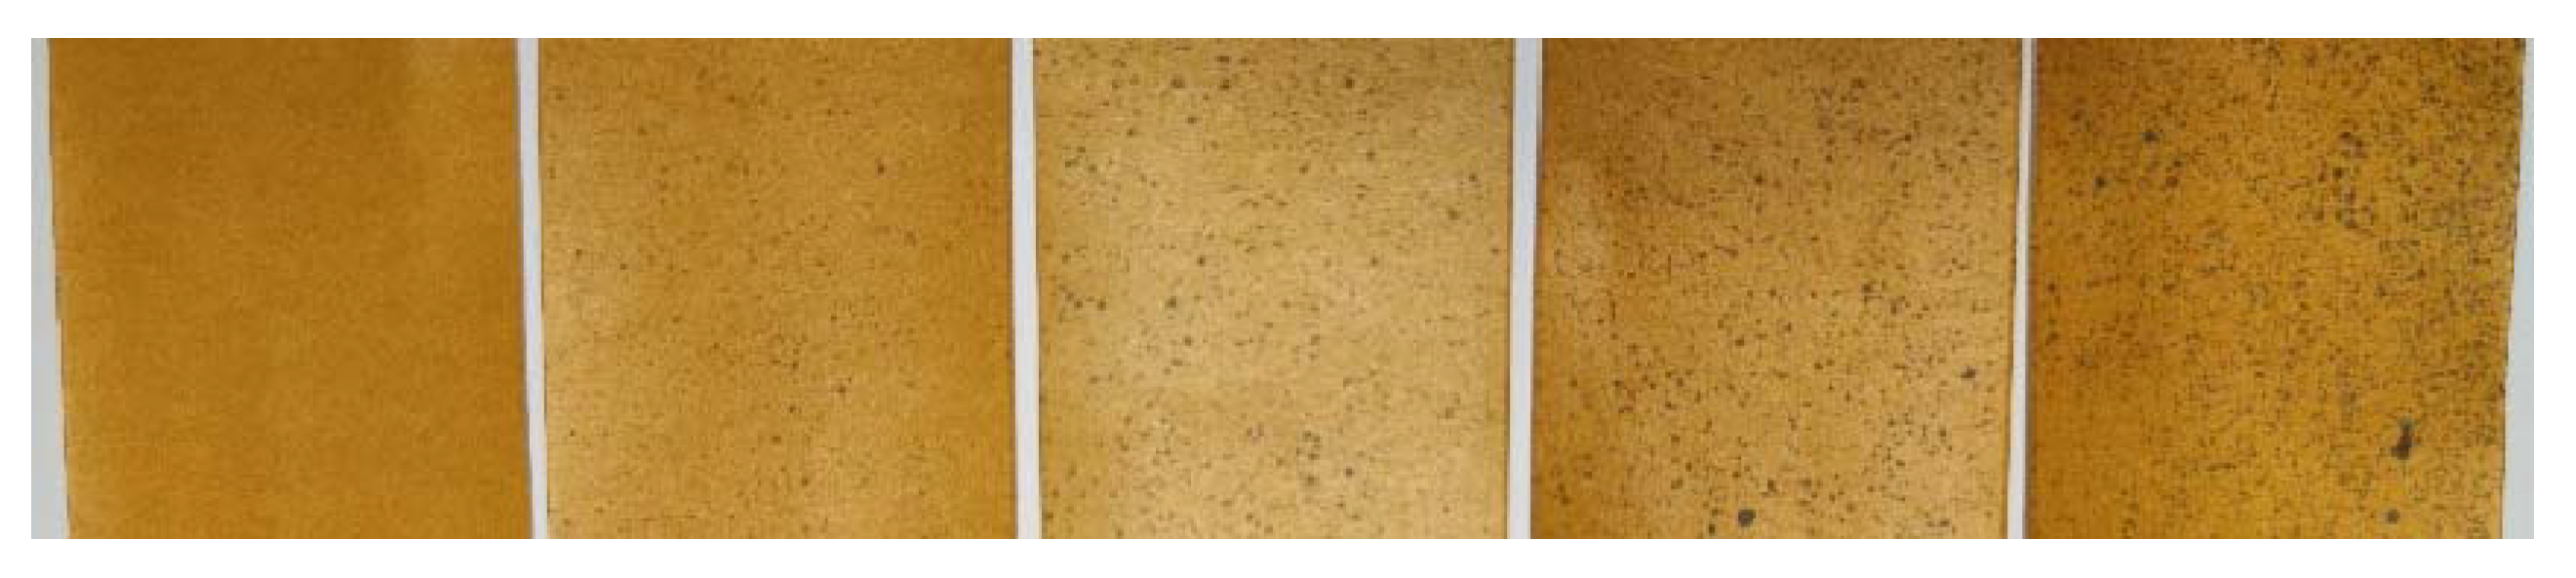
5.2. Targeted and Variable Spray Experiment

This experiment aims to evaluate the sprayer’s operational quality and control effect. The adhesion rate μ of the spray liquid on the plant leaf surface and back were used as performance evaluation indicators. The potato plant was selected as the experimental subject, and 30 consecutive potato plants in the same row were selected for each group of experiments. The sprayer’s nozzles adopt the standard vertebral fan fog nozzle SC 110-05 produced by Lechler, Germany. The typical fan fog nozzle can deliver high-impact liquid column flow or fan spray with a diffusion angle variation range of 0°~110°, widely used in agricultural applications. The droplet spectra of SC 110-05 nozzle were measured at 0.4 MPa with VisiSizer DP Particle Sizing System Model 6401 (Tianjin Celes Automation Technology Co., Ltd., Tianjin, China), in which the minimum diameter of the droplets was 17.5 μm; max. particle size 340 μm, 150.4 μm mid-diameter.
As shown in Figure 11a, there is some positional deviation among the potato plants on the same ridge, and the potato seedlings in adjacent ridges also differ. As shown in Figure 11b, sampling points were arranged on the highest point, 3/4 height, and 1/4 height of the leaves of 10 potato seedlings (the red box in the figure indicates the location of the fog drop test card). A fog droplet test card (30 × 40 mm) was used as the sampling sheet, with one sampling sheet placed on the leaf surface and one on the leaf back at each sampling point. A dye (Rhodamine-B) was added to water as the spray liquid (the concentration is about 0.2%), and the amount of spray liquid used was recorded after the test was completed and the fog droplets were dried (the principle is similar to that of water sensitive paper, the fog droplets will appear blue). Each group was repeated three times, and the average value was taken. A control group was set up in this experiment, which used the continuous spray method (using the same sprayer, but with all nozzles continuously open and without targeted and variable spray), with the same arrangement as the experimental group.
The collected samples were classified as Class 0 (no pesticide adherence, no fog droplets at all), Class 1 (0–1/4 area with pesticide adherence, less than 30 pcs/cm2), Class 2 (1/4–1/2 area with pesticide adherence, less than 60 pcs/cm2), Class 3 (1/2–3/4 area with pesticide adherence, less than 90 pcs/cm2), Class 4 (more than 3/4 area with pesticide adherence, more than 90 pcs/cm2). Corresponding to the fog droplet test cards in Figure 12 (from left to right).
The data were processed according to the attachment rate calculation Equation (31), and the results were calculated in Table 5.
μ = 100 % 1 4 Y i i / ( 4 Y i )
where: μ—pesticide adhesion rate, %; i—number of sampling slice levels; Yi—number of sampling slices at level i.
The data are shown in Table 5 in the form of test group/control group.
The experimental results showed that the targeted and variable spray of the sprayer has the following advantage over continuous spray:
(1)
Increased the spraying precision by 12.2% while maintaining high precision, with the adhesion rate μ of the pesticide exceeding 66.4%, resulting in excellent disease control;
(2)
Reduced the coefficient of variation of the pesticide adhesion rate by 31.6%, resulting in a more uniform pesticide spray distribution;
(3)
Under similar working conditions, the targeted and variable spray effectively improved the targeting rate of the pesticide and saved 37.9% of the pesticide.
The adhesion rate of manually carried sprayers is about 10%, and that of traditional continuous sprayers is approximately 30–50% [4,27]. However, the adhesion rate of the continuous spray mode of this sprayer can reach 59%, and the targeted and variable spray can obtain over 66%, significantly improving spraying accuracy. It is crucial in enhancing pesticide utilisation and reducing environmental pollution caused by pesticides. The sprayer can evenly spray the leaf surface and back of the plants, leading to better disease prevention and control.

6. Conclusions

(1)
The operational reliability of the main working parts of the sprayer was analysed. The modal analysis of the vehicle part was carried out using ANSYS software. The resonance frequency was greater than 23.387 Hz, and the sprayer would not resonate. The motion of the targeting device was simulated using ADAMS software, and the motion reliability of the equipment can meet the requirements.
(2)
The targeted and variable spray system was built with the design of an autonomous marching system with a positioning accuracy of up to 18 cm using the TOA principle in UWB technology. Plant position recognition was achieved using Open MV technology.
(3)
Performance validation tests were carried out on the sprayer based on field testing methods for plant protection machinery. The results proved that the sprayer could follow a preset route, identify potato plants, and carry out targeted and variable spraying based on relevant information, with an adherence rate of over 66% and a pesticide-saving rate of 37.9% compared to continuous spray.
This paper demonstrates that targeted and variable spray methods can effectively improve pesticide availability and contribute to developing precision variable spray technology and machinery. This paper has some limitations as the nature of the development research and financial time constraints have focused the research more on achieving functionality. Although the sprayer has the disadvantage of having a weak range compared to larger plant protection machines, the sprayer is flexible and suitable for various scenarios where larger plant protection machines cannot drive into. In the future, this research will be further developed to further expand the applicability of the sprayer based on its increased flexibility for larger areas and more extended periods of operation.

Author Contributions

Conceptualisation, L.L.; methodology, L.L.; software, L.L. and X.H.; validation, L.L.; formal analysis, L.L. and X.H.; investigation, L.L.; resources, L.L.; data curation, L.L., X.H., Y.X. and T.J.; writing—original draft preparation, L.L.; writing—review and editing, L.L. and W.L.; visualisation, W.L.; supervision, W.L.; project administration, W.L.; funding acquisition, W.L. All authors have read and agreed to the published version of the manuscript.

Funding

This research was funded by Science and Technology Project of China Tobacco Corporation Shaanxi Province, Construction of a Standard System for Suitable Mechanized Tobacco Agriculture in Shaanxi Tobacco Area and Demonstration and Promotion of Integration of Agricultural Machinery and Agriculture and the Key Industry Chain Innovation Project of the Shaanxi Province (2018ZDCXL-NY-03-06).

Institutional Review Board Statement

Not applicable.

Data Availability Statement

Not applicable.

Acknowledgments

I would like to extend my sincere thanks to those or things who have helped with this article.

Conflicts of Interest

The authors declare no conflict of interest.

References

  1. Tudi, M.; Li, H.; Li, H.; Wang, L.; Lyu, J.; Yang, L.; Tong, S.; Yu, Q.J.; Ruan, H.D.; Atabila, A.; et al. Exposure Routes and Health Risks Associated with Pesticide Application. Toxics 2022, 10, 335. [Google Scholar] [CrossRef]
  2. Liang, Z.; Abdelshafy, A.M.; Luo, Z.; Belwal, T.; Lin, X.; Xu, Y.; Wang, L.; Yang, M.; Qi, M.; Dong, Y.; et al. Occurrence, detection, and dissipation of pesticide residue in plant-derived foodstuff: A state-of-the-art review. Food Chem. 2022, 384, 132494. [Google Scholar] [CrossRef]
  3. Wang, P.; Yu, W.; Ou, M.; Gong, C.; Jia, W. Monitoring of the Pesticide Droplet Deposition with a Novel Capacitance Sensor. Sensors 2019, 19, 537. [Google Scholar] [CrossRef] [Green Version]
  4. An, Q.; Li, D.; Wu, Y.; Pan, C. Deposition and distribution of myclobutanil and tebuconazole in a semidwarf apple orchard by hand-held gun and air-assisted sprayer application. Pest Manag. Sci. 2020, 76, 4123–4130. [Google Scholar] [CrossRef]
  5. Kim, J.; Kim, S.; Ju, C.; Son, H.I. Unmanned Aerial Vehicles in Agriculture: A Review of Perspective of Platform, Control, and Applications. IEEE Access 2019, 7, 105100–105115. [Google Scholar] [CrossRef]
  6. Radoglou-Grammatikis, P.; Sarigiannidis, P.; Lagkas, T.; Moscholios, I. A compilation of UAV applications for precision agriculture. Comput. Netw. 2020, 172, 107148. [Google Scholar] [CrossRef]
  7. Mahmud, M.S.; Zahid, A.; He, L.; Martin, P. Opportunities and Possibilities of Developing an Advanced Precision Spraying System for Tree Fruits. Sensors 2021, 21, 3262. [Google Scholar] [CrossRef]
  8. Berenstein, R.; Edan, Y. Human-robot collaborative site-specific sprayer. J. Field Robot. 2017, 34, 1519–1530. [Google Scholar] [CrossRef]
  9. Xiang, D.; Tie, Z.; Mingde, Y. Design and experiment of 3WPZ-4 type air-assisted grape sprayer. Trans. Chin. Soc. Agric. Mach 2018, 49, 205–213. [Google Scholar]
  10. Baltazar, A.R.; dos Santos, F.N.; Moreira, A.P.; Valente, A.; Cunha, J.B. Smarter Robotic Sprayer System for Precision Agriculture. Electronics 2021, 10, 2061. [Google Scholar] [CrossRef]
  11. Changjie, H.; Kang, Z.; Xueguan, Z.; Shenyu, Z.; Hao, F.; Changyuan, Z. Design and Experiment of Row Identification and Row-oriented Spray Control System for Field Cabbage Crops. Nongye Jixie Xuebao/Trans. Chin. Soc. Agric. Mach. 2022, 53, 89–101. [Google Scholar] [CrossRef]
  12. Pintelon, R.; Guillaume, P.; Schoukens, J. Uncertainty calculation in (operational) modal analysis. Mech. Syst. Signal Process. 2007, 21, 2359–2373. [Google Scholar] [CrossRef]
  13. Wang, Y.; Pan, J. Applications of Operational Modal Analysis to a Single-Phase Distribution Transformer. IEEE Trans. Power Deliv. 2015, 30, 2061–2063. [Google Scholar] [CrossRef]
  14. Yao, Y.; Du, Y.; Zhu, Z.; Mao, E.; Song, Z. Vibration characteristics analysis and optimisation of corn combine harvester frame using modal analysis method. Trans. Chin. Soc. Agric. Eng. 2015, 31, 46–53. [Google Scholar]
  15. Bin Zahid, F.; Ong, Z.C.; Khoo, S.Y. A review of operational modal analysis techniques for in-service modal identification. J. Braz. Soc. Mech. Sci. Eng. 2020, 42, 398. [Google Scholar] [CrossRef]
  16. Jiang, X.; Jiang, F. Operational modal analysis using symbolic regression for a nonlinear vibration system. J. Low Freq. Noise Vib. Act. Control. 2021, 40, 120–134. [Google Scholar] [CrossRef] [Green Version]
  17. Ji, J.; Chen, K.; Jin, X.; Wang, Z.; Dai, B.; Fan, J.; Lin, X. High-efficiency modal analysis and deformation prediction of rice transplanter based on effective independent method. Comput. Electron. Agric. 2020, 168, 105126. [Google Scholar] [CrossRef]
  18. Uk, S. Tracing insecticide spray droplets by sizes on natural surfaces. The state of the art and its value. Pestic. Sci. 1977, 8, 501–509. [Google Scholar]
  19. Ghafoor, A.; Khan, F.A.; Khorsandi, F.; Khan, M.A.; Nauman, H.M.; Farid, M.U. Development and Evaluation of a Prototype Self-Propelled Crop Sprayer for Agricultural Sustainability in Small Farms. Sustainability 2022, 14, 9204. [Google Scholar] [CrossRef]
  20. Man, Z.; Yuhan, J.; Shichao, L.; Ruyue, C.; Hongzhen, X.; Zhenqian, Z. Research progress of agricultural machinery navigation technology. Nongye Jixie Xuebao/Trans. Chin. Soc. Agric. Mach. 2020, 51, 1–18. [Google Scholar] [CrossRef]
  21. Navarro, M.; Najar, M. Frequency Domain Joint TOA and DOA Estimation in IR-UWB. IEEE Trans. Wirel. Commun. 2011, 10, 3174–3184. [Google Scholar] [CrossRef]
  22. Alsindi, N.A.; Alavi, B.; Pahlavan, K. Measurement and Modeling of Ultrawideband TOA-Based Ranging in Indoor Multipath Environments. IEEE Trans. Veh. Technol. 2009, 58, 1046–1058. [Google Scholar] [CrossRef]
  23. Poulose, A.; Han, D.S. UWB Indoor Localization Using Deep Learning LSTM Networks. Appl. Sci. 2020, 10, 69–77. [Google Scholar] [CrossRef]
  24. Binbin, X.; Jizhan, L.; Meng, H.; Jian, W.; Zhujie, X. Research progress on Autonomous Navigation Technology of Agricultural Robot. In Proceedings of the 2021 IEEE 11th Annual International Conference on CYBER Technology in Automation, Control, and Intelligent Systems (CYBER), Jiaxian, China, 27–31 July 2021; pp. 891–898. [Google Scholar]
  25. Rehman, T.U.; Mahmud, M.S.; Chang, Y.K.; Jin, J.; Shin, J. Current and future applications of statistical machine learning algorithms for agricultural machine vision systems. Comput. Electron. Agric. 2019, 156, 585–605. [Google Scholar] [CrossRef]
  26. McGuinness, B.; Duke, M.; Au, C.K.; Lim, S.H. Measuring radiata pine seedling morphological features using a machine vision system. Comput. Electron. Agric. 2021, 189, 106355. [Google Scholar] [CrossRef]
  27. Sarri, D.; Martelloni, L.; Rimediotti, M.; Lisci, R.; Lombardo, S.; Vieri, M. Testing a multi-rotor unmanned aerial vehicle for spray application in high slope terraced vineyard. J. Agric. Eng. 2019, 50, 38–47. [Google Scholar] [CrossRef] [Green Version]
Figure 1. Machine structure.
Agriculture 13 00797 g001
Figure 2. Schematic diagram of the targeted and variable spray.
Agriculture 13 00797 g002
Figure 3. First fourth-order vibration diagram of the vehicle part.
Agriculture 13 00797 g003aAgriculture 13 00797 g003b
Figure 4. Targeting device structure.
Agriculture 13 00797 g004
Figure 5. Kinetics analysis.
Agriculture 13 00797 g005
Figure 6. TOA algorithm principle.
Agriculture 13 00797 g006
Figure 7. Autonomous marching system.
Agriculture 13 00797 g007
Figure 8. The process of targeted and variable spray.
Agriculture 13 00797 g008
Figure 9. Projection method for target crop coordinates principle.
Agriculture 13 00797 g009
Figure 10. Comparison of the preset route and actual route.
Agriculture 13 00797 g010
Figure 11. Targeted and variable spray experiment.
Agriculture 13 00797 g011
Figure 12. Fog droplet adhesion grade.
Agriculture 13 00797 g012
Table 1. Main technical parameters of the sprayer.
ParametersValues
Overate size (Length × Width × Height)/m × m × m1.3 × 0.35 × 0.9
Operation speed/m/s0.5
Suitable planting row spacing/m0.6–1
Suitable planting height/m0.3–0.7
Pesticide tank volume/L20
Number of nozzles6
Type of nozzle2
Rated spray pressure/MPa0.3
Table 2. Results of modal analysis.
OrderNatural Frequencies/HzCorresponding Mode Shapes
123.378Bending in the X direction
253.207Bending in the Y direction
361.500Torsion around the Z axis
461.811Bending in the Z direction
Table 3. Photoelectric sensors’ specific feedback signal.
NumberIdentification of Photoelectric SensorsFeedback Content
TopBelow
I10/1Plants available, tall plants
II01Plants available, dwarf plants
III00no
Table 4. Measurement results of relevant parameters in the test field.
ParametersValues
Row spacing/m1.00
Plant spacing/m0.40
Plant height (median)/m0.49
Plant height deviation/m0.16
Intra-row deviation of plants/m0.22
Table 5. Results of the determination of the adhesion rate.
ParameterSurfaceBack
TopMiddleBelowTopMiddleBelow
Classes411/89/77/59/57/35/3
313/1212/910/814/149/107/7
26/77/108/95/910/1013/13
10/32/44/62/24/63/5
00/00/01/20/00/12/2
Total30/3030/3030/3030/3030/3030/30
μ/%79.2/70.873.3/65.865.0/56.775.0/68.365.8/56.758.3/53.3
Average μ/%72.5/64.466.4/59.4
Coefficient of variation/%22.9/33.5
Relative consumption/%62.1/100
Disclaimer/Publisher’s Note: The statements, opinions and data contained in all publications are solely those of the individual author(s) and contributor(s) and not of MDPI and/or the editor(s). MDPI and/or the editor(s) disclaim responsibility for any injury to people or property resulting from any ideas, methods, instructions or products referred to in the content.

