


Inhibition of Nickel (II) Mobility in Theobroma cacao L. Seedlings Using Zeolite 5A

 , , and
Abstract
:1. Introduction
2. Materials and Methods
2.1. Zeolite 5A Adsorbent
2.2. Physical Characterization of the Adsorbent and Soils
2.3. Sampling of Soils
2.4. Sampling of Cacao’s Fruits
2.5. Determination of the Physical and Chemical Properties of the Soil
2.6. Substrate Contamination with Ni+2
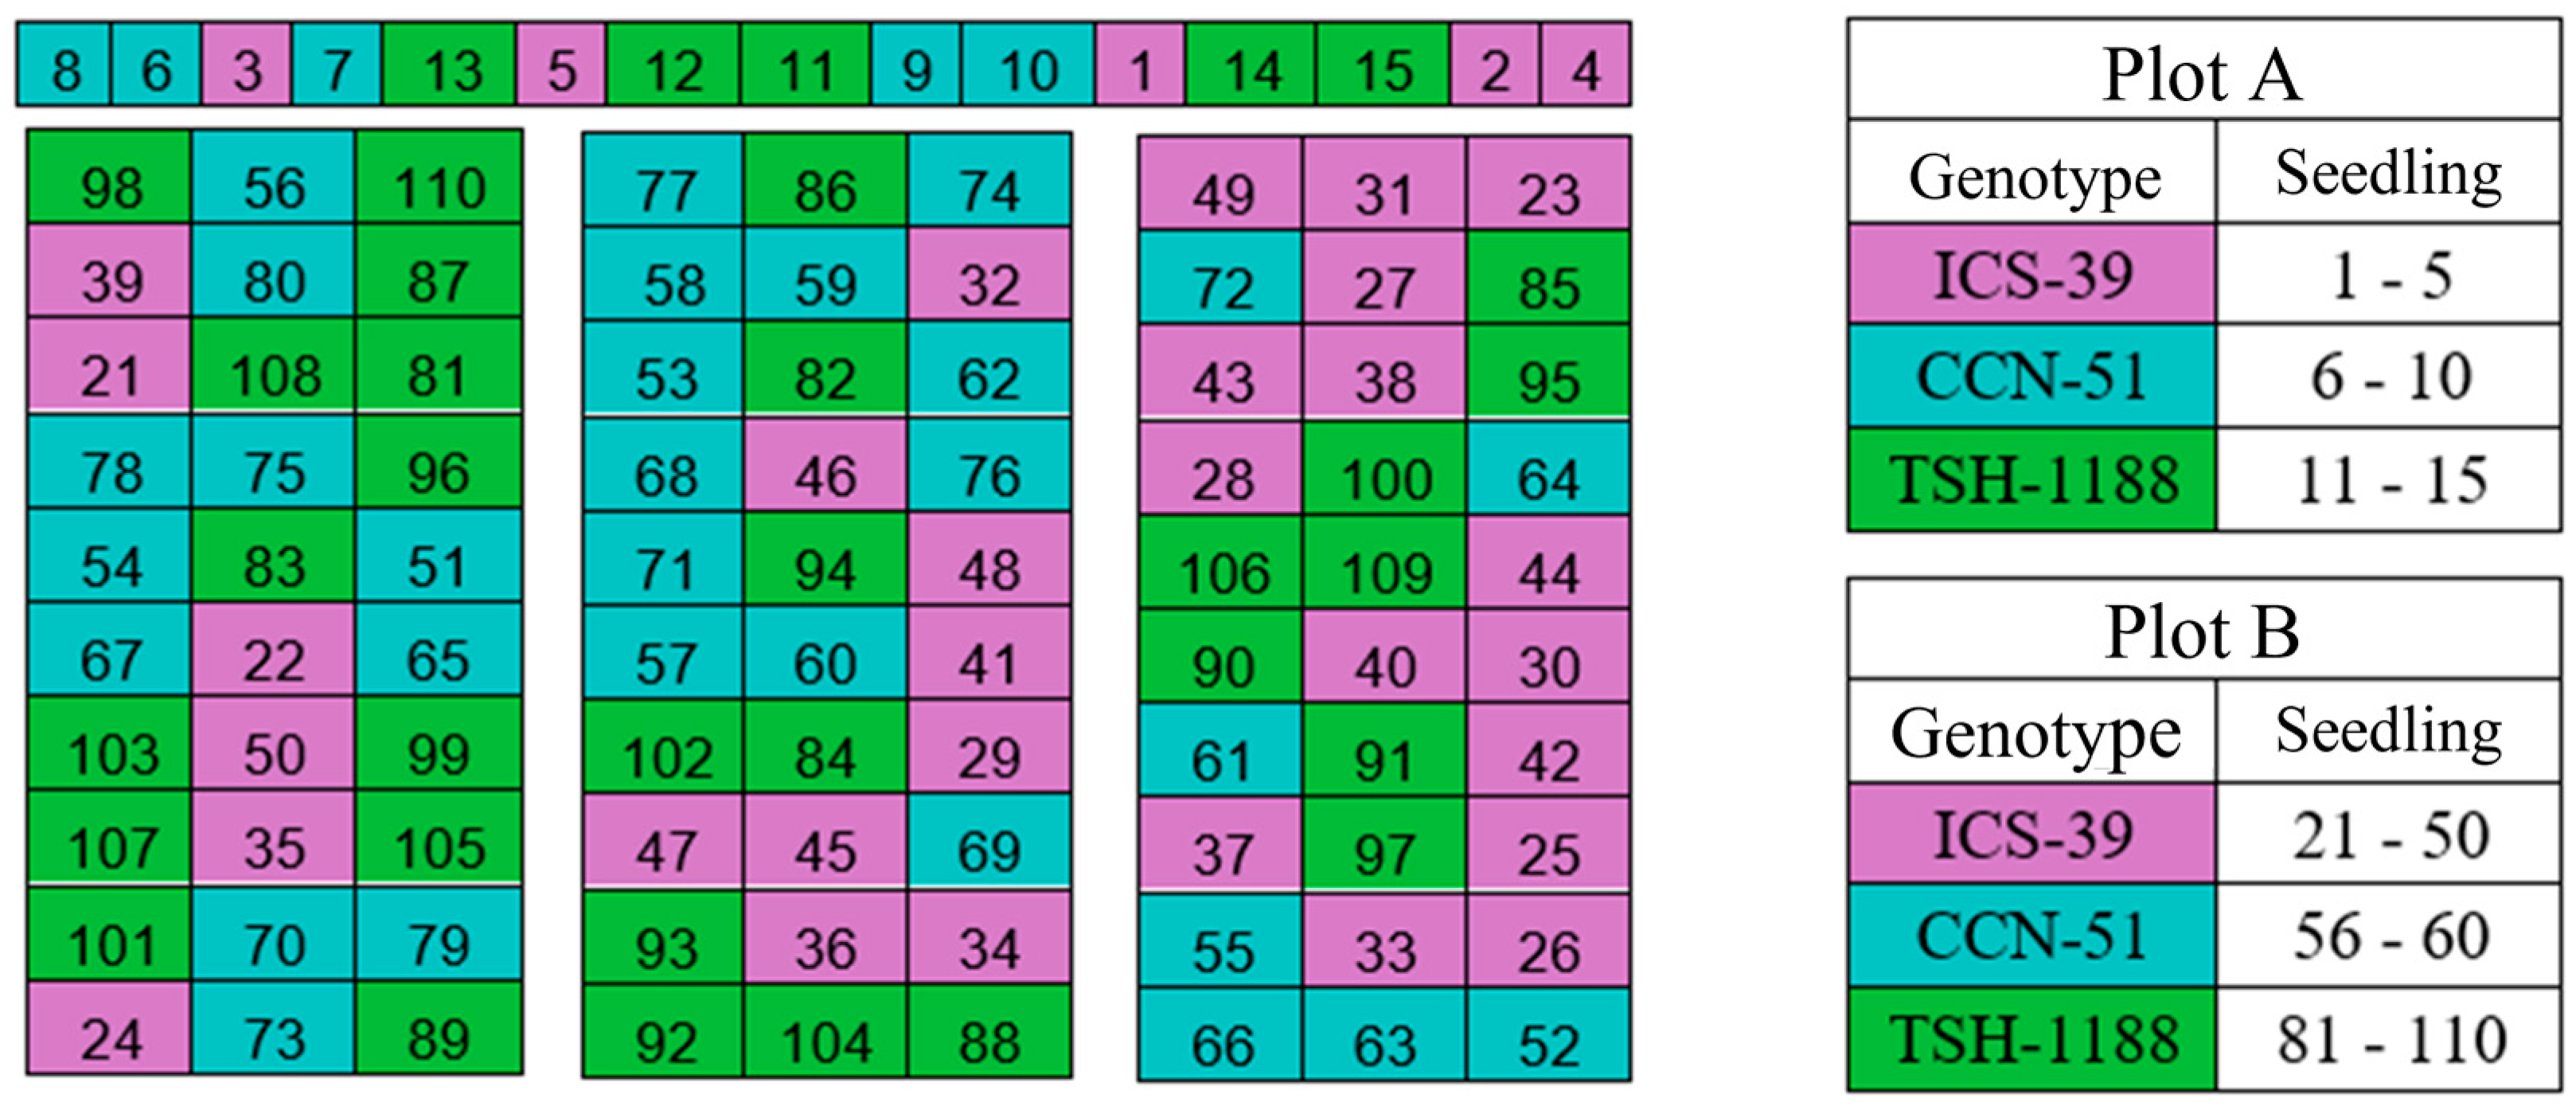
2.7. Implementation of a Suitable Space for Cacao Planting
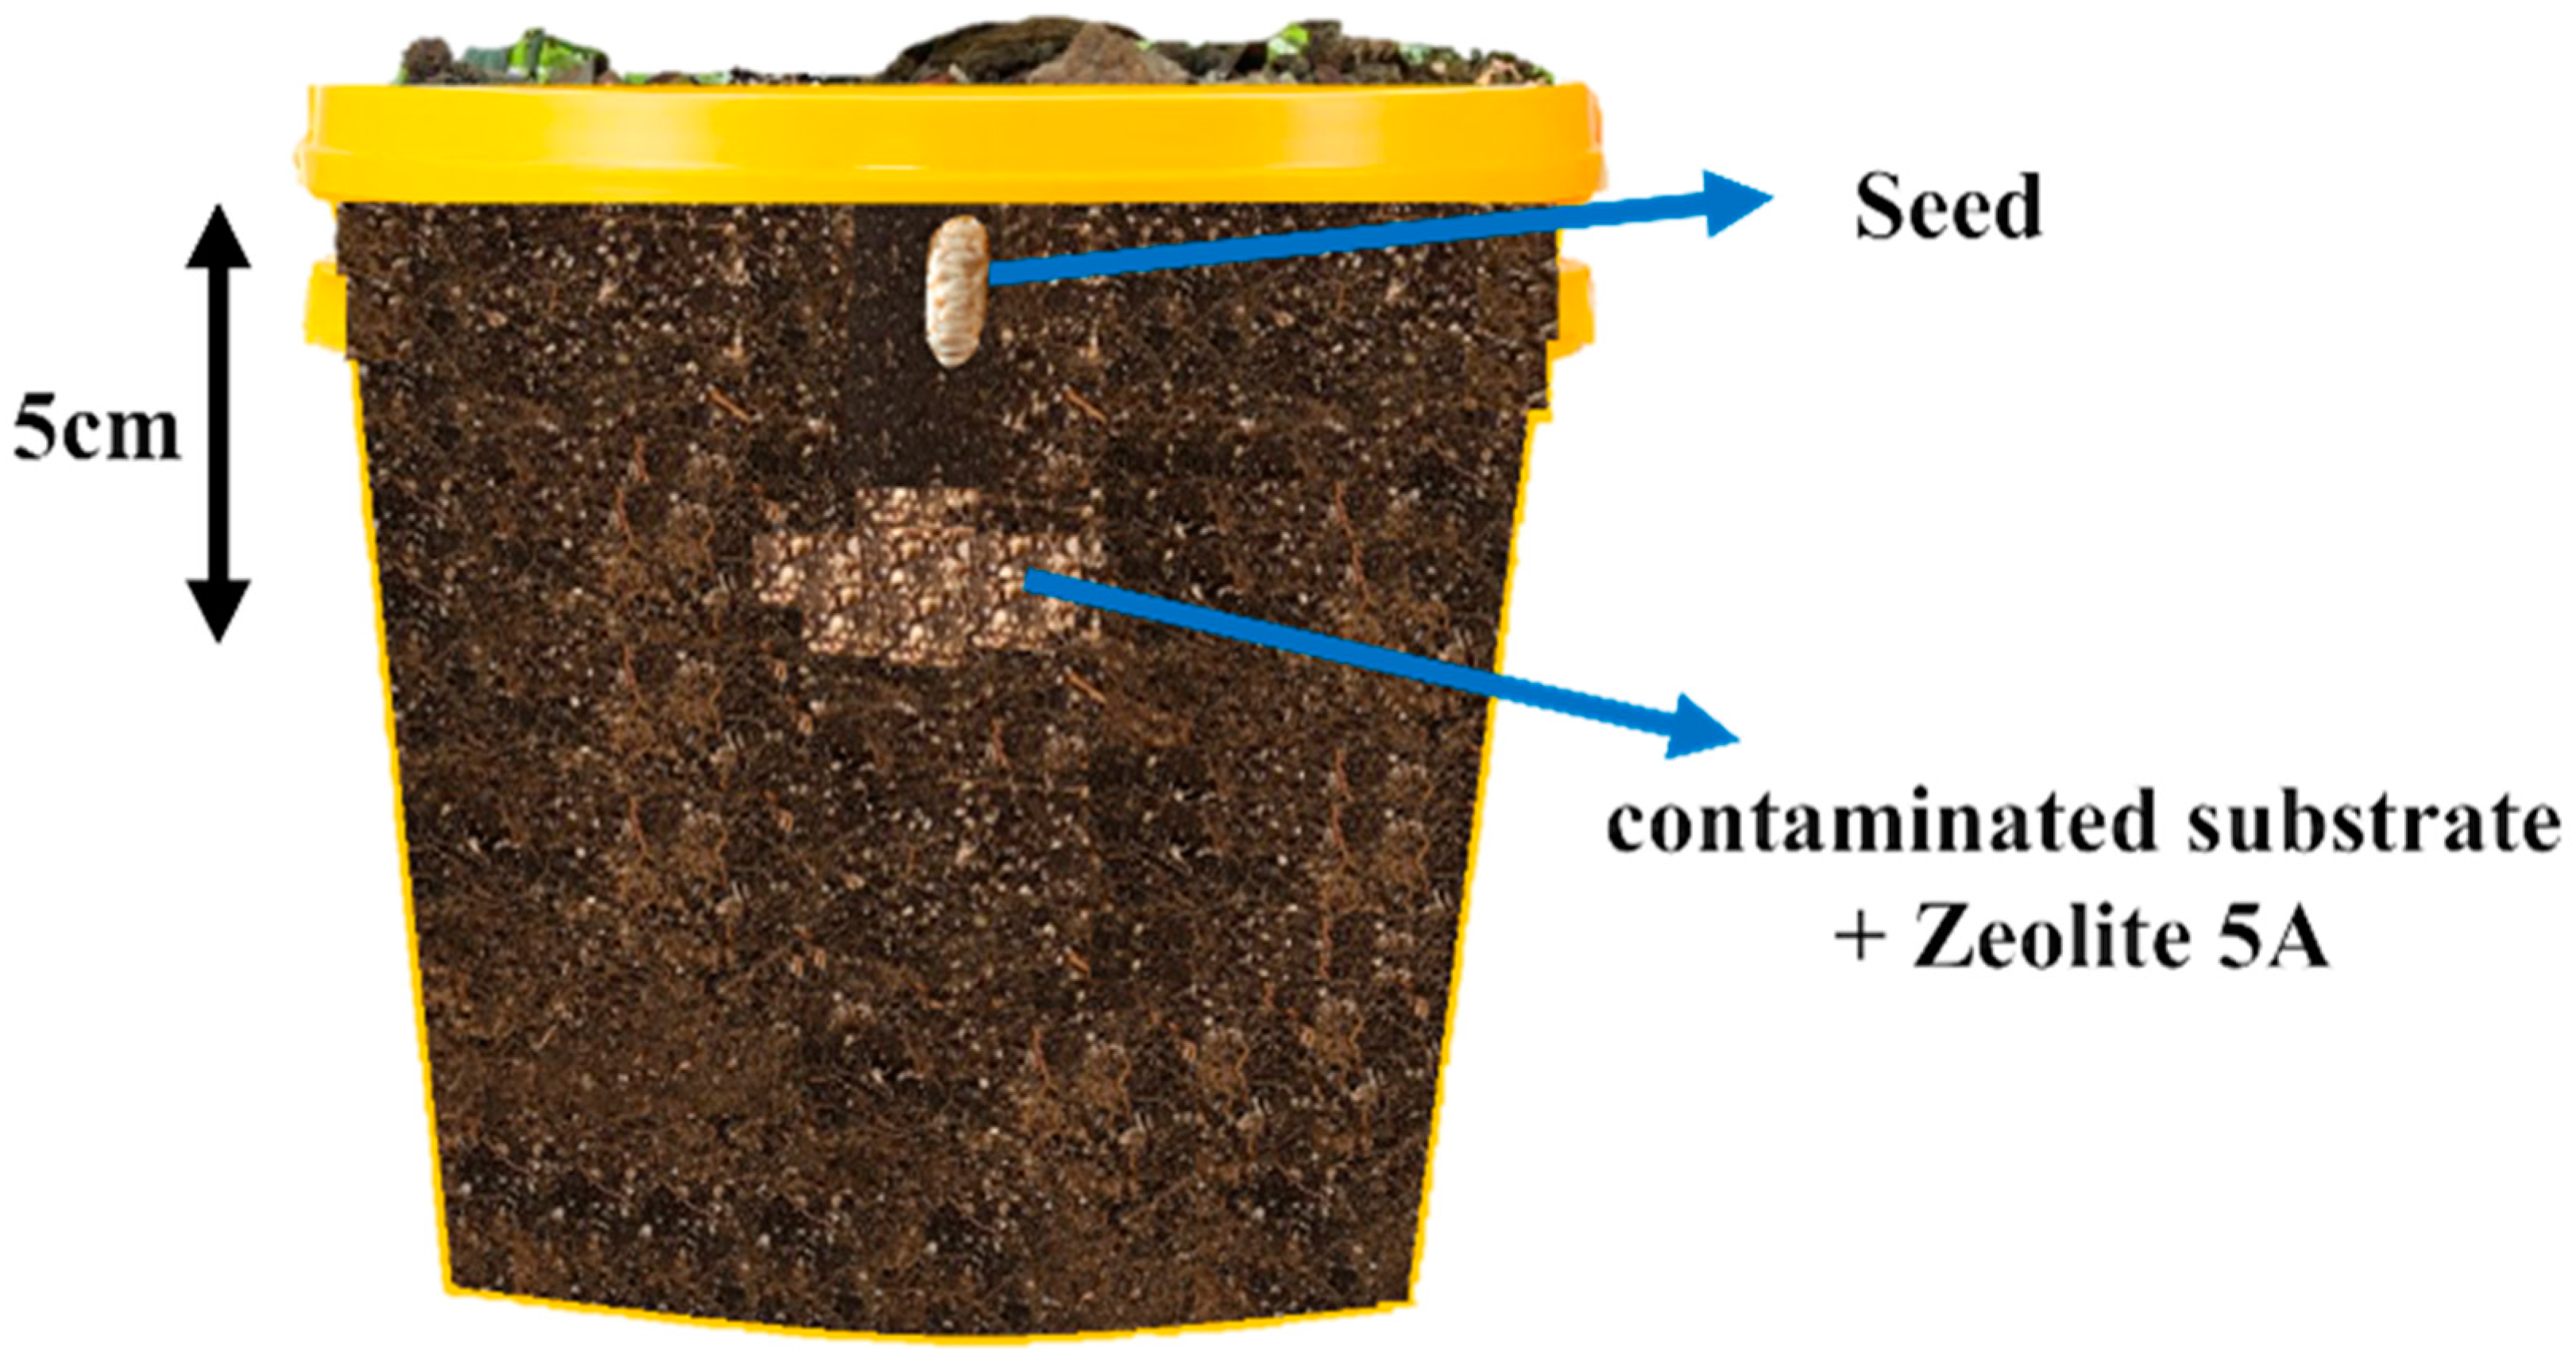
2.8. Preparation and Application of Zeolite 5A in Pots
2.9. Statistical Analysis
2.10. Ni+2 Determination Using Atomic Absorption Spectroscopy
3. Results and Discussion
3.1. Characterization by X-ray Diffraction and SEM Microscopy
3.1.1. Soil Samples
3.1.2. Zeolite 5A
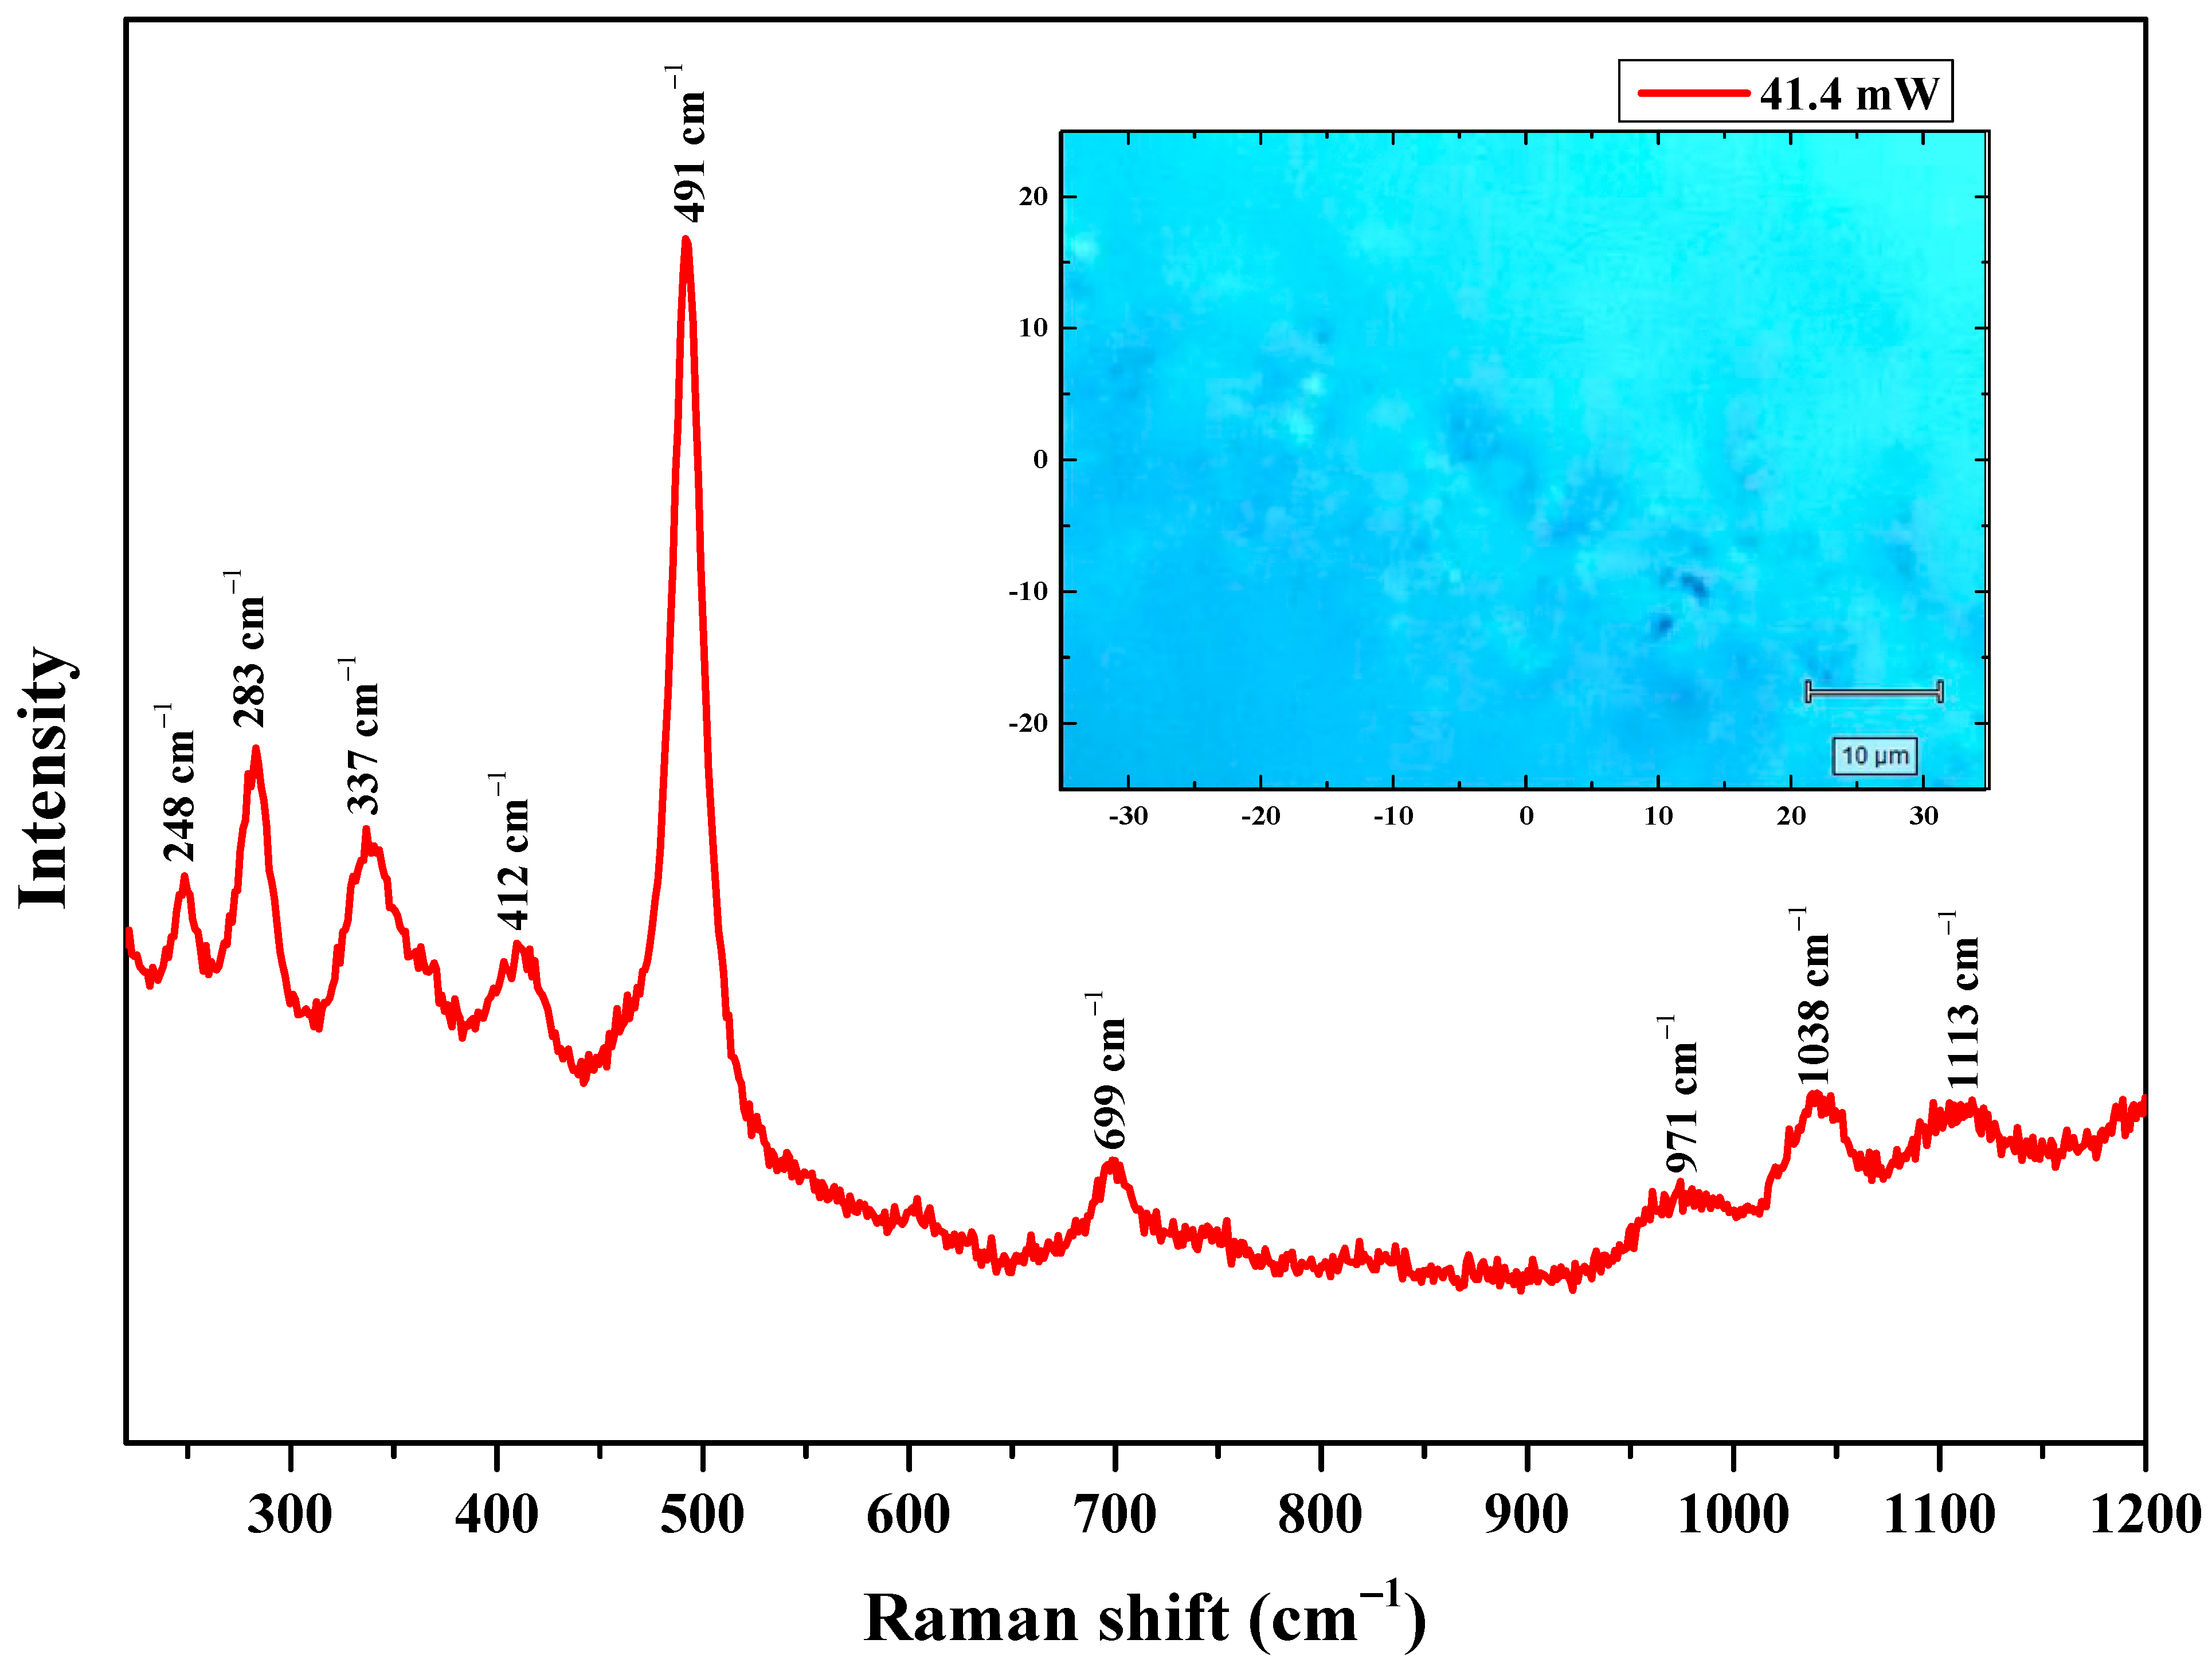
3.1.3. Raman Spectroscopy Analysis
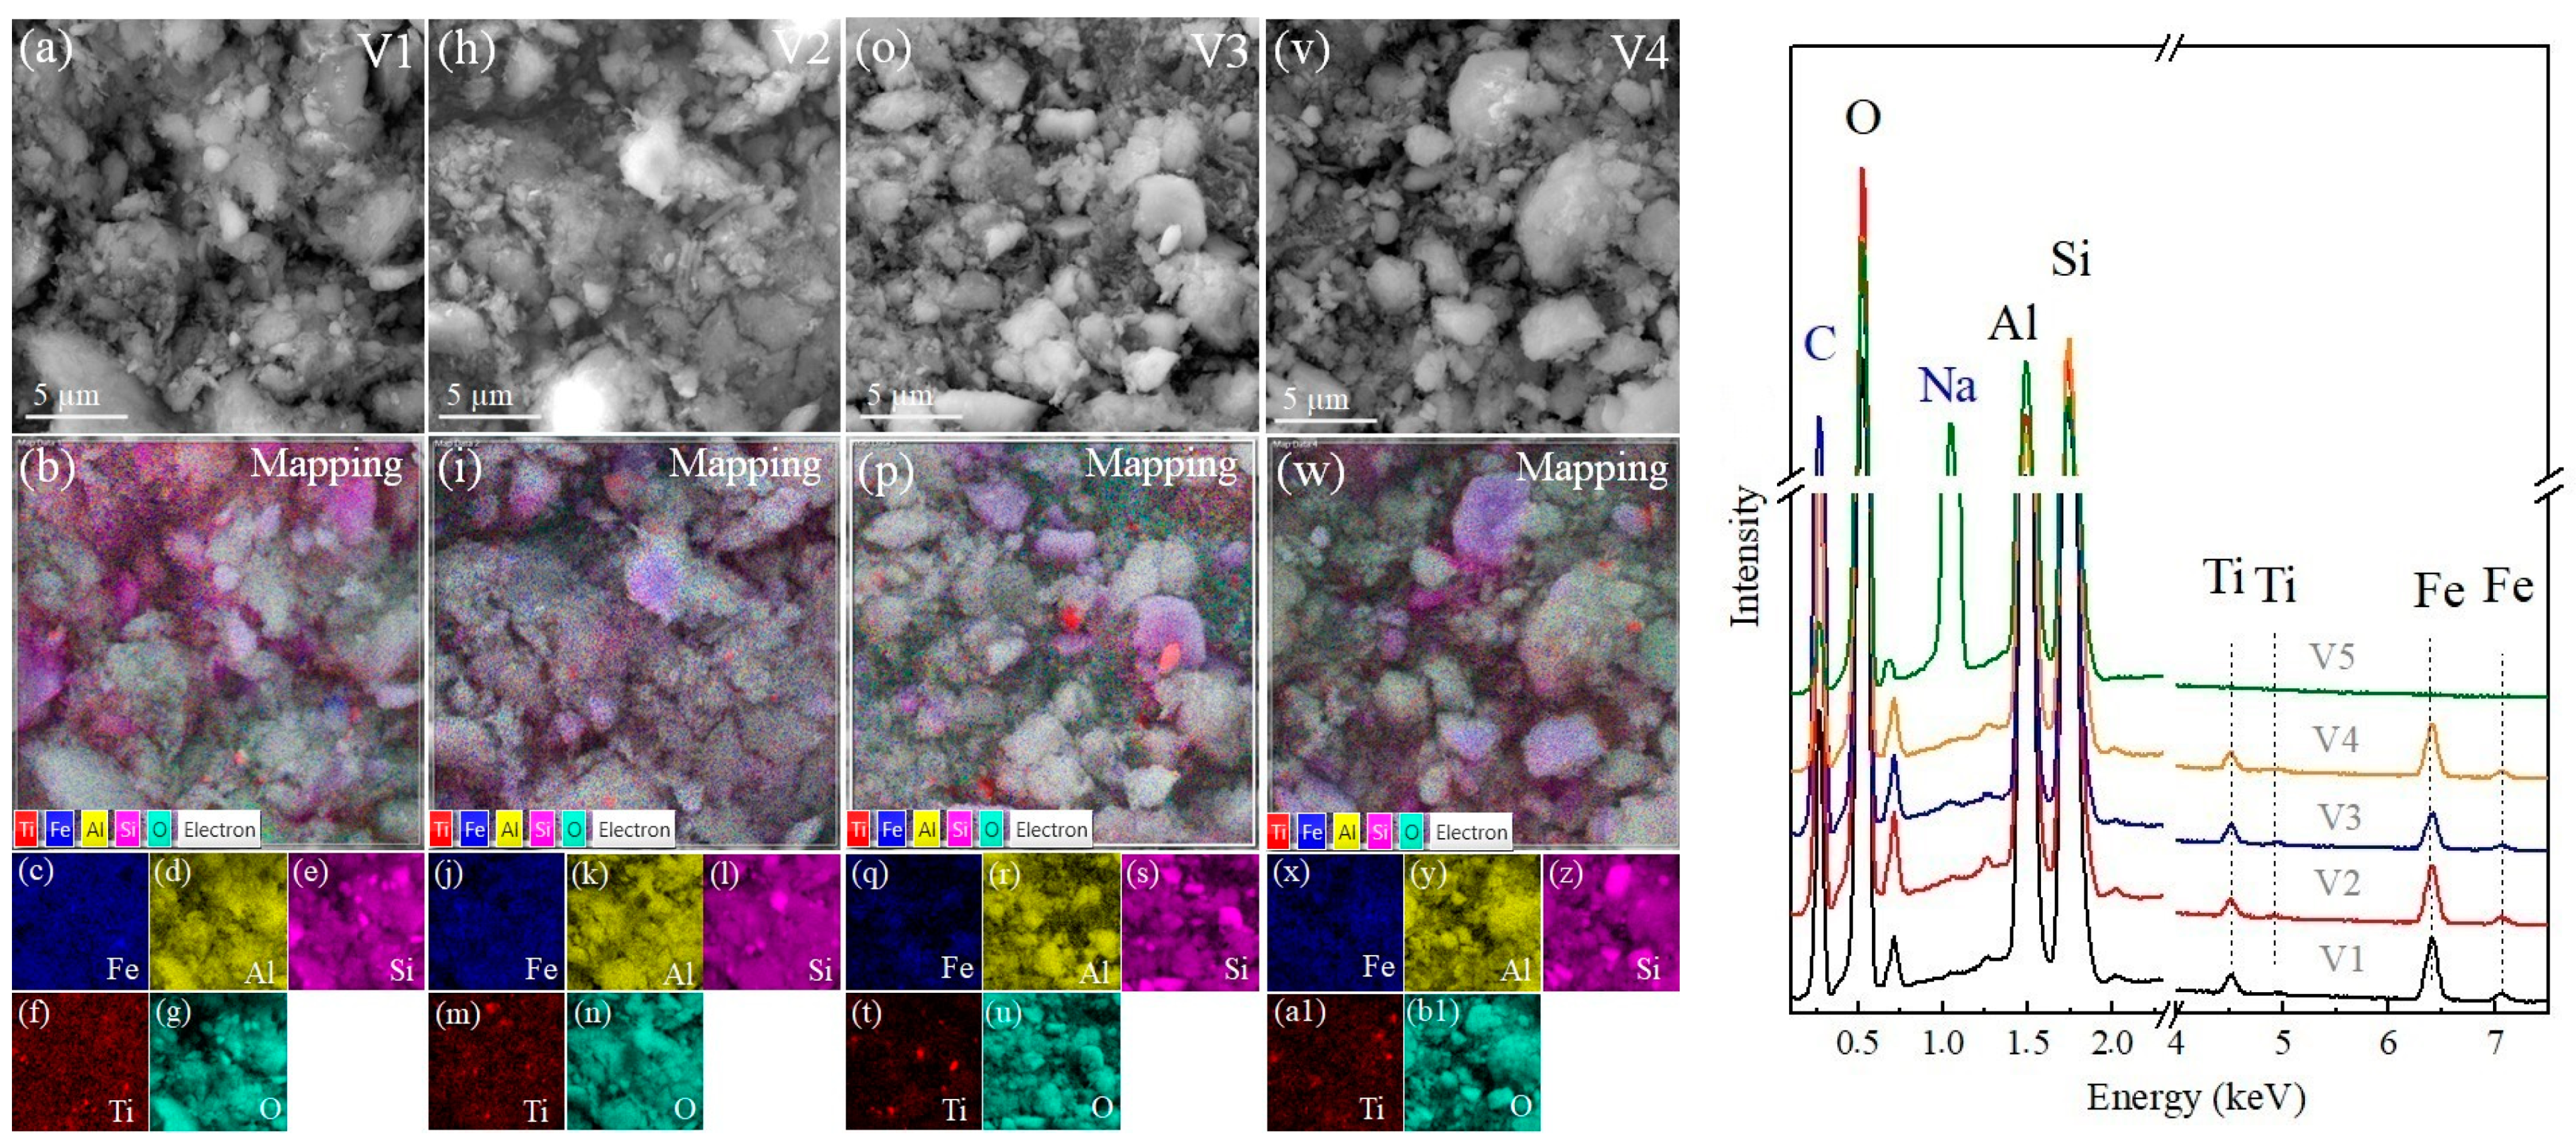
3.1.4. SEM Analysis (Zeolite 5A Integrity in Soils)
3.2. Analysis of Morphological Variables and Concentration of Ni+2
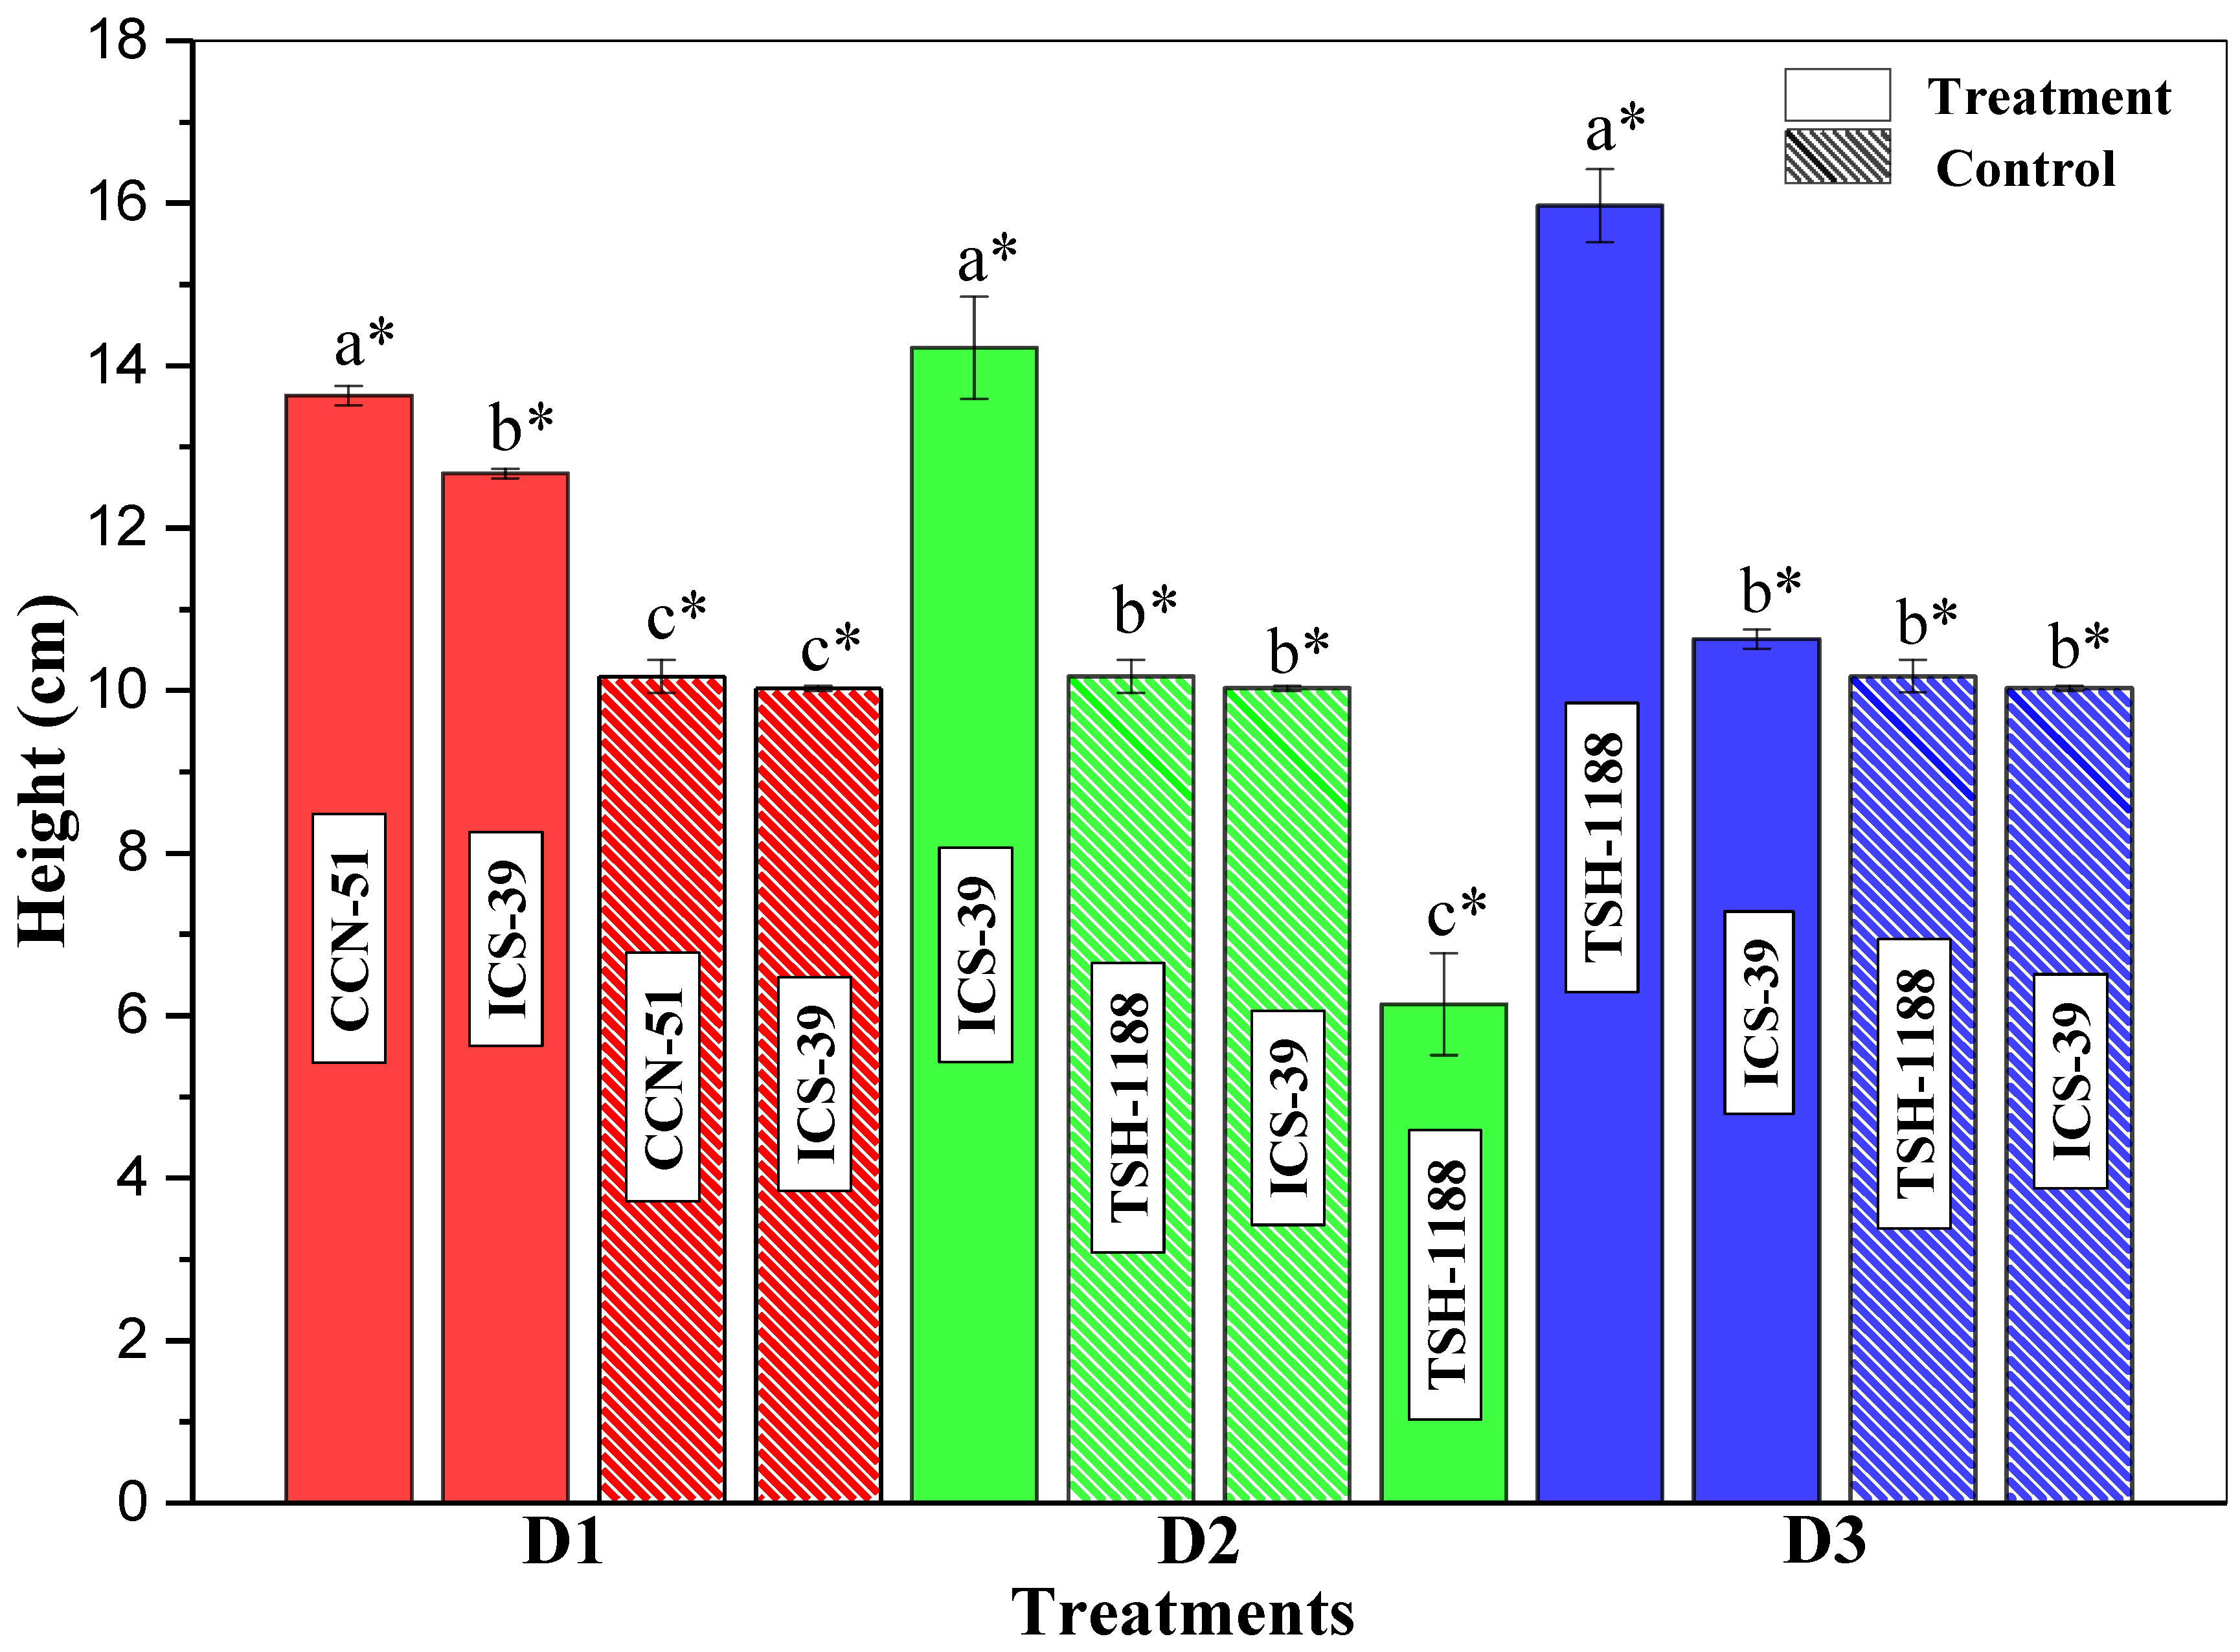
3.2.1. Height
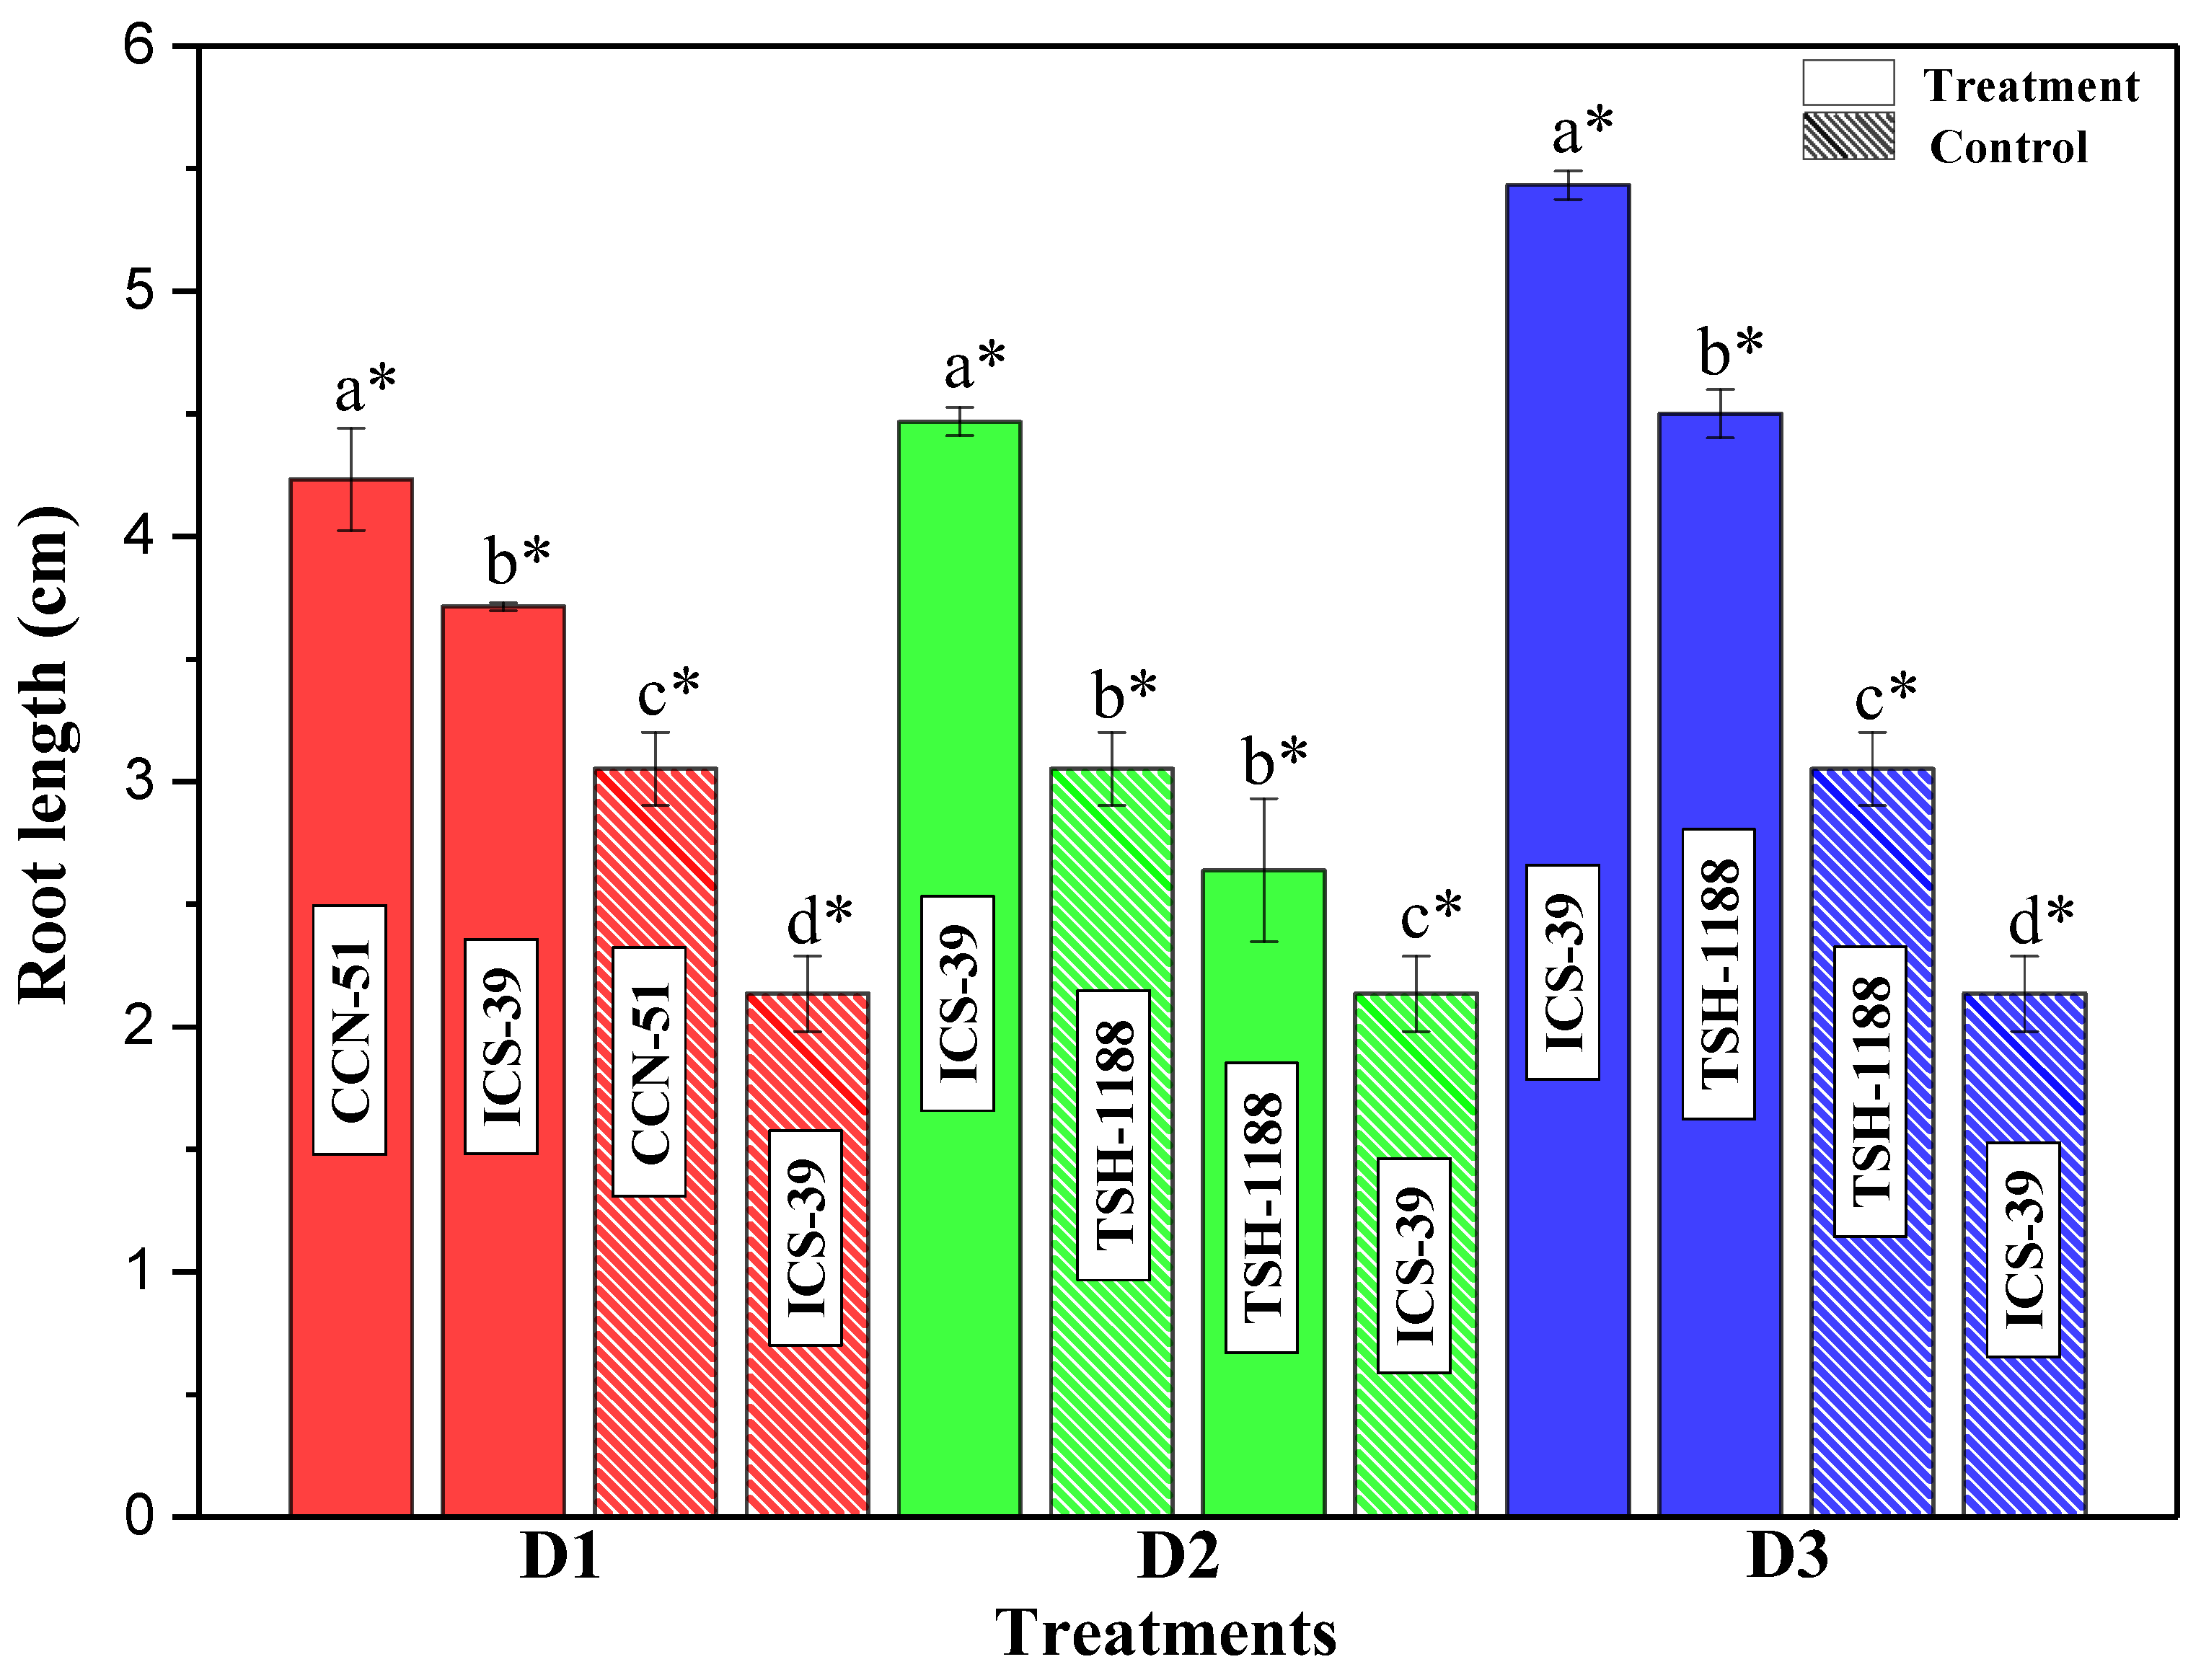
3.2.2. Root
3.2.3. Ni+2 Concentration in Seedlings
3.2.4. Mechanism of Ni Adsorption
4. Conclusions
Supplementary Materials
Author Contributions
Funding
Data Availability Statement
Acknowledgments
Conflicts of Interest
References
- Quintero, M.L.; Díaz-Morales, K.M. The world cacao market. Agroalim 2004, 9, 47–59. [Google Scholar]
- Huamán-Sánchez, O.G. Commodities Observatory: Cacao; MIDAGRI: Lima, Peru, 2021; pp. 4–19. [Google Scholar]
- Araujo, Q.R.; Fernandes, C.A.; Ribeiro, D.O.; Efraim, P.; Steinmacher, D.; Lieberei, R.; Bastide, P.; Araujo, T.G. Cacao Quality Index–A proposal. Food Control 2014, 46, 49–54. [Google Scholar] [CrossRef]
- EFSA (European Food Safety Authority). Cadmium dietary exposure in the European population. EFSA J. 2012, 10, 2551. [Google Scholar] [CrossRef]
- EFSA (European Food Safety Authority). Lead dietary exposure in the European population. EFSA J. 2012, 10, 2831. [Google Scholar] [CrossRef]
- Loureiro, G.A.H.A.; Araujo, Q.R.; Sodré, G.A.; Valle, R.R.; Souza, J.O.; Ramos, E.M.L.S.; Comerford, N.B.; Grierson, P.F. Cacao quality: Highlighting selected attributes. Food Rev. Int. 2016, 33, 382–405. [Google Scholar] [CrossRef]
- European Food Safety Authority (EFSA). Scientific Opinion on the Risks to Public Health Related to the Presence of Nickel in Food and Drinking Water. EFSA J. 2015, 13, 4002. [Google Scholar] [CrossRef] [Green Version]
- Kruszewski, B.; Obiedziński, M.W.; Kowalska, J. Nickel, cadmium and lead levels in raw cocoa and processed chocolate mass materials from three different manufacturers. J. Food Compos. Anal. 2018, 66, 127–135. [Google Scholar] [CrossRef]
- Genchi, G.; Carocci, A.; Lauria, G.; Sinicropi, M.S.; Catalano, A. Nickel: Human Health and Environmental Toxicology. Int. J. Environ. Res. Public Health 2020, 17, 679. [Google Scholar] [CrossRef] [Green Version]
- Brown, P.H.; Welch, R.M.; Cary, E.E. Nickel: A Micronutrient Essential for Higher Plants. J. Plant Physiol. 1987, 85, 801–803. [Google Scholar] [CrossRef]
- Wood, B.W.; Reilly, C.C.; Nyczepir, A.P. Mouse-ear of Pecan: I. Symptomatology and occurrence. HortScience 2004, 39, 87–94. [Google Scholar] [CrossRef] [Green Version]
- Mitra, S.; Chakraborty, A.J.; Tareq, A.M.; Emran, T.B.; Nainu, F.; Khusro, A.; Idris, A.M.; Khandaker, M.U.; Osman, H.; Alhumaydhi, F.A.; et al. Impact of heavy metals on the environment and human health: Novel therapeutic insights to counter the toxicity. J. King Saud Univ. Sci. 2022, 34, 101865. [Google Scholar] [CrossRef]
- Teefy, D.A. Remediation technologies screening matrix and reference guide: Version III. Remediat. J. 1997, 8, 115–121. [Google Scholar] [CrossRef]
- Azhar, U.; Ahmad, H.; Shafqat, H.; Babar, M.; Shahzad Munir, H.M.; Sagir, M.; Arif, M.; Hassan, A.; Rachmadona, N.; Rajendran, S.; et al. Remediation techniques for elimination of heavy metal pollutants from soil: A review. Environ. Res. 2022, 214, 113918. [Google Scholar] [CrossRef]
- Yao, Z.; Li, J.; Xie, H.; Yu, C. Review on Remediation Technologies of Soil Contaminated by Heavy Metals. Procedia Environ. Sci. 2012, 16, 722–729. [Google Scholar] [CrossRef] [Green Version]
- Busto, Y.; Cabrera, X.; Tack, F.; Verloo, M. Potential of thermal treatment for decontamination of mercury containing wastes from chlor-alkali industry. J. Hazard. Mater. 2011, 186, 114–118. [Google Scholar] [CrossRef] [PubMed]
- Mumpton, F.A. La roca magica: Uses of natural zeolites in agriculture and industry. Proc. Natl. Acad. Sci. USA 1999, 97, 3463–3470. [Google Scholar] [CrossRef] [PubMed] [Green Version]
- Mondal, M.; Biswas, B.; Garai, S.; Sarkar, S.; Banerjee, H.; Brahmachari, K.; Bandyopadhyay, P.K.; Maitra, S.; Brestic, M.; Skalicky, M.; et al. Zeolites Enhance Soil Health, Crop Productivity and Environmental Safety. Agronomy 2021, 11, 448. [Google Scholar] [CrossRef]
- Primo, A.; Garcia, H. Zeolites as catalysts in oil refining. Chem. Soc. Rev. 2014, 43, 7548–7561. [Google Scholar] [CrossRef] [PubMed]
- Ramesh, K.; Biswas, A.K.; Somasudaram, J.; Rao, A.S. Nanoporous zeolites in farming: Current status and issues ahead. Curr. Sci. 2010, 99, 760–764. [Google Scholar]
- Mastinu, A.; Kumar, A.; Maccarinelli, G.; Bonini, S.; Premoli, M.; Aria, F.; Gianoncelli, A.; Memo, M. Zeolite clinoptilolite: Therapeutic virtues of an ancient mineral. Molecules 2019, 24, 1517. [Google Scholar] [CrossRef] [Green Version]
- Mumpton, F.A.; Fishman, P.H. The Application of Natural Zeolites in Animal Science and Aquaculture. J. Anim. Sci. 1977, 45, 1188–1203. [Google Scholar] [CrossRef]
- Pond, W.G.; Yen, J.T. Reproduction and progeny growth in rats fed clinoptilolite in the presence or absence of dietary cadmium. Bull. Environ. Contam. Toxicol. 1983, 31, 666–672. [Google Scholar] [CrossRef] [PubMed]
- Hong, M.; Yu, L.; Wang, Y.; Zhang, J.; Chen, Z.; Dong, L.; Zan, Q.; Li, R. Heavy metal adsorption with zeolites: The role of hierarchical pore architecture. Chem. Eng. J. 2019, 359, 363–372. [Google Scholar] [CrossRef]
- Oboh, I.O. The Chemistry of Removal of Inorganic Compounds from the Soil. In Geomicrobiology and Biogeochemistry; Parmar, N., Singh, A., Eds.; Springer: Berlin/Heidelberg, Germany, 2014; pp. 247–259. [Google Scholar] [CrossRef]
- Ramesh, K.; Reddy, D.D. Zeolites and Their Potential Uses in Agriculture. Adv. Agron. 2011, 113, 219–241. [Google Scholar] [CrossRef]
- Szerement, J.; Szatanik-Kloc, A.; Jarosz, R.; Bajda, T.; Mierzwa-Hersztek, M. Contemporary applications of natural and synthetic zeolites from fly ash in agriculture and environmental protection. J. Clean. Prod. 2021, 311, 127461. [Google Scholar] [CrossRef]
- Putz, K.; Brandeburg, H. “Match!—Phase Identification from Powder Diffraction.” Kreuzherrenstr. 102, 53227 Bonn, Germany. Available online: https://www.crystalimpact.de/match (accessed on 25 February 2023).
- Porcher, F.; Souhassou, M.; Graafsma, H.; Puig-Molina, A.; Dusausoy, Y.; Lecomte, C. Refinement of framework disorder in dehydrated CaA zeolite from single-crystal synchrotron data. Acta Crystallogr. Sect. B Struct. Sci. Cryst. Eng. Mater. 2000, 56, 766–772. [Google Scholar] [CrossRef]
- Gualtieri, A.F. Accuracy of XRPD QPA using the combined Rietveld–RIR method. J. Appl. Crystallogr. 2000, 33, 267–278. [Google Scholar] [CrossRef] [Green Version]
- Machatschki, F. Die Kristallstruktur von Tiefquarz SiO2 und Aluminiumorthoarsenat AlAsO4. Z. Für Krist. Cryst. Mater. 1936, 94, 222–230. [Google Scholar] [CrossRef]
- Dutta, P.K.; Del Barco, B. Raman spectroscopy of zeolite A: Influence of silicon/aluminum ratio. J. Phys. Chem. 1988, 92, 354–357. [Google Scholar] [CrossRef]
- Soil Survey Staff. Keys to Soil Taxonomy, 13th ed.; USDA Natural Resources Conservation Service: Washington, DC, USA, 2022. [Google Scholar]
- Arévalo-Gardini, E.; Obando-Cerpa, M.E.; Zúñiga-Cernades, L.B.; Arévalo-Hernández, C.O.; Baligar, V.; He, Z. Metales pesados en suelos de plantaciones de cacao (Theobroma cacao L.) en tres regiones del Perú. Ecol. Apl. 2016, 15, 81. [Google Scholar] [CrossRef]
- Fasina, A.S.; Omotoso, S.O.; Shittu, O.S.; Adenikinju, A.P. Properties, Clasification and Suitability Evaluation of some Selected Cocoa Soils of South-Weresten Nigeria. J. Agric. Environ. Sci. 2007, 2, 312–317. [Google Scholar]
- Arce, M.P. Manual de Cultivo de Cacao, 1st ed.; MINAGRI: Lima, Perú, 2003; p. 100. [Google Scholar]
- Lass, R.A.; Wood, G.A.R. Cacao Production: Present Constraints and Priorities for Research; The World Bank: Washington, DC, USA, 1985. [Google Scholar]
- Donagema, G.K.; Campos, D.V.B.; de Calderano, S.B.; Teixeira, W.G.; Viana, J.H.M. Manual de Métodos de Análise de Solo; Empresa Brasileira de Pesquisa Agropecuária: Rio de Janeiro, Brazil, 2011; p. 230. [Google Scholar]
- Baillie, I.C.; Anderson, J.M.; Ingram, J.S.I. Tropical Soil Biology and Fertility: A Handbook of Methods. J. Ecol. 1990, 78, 547. [Google Scholar] [CrossRef]
- Alloway, B.J. Sources of Heavy Metals and Metalloids in Soils. In Heavy Metals in Soils. Trace Metals and Metalloids in Soils and their Bioavailability; Alloway, B.J., Ed.; Springer: Dordrecht, The Netherlands, 2013; pp. 315–318. [Google Scholar]
- Barceloux, D.G. Nickel. J. Toxicol. Clin. Toxicol. 1999, 37, 239–258. [Google Scholar] [CrossRef] [PubMed]
- Domingo, L.E.; Kyuma, K. Trace elements in tropical Asian paddy soils. Soil Sci. Plant Nutr. 1983, 29, 439–452. [Google Scholar] [CrossRef] [Green Version]
- Gonnelli, C.; Renella, G. Chromium and Nickel. Environ. Pollut. 2012, 22, 313–333. [Google Scholar] [CrossRef]
- Arévalo-Hernández, C.O.; Arévalo-Gardini, E.; Barraza, F.; Farfán, A.; He, Z.; Baligar, V.C. Growth and nutritional responses of wild and domesticated cacao genotypes to soil Cd stress. Sci. Total Environ. 2020, 763, 144021. [Google Scholar] [CrossRef] [PubMed]
- Li, J.; Zhuang, X.; Font, O.; Moreno, N.; Vallejo, V.R.; Querol, X.; Tobias, A. Synthesis of merlinoite from Chinese coal fly ashes and its potential utilization as slow-release K-fertilizer. J. Hazard. Mater. 2014, 265, 242–252. [Google Scholar] [CrossRef] [Green Version]
- Minitab Software LLC (2021). Minitab Software. Available online: https://www.minitab.com (accessed on 25 February 2023).
- Güldaş, M. Comparison of digestion methods and trace elements determination in chocolates with pistachio using atomic absorption spectrometry. J. Food Nutr. 2008, 47, 92–99. [Google Scholar]
- Zuo, R.F.; Du, G.X.; Yang, W.G.; Liao, L.B.; Li, Z. Mineralogical and chemical characteristics of a powder and purified quartz from Yunnan Province. Open Geosci. 2016, 8, 606–611. [Google Scholar] [CrossRef] [Green Version]
- Tahiri, N.; Khouchaf, L.; Elaatmani, M.; Louarn, G.; Zegzouti, A.; Daoud, M. Study of the thermal treatment of SiO2 aggregate. IOP Conf. Ser. Mater. Sci. 2014, 62, 012002. [Google Scholar] [CrossRef] [Green Version]
- Grämlich, V.; Meier, W.M. The crystal structure of hydrated NaA: A detailed refinement of a pseudosymmetric zeolite structure. Z. Kristallogr. Cryst. Mater. 1971, 133, 134–149. [Google Scholar] [CrossRef]
- Ramos-Guivar, J.A.; Zarria-Romero, J.Y.; Castro-Merino, I.L.; Greneche, J.M.; Passamani, E.C. Improvement of the thermal stability of nanomaghemite by functionalization with type 5A zeolite and magnetic properties studied by in-field 57Fe Mössbauer measurements. J. Magn. Magn. Mater. 2022, 552, 169241. [Google Scholar] [CrossRef]
- Cheng, S. Effects of Heavy metals on plants and resistance mechanisms. Environ. Sci. Pollut. Res. 2003, 10, 256–264. [Google Scholar] [CrossRef] [PubMed]
- Casierra-Posada, F.; Aguilar-Avendaño, O.E. Aluminum stress in plants: Reactions in soil, symptoms in plants and possibilities for remediation. A review. Rev. Colomb. HortSci. 2018, 1, 246–257. [Google Scholar] [CrossRef]
- Molina, E. Guide for the interpretation of soil fertility in Costa Rica of Costa Rica. Costa Rican Association of Soil Science. Costa Rica 2012, 11–20. [Google Scholar]


| Chemical Analysis | |||||||||||
|---|---|---|---|---|---|---|---|---|---|---|---|
| pH | CaCO3 (%) | O.M. (%) | N (%) | P* mg kg−1 | K* mg kg−1 | E.C. dS cm−1 | |||||
| 4.3 ± 0.1 | <0.3 | 0.81 ± 0.04 | 0.04 ± 0.01 | 1.65 ± 0.02 | 24 ± 3 | 0.08 ± 0.01 | |||||
| CEC | E.C.E.C. | Ca | Mg | K | Na | Al+3 | |||||
| cmol kg−1 | |||||||||||
| 8.6 ± 0.3 | 4.6 ± 0.1 | 1.62 ± 0.02 | 0.58 ± 0.01 | 0.06 ± 0.01 | 0.34 ± 0.03 | 2 ± 0.1 | |||||
| Physical analysis (%) | |||||||||||
| Sand | Silt | Clay | B. S. | ||||||||
| 59.7 ± 4.36 | 8.3 ± 0.4 | 32.04 ± 1.21 | 30.26 ± 1.42 | ||||||||
| Ni Concentration mg kg−1 | |||||||||||
| Ni Concentration Initial | Ni Concentration before treatment | Ni Concentration after treatment | |||||||||
| 1.83 ± 0.04 | 70.21 ± 1.91 | 25.34 ± 0.82 | |||||||||
| Genotype | G1 | G2 | G3 | |||
| ICS-39 | CCN-51 | TSH-1189 | ||||
| Dose of Zeolite (g) | D0 | D1 | D2 | D3 | ||
| 0 | 1 | 2 | 4 | |||
| Band Assignment | Raman Shift (cm−1) |
|---|---|
| Double ring | 248 283 337 412 699 |
| Molecular Bonding T-O-T | 491 |
| Molecular T-O | 971 1038 1113 |
| Sample | Al (%wt) | Si (%wt) | O (%wt) | Fe (%wt) | Ti (%wt) |
|---|---|---|---|---|---|
| V1 | 15.3 | 25.9 | 51.1 | 6.8 | 0.9 |
| V2 | 15.1 | 22.2 | 57.3 | 4.8 | 0.6 |
| V3 | 12.5 | 22.6 | 60.1 | 3.9 | 0.9 |
| V4 | 13.9 | 25.1 | 55.4 | 4.9 | 0.7 |
| V5 | 20.6 | 22.1 | 57.4 | - | - |
| Dose | Genotype | Dry Matter | Ni Concentration without Treatment (µg g−1) ±5.77 × 10⁻⁴ | Ni Concentration with Treatment (µg g−1) |
|---|---|---|---|---|
| D1 | G1 | 0.659 | 0.0832 | 0.0194 ± 1 × 10⁻⁴ |
| D2 | 0.711 | 0.0831 | 0.0075 ± 5.77 × 10⁻⁵ | |
| D3 | 0.661 | 0.0831 | 0.0042 ± 2.65 × 10⁻⁴ | |
| D1 | G2 | 0.725 | 0.0830 | 0.026 ± 1 × 10⁻³ |
| D2 | G3 | 0.863 | 0.0832 | 0.0373 ± 1 × 10⁻⁴ |
| D3 | 0.393 | 0.0831 | 0.0095 ± 3.21 × 10⁻³ |
| Dose | Genotype | Dry Matter | Absorption * | Adsorption ** |
|---|---|---|---|---|
| D1 | G1 | 0.659 | 23.47% | 76.53% |
| D2 | 0.711 | 9.11% | 90.89% | |
| D3 | 0.661 | 5.14% | 94.86% | |
| D1 | G2 | 0.725 | 31.44% | 68.55% |
| D2 | G3 | 0.863 | 44.92% | 55.07% |
| D3 | 0.393 | 11.39% | 88.60% |
Disclaimer/Publisher’s Note: The statements, opinions and data contained in all publications are solely those of the individual author(s) and contributor(s) and not of MDPI and/or the editor(s). MDPI and/or the editor(s) disclaim responsibility for any injury to people or property resulting from any ideas, methods, instructions or products referred to in the content. |
© 2023 by the authors. Licensee MDPI, Basel, Switzerland. This article is an open access article distributed under the terms and conditions of the Creative Commons Attribution (CC BY) license (https://creativecommons.org/licenses/by/4.0/).
Share and Cite
Alca-Ramos, Y.V.; Checca-Huaman, N.-R.; Arévalo-Gardini, E.; Arévalo-Hernández, C.O.; Ramos-Guivar, J.A. Inhibition of Nickel (II) Mobility in Theobroma cacao L. Seedlings Using Zeolite 5A. Agriculture 2023, 13, 599. https://doi.org/10.3390/agriculture13030599
Alca-Ramos YV, Checca-Huaman N-R, Arévalo-Gardini E, Arévalo-Hernández CO, Ramos-Guivar JA. Inhibition of Nickel (II) Mobility in Theobroma cacao L. Seedlings Using Zeolite 5A. Agriculture. 2023; 13(3):599. https://doi.org/10.3390/agriculture13030599
Chicago/Turabian StyleAlca-Ramos, Yacu Vicente, Noemi-Raquel Checca-Huaman, Enrique Arévalo-Gardini, Cesar O. Arévalo-Hernández, and Juan A. Ramos-Guivar. 2023. "Inhibition of Nickel (II) Mobility in Theobroma cacao L. Seedlings Using Zeolite 5A" Agriculture 13, no. 3: 599. https://doi.org/10.3390/agriculture13030599