Article

The Effect of Information Acquisition Ability on Farmers’ Agricultural Productive Service Behavior: An Empirical Analysis of Corn Farmers in Northeast China

College of Economics and Management, Shenyang Agricultural University, Shenyang 110866, China
*
Author to whom correspondence should be addressed.
Agriculture 2023, 13(3), 573; https://doi.org/10.3390/agriculture13030573
Submission received: 12 December 2022 / Revised: 18 February 2023 / Accepted: 22 February 2023 / Published: 27 February 2023

Abstract

:
Agricultural productive services are an important means to achieve effective allocation of regional resources and play an important role in ensuring food security and improving farmers’ welfare. However, the development process of agricultural productive services still faces problems such as large differences in service levels in different segments and low participation rates in the full service. In order to investigate the influential paths of the low participation rate of farmers in the full-service process, this study takes maize farmers in northeast China as the research object. Based on 937 survey data from six cities in three northeastern provinces, we used the Item Response Theory (IRT) model to measure farmers’ information acquisition ability and constructed the Heckman two-stage model and the IV-Heckman model to analyze the logical framework of “information acquisition ability—farmers’ choice of productive agricultural services”. The main findings are as follows: firstly, the more channels there are, the stronger the farmers’ channel internalities; the higher the degree of channel differentiation, the stronger the farmers’ channel internalities. Second, after addressing the sample selection bias and endogeneity, there is a small rise in the facilitation effect of information acquisition ability on farmers’ productive agricultural service behavior. Third, this facilitation effect is achieved through farmers’ perceived usefulness of productive agricultural services, and the mediating effect of perceived ease of use is not significant. Therefore, fostering farmers’ self-perceptions and optimizing information delivery strategies are effective ways to promote farmers’ choice of agricultural productive services and to facilitate the modernization of Chinese agriculture. In general, this study helps to reveal the theoretical mechanism of farmers’ information asymmetry, and provides empirical evidence for how to promote the development of agricultural productive services.

1. Introduction

Agriculture is a basic and strategic industry related to national security, economy, and people’s livelihood. Modern agriculture is an inevitable trend of agricultural development. China’s agricultural modernization has entered a new historical stage, and appropriate scale agricultural operation featuring modern agricultural technology and equipment and new agricultural operators will become the main form. “Agricultural scale management” is regarded as the key to realize the organic connection between small farmers and modern agriculture [1], including two types of agricultural land transfer scale management and agricultural service scale management [2]. At present, the academic research on agricultural scale management is divided into two categories, namely, land transfer achieved by transferring land management right and agricultural productive services without transferring management right under the condition of property right subdivision [3]. The proposal of agricultural productive services (APS) was put forward nearly 35 years later than that of productive services. It refers to the network and organization system formed by various institutions and individuals providing services for each link of agriculture before, during, and after production on the basis of household contract management [4,5]. In this system, farmers pay certain service fees to the trustee, and entrust the trustee to complete part or all of the agricultural production process, and the final harvested food or Income belongs to the farmer. The APS adoption behavior referred to in this study mainly refers to whether mechanical services are purchased in the fields’ preparation, seeding, field management, harvesting, and other links of corn planting. The adoption types can be divided into partial link services and full services. APS subjects are comprehensive in type and extensive in service content, both those formed before the rural reform such as supply and marketing cooperatives and those emerging after the reform such as family farms, large professional households, and agricultural service enterprises, etc. [6]. The service subjects in this paper are mainly cooperatives, land trust companies, local farming households, and foreign farming households.
Farmers are essential micro-objects for implementing the adoption of APS. Exploring the influencing factors of this subject is conducive to deepening the discussion of farmers’ decision-making and widening the channels of farmers’ service adoption. In recent years, the government and academia have paid great attention to this issue and conducted active exploration. Research on the effects of APS has been confirmed by scholars; APS saves farmers’ efforts while highly fitting rural reality and satisfying farmers’ love for the land [7], truly achieving farmers’ income, food production, and agricultural efficiency, promoting agricultural scale operation and agricultural technology progress [8,9], effectively consolidating the industrial foundation of rural revitalization It optimizes the agricultural production mode and helps to better complete the docking between small farmers and modern agriculture. In particular, the full-service model, under which farmers no longer carry out a single link of trusteeship, has shown that the development of APS, a new agricultural production method, is conducive to the realization of green and low-carbon transformation of agriculture [10], and that APS can improve farm productivity and environmental benefits by reducing input costs and increasing output [11], promoting farmers’ participation in green production behavior in agriculture [12], and can also lead to the transformation of agricultural production methods of farmers without green production intentions [13]. The more links farmers adopt the service, the higher their level of agricultural green productivity [14] and the higher the level of farmers’ well-being [15]; the model not only promotes green agricultural development and improves agricultural green production efficiency, but also lays the cornerstone of sustainable agricultural development [16,17].
However, the development process of APS still faces many problems, among which the particularly prominent ones are: significant differences in the level of services in different segments [18], constraints in the supply of APS, farmers’ difficulty in screening various service models [19], farmers’ willingness to adopt contrary to their behavior [20], and the low participation rate of full service [21,22].
Many studies have shown that farmers’ agricultural productive service behavior decisions are affected to varying degrees by various factors such as farmers’ own characteristics, household and production operation characteristics, and agricultural production environment characteristics [23]. By constructing a binary Logit model, Hu, Y.T. et al. (2014) argued that the characteristics of farmers themselves significantly affected the APS behavior of farmers, which specifically manifested as: the health status of farmers mainly engaged in agricultural production and the age of the household head significantly negatively affected the APS behavior [24,25]. Xiao, J.Y. et al. (2018) investigated farmers’ intention to participate in APS in Jiangsu Province and concluded that age had a negative impact on farmers’ intention to participate, while education level had a positive impact on farmers’ intention to participate [26]. Existing studies have shown that, compared with male farmers, female farmers are more willing to participate in APS, and farmers with higher education level are less willing to participate in APS. Participation in agricultural technology training promotes farmers’ service selection [25]. As for the influence of age on participation intention of APS, Lu Qinan et al. (2017) introduced the important variable of whether non-agricultural labor force lived at home, and concluded that in low-labor-intensity links, aging significantly reduced the possibility of service, while in high-labor-intensity links, it was just the opposite. In addition, under the condition of the same age, non-household households have a higher probability of choosing services than non-household labor households [27]. As for farmers’ risk preference, the higher the degree of risk preference, the more likely they are to choose APS [28], and the lower the degree of risk preference, the less likely they are to choose the full service. Natural risk has an obstructing effect on their selection decision [22], and the degree of risk preference of farmers has heterogeneity on services of different production links; it has great influence on the demand of plant protection, fertilization, and harvest. The effects on land preparation and seeding were not significant [29]. Asymmetry of information, contradiction of supply and demand, and difference of farmers’ land endowment are the reasons that affect farmers’ subjective service willingness and objective service degree to adopt APS [30]. Some scholars have studied the APS behavior of farmers from different theoretical perspectives [18,31,32] and found that there are obvious differences in the service degree of different production links. Whether farmers buy services is a rational decision made after fully weighing the cost and benefit. High-risk production will greatly restrict the participation degree of farmers.
With China’s transition from a planned economy to a market economy, many urban-rural gap problems caused by the urban–rural division system have been continuously broken, and urban–rural relations have been moving toward integration [33]. However, some studies have also shown that rural residents have been at a disadvantage relative to urban residents regarding information access and ability. On the assumption of economics, behavioral decision makers are rational, and information is perfectly symmetric, i.e., information can be accurately and timely transmitted to all farmers; however, in the actual economic environment, information is asymmetric, and it is difficult for farmers to obtain all information in the market, and because farmers have different knowledge, ability, capital size, and position they occupy, their ability to obtain and process information varies, and farmers tend to make production decisions based on limited information. The study by Vecchio et al. also pointed out that farmers’ behavioral decisions are related to their information acquisition ability (IAA) [34], and the stronger the IAA of farmers, the more frequently they communicate with the outside world, the more likely they are to obtain adequate policy, market, and financial information, reducing the problem of information asymmetry caused by risk, which also provides an important analytical perspective for analyzing the full-service behavior of farmers.
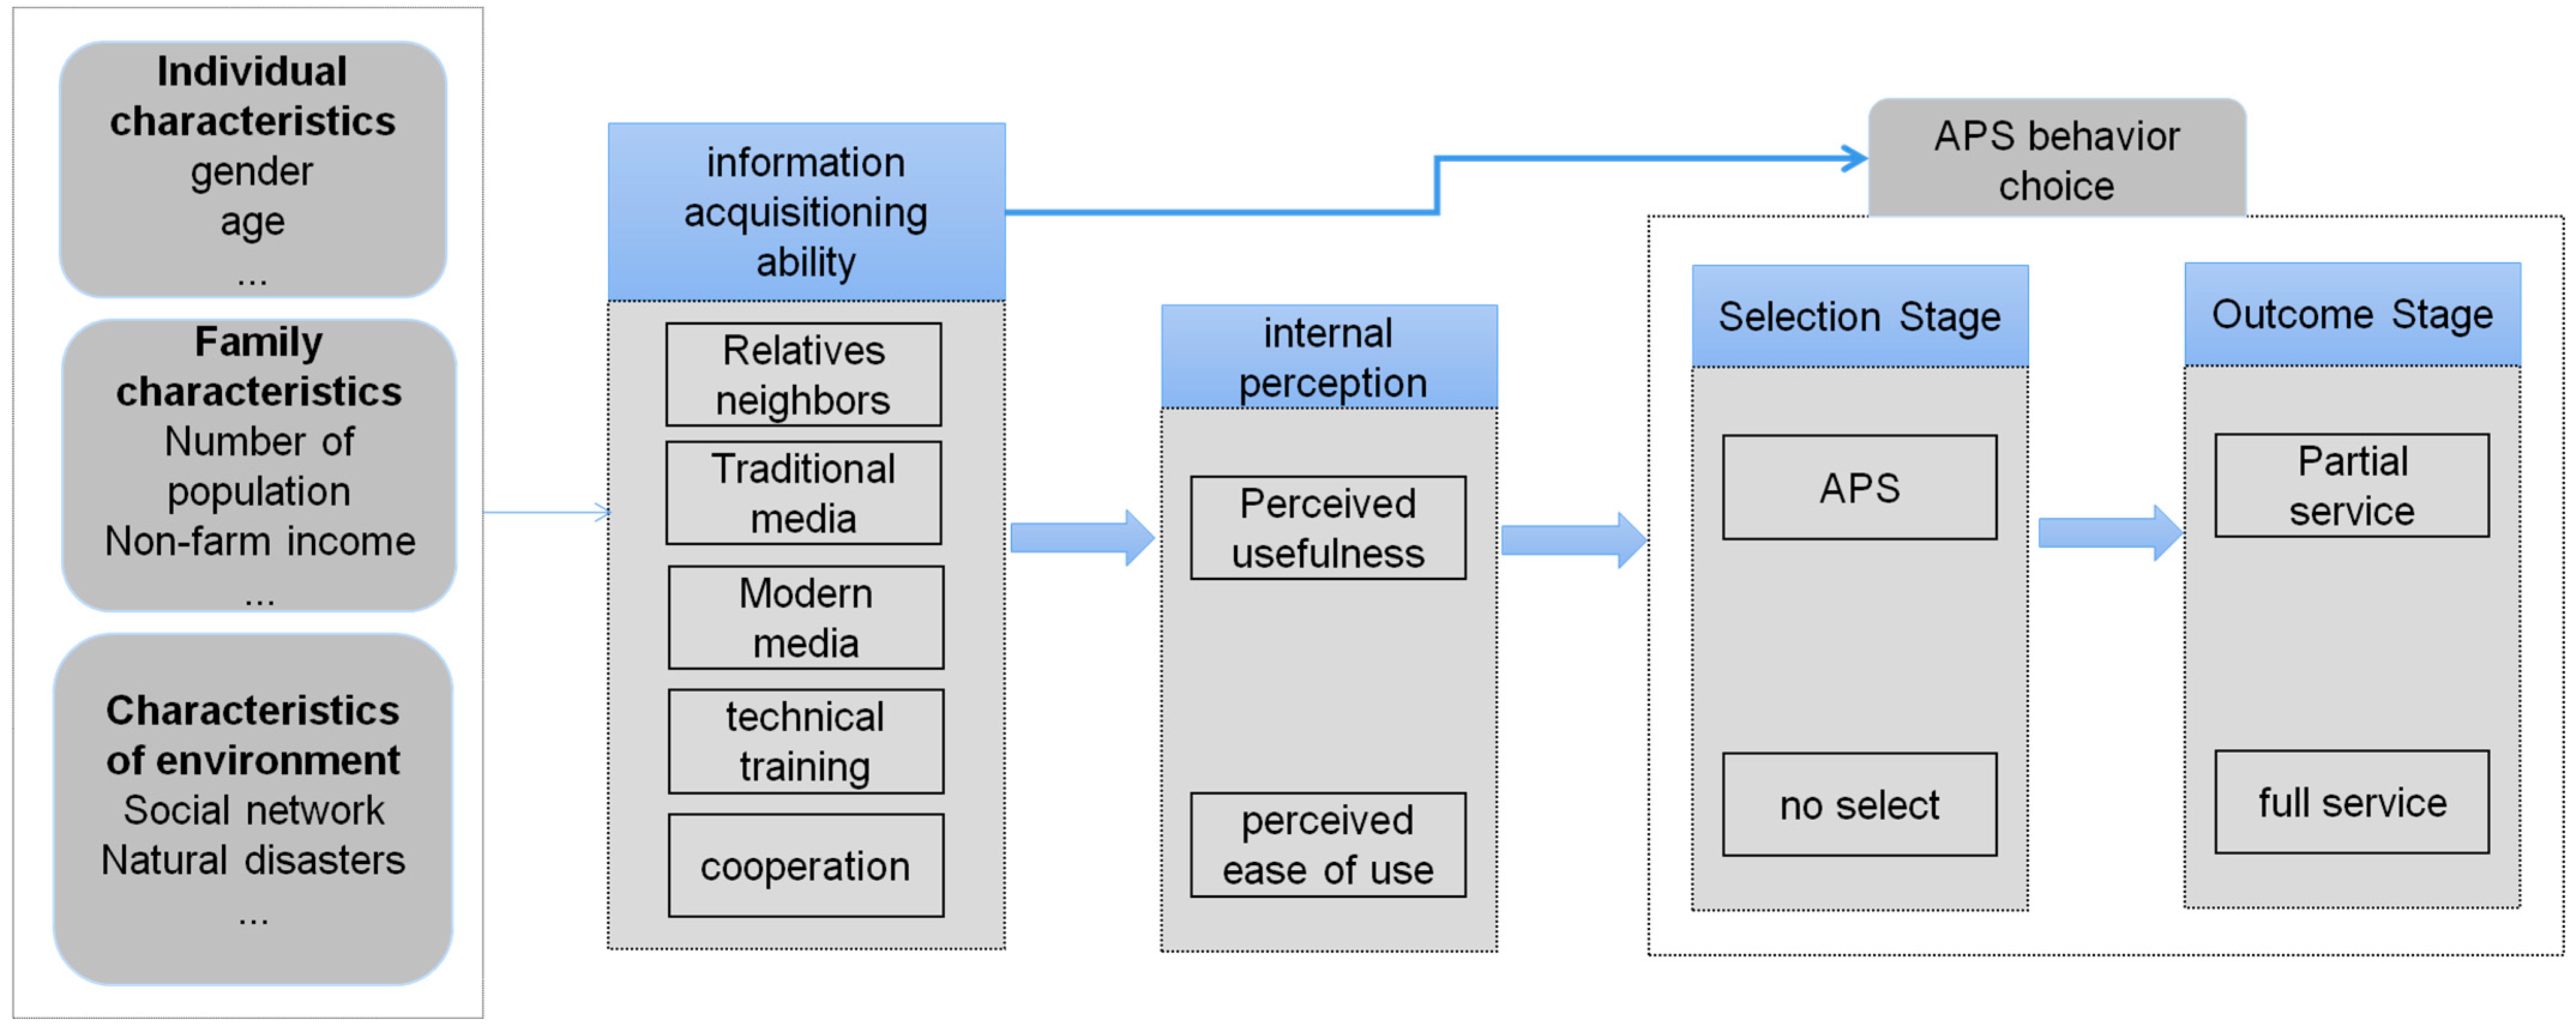
In the above studies, most of the academics analyze farmers’ single-link service, multi-link service, key link service behavior, and full service willingness, and there is a lack of empirical research on the influence of IAA on farmers’ full service behavior. Therefore, the main purpose of this study is to determine the influence of IAA on farmers’ APS behavior from the theoretical level and the empirical analysis level, in order to give full play to the role of IAA in farmers’ adoption of full service. First, the impact of IAA on farmers’ APS behavioral choices was analyzed empirically. Second, the IV-Heckman model based on the instrumental variables approach is used to overcome both the problem of sample selection bias and the problem of endogeneity of variables. Third, the mediating role of farmers’ intrinsic perceptions in this influence relationship is analyzed to reveal the intrinsic mechanism and feasible strategies to achieve full service improvement by enhancing farmers’ IAA, which has implications for the development of effective measures to promote the choice of APS.

2. Theoretical Analysis

Information asymmetry theory, based on the assumption of rational behavior, is an important economic theory and is one of the fundamental theories of information economics. It first originated from the information asymmetry theory proposed by Ackerloff in 1970s [35]. Information asymmetry theory believes that there is no complete information in actual economic life, and the information possessed by economic participants in reality is incomplete, and the distribution of information among different participants is also uneven, which is called information asymmetry [36]. The current research on the application of information asymmetry theory involves a wide range of interdisciplinary disciplines such as agricultural economics, corporate economics, and finance. Based on information asymmetry theory, Yuan, H. et al. measured the bargaining power of heterogeneous farmers and analyzed the influencing factors of farmers’ bargaining power [37]. Tian, L. studied the marketing of dried edible mushrooms and affirmed the important role of information asymmetry theory in it and proposed effective marketing strategies to help enterprises achieve their marketing goals [38]. The most important application area of information asymmetry theory is the theory of the firm; for example, Kim et al. analyzed that the main reason for the formation of stock price crash risk is that management chooses to conceal bad news from investors and the market in order to achieve their own interests under the information asymmetry theory [39]. Based on detailed position data of Chinese open-end active funds and data of listed companies, Zhang, Y.Y. confirmed that information trading under the perspective of information asymmetry theory would make prices reflect the potential returns of assets more effectively and thus improve market efficiency [40]. Existing research has achieved many valuable academic results in various disciplines using the information asymmetry theory framework, which has laid a solid foundation for this paper to study the mechanisms of farmers’ productive agricultural service behavior. On this basis, this study constructs a two-stage theoretical analysis framework of farmers’ choice behavior, as shown in Figure 1.

2.1. Theoretical Analysis of APS Selection Behavior

As decision-making subjects, farmers’ decisions are non-independent and are individual behavioral judgments based on available information [41]. It can be seen that the choice behavior of APS is also influenced to some extent by farmers’ access to information. APS is essentially a principal–agent relationship, and the problem of principal–agent naturally exists due to the unequal responsibilities and conflicting interest goals of both parties [42]. The service provider has a natural information advantage as an agent with the expertise. At the same time, the farmer, as a principal, is constrained by factors such as geography, income, and education level, which puts him at an information disadvantage [43]. This relationship also inevitably leads to information asymmetry in the transaction process. Information asymmetry theory suggests that there is information asymmetry between farmers and the APS subject, and farmers are at a complete information disadvantage. At this time, whether or not farmers choose APS or what kind of APS they choose will be indirectly affected by the quality of farmers’ own information [44], and for farmers with information advantages, transaction costs are lower and more information about service is available, while for farmers with information disadvantages, they may face “moral hazard” and “adverse selection” dilemma [45].
The mechanism of the farmer’s IAA influence on his APS selection phase and outcome phase is therefore manifested in two main ways. First, reducing the degree of information asymmetry. When farmers learn more information about APS through different information access channels, it reduces the degree of information asymmetry in the service system and reduces moral hazard, which in turn stimulates imitative behavior of farmers, i.e., farmers who are familiar with the farmers around them choose a certain APS to gain more benefits, and the farmers will also tend to choose which service [46]. Second, reducing transaction costs. The accumulation of farmers’ IAA can make the social interaction between neighborhood members more frequent and make it easier for them to produce information exchange and communication with each other, which reduces the difficulty and cost of acquiring information while effectively resolving risks, thus alleviating the information constraints faced by farmers. Only by establishing good information communication with the outside can farmers enhance their service market participation [47]. Farmers’ ability and level of information access directly affect their effective allocation and utilization of the resources they possess, ultimately their choice of production and management methods [48].
Second, at the micro level, three major components, including individual characteristics, household characteristics, and production environment characteristics of farmers’ IAA, are the key factors that influence their decisions and choices [23]. Individual characteristics such as gender, age, education level, and health status of farmers are most closely related to decision-making behavior, and farmers with different risk characteristics and ability levels make different decisions. Household characteristics are characterized by financial constraints and information constraints, which are the basis for decision makers to adopt specific behaviors. In rural China, “kinship networks” are common, with short distances between neighbors, high density of interactions, and close communication [49]. This interaction provides more information to farmers in the choice stage, which enhances their IAA and thus influences their final behavior. The quantity and quality of information acquisition are important factors in promoting farm film recycling behavior [50]. High IAA implies low information acquisition cost, which can alleviate the factor endowment constraint of new technology choice and has a positive influence on shaping farmers’ policy perceptions [51], facilitating their APS choices.

2.2. Analysis of the Mediating Effects of APS Selection Behavior

According to the knowledge–belief–behavior intervention model in behavior change theory, individual behavior formation and change need to go through the “knowledge–belief–behavior,” which is an interlinked and interactive system [52]. Among them, knowledge, as an outcome of cognition, is related to cognitive ability and the state of mind of cognition, which mainly comes from the awareness, need, acquisition, understanding, and processing of information; beliefs are formed by thinking about information, which is the knowledge internalized in the subject’s consciousness, and it is a particular subjective perception about objects or objects, which already contains the subject’s deep understanding, evaluation and emotional attitude towards such knowledge, and is a social-psychological state. Changes in human behavior may be influenced both by beliefs (perceptions) and directly by knowledge (information) [53], and the perceived usefulness and ease of use of behavior by an individual are significant explanatory variables that influence behavioral decisions [54]. In this paper, we measure the internal perception of maize growers on the APS in two dimensions: perceived usefulness and perceived ease of use. According to Zhu, Y.J. et al. [55], Li, Z.L. et al. [56], and Yan, B.B. et al. [57], perceived usefulness refers to farmers’ perceptions of the effectiveness and usefulness of adopting new technologies and services, implying that the more likely farmers believe that technology or service may bring them more output, the more likely they are to choose to adopt that technology. Perceived ease of use is how easy farmers perceive it is to implement a behavior. In this paper, perceived usefulness is defined as farmers’ perceived usefulness of participating in APS to improve output, which reflects farmers’ expected usefulness of participating in service, and perceived ease of use is defined as farmers’ perceived ease of access to APS, which reflects farmers’ perceived feasibility of participating in APS. According to the aforementioned theoretical analysis, farmers’ intrinsic perception of participation in full service is influenced by the information obtained; in other words, the more information farmers obtain, the more knowledge and experience they accumulate, and the higher the level of cognition of APS [58]. The stronger farmers’ ability to obtain information, the easier it is for them to learn information related to APS from various channels, which in turn help farmers break the original knowledge cognitive level and realize the improvement of cognitive level. When the farmers feel that the full service can free up labor time, bring more convenience, and generate more income, they are more willing to try the service. Therefore, IAA can facilitate farmers’ decision to participate in APS by improving their perceived usefulness and ease of use of APS.

3. Materials and Methods

3.1. Data Sources

In 2017, the General Office of the Ministry of Agriculture’s Guidance on Vigorously Developing Agricultural Productive Services continued to emphasize the need to take APS as a grip, focus on “helping farmers” rather than “replacing farmers”, and actively promote the development of APS. The development of APS has been able to meet the requirements of modern agricultural development by adhering to the red line of 1.8 billion mu of arable land in China. To verify the logical framework of “information accessibility-farmers’ choice of productive agricultural services”, the group conducted one-on-one field visits to maize farmers in Northeast China during the summer vacation in 2018. The reasons for choosing this region as the research object are: first, the Northeast is the main grain-producing region in China, located in the prime maize-planting belt, which is the “ballast stone” to ensure national food security. In terms of the scale of corn cultivation, the corn cultivation area in the Northeast reached 31.48% of the national cultivation area in 2018. In terms of corn production, the corn production in the Northeast accounted for 32.84% of the country in 2018. Second, in terms of APS activity, the total power of agricultural machinery in the three northeastern provinces reached 117,944,000 kW in 2018, accounting for 11.75% of the total power of agricultural machinery in the country, and coupled with the advantage of flat terrain, the development of the northeastern APS industry is rising rapidly. Using the three northeastern provinces as the study area to study the basic development of APS among Chinese corn growers is representative.
This study uses the household research form to obtain research data and designs the questionnaire structure according to the analytical framework, including four parts: individual farmers’ characteristics, household characteristics, agricultural production and operation characteristics, and farmers’ purchase of services. The survey team used a combination of typical sampling and random sampling, and the sampling realization steps were as follows: first, six cities in Harbin, Suihua, Qiqihar, Changchun, Siping, and Tieling in three northeastern provinces were selected from 34 provincial administrative regions across China; second, considering the different degrees of development of agricultural production services in each region, two to six representative townships were selected in each city, two to three villages were selected in each township, and each village was randomly selected. In each township, 2~3 villages were selected, and 15~20 farming households were randomly selected in each village to conduct one-on-one household interviews. The survey sample involved a total of 22 townships (towns) and 51 administrative villages. A total of 1198 questionnaires were distributed, and 937 valid questionnaires were collected (339 in Heilongjiang Province, 388 in Jilin Province, and 210 in Liaoning Province). The basic characteristics of the questionnaires are shown in Table 1.

3.2. Variable Selection

In this study, farmers’ APS behavior was used as the explained variable. APS is the type of outsourced services that provide operators with the various types of items needed in the agricultural production process, including outsourcing of services in product segments such as land preparation, seeding, irrigation, fertilization, pesticide application, and harvesting [59]. However, the measurement of APS in this paper is not limited to whether or not to participate, which does not reflect the actual outsourcing situation of farmers in the production segment, thus ignoring the influence of IAA on farmers’ behavioral choice of APS. Given this, this study divides farmers’ APS behavior into two steps: the first step requires observing whether farmers use APS, which is a binary dummy variable, i.e., using a value of 1, otherwise 0; the second step observes what type of services farmers who are assigned a value of 1 in the first step choose, and this paper divides APS into partial and full service, giving a value of 1 to farmers who choose partial services and a value of 1 to farmers who choose full service. In the second step, we observe what type of service is selected by the farmers who have been assigned 1 in the first step.
The core explanatory variable was IAA, and a two-parameter IRT model was constructed to estimate its parameters to more accurately assess the IAA of farmers. The specific measurement steps were as follows: first, item response matrices were constructed for five information channels, where the five channels were family and friends and neighbors, traditional media (books, newspapers, and TV), modern media (computers and cell phones), agricultural technology training, and cooperatives. Second, the IRT model was constructed to estimate the differentiation parameters and difficulty parameters. Finally, based on the estimated differentiation and difficulty parameters, the IAA parameters in the IRT model are estimated using Bayesian expectation posterior estimation method.
In this paper, the internal perception of farmers is selected as the intermediary variable, and the perceived usefulness and perceived ease of use are investigated. Farmers are more likely to accept APS when they have easier access to APS and believe that APS can save labor time, improve productivity, and increase income. The perceived usefulness of farmers is considered as “the grain yield of APS is higher than that of their own crops,” which is a five-point variable. The larger the value, the stronger the perceived usefulness. The perceived ease of use of the farmers was considered by “easy access to APS,” which is also a five-point variable, and the higher the value, the stronger the perceived ease of use.
To effectively identify the equation, it is essential to include a variable that affects only the service decision and not the service type among the factors X that influence the farmer’s APS decision. For this purpose, the number of household farm machinery is chosen as the identifying variable in this paper. To correct the sample selection problem due to service choice, it is also necessary to calculate the inverse mills ratio (IMR) of the farm household.
The APS behavior of farmers is influenced by a variety of factors. This paper draws on the studies of existing scholars [21,60] to introduce 16 control variables, such as the gender of the household head and the disaster situation, in terms of several aspects, including individual characteristics of farmers, characteristics of farmers’ household operations, and characteristics of the production environment. Specific variable definitions and descriptive statistics are shown in Table 2.

3.3. Research Methods

3.3.1. IRT Model

To more accurately assess the IAA of farmers, a two-parameter IRT model was constructed to estimate the parameters of farmers’ IAA and measure the indicators of farmers’ IAA. Combined with the actual survey, the IRT model was constructed based on the studies of Lei, M.Y. et al. [44] and Xiao, Y. et al. [61] to better assess the impact of IAA on farmers’ adoption of APS. This paper identifies the main types of information access channels of the sample farmers as friends and neighbors, traditional media (books, newspapers, TV), modern media (computers, cell phones), agricultural technology training, and cooperatives. The study by Yakubu, A.S. et al. [62] also concluded that the trait level of farmers could be determined by answering a series of (binary) questions that reflect their trait level. Therefore, constructing a two-parameter IRT model in the logistic form:
P ij = e a j ( I i b j ) 1 + e a j ( I i b j )      I i ~ N ( 0 , 1 )
In Equation (1), P i j is the probability that farmer i obtains information from the jth channel (family, friends, and neighbors, traditional media, modern media, agricultural technology training, and cooperatives); I i is the IAA parameter of the farmer, and the larger its value indicates that the farmer’s IAA is stronger; a j is the differentiation parameter of the j-th channel, and the larger its value indicates that the information obtained from the j-th channel is more valuable to the farmer; b j is the difficulty parameter of the j-th channel. In the first step, the item response matrices of the five information channels are constructed; in the second step, the marginal excellent likelihood estimation method is used to estimate the differentiation and difficulty parameters; in the third step, based on the estimated differentiation and difficulty parameters, the Bayesian expectation posterior estimation method is used to estimate the IAA parameters in the IRT model. Finally, the IAA parameters are normalized for extreme differences and transformed into a percentage scale. The conversion method is:
I i * = ( I i M i n ( I i ) ) ( M a x ( I i ) M i n ( I i ) ) × 100

3.3.2. Heckman Two-Stage Model

The explanatory variable is the adoption decision of APS by farmers, and the adoption type of farmers is further explored, which is a typical two-stage model. Therefore, the Heckman two-stage model is used for estimation. Specifically, in the first stage, a full-sample Probit model is constructed to examine the factors influencing farmers’ adoption decisions of APS; in the second stage, a modified model is used to further examine the factors influencing farmers’ service types. The model is as follows.
y 1 i = x 1 i α + μ 1 i y 1 i = { 1 y 1 i * > 0 0 y 1 i * 0
y 2 i = x 2 i β + μ 2 i y 2 i = { c y 1 i = 1 0 y 1 i = 0
Equation (3) represents the choice equation, and Equation (4) represents the result equation. y 1 i is the explanatory variable that represents whether farmers choose APS, and y 2 i is the explanatory variable that represents what kind of APS choose; the selection mechanism is that y 2 i is observed when and only when y 1 i * > 0 . In Equations (3) and (4), y 1 i * denotes the unobservable latent variable; c represents what type of APS the farmer chooses; x 1 i denotes the independent variable that influences whether the farmer chooses APS, and x 2 i denotes the independent variable that influences what type of service the farmer chooses; α and β denote the parameters to be estimated; μ 1 i and μ 2 i denote the residual terms that obey normal distribution, and i denotes the i-th sample farmer.
The expectation of the conditions for which type of APS the farmer chooses is.
E ( y 2 i | y 2 i = c ) = E ( y 2 i | y 1 i * > 0 ) = E ( x 2 i β + μ 2 i | x 1 i α + μ 1 i > 0 ) = E ( x 2 i β + μ 2 i | μ 1 i > x 1 i α ) = x 2 i β + E ( μ 2 i | μ 1 i > x 1 i α ) = x 2 i β + ρ σ μ 2 λ ( x 1 i α )
Equation (5), λ ( . ) denotes the inverse Mills ratio function. ρ represents the standard deviation, reflecting the correlation coefficient between y 1 and y 2 : ρ 0 , indicating that y 2 is affected by the selection process of y 1 , indicating the existence of sample selection bias; ρ = 0 , indicating that y 2 will not be affected by the selection process of y 1 , and this model will be estimated using the maximum likelihood estimation method (MLE) in this study.

3.3.3. IV-Heckman Model

In analyzing the effect of IAA on farmers’ APS behavior, the sample selection problem due to service selection and the endogeneity problem due to the two-way causality between IAA and full-service behavior should be dealt with. First, the sample selection problem. Farmers who did not choose APS did not choose to purchase the service due to some factors of their own (education level, health status, and income status, etc.), which means the information on farmers’ full-service behavior that this paper focuses on will be missing; that is, farmers with full-service information are the sample after sample selection. Secondly, the two-way causality; IAA affects farmers’ full service adoption behavior. In turn, farmers who originally decided to purchase full service may be more sensitive to the acquisition of full-service information. In this regard, drawing on Sun, G.L. et al. [63], Tonch, H.A. [64], and others, this paper proposes to use an instrumental variable-based Heckman two-stage model (IV-Heckman) to overcome both the endogeneity problem of IAA and the sample selection problem due to service choice. Drawing on Yang, C.F. et al. [65], the average level of IAA of farmers in the same village other than oneself is selected as an instrumental variable for IAA in this paper.
The IV-Heckman model does an OLS regression of the endogenous explanatory variable IAA on the instrumental variables and all exogenous explanatory variables before performing a Heckman two-stage regression to obtain the fitted values of IAA (see Lian, Y.J. et al., [66]) with the following equation.
I n f o r m a t i o n i = α 1 + β 1 I n s t r u m e n t i + γ X + ε i
I n f o r m a t i o n ^ i * = α 1 ^ + β ^ 1 I n s t r u m e n t i + γ ^ X
In Equation (6) and Equation (7), i represents the i-th maize grower, I n f o r m a t i o n i represents IAA, I n f o r m a t i o n i * ^ represents the fitted value of the IAA latent variable, I n f o r m a t i o n i , I n s t r u m e n t i represents the instrumental variable, X represents the control variable, ε i represents the random error term, and α 1 ^ , β 1 ^ , and γ ^ represent the estimated values of the parameters.
The second step is to bring the calculated fitted values into the Heckman two-stage model.

3.3.4. Construction of the Intermediary Effect Model

To test hypotheses H2 and H3, this paper draws on Chen, H. et al. [67] and Sun, G.L. et al. [64] to test the transmission mechanism of IAA affecting farmers’ APS behavior through perceived usefulness and perceived ease of use based on considering the endogeneity of IAA and sample selection problems. The specific testing process includes two stages.
In the first stage, testing the influence of IAA on mediating variables requires overcoming the problem of endogeneity of IAA, for which an OLS model based on instrumental variables is constructed in this paper, and the expressions of the model are as follows.
S e n s a t i o n i = α 2 + β 2 I n f o r m a t i o n ^ i * + γ X + ε i
In Equation (8), S e n s a t i o n i denotes the mediating variable (perceived usefulness or ease of use).
In the second stage, there is a need to overcome the endogeneity problem due to the two-way causality of IAA and the sample selection problem due to hosting selection, for which the paper is based on the IV-Heckman model estimated with the following expressions:
y 1 i = α 3 + β 3 I n f o r m a t i o n ^ i * + β 4 S e n s a t i o n i + γ X + ε i
y 2 i = α 4 + β 5 I n f o r m a t i o n ^ i * + β 6 S e n s a t i o n i + γ Z + ε i

4. Results

4.1. The IRT Model Was Used to Estimate IAA

4.1.1. Estimation Results of Differentiation and Difficulty Parameters

As shown in Table 3, the discrimination and difficulty parameters of the five information access channels all passed the significance test, indicating that these five channels are closely related to farmers’ IAA. The difficulty parameter of friends and family neighbors was −5.452, and the differentiation parameter was 0.343, which had the slightest differentiation, indicating that friends and family neighbors did not play a significant role in the information acquisition of farmers. The possible reason is that the price of full service is higher than partial services, making it difficult for farmers to obtain information related to full service through homogeneous friends and family neighbors. The difficulty parameter of traditional media is −0.205, and the differentiation parameter is 1.357 with a negative difficulty parameter, which indicates that farmers mostly obtain information from conventional media. The difficulty parameter of the cooperative channel is the largest. Still, the differentiation parameter is small, which suggests that it is more difficult for farmers to obtain information through cooperatives and has a more negligible effect on farmers’ IAA.

4.1.2. The Results of Estimation of IAA Parameters

The corresponding IAA parameters were obtained according to the amount of information farmers obtained from different sources. As can be seen from Table 4, the IAA parameters of farmers are all within the range of [−3, 3]. According to Robins et al. [68], if the values are between [−3, 3], then the deviation of the distribution setting is negligible, indicating that the model distribution conforms to the normal distribution.
Table 4 shows that 5.73% of the farmers did not obtain information; most of the farmers mainly received information from one or two channels, accounting for 35.63% and 32.81% of the total sample, respectively; only 25.84% of the farmers received information from three or more channels. At the same time, the parameters of IAA for different channel combinations were estimated, from which it can be seen that the more channels farmers have, the higher the corresponding IAA. In addition, among the same number of channel combinations, the channels with higher differentiation can bring higher IAA.

4.2. The Effect of IAA on Farmers’ Adoption Behavior of APS

Due to the problems of model setup and data, there may be some linear relationship between explanatory variables of the model, and the multicollinearity problems of related variables (explained variables, control variables, etc.) are highly likely to lead to the estimation distortion of the empirical analysis model. Therefore, this paper uses variance inflation factor (VIF) and Pearson correlation coefficient to test whether there is multicollinearity among independent variables. The results show that (see Table A1 and Table A2) the maximum value of VIF is 2.01, less than the critical value 10, and the absolute value of correlation coefficient between variables is 0.685 (risk characteristics and focus on long-term benefits), less than 0.8. This indicates that there is no serious multicollinearity problem between independent variables, and a regression model can be constructed [69]. In order to clarify, obtain more robust estimation results, and systematically evaluate the micro-policy effect of APS adopted by IAA on farmers, a heteroscedasticity test and autocorrelation test were also conducted in this paper. White test was used to determine whether heteroscedasticity existed in the model, and the test result showed that chi2(166) = 268.64, Prob > chi2 = 0.0000, indicating that the null hypothesis is rejected and heteroscedasticity exists. Therefore, we performed robust regression in the method of Heckman’s second stage, and the standard errors in subsequent models were adjusted by heteroscedasticity to solve this problem. As for the test of autocorrelation, BG test was selected in this study, and the results showed that Prob > chi2 = 0.2992 does not reject the null hypothesis, i.e., there is no autocorrelation (see Table A3 for test results).
Heckman two-stage estimation and Heckman estimation based on the instrumental variables method were performed in this paper, and the estimated results were compared and analyzed.

4.2.1. Baseline Regression

Table 5 shows the estimated results of the effect of IAA on farmers’ APS behavior based on the Heckman two-stage model. Table 4 shows that the Wald test of goodness of fit is significant at the 1% level. This indicates that the model fits well overall; the inverse Mills ratio is significant at the 1% level, which indicates that the problem of sample selection bias does exist and also shows that the Heckman two-stage model is applicable to the empirical analysis of this paper. The results of the selection equation of regression 1 showed that the number of farm machinery passed the significance test on farmers’ APS adoption decision; the results of regressing the identification and control variables on the outcome equation showed that the effect of the number of farm machinery on the outcome equation was not significant, thus verifying the validity of the identification variable.
The estimation results of regression 1 and regression 2 show that the coefficients of IAA are both positive and significant at the 5% and 1% statistical levels, respectively. The stronger the farmer’s IAA in regression 1, the more likely they are to choose APS; and the stronger the farmer’s IAA in regression 2, the more likely they are to choose full service.
The control variables also affected the service decision and service type of farm households. In terms of service decisions, the age, political status, and social network of the household head have a significant positive effect, which means that the older the household head is, the more they are a party member or village cadre. The broader the social network, the more they tend to choose APS, which is consistent with the studies of Lv, J. et al. [22] and Xu, H. et al. [70]. Possible reasons for this are, firstly, older age means that their agricultural production is less capable. For example, sowing and harvesting require a lot of physical work, which is difficult to support, and the older farmers tend to choose APS; secondly, more farmers who are party members or village cadres are engaged in other industries, and as party members or village cadres have a more profound knowledge and better understanding of APS organizations that have the role of promoting modern agricultural development, so their willingness to participate in production services is also stronger; third, it may be because, in rural areas, households with rich social networks not only have access to more market information but also have easy access to capital support, which is conducive to better service conditions for planting farmers. Additionally, the household head’s willingness to farm, land size, and the number of farm machinery owned by the household have a significant negative effect, which may be because the stronger the household head’s willingness to farm, the more inclined they are to buy farm machinery, have a strong affection for the land, and be more willing to plant by themselves; land size has an inverted U-shaped relationship on farmers’ choice of APS, and farmers’ choice of APS tends to rise and then fall with the growth of the land area, which is consistent with Hu, W. et al. [25] and Lv, J. et al. [22]; farmers who own farm machinery alleviate the pressure of manual labor in agricultural production, and the more farm machinery a household owns, the more it tends to plant itself or tends to provide machinery services to neighboring farmers, which is consistent with the findings of Peng, Y.H. et al. [60] and Yang, Y.C. [71]. In terms of service type, farmers’ risk characteristics have a significant positive effect, which is consistent with the findings of Xue, Y. et al. [72], probably because compared with partial services, farmers face higher service costs and the promise of being able to improve yields during the full service, and conservative farmers have a wait-and-see state, and farmers’ risk preference characteristics are an essential constraint affecting farmers’ choice of full service. In contrast, the number of family members and plot type has a significant negative effect, which is consistent with the reality that the larger the family members are, the more they tend to plant themselves and do not choose to give up cultivating the land thoroughly; the flatter the plot is, the more farmers choose partial services, and most of them have farm machinery, which inhibits their choice of full service.

4.2.2. Re-Estimation Based on the IV-Heckman Model

While IAA has a direct effect on the state of the actor, this state may, in turn, affect IAA. Therefore, only by overcoming the possible bidirectional causal relationship between IAA and farmers’ APS behavior can the effect of IAA on the adoption of farmers’ APS behavior be measured more precisely in the empirical analysis. This paper uses an instrumental variable approach to re-estimate the effect of IAA on the adoption of APS by farmers. Referring to the study of Yang, C.F. et al. [65], “the average level of IAA of farmers in the same village other than oneself” is selected as the instrumental variable in this paper.
Before the empirical analysis, the endogeneity test of IAA was conducted, as shown in Table 6. The DWH test value was 87.485, which was significant at the 1% statistical level, indicating that IAA was an endogenous explanatory variable. Secondly, the test of instrumental variables is carried out, as shown in Table 6. The F statistic of the first stage regression is 11.780, larger than the critical value 10, which negates the original hypothesis that there are weak instrumental variables. The t value of the instrumental variable is 5.770, which is significant at the 1% statistical level, indicating that the regression estimation results are effective.
The results of regression 1 and regression 3 show that the coefficients of IAA are both positive and significant at the 5% statistical level. The comparison reveals that in regression 3, i.e., after controlling for both the endogeneity of IAA and the sample selection problem, the coefficient value of IAA is larger than the estimated result of regression 1. This indicates that omitted or unobservable factors can influence farmers’ APS decisions; in other words, there are indeed endogeneity and sample selection problems of IAA, and the Heckman model estimation may underestimate the effect of IAA on farmers’ service behavior decisions. According to the regression results, IAA has a positive impact on farmers’ service decisions, indicating that the higher the level of IAA of farmers, the more likely they are to engage in service.
The results of regression 2 and 4 show that the coefficients of IAA are also both positive and significant at the 1% statistical level. The comparison reveals that in regression 4, i.e., after controlling for both the endogeneity of IAA and the sample selection problem, the coefficient value of IAA is larger than that estimated in regression 2, indicating that the estimation using the Heckman model does underestimate the effect of IAA on farmers’ full-service behavior. According to the regression results, increasing the level of IAA of farmers helps to promote the full-service behavior of farmers.
It can be found that the estimation results after using the instrumental variables method all have a slight increase, indicating that the two-way causality between IAA and farmers’ service adoption leads to an underestimation of the effect of IAA on farmers’ service adoption decisions and adoption effects, but does not affect the findings of the baseline regression, indicating that the estimation results are more robust.

4.3. Analysis of the Results of the Mediating Effect Test

4.3.1. Analysis of Mediating Effects of Perceived Usefulness

The results of the regression of the mediating effect of perceived usefulness are shown in Table 7. From the results of regression 5, it can be seen that IAA is statistically significant at the 1% level. The sign of the coefficient is positive, indicating that increasing the level of IAA of planting farmers will enhance their perceived usefulness of APS. The results of regression 6 show that both IAA and perceived usefulness have significant positive effects on farmers’ APS decisions, indicating that increasing the IAA and perceived usefulness of maize farmers can promote their participation in APS, and the mediating effect of perceived usefulness is significant, i.e., there is an “IAA → perceived usefulness → service decision” influence path.
The results of regression 7 show that both IAA and perceived usefulness are statistically significant at the 1% level with positive coefficient signs, indicating that maize farmers with higher levels of IAA and perceived usefulness promote their adoption of the full service, i.e., there is an influence path of “IAA → perceived usefulness → full service”.

4.3.2. Analysis of the Mediating Effect of Perceived Ease of Use

The results of the regression of mediating effects of perceived ease of use are shown in Table 8. From regression 8, regression 9, and regression 10, the mediating effect of farmers’ perceived ease of use of APS in the relationship between IAA affecting farmers’ participation in services was not significant. The reason may be that 82.07% of the farmers in this study had already chosen APS and the effect of perceived ease of use was not as sensitive.

4.4. Robustness Test

4.4.1. Replacement of Empirical Model

Since farmers may have autonomous selection bias and the results are not robust, this paper uses the propensity score matching method (PSM) for matching estimation. Farmers with IAA higher than the mean are defined as “strong information access” farmers. Those with IAA lower than the mean are defined as “weak information access” farmers, and corresponding treatment and control groups are set. Next, five matching methods, namely nearest neighbor matching, near neighbor matching (K = 4), radius matching (0.01), kernel matching (0.06), and local linear matching, were selected for matching tests.
When using the counterfactual estimation of PSM, a balance test is required to ensure the matching quality, which requires no significant systematic difference between the matched strong IAA group and weak information ability group. As can be seen from Table 9, the Pseudo R2 decreased significantly from 0.079 to 0.002–0.007 before matching; the LR statistic decreased significantly from 82.08 to 2.96–9.03; the significance test for probability values changed from highly significant to insignificant; the mean deviation decreased from 16.1% to 2.2–4.0%, and the median deviation decreased from 9.6% to 1.2–3.4%. The test results indicated that the total sample bias was significantly reduced after matching, the sample characteristics were similar between groups, and the balance test results were more satisfactory.
From Table 10, it can be seen that IAA has a significant effect on the adoption of full service by farmers under all four matching methods, which is consistent with the results of regression 2 in Table 5. Combining the above results, it can be concluded that the results of this paper are robust.

4.4.2. Replacement of Measurement Methods

To explore the sensitivity of the regression results to different measures of IAA, drawing on Yuan, X.H. et al. [73], the key explanatory variable of IAA was additionally replaced by the number of information access channels for farmers’ IAA, and the regression results are presented in Table 11. The results of Test I and Test II in Table 10 show no significant difference in the direction and significance of the IAA variable compared to the results in Table 4 and Table 5, indicating that the results of the effect of IAA on the APS behavior of farmers are robust.

4.4.3. Substitution Mediating Effect Test Method

In this paper, the robustness of the mediation effect was tested using the self-sampling test (Bootstrap). As can be seen from Table 12, the confidence interval of perceived usefulness does not include 0. Its mediating effect in IAA affecting farmers’ APS service decision and service type is significant, with mediating effect sizes of 0.109 and 0.128, accounting for 53.69% and 9.6% of the total effect, respectively. Perceived ease of use in the confidence interval of IAA on farmers’ APS service decision and service type contained 0, and the mediating effect was insignificant.

5. Discussion

5.1. Integration with Previous Studies

The current research on the issue of APS selection stage mainly focuses on the study of farmers’ willingness to purchase APS and farmers’ adoption behavior of APS. For example, Xiao, J.Y. et al. used fixed-order logistic regression analysis to study farmers’ willingness to participate in APS and its influencing factors and found that farmers were not highly motivated to participate in APS, and most believed that there were risks of participating in APS such as information asymmetry, immature service technology, and imperfect service system [26]. By constructing a binary Logit model, Hu, Y.T. et al. (2014) concluded that farmers’ own characteristics, family, and production operation characteristics and agricultural production environment characteristics significantly affect farmers’ APS behavior [24]. Lu, Q.N. introduced the important variable of whether non-farm laborers live at home or not, stripped out the role of non-farm laborers assisting in agricultural production, corrected the problem of biased estimation results of the impact of aging on APS in existing studies, and assessed only the marginal impact of aging on APS [27]. Using the ISM model, Li, Y.J. et al. explored the factors influencing farmers’ choice of APS and the association between different factors and the hierarchical structure [74]. Using structural equation modeling, Chen Yuxiang et al. explored the influence and mode of action of farmers’ APS risk perceptions on their behavioral decisions to provide reference for the government to develop policies to promote farmers’ participation in APS [75]. Fewer studies have been conducted on the issue of APS outcome stage, mainly focusing on the number of sessions of APS purchase by farmers and the type of APS choice studies. For example, Hu, W. et al. used a logistic model to analyze the influencing factors of farmers’ APS behavior and found that about 30% of farmers chose APS, and the number of service links was less chosen [25]. Lv, J. et al. construct a theoretical framework of risk aversion, relationship network on APS type selection bias behavior in the context of limited rationality assumption, revealing the intrinsic decision-making mechanism and institutional choice barriers of farmers’ APS selection bias [22].
From the current research results on farmers’ productive agricultural service behavior, most of the current studies on how to improve farmers’ service level focus on the scale of land operation [76], influencing factors [77], farmland titling [78], purchase subsidies [79], and household labor migration [80]. Regarding the form of IAA embedded in the modern agricultural sector, existing studies lack a better description of the logic between it and the APS of farm households. Our results are consistent with the studies of Lv, J. et al. [22], Xu, H. et al. [70], and Cai, L.M. et al. [77], in which the age of the household head, political identity, social network, willingness of the household head to work in agriculture, land size, and the number of farm machinery owned by the household are the main factors influencing farm households’ decision to participate in APS. Regarding the type of service, the risk characteristics of farm households, the number of household members, and the type of land plot are the main factors influencing the type of farm households’ participation in APS, which is consistent with the study of Xue, Y. et al. [72]. In the citation and validation of information asymmetry theory and behavior change theory, our findings, like those of Yakubu, A.S. et al. [62] and Wang, H. et al. [81], confirm that IAA can significantly increase farmers’ propensity to adopt productive agricultural services, and it can increase farmers’ intrinsic perceptions and subsequently promote their service decisions and degree of adoption. However, compared with the results of Yan, B.B. et al. [57], this paper reached a different conclusion that the mediating effect of farmers’ perceived ease of use of APS was insignificant in the relationship between IAA affecting farmers’ participation in services. The reason for this may be that 82.07% of the farmers in this study had already chosen the APS and the effect of perceived ease of use was not so sensitive.
Compared with the existing literature, this study may have the following marginal contributions. First, the APS behavior of farmers is examined from an IAA perspective. Most of the current literature has studied IAA and APS separately, while fewer studies have explored the relationship between the two. This study focuses on maize farmers in northeast China, which is the main audience group of APS, and the region is known as the “northern warehouse” in China, so it has certain representativeness. Second, in terms of variable measurement, this study does not simply use the number of information access channels of farmers to measure their IAA but uses the IRT model. Based on the information asymmetry theory and behavior change theory, this study constructs a theoretical framework of “IAA-internal perception-farmers’ APS behavior” from two levels of IAA and internal perception and draws a research framework diagram. Then, the IV-Heckman method, which combines the Heckman two-stage model and instrumental variables, is used to estimate the model and overcome the sample selection bias and endogeneity problems of the study. This study can provide new research ideas and references for APS adoption studies.

5.2. Theoretical and Practical Implications

Based on the above theoretical analysis and empirical estimation, two insights are obtained from this study. In terms of theoretical implications, first, the research results further validate and affirm the information asymmetry theory, pointing out that IAA can indeed facilitate farmers’ information accumulation in APS and promote farmers’ adoption of new technologies. Second, the research results further enrich the application of behavior change theory in APS by incorporating farmers’ inherent perceptions into the analytical framework for theoretical exploration, indicating that IAA can indeed promote farmers’ inherent perceptions in APS and thus promote farmers’ adoption of the services.
The perspective chosen for this study is the selection behavior of farmers for partial and full services in APS, and the reason for choosing this direction is that due to the rapid development of secondary and tertiary industries, the one-way outflow of high-quality rural labor has intensified the trend of “weakening” of agricultural labor [82], and “who should farm the land” and “how to farm the land” have become prominent problems plaguing farmers’ production and agricultural development. The problems of “who should farm” and “how to farm” have become prominent problems that plague farmers’ production and agricultural development. The development of APS can bridge the gap between small farmers and agricultural modernization by narrowing the gap between agricultural equipment, production technology, and management tools, which is undoubtedly an important contribution to promote agricultural development and increase farmers’ income. However, there is currently an information asymmetry between farmers and market service providers, and the choice of APS faces many risks such as natural risks, market risks, and transaction risks. Farmers in developing countries have typical risk-averse psychology, large risk perception bias, and weak IAA of farmers, which seriously hinder the development of the APS market. This study examines farmers’ APS behavior from the perspective of farmers’ IAA and provides specific countermeasure suggestions for the promotion and development of APS, so as to promote the transformation of agricultural production methods and provide reference values and practical significance for promoting the organic linkage between smallholder farmers and agricultural modernization.

6. Conclusions

This study constructs a two-stage (APS choice stage—APS outcome stage) analytical framework based on information asymmetry theory. Using microdata from 937 farmers in the northeastern corn-growing region, the Heckman two-stage model and the IV-Heckman model were used to empirically test the effect of IAA on farmers’ APS choice behavior and to examine the transmission paths of perceived usefulness and perceived ease of use.
The main findings of this study are as follows. First, the more channels farmers have to access information, the stronger their IAA. Under the same number of channel combinations, the higher the degree of differentiation of access to information channels, the stronger the IAA of farmers. Second, in the APS selection stage, IAA has a direct influence on the influence of farmers’ APS selection behavior. when farmers’ technical knowledge and experience accumulate to a certain degree, the higher their understanding of APS, the more they recognize that APS has significant effects on improving agricultural production efficiency and reducing costs, the more they are willing to select APS. In terms of individual characteristics, family characteristics, and production environment characteristics, the political identity of the household head has the greatest direct influence on the choice of APS by farmers, followed by the number of household farm machinery, operation scale, social network, willingness to farm, and age. Third, in the APS outcome stage, IAA, as the farmer’s own resource endowment, can quickly meet their own demand for production information. Farmers’ IAA has a positive influence on the choice of full service, i.e., the stronger the information access ability of farmers, the greater the possibility of choosing full service. In terms of individual characteristics, family characteristics and production environment characteristics, plot type has the greatest direct influence on farmers’ full-service behavior, followed by risk characteristics, family size, and operation scale. Fourth, the effect of IAA on farmers’ APS selection behavior was greater than the effect of perceived usefulness on farmers’ behavior, and the mediating effect of perceived usefulness existed, indicating that increasing maize farmers’ IAA and perceived usefulness could promote their participation in APS; i.e., there was an influence path of “IAA → perceived usefulness → APS selection”. Maize farmers with higher levels of IAA and perceived usefulness can promote their adoption of APS; i.e., there is an influence path of “IAA → perceived usefulness → APS”. Driven by the “IAA-farmers’ intrinsic perception-APS selection behavior” mechanism, farmers’ awareness of APS is increasing. However, at present, there are many APS providers in the market, and the development is chaotic, which hinders farmers’ APS selection behavior.
Based on the above findings, this study may generate the following policy recommendations. First, with China’s transition from a planned economy to a market economy, many of the urban–rural gap problems caused by the urban–rural division system have been broken down, and urban–rural relations have been moving toward integration. However, some studies have shown that rural residents have been at a disadvantage compared to urban residents in terms of information access and ability. How to improve the IAA of rural households and enhance their APS cognitive ability is an urgent problem to be solved. The government and localities should strengthen the construction of information infrastructure such as internet broadcasting in rural areas, cultivate farmers’ awareness of information acquisition, focus on improving farmers’ IAA, and give full play to the positive effect of IAA on farmers’ APS adoption behavior. Secondly, unlike the partial service, the full service gives the whole agricultural production process from the purchase of production materials in the early stage to the harvesting process in the later stage to the service provider, and the farmers do not need to do anything. For Chinese small farmers, most of them are risk-averse, and they often have a wait-and-see attitude when they first come into contact with new things. Therefore, for farmers who have already adopted the full service and achieved actual economic benefits, we should set up a typical example in the local area and increase publicity by organizing activities such as experience exchange and sharing between technical demonstration households and other farmers, so that more farmers can realize the benefits of the full service and speed up the cognitive process of the full service. Third, the full service often has a substitution effect on labor, which can help farmers’ families reduce the use of labor. According to the classification of farmers’ labor force characteristics and family characteristics, the publicity of the full service should be tilted toward farmers’ families with insufficient family labor force, low education level, and low socio-economic level, focusing on improving the IAA of this group, paying more attention to disadvantaged farmers’ families, improving the targeting of the service, enhancing the poverty reduction effect of APS, and paying more attention to equity while ensuring efficiency.
The following areas of urgent improvement exist in this study. First, when we use the Knowing, Believing, Acting intervention model of behavior change theory for our analysis, it is difficult to directly observe farmers’ IAA and internal perceptions because it involves quantifying their mental cognitive processes. Although this study constructs a two-stage theoretical analysis framework of “APS choice stage—APS outcome stage”, further study is needed to more appropriately express farmers’ behavioral choice mechanisms. Second, our analysis is based on a cross-sectional data set, which makes us focus only on the current status of farmers’ APS adoption behavior, but ignore farmers’ continuous adoption behavior; that is, if conditions allow, it may be more interesting to conduct a follow-up study on farmers and build a multi-period evaluation model to monitor farmers’ long-term IAA and their behavior. Third, this study only considers the mid-production aspects of APS, and in subsequent studies, attempts can be made to include the pre-production and post-production aspects of APS into the analytical framework for a more in-depth study. Fourth, as a service functional industry, APS has a comprehensive type of subjects and a wide range of service contents, including subjects formed before the rural reform such as supply and marketing cooperatives, as well as service subjects emerging after the reform such as family farms, professional households, and agricultural service enterprises, and the service contents cover almost all production links, from agricultural supply to agricultural product sales. This study only analyzes the service decisions and types of services from the perspective of farmers’ IAA, and in further research, it is necessary to conduct studies on various service subjects and investigate the influence of their different service subjects on farmers’ service behavior choices.
In the coming period, in-depth research can be conducted in the following aspects. First, the quantification of farmers’ IAA should be further optimized by using a more standard form of Likert scale for question optimization and factor analysis for measuring the variables. Second, the existing sample of farmers should be tracked and surveyed. Farmers’ IAA and choice behavior are not static, and the data of this research direction should be systematically grasped through tracking surveys in consecutive time periods to form panel data, so as to lay the foundation for subsequent research on topics such as dynamic changes of IAA and changes of choice behavior. Third, most of the existing studies have studied the mid-production link of APS, while ignoring the research on pre-production agricultural supply services such as good seeds, fertilizers and pesticides, and post-production value-added services such as storage and transportation, packaging, and marketing. In the next study, we consider including pre-production and post-production services together in the analysis framework, so as to conduct a deeper study of APS. Fourth, we found in the course of our study that different service providers also influence farmers’ behavioral choices, which will be a new research perspective for studying farmers’ behavior.

Author Contributions

Conceptualization, J.L., S.Y. and Y.X.; methodology, S.Y.; software, S.Y. and K.W.; validation, Y.X. and K.W.; formal analysis, S.Y.; investigation, Y.X.; resources, J.L. and Y.X.; data curation, S.Y.; writing—original draft preparation, S.Y.; writing—review and editing, Y.X. and K.W.; supervision, Y.X. and K.W.; project administration, J.L.; funding acquisition, J.L. All authors have read and agreed to the published version of the manuscript.

Funding

This research was funded by the National Natural Science Foundation of China (72103143 and 71873090), the Liaoning Province Philosophy and Social Science Young Talents Training Subject commissioned (2022lslqnrcwtkt-51), the Liaoning Province Scientific Research Funding Program (LJKR0239), the Liaoning Provincial Social Science Planning Fund Project (L22AGL017), the National Key R&D Program Project (2016YFD0300210).

Institutional Review Board Statement

Not applicable.

Data Availability Statement

The data that are presented in this study are available on request from the corresponding author. The data are not publicly available due to privacy restrictions.

Acknowledgments

Thanks to the editors, reviewers, and our data researchers.

Conflicts of Interest

The authors declare no conflict of interest.

Appendix A

Due to space limitation, we put the data test results of this study in Appendix A.
Table A1. Variance inflation factor of each variable.
VariableVIF1/VIF
RC2.010.498
PC31.960.510
FC11.360.734
FC21.360.738
Regional Variables1.340.747
Age1.270.789
Land size square1.250.803
IAA1.190.842
PE31.170.857
PE21.140.880
Education1.130.885
LC21.120.890
Health status1.110.898
PC11.080.923
PC21.080.924
PE11.070.932
Gender1.040.963
Mean VIF1.28
Table A2. Pearson correlation coefficient of each variable.
VarIAAGenderAgeEducHealthPC1PC2PC3RCFC1FC2ScaleLC2PE1PE2PE3Region
IAA1.00
Gender0.031.00
Age−0.04−0.011.00
Educ0.18−0.01−0.211.00
Health0.03−0.09−0.250.141.00
PC10.18−0.030.100.120.011.00
PC20.05−0.050.10−0.07−0.010.071.00
PC30.220.04−0.120.120.060.060.041.00
RC0.260.05−0.140.120.050.070.010.691.00
FC10.020.03−0.140.030.050.04−0.010.010.031.00
FC20.04−0.01−0.120.080.080.05−0.020.000.040.421.00
Scale0.090.08−0.310.060.10−0.08−0.040.100.090.14−0.151.00
LC20.05−0.080.040.040.050.090.020.070.040.080.11−0.131.00
PE10.040.000.040.000.060.05−0.010.06−0.020.050.040.050.181.00
PE20.110.06−0.170.150.100.04−0.040.110.130.190.130.170.020.031.00
PE30.00−0.03−0.090.02−0.03−0.06−0.100.030.02−0.01−0.070.23−0.17−0.080.031.00
Region0.17−0.100.080.080.060.170.210.040.020.040.10−0.260.270.050.01−0.351.00
Table A3. Autocorrelation test results.
Breusch-Godfrey LM Test for Autocorrelation
lags (p)chi2dfProb > chi2
11.07810.2992
H 0 : no serial correlation

References

  1. Yang, X.R.; Tang, J.T.; Yang, Y.J.; Dai, H.Y. Research on the Promotion Path of Rural Revitalization Strategy:take Guangdong Province as An Example. Issues Agric. Econ. 2018, 6, 108–116. [Google Scholar]
  2. Han, P.Y. Practical Logic and Reflection on Agricultural Scale Management. Rural Econ. 2020, 4, 17–25. [Google Scholar]
  3. Ji, M.F.; Li, L. Agricultural Production Trusteeship: The main form of scale management of agricultural Services. Issues Agric. Econ. 2020, 1, 17–25. [Google Scholar]
  4. Kong, X.Z.; Xu, Z.Y.; Shi, B.Q. The present situation, problem and countermeasure research of Chinese agricultural socialization service system. Jianghan Trib. 2009, 5, 13–18. [Google Scholar]
  5. Lu, Q.W.; Jiang, C.Y. Development mode and industry attribute of agricultural producer services. Jiang-Huai Trib. 2017, 2, 44–49+77. [Google Scholar]
  6. Xu, Q.H.; Zhu, P.X.; Qu, F.T. Smallholder farmers’ organized access to productive agricultural services: Evolutionary logic and technical efficiency changes. Rural Econ. 2022, 4, 107–117. [Google Scholar]
  7. Huang, H.Q. “Full trusteeship”: Solving the problem of “Who will farm the land”—Practice and thinking of “full trusteeship” management service of agricultural production in Nantong. Mod. Econ. Res. 2016, 1, 69–73. [Google Scholar]
  8. Wolf, C.A. Custom Dairy Heifer Grower Industry Characteristics and Contract Terms. J. Dairy Sci. 2003, 86, 3016–3022. [Google Scholar] [CrossRef] [Green Version]
  9. Zhang, X.b.; Yang, J.; Thomas, R. Mechanization outsourcing clusters and division of labor in Chinese agriculture. China Econ. Rev. 2017, 43, 184–195. [Google Scholar] [CrossRef]
  10. Cai, B.Z. Agricultural Production Trusteeship and Agricultural Green and Low-carbon Transformation: A Framework of Theoretical Analysis. J. Jishou Univ. 2022, 43, 125–132. [Google Scholar]
  11. Zhu, Y.Y.; Junmiao, D.; Menghan, W.; Tan, Y.C.; Yao, W.; Zhang, Y. Can Agricultural Productive Services Promote Agricultural Environmental Efficiency in China? Int. J. Environ. Res. Public Health 2022, 19, 9339. [Google Scholar] [CrossRef]
  12. Li, R.; Yu, Y. Impacts of Green Production Behaviors on the Income Effect of Rice Farmers from the Perspective of Outsourcing Services: Evidence from the Rice Region in Northwest China. J. Agriculture 2022, 12, 1682. [Google Scholar] [CrossRef]
  13. Sun, X.Y.; Liu, Y. Can land trust drive farmers to green production? Chin. Rural Econ. 2019, 10, 60–80. [Google Scholar]
  14. Zhang, M.L.; Tong, T.; Chen, Z.J. Can Socialized Service of Agricultural Production Improve Agricultural Green Productivity? South China J. Econ. 2022, 1, 135–152. [Google Scholar]
  15. Hao, D.D.; Wang, Y.N.; Hu, D.S.; Qiao, M.; Wang, B.W. Study on inducements and welfare effects of farmers’ participation in agricultural trusteeship. Chin. J. Agric. Resour. Reg. Plan. 2022, 1–13. [Google Scholar]
  16. Ge, P.F.; Wang, S.J.; Huang, X.L. Measurement for China’s agricultural green TFP. China Popul. Resour. Environ. 2018, 28, 66–74. [Google Scholar]
  17. Li, C.X.; Xu, J.B.; Wang, Y. Can Socialized Service of Agricultural Green Production Improve Agricultural Green Productivity? J. Agrotech. Econ. 2021, 9, 36–49. [Google Scholar]
  18. Liu, J.C.; Zhong, F.N.; Xu, Z.G.; Qiu, H.G. Heterogeneity and Causes of Farmer’s Production Link Outsourcing Behavior from the Perspective of Division of Labor. J. Agrotech. Econ. 2019, 7, 4–14. [Google Scholar]
  19. Du, H.Y.; Chen, J.H.; Gong, J.; Liu, B.Y. Agricultural production trusteeship: Model, effectiveness, and risk sharing mechanism-Based on the survey of Shanxi and Heilongjiang provinces. Price Theory Pract. 2020, 12, 10–13+74. [Google Scholar]
  20. Zhang, Y.Y.; Zhang, Z.J. Study on Difference between Demand Willingness and Choice Behavior of Peasant Households’ Production Links Outsourcing-Based on Empirical Analysis of Rice Production Data from Jiangsu and Jiangxi Provinces. J. Huazhong Agric. Univ. 2016, 2, 9–14+134. [Google Scholar]
  21. Han, Q.; Liu, Q.L.; Meng, T. Can Subsidies for Weak Links of Agricultural Production Trusteeship Improves the Farmers’ Willingness of Whole-process Trusteeship? A Case Study on Agricultural Pest Control Subsidy. J. Huazhong Agric. Univ. 2021, 2, 71–79+178–179. [Google Scholar]
  22. Lv, J.; Xue, Y.; Han, X.Y. Risk aversion, Relationship Network and Selection Bias of Agricultural production custody Service: An analysis based on the hypothesis of Bounded Rationality. Rural Econ. 2020, 3, 118–126. [Google Scholar]
  23. Xu, J.L.; Chu, Y.F.; Gu, H.F. Farmers’ Risk Preference, Risk Perception and Decision Making of Rice Production Outsourcing: Based on the Survey of Rice Growers in Jiangsu Province. Financ. Econ. Xinjiang 2019, 6, 37–50. [Google Scholar]
  24. Hu, Y.T.; Xiao, Z.M. lnfluencing factors on the production processes outsourcing behavior of farmers-Based on date from survey of corn farmers in Ningcheng county of lnner Mongolia. Guangdong Agric. Sci. 2014, 19, 226–231. [Google Scholar]
  25. Hu, W.; Yan, J.X.; Chen, Z.J. Production process outsourcing behavior of farmers and its influencing factors: Based on the perspective of factor supply and the survey data of 1134 households. J. Hunan Agric. Univ. 2016, 17, 8–14. [Google Scholar]
  26. Xiao, J.Y.; Zhang, C.L.; Chen, L.Q.; Zhou, S.S. Investigation and demonstration of farmers’ willingness to participate in land trusteeship. Stat. Decis. 2018, 19, 226–231. [Google Scholar]
  27. Lu, Q.N.; Zhang, C.S.; Qiu, H.G. The Effect of Aging of Agricultural Labor Force and Part-time Farming on theOutsourcing of Agricultural Production. Issues Agric. Econ. 2017, 10, 27–34. [Google Scholar]
  28. Li, D.; Xia, Q.; Zhou, H. Risk preference, operational returns and farmers’ land trusteeship behavior: Based on empirical data of rice planting in Jiangxi Province. Jiangxi Soc. Sci. 2018, 38, 56–65. [Google Scholar]
  29. Sun, D.Q.; Misgina, A.; Lu, Y.T.; Liu, M.X. Quality Surveillance, Risk Attitude, and the Demand for Outsourcing Services in DifferentAgricultural Production Links. J. Agrotech. Econ. 2019, 4, 4–15. [Google Scholar]
  30. Zhong, Z.; Shi, Z.T.; Cao, S.X. A Study on the Gap Between Small Farmers’ Willingness and Actual Practice in Agricultural Production Outsourcing. J. Huazhong Agric. Univ. 2021, 1, 81–89+177. [Google Scholar]
  31. Cai, R.; Cai, S.K. An Empirical Study of Agricultural production outsourcing: Based on the investigation of main rice-producing areas in Anhui Province. J. Agrotech. Econ. 2014, 4, 34–42. [Google Scholar]
  32. Chen, S.Y.; Li, S.P. The Influence factors of farmers’ production outsourcing: An empirical study based on the Williamson Analysis Paradigm. South China J. Econ. 2014, 12, 105–110. [Google Scholar]
  33. Zhang, H.P. The Evolution of China’s Urban-Rural Relations in the Past Seven Decades: From Separation to Integration. Chin. Rural Econ. 2019, 3, 2–18. [Google Scholar]
  34. Vecchio, Y.; Paolo Agnusdei, G.; Paolo Miglietta, P.; Capitanio, F. Adoption of precision farming tools: The case of Italian farmers. Int. J. Environ. Res. Public Health 2020, 17, 869. [Google Scholar] [CrossRef] [Green Version]
  35. Ackerloff, G.A. The market for lemons: Quality uncertainty and the market mechanism. Q. J. Econ. 1970, 84, 488–500. [Google Scholar] [CrossRef]
  36. Peter, F.P. Information asymmetries in participative budgeting: A bargaining approach. J. Bus. Financ. Account. 1984, 11, 41–59. [Google Scholar]
  37. Yuan, H.; Liu, M.L. Estimation of Bargaining Power of Heterogeneous Farmers and Analysis of lnfluencing Factors of Bargaining Power:From Information Asymmetry Perspective. J. Agro-For. Econ. Manag. 2016, 3, 262–270. [Google Scholar]
  38. Tian, L. Analysis on the Current Situation of Dried Edible Fungi Sales Based on the Theory ofInformation Asymmetry and lts Development Countermeasures. Edible Fungi China 2020, 5, 154–156. [Google Scholar]
  39. Kim, J.B.; Li, Y.H.; Zhang, L.D. CFOs versus CEOs: Equity incentives and crashes. J. Financ. Econ. 2011, 3, 713–730. [Google Scholar] [CrossRef]
  40. Zhang, Y.Y.; Bai, C.Q. Institutional Trading and Market lnformational Environment: Theoretical and Empirical Analysis under Information Asymmetry Framework. Front. Sci. Technol. Eng. Manag. 2019, 5, 66–74. [Google Scholar]
  41. Davis Richard, A. Social Structure, Belief, Attitude, Intention, and Behavior: A Partial Test of Liska’s Revisions. Soc. Psychol. Q. 1985, 48, 89–93. [Google Scholar] [CrossRef]
  42. Zhang, Y.P. The research on information asymmetry of Principal-Agent Relationship-Theoretic Framework and Empirical Evidence of Asset Management Market. Rev. Invest. Stud. 2017, 36, 145–157. [Google Scholar]
  43. Yu, L.Z.; Xie, H.X. Peasants’ Information Access in Contemporary China: A Structural Analysis and Its Limitations. J. Libr. Sci. China 2013, 39, 9–26. [Google Scholar]
  44. Lei, M.Y.; Yu, G.X.; Li, X.D. Organization Model, Information Acquisition Ability and Farmers’ Borrowing Behavior of Industrial Chain-Based on the Field Survey of 492 Cotton Farmers in Xinjiang. J. Financ. Dev. Res. 2020, 5, 26–34. [Google Scholar]
  45. Wu, Z.Z. The theory of information asymmetry and its economic significance. Econ. Perspect. 1997, 1, 66–69. [Google Scholar]
  46. Amir, K.; Ghadim, A.; David, J.P.; Michael, P.B. Risk, uncertainty, and learning in adoption of a crop innovation. Agric. Econ. 2005, 33, 1–9. [Google Scholar]
  47. Wu, B.J.; Hu, L.F.; Ma, J.J. An Empirical Analysis on Social Networks, Access to Information and Entrepreneurship of Farm Households. Econ. Surv. 2014, 31, 32–37. [Google Scholar]
  48. Wozniak, G.D. Joint information acquisition and new technology adoption: Late versus early adoption. Rev. Econ. Stat. 1993, 75, 438–445. [Google Scholar] [CrossRef]
  49. Curtin, C.M.; Barrett, H.C.; Bolyanatz, A.; Crittenden, A.N.; Fessler, D.M.; Fitzpatrick, S.; Gurven, M.; Kanovsky, M.; Kushnick, G.; Laurence, S.; et al. Kinship intensity and the use of mental states in moral judgment across societies. Evol. Hum. Behav. 2020, 41, 415–429. [Google Scholar] [CrossRef]
  50. Zhang, W.E.; Luo, Y.; Zhao, M.J. Social Networks, information Acquisition and Households’ Behavior of Agricultural Film Recycling:A Sample of Farm Households in Yellow River Basin. J. Agro-For. Econ. Manag. 2022, 21, 40–48. [Google Scholar]
  51. An, F.; Yan, T.W.; Zhang, F.Y. The influence of income quality on farmers’ conscious adoption of straw returning technology: Based on moderated mediation effect analysis. Chin. J. Agric. Resour. Reg. Plan. 2022, 43, 162–172. [Google Scholar]
  52. Zhang, J.M. On the Relationship of Knowledge-Belief-Behavior. J. Xiangtan Univ. 2009, 33, 130–134. [Google Scholar]
  53. Jiang, J.; Wang, X.L.; Zhou, J. Study on the influence of information ability on the change of pesticide application behavior of vegetable farmers. J. Agrotech. Econ. 2016, 12, 43–53. [Google Scholar]
  54. Davis, F.D. Perceived usefulness, perceived ease of use, and user acceptance of information technology. MIS Q. 1989, 13, 319–340. [Google Scholar] [CrossRef] [Green Version]
  55. Zhu, Y.J.; Zhou, D.Y.; You, L.Z. Impact of farmers’ resource endowment and inner perception on technology adoption in Oromia, Ethiopia. Resour. Sci. 2015, 37, 1629–1638. [Google Scholar]
  56. Li, Z.L.; Han, Y.; Guo, X.; Jiang, F.F.; Lin, W.L. Analysis of Influencing Factors on Farmer’s Willingness to Adopt Soil Testing and Formula Fertilization Technology Based on SEM. Resour. Environ. Yangtze Basin 2019, 28, 2119–2129. [Google Scholar]
  57. Yan, B.B.; Zhao, P.P.; Liu, T.J. The Impact of Information Literacy on Farmers’ Participation in E-commerce Based on the Intermediary Role of Farmers’ Internal Perception and the Regulatory Role of Government Promotion. J. Huazhong Agric. Univ. 2021, 5, 54–65+193–194. [Google Scholar]
  58. Wang, X.L. Information Ability, Anchoring-Adjustment and Behavioral Transition of Vegetable Farmers’ Pesticides-Use: Based on the Survey of Shandong Province; Shenyang Agricultural University, Liaoning Province: Shenyang, China, 2016. [Google Scholar]
  59. Luo, B.L. On Service Scale Management—From Vertical Division of Labor to Horizontal Division of Labor and Continuous Specialization. Chin. Rural Econ. 2017, 11, 2–16. [Google Scholar]
  60. Peng, Y.H.; Pan, W.G.; Li, L. Large rice farmer households’ decisions on mechanic service outsourcing in rice production. J. Zhejiang A&F Univ. 2019, 36, 1006–1011. [Google Scholar]
  61. Xiao, Y.; Qi, Z.H.; Xu, S.; Yang, C.Y.; Liu, Y.X. Impact of Social Interaction and Information Acquisition Ability on Farmers’ Adoption Behavior of Rice-shrimp Co-cultivation Technology. J. Ecol. Rural Environ. 2022, 38, 308–318. [Google Scholar]
  62. Yakubu, A.S.; Euan, P. Efficiency Effects of Access to Information on Small-scale Agriculture: Empirical Evidence from Uganda using Stochastic Frontier and IRT Models. J. Agric. Econ. 2017, 68, 494–517. [Google Scholar]
  63. Sun, G.L.; Li, Q.H.; Yang, Y.M. The impact of financial knowledge on passive landless farmers’ entrepreneurial behavior-empirical evidence based on IV-Heckman model. China Rural Surv. 2019, 3, 124–144. [Google Scholar]
  64. Tonch, H.A.; Sohn, W. The impact of informal credit on household welfare: Evidence from rural Ethiopia. Appl. Econ. Lett. 2022, 29, 12–16. [Google Scholar] [CrossRef]
  65. Yang, C.F.; Zheng, S.F.; Yang, N. The impact of information literacy and green prevention-control technology adoption behavior on farmer household income. Chin. J. Eco-Agric. 2020, 28, 1823–1834. [Google Scholar]
  66. Lian, Y.J.; Li, W.S.; Huang, B.H. The Impact of Children Migration on the Health and Life Satisfaction of Parents Left Behind. China Econ. Q. 2015, 14, 185–202. [Google Scholar]
  67. Chen, H.; Lv, Y. The mystery of official families’ inhibiting children’s entrepreneurship: An explanation based on educational screening. J. Financ. Econ. 2017, 43, 67–82. [Google Scholar]
  68. Robins, R.W.; Fraley, R.C.; Krueger, R.F. Handbook of Research Methods in Personality Psychology; Guilford Press: New York, NY, USA, 2009. [Google Scholar]
  69. Cheng, X.T.; Zhou, H.; Liu, X.H.; Chen, X.J. Study on Effect of Farmers’ Concurrent Business Degree on CroplandAbandonment in Mountainous Area: A Case Study in Wuling Mountain Area. Resour. Environ. Yangtze Basin 2021, 30, 246–256. [Google Scholar]
  70. Xu, H.; Tong, J.H.; Chen, G.Y.; Zhuang, T.H. Does feminization of agriculture promotes outsourcing of agricultural machinery services? Acta Agric. Zhejiangensis 2022, 34, 173–183. [Google Scholar]
  71. Yang, Y.C. Outsourcing Decision-Making of Non-timber Forest Planting Households in the Middle and Upper Reaches of the Yellow River-Based on the Field Survey Data of the Farmers in the Seven Provinces. J. Northwest For. Univ. 2022, 37, 275–280. [Google Scholar]
  72. Xue, Y.; Lv, J.; Han, X.Y. Mechanism and empirical study of the dual role of natural risk and non-farm employment in Northeast China’s agricultural trusteeship decision. Contemp. Econ. Res. 2022, 1–14. [Google Scholar]
  73. Yuan, X.H.; Xiao, Y.C. Information accessibility, Cognition Level and Consumer Trust of Organic Agricultural Products. J. Manag. 2021, 34, 92–108. [Google Scholar]
  74. Li, Y.J.; Ma, J. Impacts of trusteeship factors and operating characteristics on farmers’ agriculturaproduction trusteeship decisions. J. China Agric. Univ. 2022, 12, 28–41. [Google Scholar]
  75. Chen, Y.X.; Huang, S.L.; Liu, Z.j. Research on the lmpact of Risk Perception on Farmer’s Land Trusteeship Decision. China Land Sci. 2022, 10, 21–30. [Google Scholar]
  76. Qu, M.; Zhao, K.; Zhang, R.; Gao, Y.; Wang, J. Divergence between Willingness and Behavior of Farmers to Purchase Socialized Agricultural Services: From a Heterogeneity Perspective of Land Scale. Land 2022, 11, 1121. [Google Scholar] [CrossRef]
  77. Cai, L.M.; Wang, L.P. Analysis on outsourcing service behavior of rice pest and disease control based on Heckman selection model-A case study of ten counties in Fujian Province. PLoS ONE 2021, 16, e0254819. [Google Scholar] [CrossRef] [PubMed]
  78. Li, N.; Wang, X.S.; Wang, S.J.; Li, G.S. Self-purchasing or Outsourcing: How Does Farmland Right Confirmation Affect Farmers’ Choice of Agricultural Mechanization? Chin. Rural. Econ. 2019, 6, 54–75. [Google Scholar]
  79. Cai, L.M.; Wang, L.P. Analysis on the affection of plant protection machinery subsidy on outsourcing service behavior of rice control: Evidence based on micro household data of main rice producing areas in Fujian Province. J. Chin. Agric. Mech. 2021, 42, 206–212. [Google Scholar]
  80. Chen, Z.; Sarkar, A.; Hossain, M.S.; Li, X.; Xia, X. Household Labour Migration and Farmers’ Access to Productive Agricultural Services: A Case Study from Chinese Provinces. Agriculture 2021, 11, 976. [Google Scholar] [CrossRef]
  81. Wang, H.; Qi, Z.H.; Yang, C.Y.; Tian, Z.Y. Study on the Influence of Farmers’ Information Capability on the Adoption Intention of Ecological Planting and Breeding Model-Mediation Based on Perceived Ease of Use. World Agric. 2022, 7, 93–105. [Google Scholar]
  82. Yao, C.S.; Qiu, Y.F.; Huang, L.; Li, Z.T. Coupling Relationship between Urbanization and Food Security in China: An Empirical Study. China Soft Sci. 2016, 8, 75–88. [Google Scholar]
Figure 1. The theoretical framework of the study.
Agriculture 13 00573 g001
Table 1. Basic characteristics of sample (Unit: farmer, %).
IndexValueFreqPercentIndexValueFreqPercent
GenderMale88794.66Service DecisionUnpurchased16817.93
Female505.34Purchase service76982.07
Age18–40 years old727.68Service TypePartial service53869.96
41–63 years old63067.24Full service23130.04
64–86 years old23525.08Service InstitutionCooperative20322.61
EducationNo degree394.16Service enterprise808.91
Primary school41544.29Local farmers59566.26
Middle school40943.65Non-local farmers202.23
High school697.36Land CharacteristicsNon-flat land21823.27
Bachelor’s Degree50.53Flat land71976.73
Health StatusExtremely unhealthy131.39Land Scale<10 mu444.70
Relatively unhealthy848.96CNY10–30 mu54658.27
Ordinary state11412.17>30 mu34737.03
Relatively healthy48952.19Agricultural Machinery SituationNot owned44046.96
Extremely healthy23725.29Possess49753.04
Table 2. The meaning of each variable and the results of descriptive statistical analysis.
VariableVariable DescriptionMeanStandard DeviationMinimum Maximum
Explained variables
Service Decision 1 if APS is purchased, 0 otherwise0.8210.38401
Service Type2 if full service is purchased, 1 otherwise1.3000.45912
Core explanatory variables
information acquisition ability(IAA)IAA parameters calculated by the IRT model32.56224.5910100
Response VariablesWhether to obtain information through family, friends, and neighbors channels: Yes = 1, No = 00.8610.34601
Whether to obtain information through traditional media channels: Yes = 1, No = 00.5520.49801
Whether to obtain information through modern media channels: Yes = 1, No = 00.1810.38601
Whether to obtain information through agricultural technology training: Yes = 1, No = 00.1720.37701
Whether to obtain information through cooperative channels: Yes = 1, No = 00.1130.31701
Intermediate variables
Perceived Usefulness (PU)Produce higher yields of food from APS than from growing your own; 1 = strongly disagree, 2 = disagree, 3 = fairly agree, 4 = agree, 5 = strongly agree3.1560.75815
Perceived ease of use (PEU)APS can be easily obtained; 1 = very uncomplicated, 2 = not easy, 3 = fair, 4 = easy, 5 = very easy3.8040.68615
Personal characteristics of the head of household
Gender0 = Female; 1 = Male0.9470.22501
AgeThe actual age of head of household/year55.40810.2982486
Education1 = Elementary school and below; 2 = Junior high school; 3 = High school and above1.5940.63213
Health status1 = very poor; 2 = poor; 3 = fair; 4 = good; 5 = very good3.9100.92215
Is a party member or village cadre (PC1)0 = Neither a party member nor a village cadre; 1 = A party member or a village cadre0.1250.33101
Willingness to continue farming (PC2)1 = very reluctant, 2 = reluctant, 3 = fair, 4 = willing, 5 = very willing3.5750.77015
Focus on long-term benefits (PC3)Farmers’ self-assessment 0–10 points4.5143.004010
Risk characteristics (RC)1 = risk-averse; 2 = risk-neutral; 3 = risk-averse1.8450.91113
Farming family characteristics
Number of family members (FC1)The actual number of family members (persons)3.5231.35918
Percentage of non-farm income (FC2)Non-farm income/total net household income32.56432.936094.258
Number of farm machinery (FC3)Number of farm machinery available to households1.0831.47208
Land characteristics
Scale of operation (LC1)Total arable land area/mu43.39750.4332.5358
Terrain conditions (LC2)0 = non-flat; 1 = flat0.7670.42301
Production environment characteristics
Accessibility of farmland roads (PE1)1 = very poor; 2 = poor; 3 = fair; 4 = good; 5 = very good3.4300.95115
Social Network (PE2)Add 1 to the number of gifts from last year’s family to obtain the correct number8.4981.315011.29
Natural disasters (PE3)0 = agricultural production was not affected last year; 1 = affected0.5380.49901
Table 3. Estimation results of differentiation and difficulty parameters.
Type of Information ChannelDifferentiation Parameter(Standard Error) Difficulty Parameter (Standard Error)
Family, friends, and neighbors0.343 **0.144−5.452 **2.207
Traditional media1.357 ***0.223−0.205 ***0.068
Modern media1.635 ***0.2921.284 ***0.136
Agricultural technology training1.285 ***0.2221.536 ***0.184
Cooperatives1.281 ***0.2311.996 ***0.247
Note: *** and ** indicate significance at the 1% and 5% levels, respectively.
Table 4. Estimation results of IAA parameters.
Type of Channel CombinationIAA ParameterPercentage/%
Not to obtain information−0.91705.73
Family, Friends, and Neighbors (FFN)−0.704635.63
Traditional Media (TM)−0.1377
Modern Media (MM)0.0047
Agricultural technology training (AT)−0.1752
Cooperatives−0.1772
FFN + TM0.037132.81
FFN + MM0.1735
FFN + AT0.0011
FFN + Cooperatives−0.0007
TM + MM0.6383
TM + AT0.4826
TM + Cooperatives0.4810
MM + AT0.6067
AT + Cooperatives0.4485
FFN + TM + MM0.786916.98
FFN + TM + AT0.6352
FFN + TM + Cooperatives0.6336
FFN + MM + AT0.7561
FFN + MM + Cooperatives0.7545
FFN + AT + Cooperatives0.6020
TM + MM + Cooperatives1.1806
MM + AT + Cooperatives1.1509
FFN + TM + MM + AT1.32406.88
FFN + TM + MM + Cooperatives1.3225
FFN + TM + AT + Cooperatives1.1777
FFN + MM + AT + Cooperatives1.2928
TM + MM + AT + Cooperatives1.7163
FFN + TM + MM + AT + Cooperatives1.86441.98
Table 5. Heckman model estimation results.
Variable NameRegression 1: Selection EquationRegression 2: Outcome Equation
Coef.Robust Std. Err.Coef.Robust Std. Err.
IAA0.234 **0.0920.121 ***0.026
Gender−0.2590.307−0.0200.069
Age0.012 **0.0070.0010.002
Education0.0030.103−0.0280.027
Health status0.0310.062−0.0200.019
PC10.641 **0.230−0.0100.048
PC2−0.152 *0.076−0.0340.023
PC3−0.0420.0260.0060.008
RC−0.0180.0900.052 **0.027
FC10.0730.049−0.043 ***0.013
FC20.0070.0330.0040.009
Land size square−0.179 ***0.0460.038 **0.017
LC20.2160.138−0.104 **0.044
PE10.0450.060−0.0250.017
PE20.122 ***0.037−0.0080.015
PE3−0.1540.1290.0050.033
Regional VariablesControlledControlled
FC3−0.408 ***0.043
Constant term1.452 *0.7841.519 ***0.232
imr−0.295 ***0.097
Wald test82.130 ***
Note: ***, **, and * indicate significance at the levels of 1%, 5%, and 10%, respectively.
Table 6. Re-estimation results based on the IV-Heckman model.
Variable NameRegression 3: Selection EquationRegression 4: Outcome Equation
Coef.Robust Std. Err.Coef.Robust Std. Err.
IAA1.211 **0.6121.270 ***0.145
Control variablesControlled
imr−0.341 ***0.088
Wald test165.09 ***
DWH test values87.485 ***
Instrumental variable t-value5.770 ***
One-stage F-value11.780 ***
Note: *** and ** indicate significance at the 1% and 5% levels, respectively.
Table 7. Results of the mediating effects test for perceived usefulness.
Variable NameRegression 5Regression 6Regression 7
PUSelection EquationOutcome Equation
IAA0.699 *** (0.203)1.088 * (0.595)1.188 *** (0.120)
PU----0.788 *** (0.096)0.170 *** (0.026)
Constant term3.944 *** (0.475)0.941 (1.371)2.697 *** (0.296)
Control variablesControlledControlledControlled
imr----−0.207 ** (0.082)
Wald test----241.75 ***
Number of observations937937769
Note: ***, **, and * indicate significance at the levels of 1%, 5%, and 10%, respectively.
Table 8. Results of the mediating effect test for perceived ease of use.
Variable NameRegression 8Regression 9Regression 10
PEUSelection EquationOutcome Equation
IAA0.125 (0.190)1.413 ** (0.579)1.261 *** (0.130)
PEU----0.553 *** (0.084)−0.012 (0.029)
Constant term3.340 *** (0.444)1.970 (1.325)3.342 *** (0.321)
Control variablesControlledControlledControlled
imr----−0.365 *** (0.082)
Wald test----164.71 ***
Number of observations937937769
Note: *** and ** indicate significance at the 1% and 5% levels, respectively.
Table 9. Results of balance test of explanatory variables before and after matching.
Method of MatchingPseudo R2LR Statisticp-ValueDeviation from the Mean (%)Deviation from the Median (%)
Before matching0.07982.080.00016.19.6
Nearest neighbor matching0.0079.030.9124.03.4
Nearest neighbor matching (K = 4)0.0034.290.9982.72.3
Radius matching (caliper = 0.01)0.0022.961.0002.21.2
Kernel matching (bandwidth = 0.06)0.0079.030.9124.03.4
Local linear matching0.0079.030.9124.03.4
Table 10. Robustness test considering self-selection bias (PSM).
Variable NameMethod of MatchingMean Value of Change in Farmers’ Choice of APS BehaviorBootstrap Standard Errort-Test Value
Processing Group Control GroupAverage Treatment Effect
selective typeNearest neighbor matching1.3411.2150.126 ***0.0472.85
Nearest neighbor matching (K = 4)1.3411.2170.125 ***0.0443.20
Radius matching (caliper = 0.01)1.3421.2230.118 ***0.0403.11
Kernel matching (bandwidth = 0.06)1.3411.2150.126 ***0.0452.85
Local linear matching1.3411.2230.119 ***0.0342.68
Mean 0.123
Note: ***,indicate significance at the 1% levels, respectively.
Table 11. Robustness results for switching measurement methods.
Variable NameTest 1. HeckmanTest 2. IV-Heckman
Regression 11Regression 12Regression 13Regression 14
Selection EquationOutcome EquationSelection EquationOutcome Equation
IAA0.356 *** (0.064) 0.069 *** (0.018)0.771 ** (0.347)0.816 *** (0.084)
Control variablesControlledControlledControlledControlled
Number of observations937769937769
imr−0.262 *** (0.088)−0.36 *** (0.086)
Wald test78.72 ***163.54 ***
DWH test values----88.034 ***
Instrumental variable t-value----5.56 ***
One-stage F-value----11.36 ***
Note: *** and ** indicate significance at the 1% and 5% levels, respectively.
Table 12. Results of the bootstrap-mediated effects test.
Action VariableAction PathPath CoefficientBootstrap Standard Error 95% Confidence Interval Test Result
PUIAA→Service Decision: Intermediary Effect0.1090.036[0.046, 0.186]Significant
IAA→Service Type: Intermediary Effect0.1280.045[0.055, 0.228]Significant
PEUIAA→Service Decision: Intermediary Effect0.0150.025[−0.035, 0.065]Not significant
IAA→Service Type: Intermediary Effect0.0060.009[−0.007, 0.028]Not significant
Disclaimer/Publisher’s Note: The statements, opinions and data contained in all publications are solely those of the individual author(s) and contributor(s) and not of MDPI and/or the editor(s). MDPI and/or the editor(s) disclaim responsibility for any injury to people or property resulting from any ideas, methods, instructions or products referred to in the content.

