Article

An Infrared Temperature Correction Method for the Skin Temperature of Pigs in Infrared Images

College of Biosystems Engineering and Food Science, Zhejiang University, Hangzhou 310058, China
*
Author to whom correspondence should be addressed.
Agriculture 2023, 13(3), 520; https://doi.org/10.3390/agriculture13030520
Submission received: 1 February 2023 / Revised: 18 February 2023 / Accepted: 19 February 2023 / Published: 21 February 2023
(This article belongs to the Section Agricultural Technology)

Abstract

:
Accurately measuring the skin temperature of pigs is essential to large-scale pig farming for health monitoring, as well as disease detection and prevention. Infrared thermography (IRT) is a promising technology for the non-invasive measuring of pig skin temperature. However, the distance and angle of view of measurement greatly affect the accuracy of IRT-measured temperature. To improve the accuracy of the measurement, this study starts with evaluating the effects of four parameters on the measurement of skin temperature: horizontal distance, camera height, pig height, and angle of view between the object and the IRT camera. It follows by proposing a mathematical model describing the relationship between the real skin temperature and the four parameters through means of response surface methodology. A correction algorithm is then developed based on the mathematical model to improve the measuring accuracy. In order to evaluate the performance of the correction algorithm, the measured skin temperatures before and after correction are compared with the actual ones. The comparison was carried out in an experimental pig farm with 25 randomly selected pigs. The results show that the mean relative error before the correction was −4.64% and the mean relative error after the correction was −0.70%. This study demonstrates that the new infrared temperature correction method is effective and can benefit skin temperature monitoring for commercial pig farms.

1. Introduction

China has developed a large pig industry to meet the demand of the large population [1]. Since the first detection of African Swine Fever (ASF) in China in August 2018, multiple outbreaks of ASF have been reported across China [2]. The ASF became a serious threat, not only to individual pig farms, but also to the entire pig industry in China. Many pig farms experienced tremendous losses these years due to their failure to prevent ASF [3]. Since there is no ASF vaccine available, the most common method to prevent the spreading of ASF in China is to eliminate the source of infection by culling and isolating infected pigs [4]. Though this method can reduce the likelihood of ASF spreading to healthy pigs, the effectiveness of this treatment depends on how quickly infected pigs can be detected and isolated. Any delay will result in the death of a large number of pigs and enormous economic losses to affected pig farms [5]. Therefore, the timely detection of infected pigs plays an extremely important role in disease prevention and damage control.
Body temperature is an important indicator of pigs’ health status [6]. Monitoring pigs’ body temperature can effectively identify infected pigs and prevent the spread of diseases by isolating the infected pigs. Most diseases cause the body temperature of pigs to rise prior to other symptoms, especially some infectious diseases [7]. For example, high fever is one of the most reliable indications of ASF infection [8]. Thus, measuring the pigs’ skin temperature could be an important method for ASF prevention.
Infrared thermography (IRT) is a promising technology, not only for the automatic monitoring of pigs’ skin temperature [9,10], but also for extracting pig-body shape based on shape segmentation [11,12] and evaluating stress conditions in pigs [13,14], although it has drawbacks in providing sufficient information to determine what causes the changes in skin temperature of animals [10,15]. Compared with other temperature measuring technologies, such as rectal and contact skin thermometers or implanted thermal sensors, IRT is a non-contact measure for the surface temperature, which has a distinctive advantage in pig skin temperature sensing in the perspective of reducing the risk of viral infection [16]. However, the accuracy of the IRT measurement can be affected by many factors. The distance between the measured object and the IRT camera, for instance, is one of the most influencing factors in surface temperature sensing [17,18], as the measured temperature decreases with increasing distance between the IRT camera and the target object [19]. Given that the distance between the thermal camera and each pig in the pen is different, each pig’s skin temperature, measured by the IRT camera, could be different from its actual skin temperature [20]. In other words, a pig with a high temperature, far away from the IRT camera, could have the same or even lower measured temperature as one with a normal temperature, close to the camera [21]. This phenomenon could result in a delay in sick pig detection. Note that the emissivity of pig skin is also an influencing factor in surface temperature sensing, which describes a material’s ability to emit energy by radiation [22]. In some previous studies, the skin emissivity of pigs was set as a constant value of 0.98 in pig health screening and fever detection [23,24]. The infrared emissivity was determined by the skin surface condition and the viewing angle [25]. For a commercial pig barn, most of the pigs (particularly the skin surface condition) in a raising unit were the same, which means the viewing angle could be the most affecting parameter for the emissivity in the pig skin temperature measurement using IRT camera. Therefore, in order to accurately obtain pigs’ skin temperature using IRT, it is critical to systematically investigate the effects of the key influencing parameters, such as the distance and the angle of view between pigs and the IRT camera. Furthermore, a correction method for determining the effect of distance and the angle of view is needed for the application of infrared thermography.
Therefore, the objectives of this study are (1) to evaluate the effect of the distance and the angle of view between the pigs and the IRT camera on the accuracy of IRT-measured skin temperature; and (2) to develop a new methodology to correct the skin measurement made by IRT cameras. The results of this study could benefit the health monitoring of pigs by using an IRT camera for commercial pig farms.

2. Methodology and Materials

2.1. The Affecting Parameters Identification

The observation distance, the distance between the pig and the IRT camera, was determined by the height of the pig and the camera, as well as the horizontal distance between them. The observation distance affected the transmittance of infrared radiation in the atmosphere, resulting in the measurement error [26]. According to the Pythagorean theorem, the observation distance could be further measured using the horizontal distance between the camera and the pig, camera height, and pig height. Additionally, since the emissivity depends on the angle of radiation, the angle of view is also an important affecting factor [27]. Therefore, horizontal distance, camera height, pig height, and the angle of view are the factors selected for this study.

2.2. Response Surface Methodology Modelling

The response surface methodology (RSM), a combination of mathematical and statistical techniques, was selected to investigate the effects of the five parameters on the accuracy of skin temperature measurement using infrared thermography. RSM provides the framework to explore the relationship between explanatory variables and response variables, and to obtain the optimal combination for desired responses [28]. RSM is widely applied during both the model development phase and the model improvement and optimization phase.

2.2.1. Experimental Variables and Response

The five factors—horizontal distance, camera height, the angle of view between the camera and target pig, the skin temperature of the pig, and target pig height—were set as the input variables in the RSM model (Table 1). Given the difficulties in using pigs in the laboratory experiment (e.g., keeping them still and controlling the surface temperature), we used a black body cavity (HT-C50, temperature range: 5 to 50 °C, effective emissivity: 0.98 ± 0.02, resolution: 0.01 °C, accuracy: ±0.15 °C) to represent the pigs, as an alternative. The ranges of horizontal distance (D), camera height (Hc), and the angle of view between the camera and black body cavity (θ) were determined based on the size of the pens (4.8 × 3.75 m in length × width) and the height of the thermal imaging camera installed. In this study, the range of horizontal distance between the camera and the black body cavity was set at 2 to 6 m and the range of camera height was set at 1.7 to 2.3 m, and the angle between the camera and the black body cavity was set at 0 to 50 °C. The black body cavity temperature (Tb) was determined by refereeing the skin temperature of healthy and thermal comfortable pigs and sick pigs, such as ASF-infected pigs. The rectal temperature of a healthy and thermal comfortable pig (6 weeks of age) stayed at 39.1 ± 0.68 °C [29], when the temperature-humidity index (THI) was around 70. According to the relationship between the rectal temperature and central dorsal surface temperature of pigs [30], the normal dorsal surface temperature of pigs would be around 34 °C. A study shows that the rectal temperature of ASF-infected pigs could rise from 39.5 °C (0 day) to a maximum of 41.7 °C (7th day), while the skin temperature could rise from 36.7 °C (0 day) to 40.1 °C (8th day), based on the progression of the infection [31]. Therefore, the range of black body cavity temperature was set at 32 to 42 °C. In addition, the range of the black cavity body height was determined according to the height of the pigs, using the relationship between pig weight and its body height [32], expressed as Height = (Body Weight)0.33. Therefore, the range of the black body cavity height (Hb) was set at 0 to 0.6 m. Table 1 lists the three levels of each parameter in this study.

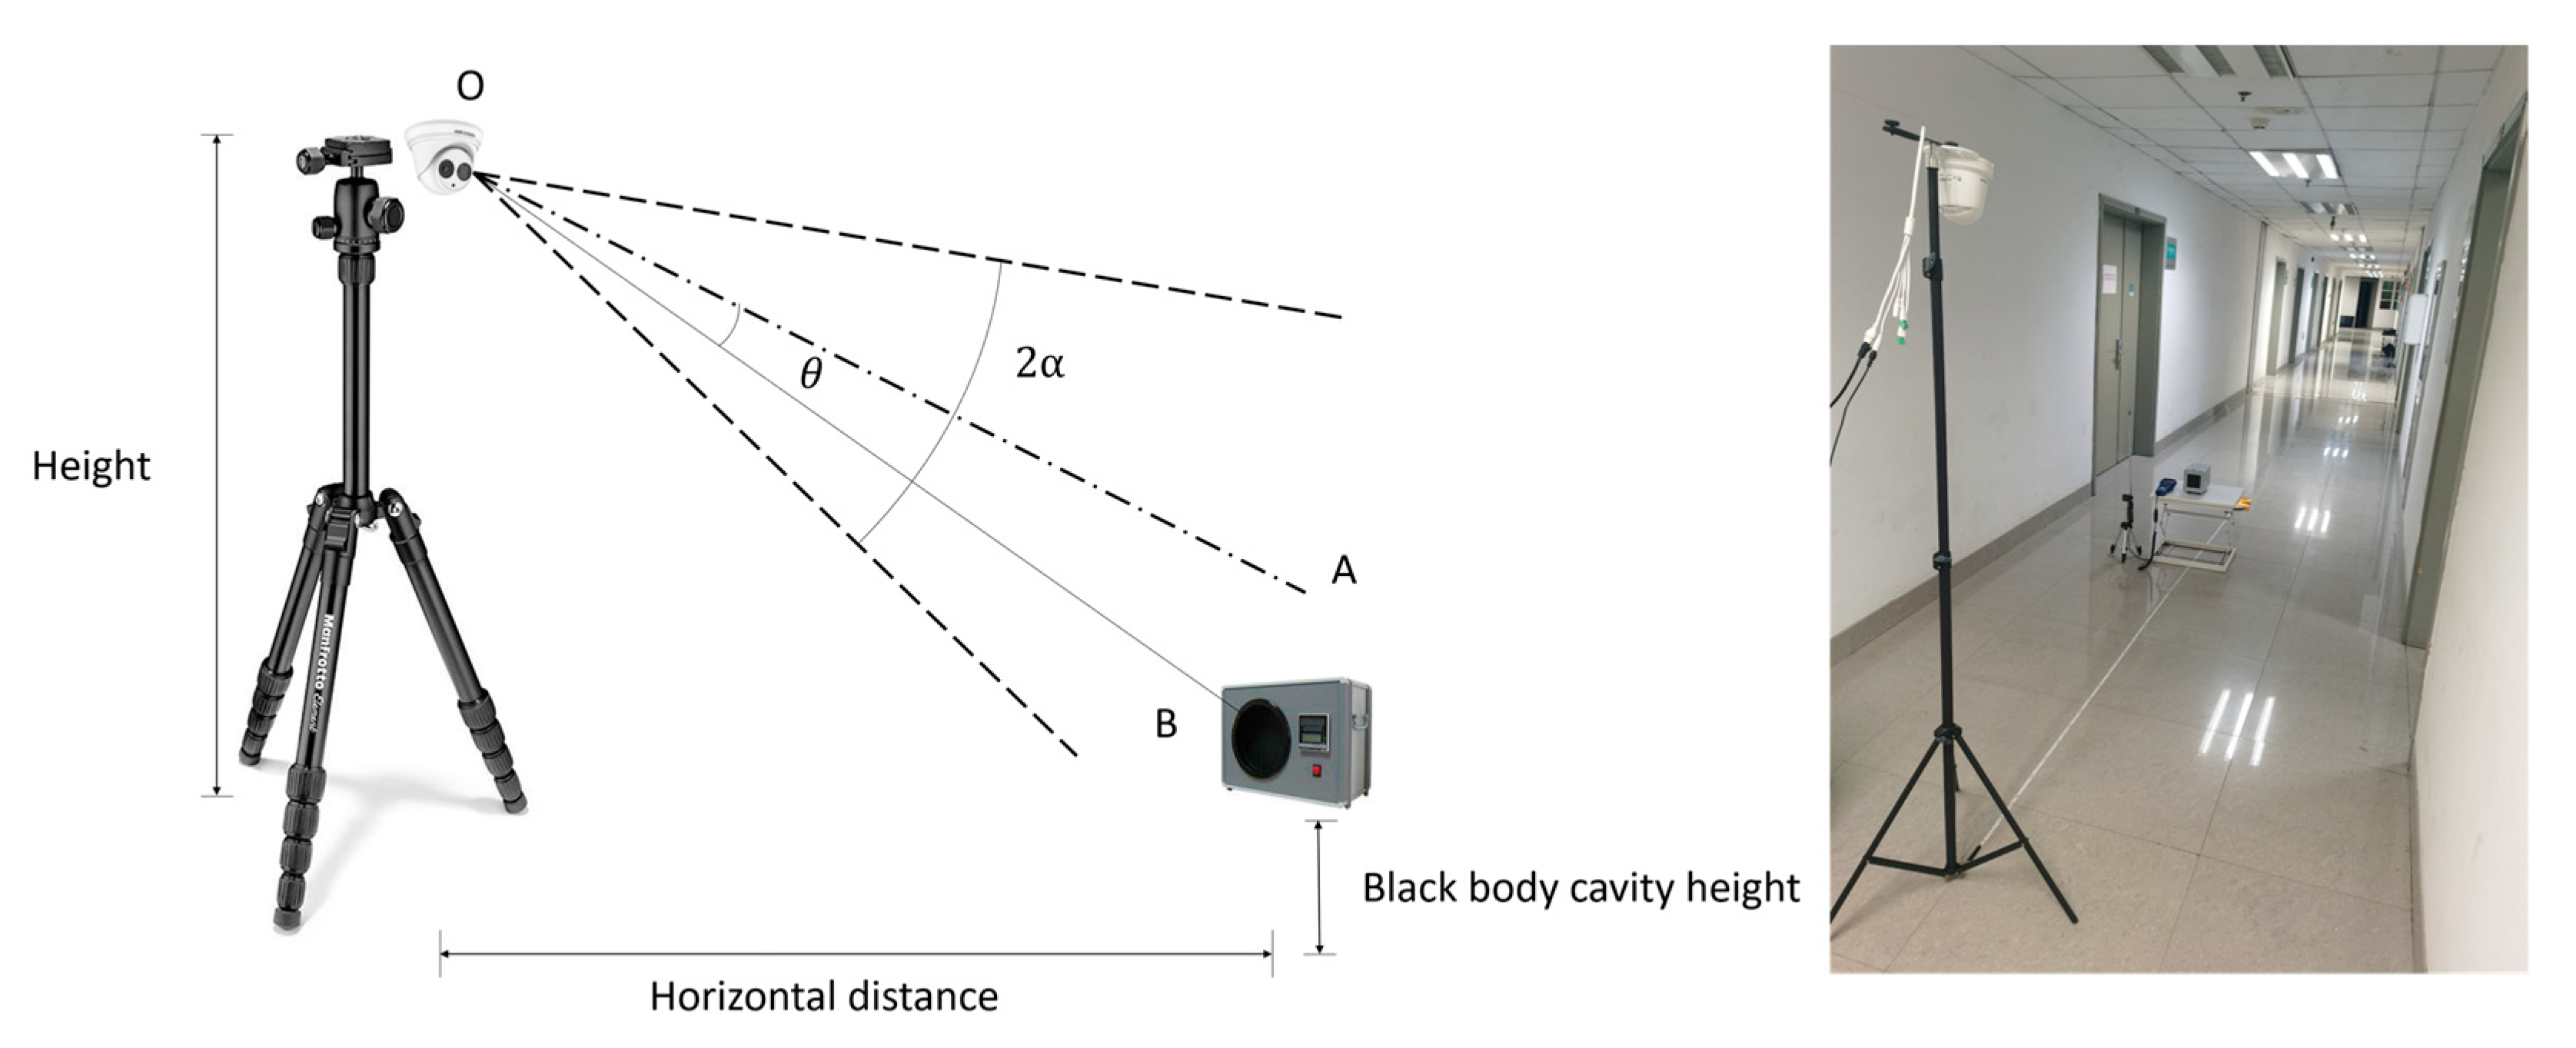
2.2.2. Setup of the Laboratory Experiment

To investigate the effects of the identified parameters on the surface temperature sensing by IRT camera, a laboratory experiment was conducted. Figure 1 illustrates the scheme of the experiment, along with a photo of the setup. As it shows, a black body cavity (HT-C50, temperature range: 5 to 50 °C, effective emissivity: 0.96 ± 0.02, resolution: 0.01 °C, accuracy: ±0.15 °C) was used to characterize the skin temperature of pigs, and a thermal imaging camera (Hikvision TB-1217A-3’PA, field angle: 50° × 37.2°, temperature measurement range: 30–45 °C, temperature measurement accuracy: ±0.5 °C, emissivity of pig skin: 0.98) was used to measure the temperature area of the black body cavity. The horizontal distance from the thermal imaging camera to the black body cavity was controlled by a flexible ruler. The angle of view between the black body cavity and the optical center of the thermal imaging camera was controlled by the horizontal distance because of the geometric relationship between the horizontal distance and the angle of view, given a particular camera height. The ambient temperature was recorded every 1 min by portable, hot-wire anemometers (VelociCalc® Multi-Function Ventilation Meter 9565-A, TSI, Shoreview, MN, USA, temperature measurement range: −10 to 60 °C, resolution: 0.1 °C, accuracy: ±0.3 °C). Undoubtedly, the condition of the lights and materials surrounding the artificial pig (black body cavity) in the experiment could also potentially affect the temperature sensing; the interferences associated with the lights and materials were omitted in this modeling procedure because the condition was comparable, and it was difficult to build the same condition for the modeling.

2.2.3. Establishment of RSM Model

There are different approaches to designing an RSM modelling. In this study, the Box-Behnken design (BBD), a rotatable or nearly rotatable design based on three levels of incomplete factors [33], was used in order to reduce the number of tests. The number of tests (N) required in BBD was calculated according to Equation (1) [34]:
N = 2 k k 1 + c
where k is the number of experimental variables; c is the specified number of replicated central points. In this study, we set 6 replicates for the central point. The resulting N becomes 46 for k = 5 and c = 6. All 46 cases listed in Table 2 served as the training dataset for the RSM model development.
The final second-order RSM model can be written as:
y = β 0 + i = 1 5 β i x i + i = 1 5 β i i x i 2 + i = 1 5 j > i 5 β i j x i x j
where y is the predicted response; β0 is the model constant; βi are linear coefficients; βii are the quadratic coefficients; βij are the coefficients of the cross products; xi and xj are independent variables.
The statistical significance (p-value) of each term in Equation (2) was determined by the multiple analysis of variance (MANOVA). The smaller p-value meant a higher statistical significance of the corresponding term. Only the terms that corresponded with p-values [35] lower than 0.1 were kept in the final RSM model. Both the experimental design and data analysis for the RSM modeling were conducted in Design Experts Version 8.0 (Stat-Ease, Inc., Minneapolis, MN, USA).

2.2.4. RSM Model Verification

RSM, coupled with BBD, can effectively reduce the number of tests compared with the one using a full factorial design; however, model uncertainty might be introduced [36]. To avoid overfitting, the RSM model was verified using 9 separate cases (served as the testing dataset, as shown in Table 3) in which all the values of the experimental variables were selected randomly within the experimental domain. The relative difference was calculated between the experimental results and predicted results, also shown in Table 3.

2.3. Correction Algorithm

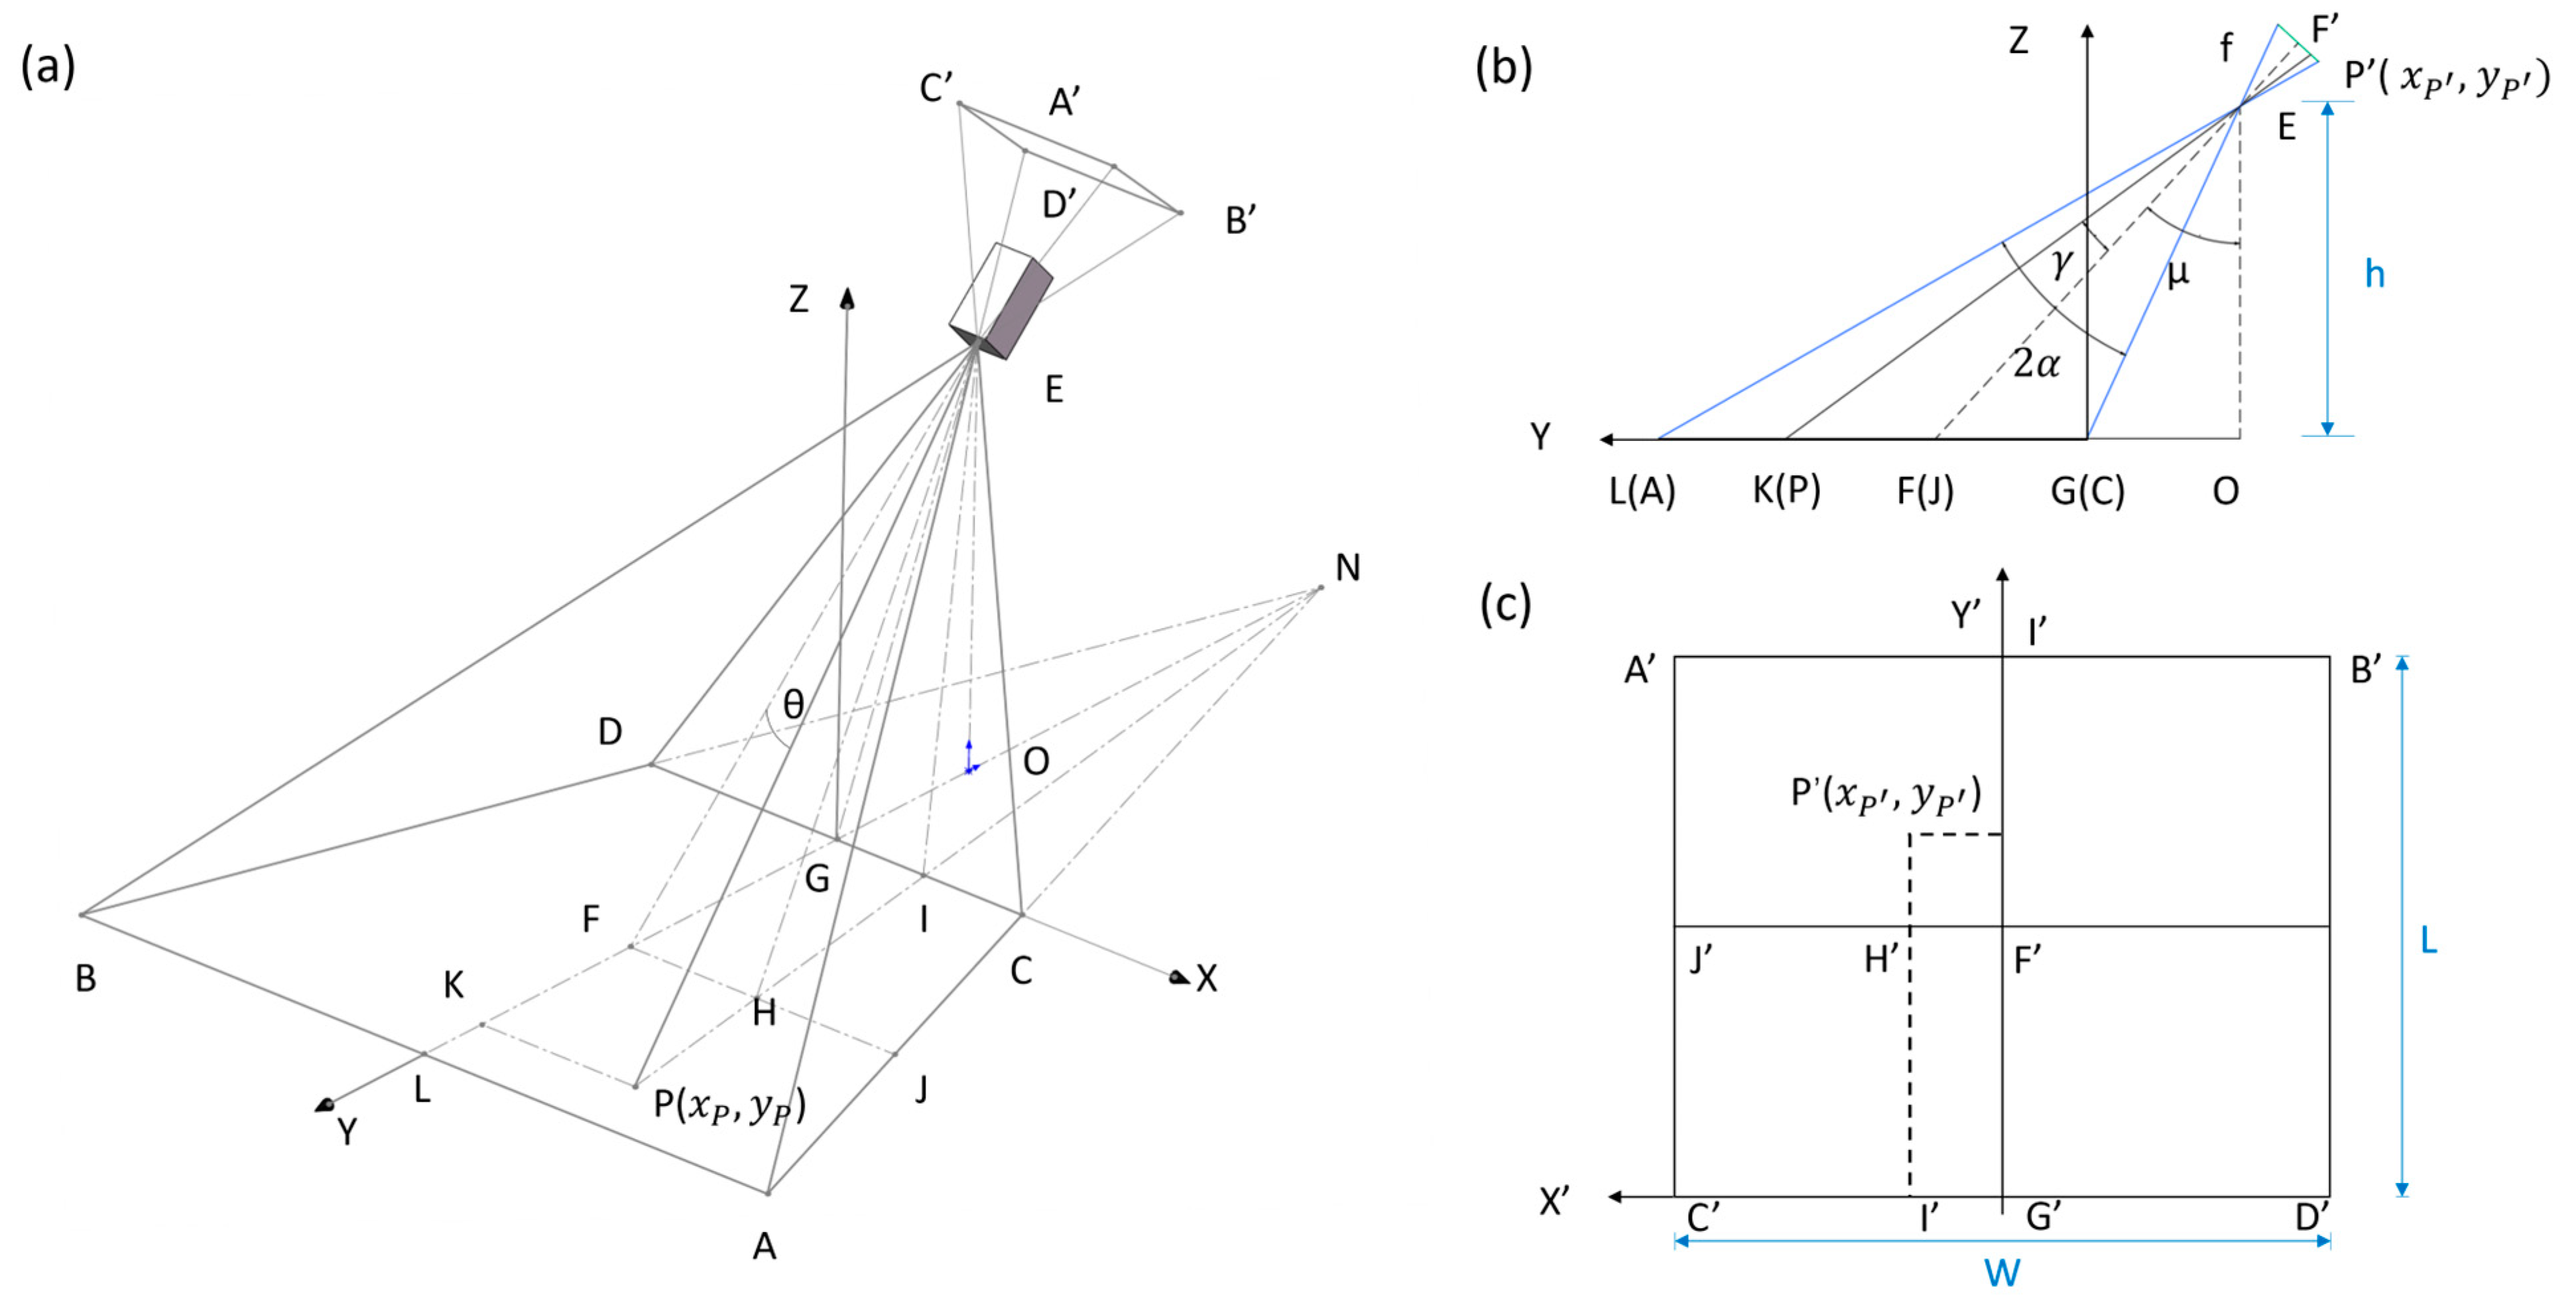
2.3.1. Distance Determination

Vision-based target ranging can be divided into two types: monocular ranging and binocular ranging [37]. Monocular ranging is the most common way to measure the distance between the IRT camera and the object in the view. For monocular ranging technique, the models can be further divided into geometric imaging-based methods [38], perspective transformation-based methods [39], and data fitting-based methods [40].
In this study, the imaging-based geometric method model was adopted for monocular ranging. According to the IRT system in the pig barn, as described previously, the geometric relationship between the camera and the object is illustrated in Figure 2a. If point E was the optical center of the camera and point P was the location of the object, the line EP would be the distance between the camera and the object (pig in this study). Let trapezoid ABCD be the field of view for the camera mounted on the inspection robot and point F be the center of that view. Select X-G-Y as the coordinate system with point G, the midpoint of line CD, as the origin. One would notice that line EF denoted the optical axis of the camera and point O was the projection of point E onto plane ABN. Figure 2b shows the side view of the geometric relationship between the camera and the object. Let 2α denote the vertical, angular field of view.
Figure 2c illustrates the relationship between the points on the object plane and those on the image plane, where L and W were the length and width of the image plane, respectively. On the image plane, X’-G’-Y’ was the coordinate system with point G’, the midpoint of C’D’, as the origin. Points in the object plane coordinate system can be mapped one-on-one to points in the image plane coordinate system.
Let P (xP, yP) be a point in the object plane and P’ (xP’, yP’) be the corresponding point in the image plane. Given the camera height, h, and the elevation angle, μ, the distance between the IRT camera and the object could be obtained through the following steps:
  • Determine yP of point P.
As shown in Figure 2b, yP can be calculated as follows:
y P = O K ¯ O G ¯ = h × tan μ + γ h × tan μ α ,   for   GK > GF y P = O K ¯ O G ¯ = h × tan μ γ h × tan μ α ,   for   GK < GF
γ = arctan y P L 2 f
f = L 2 tan α
where h is the camera height, m; α is half of the vertical field of view, o; μ is the elevation angle of the camera, o; γ is the angle of view in the y-axis direction, o; which could be determined using Equation (4), L is the height of the image plane, pixel; and f is the focal length of the camera, pixel, derived from the Equation (5).
2.
Determine xP of point P.
Triangle similarity was used to determine xp. Since ∆KPN~∆GIN, xp could be derived using:
x P = G I ¯ × N G ¯ + y P N G ¯
where
G I ¯ = G I ¯ × E G ¯ E G ¯ = x p × h × cos α f × cos μ α
Since ∆NGC~∆NFJ, we could find a relationship among N G ¯ , G F ¯ , G C ¯ , and F J ¯ , as shown in Equation (8):
N G ¯ N F ¯ = N G ¯ N G ¯ + G F ¯ = G C ¯ F J ¯
where
G F ¯ = O F ¯ O G ¯ = h × tan μ h × tan μ α
G C ¯ = E G ¯ × W 2 f = h × W 2 f × cos μ α
F J ¯ = E F ¯ × W 2 f = h × W 2 f × cos μ
Using results from Equations (8), (10) and (11), N G ¯ becomes:
N G ¯ = h × tan μ tan μ α cos μ α cos μ 1
where h is the camera height, m; α is half of the vertical field of view, o; μ is the elevation angle of the camera, o; W is the width of the image plane, pixel; and f is the focal length of the camera, pixel.
3.
Determine the horizontal distance between camera and object.
The length of O P ¯ can then be determined by the following equation:
O P ¯ = x P 2 + y P + l O G 2 = x P 2 + y P + h × tan μ α 2
where h is the camera height, m; α is half of the vertical field of view, o; μ is the elevation angle of the camera, o.

2.3.2. Determination of the Angle of View

The PEF , θ, was the angle of view between the object and IRT camera, which could be calculated using the following equation:
θ = arccos E F · E P E F · E P = arccos h × tan μ × y P + h × tan μ α + h 2 ( h × tan μ ) 2 + h 2 × x P 2 + ( y P + h × tan μ α ) 2 + h 2

2.3.3. Correction Algorithm Development

The IRT camera used in this study could measure the temperature for each pixel of the image. Using the temperature data above, a temperature distribution map could be created. To develop the correction algorithm, the mathematical model from RSM, the observation distance (Equation (13)), and the angle of view (Equation (14)) were all compiled into the correction algorithm, together with the data from the IRT camera in Python 3.8. Thus, the temperature information associated with each pixel could be corrected accordingly, and a new infrared image could be generated.

2.4. Case Study

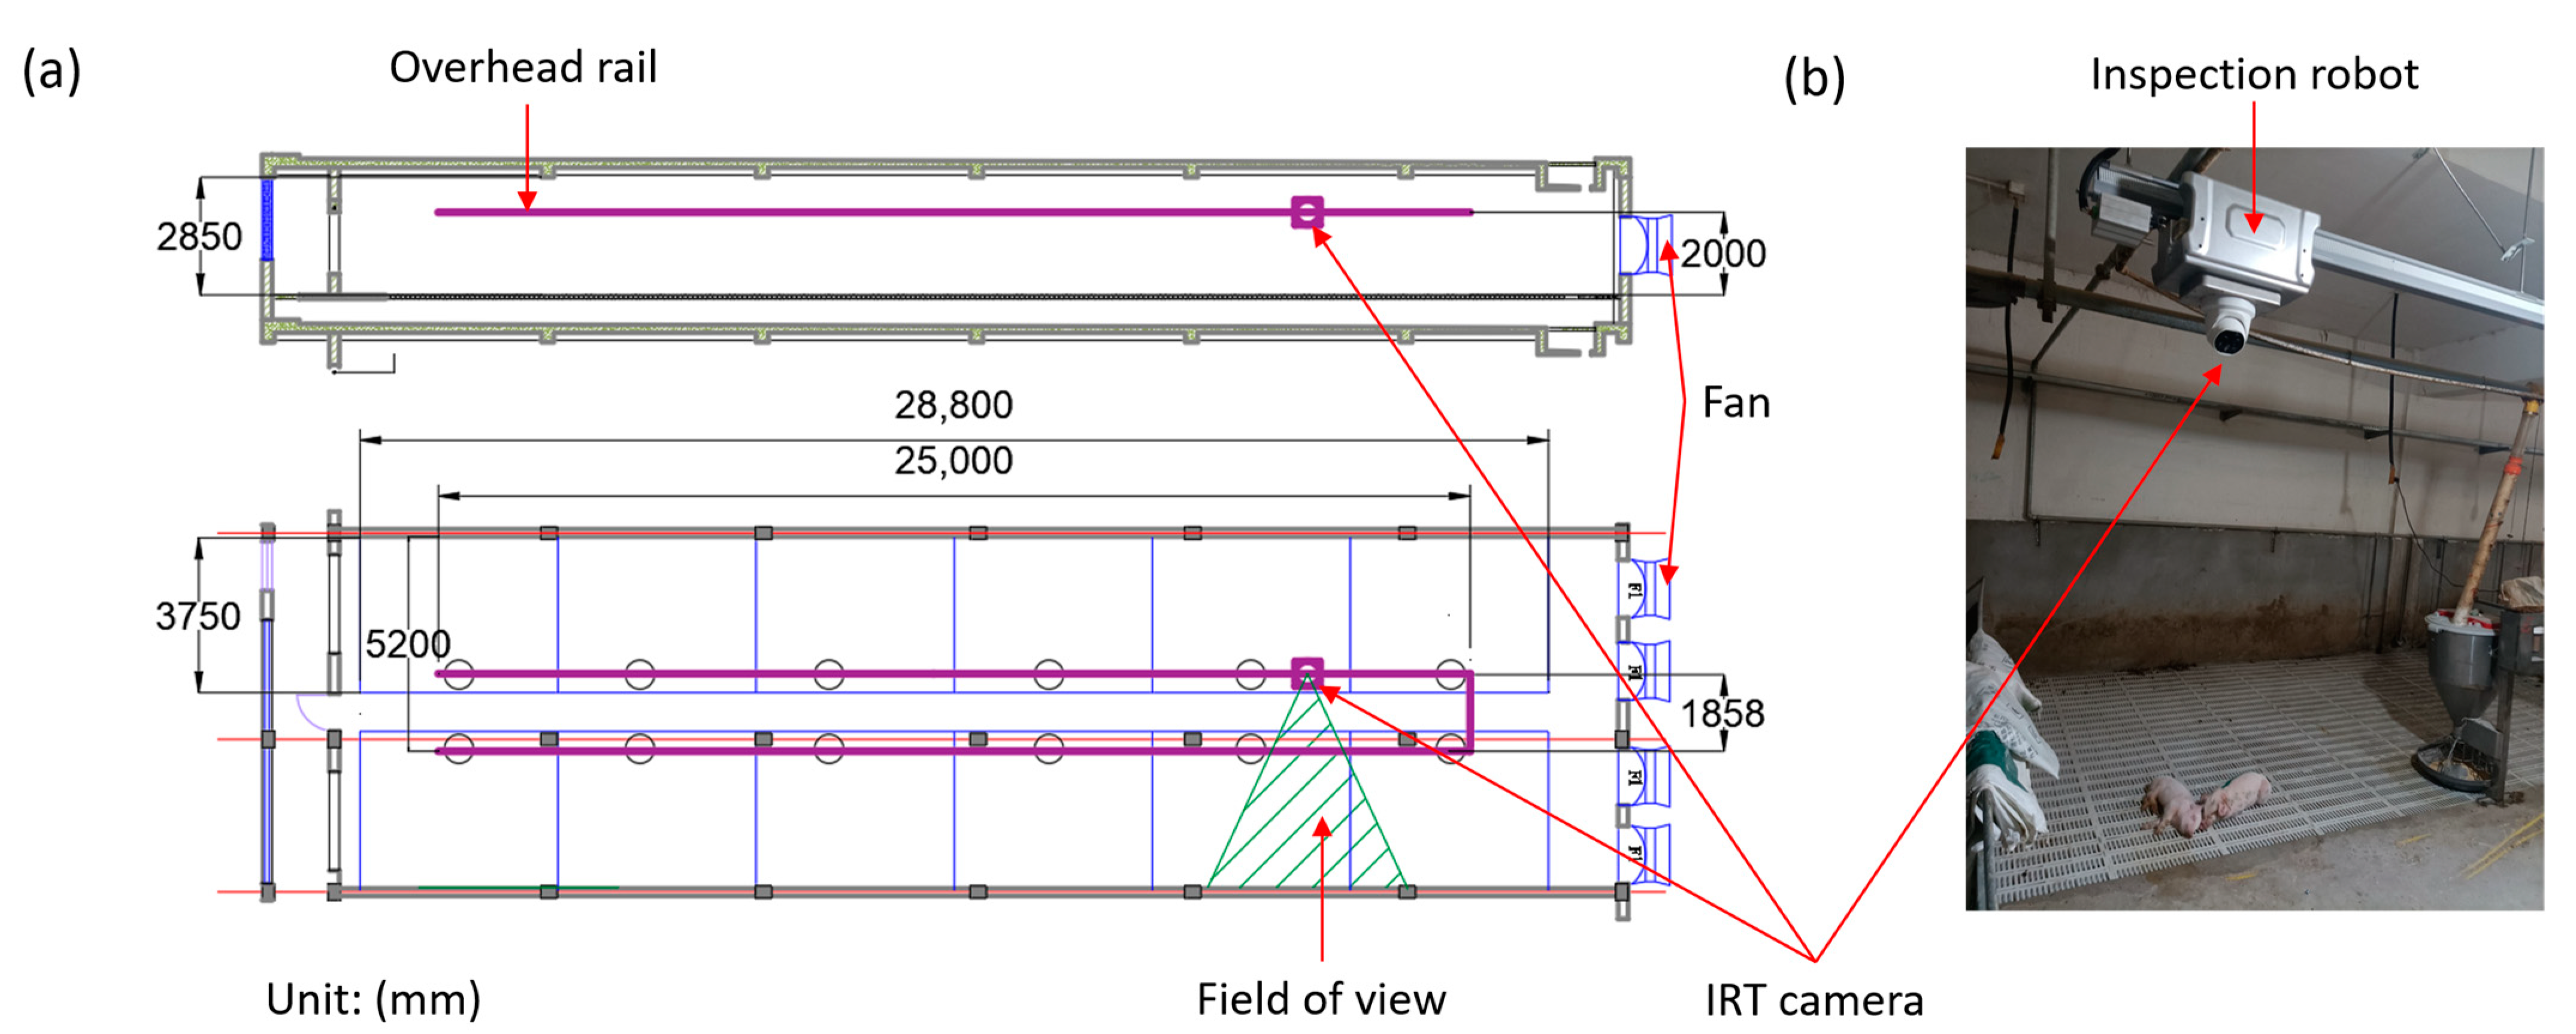
2.4.1. Experimental Barn and Animal

In order to evaluate the performance of the correction method, a field experiment was carried out in a commercial pig farm located in Huzhou, Zhejiang Province, China on 30 August 2022. The layout of the experimental barn was illustrated in Figure 3. Its dimensions were 31 m in length, 8.5 m in width, and 2.85 m in height. As shown in Figure 3, there were two rows of pig pens. Each row had 6 identical pens (4.8 × 3.75 m). A total of 330 pigs (Yorkshire × Landrace × Duroc, aged 67 days) were raised in the barn. Pigs were fed by an automatic feeder and water was provided. Standard cleaning and maintenance procedures for the pig room were followed.

2.4.2. Infrared Thermography System in Pig Building

Figure 3 shows the infrared thermography system used in a commercial pig barn in Changxing, Zhejiang, China. The system consists of two parts: the IRT camera and the overhead rail. To automatically take infrared thermal photos for all the pens, the IRT camera (Hikvision TB-1217A-3’PA, angular field of view: 50° × 37.2°, temperature measurement accuracy: ±0.5 °C) rode the overhead rail and scanned all the pens. The inspection time and the interval could be determined by the farm managers. In this study, each inspection lasted 10 min and the interval between two inspections was 4 h. In order to take the ideal picture of pigs, the elevation angle of the IRT camera was set to 55°.

2.4.3. Setup of the Field Experiment

To test the correction model, a comparison between the skin surface temperature before correction (TBC) and the corresponding actual skin surface temperature (TA) of pigs, and a comparison between the skin surface temperature after correction (TAC) and the corresponding actual skin surface temperature (TA) of pigs, were evaluated. During the experiment, the inspection robot stayed in front of each pen for 5 min. Within each 5 min stay, the IRT camera took a thermal image of the pigs. Meanwhile, the central inguinal or hip of 1 to 3 pigs was selected for the skin temperature measurement, using a portable infrared thermometer (Raytek MX4, Fluke Corp., Everett, Wash.) with an accuracy of ±0.1 °C. In total, 25 pigs were randomly selected from different pens for the experiment. Note that, in order to ensure the accuracy of the measured skin surface temperature of pigs, the measuring distances of the Raytek MX4 to the skin surface were maintained around 10 cm. The corresponding skin surface temperatures, after correction (TAC), were then calculated using the correction algorithm. In addition, the indoor air temperature and relative humidity were recorded continuously during the experiment by portable hot-wire anemometers (VelociCalc® Multi-Function Ventilation Meter9565-A, TSI, Shoreview, Minnesota, MN, USA).

2.4.4. Comparison Criteria

The accuracy of the correction method was evaluated using relative error (Er):
E r B C = T B C T a T a × 100 %
E r A C = T A C T a T a × 100 %
where Er-BC is the relative error of temperature before correction; Er-AC is the relative error of correction temperature after correction; TBC is the temperature before correction, °C; TAC is the temperature after correction, °C; TA is the actual temperature, °C.

3. Results and Discussion

3.1. RSM Model

3.1.1. RSM Model Development

According to the MANOVA result from the original RSM model, based on Equation (2), the p-value of the model was <0.0001, which means the regression model is highly significant. However, only 8 terms, i.e., A, B, C, D, E, AD, A2, C2, D2, were significant (p-values < 0.05), and the remaining terms were not significant. Therefore, the terms with a p-value > 0.05 were removed from the RSM model. Table 4 lists the MANOVA results of the modified RSM model. The modified RSM model was significant (p-value < 0.0001) and the p-values of all the examined terms were less than 0.05, indicating that the terms could significantly affect the response. Based on the R2 at 0.9970, adjusted R2 at 0.9962, and predicted R2 at 0.9954, the modified RSM model was therefore deemed suitable to predict surface temperature.
The coefficient of each term listed in Table 4 was estimated using regression analysis. Thus, the mathematical model for predicting the measured surface temperature was established as:
T m = 12.41943 + 1.96598 D 0.897917 H c + 0.021062 θ + 0.337445 T b + 0.38125 H b 0.0625 × D × T b                                                       0.047232 D 2 0.001454 θ 2 + 0.00991 T b 2
Accordingly, the body temperature of the black body cavity can then be calculated as follows:
T b = 3.153380424 D                                                     + 50.45408678 × ( 0.00005763656 θ 2 0.000834898 θ 0.01511275 H b                                                     + 0.03559343 H c + 0.03964 T m 0.120112072 D + 0.005778526 D 2 0.378437077 ) 0.5                                                     17.02547931
where Tb is the actual surface temperature of the black body cavity, °C; Tm is the average surface temperature of the black body cavity measured by the IRT camera, °C; D is the horizontal distance between the black body cavity and the camera, m; Hc is the height of the camera, m; Hb is the height of the black body cavity from the ground, m; θ is the angle of view between the black body cavity and the camera, o.

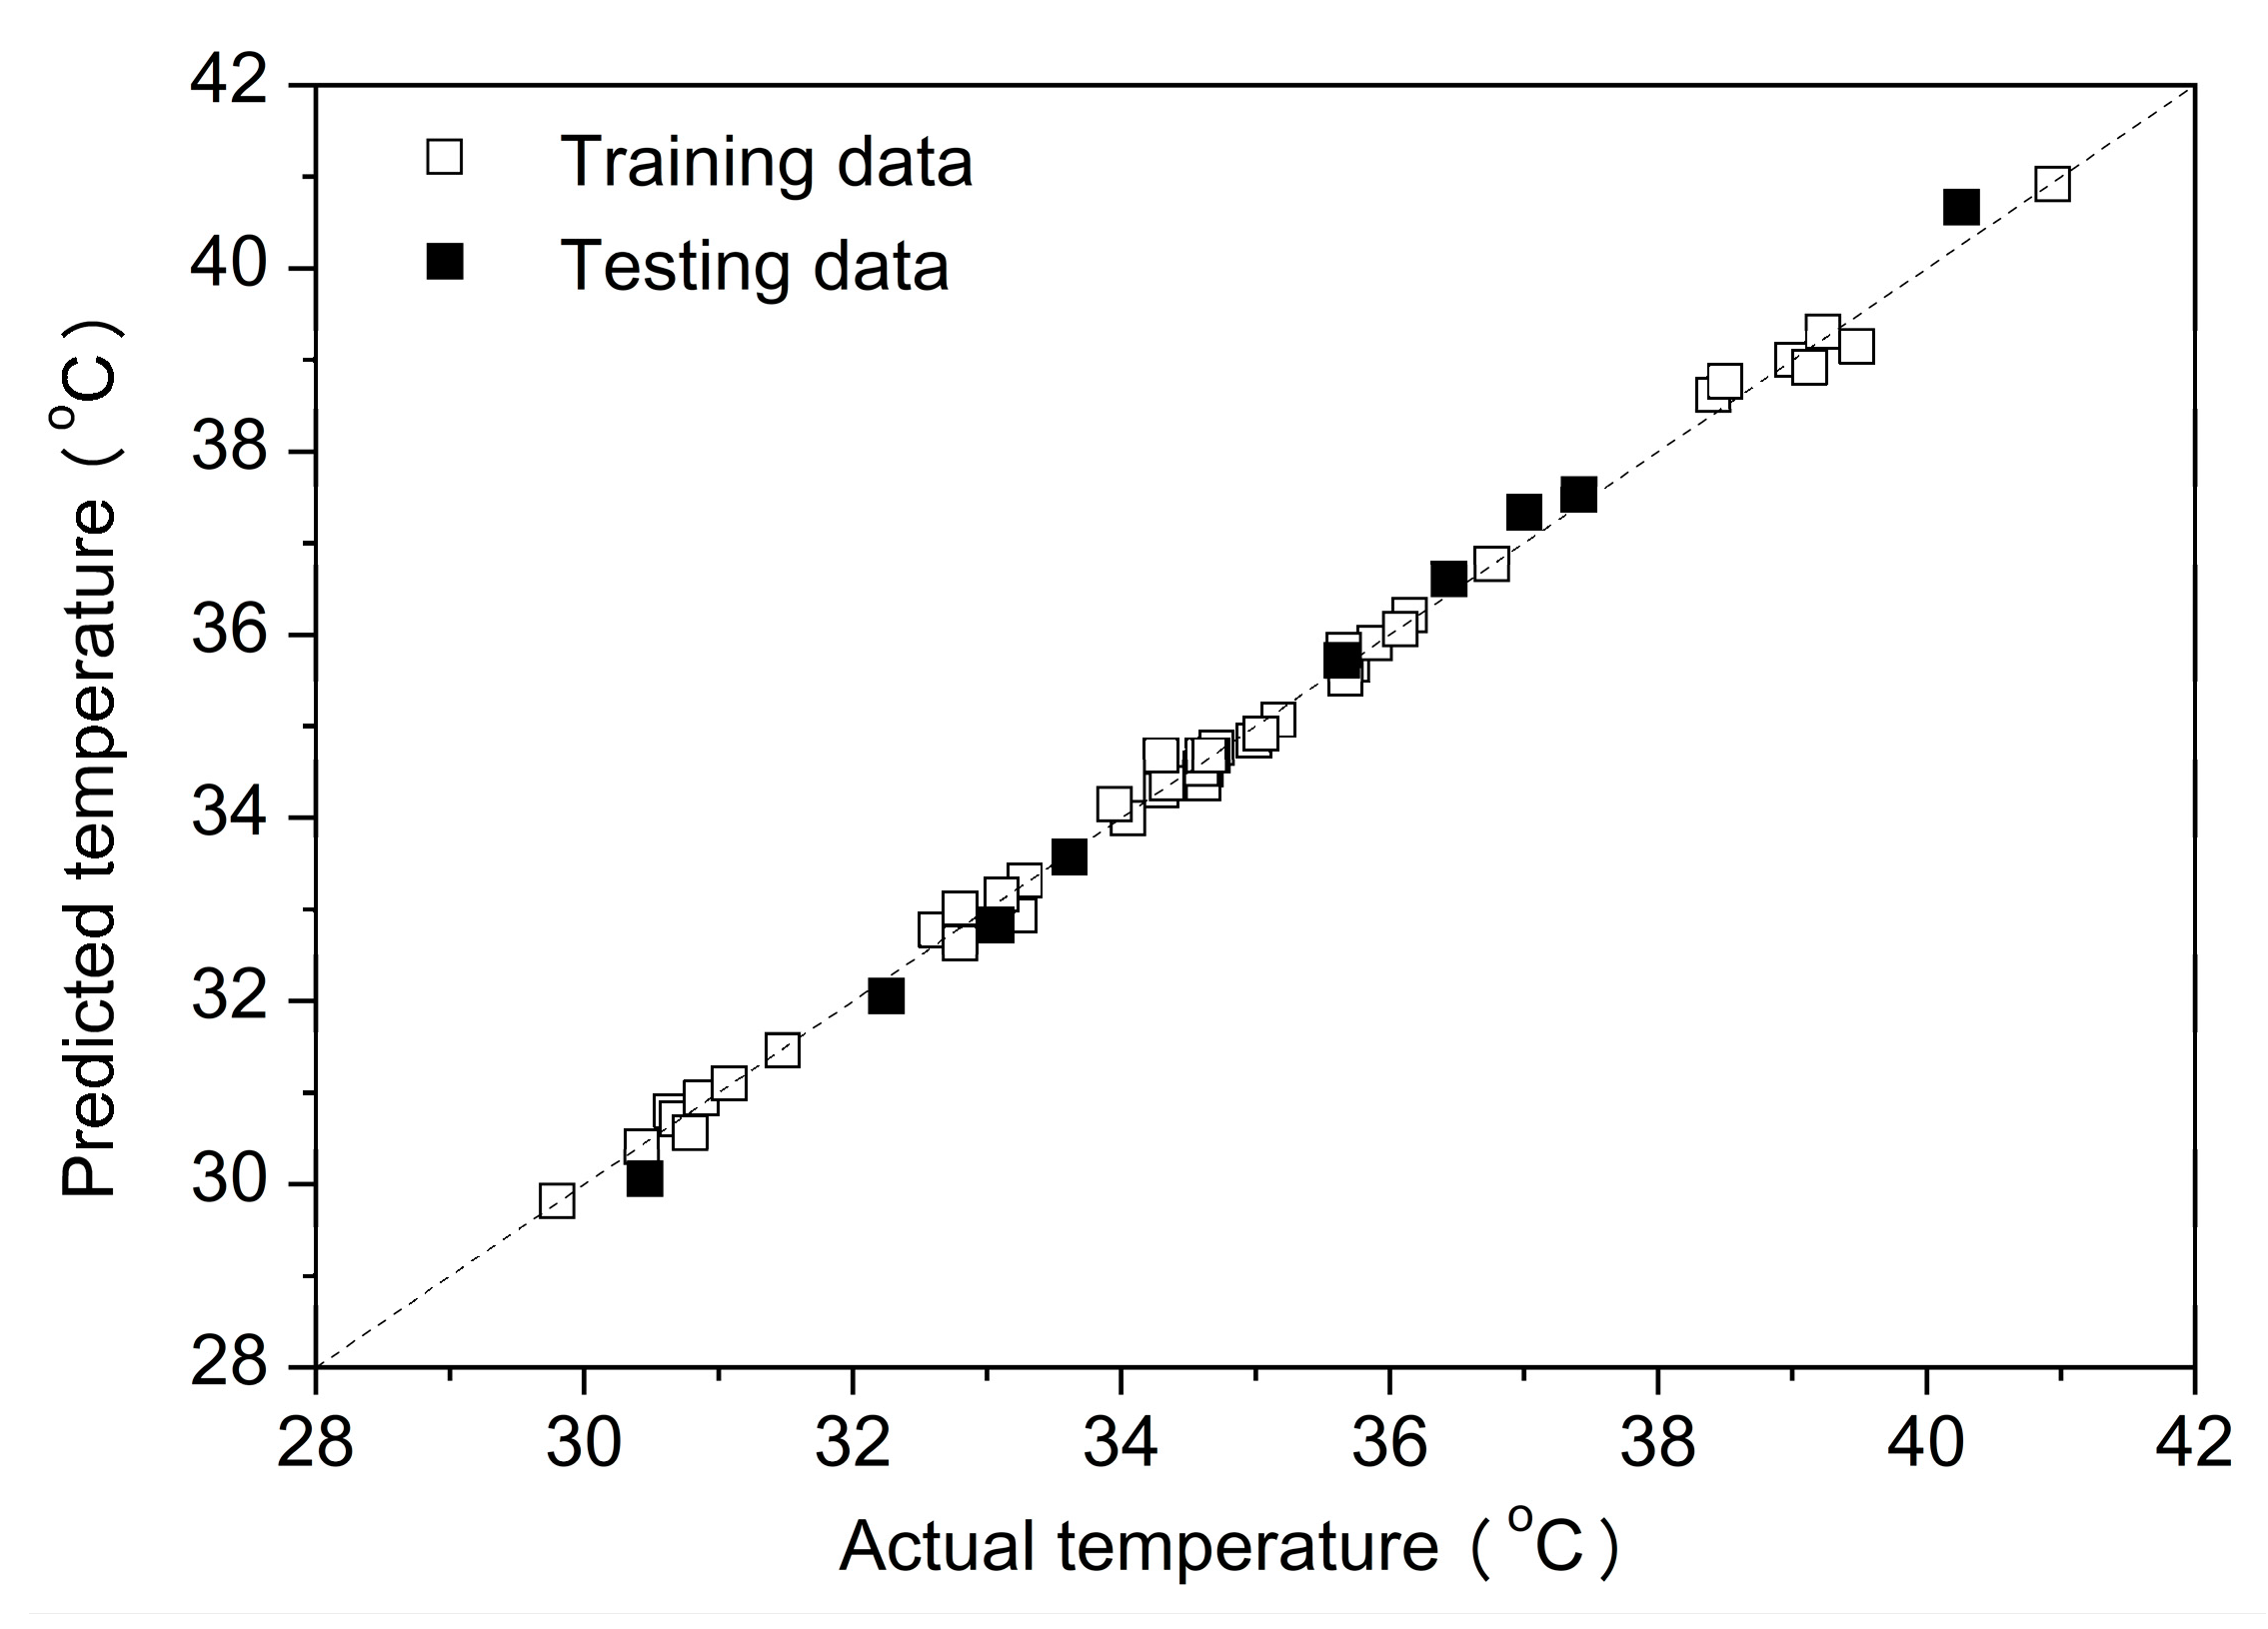
3.1.2. RSM Model Verification

Figure 4 shows the comparison of the predicted values by the RSM model and the measured values. Theoretically, the data points should be split evenly by the 45 degree line. The closer they are to the solid line, the better the prediction model. From Figure 4, the data points were very close to the 45 degree solid line, which indicated that the mathematical model could predict the relation between the investigated variables and the response well.

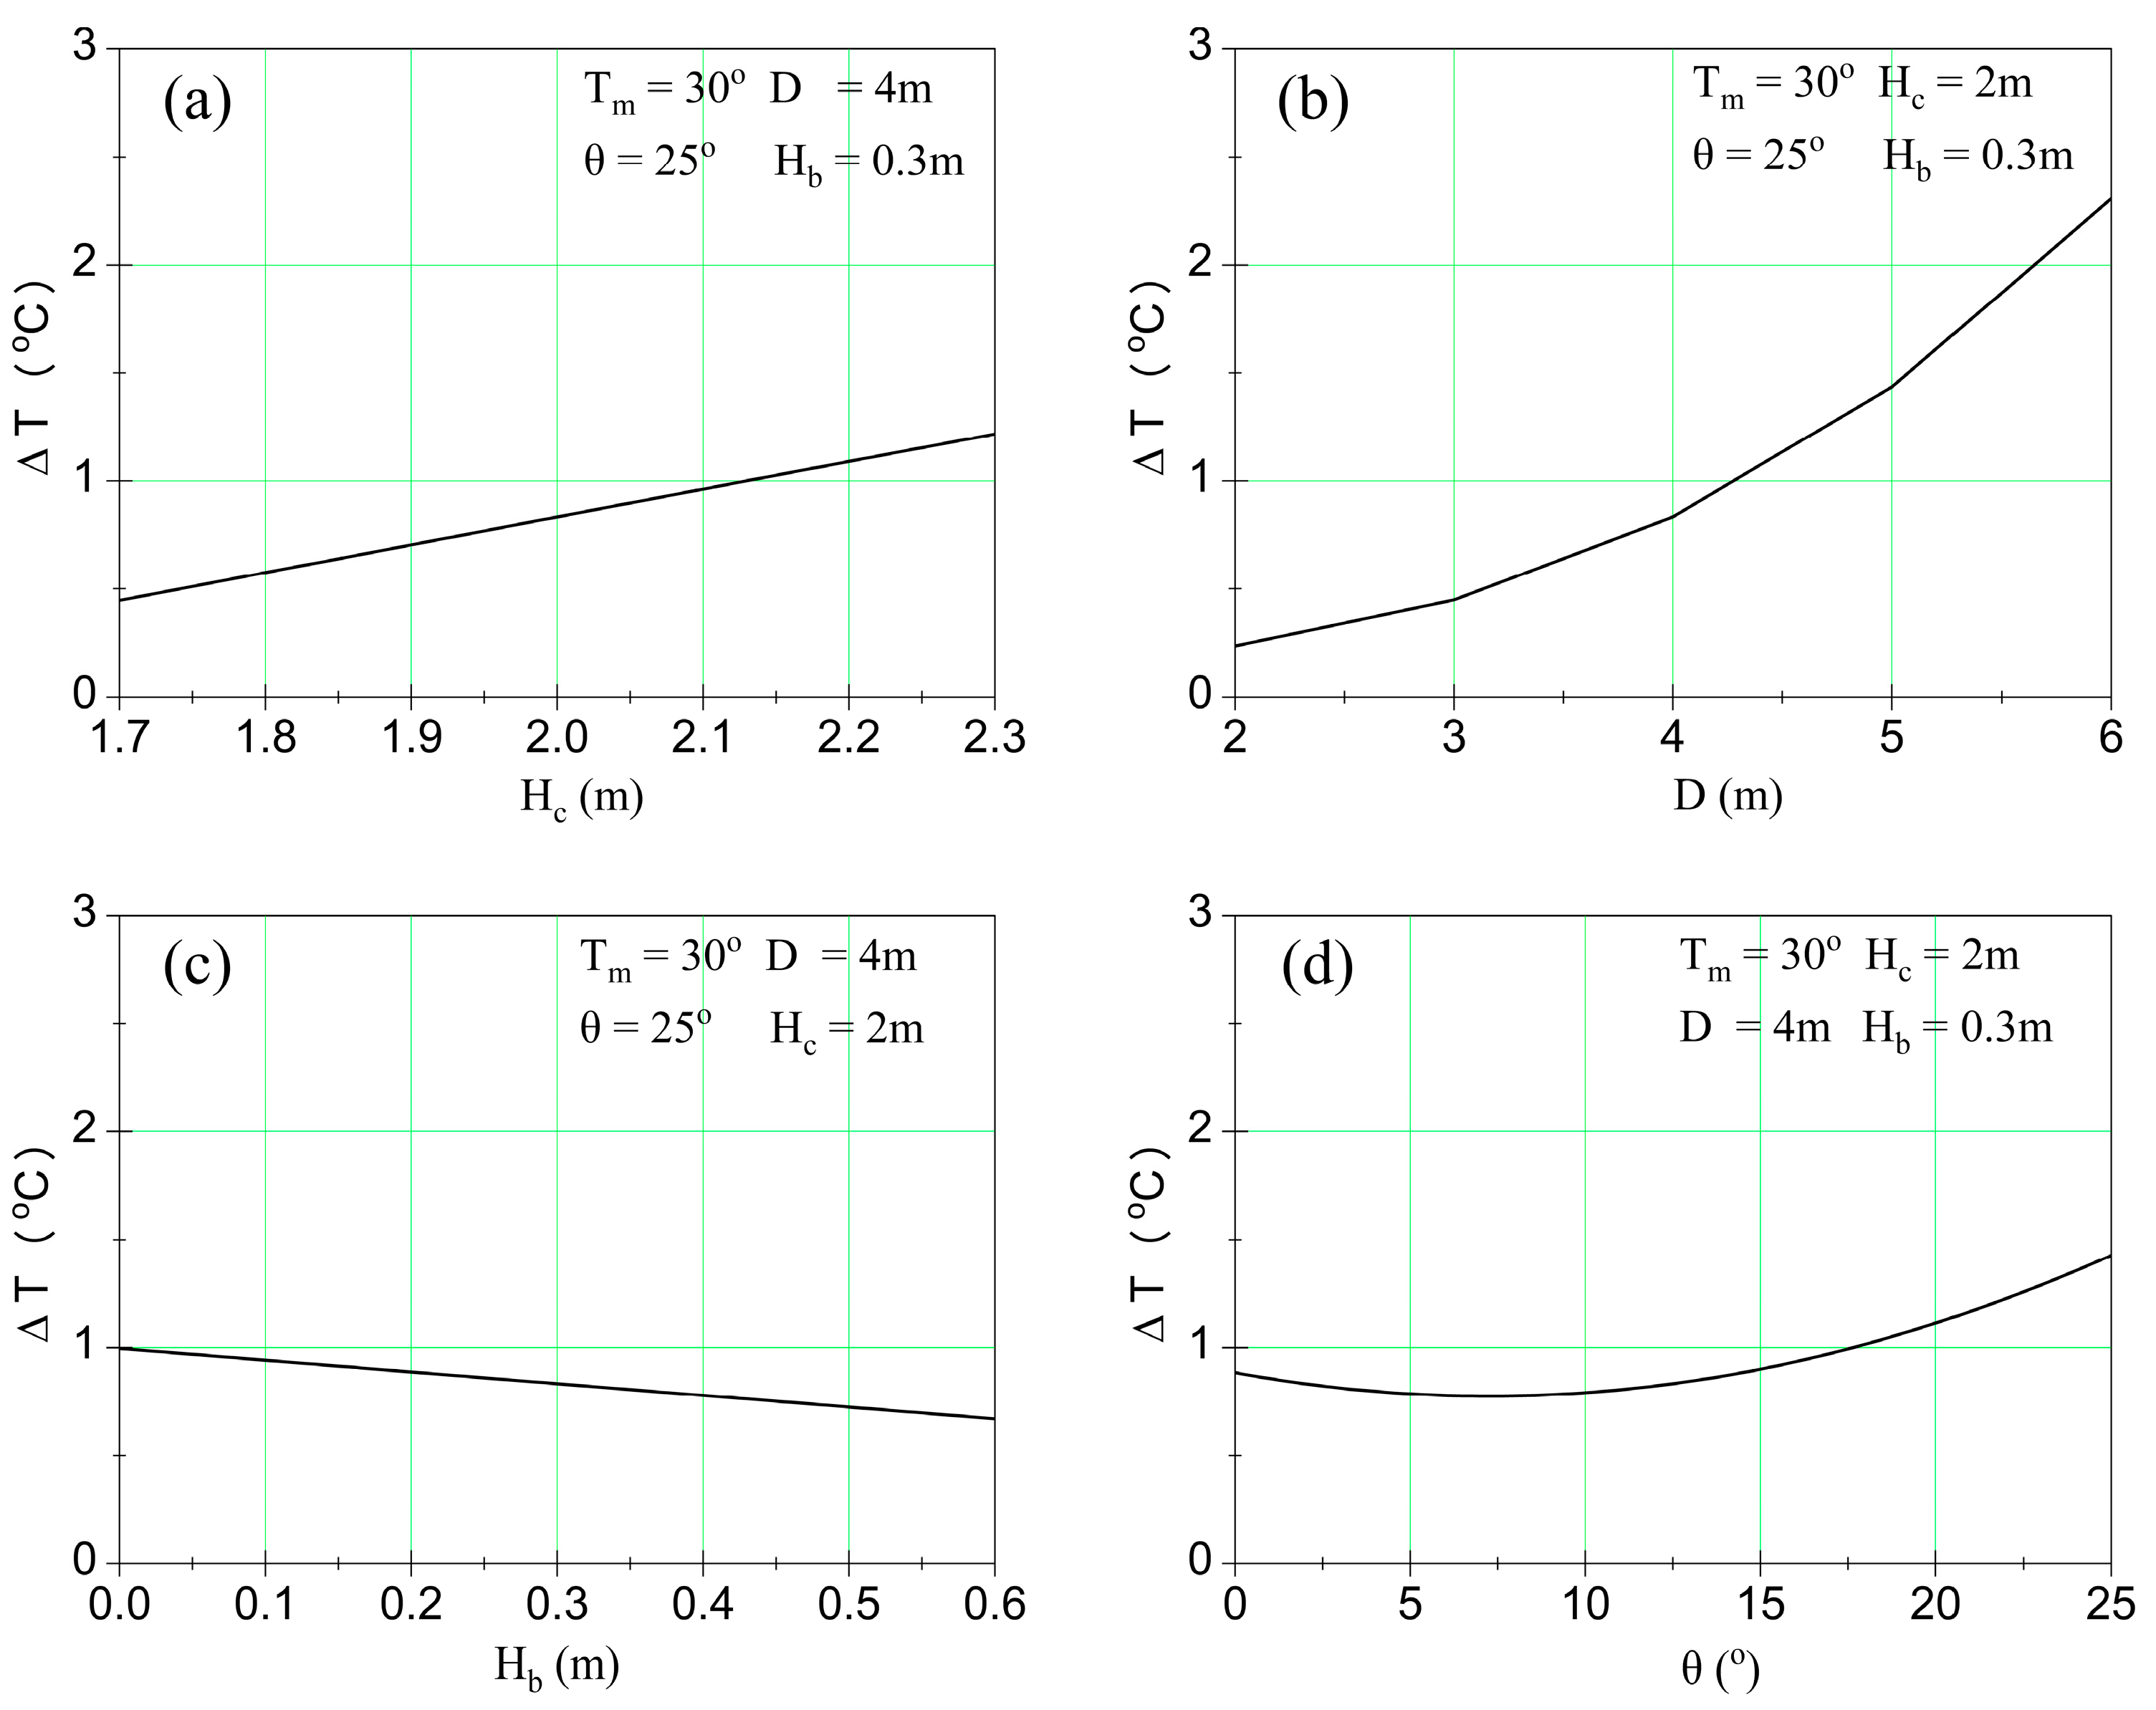
3.2. Effect of the Parameters on Surface Temperature Detection

Based on Tb calculation from the RSM model, the effect of camera height (Hc), horizontal distance (D), pig height (Hb), and angle of view between the IRT camera and pigs (θ) on the skin temperature difference (ΔT) between Tb and Tm were analyzed using Origin Pro (OriginLab, Northampton, MA, USA). Figure 5 illustrates the perturbation of the relative significance of each factor.
According to Figure 5, as Hc increased from 1.7 to 2.3 m, ΔT increased linearly from 0.45 to 1.22 °C, with Tm, D, θ, and Hb held at 30 °C, 4 m, 25°, and 0.3 m, respectively. Similarly, as horizontal distance (D) increased from 2 to 6 m, the ΔT increased non-linearly from 0.24 to 2.31 °C, with Tm, Hc, θ, and Hb at 30 °C, 2 m, 25°, and 0.3 m, respectively. In addition, as the height (Hb) of the object increased from 0 to 0.6 m, the ΔT decreased linearly from 1 to 0.67 °C when Tm, D, θ, and Hc were at 30 °C, 4 m, 25°, and 2 m, respectively. According to the Pythagorean theorem, the observation distance between the IRT camera and the object was determined by the three parameters, i.e., the camera height, the horizontal distance, and the object height. Therefore, the observation distance negatively affects the accuracy of the surface temperature measurement in the application of infrared thermography. Zhou, Wei, Xie, Tang and Cui [26] reported that the phenomenon could be attributed to the decrease in the transmittance of infrared radiation in the atmosphere, with increasing observation distances. Among these three parameters, the variation of horizontal distance had the most impact because the horizontal distance was much larger than the height difference between the camera and the object. Thus, it had the greatest impact on the temperature difference. Since the ranges of the other factors were fixed according to the situation in practice, the horizontal distance between pigs and the IRT camera became the most impacting factor.
Regarding the effect of the angle of view θ (Figure 5), as the angle of view increased from 0° to 25°, the temperature difference, ΔT, initially decreased from 0.89 to 0.78 °C but then increased from 0.78 to 1.43 °C, with Tm, Hc, D, and Hb at 30 °C, 2 m, 4 m, and 0.3 m, respectively. However, some research found that the measurement could be deemed reliable as long as the angle of view is less than 45° [27,41]. The slight decline of temperature difference, ΔT, in this study has not been reported in the literature. The decline could be attributed to the removal of some terms in the process of RSM modeling. Generally, the effect of Hb variation between 0 to 0.6 m on ΔT was less than 0.5 °C. Therefore, the height of the pig was fixed at 0.3 m in the correction algorithm development and the height of the IRT camera was fixed at 2 m, according to the situation in the experimental barn.

3.3. Performance of the Correction Method

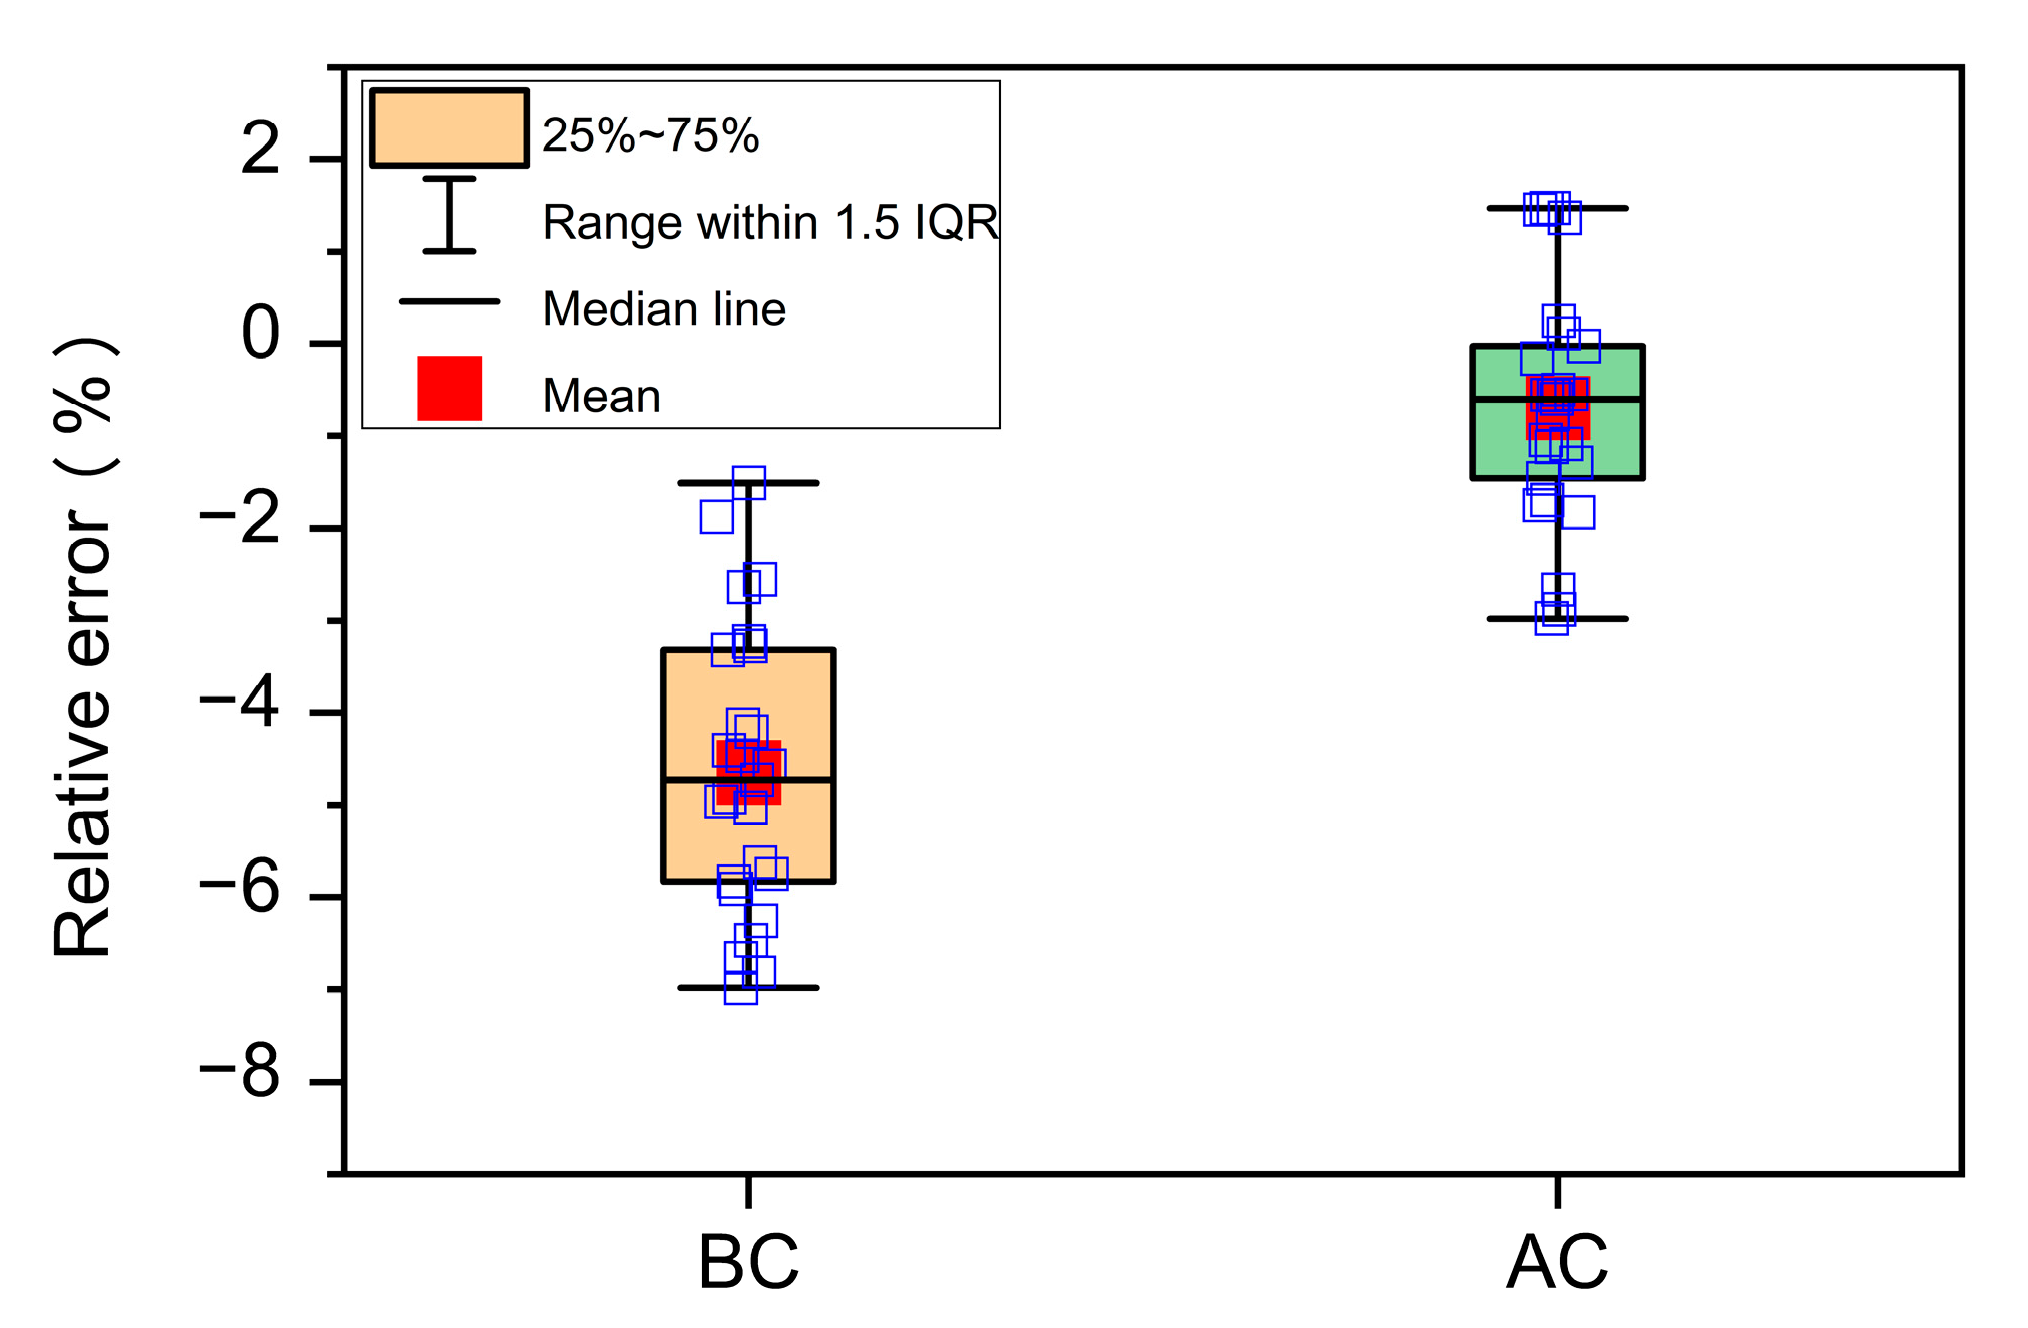
3.3.1. Comparison between Skin Temperature before and after Correction

Figure 6 is a boxplot illustrating the difference in relative error before correction (Er-BC) and after correction (Er-AC) of all 25 samples. It shows that the relative error before correction had a median value of −4.73%, while the median value of relative error after the correction improved to −0.60%. The mean relative error before and after the correction was −4.64% and −0.70%, respectively. In addition, the maximum and the minimum of Er-BC were −1.51% and −7%, respectively. After correction, the maximum and minimum of Er-AC improved to 1.47% and −2.98%, respectively. Although the maximum relative error after correction increased (above 0), the absolute value of the maximum and the minimum still improved from 6.98% to 2.98%. Fixing the pig’s height at 0.3 m in the correction algorithm may have caused the Er-AC > 0. Additionally, the interquartile range (IQR) of the boxplot associated with BC was 2.52, while the IQR of the boxplot associated with AC was 1.19. Note that IQR is a measure that describes the dispersion of each variable in the statistical data. The larger the IQR is, the greater the discrete degree is. The decline of IQR indicated that the discrete degree of relative error was improved after correction. Based on the above analysis, the accuracy of IRT temperature measurement can be improved by using the correction method proposed in this research.

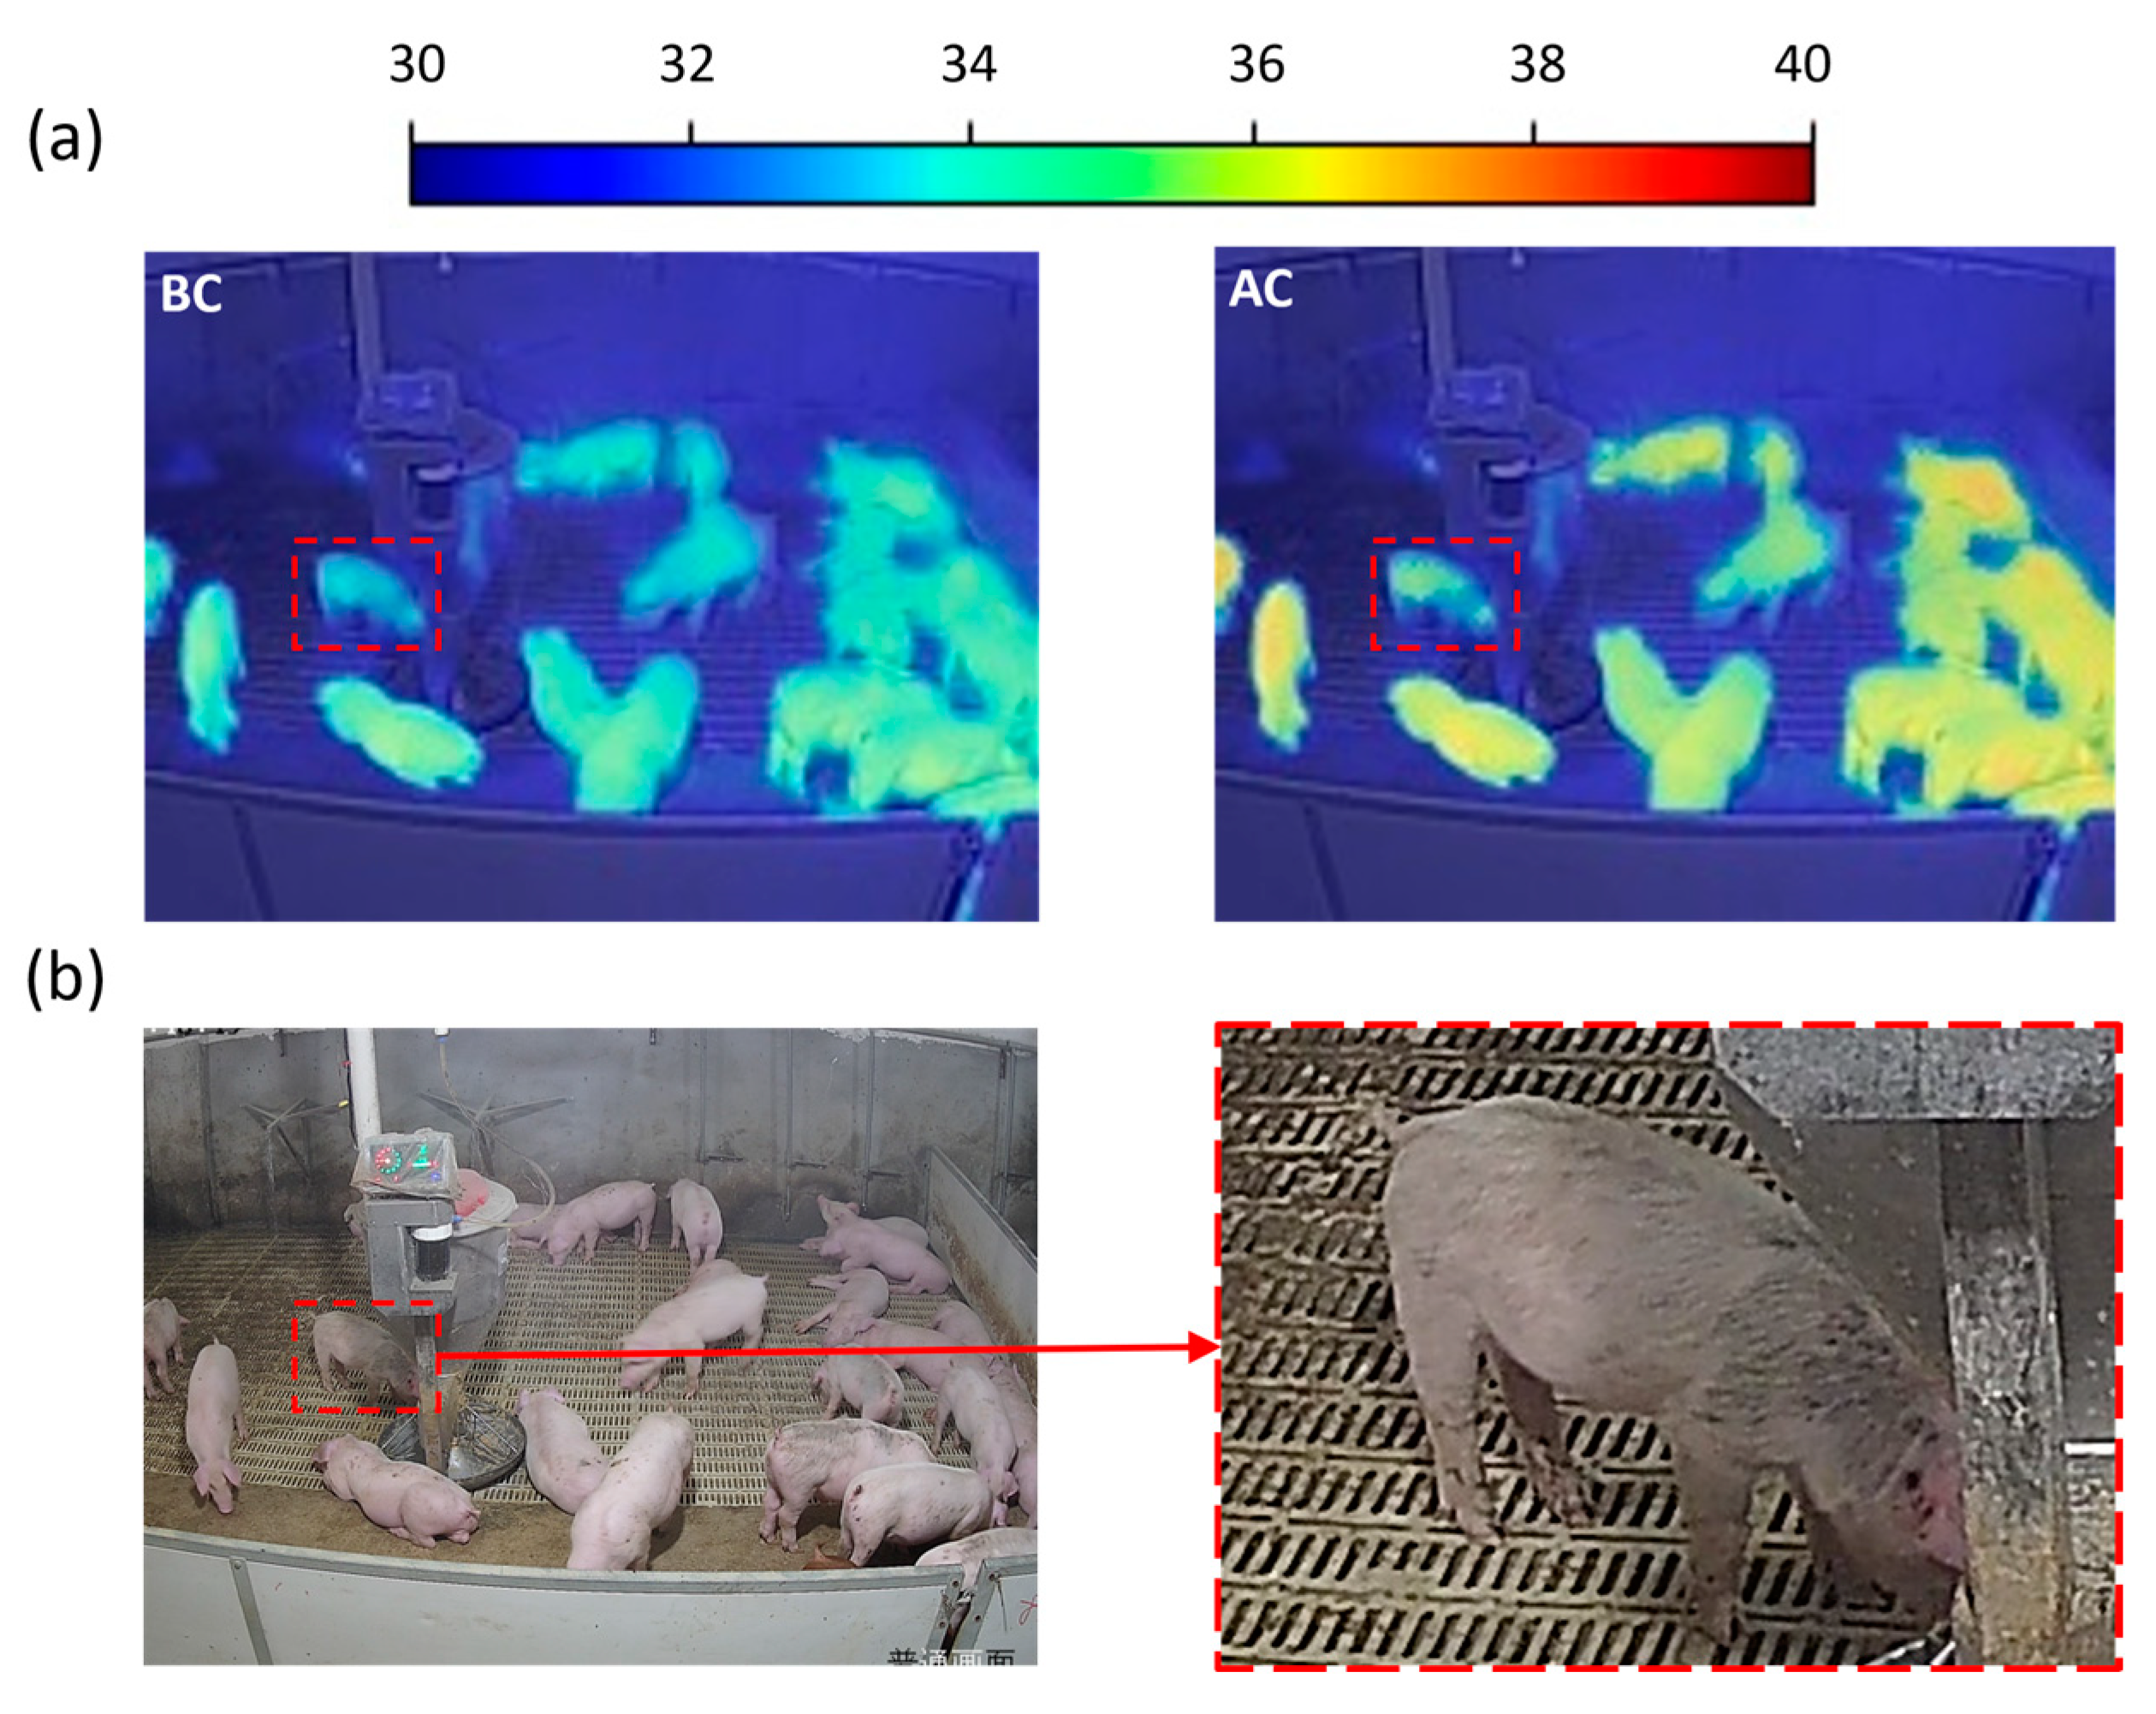
3.3.2. Comparison between IRT Images

Figure 7a shows the temperature distribution images in a pig pen before and after correction, which was obtained at a thermal comfort condition (THI = 70.54). The skin temperature of each pig was similar under normal circumstances. The temperature distribution image before correction showed that the skin temperatures of pigs close to the camera appeared higher than the skin temperatures of pigs further away from the camera. This was in line with the known limitation of the IRT camera. Comparatively, the skin temperatures of pigs in the temperature distribution image, after correction, became closer to each other and stayed in the range of 36 to 37 °C. This demonstrates the good performance of the correction model.
Particularly, a piglet with a low skin temperature area on its neck was detected in the infrared image, as shown in the red box. Referring to the corresponding visible image (Figure 7b), the area of skin with the lower temperature piglet was dirty in the scale-up image. Many studies have reported that the clearness of skin is very important to surface temperature sensing [42] because the dirty stuff not only blocks the heat transfer from the pig body to the ambient air, but also impacts the emissivity level of the target surface [43]. In this case, the dried feces stuck on the skin surface could be the potential reason for the dirty skin. Therefore, in order to ensure the accuracy of the measurement result, pigs in pig pens should have a sufficient area of clean skin.
Additionally, it could be found that the temperatures of the pigs in the right zone were around 0.3 °C higher than those in the other area, according to Figure 7a. This phenomenon could be attributed to the difference in the density of pigs. As can be seen, more pigs stayed in the right zone of the pen. A similar result was reported by Abudabos, et al. [44], who, in a comparison of the skin temperatures of birds under different stocking densities, found that the skin temperatures of birds increased as the stocking density increased. Therefore, to better assess the health of group pigs by skin temperature, the density of the area where pigs are located should also be considered. Overall, the IRT camera, compiled with the correction algorithm, has a good measuring performance for clean pigs, although it has limitations for dirty pigs and the density of pigs.

3.4. Limitations and Perspectives

Since the tested IRT camera only has a single lens, monocular ranging was adopted to detect the distance between the objects in the picture and the IRT camera. However, the monocular ranging model can only detect the horizontal distance and angle of view between the camera and the pig, but not the pig’s height. Therefore, there is an error between the measured distance and the actual observation distance. To improve the accuracy of the correction method and make it more robust, how to detect pig height remains an area of future work. Additionally, since different IRT cameras consist of different hardware, the correction algorithm is just reliable for the tested IRT camera (Hikvision TB-1217A-3’PA). Even so, the outcome of this study is still meaningful because (1) the producer of the tested IRT camera was a world-famous producer, which means that the proposed correction algorithm could be potentially embedded into their further products and more animal farms would benefit from these; (2) the test IRT camera has already been widely applied in many livestock farms in Zhejiang Province. Thus, direct application of the correction algorithm could also be acceptable; (3) this study provides a potential method to better monitor the animals’ skin surface temperature using IRT camera. A further modification is, perhaps, required when adapted to other IRT cameras. Even so, the proposed correction method for IRT cameras can benefit from a better skin temperature measurement of pigs in the future.

4. Conclusions

The study investigated the effects of the observation distance and the angle of view on the surface temperature sensing, and then proposed an infrared temperature correction method for processing the skin temperatures of pigs in infrared image. Based on the results, the following conclusions can be drawn:
  • Response surface methodology can be applied in the modeling of the relationship between the actual skin temperature and the affecting parameters, along with the monocular ranging being applied in the determination of the observation distance.
  • The observation distance significantly affects the accuracy of the skin temperature measurement. The horizontal distance, the camera height, and the angle of view between the camera and the object positively affect the accuracy between the measurements and the actual skin temperatures, while the heights of pigs negatively affect the accuracy between the measurements and the actual skin temperatures.
  • A skin temperature correction algorithm was developed and evaluated using field-measured data. The average relative error of measured skin temperatures before the correction was −4.63%, and the corresponding mean relative error after the correction was reduced to −0.25%.

Author Contributions

Conceptualization, X.W.; methodology, X.W. and F.H.; software, F.H.; formal analysis, F.H.; investigation, X.W., R.Y. and K.W.; writing—original draft preparation, F.H.; writing—review and editing, X.W. and K.W.; visualization, X.W. and K.W.; data curation, R.Y.; validation, F.H. and R.Y.; supervision, K.W.; project administration, K.W.; funding acquisition, K.W. All authors have read and agreed to the published version of the manuscript.

Funding

This work was supported by grants from the Key R & D Projects of Zhejiang Province (2022C02050). The authors appreciated the employees in the experimental pig farm for help during field experiments.

Institutional Review Board Statement

Not applicable.

Data Availability Statement

Not applicable.

Conflicts of Interest

The authors declare no conflict of interest.

References

  1. Rae, A.N.; Ma, H.; Huang, J.; Rozelle, S. Livestock in China: Commodity-Specific Total Factor Productivity Decomposition Using New Panel Data. Am. J. Agric. Econ. 2006, 88, 680–695. [Google Scholar] [CrossRef] [Green Version]
  2. Wang, Y.; Gao, L.; Li, Y.; Xu, Q.; Yang, H.; Shen, C.; Huang, B. African swine fever in China: Emergence and control. J. Biosaf. Biosecurity 2019, 1, 7–8. [Google Scholar] [CrossRef]
  3. Gao, L.; Sun, X.; Yang, H.; Xu, Q.; Li, J.; Kang, J.; Liu, P.; Zhang, Y.; Wang, Y.; Huang, B. Epidemic situation and control measures of African Swine Fever Outbreaks in China 2018–2020. Transbound. Emerg. Dis. 2021, 68, 2676–2686. [Google Scholar] [CrossRef] [PubMed]
  4. Wang, T.; Luo, R.; Sun, Y.; Qiu, H.-J. Current efforts towards safe and effective live attenuated vaccines against African swine fever: Challenges and prospects. Infect. Dis. Poverty 2021, 10, 137. [Google Scholar] [CrossRef] [PubMed]
  5. Tao, D.; Sun, D.; Liu, Y.; Wei, S.; Yang, Z.; An, T.; Shan, F.; Chen, Z.; Liu, J. One year of African swine fever outbreak in China. Acta Trop. 2020, 211, 105602. [Google Scholar] [CrossRef]
  6. Pusnik, I.; Stukelj, M. Usefulness of thermovision for pig welfare. Elektrotehniski Vestn. 2019, 86, 77–82. [Google Scholar]
  7. Jorquera-Chavez, M.; Fuentes, S.; Dunshea, F.R.; Warner, R.D.; Poblete, T.; Morrison, R.S.; Jongman, E.C. Remotely Sensed Imagery for Early Detection of Respiratory Disease in Pigs: A Pilot Study. Animals 2020, 10, 451. [Google Scholar] [CrossRef] [Green Version]
  8. Hwang, S.W.; Choi, Y.S.; Lee, S.J.; Yang, S.H. An Analysis on ASF Variations and Temperature. In Proceedings of the IEEE/ION Position, Location and Navigation Symposium (PLANS), Monterey, CA, USA, 5–8 May 2014; pp. 882–885. [Google Scholar]
  9. Escuredo, J.A.M.; Carr, J.; Dizon, R.; Howells, M. Using infrared thermography to help maintain pig health. Practice 2021, 43, 388–396. [Google Scholar] [CrossRef]
  10. Soerensen, D.D.; Pedersen, L.J. Infrared skin temperature measurements for monitoring health in pigs: A review. Acta Vet. Scand. 2015, 57, 5. [Google Scholar] [CrossRef] [Green Version]
  11. Zhong, Z. A novel visible and infrared image fusion method based on convolutional neural network for pig-body feature detection. Multimed. Tools Appl. 2021, 81, 2757–2775. [Google Scholar] [CrossRef]
  12. Sa, J.; Choi, Y.; Lee, H.; Chung, Y.; Park, D.; Cho, J. Fast Pig Detection with a Top-View Camera under Various Illumination Conditions. Symmetry 2019, 11, 266. [Google Scholar] [CrossRef]
  13. Shirley, L.K.; Field, T.; Schinckel, A.P.; Johnson, J.S.; Stwalley, R.; Stewart, K.R. 80 Use of an Electronically-controlled Floor Cooling Pad During Heat Stress on Thermoregulatory and Reproductive Performance in Boars. J. Anim. Sci. 2021, 99, 107. [Google Scholar] [CrossRef]
  14. Da Fonseca, F.N.; Abe, J.M.; Nääs, I.D.A.; Cordeiro, A.F.D.S.; Amaral, F.V.D.; Ungaro, H.C. Automatic prediction of stress in piglets (Sus Scrofa) using infrared skin temperature. Comput. Electron. Agric. 2019, 168, 105148. [Google Scholar] [CrossRef]
  15. Choudhury, M.; Saikia, T.; Banik, S.; Patil, G.; Pegu, S.R.; Rajkhowa, S.; Sen, A.; Das, P.J. Infrared imaging a new non-invasive machine learning technology for animal husbandry. Imaging Sci. J. 2020, 68, 240–249. [Google Scholar] [CrossRef]
  16. Tattersall, G.J. Infrared thermography: A non-invasive window into thermal physiology. Comp. Biochem. Physiol. Part A Mol. Integr. Physiol. 2016, 202, 78–98. [Google Scholar] [CrossRef]
  17. Playa-Montmany, N.; Tattersall, G.J. Spot size, distance and emissivity errors in field applications of infrared thermography. Methods Ecol. Evol. 2021, 12, 828–840. [Google Scholar] [CrossRef]
  18. Faye, E.; Dangles, O.; Pincebourde, S. Distance makes the difference in thermography for ecological studies. J. Therm. Biol. 2016, 56, 1–9. [Google Scholar] [CrossRef] [Green Version]
  19. Arenas, A.J.; Gómez, F.; Salas, R.; Carrasco, P.; Borge, C.; Maldonado, A.; O’Brien, D.J.; Martínez-Moreno, F. An evaluation of the application of infrared thermal imaging to the tele-diagnosis of sarcoptic mange in the Spanish ibex (Capra pyrenaica). Vet. Parasitol. 2002, 109, 111–117. [Google Scholar] [CrossRef]
  20. Zhang, C.; Xiao, D.; Yang, Q.; Wen, Z.; Lv, L. Review: Application of Infrared Thermography in Livestock Monitoring. Trans. ASABE 2020, 63, 389–399. [Google Scholar] [CrossRef]
  21. Church, J.; Hegadoren, P.; Paetkau, M.; Miller, C.; Regev-Shoshani, G.; Schaefer, A.; Schwartzkopf-Genswein, K. Influence of environmental factors on infrared eye temperature measurements in cattle. Res. Vet. Sci. 2014, 96, 220–226. [Google Scholar] [CrossRef]
  22. Harrap, M.J.M.; de Ibarra, N.H.; Whitney, H.M.; Rands, S.A. Reporting of thermography parameters in biology: A systematic review of thermal imaging literature. R. Soc. Open Sci. 2018, 5, 181281. [Google Scholar] [CrossRef] [PubMed] [Green Version]
  23. Soerensen, D.D.; Clausen, S.; Mercer, J.B.; Pedersen, L.J. Determining the emissivity of pig skin for accurate infrared ther-mography. Comput. Electron. Agric. 2014, 109, 52–58. [Google Scholar] [CrossRef]
  24. Zhang, K.; Jiao, L.; Zhao, X.; Dong, D. An instantaneous approach for determining the infrared emissivity of swine surface and the influencing factors. J. Therm. Biol. 2016, 57, 78–83. [Google Scholar] [CrossRef]
  25. Muniz, P.R.; Magalhães, R.D.S.; Cani, S.P.N.; Donadel, C.B. Non-contact measurement of angle of view between the inspected surface and the thermal imager. Infrared Phys. Technol. 2015, 72, 77–83. [Google Scholar] [CrossRef]
  26. Zhou, Z.; Wei, X.; Xie, T.; Tang, Z.; Cui, H. Influence of Observation Distance and Angle of View on the Detection Accuracy of Infrared Thermal Radiation. Infrared Technol. 2017, 39, 86–90. [Google Scholar]
  27. Muniz, P.R.; Cani, S.P.N.; Magalhaes, R.D.S. Influence of Field of View of Thermal Imagers and Angle of View on Temperature Measurements by Infrared Thermovision. IEEE Sens. J. 2013, 14, 729–733. [Google Scholar] [CrossRef]
  28. Baş, D.; Boyacı, İ.H. Modeling and optimization I: Usability of response surface methodology. J. Food Eng. 2007, 78, 836–845. [Google Scholar] [CrossRef]
  29. Madzimure, J.; Chimonyo, M.; Zander, K.; Dzama, K. Diurnal heat-related physiological and behavioural responses in South African indigenous gilts. J. Arid. Environ. 2012, 87, 29–34. [Google Scholar] [CrossRef]
  30. Chung, T.-H.; Jung, W.-S.; Nam, E.-H.; Kim, J.-H.; Park, S.-H.; Hwang, C.-Y. Comparison of Rectal and Infrared Thermometry for Obtaining Body Temperature of Gnotobiotic Piglets in Conventional Portable Germ Free Facility. Asian-Australas. J. Anim. Sci. 2010, 23, 1364–1368. [Google Scholar] [CrossRef]
  31. Oh, S.-I.; Lee, H.S.; Bui, V.N.; Dao, D.T.; Bui, N.A.; Le, T.D.; Kieu, M.A.; Nguyen, Q.H.; Tran, L.H.; So, K.-M.; et al. Dynamic Variations in Infrared Skin Temperature of Weaned Pigs Experimentally Inoculated with the African Swine Fever Virus: A Pilot Study. Vet. Sci. 2021, 8, 223. [Google Scholar] [CrossRef]
  32. Baxter, S.H. Intensive Pig Production: Environmental Management and Design; Granada Publishing Ltd.: London, UK, 1984; p. 588. [Google Scholar]
  33. Ferreira, S.L.C.; Bruns, R.E.; Ferreira, H.S.; Matos, G.D.; David, J.M.; Brandão, G.C.; da Silva, E.G.P.; Portugal, L.A.; dos Reis, P.S.; Souza, A.S.; et al. Box-Behnken design: An alternative for the optimization of analytical methods. Anal. Chim. Acta 2007, 597, 179–186. [Google Scholar] [CrossRef]
  34. Myers, R.H.; Montgomery, D.C.; Anderson-Cook, C. Response Surface Methodology: Process and Product Optimization Using Designed Experiments; John Wiley & Sons: Hoboken, NJ, USA, 2016. [Google Scholar]
  35. Box, G.E.; Cox, D.R. An analysis of transformations. J. R. Stat. Soc. Ser. B (Methodol.) 1964, 26, 211–252. [Google Scholar] [CrossRef]
  36. Shen, X.; Zhang, G.; Bjerg, B. Investigation of response surface methodology for modelling ventilation rate of a naturally ven-tilated building. Build. Environ. 2012, 54, 174–185. [Google Scholar] [CrossRef]
  37. Cheng, Y.H.; Wang, S.N.; Yu, D.H. Optimal Design of Monocular Stereo Vision System. In Proceedings of the 16th IEEE International Conference on Mechatronics and Automation (IEEE ICMA), Tianjin, China, 4–7 August 2019; pp. 1022–1027. [Google Scholar]
  38. Rezaei, M.; Terauchi, M.; Klette, R. Robust Vehicle Detection and Distance Estimation Under Challenging Lighting Conditions. IEEE Trans. Intell. Transp. Syst. 2015, 16, 2723–2743. [Google Scholar] [CrossRef]
  39. Kim, J.B. Efficient Vehicle Detection and Distance Estimation Based on Aggregated Channel Features and Inverse Perspective Mapping from a Single Camera. Symmetry 2019, 11, 1205. [Google Scholar] [CrossRef] [Green Version]
  40. Shen, C.; Zhao, X.; Liu, Z.; Gao, T.; Xu, J. Joint vehicle detection and distance prediction via monocular depth estimation. IET Intell. Transp. Syst. 2020, 14, 753–763. [Google Scholar] [CrossRef]
  41. Litwa, M. Influence of Angle of View on Temperature Measurements Using Thermovision Camera. IEEE Sens. J. 2010, 10, 1552–1554. [Google Scholar] [CrossRef]
  42. LokeshBabu, L.; Jeyakumar, S.; Vasant, P.J.; Sathiyabarathi, M.; Manimaran, A.; Kumaresan, A.; Pushpadass, H.A.; Sivaram, M.; Ramesha, K.; Kataktalware, M.A.; et al. Monitoring foot surface temperature using infrared thermal imaging for assessment of hoof health status in cattle: A review. J. Therm. Biol. 2018, 78, 10–21. [Google Scholar] [CrossRef]
  43. Stokes, J.; Leach, K.; Main, D.; Whay, H. An investigation into the use of infrared thermography (IRT) as a rapid diagnostic tool for foot lesions in dairy cattle. Vet. J. 2012, 193, 674–678. [Google Scholar] [CrossRef]
  44. Abudabos, A.M.; Samara, E.M.; Hussein, E.O.S.; Al-Ghadi, M.Q.; Al-Atiyat, R.M. Impacts of Stocking Density on the Per-formance and Welfare of Broiler Chickens. Ital. J. Anim. Sci. 2013, 12, e11. [Google Scholar] [CrossRef] [Green Version]
Figure 1. The setup and the schematic graph of the laboratory experiment.
Agriculture 13 00520 g001
Figure 2. Diagram illustrating the camera’s field of view. (a) Object plane coordinate view; (b) projected view along the X-axis direction; (c) top view of the image plane.
Agriculture 13 00520 g002
Figure 3. Infrared thermography system in pig building. Geometry of the system (a) and a photo of the inspection robot (b).
Agriculture 13 00520 g003
Figure 4. Predicted values versus the experimental data values. Training data and testing data were listed in Table 2 and Table 3, respectively.
Agriculture 13 00520 g004
Figure 5. Perturbation of the relative significance of factors, including the camera height (a), horizontal distance (b), object height (c), and angle of view (d), on response.
Agriculture 13 00520 g005
Figure 6. Box plot of the relative error for the measured skin temperature before correction (BC) and after correction (AC).
Agriculture 13 00520 g006
Figure 7. Infrared images (a) and visible image (b) of a pig pen.
Agriculture 13 00520 g007
Table 1. Levels of investigated parameters for the RSM modeling. D, Hc, θ, Tb, and Hb represent the horizontal distance, the camera height, the angle of view between the camera and black body cavity, the black body cavity temperature, and the black body cavity height, respectively.
ParameterUnitLow LevelMedium LevelHigh Level
Dm246
Hcm1.722.3
θ°02550
Tb°C323742
Hbm00.30.6
Table 2. BBD with the values of each variable and the corresponding values of the response (served as the training dataset). D, Hc, θ, Tb, and Hb represent the horizontal distance, the camera height, the angle of view between the camera and black body cavity, the black body cavity temperature, and the black body cavity height, respectively.
CaseExperimental VariablesResponse
D
(m)
Hc
(m)
θ
(°)
Tb
(°C)
Hb
(m)
Tm
(°C)
T
(°C)
142.325370.326.22−10.78
24212.5370.327.89−9.11
341.712.5320.326.04−5.96
441.712.5420.330.55−11.45
542.312.537027.22−9.78
6220370.330.36−6.64
74212.5320.626.22−5.78
82225370.330.14−6.86
96225370.325.99−11.01
1041.725370.328.28−8.72
114212.5370.327.84−9.16
124225420.328.61−13.39
13422537027.03−9.97
142212.537030.41−6.59
15420370.628.23−8.77
166212.537025.11−11.89
174225370.627.92−9.08
1861.712.5370.325.63−11.37
194212.5370.328.07−8.93
2021.712.5370.331.07−5.93
21420320.325.91−6.09
226212.5420.327.69−14.31
234212.542030.56−11.44
244212.5420.631.07−10.93
2542037027.23−9.77
264225320.326.2−5.8
276212.5370.625.55−11.45
282212.5370.630.96−6.04
29420420.330.84−11.16
3042.30370.327.07−9.93
3122.312.5370.329.62−7.38
324212.5370.327.46−9.54
3342.312.5370.627.71−9.29
344212.5370.327.68−9.32
3562.312.5370.325.42−11.58
362212.5420.334.1−7.9
374212.532025.98−6.02
3842.312.5420.328.6−13.4
3941.712.537027.91−9.09
4042.312.5320.324.85−7.15
4141.712.5370.628.48−8.52
42620370.325.98−11.02
436212.5320.324.48−7.52
444212.5370.327.43−9.57
4541.70370.328.21−8.79
462212.5320.327.12−4.88
Table 3. Levels of investigated parameters in the cases for testing the RSM model.
Case No.Experimental VariablesResponse
D (m)Hc (m)θ (°)Tb (°C)Hb (m)Tm (°C)ΔT (°C)
12.321.725.341.80.1640.26−1.54
23.561.768.739.60.3437.41−2.19
33.721.8710.238.90.1936.44−2.46
44.221.8112.138.20.4135.64−2.56
54.361.9216.535.10.0633.07−2.03
65.181.9715.236.70.4633.61−3.09
75.321.7913.641.60.137−4.6
85.612.1618.635.40.5132.25−3.15
95.862.2424.633.10.5630.45−2.65
Table 4. MANOVA for RSM model.
SourceSSdfMSF-Valuep-Value
Model184.14209.2149.65<0.0001
Model308.29934.251321.89<0.0001
A-horizontal distance33.58133.581295.93<0.0001
B-camera height1.1611.1644.80<0.0001
C-angle0.585210.585222.58<0.0001
D-temperature269.451269.4510,398.19<0.0001
E-black body height0.209310.20938.080.0073
AD1.5611.5660.30<0.0001
0.352710.352713.610.0007
0.510410.510419.70<0.0001
0.606510.606523.41<0.0001
Residual0.9329360.0259
Lack of Fit0.8309310.02681.310.4149
Pure Error0.101950.0204
Cor Total309.2345
R2 = 0.9970; R2-adj = 0.9962; R2-pred = 0.9954. SS: sum of squares, df: degree of freedom, MS: mean square.
Disclaimer/Publisher’s Note: The statements, opinions and data contained in all publications are solely those of the individual author(s) and contributor(s) and not of MDPI and/or the editor(s). MDPI and/or the editor(s) disclaim responsibility for any injury to people or property resulting from any ideas, methods, instructions or products referred to in the content.

